Cambridge A Level Geography 9696 — 2015 Oct/Nov Paper 3 · Variant 3
9696/33/O/N/15 · 50 marks · ≈56 min
The question paper and its mark scheme, free to read here and free to download. This is Cambridge’s own paper, exactly as it was sat.
Question paper4 pages

Mark scheme10 pages
Answers below. Sit the paper first if you are practising.

Paper as text
Question paper, page 1
This document consists of 3 printed pages, 1 blank page and 2 Inserts. DC (ST) 128986 © UCLES 2015 [Turn over Cambridge International Examinations Cambridge International Advanced Subsidiary and Advanced Level * 0 8 7 2 3 0 9 7 4 7 * GEOGRAPHY 9696/33 Paper 3 Advanced Human Options October/November 2015 1 hour 30 minutes No Additional Materials are required. READ THESE INSTRUCTIONS FIRST An answer booklet is provided inside this question paper. You should follow the instructions on the front cover of the answer booklet. If you need additional answer paper ask the invigilator for a continuation booklet. Answer two questions only. Each question answered must be from a different topic. Sketch maps and diagrams should be drawn whenever they serve to illustrate an answer. You should make reference to appropriate examples studied in the field or the classroom, even where such examples are not specifically requested by the question. All the Figures referred to in the questions are contained in the Insert. The number of marks is given in brackets [ ] at the end of each question or part question.
Question paper, page 2
2 9696/33/O/N/15 © UCLES 2015 Production, location and change Only one question may be answered from this topic. 1 (a) Fig. 1 shows food demand for MEDCs, LEDCs and the world in 1974 and 1997 and forecasts for 2020. (i) Describe the trends in food demand shown in Fig. 1. [3] (ii) Explain how the food demand in LEDCs in 2020 may be met. [7] (b) With the help of one or more examples, evaluate the effects of the intensification of agriculture on environments and people. [15] 2 (a) (i) Give the meaning of the term economies of scale for manufacturing industry. Explain how economies of scale occur. [5] (ii) Give the meaning of the term diseconomies of scale for manufacturing industry. Explain how diseconomies of scale occur. [5] (b) For one named country, assess the extent to which the main issues limiting growth in manufacturing and related service industries have been overcome. [15] Environmental management Only one question may be answered from this topic. 3 (a) Fig. 2 shows energy gain and carbon dioxide (CO2) emissions for conventional fuels for motor vehicles and four biofuels. With reference to Fig. 2 and your own knowledge, describe the advantages of using biofuels rather than conventional fuels. [10] (b) For one named country, to what extent have the aims of its strategy for supplying electricity been fulfilled? [15] 4 (a) Describe and explain how population increase can lead to environmental degradation. [10] (b) With the help of one or more examples, explain why water pollution is difficult to reduce. [15]
Question paper, page 3
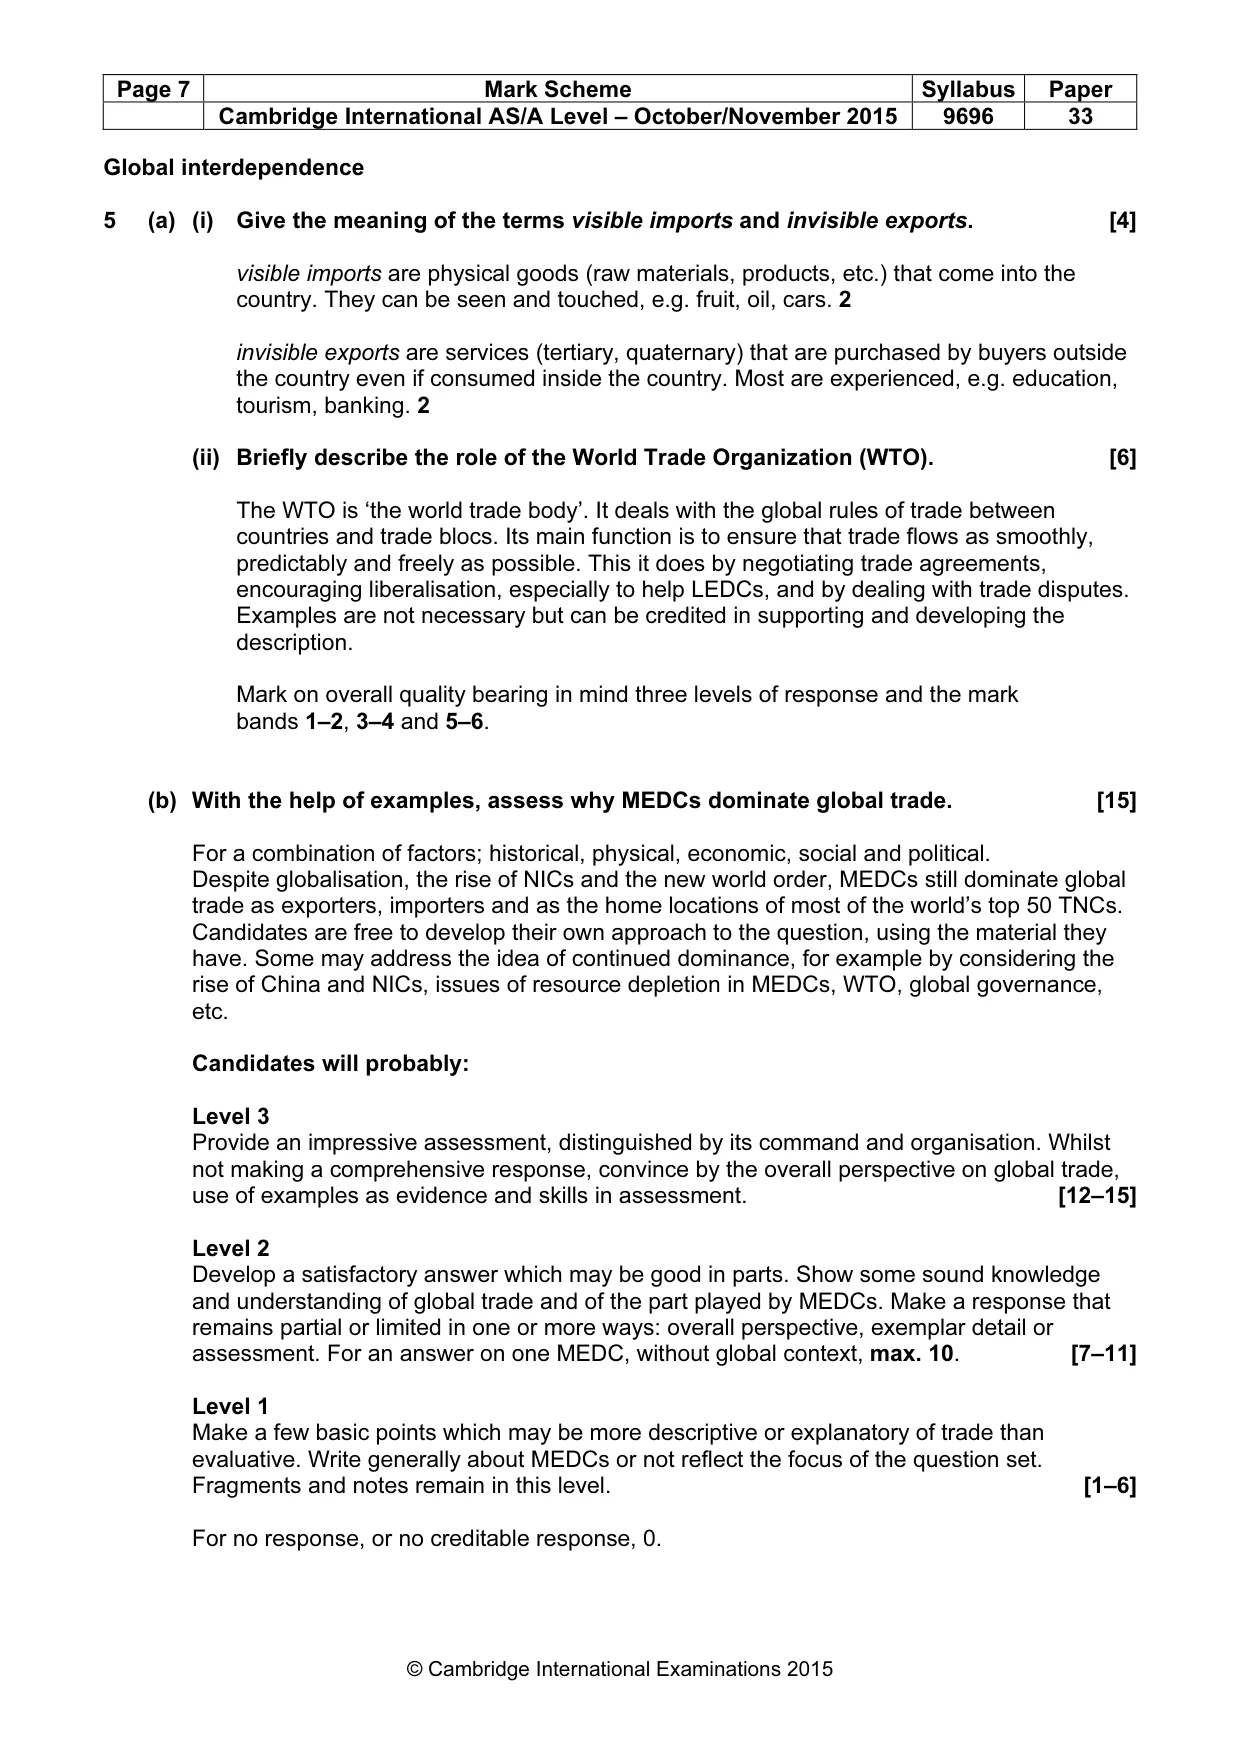
3 9696/33/O/N/15 © UCLES 2015 Global interdependence Only one question may be answered from this topic. 5 (a) (i) Give the meaning of the terms visible imports and invisible exports. [4] (ii) Briefly describe the role of the World Trade Organization (WTO). [6] (b) With the help of examples, assess why MEDCs dominate global trade. [15] 6 (a) Describe and explain the impacts of tourism on the environment. [10] (b) Fig. 3 shows the life cycle model of the development of resorts and tourist destinations. With the help of examples, evaluate the usefulness of this model in understanding the development of tourism. [15] Economic transition Only one question may be answered from this topic. 7 (a) Content removed due to copyright restrictions. [10] (b) Explain why some countries attract more foreign direct investment (FDI) than others. [15] 8 For one country you have studied: (a) describe the characteristics of its core and its periphery; [10] (b) evaluate the success of attempts to reduce disparities between the core and the periphery. [15]
Question paper, page 4
4 9696/33/O/N/15 © UCLES 2015 BLANK PAGE Permission to reproduce items where third-party owned material protected by copyright is included has been sought and cleared where possible. Every reasonable effort has been made by the publisher (UCLES) to trace copyright holders, but if any items requiring clearance have unwittingly been included, the publisher will be pleased to make amends at the earliest possible opportunity. To avoid the issue of disclosure of answer-related information to candidates, all copyright acknowledgements are reproduced online in the Cambridge International Examinations Copyright Acknowledgements Booklet. This is produced for each series of examinations and is freely available to download at www.cie.org.uk after the live examination series. Cambridge International Examinations is part of the Cambridge Assessment Group. Cambridge Assessment is the brand name of University of Cambridge Local Examinations Syndicate (UCLES), which is itself a department of the University of Cambridge.
Mark scheme, page 1
® IGCSE is the registered trademark of Cambridge International Examinations. CAMBRIDGE INTERNATIONAL EXAMINATIONS Cambridge International Advanced Subsidiary and Advanced Level MARK SCHEME for the October/November 2015 series 9696 GEOGRAPHY 9696/33 Paper 3 (Advanced Human Options), maximum raw mark 50 This mark scheme is published as an aid to teachers and candidates, to indicate the requirements of the examination. It shows the basis on which Examiners were instructed to award marks. It does not indicate the details of the discussions that took place at an Examiners’ meeting before marking began, which would have considered the acceptability of alternative answers. Mark schemes should be read in conjunction with the question paper and the Principal Examiner Report for Teachers. Cambridge will not enter into discussions about these mark schemes. Cambridge is publishing the mark schemes for the October/November 2015 series for most Cambridge IGCSE®, Cambridge International A and AS Level components and some Cambridge O Level components.
Mark scheme, page 2
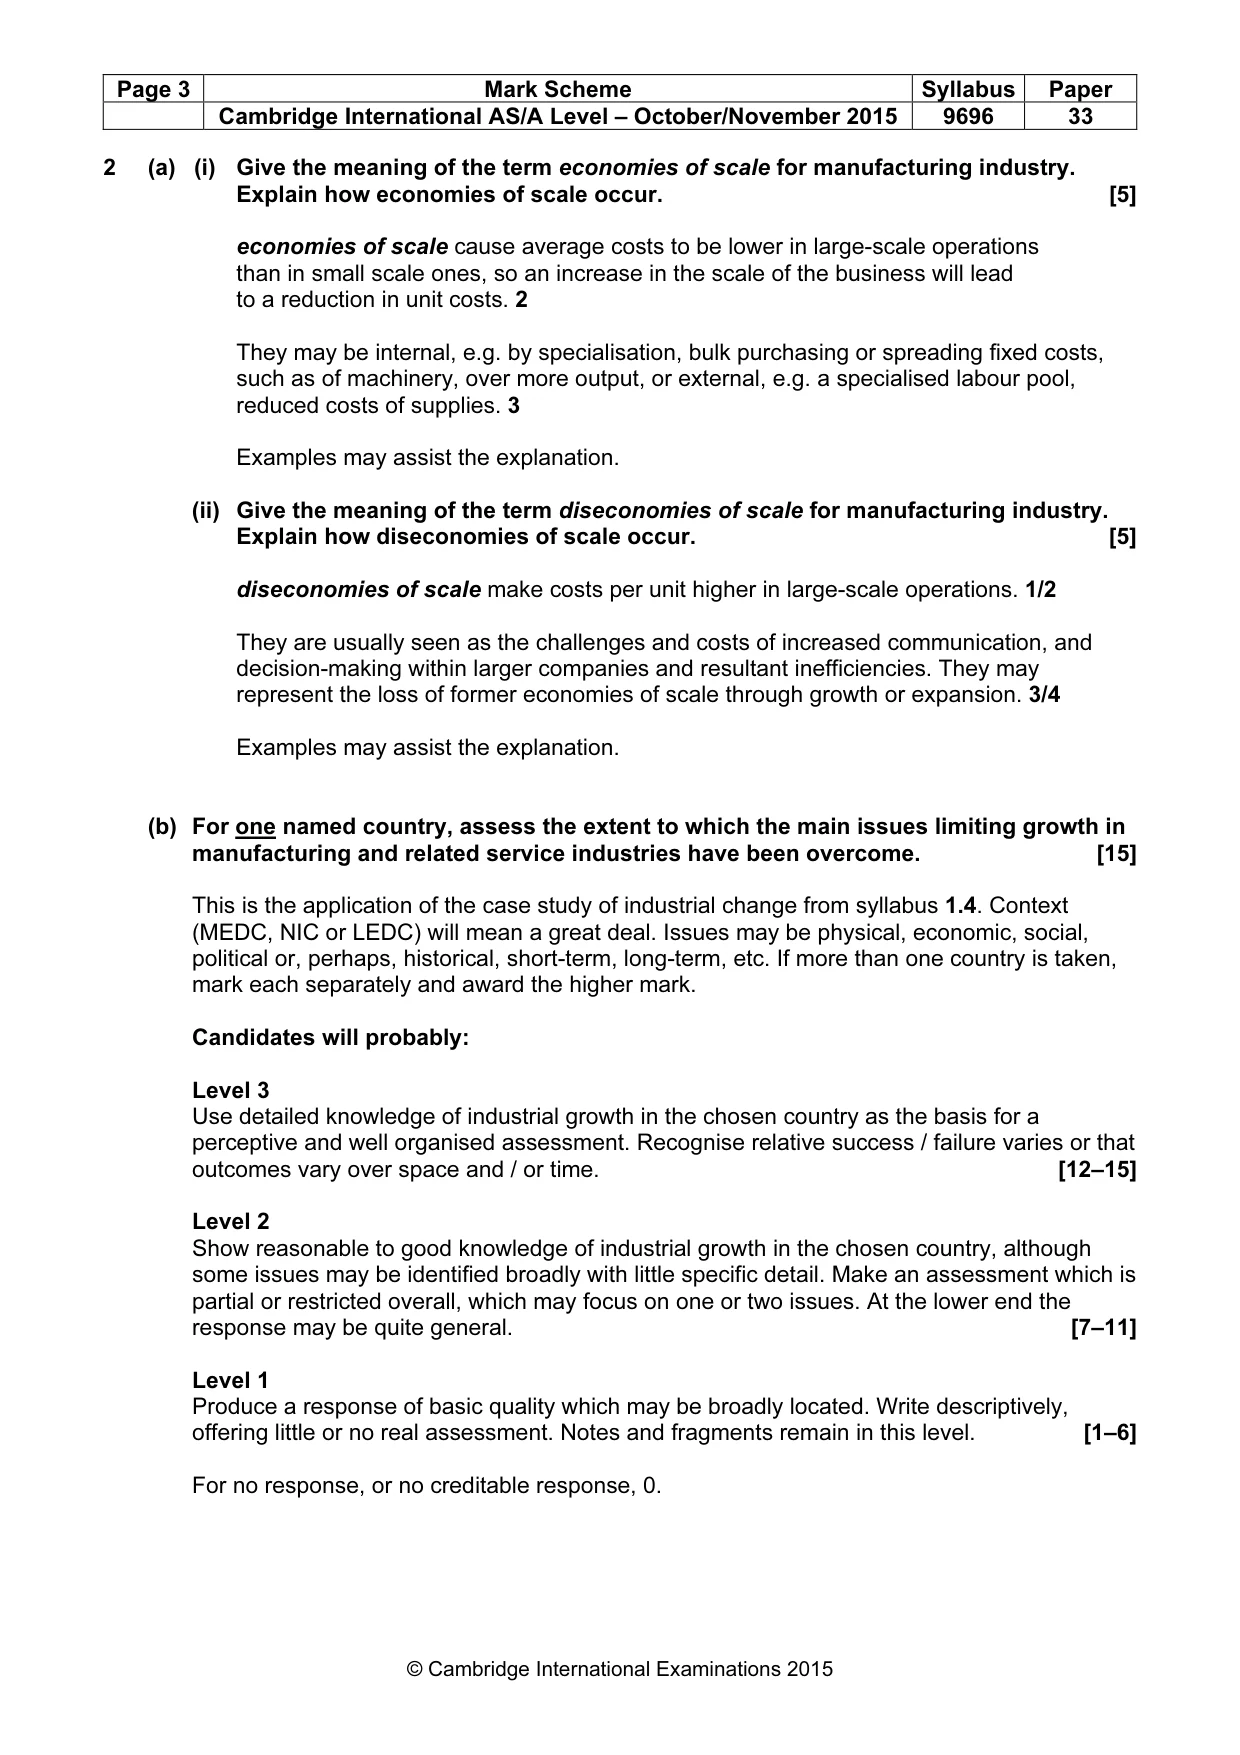
Page 2 Mark Scheme Syllabus Paper Cambridge International AS/A Level – October/November 2015 9696 33 © Cambridge International Examinations 2015 Production, location and change 1 (a) Fig. 1 shows food demand for MEDCs, LEDCs and the world in 1974 and 1997 and forecasts for 2020. (i) Describe the trends in food demand shown in Fig. 1. [3] All are increasing (world is the aggregate of the other two) 1 Food demand has increased and is forecast to increase more / at a faster rate in LEDCs 1 Data support (dates and million metric tonnes) 1 (ii) Explain how the food demand in LEDCs in 2020 may be met. [7] The syllabus covers intensification and extension of cultivation. These two ways, if developed well, could be worth full marks. If candidates include the idea of food imports from MEDCs, either commercial trade or compassionate food aid, this is also creditable. Mark on overall quality, bearing in mind three bands of marks and levels of response: 1–3, 4–5 and 6–7. Examples may be credited as part of the explanation, but a general response could perform well and achieve full marks. (b) With the help of one or more examples, evaluate the effects of the intensification of agriculture on environments and people. [15] Some sense of balance and judgement is needed of negative effects and positive effects. For environments, positives include irrigation and dealing with pests. Much of the literature is negative: from the pollution of water by chemical fertilisers to soil degradation and the removal of trees and hedgerows. People avoid hunger and may gain skills, but many lost jobs through mechanisation, their holdings through land reform and diet quality with new less tasty rice hybrids, etc. Candidates will probably: Level 3 Structure the response as an evaluation and demonstrate strong conceptual understanding of intensification. Argue convincingly and critically, identifying positive and negative effects for both environments and people, using the example(s) effectively. [12–15] Level 2 Produce a sound response, which may be good in parts, but which remains limited in exemplar detail or development. May conclude a narrative about intensification with some evaluative comments. For an answer either on environments or on people, max. 10. [7–11] Level 1 Make a basic answer which may focus weakly on the effects of intensification and on the example(s). Make one or more valid points, but little or no evaluation. Notes and fragments remain in this level. [1–6] For no response, or no creditable response, 0.
Mark scheme, page 3
Page 3 Mark Scheme Syllabus Paper Cambridge International AS/A Level – October/November 2015 9696 33 © Cambridge International Examinations 2015 2 (a) (i) Give the meaning of the term economies of scale for manufacturing industry. Explain how economies of scale occur. [5] economies of scale cause average costs to be lower in large-scale operations than in small scale ones, so an increase in the scale of the business will lead to a reduction in unit costs. 2 They may be internal, e.g. by specialisation, bulk purchasing or spreading fixed costs, such as of machinery, over more output, or external, e.g. a specialised labour pool, reduced costs of supplies. 3 Examples may assist the explanation. (ii) Give the meaning of the term diseconomies of scale for manufacturing industry. Explain how diseconomies of scale occur. [5] diseconomies of scale make costs per unit higher in large-scale operations. 1/2 They are usually seen as the challenges and costs of increased communication, and decision-making within larger companies and resultant inefficiencies. They may represent the loss of former economies of scale through growth or expansion. 3/4 Examples may assist the explanation. (b) For one named country, assess the extent to which the main issues limiting growth in manufacturing and related service industries have been overcome. [15] This is the application of the case study of industrial change from syllabus 1.4. Context (MEDC, NIC or LEDC) will mean a great deal. Issues may be physical, economic, social, political or, perhaps, historical, short-term, long-term, etc. If more than one country is taken, mark each separately and award the higher mark. Candidates will probably: Level 3 Use detailed knowledge of industrial growth in the chosen country as the basis for a perceptive and well organised assessment. Recognise relative success / failure varies or that outcomes vary over space and / or time. [12–15] Level 2 Show reasonable to good knowledge of industrial growth in the chosen country, although some issues may be identified broadly with little specific detail. Make an assessment which is partial or restricted overall, which may focus on one or two issues. At the lower end the response may be quite general. [7–11] Level 1 Produce a response of basic quality which may be broadly located. Write descriptively, offering little or no real assessment. Notes and fragments remain in this level. [1–6] For no response, or no creditable response, 0.
Mark scheme, page 4
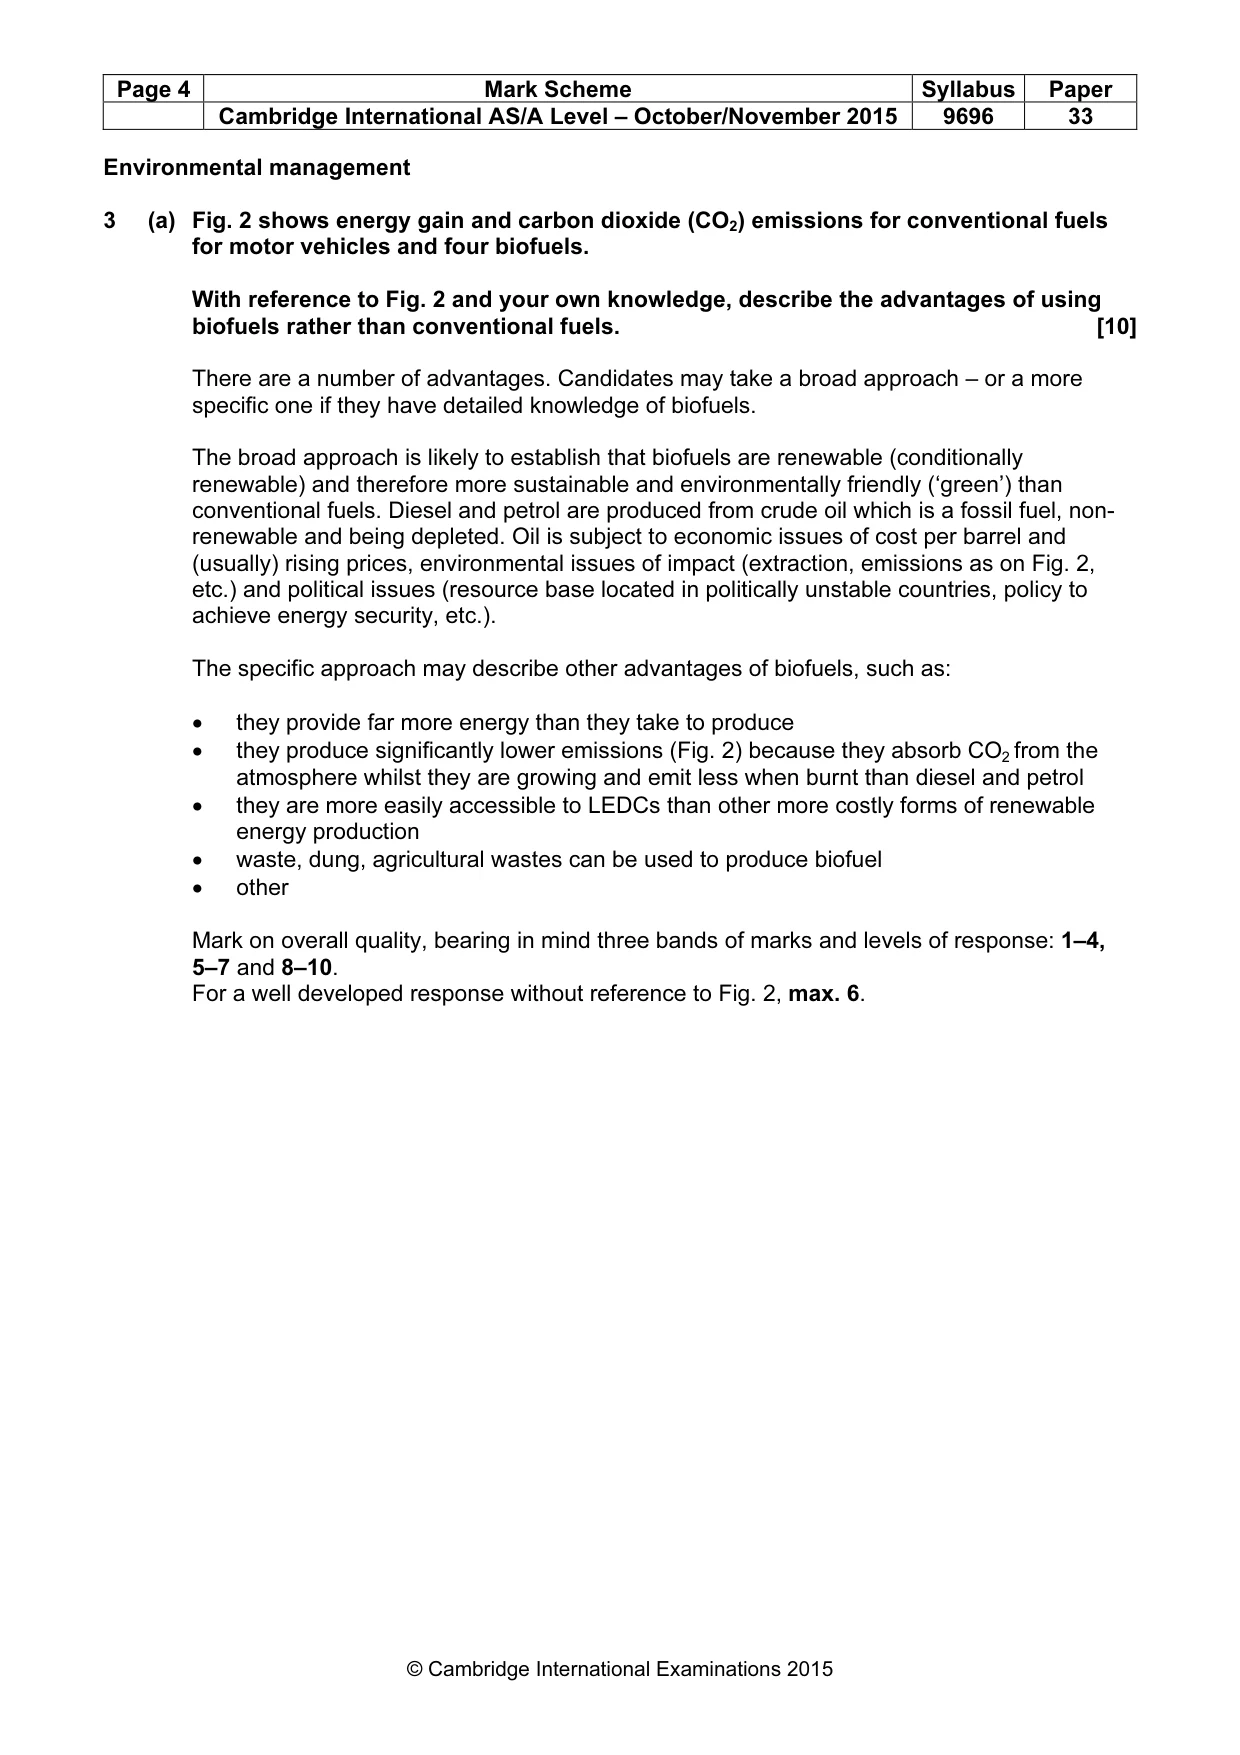
Page 4 Mark Scheme Syllabus Paper Cambridge International AS/A Level – October/November 2015 9696 33 © Cambridge International Examinations 2015 Environmental management 3 (a) Fig. 2 shows energy gain and carbon dioxide (CO2) emissions for conventional fuels for motor vehicles and four biofuels. With reference to Fig. 2 and your own knowledge, describe the advantages of using biofuels rather than conventional fuels. [10] There are a number of advantages. Candidates may take a broad approach – or a more specific one if they have detailed knowledge of biofuels. The broad approach is likely to establish that biofuels are renewable (conditionally renewable) and therefore more sustainable and environmentally friendly (‘green’) than conventional fuels. Diesel and petrol are produced from crude oil which is a fossil fuel, non- renewable and being depleted. Oil is subject to economic issues of cost per barrel and (usually) rising prices, environmental issues of impact (extraction, emissions as on Fig. 2, etc.) and political issues (resource base located in politically unstable countries, policy to achieve energy security, etc.). The specific approach may describe other advantages of biofuels, such as: • they provide far more energy than they take to produce • they produce significantly lower emissions (Fig. 2) because they absorb CO2 from the atmosphere whilst they are growing and emit less when burnt than diesel and petrol • they are more easily accessible to LEDCs than other more costly forms of renewable energy production • waste, dung, agricultural wastes can be used to produce biofuel • other Mark on overall quality, bearing in mind three bands of marks and levels of response: 1–4, 5–7 and 8–10. For a well developed response without reference to Fig. 2, max. 6.
Mark scheme, page 5
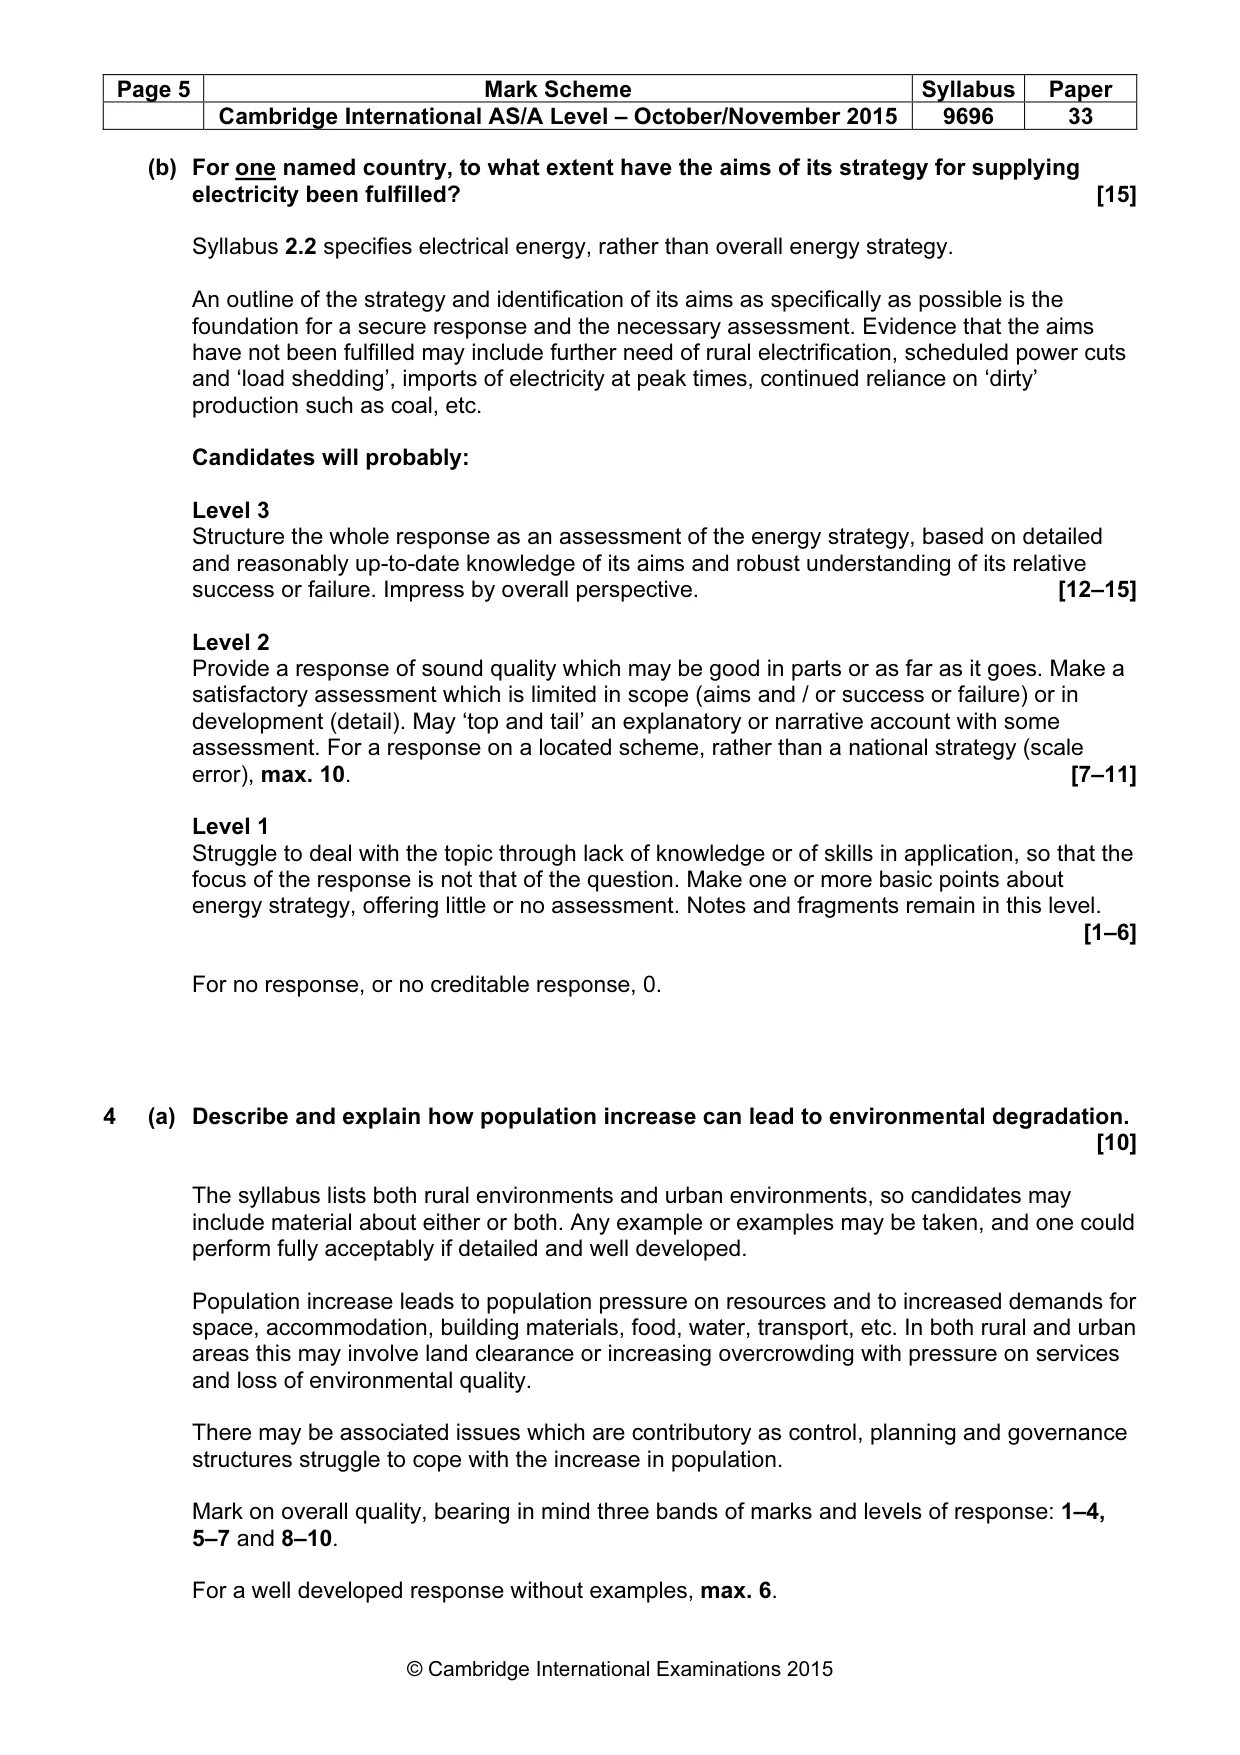
Page 5 Mark Scheme Syllabus Paper Cambridge International AS/A Level – October/November 2015 9696 33 © Cambridge International Examinations 2015 (b) For one named country, to what extent have the aims of its strategy for supplying electricity been fulfilled? [15] Syllabus 2.2 specifies electrical energy, rather than overall energy strategy. An outline of the strategy and identification of its aims as specifically as possible is the foundation for a secure response and the necessary assessment. Evidence that the aims have not been fulfilled may include further need of rural electrification, scheduled power cuts and ‘load shedding’, imports of electricity at peak times, continued reliance on ‘dirty’ production such as coal, etc. Candidates will probably: Level 3 Structure the whole response as an assessment of the energy strategy, based on detailed and reasonably up-to-date knowledge of its aims and robust understanding of its relative success or failure. Impress by overall perspective. [12–15] Level 2 Provide a response of sound quality which may be good in parts or as far as it goes. Make a satisfactory assessment which is limited in scope (aims and / or success or failure) or in development (detail). May ‘top and tail’ an explanatory or narrative account with some assessment. For a response on a located scheme, rather than a national strategy (scale error), max. 10. [7–11] Level 1 Struggle to deal with the topic through lack of knowledge or of skills in application, so that the focus of the response is not that of the question. Make one or more basic points about energy strategy, offering little or no assessment. Notes and fragments remain in this level. [1–6] For no response, or no creditable response, 0. 4 (a) Describe and explain how population increase can lead to environmental degradation. [10] The syllabus lists both rural environments and urban environments, so candidates may include material about either or both. Any example or examples may be taken, and one could perform fully acceptably if detailed and well developed. Population increase leads to population pressure on resources and to increased demands for space, accommodation, building materials, food, water, transport, etc. In both rural and urban areas this may involve land clearance or increasing overcrowding with pressure on services and loss of environmental quality. There may be associated issues which are contributory as control, planning and governance structures struggle to cope with the increase in population. Mark on overall quality, bearing in mind three bands of marks and levels of response: 1–4, 5–7 and 8–10. For a well developed response without examples, max. 6.
Mark scheme, page 6
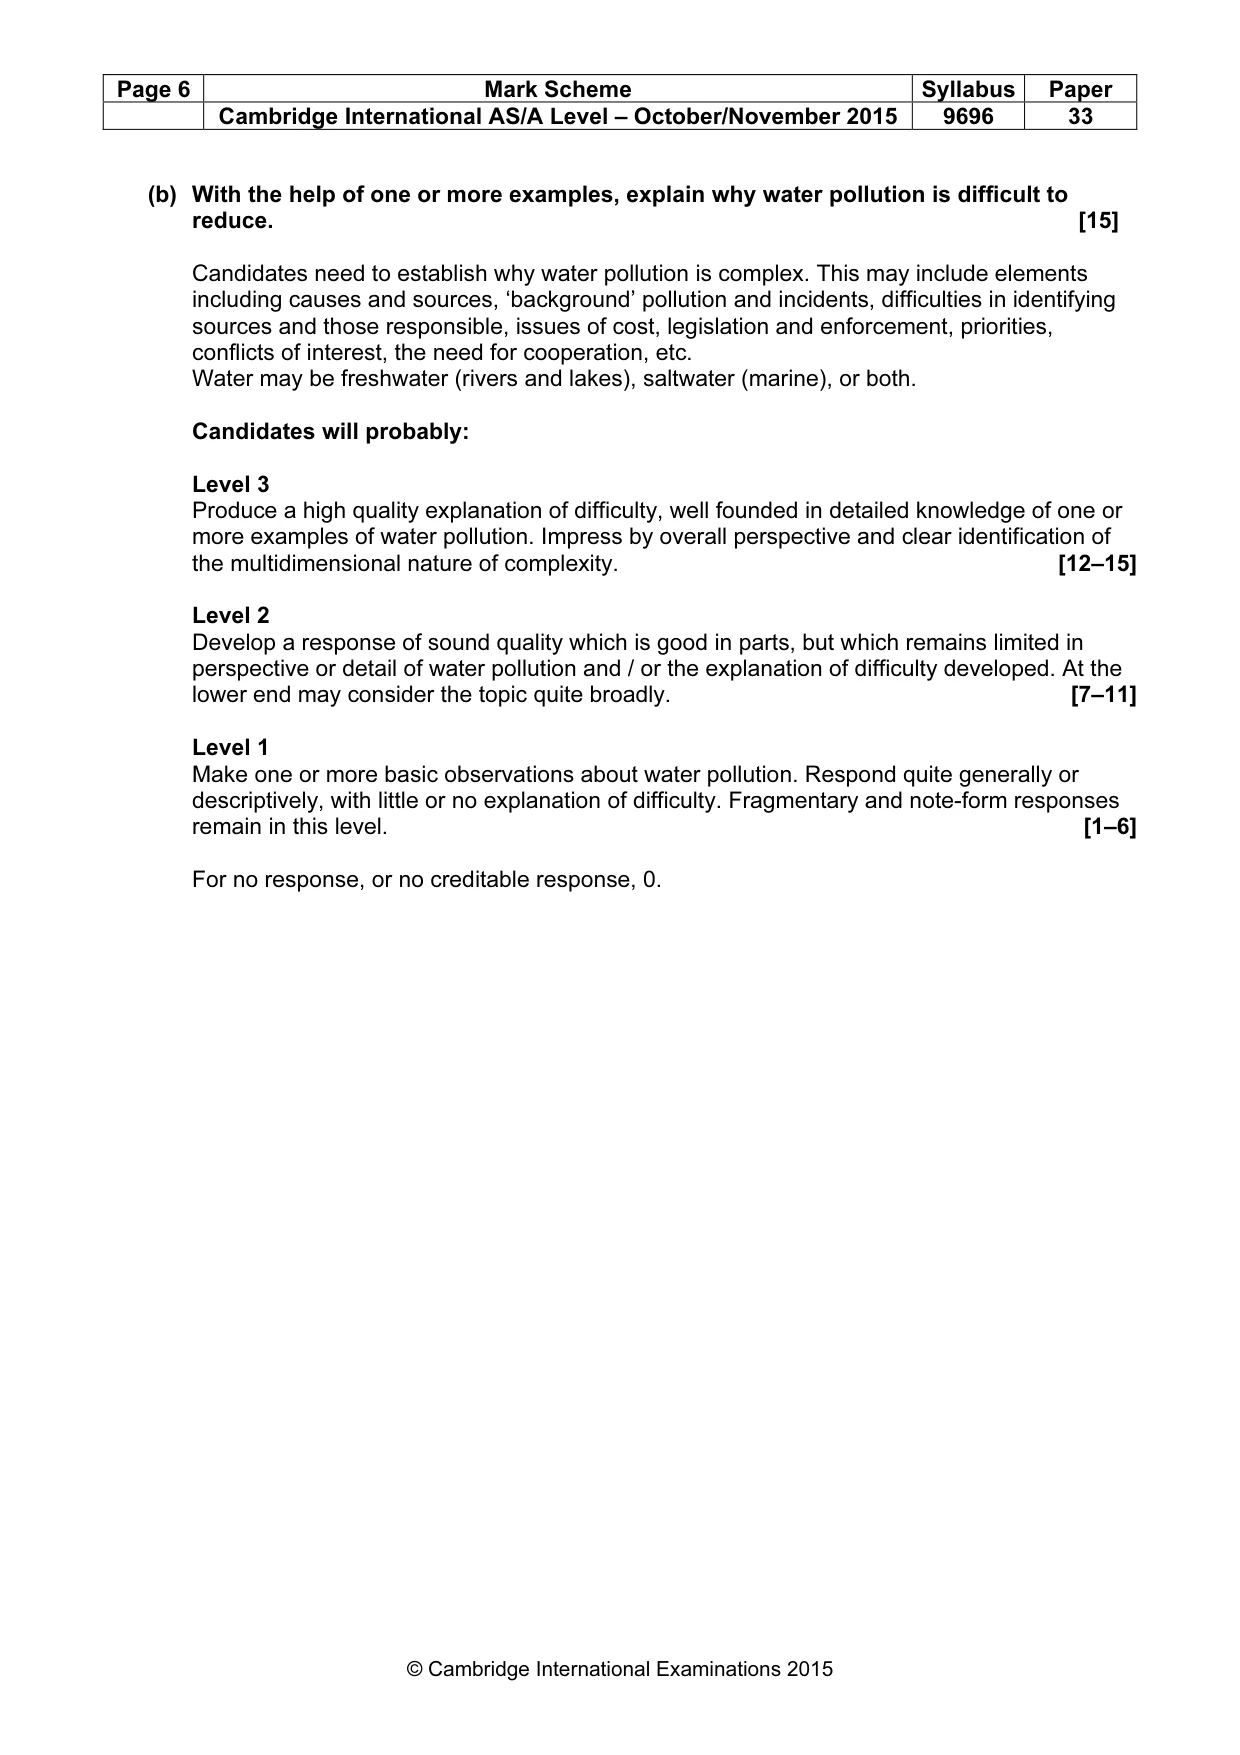
Page 6 Mark Scheme Syllabus Paper Cambridge International AS/A Level – October/November 2015 9696 33 © Cambridge International Examinations 2015 (b) With the help of one or more examples, explain why water pollution is difficult to reduce. [15] Candidates need to establish why water pollution is complex. This may include elements including causes and sources, ‘background’ pollution and incidents, difficulties in identifying sources and those responsible, issues of cost, legislation and enforcement, priorities, conflicts of interest, the need for cooperation, etc. Water may be freshwater (rivers and lakes), saltwater (marine), or both. Candidates will probably: Level 3 Produce a high quality explanation of difficulty, well founded in detailed knowledge of one or more examples of water pollution. Impress by overall perspective and clear identification of the multidimensional nature of complexity. [12–15] Level 2 Develop a response of sound quality which is good in parts, but which remains limited in perspective or detail of water pollution and / or the explanation of difficulty developed. At the lower end may consider the topic quite broadly. [7–11] Level 1 Make one or more basic observations about water pollution. Respond quite generally or descriptively, with little or no explanation of difficulty. Fragmentary and note-form responses remain in this level. [1–6] For no response, or no creditable response, 0.
Mark scheme, page 7
Page 7 Mark Scheme Syllabus Paper Cambridge International AS/A Level – October/November 2015 9696 33 © Cambridge International Examinations 2015 Global interdependence 5 (a) (i) Give the meaning of the terms visible imports and invisible exports. [4] visible imports are physical goods (raw materials, products, etc.) that come into the country. They can be seen and touched, e.g. fruit, oil, cars. 2 invisible exports are services (tertiary, quaternary) that are purchased by buyers outside the country even if consumed inside the country. Most are experienced, e.g. education, tourism, banking. 2 (ii) Briefly describe the role of the World Trade Organization (WTO). [6] The WTO is ‘the world trade body’. It deals with the global rules of trade between countries and trade blocs. Its main function is to ensure that trade flows as smoothly, predictably and freely as possible. This it does by negotiating trade agreements, encouraging liberalisation, especially to help LEDCs, and by dealing with trade disputes. Examples are not necessary but can be credited in supporting and developing the description. Mark on overall quality bearing in mind three levels of response and the mark bands 1–2, 3–4 and 5–6. (b) With the help of examples, assess why MEDCs dominate global trade. [15] For a combination of factors; historical, physical, economic, social and political. Despite globalisation, the rise of NICs and the new world order, MEDCs still dominate global trade as exporters, importers and as the home locations of most of the world’s top 50 TNCs. Candidates are free to develop their own approach to the question, using the material they have. Some may address the idea of continued dominance, for example by considering the rise of China and NICs, issues of resource depletion in MEDCs, WTO, global governance, etc. Candidates will probably: Level 3 Provide an impressive assessment, distinguished by its command and organisation. Whilst not making a comprehensive response, convince by the overall perspective on global trade, use of examples as evidence and skills in assessment. [12–15] Level 2 Develop a satisfactory answer which may be good in parts. Show some sound knowledge and understanding of global trade and of the part played by MEDCs. Make a response that remains partial or limited in one or more ways: overall perspective, exemplar detail or assessment. For an answer on one MEDC, without global context, max. 10. [7–11] Level 1 Make a few basic points which may be more descriptive or explanatory of trade than evaluative. Write generally about MEDCs or not reflect the focus of the question set. Fragments and notes remain in this level. [1–6] For no response, or no creditable response, 0.
Mark scheme, page 8
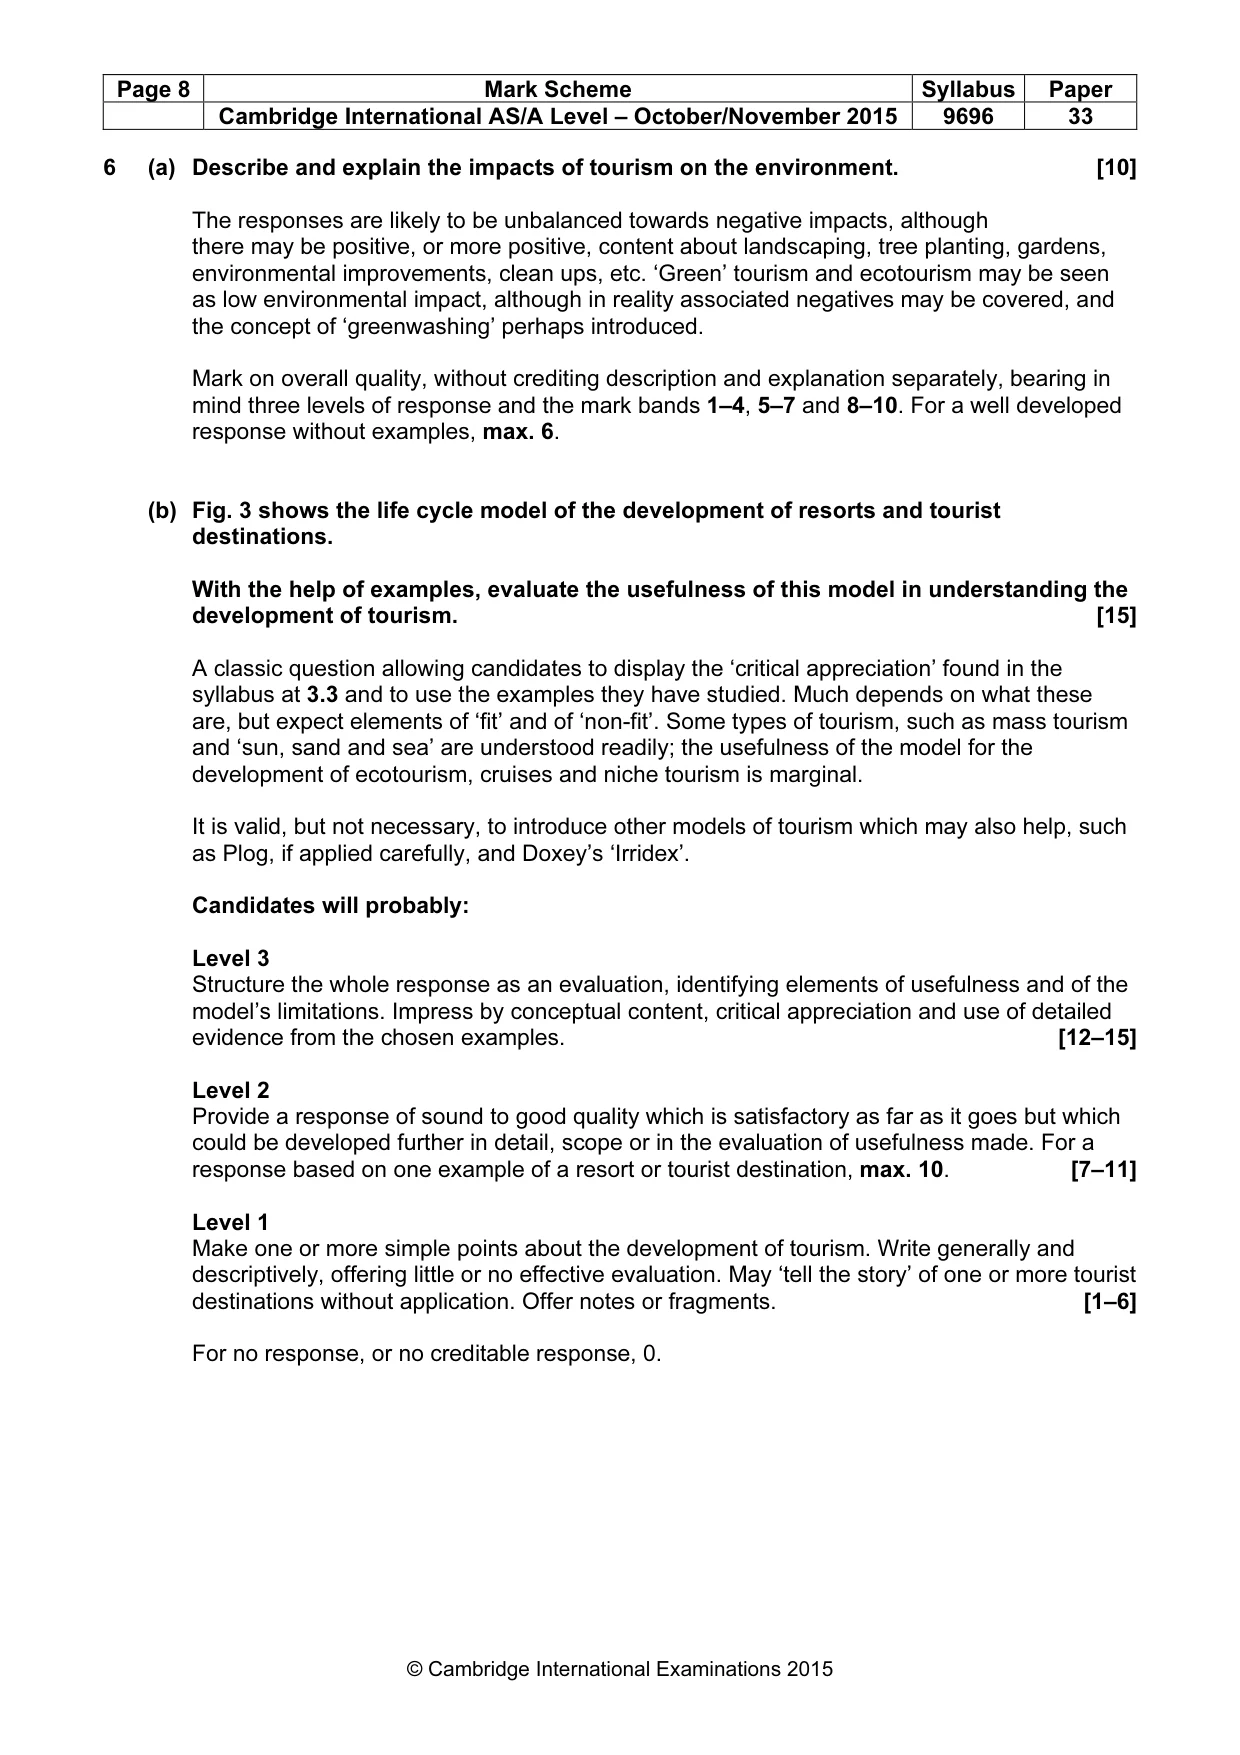
Page 8 Mark Scheme Syllabus Paper Cambridge International AS/A Level – October/November 2015 9696 33 © Cambridge International Examinations 2015 6 (a) Describe and explain the impacts of tourism on the environment. [10] The responses are likely to be unbalanced towards negative impacts, although there may be positive, or more positive, content about landscaping, tree planting, gardens, environmental improvements, clean ups, etc. ‘Green’ tourism and ecotourism may be seen as low environmental impact, although in reality associated negatives may be covered, and the concept of ‘greenwashing’ perhaps introduced. Mark on overall quality, without crediting description and explanation separately, bearing in mind three levels of response and the mark bands 1–4, 5–7 and 8–10. For a well developed response without examples, max. 6. (b) Fig. 3 shows the life cycle model of the development of resorts and tourist destinations. With the help of examples, evaluate the usefulness of this model in understanding the development of tourism. [15] A classic question allowing candidates to display the ‘critical appreciation’ found in the syllabus at 3.3 and to use the examples they have studied. Much depends on what these are, but expect elements of ‘fit’ and of ‘non-fit’. Some types of tourism, such as mass tourism and ‘sun, sand and sea’ are understood readily; the usefulness of the model for the development of ecotourism, cruises and niche tourism is marginal. It is valid, but not necessary, to introduce other models of tourism which may also help, such as Plog, if applied carefully, and Doxey’s ‘Irridex’. Candidates will probably: Level 3 Structure the whole response as an evaluation, identifying elements of usefulness and of the model’s limitations. Impress by conceptual content, critical appreciation and use of detailed evidence from the chosen examples. [12–15] Level 2 Provide a response of sound to good quality which is satisfactory as far as it goes but which could be developed further in detail, scope or in the evaluation of usefulness made. For a response based on one example of a resort or tourist destination, max. 10. [7–11] Level 1 Make one or more simple points about the development of tourism. Write generally and descriptively, offering little or no effective evaluation. May ‘tell the story’ of one or more tourist destinations without application. Offer notes or fragments. [1–6] For no response, or no creditable response, 0.
Mark scheme, page 9
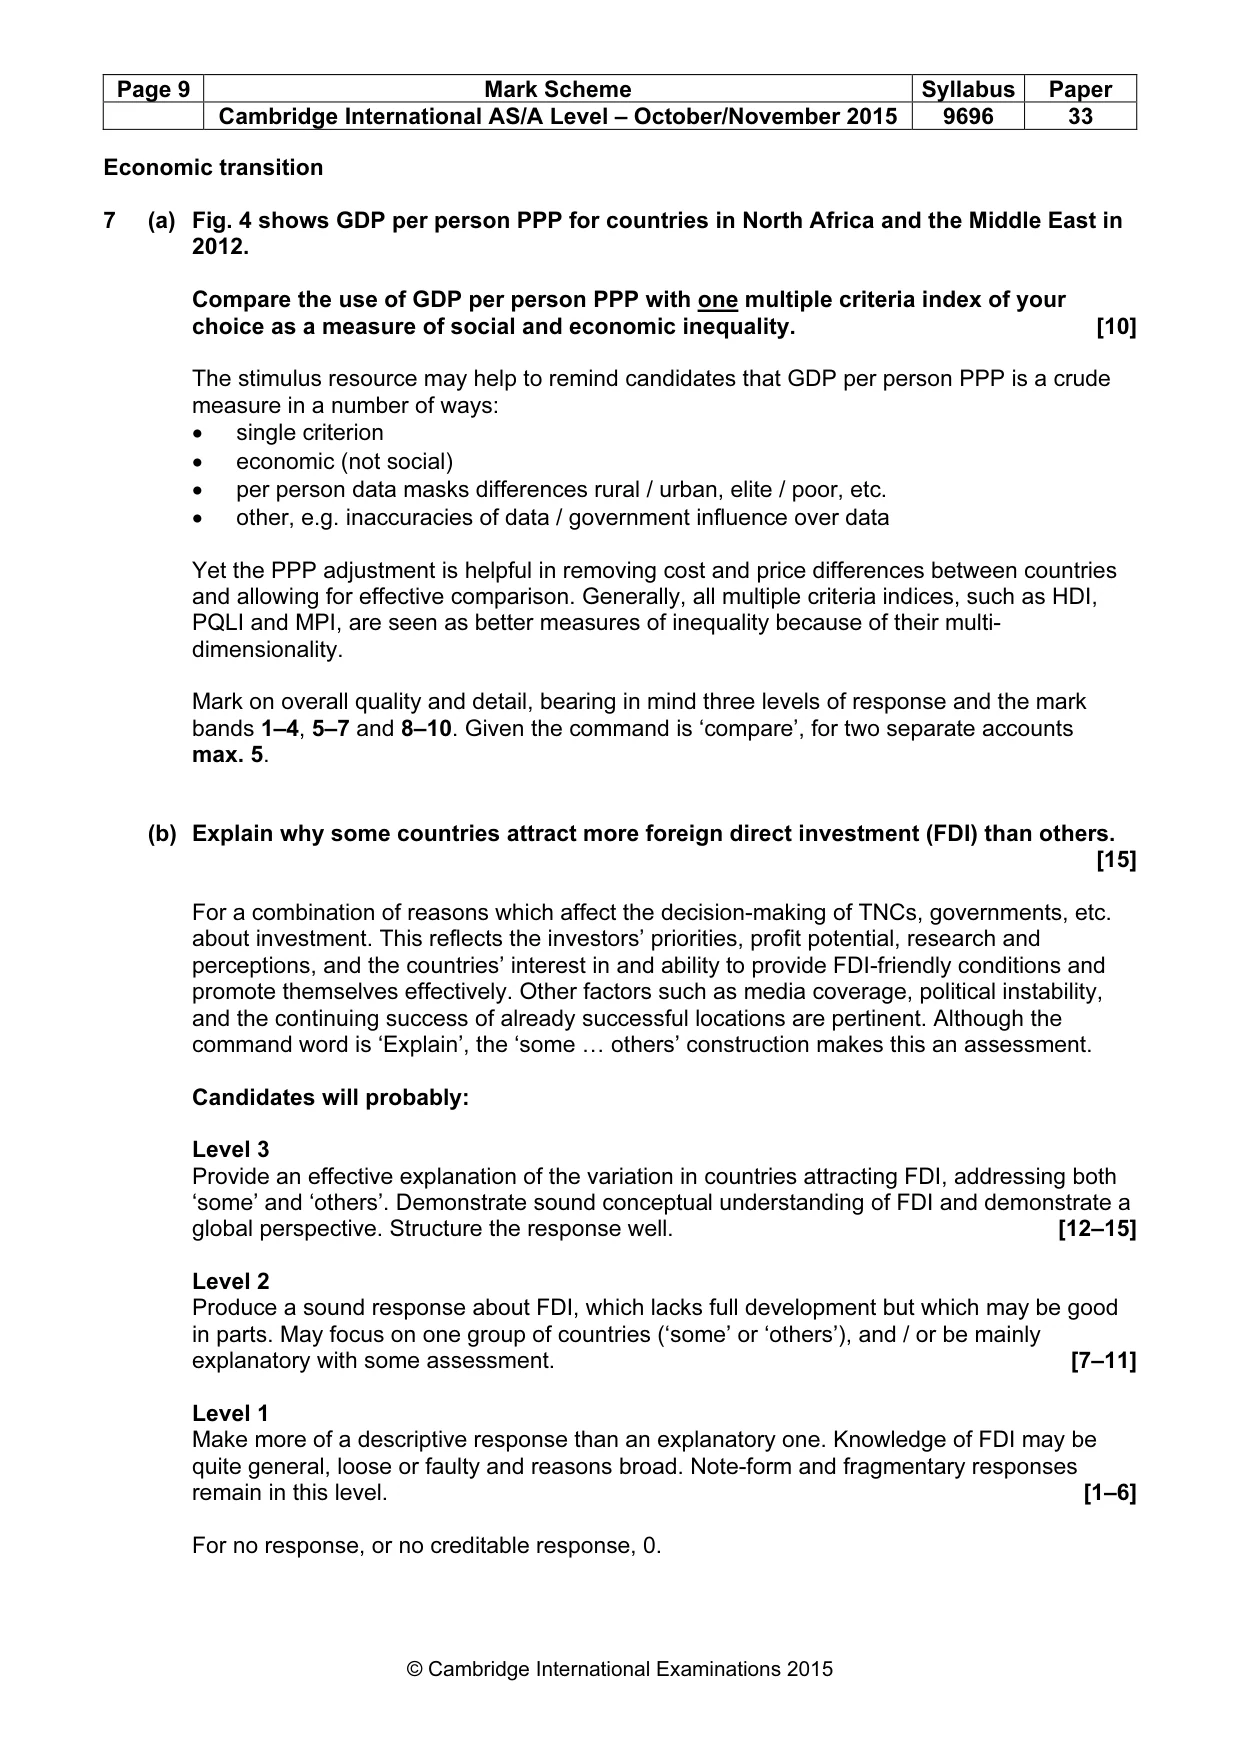
Page 9 Mark Scheme Syllabus Paper Cambridge International AS/A Level – October/November 2015 9696 33 © Cambridge International Examinations 2015 Economic transition 7 (a) Fig. 4 shows GDP per person PPP for countries in North Africa and the Middle East in 2012. Compare the use of GDP per person PPP with one multiple criteria index of your choice as a measure of social and economic inequality. [10] The stimulus resource may help to remind candidates that GDP per person PPP is a crude measure in a number of ways: • single criterion • economic (not social) • per person data masks differences rural / urban, elite / poor, etc. • other, e.g. inaccuracies of data / government influence over data Yet the PPP adjustment is helpful in removing cost and price differences between countries and allowing for effective comparison. Generally, all multiple criteria indices, such as HDI, PQLI and MPI, are seen as better measures of inequality because of their multi- dimensionality. Mark on overall quality and detail, bearing in mind three levels of response and the mark bands 1–4, 5–7 and 8–10. Given the command is ‘compare’, for two separate accounts max. 5. (b) Explain why some countries attract more foreign direct investment (FDI) than others. [15] For a combination of reasons which affect the decision-making of TNCs, governments, etc. about investment. This reflects the investors’ priorities, profit potential, research and perceptions, and the countries’ interest in and ability to provide FDI-friendly conditions and promote themselves effectively. Other factors such as media coverage, political instability, and the continuing success of already successful locations are pertinent. Although the command word is ‘Explain’, the ‘some … others’ construction makes this an assessment. Candidates will probably: Level 3 Provide an effective explanation of the variation in countries attracting FDI, addressing both ‘some’ and ‘others’. Demonstrate sound conceptual understanding of FDI and demonstrate a global perspective. Structure the response well. [12–15] Level 2 Produce a sound response about FDI, which lacks full development but which may be good in parts. May focus on one group of countries (‘some’ or ‘others’), and / or be mainly explanatory with some assessment. [7–11] Level 1 Make more of a descriptive response than an explanatory one. Knowledge of FDI may be quite general, loose or faulty and reasons broad. Note-form and fragmentary responses remain in this level. [1–6] For no response, or no creditable response, 0.
Mark scheme, page 10
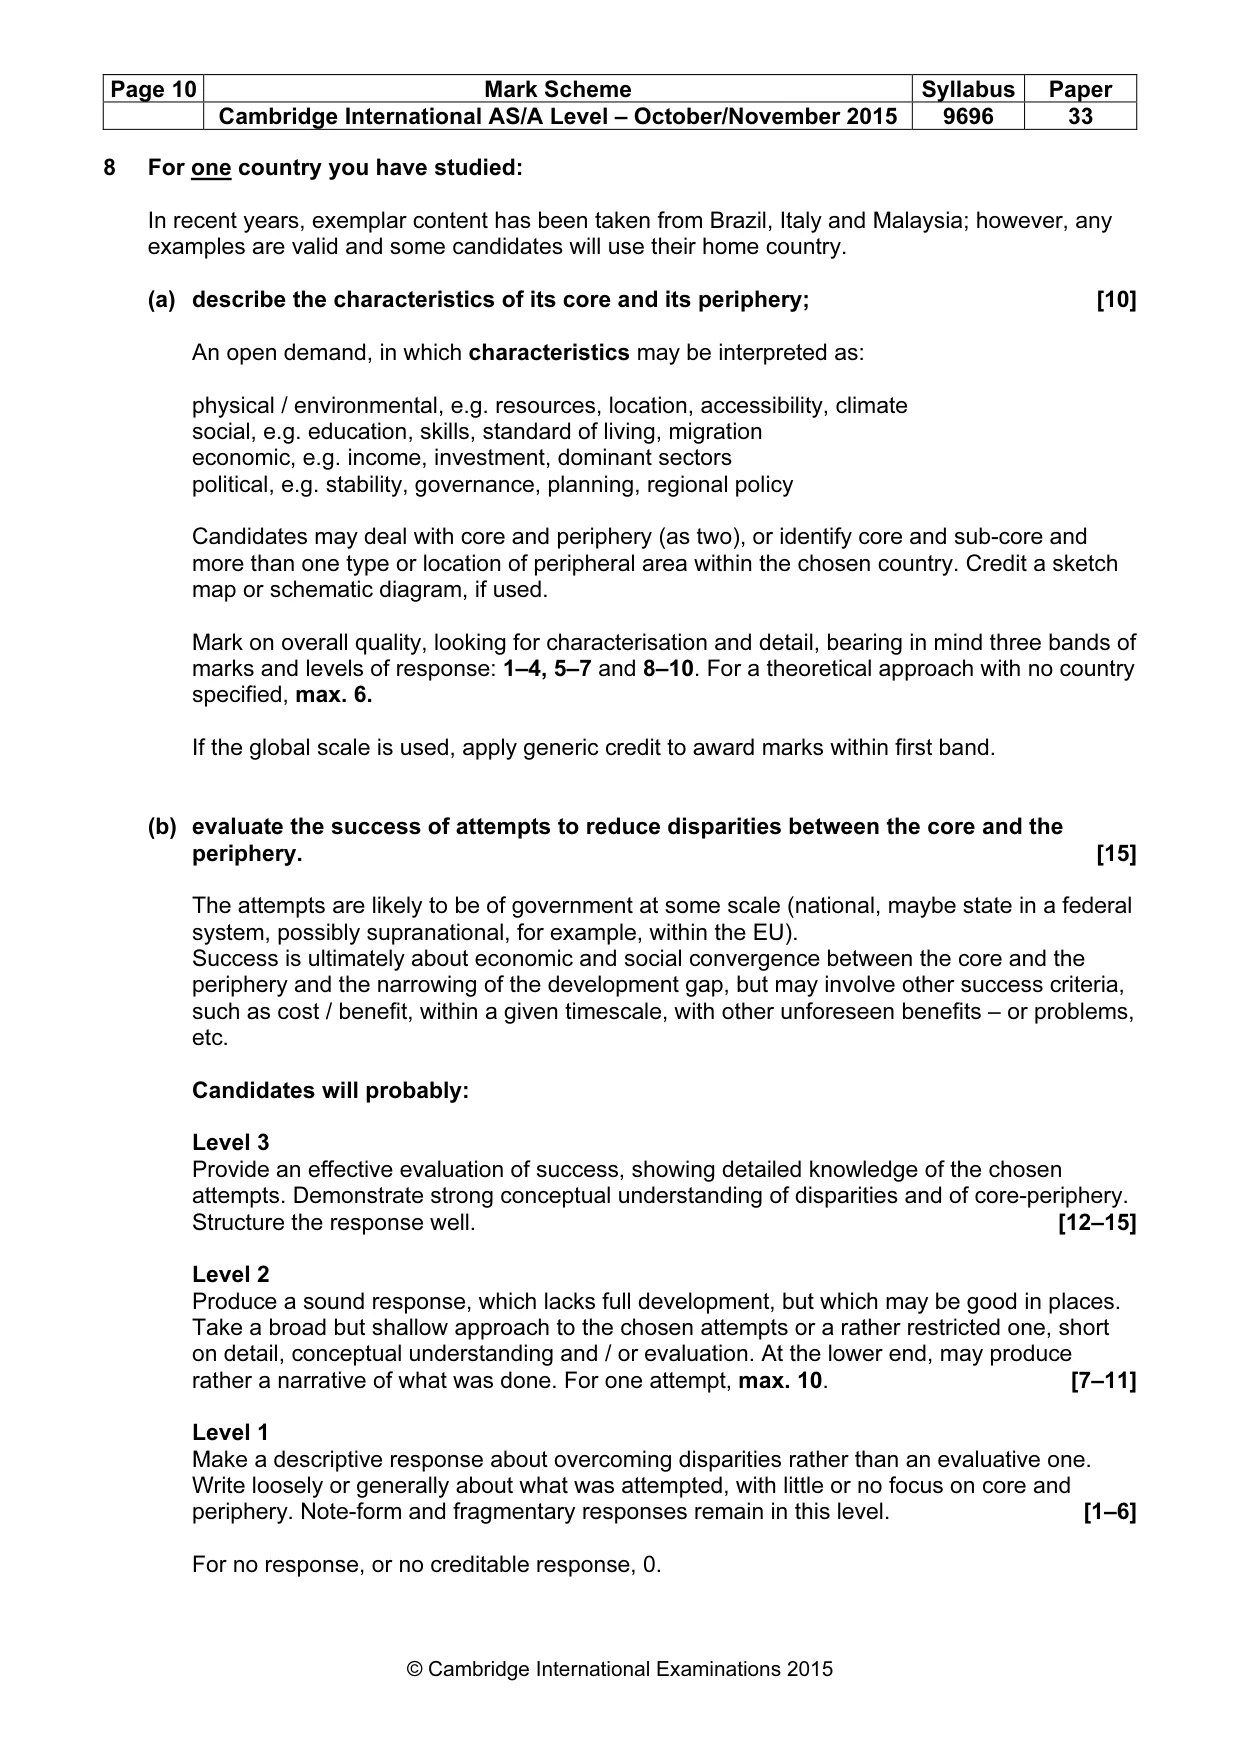
Page 10 Mark Scheme Syllabus Paper Cambridge International AS/A Level – October/November 2015 9696 33 © Cambridge International Examinations 2015 8 For one country you have studied: In recent years, exemplar content has been taken from Brazil, Italy and Malaysia; however, any examples are valid and some candidates will use their home country. (a) describe the characteristics of its core and its periphery; [10] An open demand, in which characteristics may be interpreted as: physical / environmental, e.g. resources, location, accessibility, climate social, e.g. education, skills, standard of living, migration economic, e.g. income, investment, dominant sectors political, e.g. stability, governance, planning, regional policy Candidates may deal with core and periphery (as two), or identify core and sub-core and more than one type or location of peripheral area within the chosen country. Credit a sketch map or schematic diagram, if used. Mark on overall quality, looking for characterisation and detail, bearing in mind three bands of marks and levels of response: 1–4, 5–7 and 8–10. For a theoretical approach with no country specified, max. 6. If the global scale is used, apply generic credit to award marks within first band. (b) evaluate the success of attempts to reduce disparities between the core and the periphery. [15] The attempts are likely to be of government at some scale (national, maybe state in a federal system, possibly supranational, for example, within the EU). Success is ultimately about economic and social convergence between the core and the periphery and the narrowing of the development gap, but may involve other success criteria, such as cost / benefit, within a given timescale, with other unforeseen benefits – or problems, etc. Candidates will probably: Level 3 Provide an effective evaluation of success, showing detailed knowledge of the chosen attempts. Demonstrate strong conceptual understanding of disparities and of core-periphery. Structure the response well. [12–15] Level 2 Produce a sound response, which lacks full development, but which may be good in places. Take a broad but shallow approach to the chosen attempts or a rather restricted one, short on detail, conceptual understanding and / or evaluation. At the lower end, may produce rather a narrative of what was done. For one attempt, max. 10. [7–11] Level 1 Make a descriptive response about overcoming disparities rather than an evaluative one. Write loosely or generally about what was attempted, with little or no focus on core and periphery. Note-form and fragmentary responses remain in this level. [1–6] For no response, or no creditable response, 0.
What you needed in this session
Cambridge’s own grade thresholds for 2015 Oct/Nov, Paper 3 · Variant 3. A higher threshold means an easier paper — the bar moves with how the cohort did.