Cambridge A Level Geography 9696 — 2011 Oct/Nov Paper 3 · Variant 1
9696/31/O/N/11 · 50 marks · ≈56 min
The question paper and its mark scheme, free to read here and free to download. This is Cambridge’s own paper, exactly as it was sat.
Question paper4 pages


Mark scheme11 pages
Answers below. Sit the paper first if you are practising.




Paper as text
Question paper, page 1
READ THESE INSTRUCTIONS FIRST If you have been given an Answer Booklet, follow the instructions on the front cover of the Booklet. Write your Centre number, candidate number and name on all the work you hand in. Write in dark blue or black pen. You may use a soft pencil for any diagrams, graphs or rough working. Do not use staples, paper clips, highlighters, glue or correction fl uid. Answer two questions only. Each question answered must be from a different topic. Sketch maps and diagrams should be drawn whenever they serve to illustrate an answer. You should make reference to appropriate examples studied in the fi eld or the classroom, even where such examples are not specifi cally requested by the question. All the Figures and the Table referred to in the questions are contained in the Insert. At the end of the examination, fasten all your work securely together. The number of marks is given in brackets [ ] at the end of each question or part question. GEOGRAPHY 9696/31 Paper 3 Advanced Human Options October/November 2011 1 hour 30 minutes Additional Materials: Answer Booklet/Paper UNIVERSITY OF CAMBRIDGE INTERNATIONAL EXAMINATIONS General Certifi cate of Education Advanced Subsidiary Level and Advanced Level This document consists of 3 printed pages, 1 blank page and 1 Insert. [Turn over IB11 11_9696_31/RP © UCLES 2011 *4723008892*
Question paper, page 2
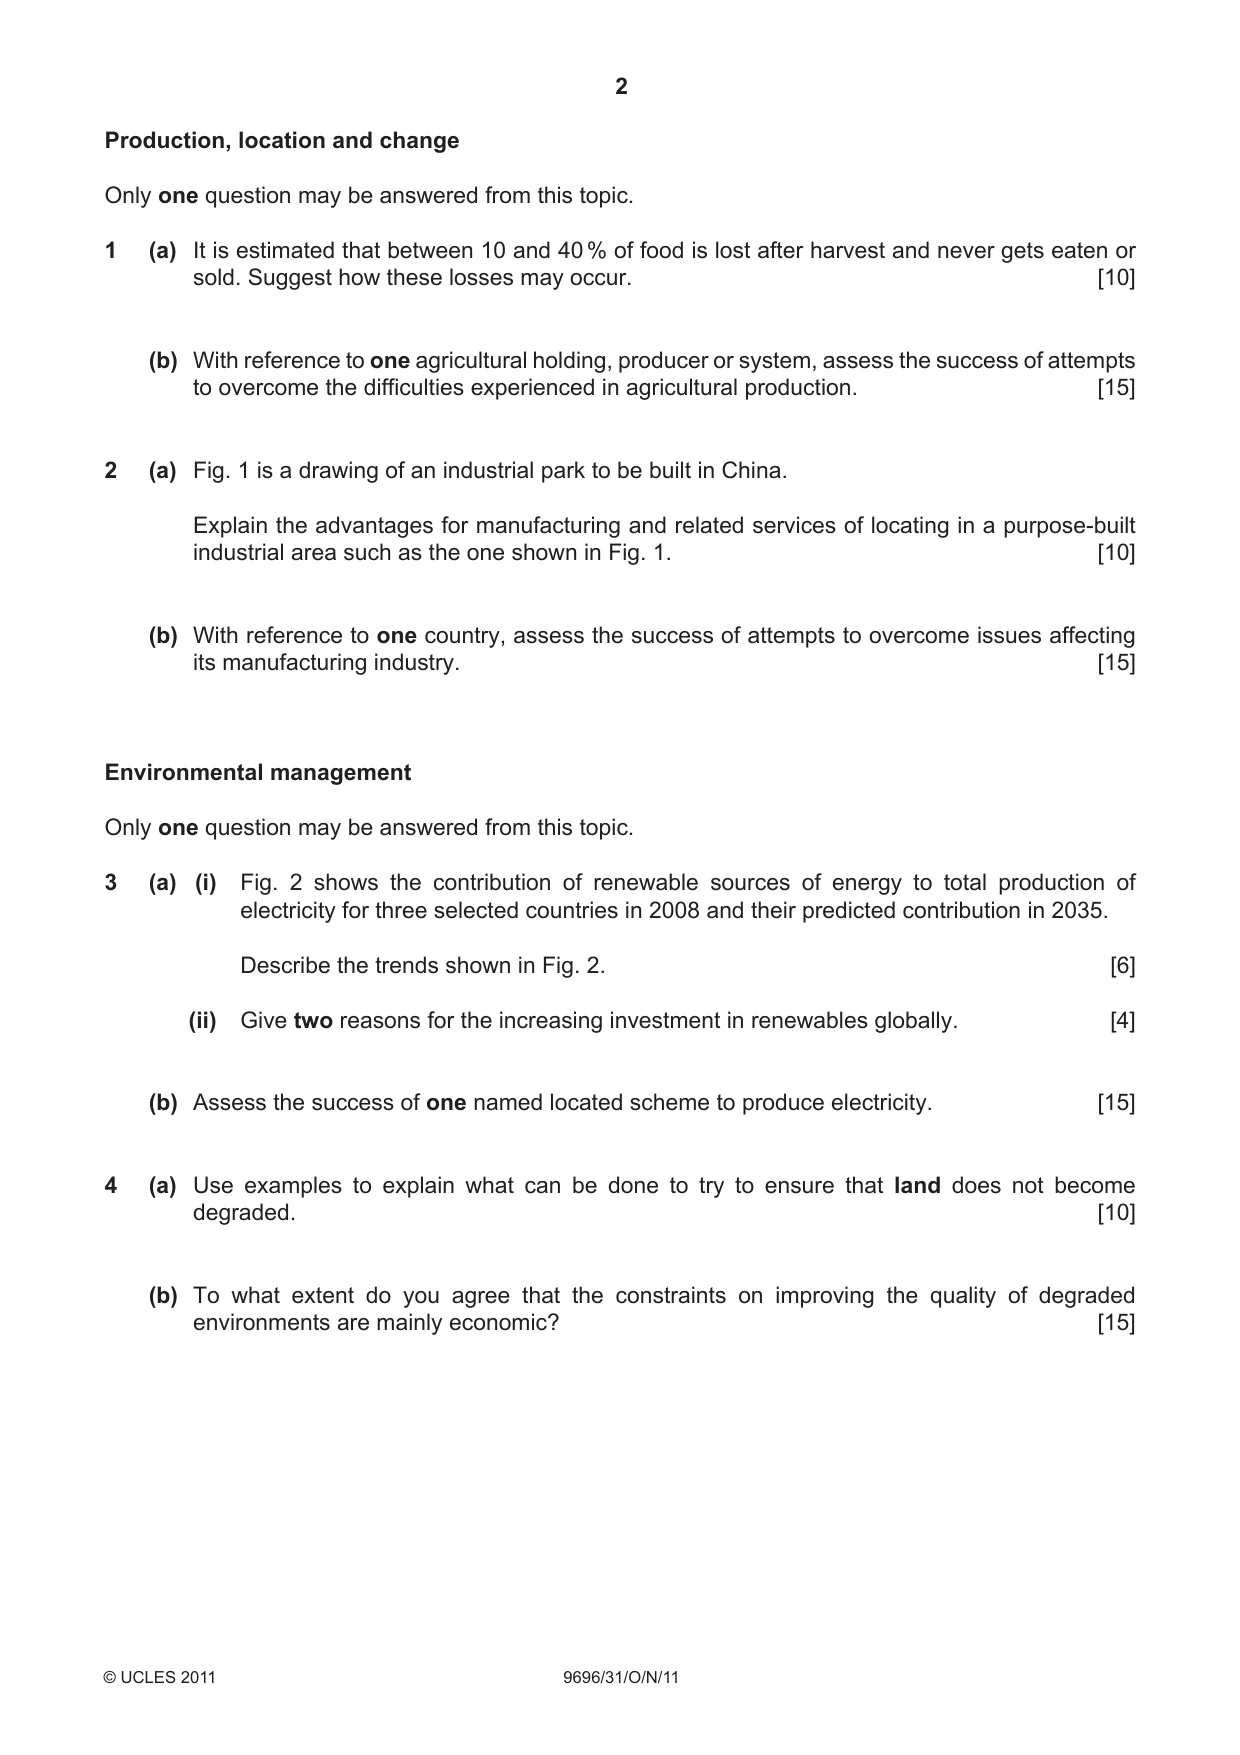
2 9696/31/O/N/11 © UCLES 2011 Production, location and change Only one question may be answered from this topic. 1 (a) It is estimated that between 10 and 40 % of food is lost after harvest and never gets eaten or sold. Suggest how these losses may occur. [10] (b) With reference to one agricultural holding, producer or system, assess the success of attempts to overcome the difficulties experienced in agricultural production. [15] 2 (a) Fig. 1 is a drawing of an industrial park to be built in China. Explain the advantages for manufacturing and related services of locating in a purpose-built industrial area such as the one shown in Fig. 1. [10] (b) With reference to one country, assess the success of attempts to overcome issues affecting its manufacturing industry. [15] Environmental management Only one question may be answered from this topic. 3 (a) (i) Fig. 2 shows the contribution of renewable sources of energy to total production of electricity for three selected countries in 2008 and their predicted contribution in 2035. Describe the trends shown in Fig. 2. [6] (ii) Give two reasons for the increasing investment in renewables globally. [4] (b) Assess the success of one named located scheme to produce electricity. [15] 4 (a) Use examples to explain what can be done to try to ensure that land does not become degraded. [10] (b) To what extent do you agree that the constraints on improving the quality of degraded environments are mainly economic? [15]
Question paper, page 3
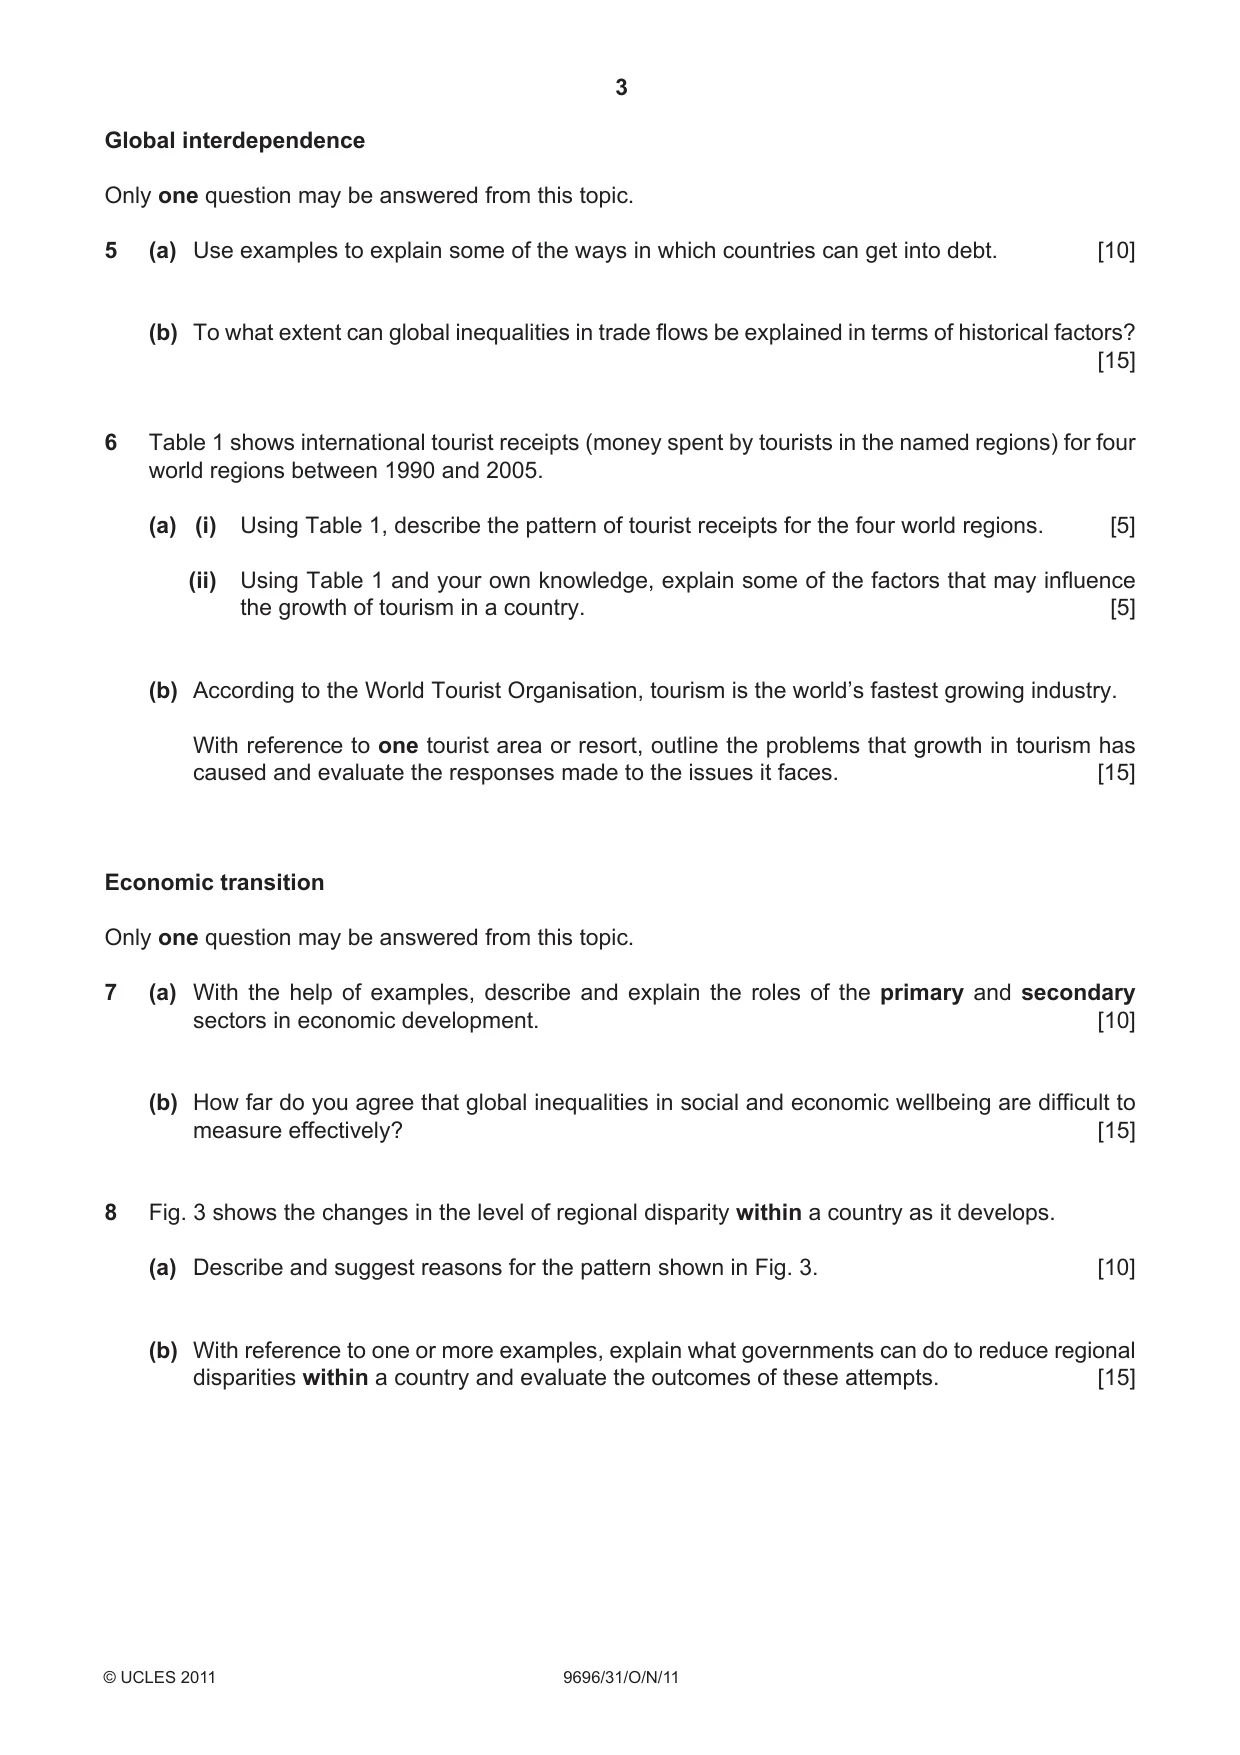
3 9696/31/O/N/11 © UCLES 2011 [Turn over Global interdependence Only one question may be answered from this topic. 5 (a) Use examples to explain some of the ways in which countries can get into debt. [10] (b) To what extent can global inequalities in trade flows be explained in terms of historical factors? [15] 6 Table 1 shows international tourist receipts (money spent by tourists in the named regions) for four world regions between 1990 and 2005. (a) (i) Using Table 1, describe the pattern of tourist receipts for the four world regions. [5] (ii) Using Table 1 and your own knowledge, explain some of the factors that may influence the growth of tourism in a country. [5] (b) According to the World Tourist Organisation, tourism is the world’s fastest growing industry. With reference to one tourist area or resort, outline the problems that growth in tourism has caused and evaluate the responses made to the issues it faces. [15] Economic transition Only one question may be answered from this topic. 7 (a) With the help of examples, describe and explain the roles of the primary and secondary sectors in economic development. [10] (b) How far do you agree that global inequalities in social and economic wellbeing are difficult to measure effectively? [15] 8 Fig. 3 shows the changes in the level of regional disparity within a country as it develops. (a) Describe and suggest reasons for the pattern shown in Fig. 3. [10] (b) With reference to one or more examples, explain what governments can do to reduce regional disparities within a country and evaluate the outcomes of these attempts. [15]
Question paper, page 4
4 Permission to reproduce items where third-party owned material protected by copyright is included has been sought and cleared where possible. Every reasonable effort has been made by the publisher (UCLES) to trace copyright holders, but if any items requiring clearance have unwittingly been included, the publisher will be pleased to make amends at the earliest possible opportunity. University of Cambridge International Examinations is part of the Cambridge Assessment Group. Cambridge Assessment is the brand name of University of Cambridge Local Examinations Syndicate (UCLES), which is itself a department of the University of Cambridge. 9696/31/O/N/11 © UCLES 2011 BLANK PAGE
Mark scheme, page 1
UNIVERSITY OF CAMBRIDGE INTERNATIONAL EXAMINATIONS GCE Advanced Subsidiary Level and GCE Advanced Level MARK SCHEME for the October/November 2011 question paper for the guidance of teachers 9696 GEOGRAPHY 9696/31 Paper 3 (Advanced Human Options), maximum raw mark 50 This mark scheme is published as an aid to teachers and candidates, to indicate the requirements of the examination. It shows the basis on which Examiners were instructed to award marks. It does not indicate the details of the discussions that took place at an Examiners’ meeting before marking began, which would have considered the acceptability of alternative answers. Mark schemes must be read in conjunction with the question papers and the report on the examination. • Cambridge will not enter into discussions or correspondence in connection with these mark schemes. Cambridge is publishing the mark schemes for the October/November 2011 question papers for most IGCSE, GCE Advanced Level and Advanced Subsidiary Level syllabuses and some Ordinary Level syllabuses.
Mark scheme, page 2
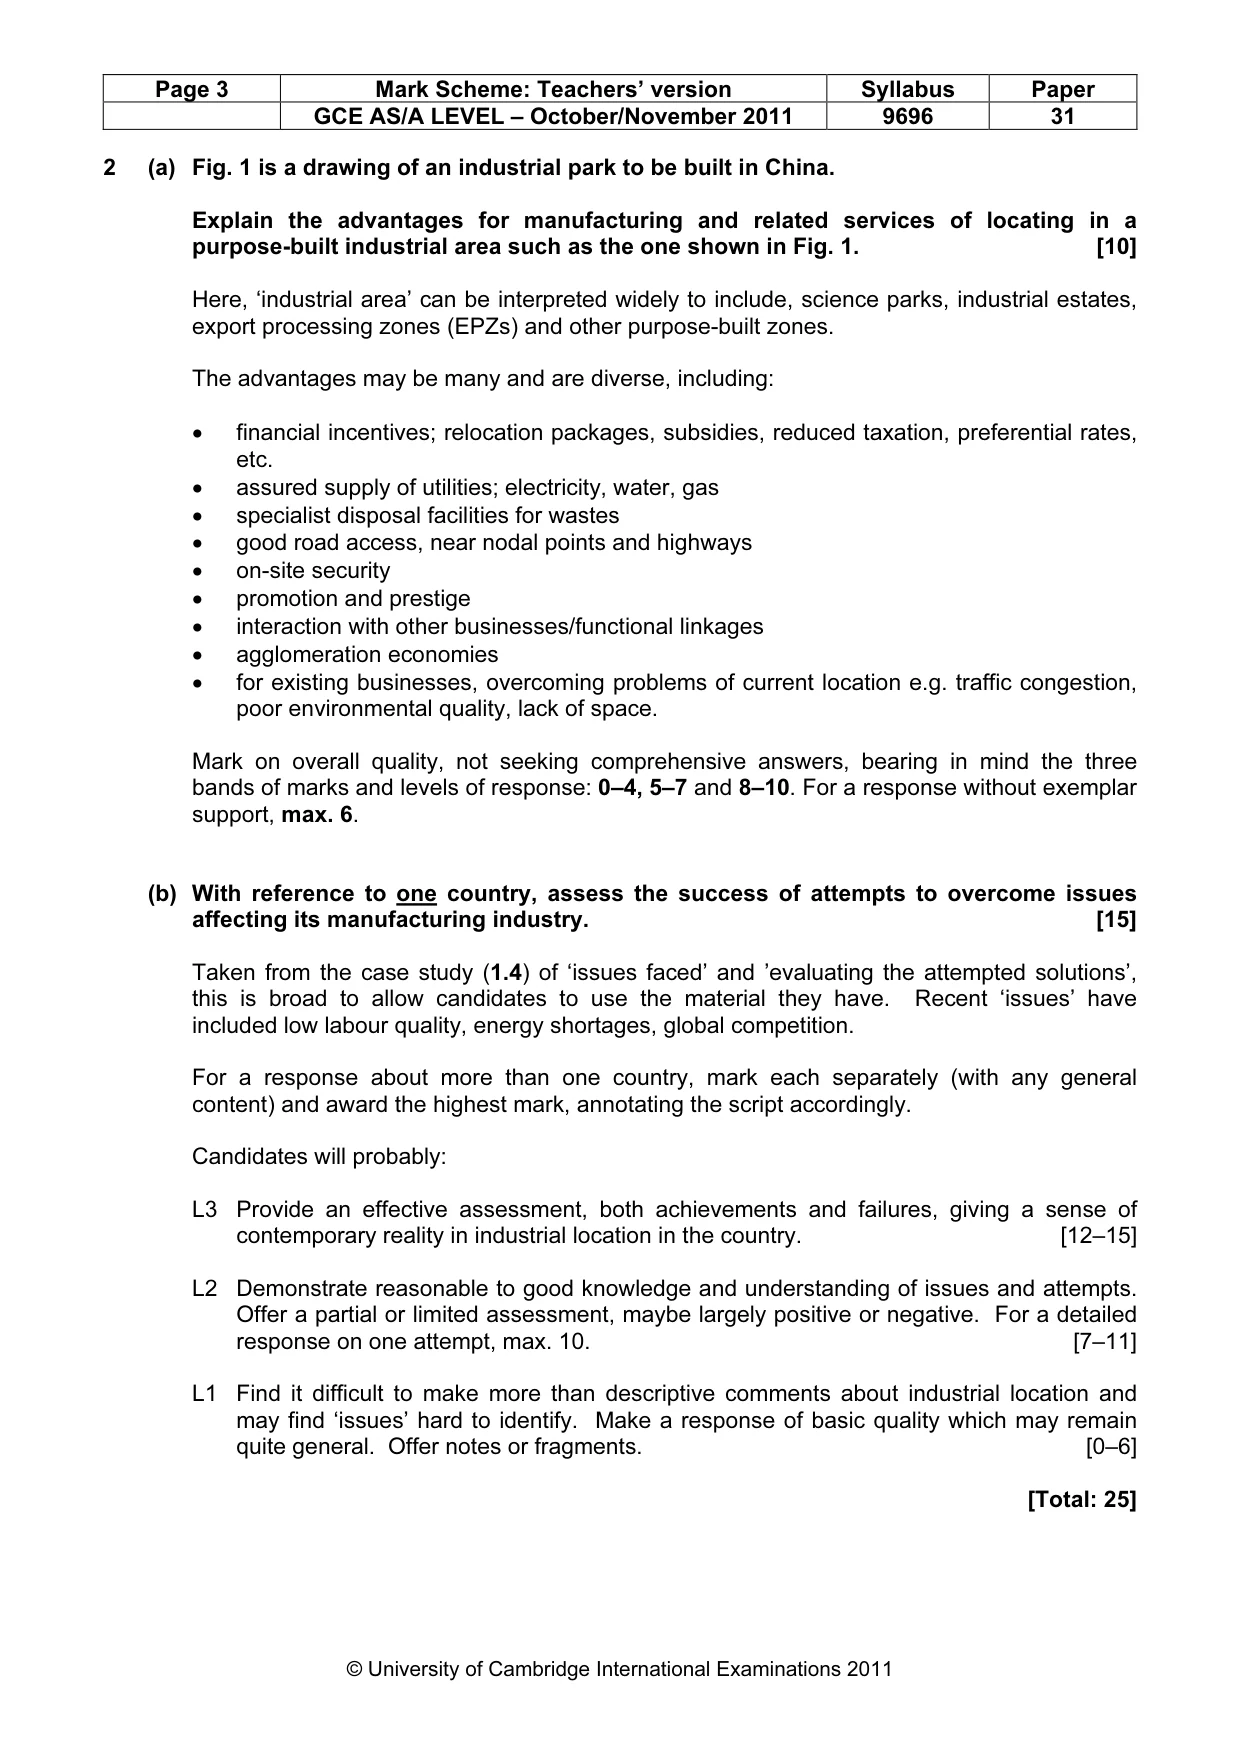
Page 2 Mark Scheme: Teachers’ version Syllabus Paper GCE AS/A LEVEL – October/November 2011 9696 31 © University of Cambridge International Examinations 2011 Production, location and change 1 (a) It is estimated that between 10 and 40% of food is lost after harvest and never gets eaten or sold. Suggest how these losses may occur. [10] Post-harvest losses are attributable to a variety of reasons including: • rodents and insects that get into sacks, stores, etc. • deterioration, e.g. rotting, mildew, fungus • inefficient removal of crops from fields • intervening circumstances: personal, e.g. illness; local, e.g. political instability • severe weather events • transport problems • storage and distribution problems • handling problems, e.g. spillage of grain, errors • theft Mark on overall quality, not seeking comprehensive answers and rewarding understanding of the realities of agricultural production. Bear in mind the three bands of marks and levels of response: 0–4, 5–7 and 8–10. For a response without exemplar support, max. 6. (b) With reference to one agricultural holding, producer or system, assess the success of attempts to overcome the difficulties experienced in agricultural production. [15] A question focussed on one case study or example to promote detailed treatment. If more than one example is taken, mark each separately and award the higher or highest mark. Accept any difficulties and any attempts, looking for reality, detail (data, names, locations, etc.) and skills in assessment in terms of success/failure, total/partial, consequences, expected/unexpected outcomes, etc. Reward well responses which observe outcomes that vary spatially or between groups of people. Candidates will probably: L3 Provide an effective assessment of success, giving a sense of the realities of agricultural production and detailing both difficulties and attempts. Differentiate outcomes over space, in time or between groups of people. [12–15] L2 Demonstrate reasonable to good knowledge and understanding of difficulties and attempts, but offer a partial or limited assessment. For a detailed response on one attempt, max. 10. [7–11] L1 Struggle to make more than descriptive comments about agricultural production or superficial observations about attempts’ success/failure. Make a basic response which may remain quite general. Offer notes or fragments. [0–6] [Total: 25]
Mark scheme, page 3
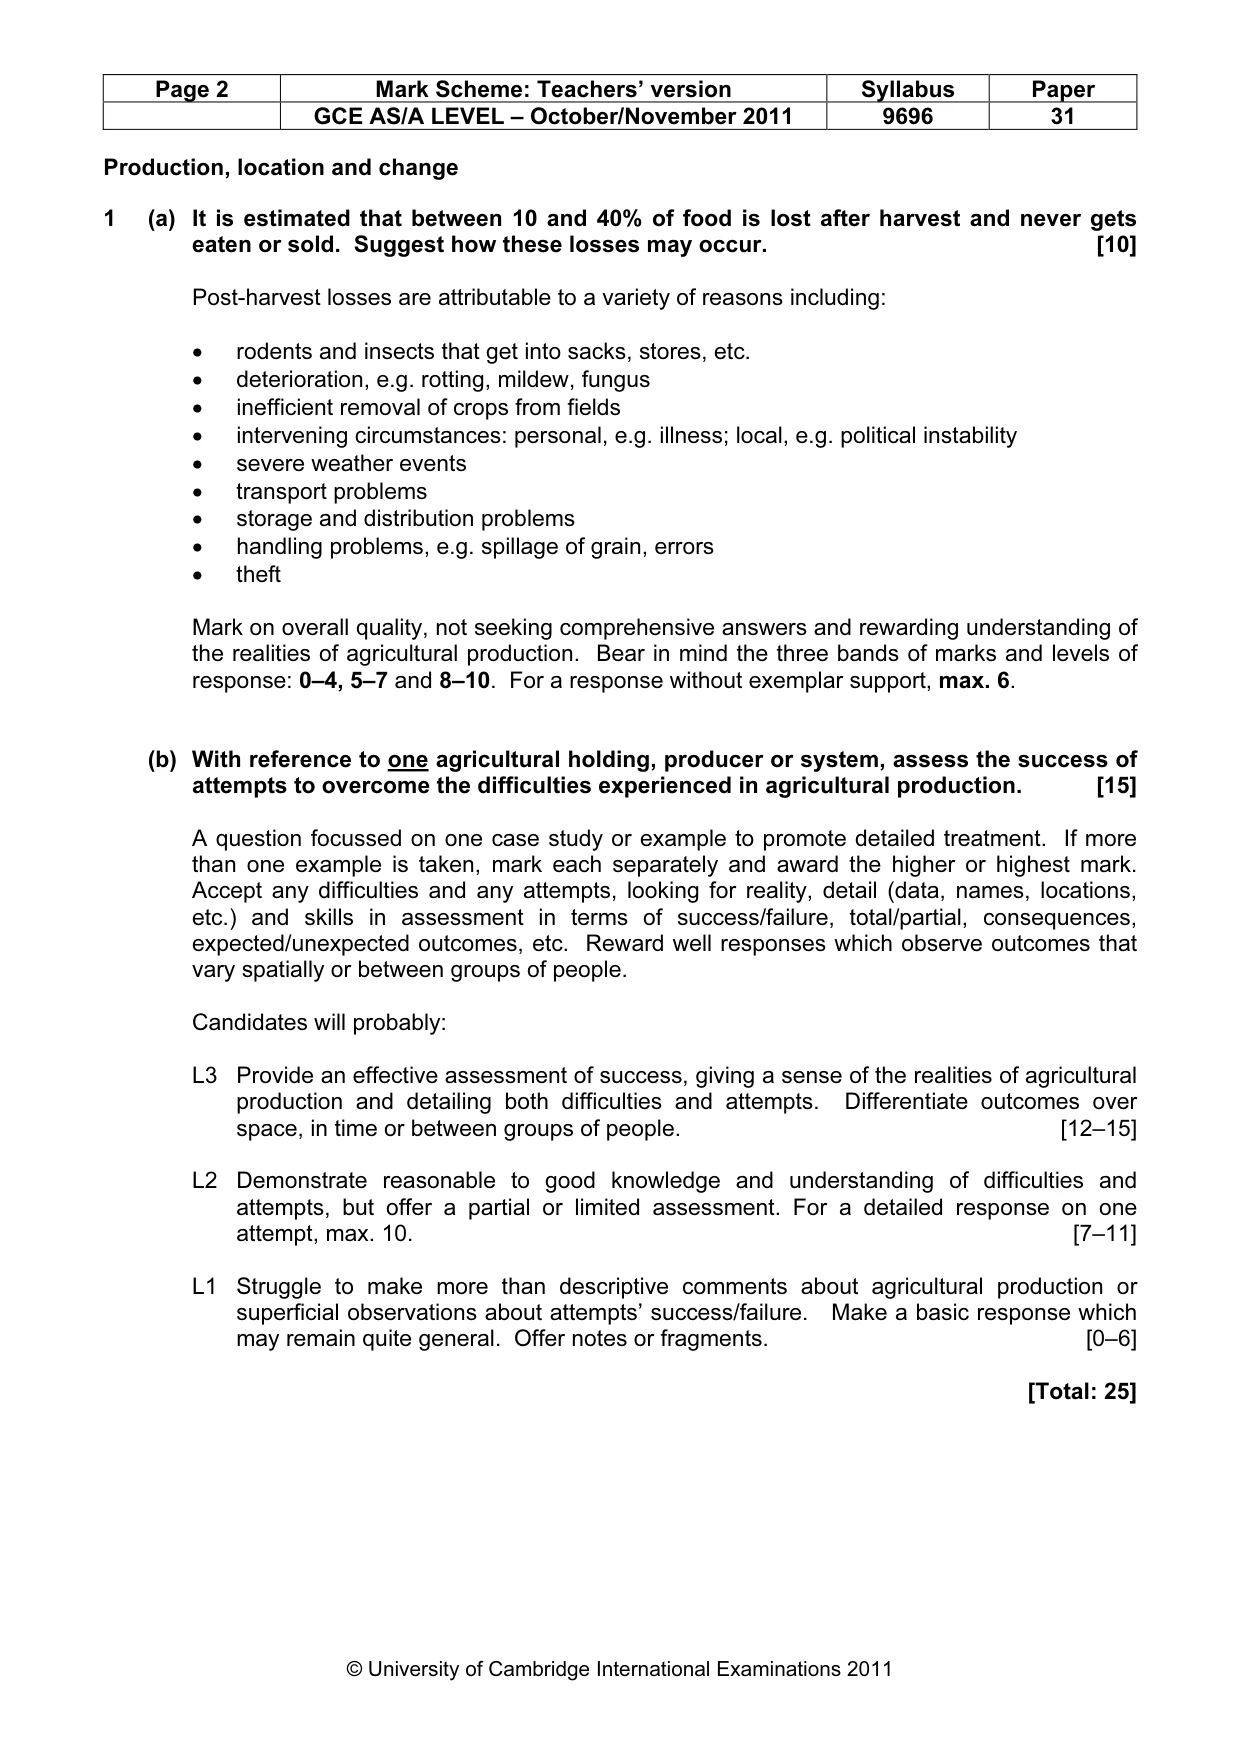
Page 3 Mark Scheme: Teachers’ version Syllabus Paper GCE AS/A LEVEL – October/November 2011 9696 31 © University of Cambridge International Examinations 2011 2 (a) Fig. 1 is a drawing of an industrial park to be built in China. Explain the advantages for manufacturing and related services of locating in a purpose-built industrial area such as the one shown in Fig. 1. [10] Here, ‘industrial area’ can be interpreted widely to include, science parks, industrial estates, export processing zones (EPZs) and other purpose-built zones. The advantages may be many and are diverse, including: • financial incentives; relocation packages, subsidies, reduced taxation, preferential rates, etc. • assured supply of utilities; electricity, water, gas • specialist disposal facilities for wastes • good road access, near nodal points and highways • on-site security • promotion and prestige • interaction with other businesses/functional linkages • agglomeration economies • for existing businesses, overcoming problems of current location e.g. traffic congestion, poor environmental quality, lack of space. Mark on overall quality, not seeking comprehensive answers, bearing in mind the three bands of marks and levels of response: 0–4, 5–7 and 8–10. For a response without exemplar support, max. 6. (b) With reference to one country, assess the success of attempts to overcome issues affecting its manufacturing industry. [15] Taken from the case study (1.4) of ‘issues faced’ and ’evaluating the attempted solutions’, this is broad to allow candidates to use the material they have. Recent ‘issues’ have included low labour quality, energy shortages, global competition. For a response about more than one country, mark each separately (with any general content) and award the highest mark, annotating the script accordingly. Candidates will probably: L3 Provide an effective assessment, both achievements and failures, giving a sense of contemporary reality in industrial location in the country. [12–15] L2 Demonstrate reasonable to good knowledge and understanding of issues and attempts. Offer a partial or limited assessment, maybe largely positive or negative. For a detailed response on one attempt, max. 10. [7–11] L1 Find it difficult to make more than descriptive comments about industrial location and may find ‘issues’ hard to identify. Make a response of basic quality which may remain quite general. Offer notes or fragments. [0–6] [Total: 25]
Mark scheme, page 4
Page 4 Mark Scheme: Teachers’ version Syllabus Paper GCE AS/A LEVEL – October/November 2011 9696 31 © University of Cambridge International Examinations 2011 Environmental management 3 (a) (i) Fig. 2 shows the contribution of renewable sources of energy to total production of electricity for three selected countries in 2008 and their predicted contribution in 2035. Describe the trends shown in Fig. 2. [6] The data is relative and so actual total energy production is not known. • Overall trend (2): % decreases in Brazil, but increases for Canada and USA. Some detail, e.g. USA large increase, approx. 10% to 25% • The mix changes (4): dominant hydro share, stable (USA) or falling; others added/growing. Some detail of key changes, e.g. notable increase in wind %, addition of solar to all three countries, etc. As trends requires some comparison, for separate descriptions of the three countries (max. 3). (ii) Give two reasons for the increasing investment in renewables globally. [4] The classic reasons are in response to concerns about two things: − the depletion of non-renewable sources, such as oil, and the associated issues of rising prices and over-dependency − the environmental impacts of burning fossil fuels Candidates may express these positively, such as ‘choice of cleaner greener fuel sources’ or may offer other reasons, such as the outworking of the Kyoto Protocol to meet emissions targets, the powerful environmental lobby, etc. Credit each reason 2 to the maximum. (b) Assess the success of one named located scheme to produce electricity. [15] The success may be judged in a number of ways or dimensions: – environmental what impacts does it have? resource use? – economic cost-effective? stimulating growth? meeting demand? – social how has it affected standard of living? local people? – political does it achieve its objectives? bring prestige? attract criticism and protests? It is particularly creditable to consider the views of different groups of people and to identify conflicts of interest, e.g. for an HEP scheme between local residents, government, landowners, consumers, fishermen, etc. (AO 4.3). Candidates will probably: L3 Structure their whole response as an assessment, combining detailed knowledge of the scheme, with high quality conceptual understanding. Recognise the perspectives of two or more groups of people. [12–15] L2 Provide a response of sound quality which may be good in parts or as far as it goes. Give a satisfactory, but limited, assessment which may not be well-integrated with the rest of the answer. For a national strategy (scale problem), max. 8. [7–11]
Mark scheme, page 5
Page 5 Mark Scheme: Teachers’ version Syllabus Paper GCE AS/A LEVEL – October/November 2011 9696 31 © University of Cambridge International Examinations 2011 L1 Struggle to deal with the topic through lack of knowledge of a suitable example. Make one or more basic points about power production. Take a descriptive approach, offering little or no effective assessment. Notes and fragments remain in this level. [0–6] [Total: 25]
Mark scheme, page 6
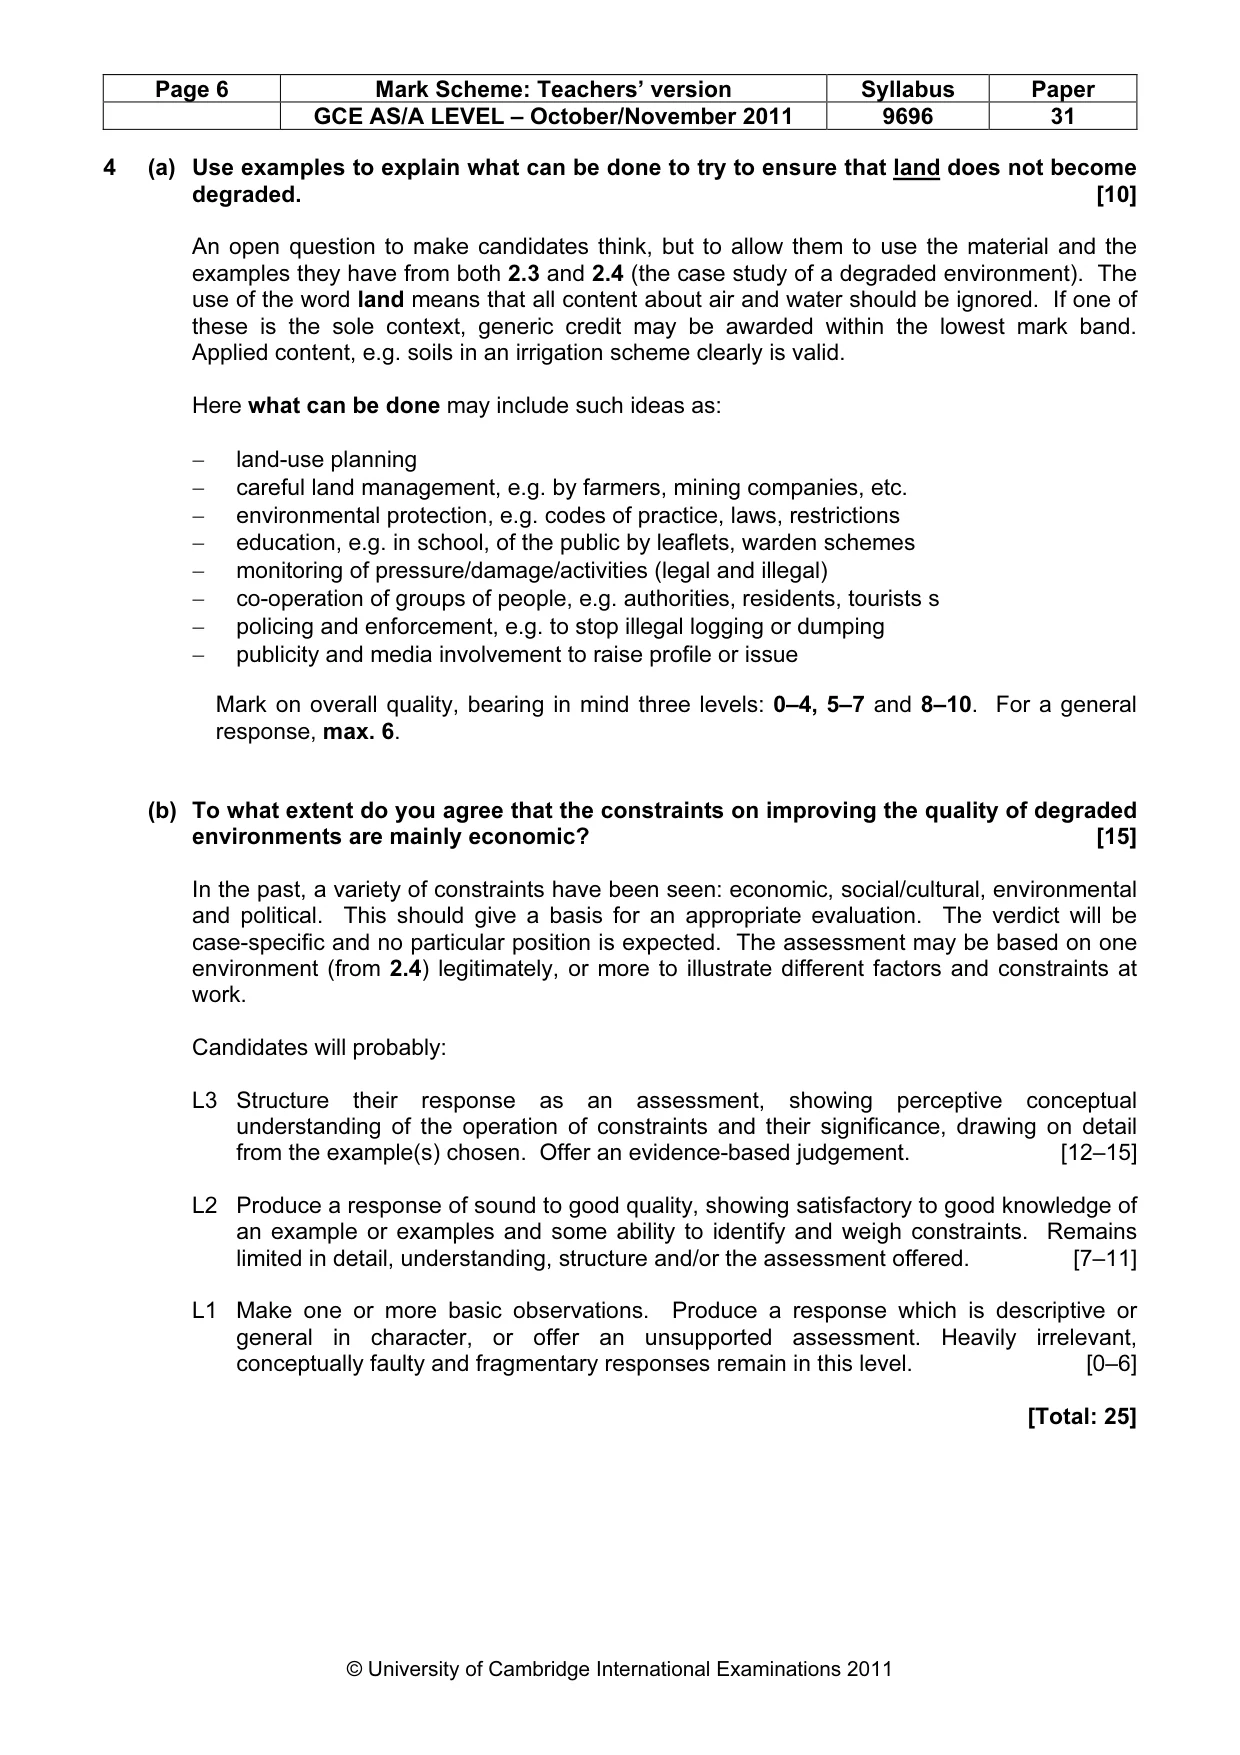
Page 6 Mark Scheme: Teachers’ version Syllabus Paper GCE AS/A LEVEL – October/November 2011 9696 31 © University of Cambridge International Examinations 2011 4 (a) Use examples to explain what can be done to try to ensure that land does not become degraded. [10] An open question to make candidates think, but to allow them to use the material and the examples they have from both 2.3 and 2.4 (the case study of a degraded environment). The use of the word land means that all content about air and water should be ignored. If one of these is the sole context, generic credit may be awarded within the lowest mark band. Applied content, e.g. soils in an irrigation scheme clearly is valid. Here what can be done may include such ideas as: − land-use planning − careful land management, e.g. by farmers, mining companies, etc. − environmental protection, e.g. codes of practice, laws, restrictions − education, e.g. in school, of the public by leaflets, warden schemes − monitoring of pressure/damage/activities (legal and illegal) − co-operation of groups of people, e.g. authorities, residents, tourists s − policing and enforcement, e.g. to stop illegal logging or dumping − publicity and media involvement to raise profile or issue Mark on overall quality, bearing in mind three levels: 0–4, 5–7 and 8–10. For a general response, max. 6. (b) To what extent do you agree that the constraints on improving the quality of degraded environments are mainly economic? [15] In the past, a variety of constraints have been seen: economic, social/cultural, environmental and political. This should give a basis for an appropriate evaluation. The verdict will be case-specific and no particular position is expected. The assessment may be based on one environment (from 2.4) legitimately, or more to illustrate different factors and constraints at work. Candidates will probably: L3 Structure their response as an assessment, showing perceptive conceptual understanding of the operation of constraints and their significance, drawing on detail from the example(s) chosen. Offer an evidence-based judgement. [12–15] L2 Produce a response of sound to good quality, showing satisfactory to good knowledge of an example or examples and some ability to identify and weigh constraints. Remains limited in detail, understanding, structure and/or the assessment offered. [7–11] L1 Make one or more basic observations. Produce a response which is descriptive or general in character, or offer an unsupported assessment. Heavily irrelevant, conceptually faulty and fragmentary responses remain in this level. [0–6] [Total: 25]
Mark scheme, page 7
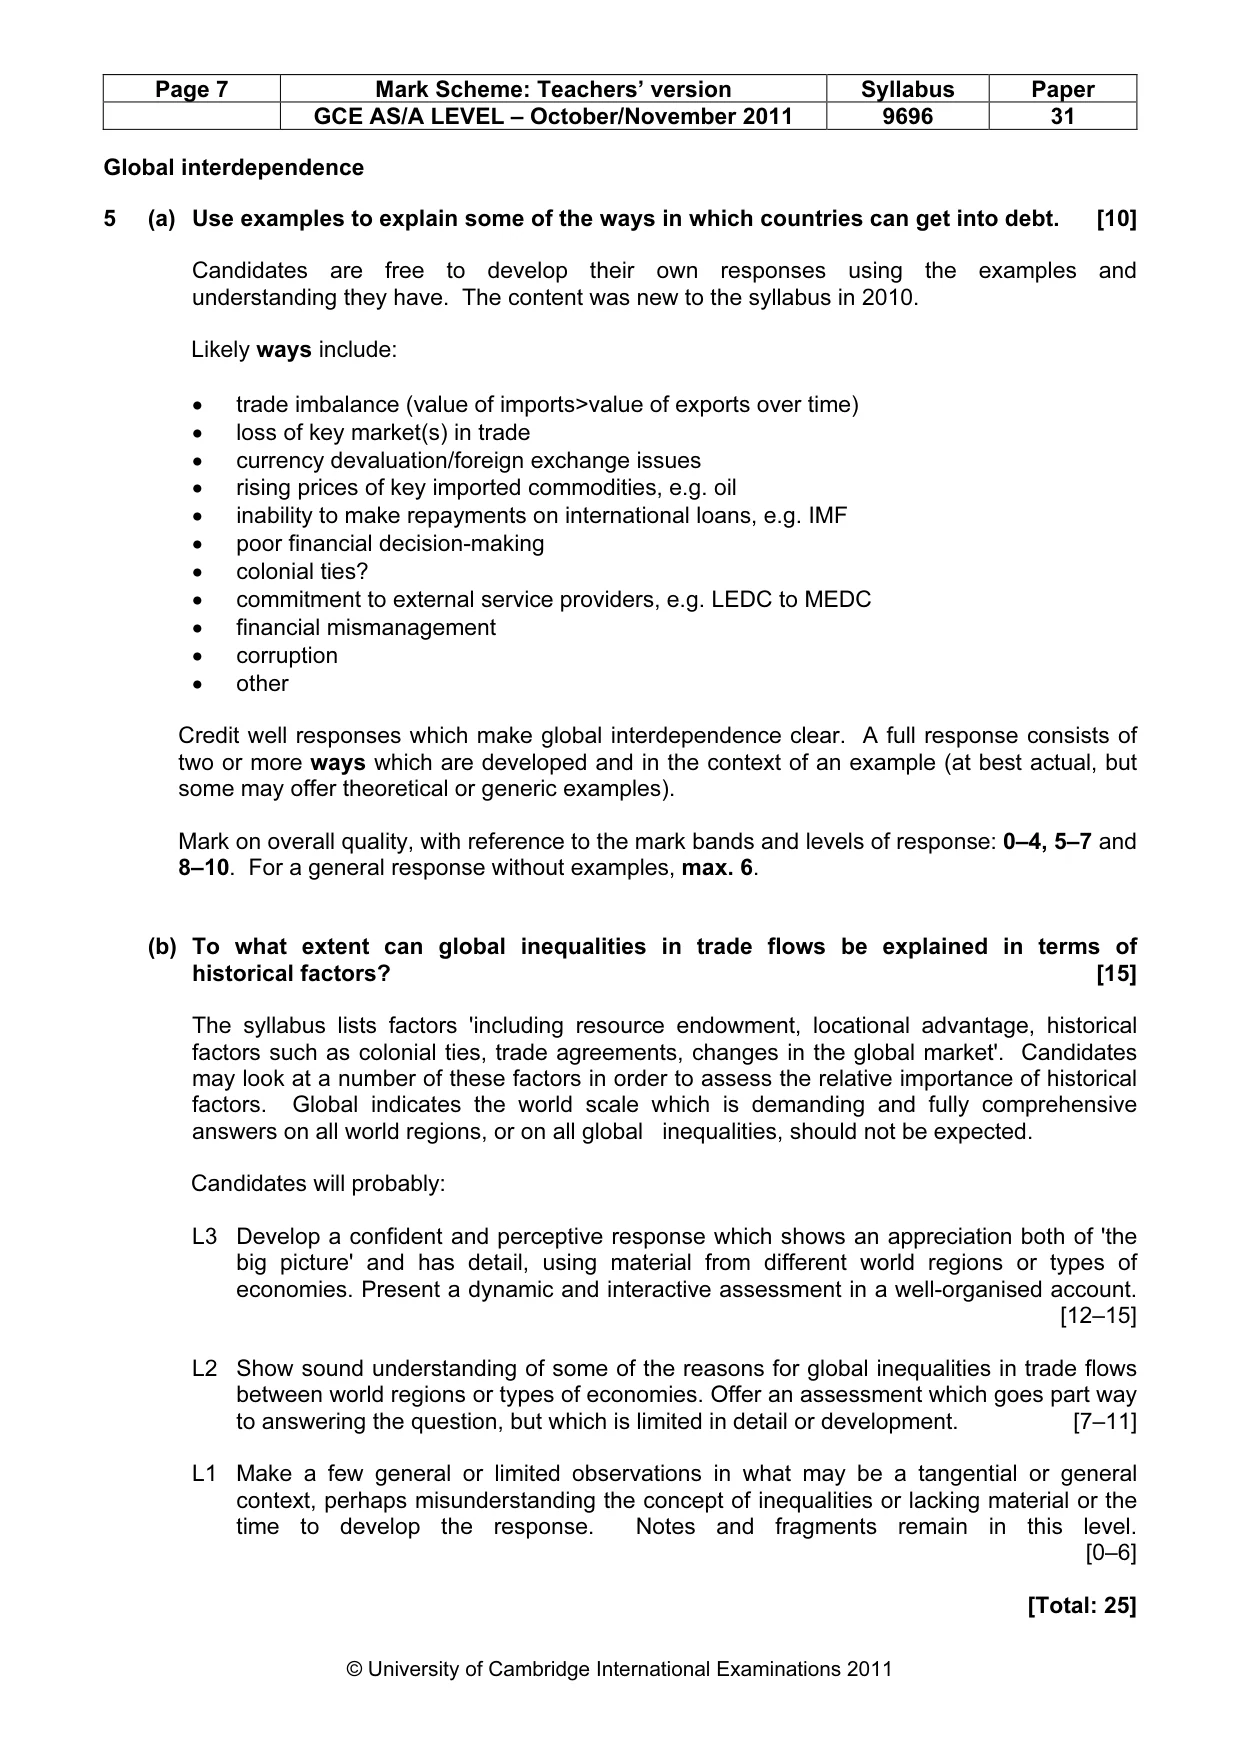
Page 7 Mark Scheme: Teachers’ version Syllabus Paper GCE AS/A LEVEL – October/November 2011 9696 31 © University of Cambridge International Examinations 2011 Global interdependence 5 (a) Use examples to explain some of the ways in which countries can get into debt. [10] Candidates are free to develop their own responses using the examples and understanding they have. The content was new to the syllabus in 2010. Likely ways include: • trade imbalance (value of imports>value of exports over time) • loss of key market(s) in trade • currency devaluation/foreign exchange issues • rising prices of key imported commodities, e.g. oil • inability to make repayments on international loans, e.g. IMF • poor financial decision-making • colonial ties? • commitment to external service providers, e.g. LEDC to MEDC • financial mismanagement • corruption • other Credit well responses which make global interdependence clear. A full response consists of two or more ways which are developed and in the context of an example (at best actual, but some may offer theoretical or generic examples). Mark on overall quality, with reference to the mark bands and levels of response: 0–4, 5–7 and 8–10. For a general response without examples, max. 6. (b) To what extent can global inequalities in trade flows be explained in terms of historical factors? [15] The syllabus lists factors 'including resource endowment, locational advantage, historical factors such as colonial ties, trade agreements, changes in the global market'. Candidates may look at a number of these factors in order to assess the relative importance of historical factors. Global indicates the world scale which is demanding and fully comprehensive answers on all world regions, or on all global inequalities, should not be expected. Candidates will probably: L3 Develop a confident and perceptive response which shows an appreciation both of 'the big picture' and has detail, using material from different world regions or types of economies. Present a dynamic and interactive assessment in a well-organised account. [12–15] L2 Show sound understanding of some of the reasons for global inequalities in trade flows between world regions or types of economies. Offer an assessment which goes part way to answering the question, but which is limited in detail or development. [7–11] L1 Make a few general or limited observations in what may be a tangential or general context, perhaps misunderstanding the concept of inequalities or lacking material or the time to develop the response. Notes and fragments remain in this level. [0–6] [Total: 25]
Mark scheme, page 8
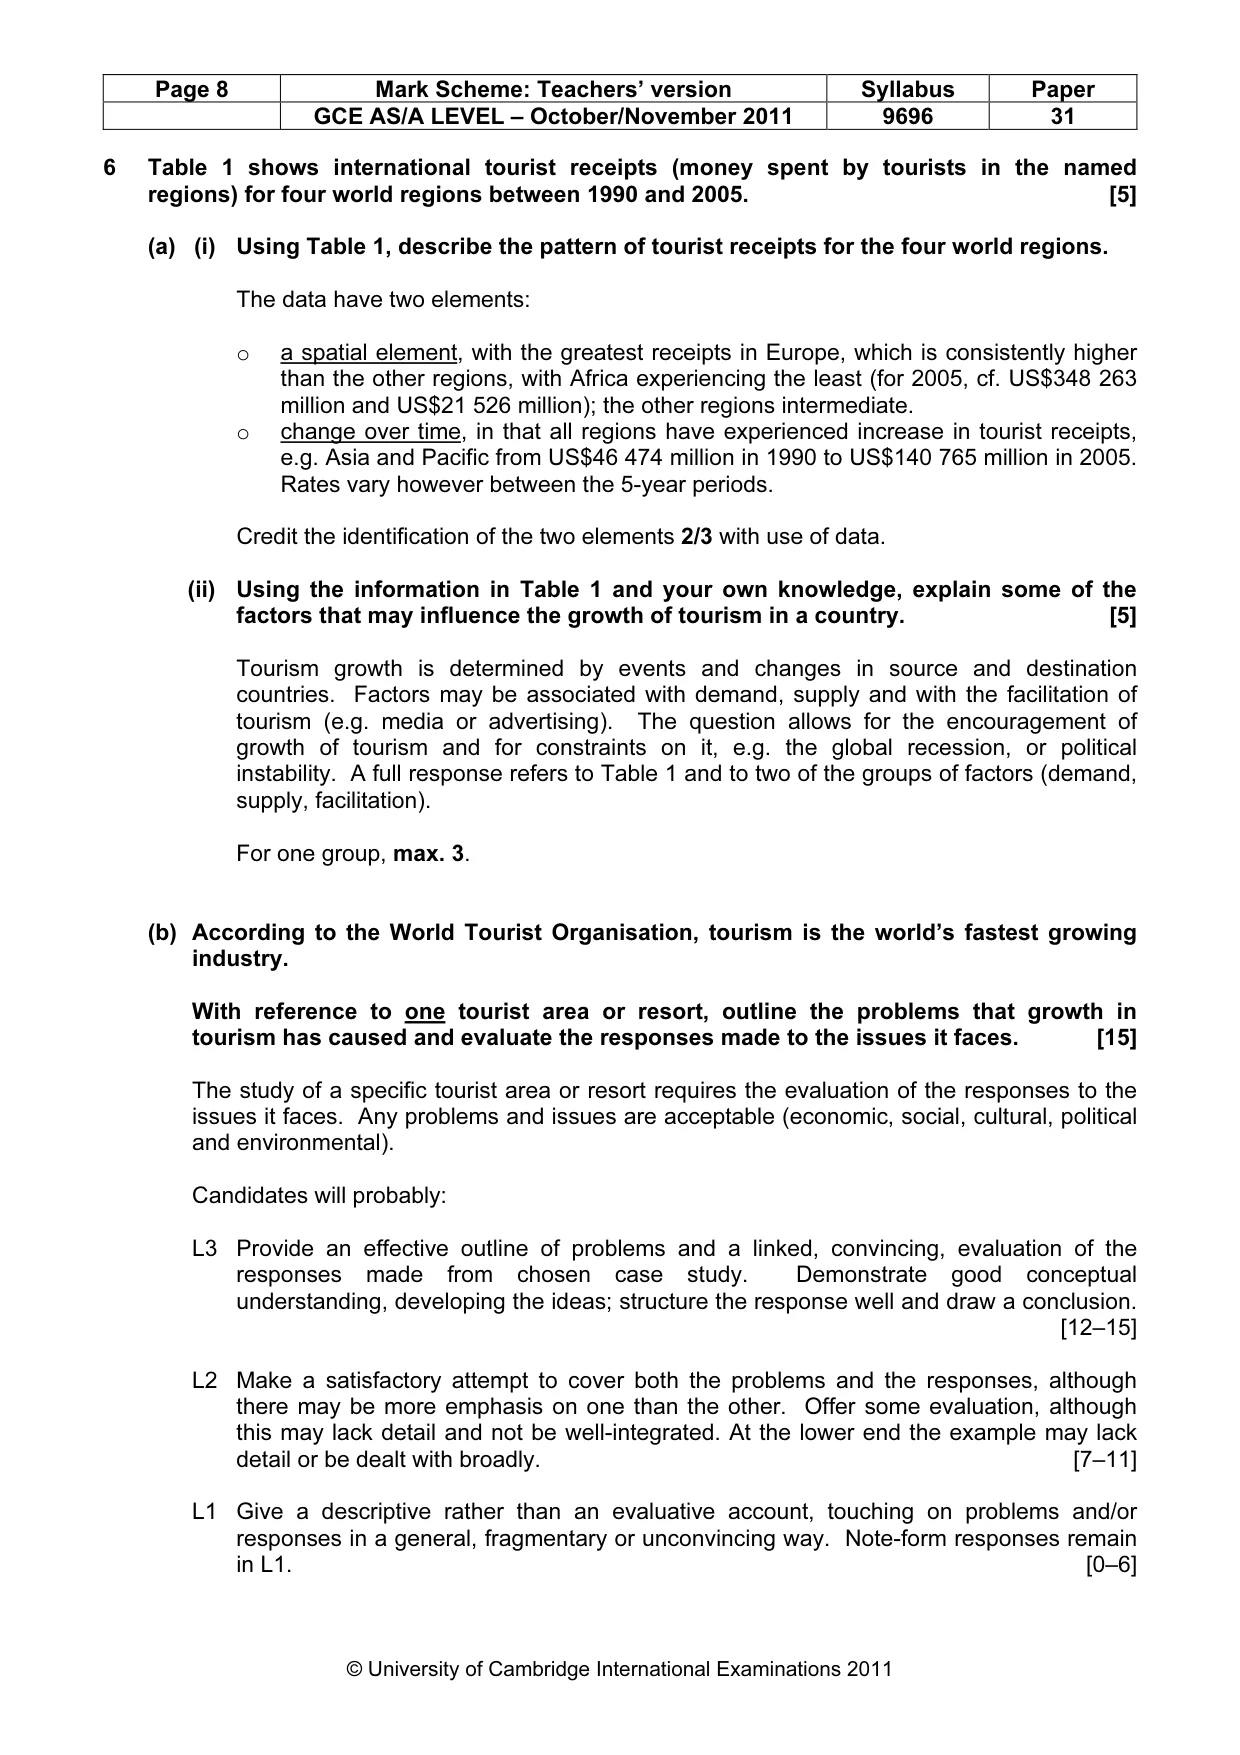
Page 8 Mark Scheme: Teachers’ version Syllabus Paper GCE AS/A LEVEL – October/November 2011 9696 31 © University of Cambridge International Examinations 2011 6 Table 1 shows international tourist receipts (money spent by tourists in the named regions) for four world regions between 1990 and 2005. [5] (a) (i) Using Table 1, describe the pattern of tourist receipts for the four world regions. The data have two elements: o a spatial element, with the greatest receipts in Europe, which is consistently higher than the other regions, with Africa experiencing the least (for 2005, cf. US$348 263 million and US$21 526 million); the other regions intermediate. o change over time, in that all regions have experienced increase in tourist receipts, e.g. Asia and Pacific from US$46 474 million in 1990 to US$140 765 million in 2005. Rates vary however between the 5-year periods. Credit the identification of the two elements 2/3 with use of data. (ii) Using the information in Table 1 and your own knowledge, explain some of the factors that may influence the growth of tourism in a country. [5] Tourism growth is determined by events and changes in source and destination countries. Factors may be associated with demand, supply and with the facilitation of tourism (e.g. media or advertising). The question allows for the encouragement of growth of tourism and for constraints on it, e.g. the global recession, or political instability. A full response refers to Table 1 and to two of the groups of factors (demand, supply, facilitation). For one group, max. 3. (b) According to the World Tourist Organisation, tourism is the world’s fastest growing industry. With reference to one tourist area or resort, outline the problems that growth in tourism has caused and evaluate the responses made to the issues it faces. [15] The study of a specific tourist area or resort requires the evaluation of the responses to the issues it faces. Any problems and issues are acceptable (economic, social, cultural, political and environmental). Candidates will probably: L3 Provide an effective outline of problems and a linked, convincing, evaluation of the responses made from chosen case study. Demonstrate good conceptual understanding, developing the ideas; structure the response well and draw a conclusion. [12–15] L2 Make a satisfactory attempt to cover both the problems and the responses, although there may be more emphasis on one than the other. Offer some evaluation, although this may lack detail and not be well-integrated. At the lower end the example may lack detail or be dealt with broadly. [7–11] L1 Give a descriptive rather than an evaluative account, touching on problems and/or responses in a general, fragmentary or unconvincing way. Note-form responses remain in L1. [0–6]
Mark scheme, page 9
Page 9 Mark Scheme: Teachers’ version Syllabus Paper GCE AS/A LEVEL – October/November 2011 9696 31 © University of Cambridge International Examinations 2011 [Total: 25]
Mark scheme, page 10
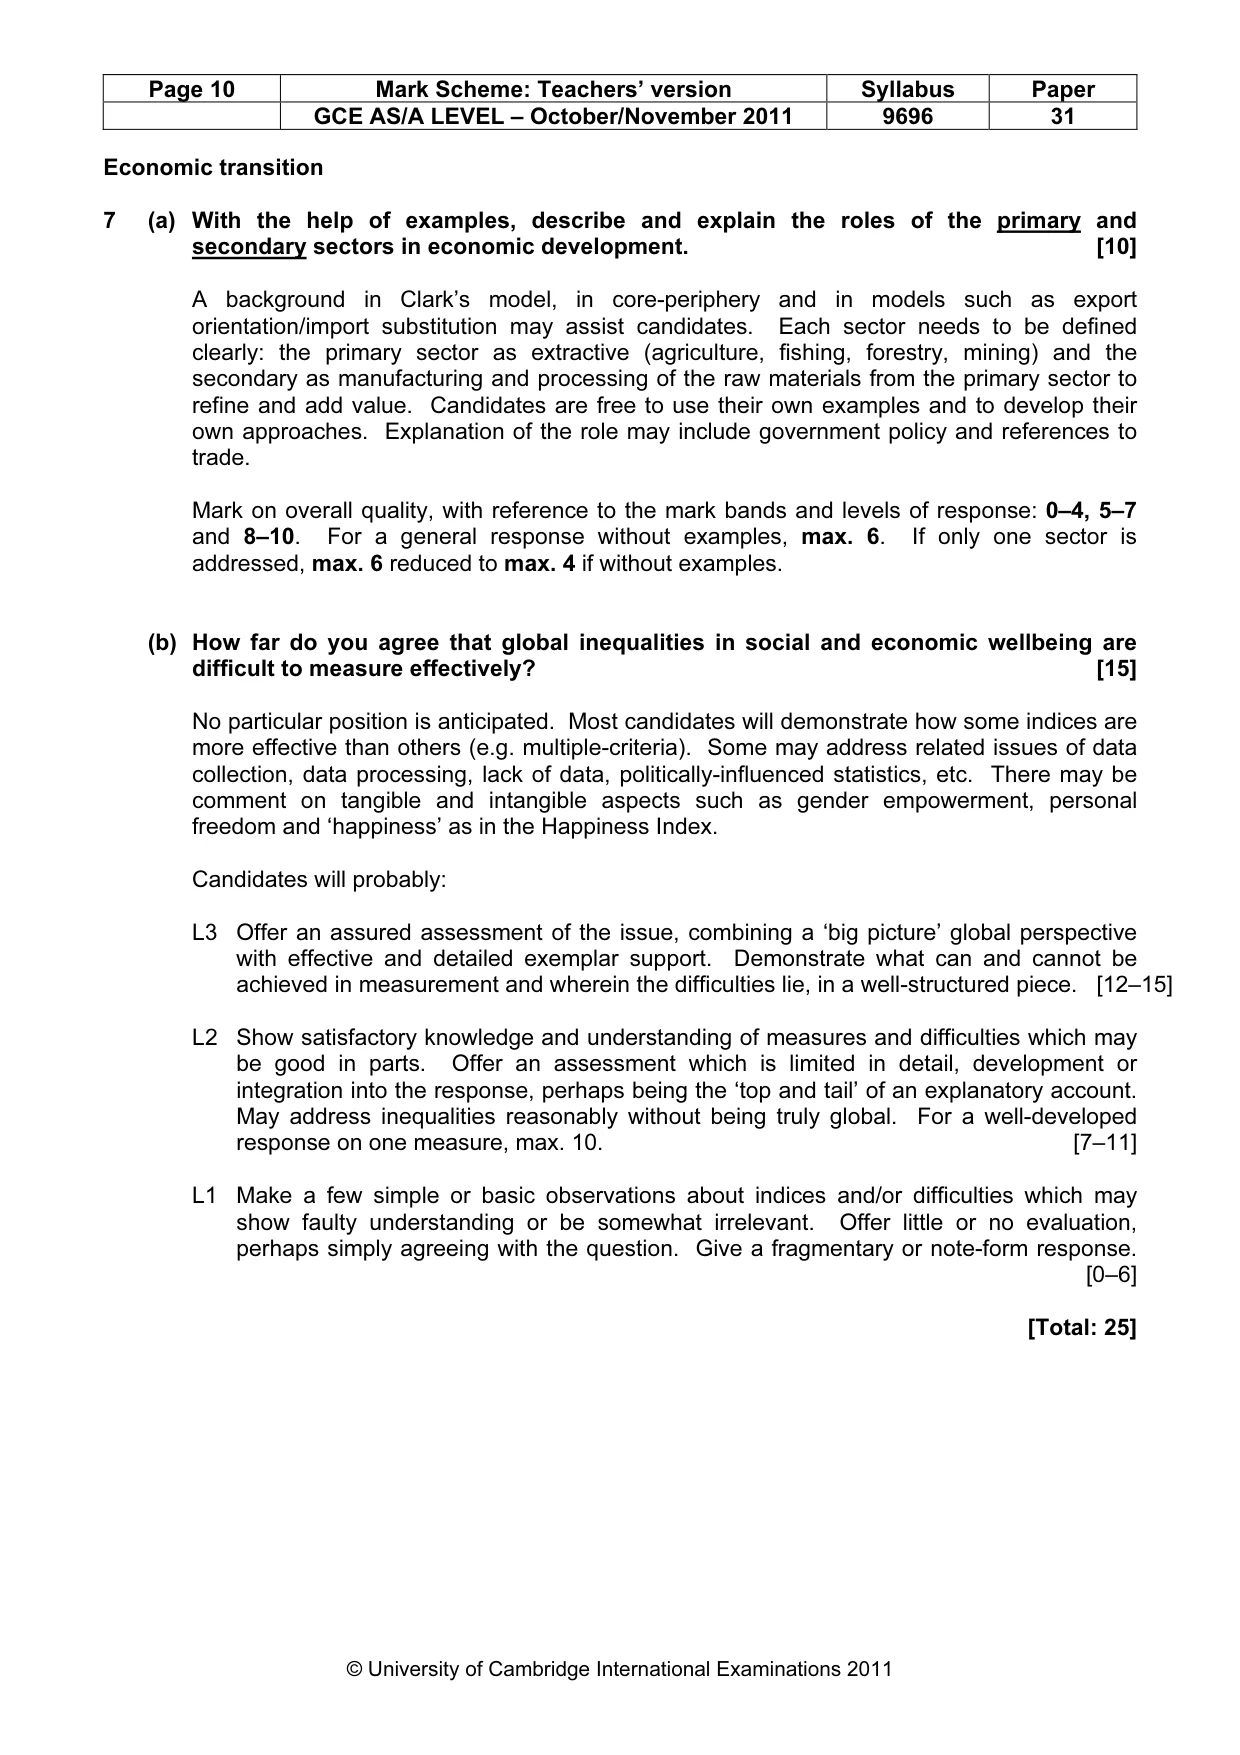
Page 10 Mark Scheme: Teachers’ version Syllabus Paper GCE AS/A LEVEL – October/November 2011 9696 31 © University of Cambridge International Examinations 2011 Economic transition 7 (a) With the help of examples, describe and explain the roles of the primary and secondary sectors in economic development. [10] A background in Clark’s model, in core-periphery and in models such as export orientation/import substitution may assist candidates. Each sector needs to be defined clearly: the primary sector as extractive (agriculture, fishing, forestry, mining) and the secondary as manufacturing and processing of the raw materials from the primary sector to refine and add value. Candidates are free to use their own examples and to develop their own approaches. Explanation of the role may include government policy and references to trade. Mark on overall quality, with reference to the mark bands and levels of response: 0–4, 5–7 and 8–10. For a general response without examples, max. 6. If only one sector is addressed, max. 6 reduced to max. 4 if without examples. (b) How far do you agree that global inequalities in social and economic wellbeing are difficult to measure effectively? [15] No particular position is anticipated. Most candidates will demonstrate how some indices are more effective than others (e.g. multiple-criteria). Some may address related issues of data collection, data processing, lack of data, politically-influenced statistics, etc. There may be comment on tangible and intangible aspects such as gender empowerment, personal freedom and ‘happiness’ as in the Happiness Index. Candidates will probably: L3 Offer an assured assessment of the issue, combining a ‘big picture’ global perspective with effective and detailed exemplar support. Demonstrate what can and cannot be achieved in measurement and wherein the difficulties lie, in a well-structured piece. [12–15] L2 Show satisfactory knowledge and understanding of measures and difficulties which may be good in parts. Offer an assessment which is limited in detail, development or integration into the response, perhaps being the ‘top and tail’ of an explanatory account. May address inequalities reasonably without being truly global. For a well-developed response on one measure, max. 10. [7–11] L1 Make a few simple or basic observations about indices and/or difficulties which may show faulty understanding or be somewhat irrelevant. Offer little or no evaluation, perhaps simply agreeing with the question. Give a fragmentary or note-form response. [0–6] [Total: 25]
Mark scheme, page 11
Page 11 Mark Scheme: Teachers’ version Syllabus Paper GCE AS/A LEVEL – October/November 2011 9696 31 © University of Cambridge International Examinations 2011 8 Fig. 3 shows the changes in the level of regional disparity within a country as it develops. (a) Describe and suggest reasons for the pattern shown in Fig. 3. [10] Fig. 3 is based on the core-periphery concept and divergence/convergence over time. Initially the country is economically undeveloped and the level of disparity is small. In the early stages of development there is a tendency, due to cumulative causation, for it to be concentrated in the core region(s) to benefit from agglomeration economies and the multiplier effect. Backwash effects, e.g. selective migration, capital flows, etc., enhance the level of disparity between core and periphery (the rising line). At the notional mid-point, disparities start to decline. As the country becomes more developed, government may have more capital (from greater tax yields) to spread development into peripheral regions. The core(s) may also suffer from overheating and diseconomies which help to encourage businesses and entrepreneurs to seek better and more cost- effective locations in peripheral regions. Some candidates may recognise that, in reality, full convergence (to the right) may not be reached due to the disadvantages that the periphery may always have (location, accessibility, resource base, environment).Also, governments must balance the need to reduce disparities with attaining continued national economic growth (and meeting other priorities?). Credit candidates who display good conceptual understanding and use geographical terminology appropriately. Mark on overall quality, with reference to the mark bands and levels of response: 0–4, 5–7 and 8–10. As a general response may perform well, the usual maximum does not apply. Responses which describe, but do not give reasons, remain in the lowest band. (b) With reference to one or more examples, explain what governments can do to reduce regional disparities within a country and evaluate the outcomes of these attempts. [15] An open question on regional disparities allowing candidates to use the example(s) they have. The only requirements are for a case context and for more than one attempt. The lower order demand is explanation, the higher one, the evaluation that follows. Government action may be indirect, e.g. improving transport infrastructure to reduce peripherality, or direct, e.g. grants/subsidies to encourage business relocation. Candidates will probably: L3 Provide an assured response, explaining government actions clearly and effectively and making a high quality evaluation of the outcomes, considering what was and what was not achieved. Use the chosen example(s) in a detailed, developed and selective way. [12–15] L2 Treat regional disparities satisfactorily, with some good elements at the upper end. Explain the actions and evaluate outcomes, but maybe not in a balanced way. Use the example(s) largely soundly, with some limitations of focus, detail, or development. For a response on one attempt, max. 10. [7–11] L1 Offer a simple or basic quality response, which may consist more of recall knowledge, or of unsupported opinion, than be an attempt to address the question set. Fragments, notes and point-form responses remain in this level. [0–6] [Total: 25]
What you needed in this session
Cambridge’s own grade thresholds for 2011 Oct/Nov, Paper 3 · Variant 1. A higher threshold means an easier paper — the bar moves with how the cohort did.