Cambridge A Level Geography 9696 — 2010 May/June Paper 3 · Variant 1
9696/31/M/J/10 · 50 marks · ≈56 min
The question paper and its mark scheme, free to read here and free to download. This is Cambridge’s own paper, exactly as it was sat.
Question paper4 pages


Mark scheme9 pages
Answers below. Sit the paper first if you are practising.




Paper as text
Question paper, page 1
READ THESE INSTRUCTIONS FIRST If you have been given an Answer Booklet, follow the instructions on the front cover of the Booklet. Write your Centre number, candidate number and name on all the work you hand in. Write in dark blue or black pen. You may use a soft pencil for any diagrams, graphs or rough working. Do not use staples, paper clips, highlighters, glue or correction fl uid. Answer two questions only. Each question answered must be from a different topic. Sketch maps and diagrams should be drawn whenever they serve to illustrate an answer. You should make reference to appropriate examples studied in the fi eld or the classroom, even where such examples are not specifi cally requested by the question. All the Figures and the Tables referred to in the questions are contained in the Insert. At the end of the examination, fasten all your work securely together. The number of marks is given in brackets [ ] at the end of each question or part question. GEOGRAPHY 9696/31 Paper 3 Advanced Human Options May/June 2010 1 hour 30 minutes Additional Materials: Answer Booklet/Paper UNIVERSITY OF CAMBRIDGE INTERNATIONAL EXAMINATIONS General Certifi cate of Education Advanced Subsidiary Level and Advanced Level This document consists of 3 printed pages, 1 blank page and 1 Insert. [Turn over IB10 06_9696_31/3RP © UCLES 2010 *0572590631*
Question paper, page 2
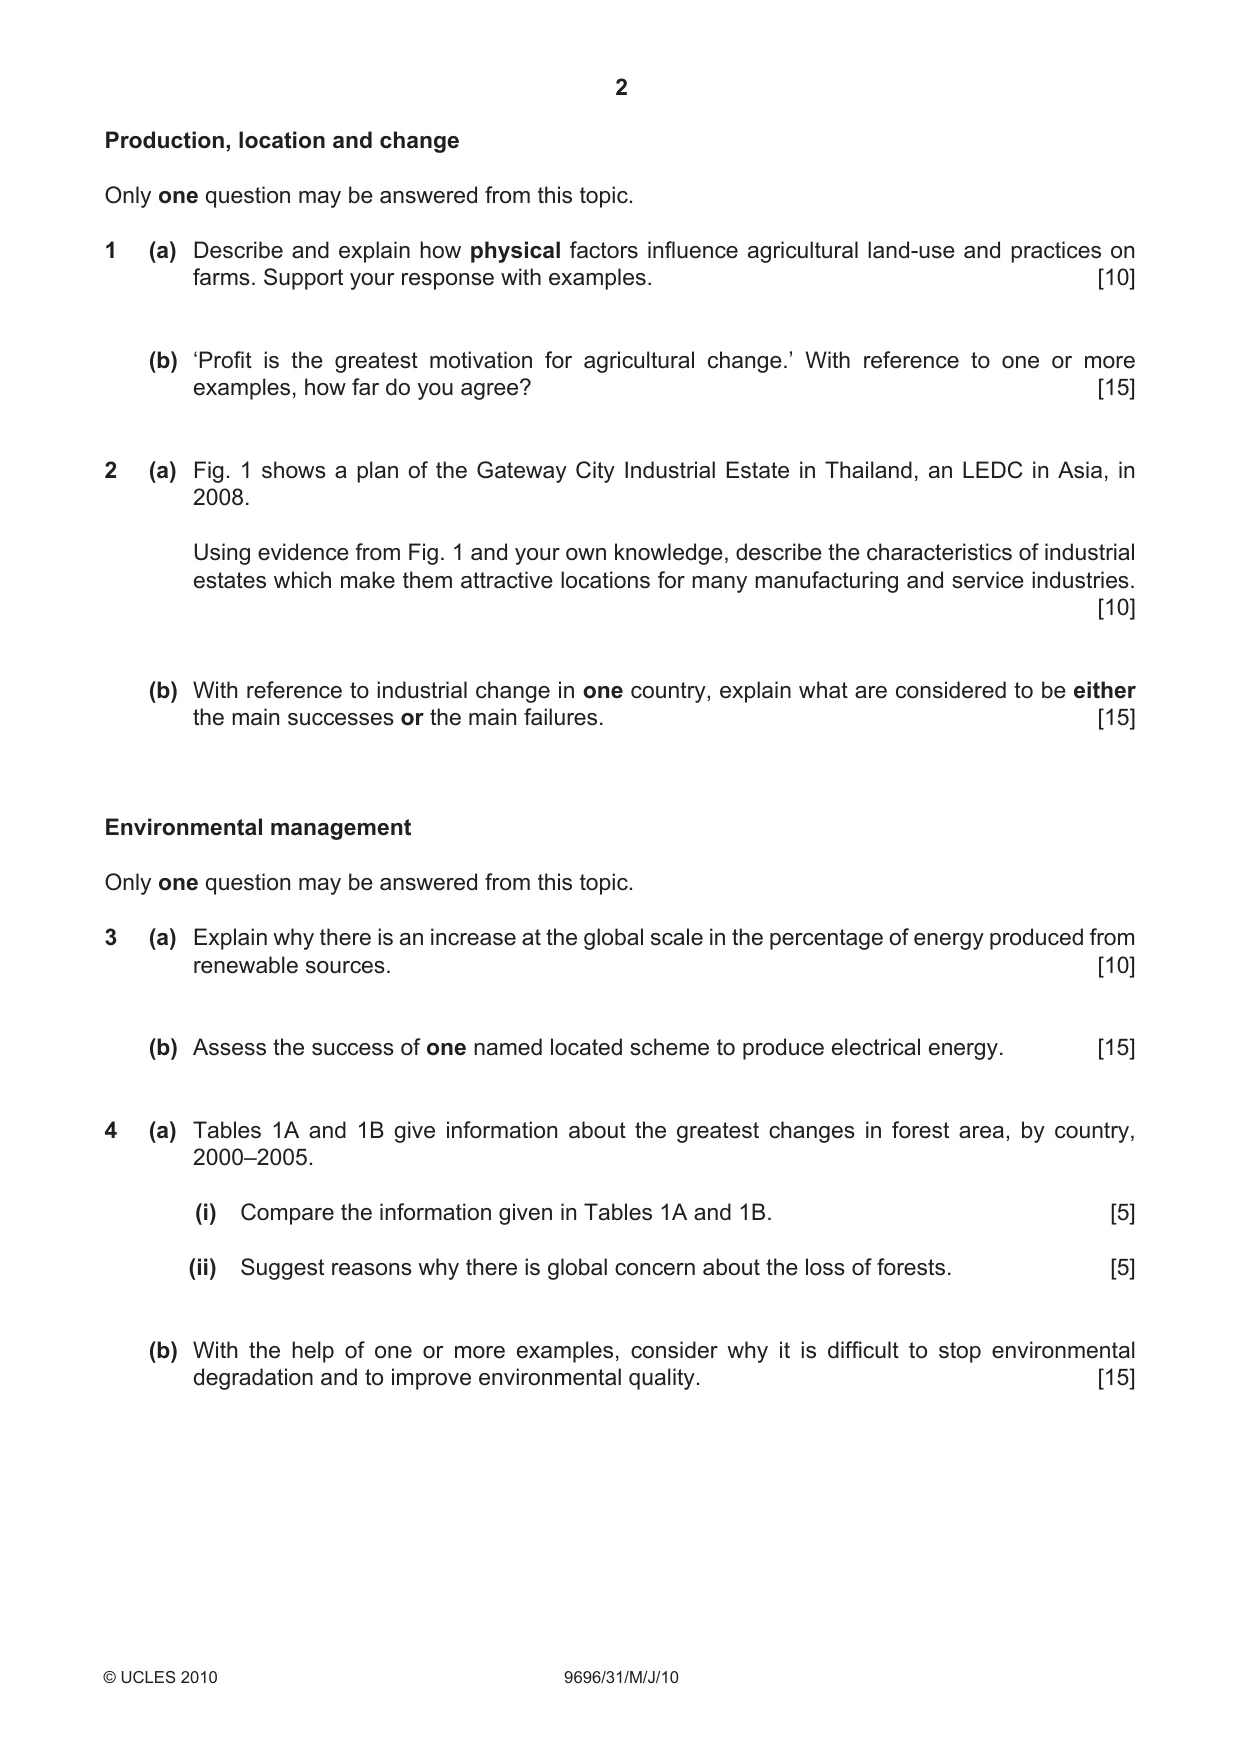
2 9696/31/M/J/10 © UCLES 2010 Production, location and change Only one question may be answered from this topic. 1 (a) Describe and explain how physical factors influence agricultural land-use and practices on farms. Support your response with examples. [10] (b) ‘Profit is the greatest motivation for agricultural change.’ With reference to one or more examples, how far do you agree? [15] 2 (a) Fig. 1 shows a plan of the Gateway City Industrial Estate in Thailand, an LEDC in Asia, in 2008. Using evidence from Fig. 1 and your own knowledge, describe the characteristics of industrial estates which make them attractive locations for many manufacturing and service industries. [10] (b) With reference to industrial change in one country, explain what are considered to be either the main successes or the main failures. [15] Environmental management Only one question may be answered from this topic. 3 (a) Explain why there is an increase at the global scale in the percentage of energy produced from renewable sources. [10] (b) Assess the success of one named located scheme to produce electrical energy. [15] 4 (a) Tables 1A and 1B give information about the greatest changes in forest area, by country, 2000–2005. (i) Compare the information given in Tables 1A and 1B. [5] (ii) Suggest reasons why there is global concern about the loss of forests. [5] (b) With the help of one or more examples, consider why it is difficult to stop environmental degradation and to improve environmental quality. [15]
Question paper, page 3
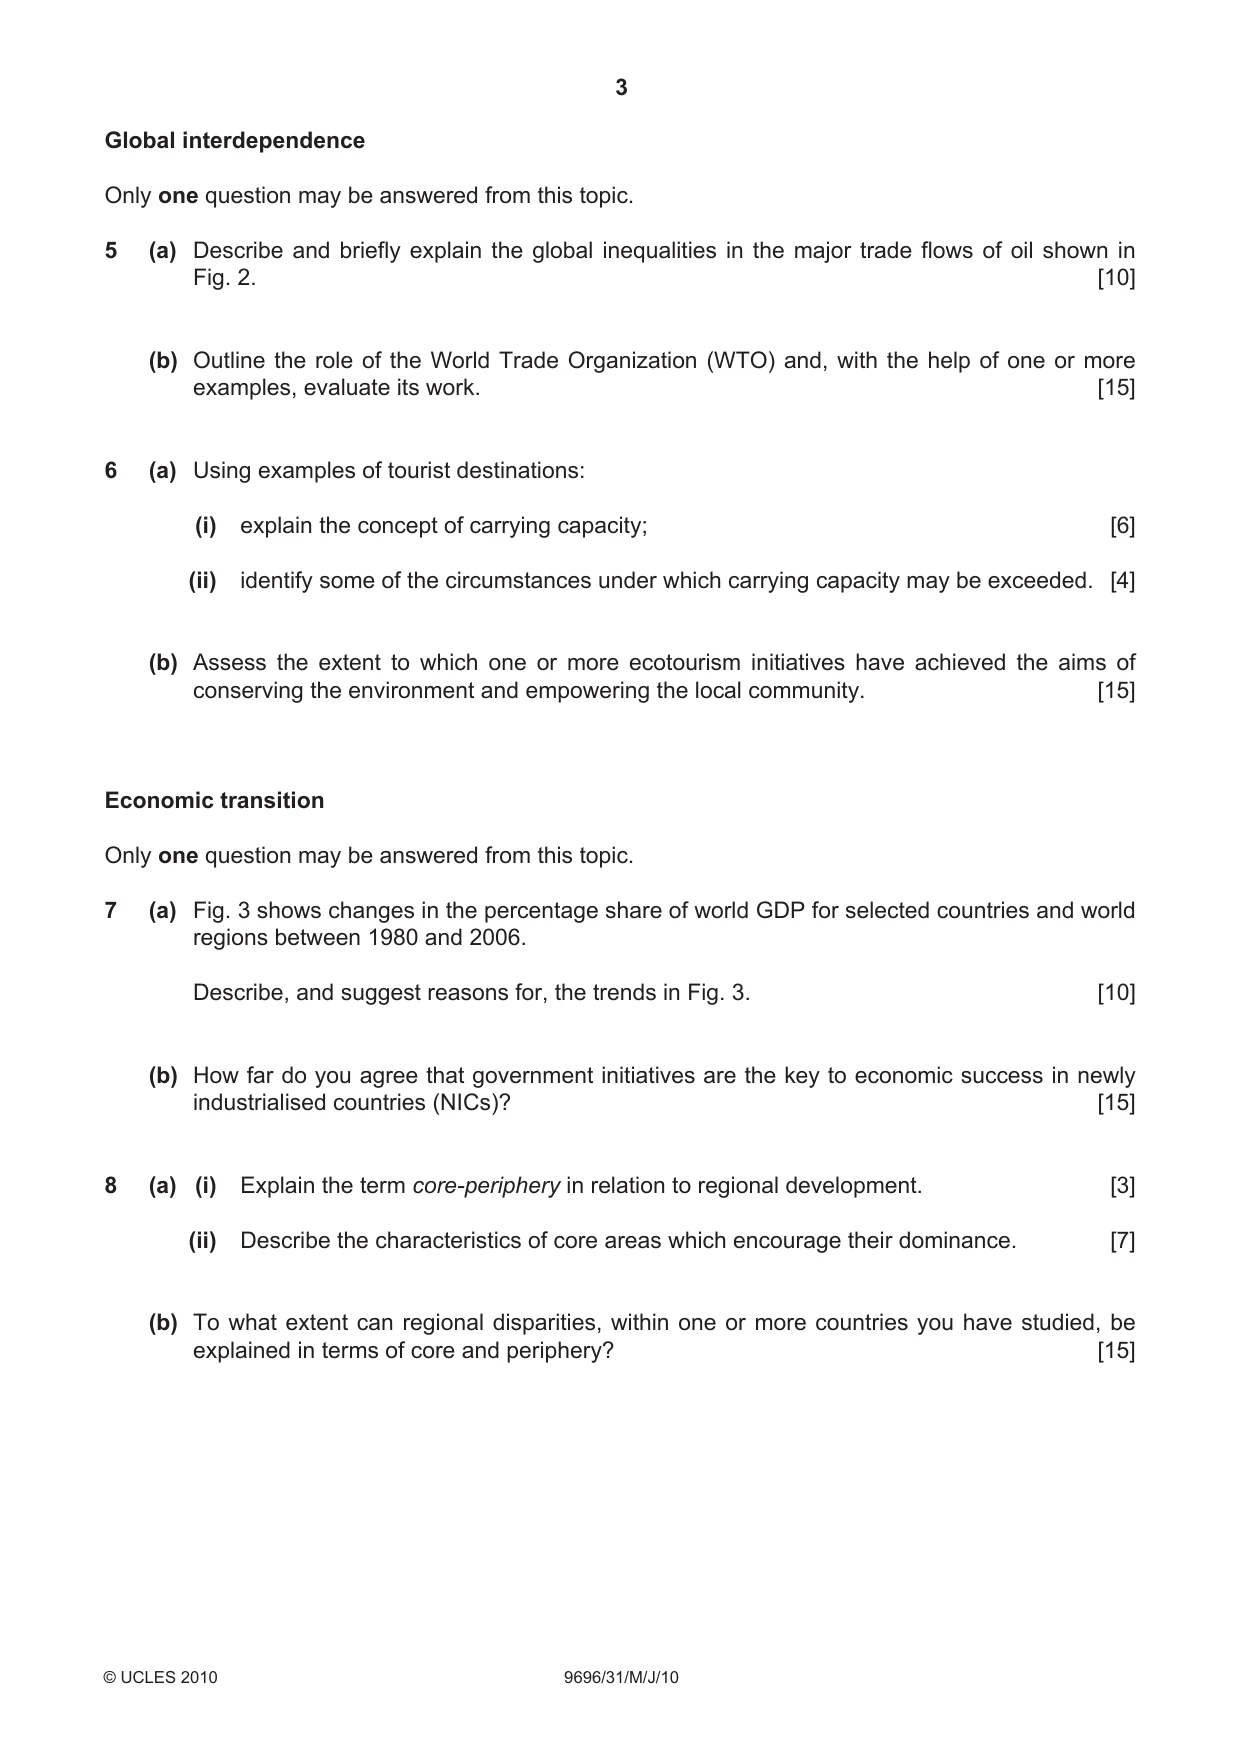
3 9696/31/M/J/10 © UCLES 2010 [Turn over Global interdependence Only one question may be answered from this topic. 5 (a) Describe and briefly explain the global inequalities in the major trade flows of oil shown in Fig. 2. [10] (b) Outline the role of the World Trade Organization (WTO) and, with the help of one or more examples, evaluate its work. [15] 6 (a) Using examples of tourist destinations: (i) explain the concept of carrying capacity; [6] (ii) identify some of the circumstances under which carrying capacity may be exceeded. [4] (b) Assess the extent to which one or more ecotourism initiatives have achieved the aims of conserving the environment and empowering the local community. [15] Economic transition Only one question may be answered from this topic. 7 (a) Fig. 3 shows changes in the percentage share of world GDP for selected countries and world regions between 1980 and 2006. Describe, and suggest reasons for, the trends in Fig. 3. [10] (b) How far do you agree that government initiatives are the key to economic success in newly industrialised countries (NICs)? [15] 8 (a) (i) Explain the term core-periphery in relation to regional development. [3] (ii) Describe the characteristics of core areas which encourage their dominance. [7] (b) To what extent can regional disparities, within one or more countries you have studied, be explained in terms of core and periphery? [15]
Question paper, page 4
4 Copyright Acknowledgements: Question 2 © www.gatewaycity.net/content/masterplan/masterplan.htm; Mox Public Co. Ltd; 18 August 2008. Question 4 © Global Forest Resources Assessment 2005; www.fao.org; 20 August 2008. Question 5 © BP Statistical Review of World Energy, June 2008; http://www.bp.com/liveassets/bp_internet/globalbp; 19 August 2008. Question 7 © Dominic Ziegler; Reaching for a Renaissance: A Special Report on China and its Region; The Economist; 31 March 2007. Permission to reproduce items where third-party owned material protected by copyright is included has been sought and cleared where possible. Every reasonable effort has been made by the publisher (UCLES) to trace copyright holders, but if any items requiring clearance have unwittingly been included, the publisher will be pleased to make amends at the earliest possible opportunity. University of Cambridge International Examinations is part of the Cambridge Assessment Group. Cambridge Assessment is the brand name of University of Cambridge Local Examinations Syndicate (UCLES), which is itself a department of the University of Cambridge. 9696/31/M/J/10 © UCLES 2010 BLANK PAGE
Mark scheme, page 1
UNIVERSITY OF CAMBRIDGE INTERNATIONAL EXAMINATIONS GCE Advanced Subsidiary Level and GCE Advanced Level MARK SCHEME for the May/June 2010 question paper for the guidance of teachers 9696 GEOGRAPHY 9696/31 Paper 31 (Advanced Human Options), maximum raw mark 50 This mark scheme is published as an aid to teachers and candidates, to indicate the requirements of the examination. It shows the basis on which Examiners were instructed to award marks. It does not indicate the details of the discussions that took place at an Examiners’ meeting before marking began, which would have considered the acceptability of alternative answers. Mark schemes must be read in conjunction with the question papers and the report on the examination. • CIE will not enter into discussions or correspondence in connection with these mark schemes. CIE is publishing the mark schemes for the May/June 2010 question papers for most IGCSE, GCE Advanced Level and Advanced Subsidiary Level syllabuses and some Ordinary Level syllabuses.
Mark scheme, page 2
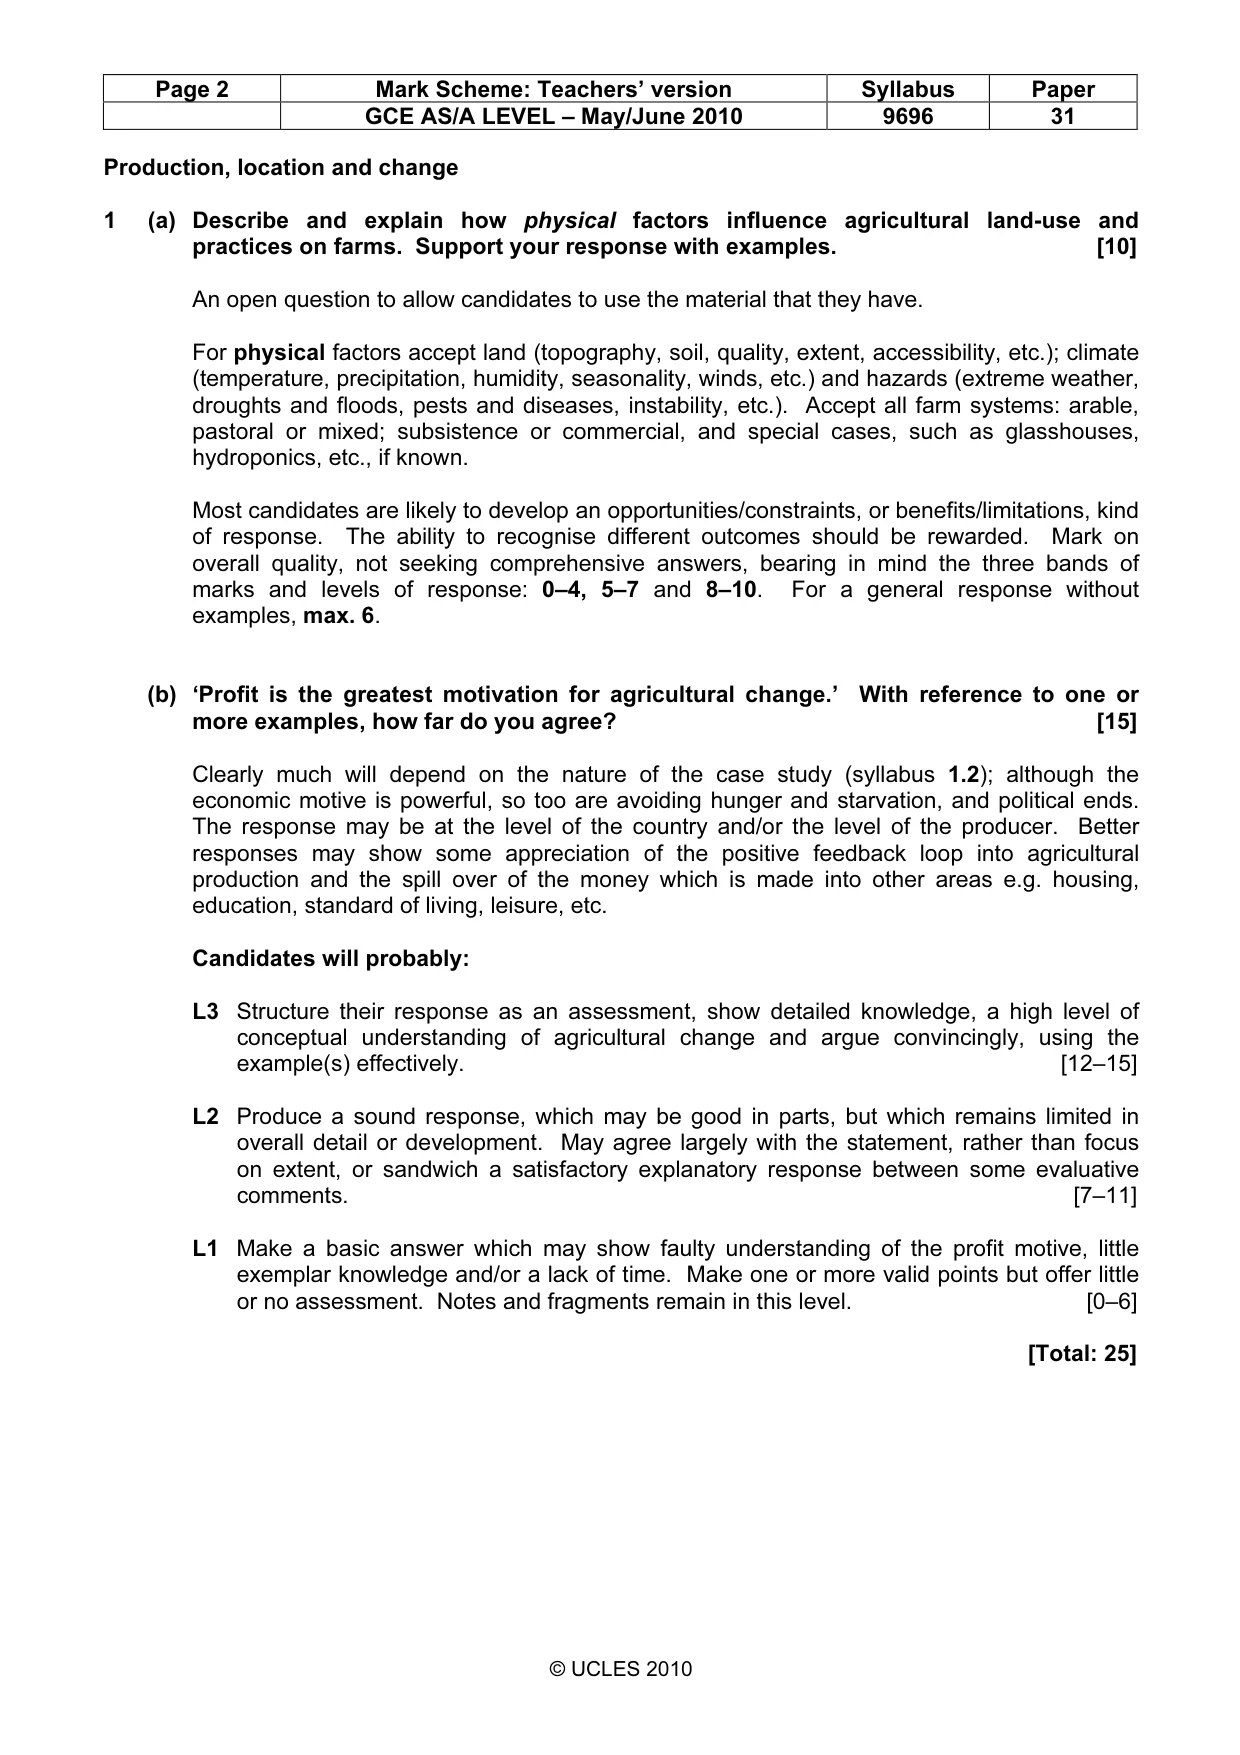
Page 2 Mark Scheme: Teachers’ version Syllabus Paper GCE AS/A LEVEL – May/June 2010 9696 31 © UCLES 2010 Production, location and change 1 (a) Describe and explain how physical factors influence agricultural land-use and practices on farms. Support your response with examples. [10] An open question to allow candidates to use the material that they have. For physical factors accept land (topography, soil, quality, extent, accessibility, etc.); climate (temperature, precipitation, humidity, seasonality, winds, etc.) and hazards (extreme weather, droughts and floods, pests and diseases, instability, etc.). Accept all farm systems: arable, pastoral or mixed; subsistence or commercial, and special cases, such as glasshouses, hydroponics, etc., if known. Most candidates are likely to develop an opportunities/constraints, or benefits/limitations, kind of response. The ability to recognise different outcomes should be rewarded. Mark on overall quality, not seeking comprehensive answers, bearing in mind the three bands of marks and levels of response: 0–4, 5–7 and 8–10. For a general response without examples, max. 6. (b) ‘Profit is the greatest motivation for agricultural change.’ With reference to one or more examples, how far do you agree? [15] Clearly much will depend on the nature of the case study (syllabus 1.2); although the economic motive is powerful, so too are avoiding hunger and starvation, and political ends. The response may be at the level of the country and/or the level of the producer. Better responses may show some appreciation of the positive feedback loop into agricultural production and the spill over of the money which is made into other areas e.g. housing, education, standard of living, leisure, etc. Candidates will probably: L3 Structure their response as an assessment, show detailed knowledge, a high level of conceptual understanding of agricultural change and argue convincingly, using the example(s) effectively. [12–15] L2 Produce a sound response, which may be good in parts, but which remains limited in overall detail or development. May agree largely with the statement, rather than focus on extent, or sandwich a satisfactory explanatory response between some evaluative comments. [7–11] L1 Make a basic answer which may show faulty understanding of the profit motive, little exemplar knowledge and/or a lack of time. Make one or more valid points but offer little or no assessment. Notes and fragments remain in this level. [0–6] [Total: 25]
Mark scheme, page 3
Page 3 Mark Scheme: Teachers’ version Syllabus Paper GCE AS/A LEVEL – May/June 2010 9696 31 © UCLES 2010 2 (a) Fig. 1 shows a plan of the Gateway City Industrial Estate in Thailand, an LEDC in Asia, in 2008. Using evidence from Fig. 1 and your own knowledge, describe the characteristics of industrial estates which make them attractive locations for many manufacturing and service industries. [10] Some characteristics are visible in or discernible from the plan, others are not. Likely observations include the provision or availability of: - suitable plots, with potential for expansion - shell buildings - good road access - environmental services (water, power, waste disposal, etc.) - 24 hour security - actual or potential on-site linkages - subsidies or financial incentives - agglomeration economies - prestige - promotion - other Mark on overall quality, bearing in mind the three bands of marks and levels of response: 0–4, 5–7 and 8–10. For a response derived from Fig. 1, without the integration of a candidate’s own material, max. 6 if done well. (b) With reference to industrial change in one country, explain what are considered to be either the main successes or the main failures. [15] A permissive framework to allow candidates to make the best use of the case study they have. The explanation may be both of the achievement, or lack of it, and the viewpoint of the group(s) of people concerned. The timescale is open and responses may be quite recent, although the syllabus dateline is 1970. In the case of both success and failure being attempted, or more than one country being taken, please mark each account separately and credit the better one. Candidates will probably: L3 Use detailed knowledge of industrial change in the chosen country as the basis for a strong and well-structured explanation of success/failure from the viewpoint of more than one group of people. [12–15] L2 Demonstrate reasonable to good knowledge and understanding of industrial change in the chosen country. Explain success/failure in a partial or limited way, maybe from one viewpoint. [7–11] L1 Find it difficult to make more than descriptive comments about industrial change and statements of success/failure. Offer a response of basic quality which is loose and may remain quite general to the chosen country. Notes and fragments remain in this level. [0–6] [Total: 25]
Mark scheme, page 4
Page 4 Mark Scheme: Teachers’ version Syllabus Paper GCE AS/A LEVEL – May/June 2010 9696 31 © UCLES 2010 Environmental management 3 (a) Explain why there is an increase at the global scale in the percentage of energy produced from renewable sources. [10] It is likely that responses will be couched in terms of the disadvantages or limitations of non- renewables, and the advantages or benefits of renewables. Likely considerations include, - potential, availability and time scale e.g. depletion of fossil fuels - environmental impacts - economic issues e.g. investment and funding - policies and political decisions - public concerns and pressure groups - flexibility of renewables for LEDCs (scale, cost, sites, etc.) - other Mark on overall quality, not seeking comprehensive answers, bearing in mind the three bands of marks and levels of response: 0–4, 5–7 and 8–10. There is no specific requirement for exemplar support, but see QP cover. (b) Assess the success of one named located scheme to produce electrical energy. [15] Candidates are free to use any example that they have. The success of the scheme may be judged in a number of ways, or dimensions, for example, - environmental what impacts does it have? resource use? - economic is it cost-effective? profitable? a stimulus to growth? meeting demand? - social how has it affected the standard of living? local communities? - political does it achieve its objectives? bring prestige? attract criticism and protests? It is particularly creditable to consider success from the viewpoints of different groups of people and to identify conflicts of interest, e.g. for an HEP station: government, landowners, local residents, consumers, fishermen, etc. (AO 4.3) Candidates will probably: L3 Structure their whole response as an assessment, combining detailed knowledge of the scheme, with high quality conceptual understanding. Recognise the perspectives of two or more groups of people. [12–15] L2 Provide a response of sound quality which may be good in parts or as far as it goes. Give a satisfactory, but limited, assessment which may not be integrated with the rest of the answer. [7–11] L1 Struggle to deal with the topic through lack of knowledge of a suitable example. Make one or more basic points about power production. Take a descriptive approach, offering little or no effective assessment. Notes and fragments remain in this level. [0–6] [Total: 25]
Mark scheme, page 5
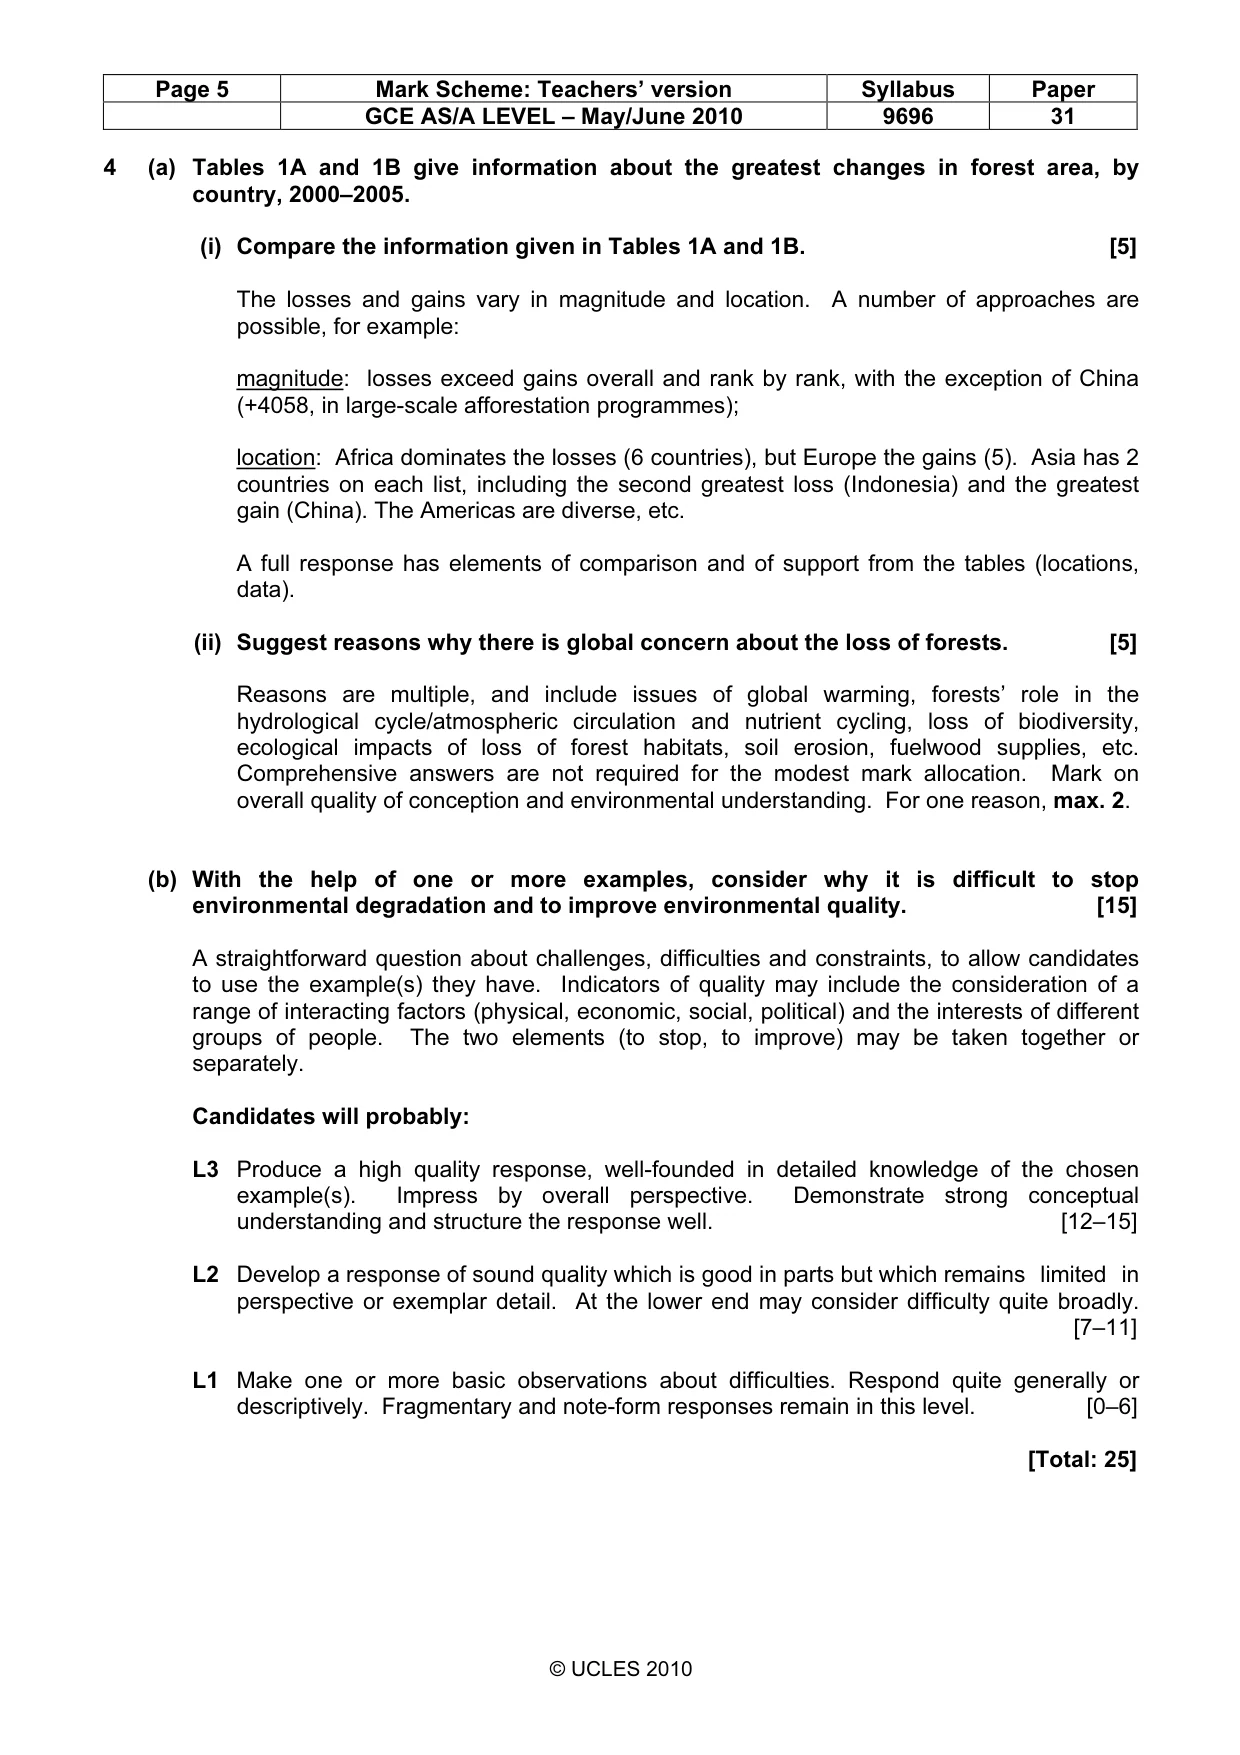
Page 5 Mark Scheme: Teachers’ version Syllabus Paper GCE AS/A LEVEL – May/June 2010 9696 31 © UCLES 2010 4 (a) Tables 1A and 1B give information about the greatest changes in forest area, by country, 2000–2005. (i) Compare the information given in Tables 1A and 1B. [5] The losses and gains vary in magnitude and location. A number of approaches are possible, for example: magnitude: losses exceed gains overall and rank by rank, with the exception of China (+4058, in large-scale afforestation programmes); location: Africa dominates the losses (6 countries), but Europe the gains (5). Asia has 2 countries on each list, including the second greatest loss (Indonesia) and the greatest gain (China). The Americas are diverse, etc. A full response has elements of comparison and of support from the tables (locations, data). (ii) Suggest reasons why there is global concern about the loss of forests. [5] Reasons are multiple, and include issues of global warming, forests’ role in the hydrological cycle/atmospheric circulation and nutrient cycling, loss of biodiversity, ecological impacts of loss of forest habitats, soil erosion, fuelwood supplies, etc. Comprehensive answers are not required for the modest mark allocation. Mark on overall quality of conception and environmental understanding. For one reason, max. 2. (b) With the help of one or more examples, consider why it is difficult to stop environmental degradation and to improve environmental quality. [15] A straightforward question about challenges, difficulties and constraints, to allow candidates to use the example(s) they have. Indicators of quality may include the consideration of a range of interacting factors (physical, economic, social, political) and the interests of different groups of people. The two elements (to stop, to improve) may be taken together or separately. Candidates will probably: L3 Produce a high quality response, well-founded in detailed knowledge of the chosen example(s). Impress by overall perspective. Demonstrate strong conceptual understanding and structure the response well. [12–15] L2 Develop a response of sound quality which is good in parts but which remains limited in perspective or exemplar detail. At the lower end may consider difficulty quite broadly. [7–11] L1 Make one or more basic observations about difficulties. Respond quite generally or descriptively. Fragmentary and note-form responses remain in this level. [0–6] [Total: 25]
Mark scheme, page 6
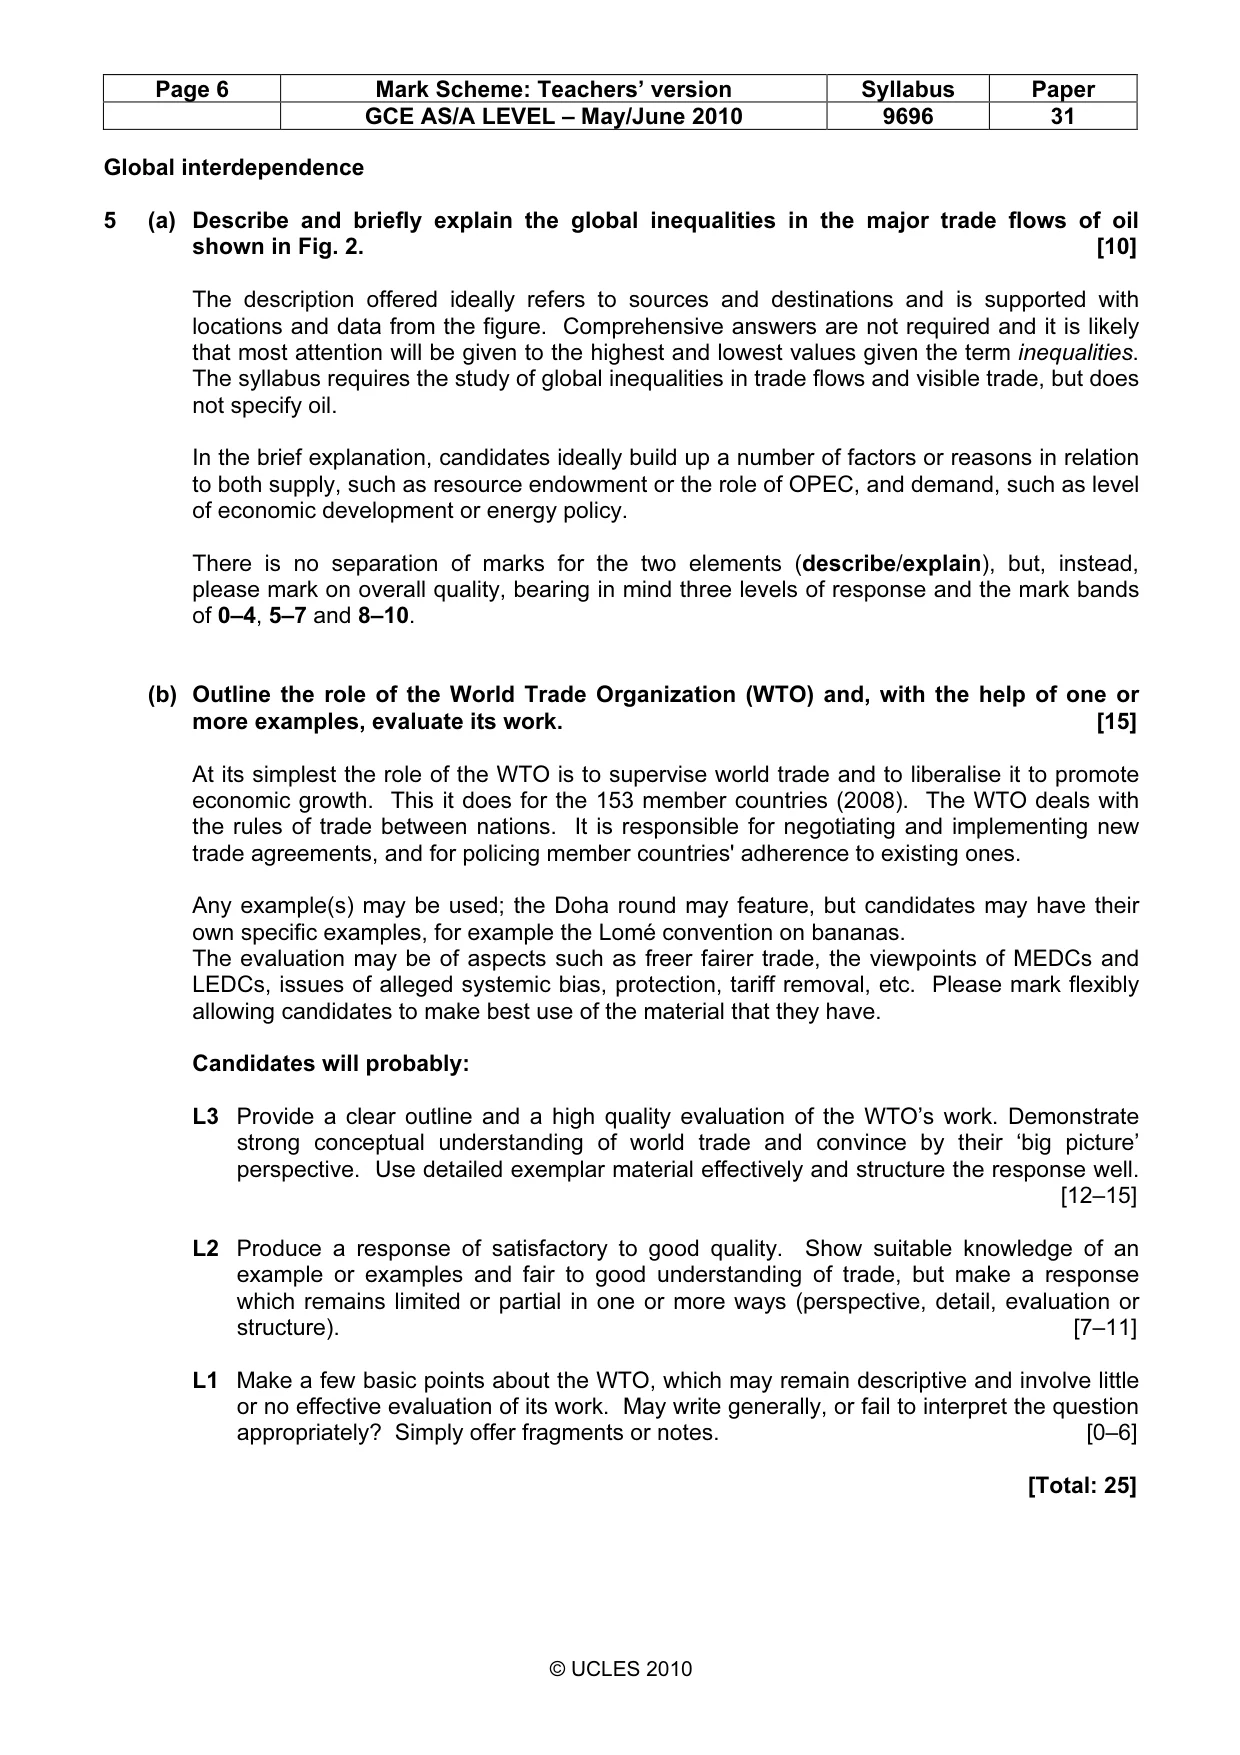
Page 6 Mark Scheme: Teachers’ version Syllabus Paper GCE AS/A LEVEL – May/June 2010 9696 31 © UCLES 2010 Global interdependence 5 (a) Describe and briefly explain the global inequalities in the major trade flows of oil shown in Fig. 2. [10] The description offered ideally refers to sources and destinations and is supported with locations and data from the figure. Comprehensive answers are not required and it is likely that most attention will be given to the highest and lowest values given the term inequalities. The syllabus requires the study of global inequalities in trade flows and visible trade, but does not specify oil. In the brief explanation, candidates ideally build up a number of factors or reasons in relation to both supply, such as resource endowment or the role of OPEC, and demand, such as level of economic development or energy policy. There is no separation of marks for the two elements (describe/explain), but, instead, please mark on overall quality, bearing in mind three levels of response and the mark bands of 0–4, 5–7 and 8–10. (b) Outline the role of the World Trade Organization (WTO) and, with the help of one or more examples, evaluate its work. [15] At its simplest the role of the WTO is to supervise world trade and to liberalise it to promote economic growth. This it does for the 153 member countries (2008). The WTO deals with the rules of trade between nations. It is responsible for negotiating and implementing new trade agreements, and for policing member countries' adherence to existing ones. Any example(s) may be used; the Doha round may feature, but candidates may have their own specific examples, for example the Lomé convention on bananas. The evaluation may be of aspects such as freer fairer trade, the viewpoints of MEDCs and LEDCs, issues of alleged systemic bias, protection, tariff removal, etc. Please mark flexibly allowing candidates to make best use of the material that they have. Candidates will probably: L3 Provide a clear outline and a high quality evaluation of the WTO’s work. Demonstrate strong conceptual understanding of world trade and convince by their ‘big picture’ perspective. Use detailed exemplar material effectively and structure the response well. [12–15] L2 Produce a response of satisfactory to good quality. Show suitable knowledge of an example or examples and fair to good understanding of trade, but make a response which remains limited or partial in one or more ways (perspective, detail, evaluation or structure). [7–11] L1 Make a few basic points about the WTO, which may remain descriptive and involve little or no effective evaluation of its work. May write generally, or fail to interpret the question appropriately? Simply offer fragments or notes. [0–6] [Total: 25]
Mark scheme, page 7
Page 7 Mark Scheme: Teachers’ version Syllabus Paper GCE AS/A LEVEL – May/June 2010 9696 31 © UCLES 2010 6 (a) Using examples of tourist destinations: (i) explain the concept of carrying capacity; [6] Carrying capacity is an ecological term meaning the maximum number of tourists that the resources of a destination can support. It can mean, - physical capacity e.g. bed spaces, physical space without overcrowding such as on pavements or a beach - service capacity e.g. water, power, parking spaces - psychological capacity in relation to the quality of the tourist experience and the perceptions of locals - environmental capacity i.e. before damage is sustained to any environment e.g. coast, urban heritage The number of tourists supportable may differ with the definition used. Any examples may be used to support the response. Mark on overall quality, for a response without examples, max. 3. (ii) identify some of the circumstances under which carrying capacity may be exceeded. [4] Credit any circumstances, for example, in relation to, - timescale, such as peak season, public holidays, weekends - promotion, such as special events, media attention, fashion - unplanned circumstances, such as two cruise ships arriving at one island at the same time, a lack of regulation or control Different approaches are possible but a full answer could consist of two developed circumstances supported by examples. (b) Assess the extent to which one or more ecotourism initiatives have achieved the aims of conserving the environment and empowering the local community. [15] ‘Environmental conservation and community empowerment’ is the slogan of an organisation in Indonesia, but the twin aims are common in ecotourism. The assessment may cover what has and has not been achieved: credit the recognition of outcomes which vary spatially, or between community groups. Candidates will probably: L3 Structure the whole response as an assessment, make effective use of one or more detailed examples. Demonstrate strong conceptual understanding of both aims in a reasonably balanced manner. [12–15] L2 Provide a response of sound to good quality which is fine as far as it goes, but which remains underdeveloped in detail, or in the assessment offered. May focus more on one aim – the environmental one? [7–11] L1 Offer more of a description than an assessment. Make one or more simple observations about the environment and/or the community. Offer a generalised piece, or show limited or faulty recall. [0–6] [Total: 25]
Mark scheme, page 8
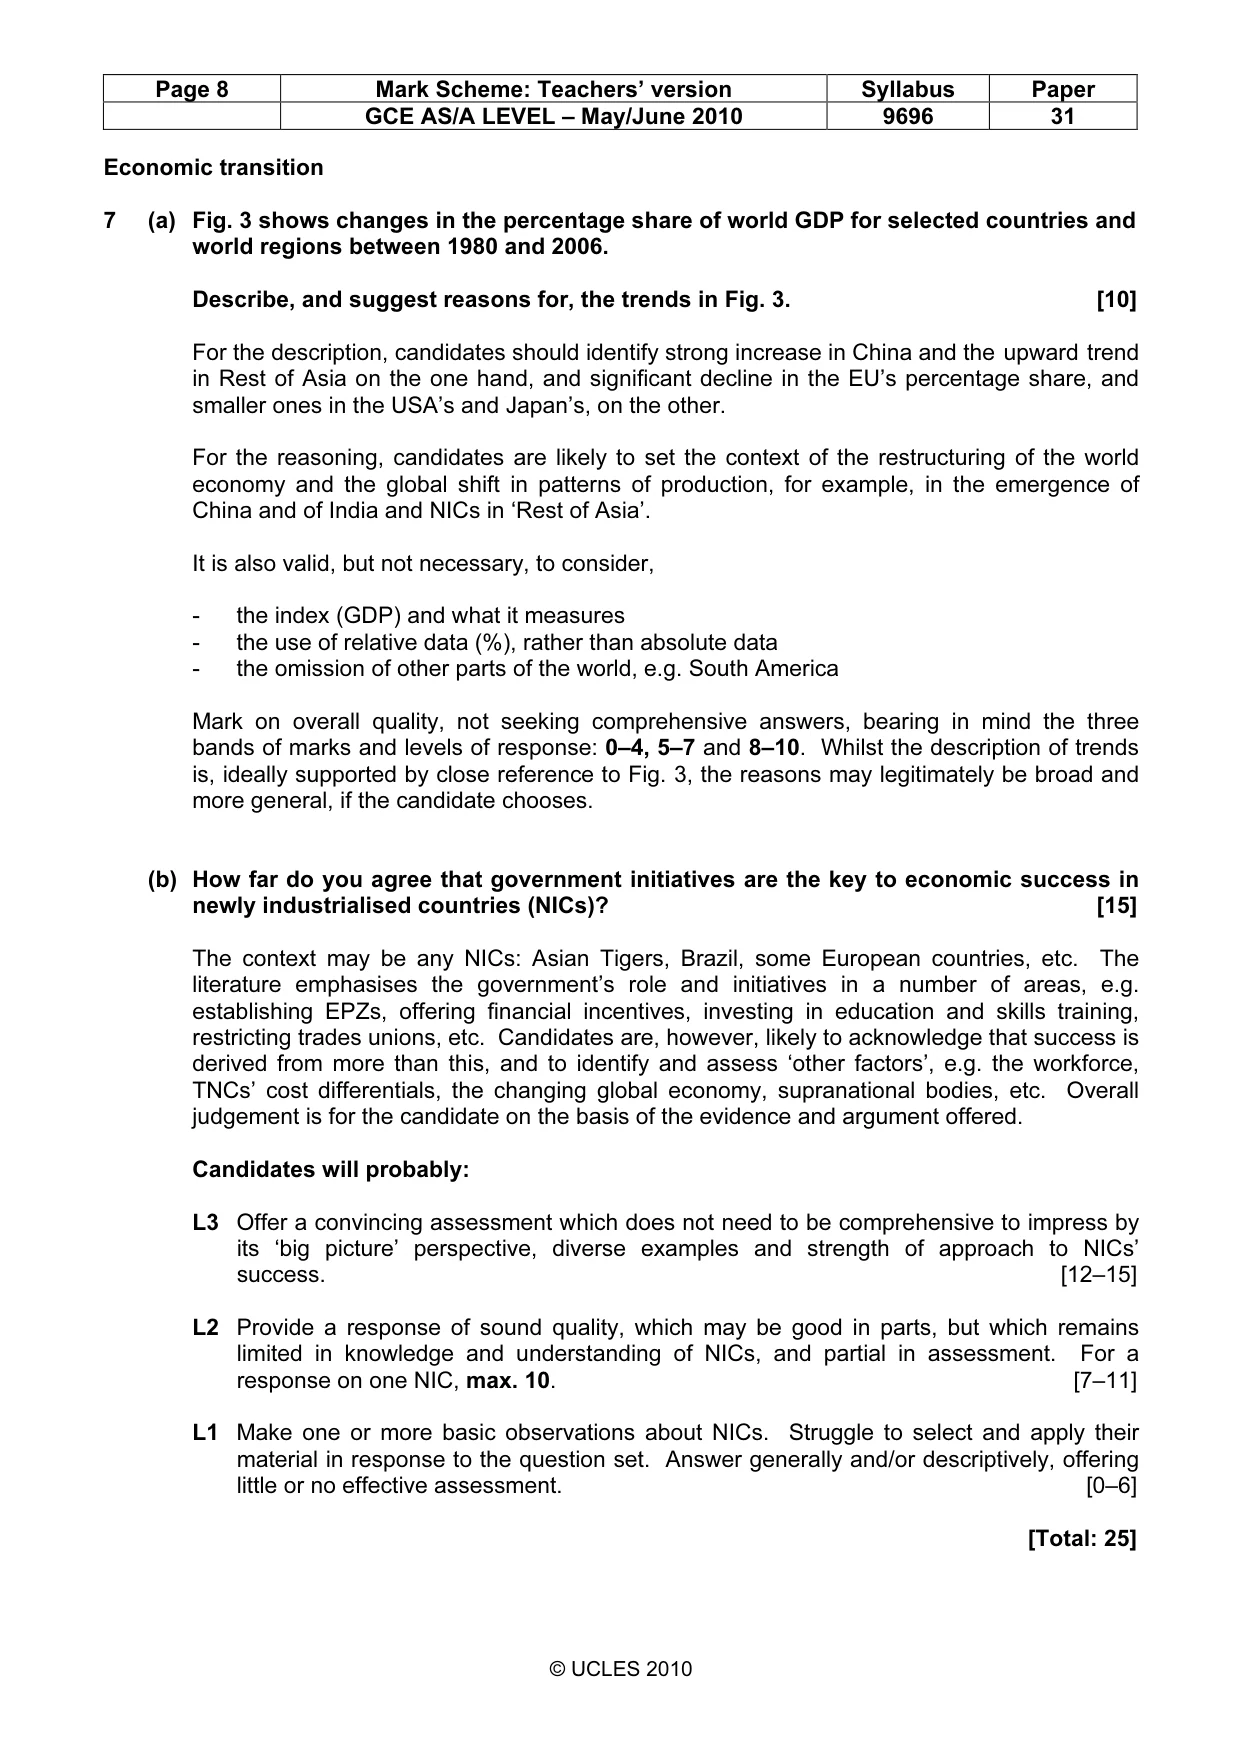
Page 8 Mark Scheme: Teachers’ version Syllabus Paper GCE AS/A LEVEL – May/June 2010 9696 31 © UCLES 2010 Economic transition 7 (a) Fig. 3 shows changes in the percentage share of world GDP for selected countries and world regions between 1980 and 2006. Describe, and suggest reasons for, the trends in Fig. 3. [10] For the description, candidates should identify strong increase in China and the upward trend in Rest of Asia on the one hand, and significant decline in the EU’s percentage share, and smaller ones in the USA’s and Japan’s, on the other. For the reasoning, candidates are likely to set the context of the restructuring of the world economy and the global shift in patterns of production, for example, in the emergence of China and of India and NICs in ‘Rest of Asia’. It is also valid, but not necessary, to consider, - the index (GDP) and what it measures - the use of relative data (%), rather than absolute data - the omission of other parts of the world, e.g. South America Mark on overall quality, not seeking comprehensive answers, bearing in mind the three bands of marks and levels of response: 0–4, 5–7 and 8–10. Whilst the description of trends is, ideally supported by close reference to Fig. 3, the reasons may legitimately be broad and more general, if the candidate chooses. (b) How far do you agree that government initiatives are the key to economic success in newly industrialised countries (NICs)? [15] The context may be any NICs: Asian Tigers, Brazil, some European countries, etc. The literature emphasises the government’s role and initiatives in a number of areas, e.g. establishing EPZs, offering financial incentives, investing in education and skills training, restricting trades unions, etc. Candidates are, however, likely to acknowledge that success is derived from more than this, and to identify and assess ‘other factors’, e.g. the workforce, TNCs’ cost differentials, the changing global economy, supranational bodies, etc. Overall judgement is for the candidate on the basis of the evidence and argument offered. Candidates will probably: L3 Offer a convincing assessment which does not need to be comprehensive to impress by its ‘big picture’ perspective, diverse examples and strength of approach to NICs’ success. [12–15] L2 Provide a response of sound quality, which may be good in parts, but which remains limited in knowledge and understanding of NICs, and partial in assessment. For a response on one NIC, max. 10. [7–11] L1 Make one or more basic observations about NICs. Struggle to select and apply their material in response to the question set. Answer generally and/or descriptively, offering little or no effective assessment. [0–6] [Total: 25]
Mark scheme, page 9
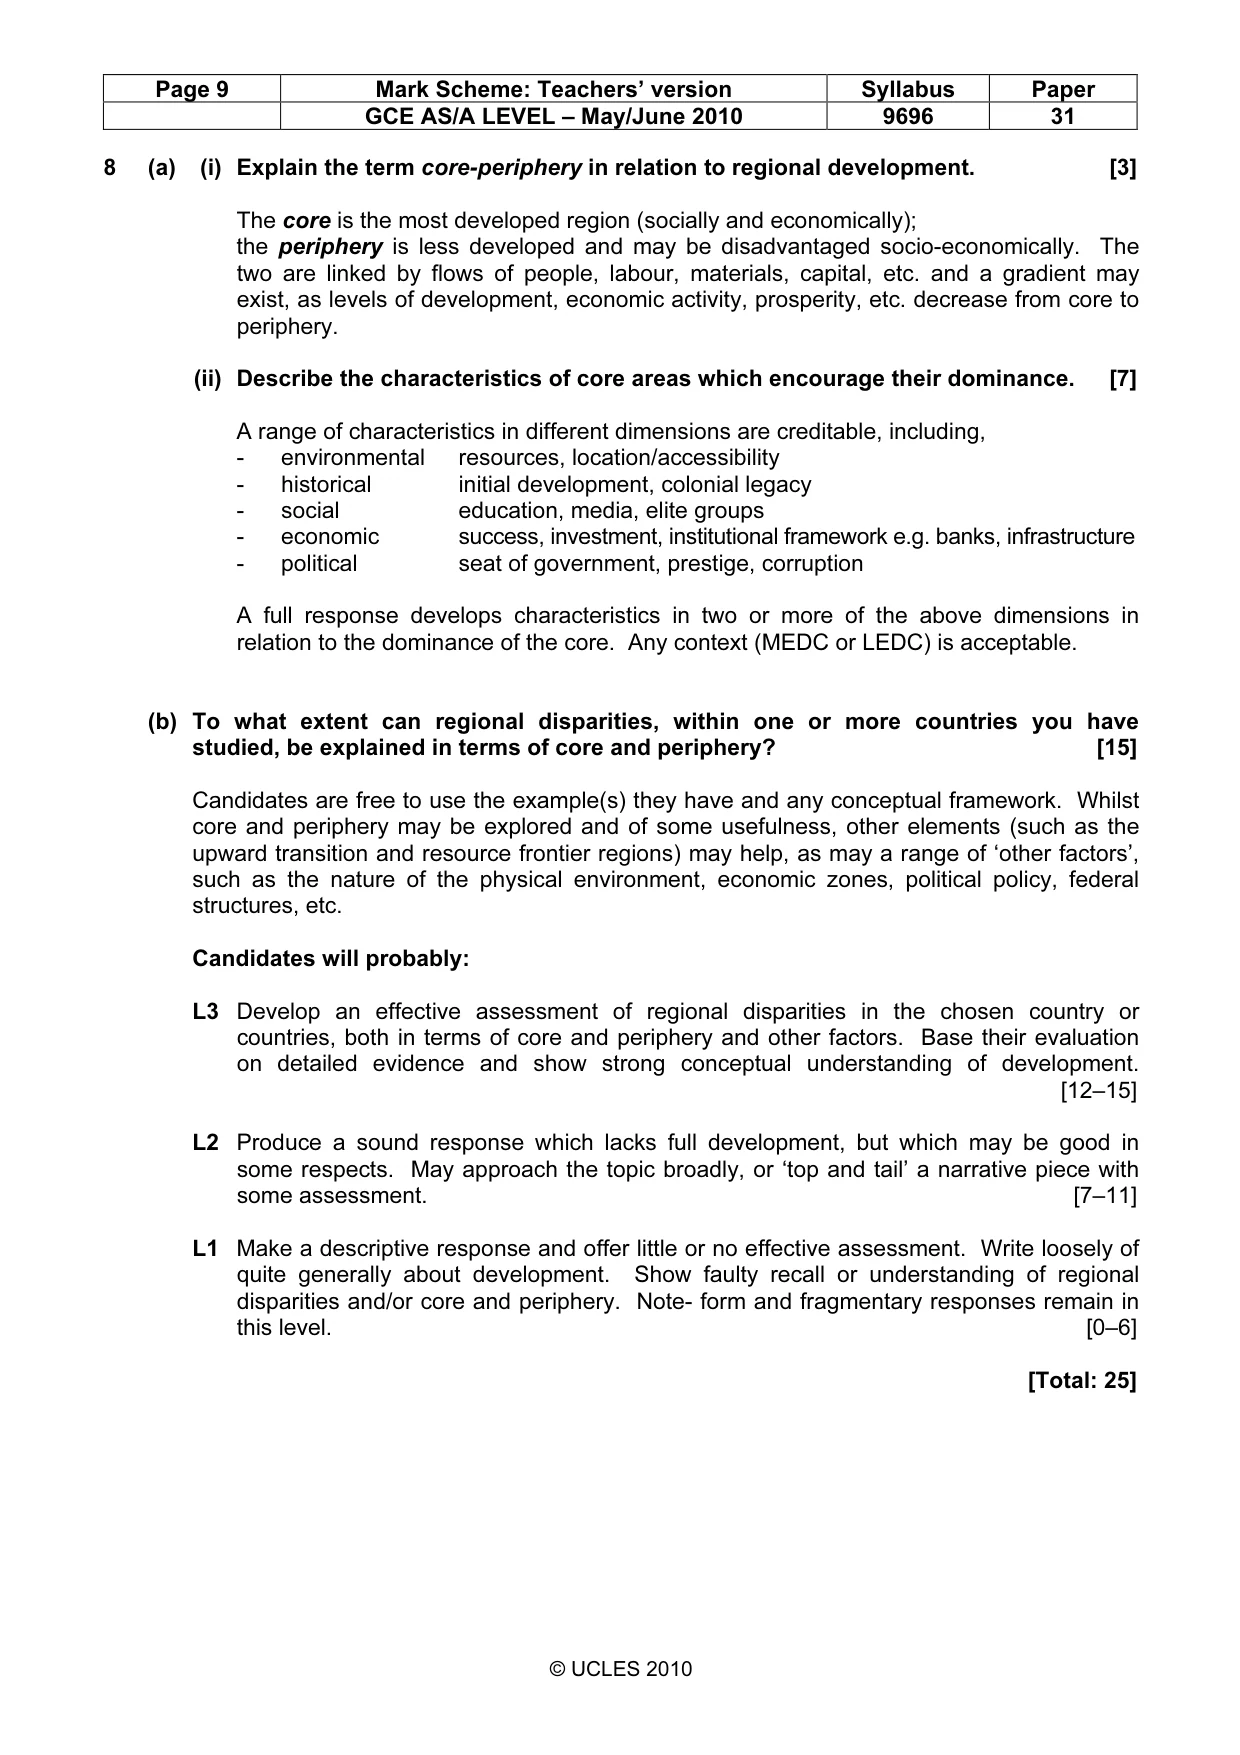
Page 9 Mark Scheme: Teachers’ version Syllabus Paper GCE AS/A LEVEL – May/June 2010 9696 31 © UCLES 2010 8 (a) (i) Explain the term core-periphery in relation to regional development. [3] The core is the most developed region (socially and economically); the periphery is less developed and may be disadvantaged socio-economically. The two are linked by flows of people, labour, materials, capital, etc. and a gradient may exist, as levels of development, economic activity, prosperity, etc. decrease from core to periphery. (ii) Describe the characteristics of core areas which encourage their dominance. [7] A range of characteristics in different dimensions are creditable, including, - environmental resources, location/accessibility - historical initial development, colonial legacy - social education, media, elite groups - economic success, investment, institutional framework e.g. banks, infrastructure - political seat of government, prestige, corruption A full response develops characteristics in two or more of the above dimensions in relation to the dominance of the core. Any context (MEDC or LEDC) is acceptable. (b) To what extent can regional disparities, within one or more countries you have studied, be explained in terms of core and periphery? [15] Candidates are free to use the example(s) they have and any conceptual framework. Whilst core and periphery may be explored and of some usefulness, other elements (such as the upward transition and resource frontier regions) may help, as may a range of ‘other factors’, such as the nature of the physical environment, economic zones, political policy, federal structures, etc. Candidates will probably: L3 Develop an effective assessment of regional disparities in the chosen country or countries, both in terms of core and periphery and other factors. Base their evaluation on detailed evidence and show strong conceptual understanding of development. [12–15] L2 Produce a sound response which lacks full development, but which may be good in some respects. May approach the topic broadly, or ‘top and tail’ a narrative piece with some assessment. [7–11] L1 Make a descriptive response and offer little or no effective assessment. Write loosely of quite generally about development. Show faulty recall or understanding of regional disparities and/or core and periphery. Note- form and fragmentary responses remain in this level. [0–6] [Total: 25]
What you needed in this session
Cambridge’s own grade thresholds for 2010 May/June, Paper 3 · Variant 1. A higher threshold means an easier paper — the bar moves with how the cohort did.