Cambridge A Level Environmental Management (AS only) 8291 — 2023 May/June Paper 2 · Variant 2
8291/22/M/J/23 · 5 questions · 80 marks · ≈90 min
The question paper and its mark scheme, free to read here and free to download. This is Cambridge’s own paper, exactly as it was sat.
Question paper20 pages





Mark scheme12 pages
Answers below. Sit the paper first if you are practising.

Questions as text
Q1 · Plants use chlorophyll to capture light energy for photosynthesis
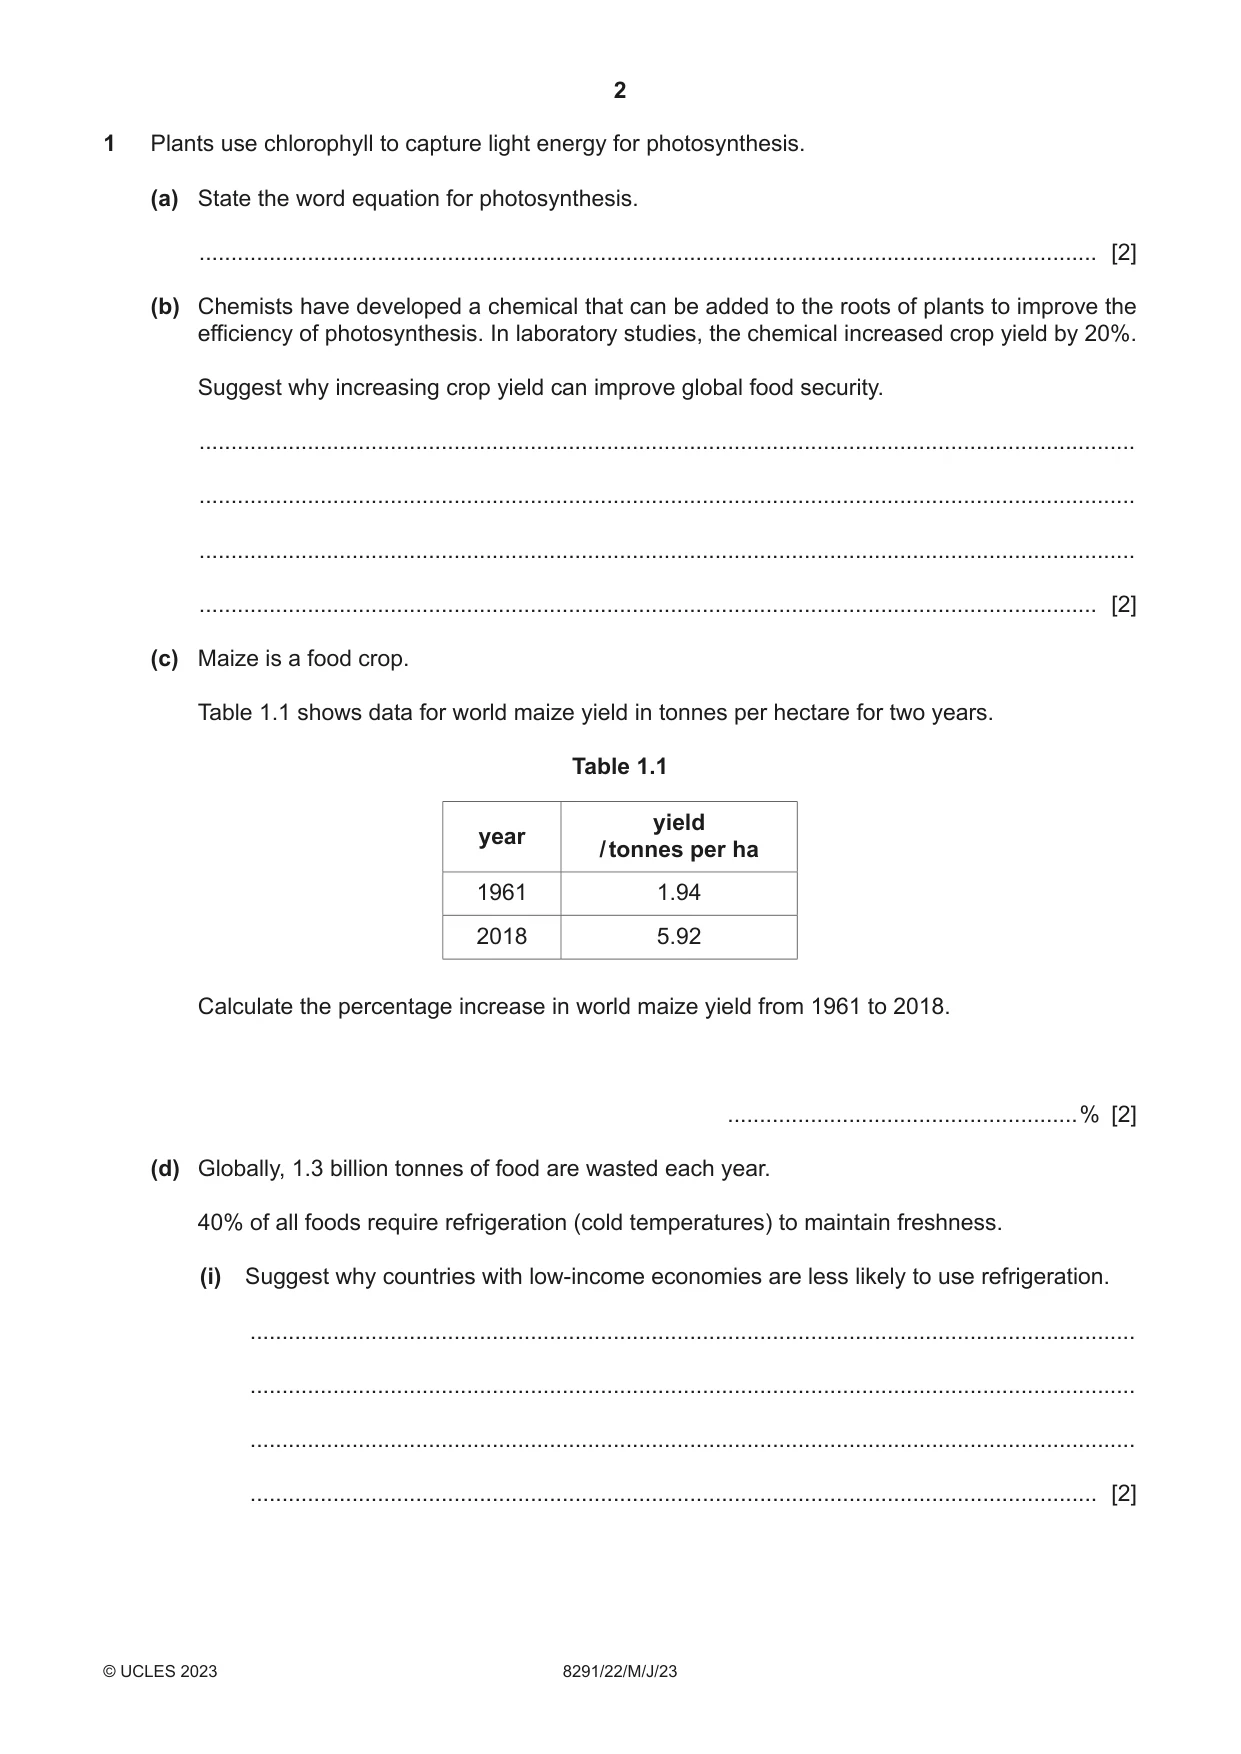
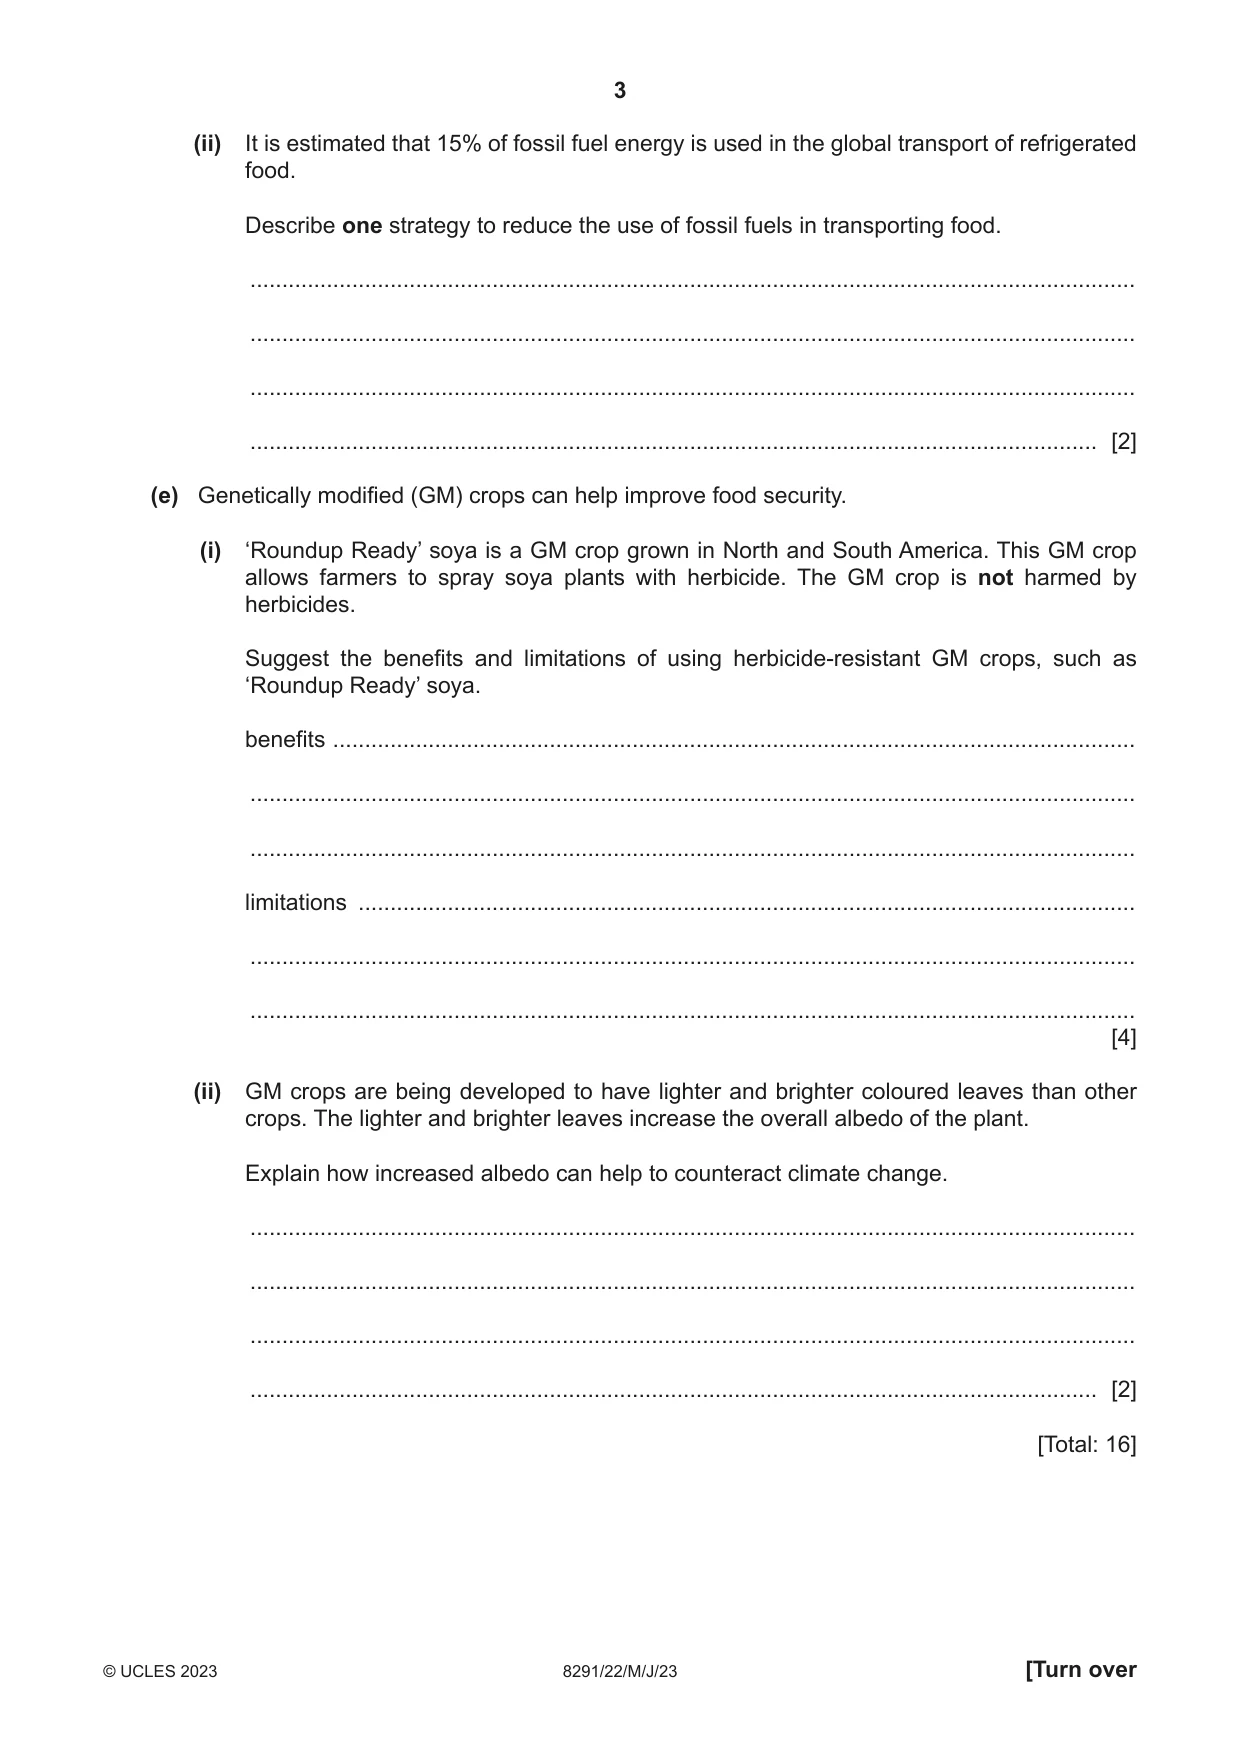
1 Plants use chlorophyll to capture light energy for photosynthesis. (a) State the word equation for photosynthesis. ............................................................................................................................................. [2] (b) Chemists have developed a chemical that can be added to the roots of plants to improve the efficiency of photosynthesis. In laboratory studies, the chemical increased crop yield by 20%. Suggest why increasing crop yield can improve global food security. ................................................................................................................................................... ................................................................................................................................................... ................................................................................................................................................... ............................................................................................................................................. [2] (c) Maize is a food crop. Table 1.1 shows data for world maize yield in tonnes per hectare for two years. Table 1.1 yield year / tonnes per ha 1961 1.94 2018 5.92 Calculate the percentage increase in world maize yield from 1961 to 2018. .......................................................% [2] (d) Globally, 1.3 billion tonnes of food are wasted each year. 40% of all foods require refrigeration (cold temperatures) to maintain freshness. (i) Suggest why countries with low‑income economies are less likely to use refrigeration. ........................................................................................................................................... ........................................................................................................................................... ........................................................................................................................................... ..................................................................................................................................... [2] (ii) It is estimated that 15% of fossil fuel energy is used in the global transport of refrigerated food. Describe one strategy to reduce the use of fossil fuels in transporting food. ........................................................................................................................................... ........................................................................................................................................... ........................................................................................................................................... ..................................................................................................................................... [2] (e) Genetically modified (GM) crops can help improve food security. (i) ‘Roundup Ready’ soya is a GM crop grown in North and South America. This GM crop allows farmers to spray soya plants with herbicide. The GM crop is not harmed by herbicides. Suggest the benefits and limitations of using herbicide‑resistant GM crops, such as ‘Roundup Ready’ soya. benefits .............................................................................................................................. ........................................................................................................................................... ........................................................................................................................................... limitations .......................................................................................................................... ........................................................................................................................................... ........................................................................................................................................... [4] (ii) GM crops are being developed to have lighter and brighter coloured leaves than other crops. The lighter and brighter leaves increase the overall albedo of the plant. Explain how increased albedo can help to counteract climate change. ........................................................................................................................................... ........................................................................................................................................... ........................................................................................................................................... ..................................................................................................................................... [2] [Total: 16]
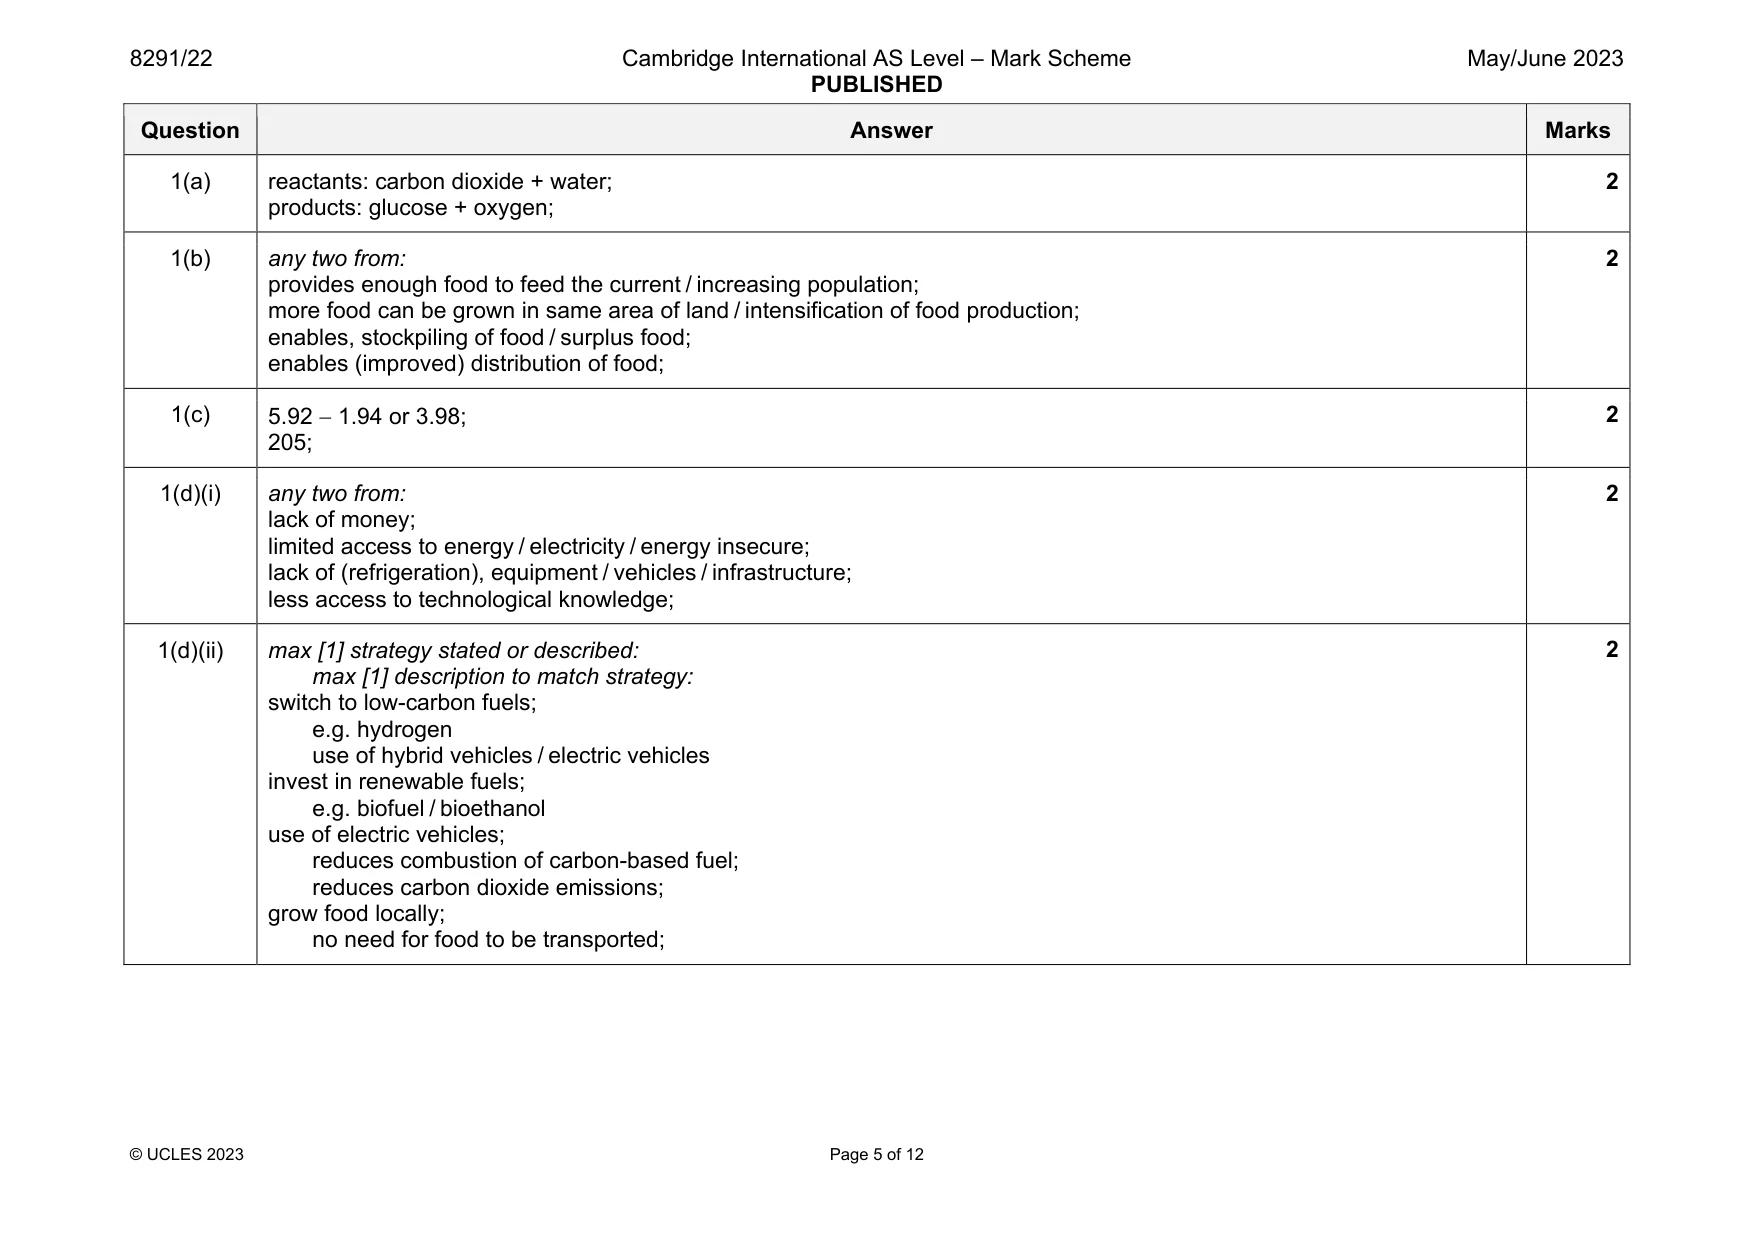
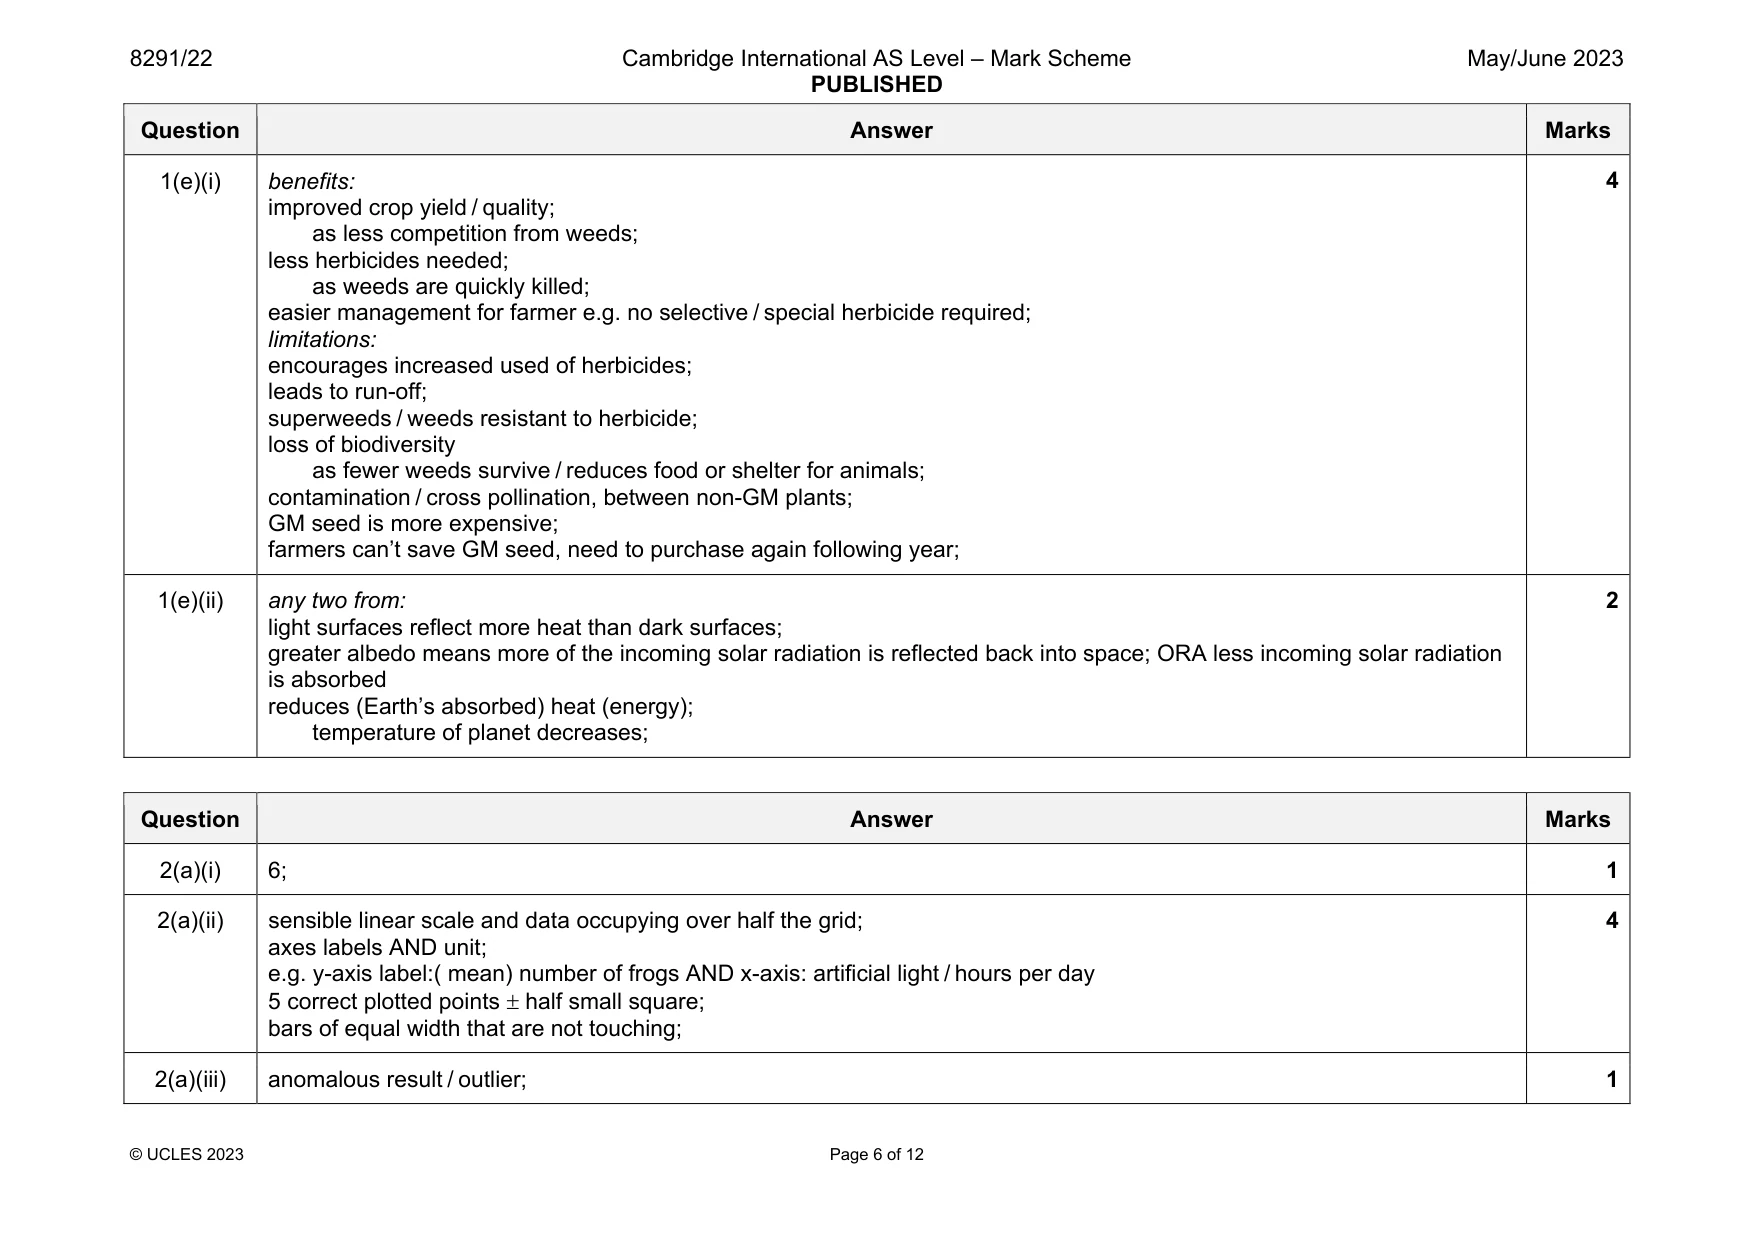
Mark scheme: 1(a) reactants: carbon dioxide + water; products: glucose + oxygen; 2 1(b) any two from: provides enough food to feed the current / increasing population; more food can be grown in same area of land / intensification of food production; enables, stockpiling of food / surplus food; enables (improved) distribution of food; 2 1(c) 5.92 1.94 or 3.98; 205; 2 1(d)(i) any two from: lack of money; limited access to energy / electricity / energy insecure; lack of (refrigeration), equipment / vehicles / infrastructure; less access to technological knowledge; 2 1(d)(ii) max [1] strategy stated or described: max [1] description to match strategy: switch to low-carbon fuels; e.g. hydrogen use of hybrid vehicles / electric vehicles invest in renewable fuels; e.g. biofuel / bioethanol use of electric vehicles; reduces combustion of carbon-based fuel; reduces carbon dioxide emissions; grow food locally; no need for food to be transported; 2 Question Answer Marks 1(e)(i) benefits: improved crop yield / quality; as less competition from weeds; less herbicides needed; as weeds are quickly killed; easier management for farmer e.g. no selective / special herbicide required; limitations: encourages increased used of herbicides; leads to run-off; superweeds / weeds resistant to herbicide; loss of biodiversity as fewer weeds survive / reduces food or shelter for animals; contamination / cross pollination, between non-GM plants; GM seed is more expensive; farmers can’t save GM seed, need to purchase again following year; 4 1(e)(ii) any two from: light surfaces reflect more heat than dark surfaces; greater albedo means more of the incoming solar radiation is reflected back into space; ORA less incoming solar radiation is absorbed reduces (Earth’s absorbed) heat (energy); temperature of planet decreases; 2
Q2 · The African clawed frog and tadpole
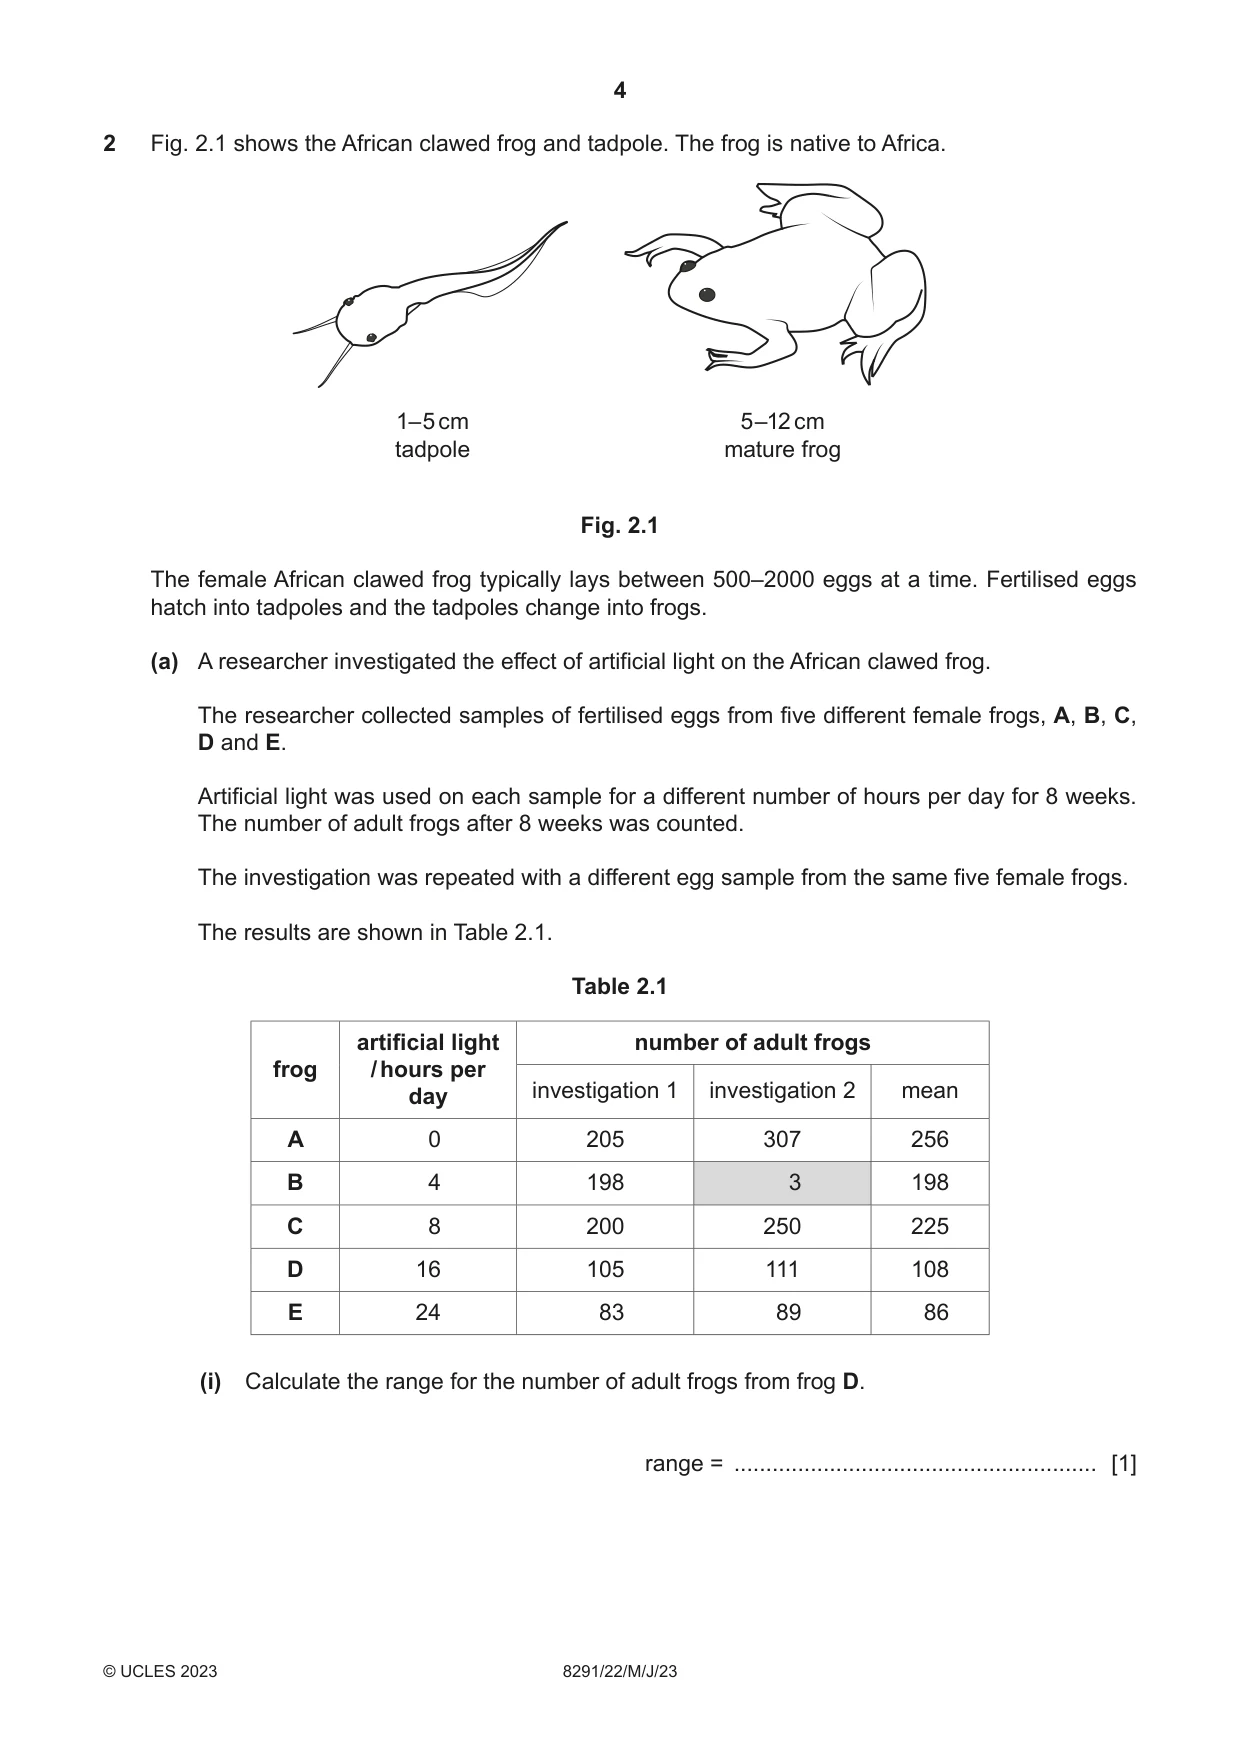
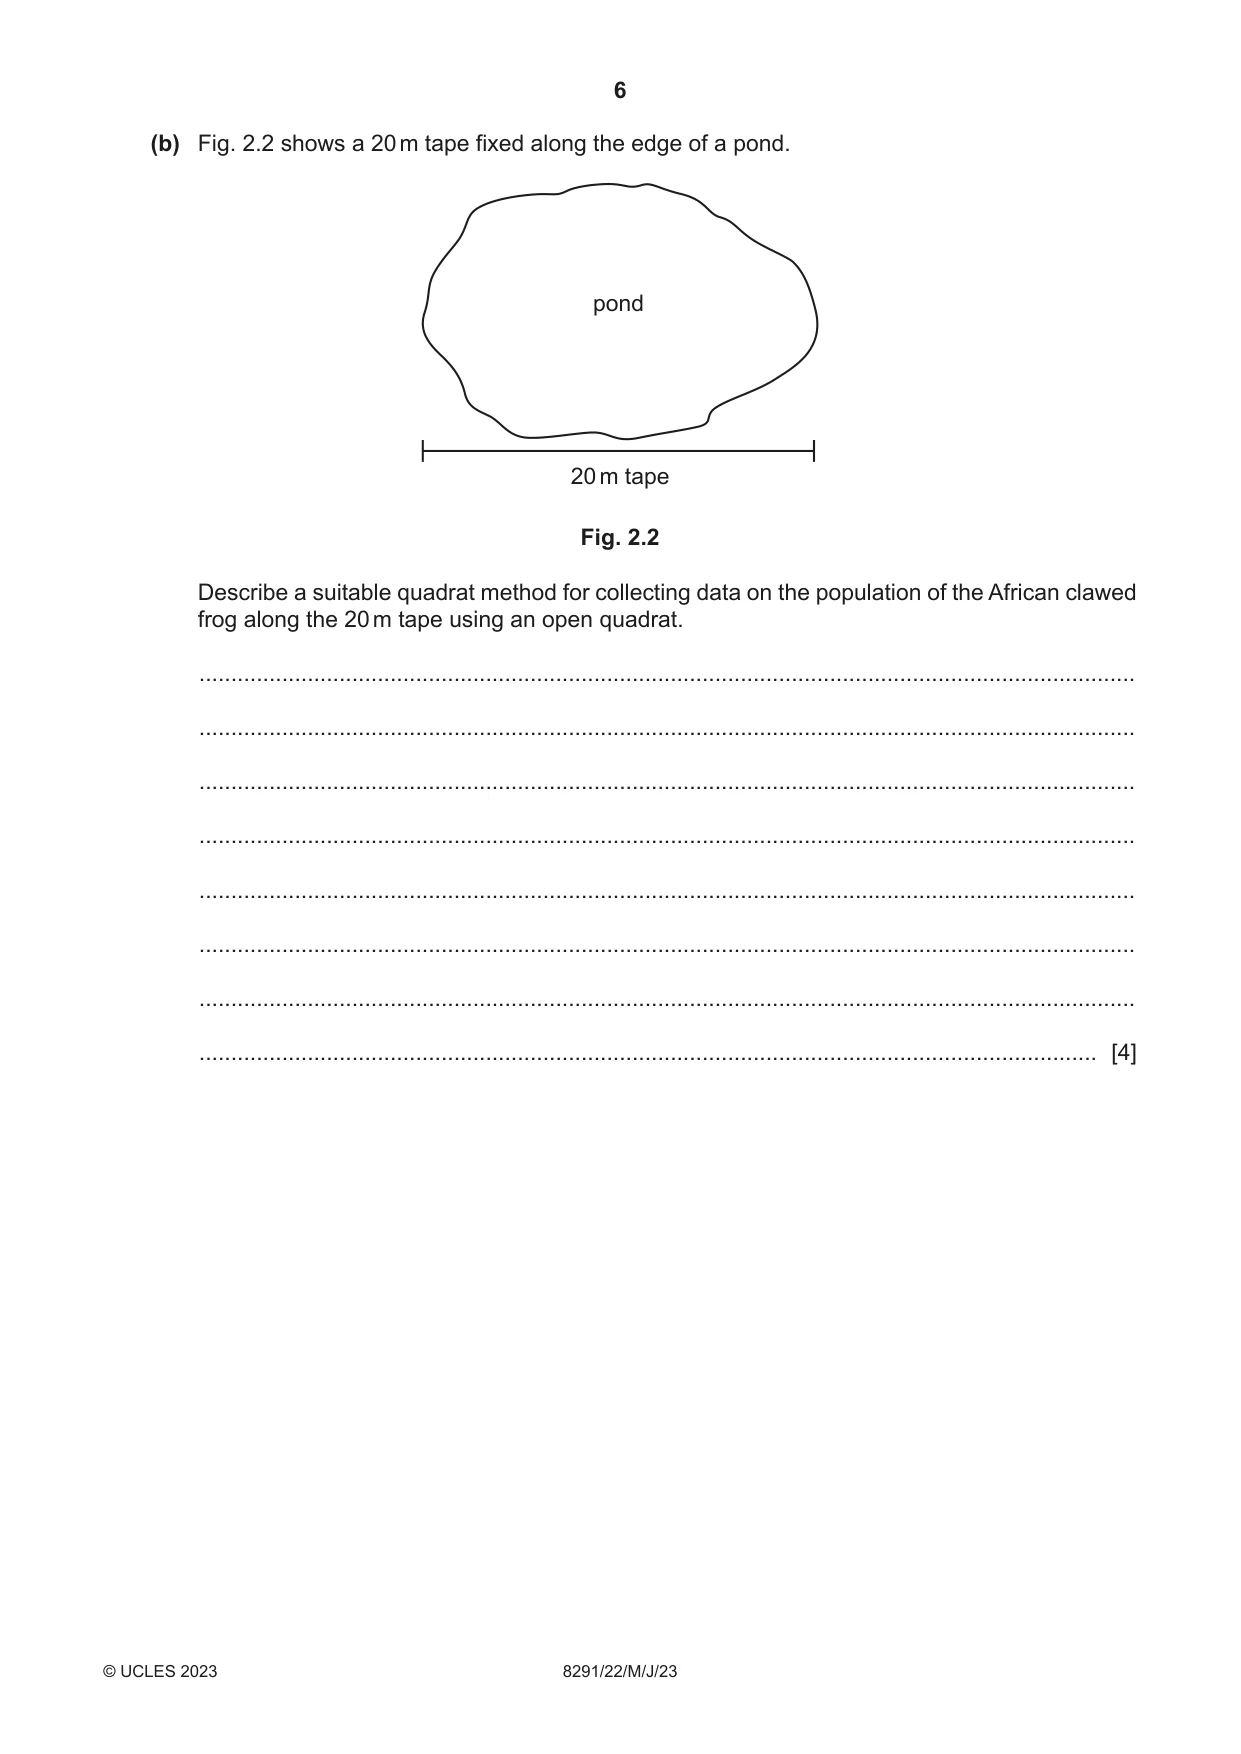
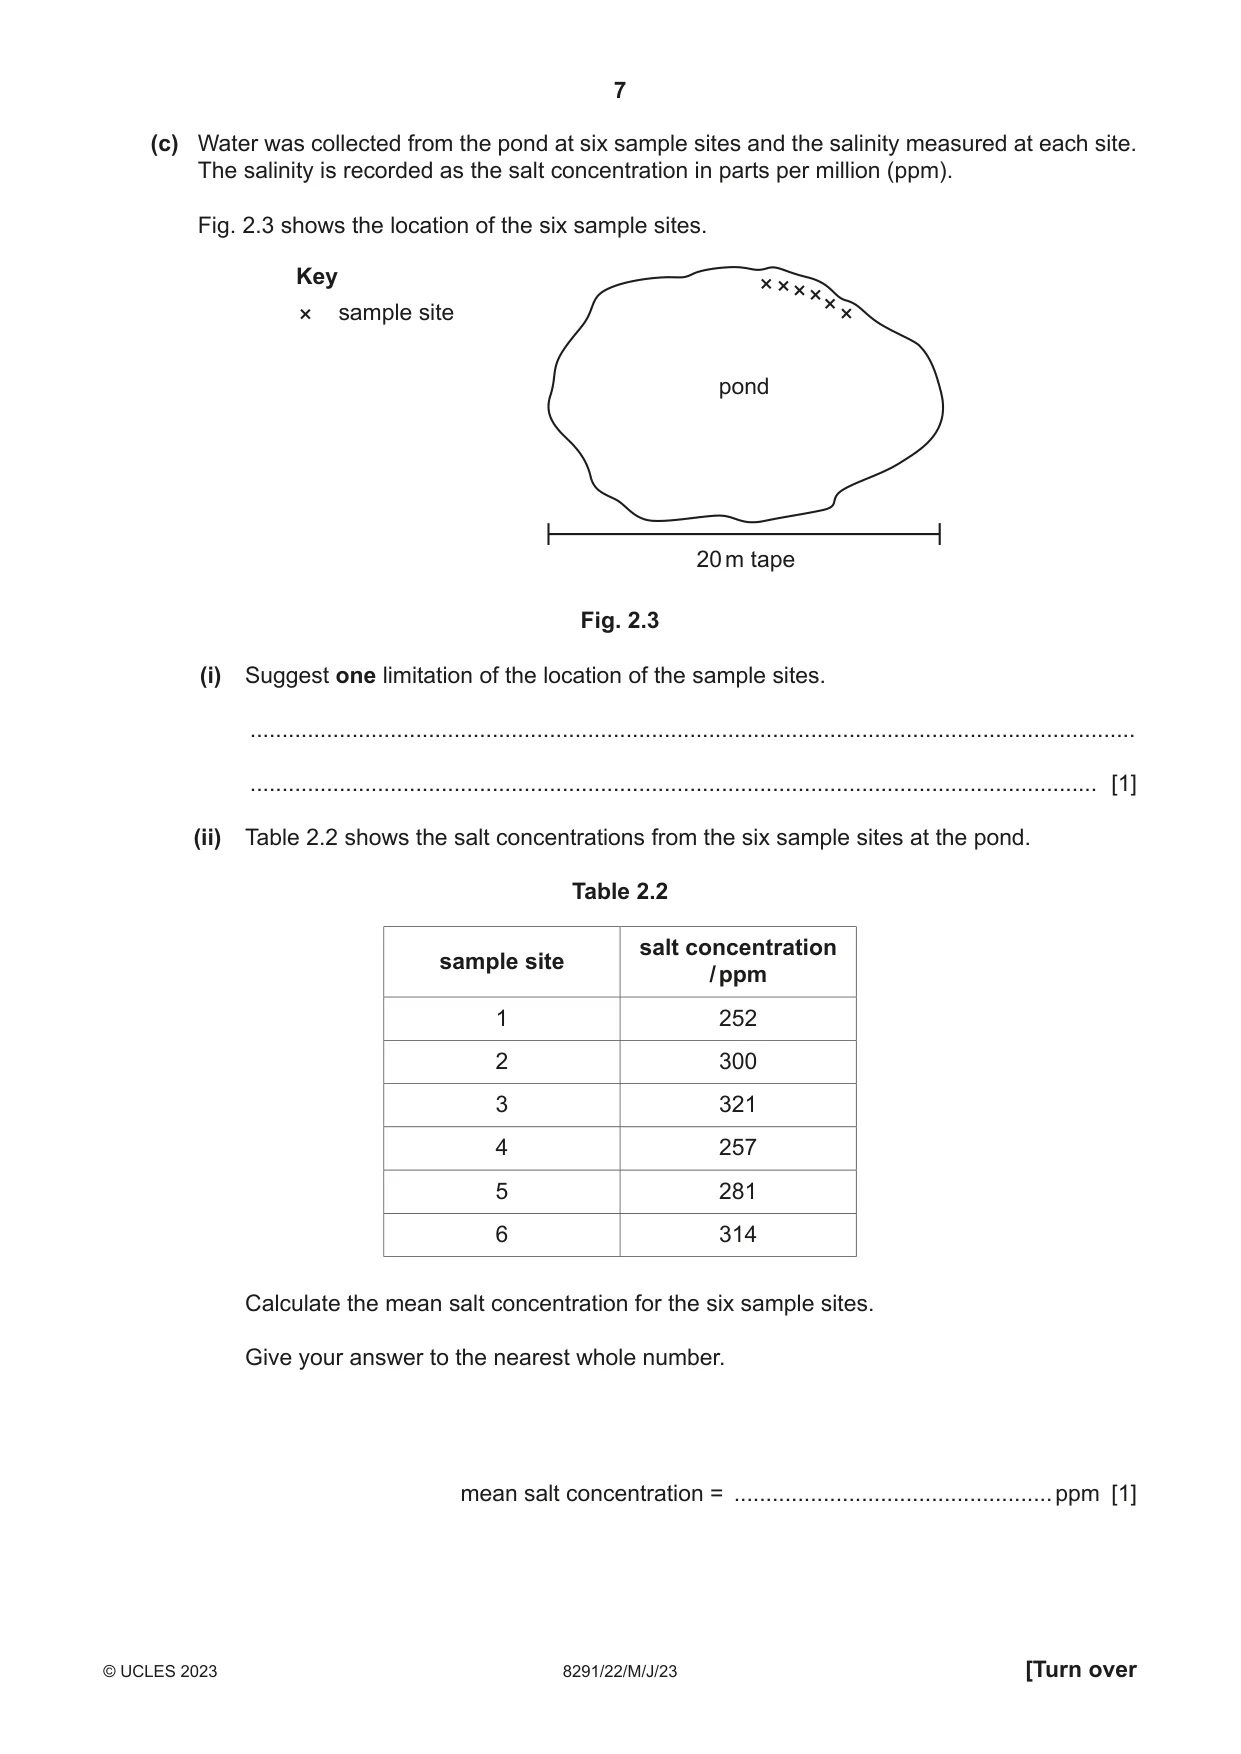
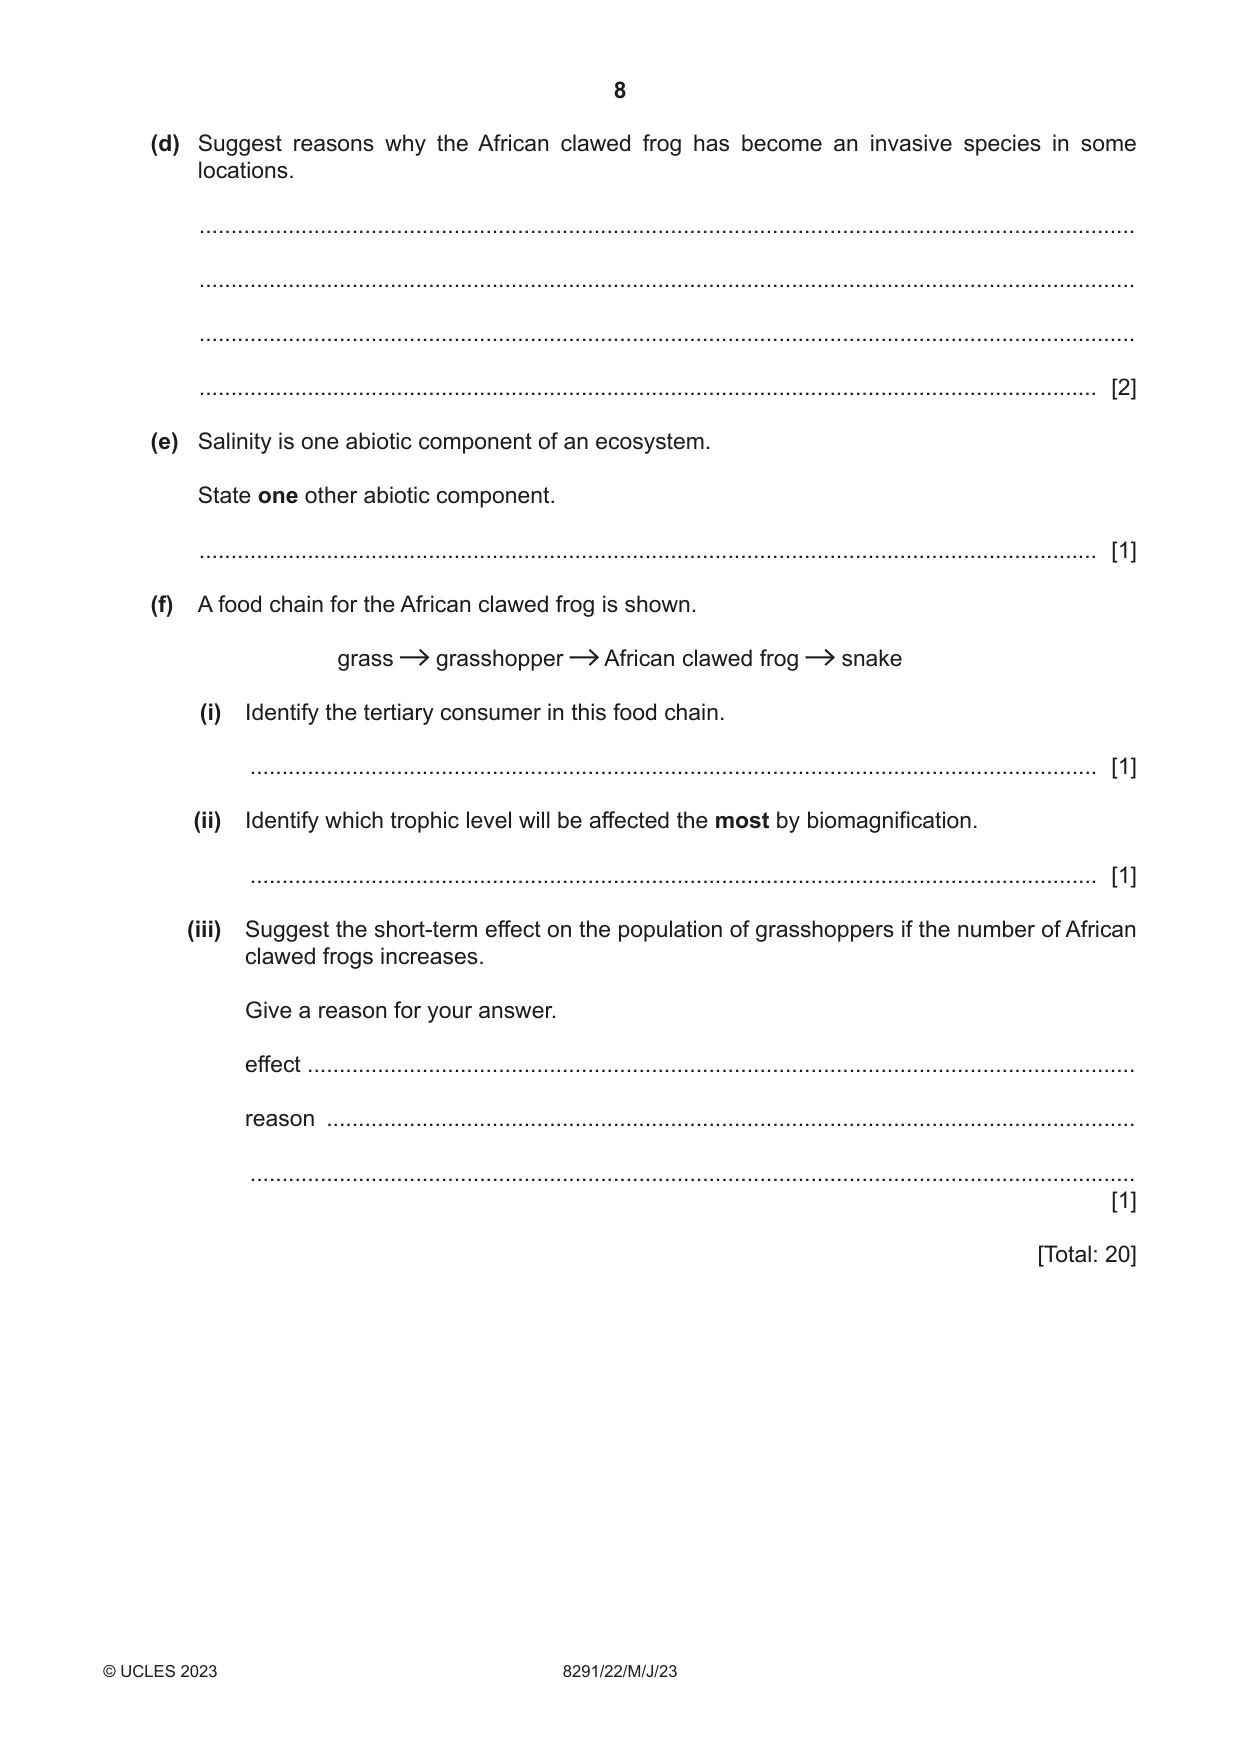
2 Fig. 2.1 shows the African clawed frog and tadpole. The frog is native to Africa. 1–5 cm 5–12 cm tadpole mature frog Fig. 2.1 The female African clawed frog typically lays between 500–2000 eggs at a time. Fertilised eggs hatch into tadpoles and the tadpoles change into frogs. (a) A researcher investigated the effect of artificial light on the African clawed frog. The researcher collected samples of fertilised eggs from five different female frogs, A, B, C, D and E. Artificial light was used on each sample for a different number of hours per day for 8 weeks. The number of adult frogs after 8 weeks was counted. The investigation was repeated with a different egg sample from the same five female frogs. The results are shown in Table 2.1. Table 2.1 artificial light number of adult frogs frog / hours per day investigation 1 investigation 2 mean A 0 205 307 256 B 4 198 3 198 C 8 200 250 225 D 16 105 111 108 E 24 83 89 86 (i) Calculate the range for the number of adult frogs from frog D. range = ......................................................... [1] (ii) Plot a bar chart of the mean number of adult frogs (y‑axis) against the hours of artificial light per day. [4] (iii) Suggest a reason why the result for frog B in investigation 2 was not included in the mean. ........................................................................................................................................... ..................................................................................................................................... [1] (iv) Use the data in Table 2.1 to write a suitable conclusion for the investigation. ........................................................................................................................................... ..................................................................................................................................... [1] (v) Describe one limitation of the method of egg sampling used in this investigation. ........................................................................................................................................... ..................................................................................................................................... [1] (b) Fig. 2.2 shows a 20 m tape fixed along the edge of a pond. pond 20 m tape Fig. 2.2 Describe a suitable quadrat method for collecting data on the population of the African clawed frog along the 20 m tape using an open quadrat. ................................................................................................................................................... ................................................................................................................................................... ................................................................................................................................................... ................................................................................................................................................... ................................................................................................................................................... ................................................................................................................................................... ................................................................................................................................................... ............................................................................................................................................. [4] (c) Water was collected from the pond at six sample sites and the salinity measured at each site. The salinity is recorded as the salt concentration in parts per million (ppm). Fig. 2.3 shows the location of the six sample sites. Key sample site pond 20 m tape Fig. 2.3 (i) Suggest one limitation of the location of the sample sites. ........................................................................................................................................... ..................................................................................................................................... [1] (ii) Table 2.2 shows the salt concentrations from the six sample sites at the pond. Table 2.2 salt concentration sample site / ppm 1 252 2 300 3 321 4 257 5 281 6 314 Calculate the mean salt concentration for the six sample sites. Give your answer to the nearest whole number. mean salt concentration = ..................................................ppm [1] (d) Suggest reasons why the African clawed frog has become an invasive species in some locations. ................................................................................................................................................... ................................................................................................................................................... ................................................................................................................................................... ............................................................................................................................................. [2] (e) Salinity is one abiotic component of an ecosystem. State one other abiotic component. ............................................................................................................................................. [1] (f) A food chain for the African clawed frog is shown. grass grasshopper African clawed frog snake (i) Identify the tertiary consumer in this food chain. ..................................................................................................................................... [1] (ii) Identify which trophic level will be affected the most by biomagnification. ..................................................................................................................................... [1] (iii) Suggest the short‑term effect on the population of grasshoppers if the number of African clawed frogs increases. Give a reason for your answer. effect .................................................................................................................................. reason ............................................................................................................................... ........................................................................................................................................... [1] [Total: 20]
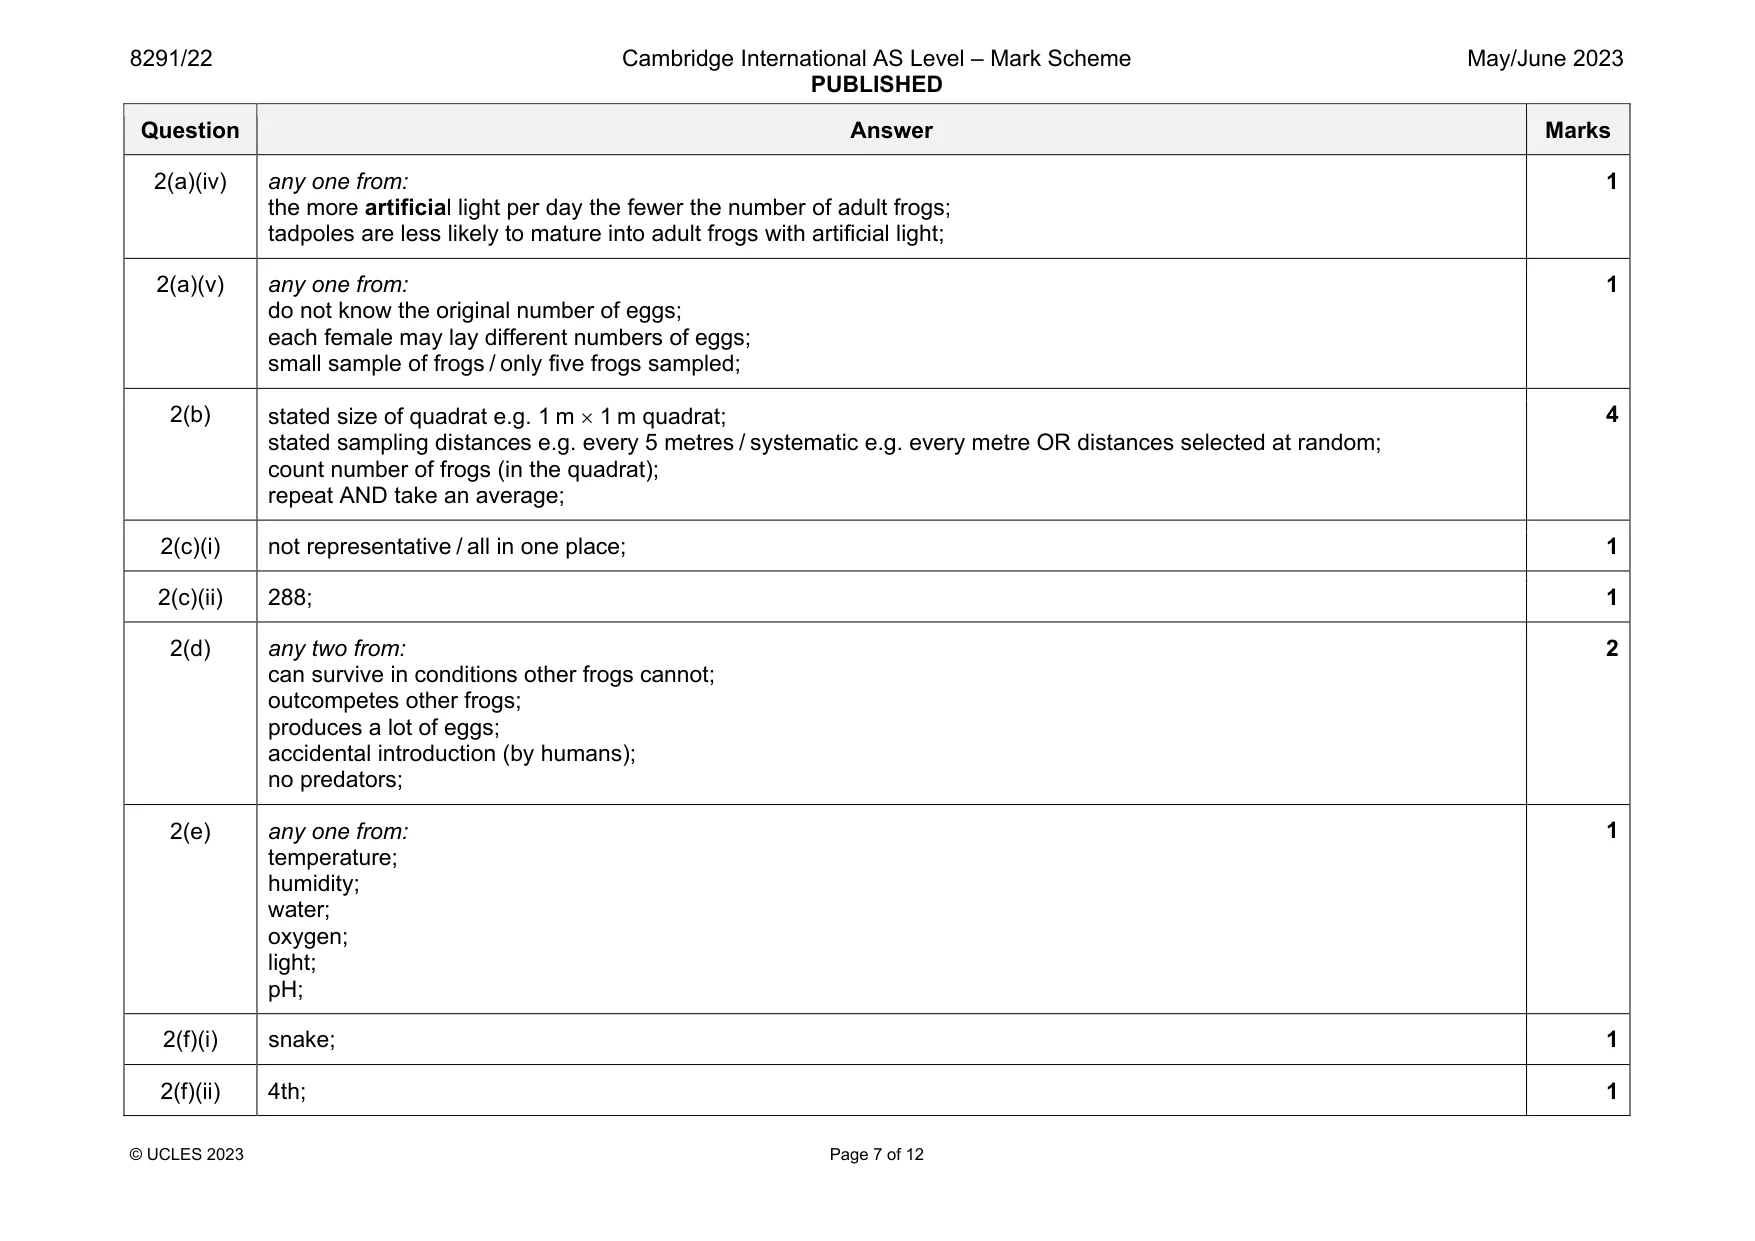
Mark scheme: 2(a)(i) 6; 1 2(a)(ii) sensible linear scale and data occupying over half the grid; axes labels AND unit; e.g. y-axis label:( mean) number of frogs AND x-axis: artificial light / hours per day 5 correct plotted points half small square; bars of equal width that are not touching; 4 2(a)(iii) anomalous result / outlier; 1 Question Answer Marks 2(a)(iv) any one from: the more artificial light per day the fewer the number of adult frogs; tadpoles are less likely to mature into adult frogs with artificial light; 1 2(a)(v) any one from: do not know the original number of eggs; each female may lay different numbers of eggs; small sample of frogs / only five frogs sampled; 1 2(b) stated size of quadrat e.g. 1 m 1 m quadrat; stated sampling distances e.g. every 5 metres / systematic e.g. every metre OR distances selected at random; count number of frogs (in the quadrat); repeat AND take an average; 4 2(c)(i) not representative / all in one place; 1 2(c)(ii) 288; 1 2(d) any two from: can survive in conditions other frogs cannot; outcompetes other frogs; produces a lot of eggs; accidental introduction (by humans); no predators; 2 2(e) any one from: temperature; humidity; water; oxygen; light; pH; 1 2(f)(i) snake; 1 2(f)(ii) 4th; 1 Question Answer Marks 2(f)(iii) decrease population AND, more predators / more are eaten; 1
More questions on Data collection techniques and data analysis
Question 3
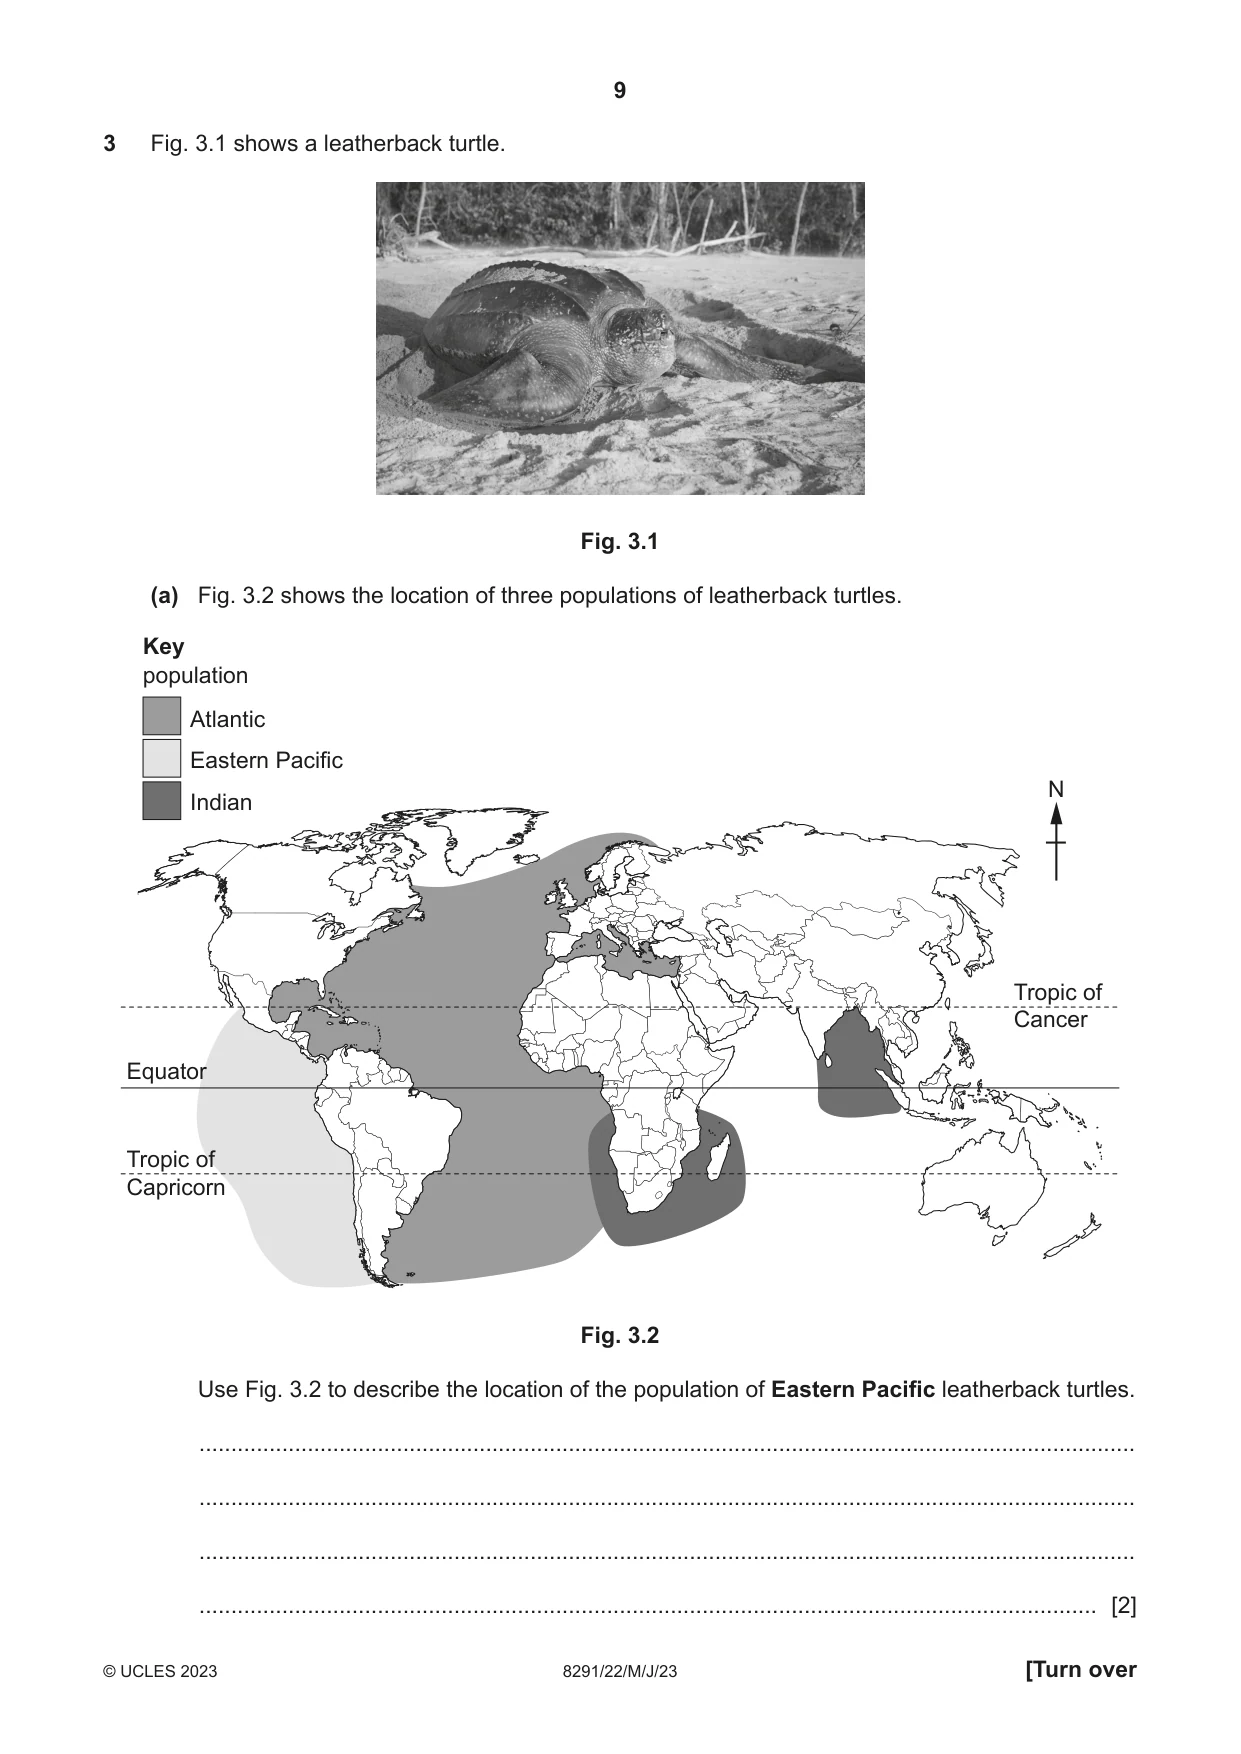
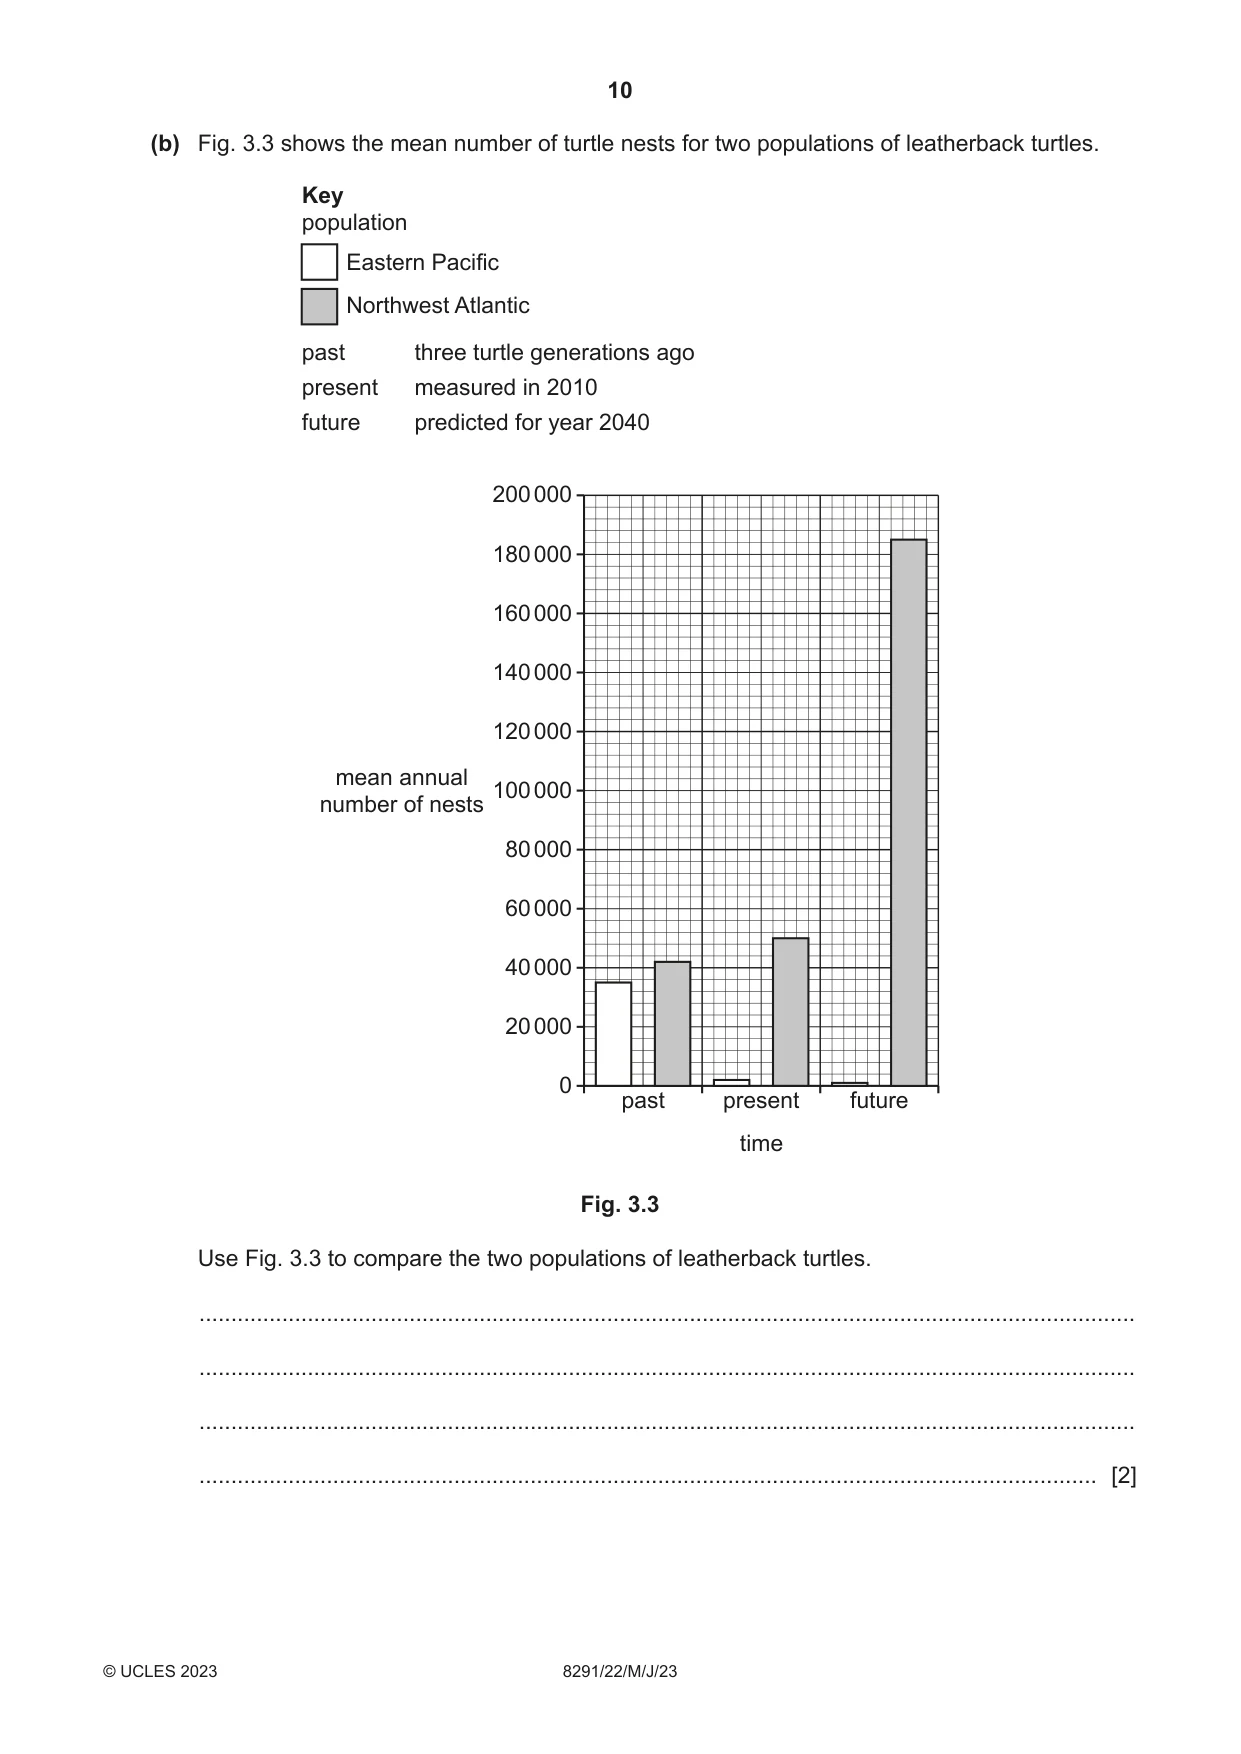
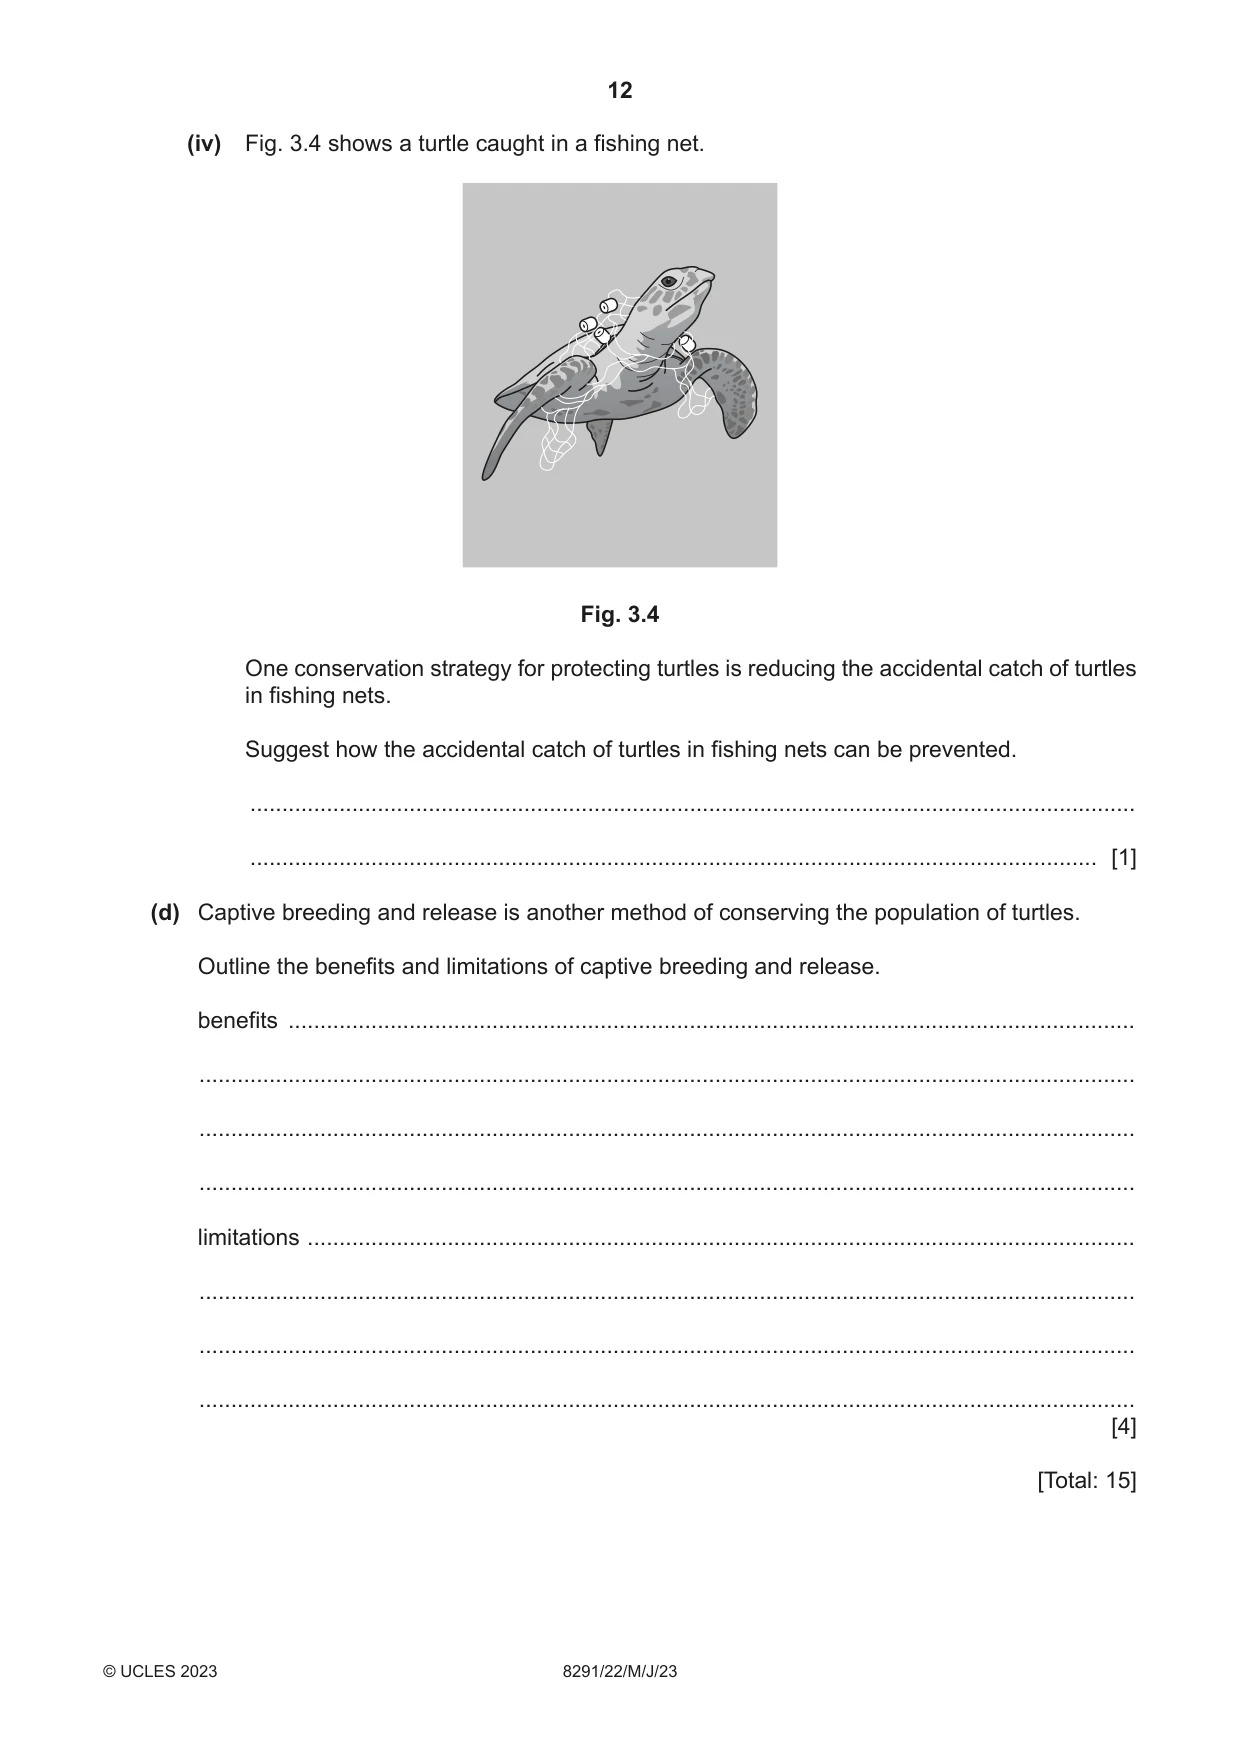
3 Fig. 3.1 shows a leatherback turtle. Fig. 3.1 (a) Fig. 3.2 shows the location of three populations of leatherback turtles. Key population Atlantic Eastern Pacific N Indian Tropic of Cancer Equator Tropic of Capricorn Fig. 3.2 Use Fig. 3.2 to describe the location of the population of Eastern Pacific leatherback turtles. ................................................................................................................................................... ................................................................................................................................................... ................................................................................................................................................... ............................................................................................................................................. [2] (b) Fig. 3.3 shows the mean number of turtle nests for two populations of leatherback turtles. Key population Eastern Pacific Northwest Atlantic past three turtle generations ago present measured in 2010 future predicted for year 2040 200 000 180 000 160 000 140 000 120 000 mean annual 100 000 number of nests 80 000 60 000 40 000 20 000 0 past present future time Fig. 3.3 Use Fig. 3.3 to compare the two populations of leatherback turtles. ................................................................................................................................................... ................................................................................................................................................... ................................................................................................................................................... ............................................................................................................................................. [2] (c) Climate change is a major threat to leatherback turtles. Higher sand temperature during egg incubation leads to a higher number of female turtles. (i) Explain why higher sand temperature can be a result of climate change. ........................................................................................................................................... ........................................................................................................................................... ........................................................................................................................................... ..................................................................................................................................... [2] (ii) Suggest the impact higher sand temperature has on the population of turtles. Give reasons for your answer. impact ................................................................................................................................ reasons ............................................................................................................................. ........................................................................................................................................... ........................................................................................................................................... [2] (iii) Suggest one other impact of climate change that could decrease the population of turtles. Give a reason for your answer. ........................................................................................................................................... ........................................................................................................................................... ........................................................................................................................................... ..................................................................................................................................... [2] (iv) Fig. 3.4 shows a turtle caught in a fishing net. Fig. 3.4 One conservation strategy for protecting turtles is reducing the accidental catch of turtles in fishing nets. Suggest how the accidental catch of turtles in fishing nets can be prevented. ........................................................................................................................................... ..................................................................................................................................... [1] (d) Captive breeding and release is another method of conserving the population of turtles. Outline the benefits and limitations of captive breeding and release. benefits ..................................................................................................................................... ................................................................................................................................................... ................................................................................................................................................... ................................................................................................................................................... limitations .................................................................................................................................. ................................................................................................................................................... ................................................................................................................................................... ................................................................................................................................................... [4] [Total: 15]
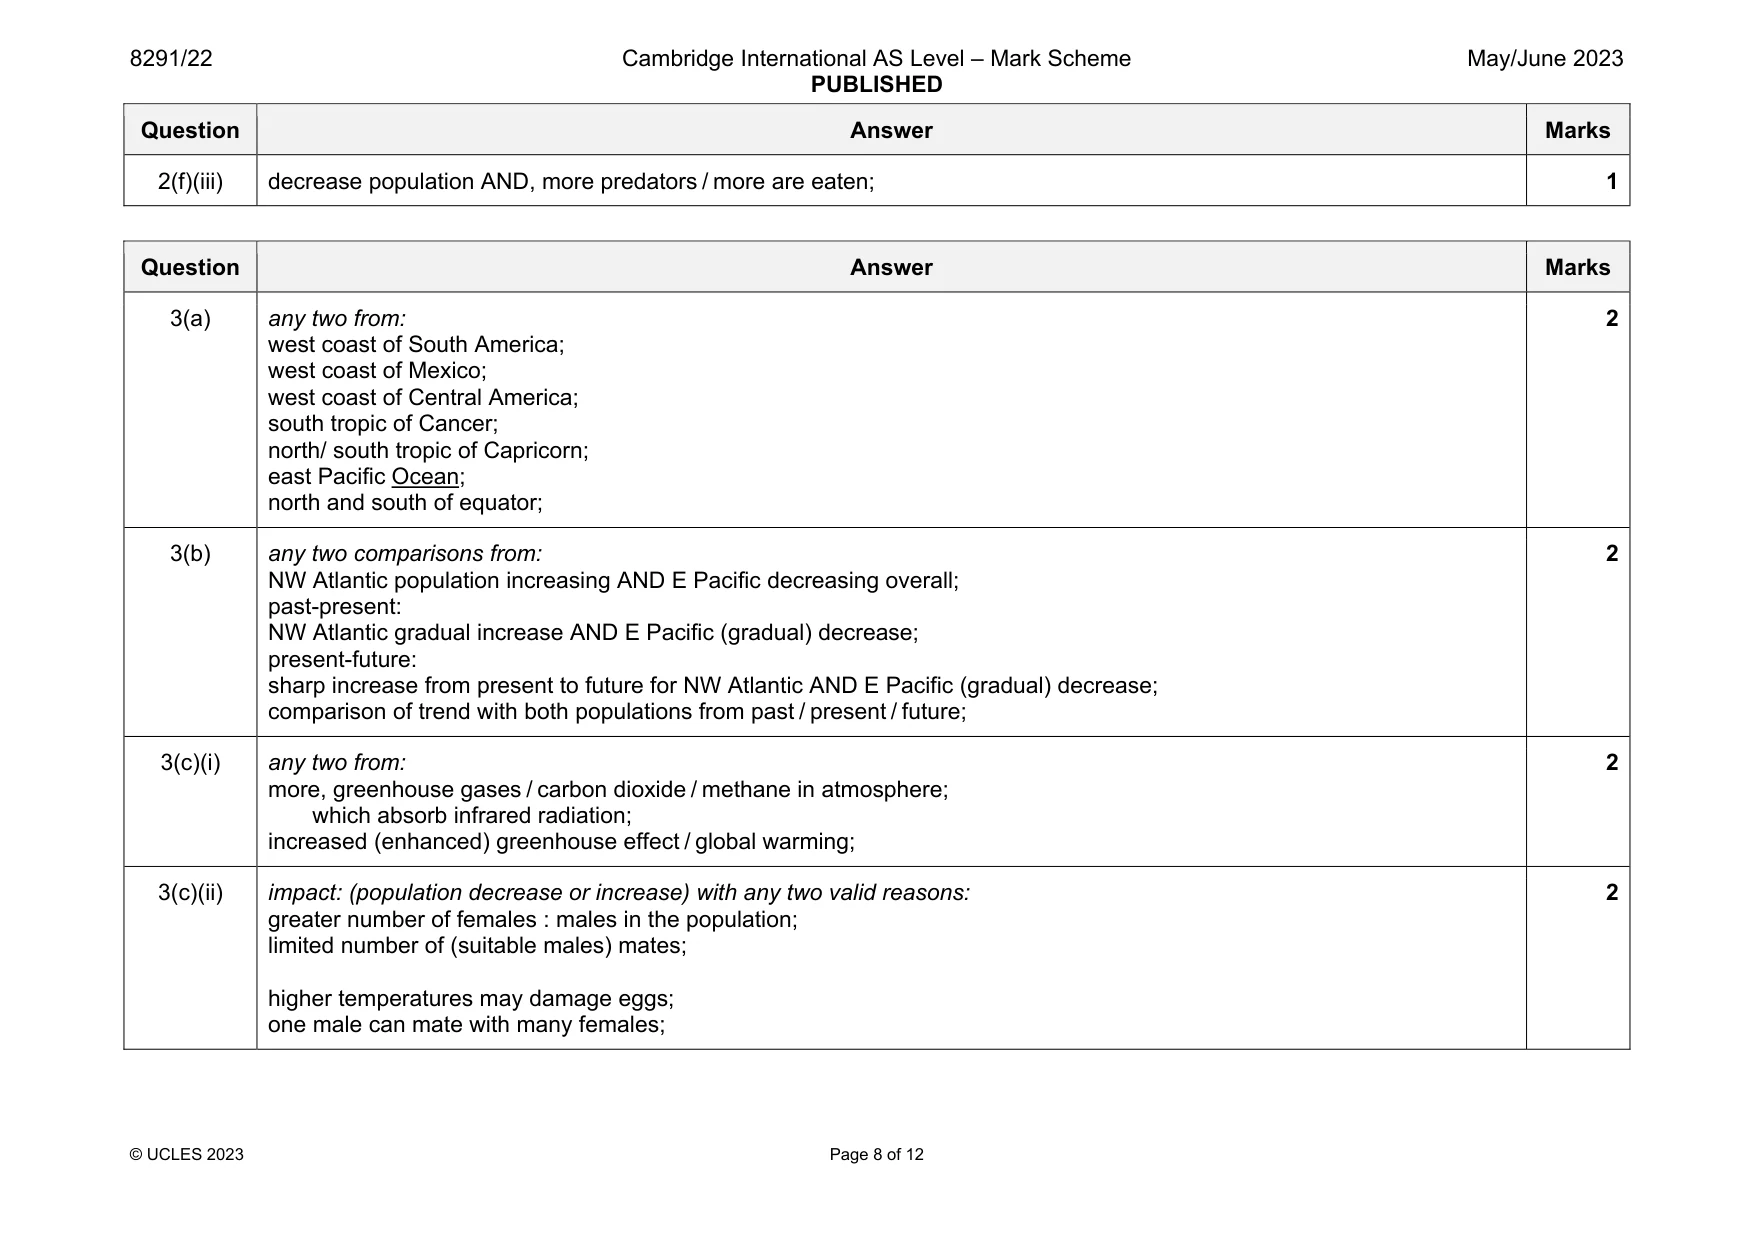
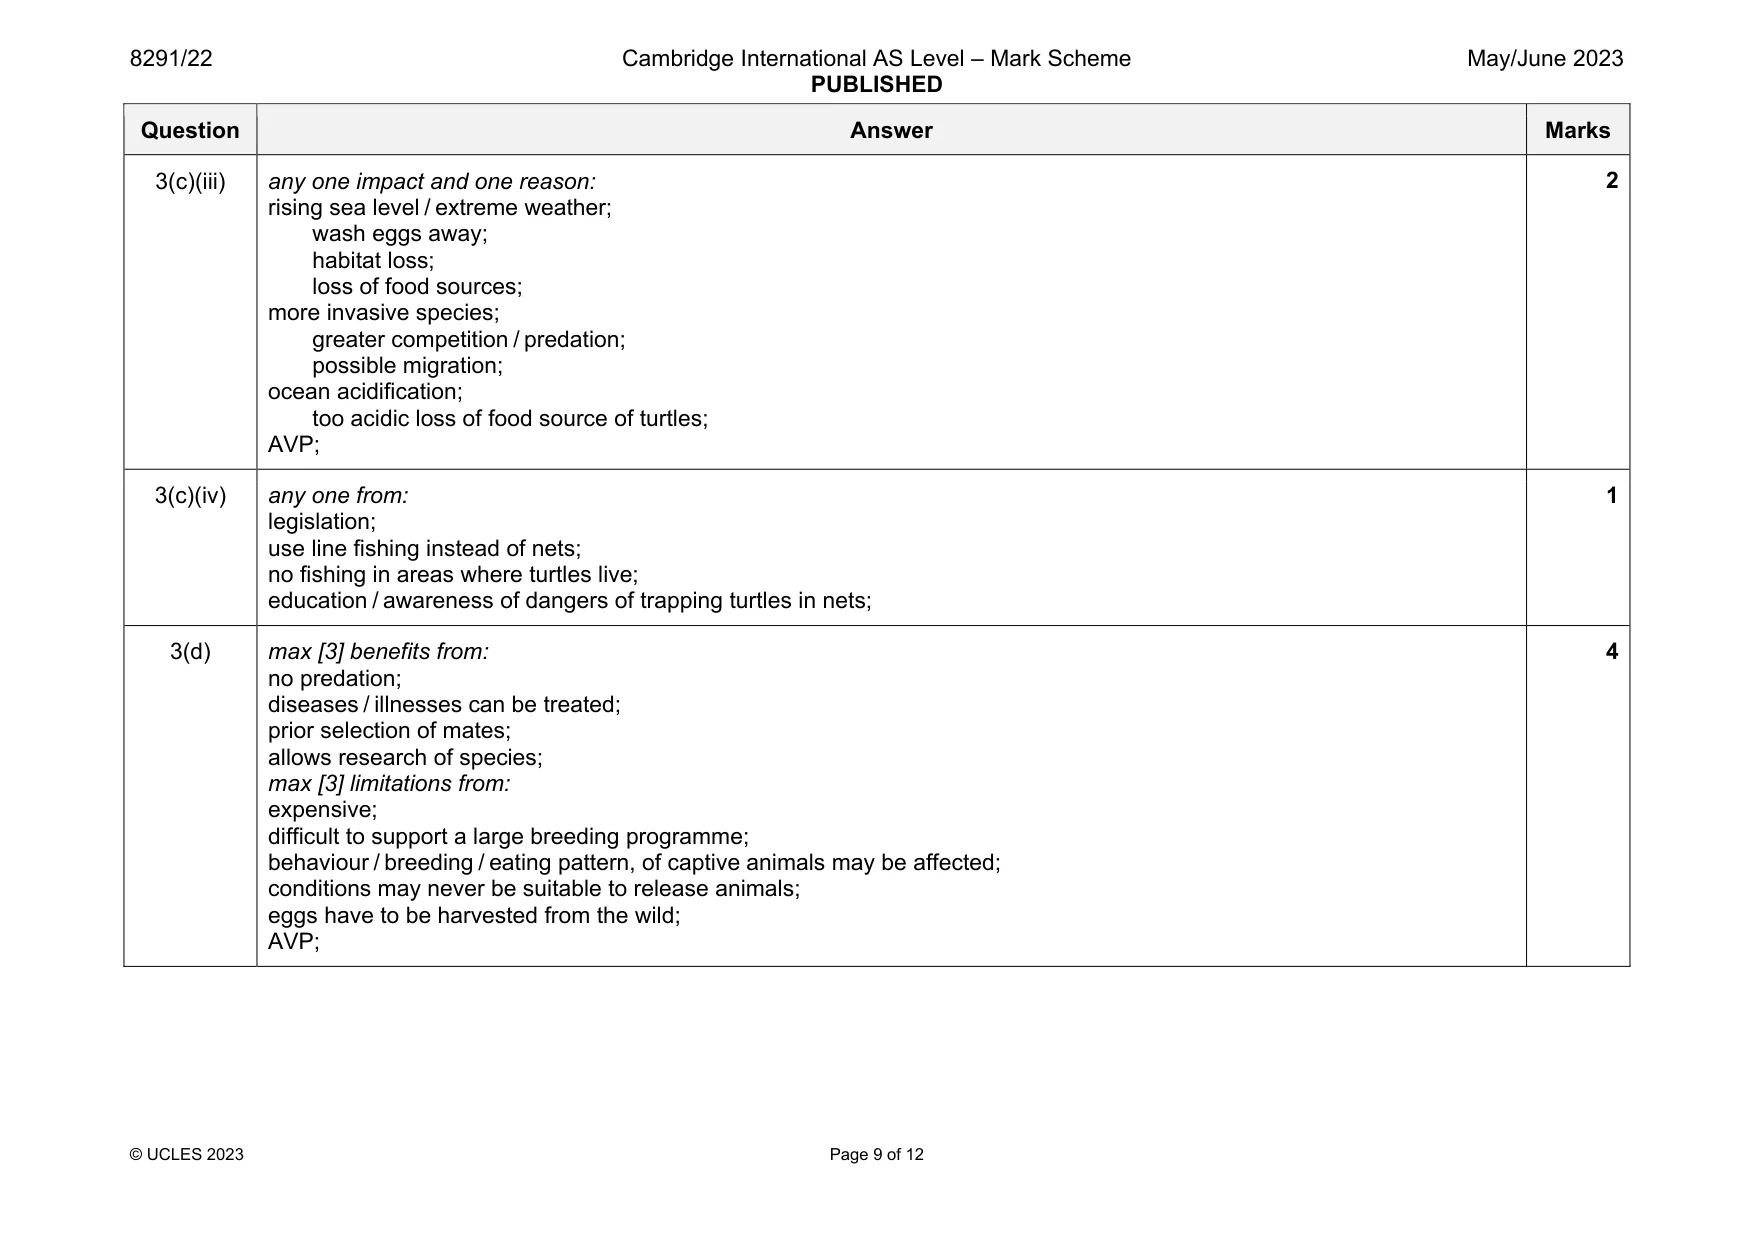
Mark scheme: 3(a) any two from: west coast of South America; west coast of Mexico; west coast of Central America; south tropic of Cancer; north/ south tropic of Capricorn; east Pacific Ocean; north and south of equator; 2 3(b) any two comparisons from: NW Atlantic population increasing AND E Pacific decreasing overall; past-present: NW Atlantic gradual increase AND E Pacific (gradual) decrease; present-future: sharp increase from present to future for NW Atlantic AND E Pacific (gradual) decrease; comparison of trend with both populations from past / present / future; 2 3(c)(i) any two from: more, greenhouse gases / carbon dioxide / methane in atmosphere; which absorb infrared radiation; increased (enhanced) greenhouse effect / global warming; 2 3(c)(ii) impact: (population decrease or increase) with any two valid reasons: greater number of females : males in the population; limited number of (suitable males) mates; higher temperatures may damage eggs; one male can mate with many females; 2 Question Answer Marks 3(c)(iii) any one impact and one reason: rising sea level / extreme weather; wash eggs away; habitat loss; loss of food sources; more invasive species; greater competition / predation; possible migration; ocean acidification; too acidic loss of food source of turtles; AVP; 2 3(c)(iv) any one from: legislation; use line fishing instead of nets; no fishing in areas where turtles live; education / awareness of dangers of trapping turtles in nets; 1 3(d) max [3] benefits from: no predation; diseases / illnesses can be treated; prior selection of mates; allows research of species; max [3] limitations from: expensive; difficult to support a large breeding programme; behaviour / breeding / eating pattern, of captive animals may be affected; conditions may never be suitable to release animals; eggs have to be harvested from the wild; AVP; 4
Q4 · CFCs such as CFC‑12 are not used in new equipment because of their ozone depletion…
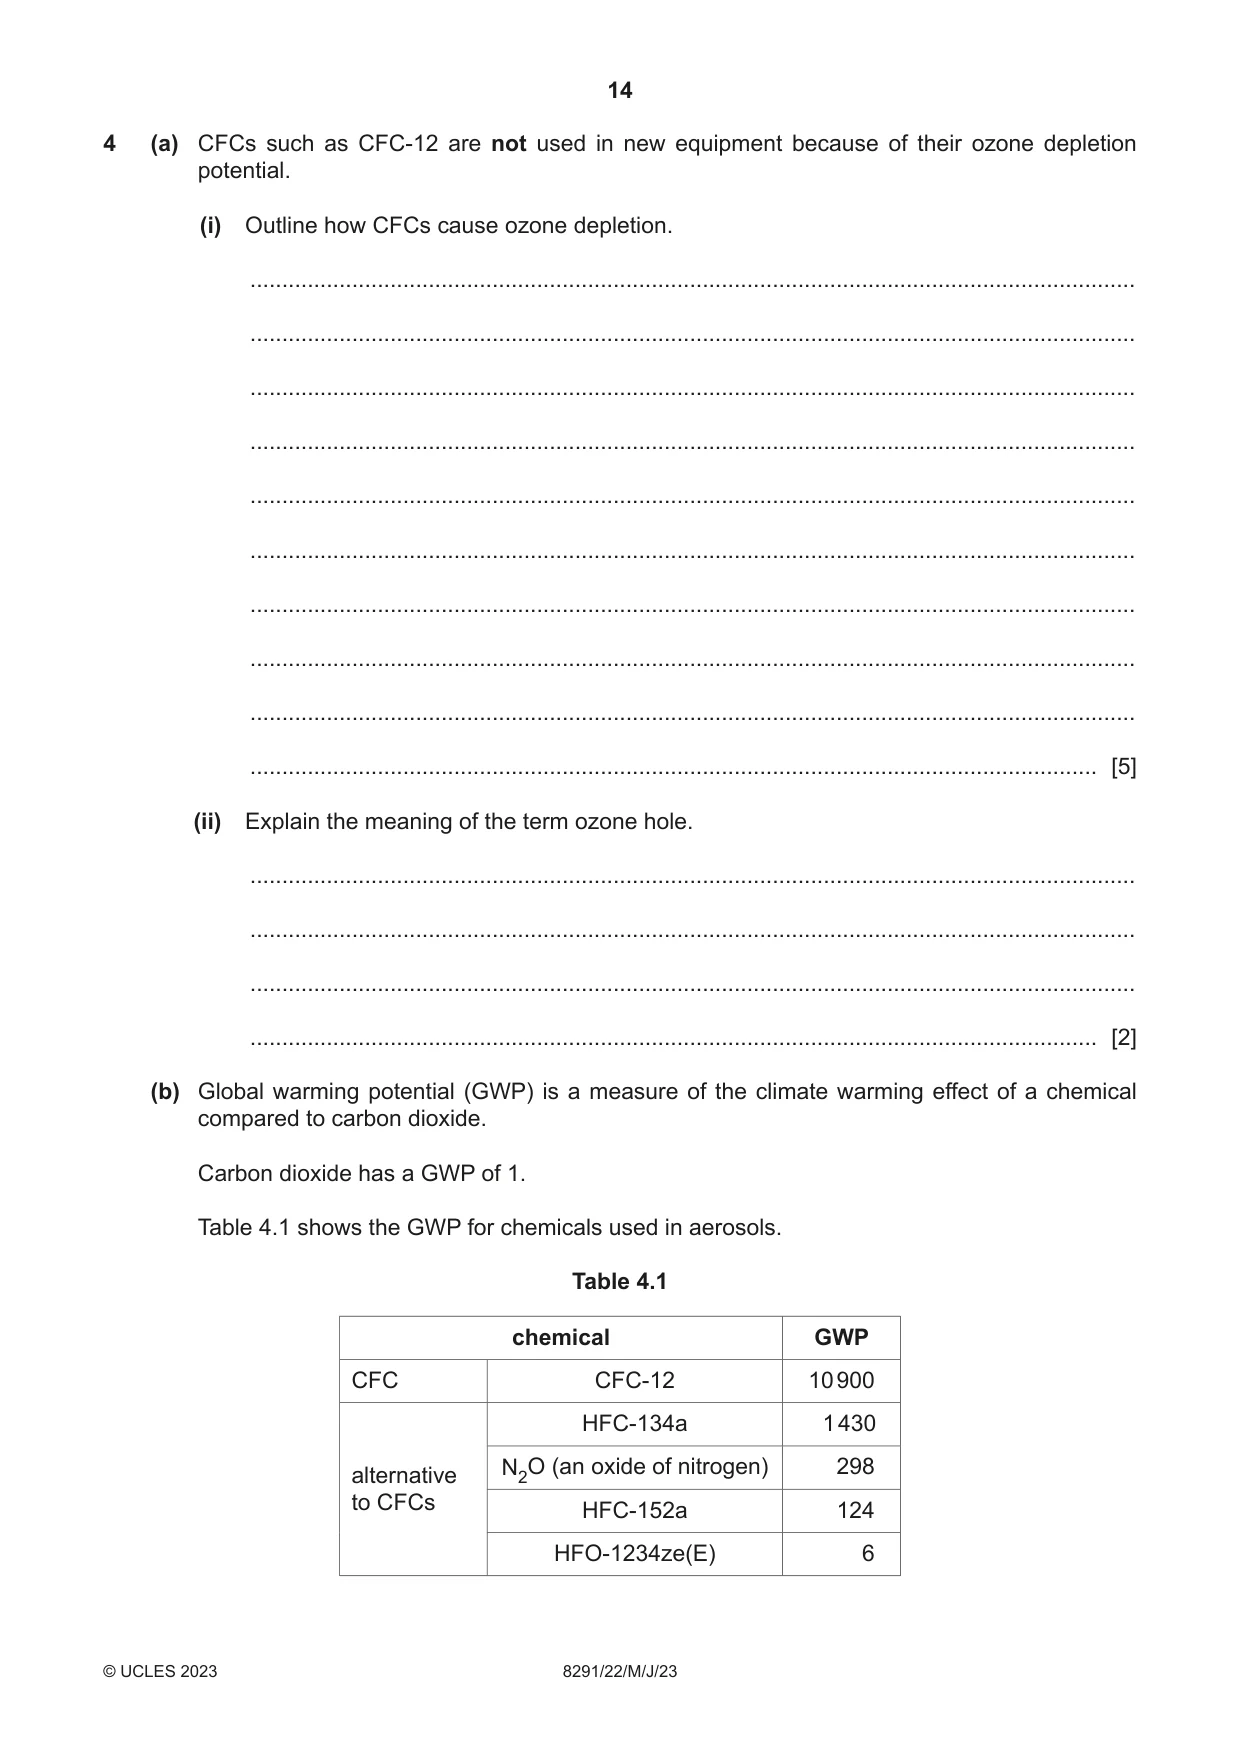
4 (a) CFCs such as CFC‑12 are not used in new equipment because of their ozone depletion potential. (i) Outline how CFCs cause ozone depletion. ........................................................................................................................................... ........................................................................................................................................... ........................................................................................................................................... ........................................................................................................................................... ........................................................................................................................................... ........................................................................................................................................... ........................................................................................................................................... ........................................................................................................................................... ........................................................................................................................................... ..................................................................................................................................... [5] (ii) Explain the meaning of the term ozone hole. ........................................................................................................................................... ........................................................................................................................................... ........................................................................................................................................... ..................................................................................................................................... [2] (b) Global warming potential (GWP) is a measure of the climate warming effect of a chemical compared to carbon dioxide. Carbon dioxide has a GWP of 1. Table 4.1 shows the GWP for chemicals used in aerosols. Table 4.1 chemical GWP CFC CFC‑12 10 900 HFC‑134a 1 430 alternative N2O (an oxide of nitrogen) 298 to CFCs HFC‑152a 124 HFO‑1234ze(E) 6 (i) Alternatives to CFCs were introduced to limit ozone depletion. Suggest other impacts associated with the use of some alternatives to CFCs. Use data from Table 4.1 to support your answer. ........................................................................................................................................... ........................................................................................................................................... ........................................................................................................................................... ........................................................................................................................................... ........................................................................................................................................... ........................................................................................................................................... ........................................................................................................................................... ..................................................................................................................................... [4] (ii) The use of CFCs was gradually phased out. Suggest reasons why a complete ban was not immediately introduced as soon as the evidence for their role in ozone depletion was understood. ........................................................................................................................................... ........................................................................................................................................... ........................................................................................................................................... ........................................................................................................................................... ........................................................................................................................................... ..................................................................................................................................... [3] [Total: 14]
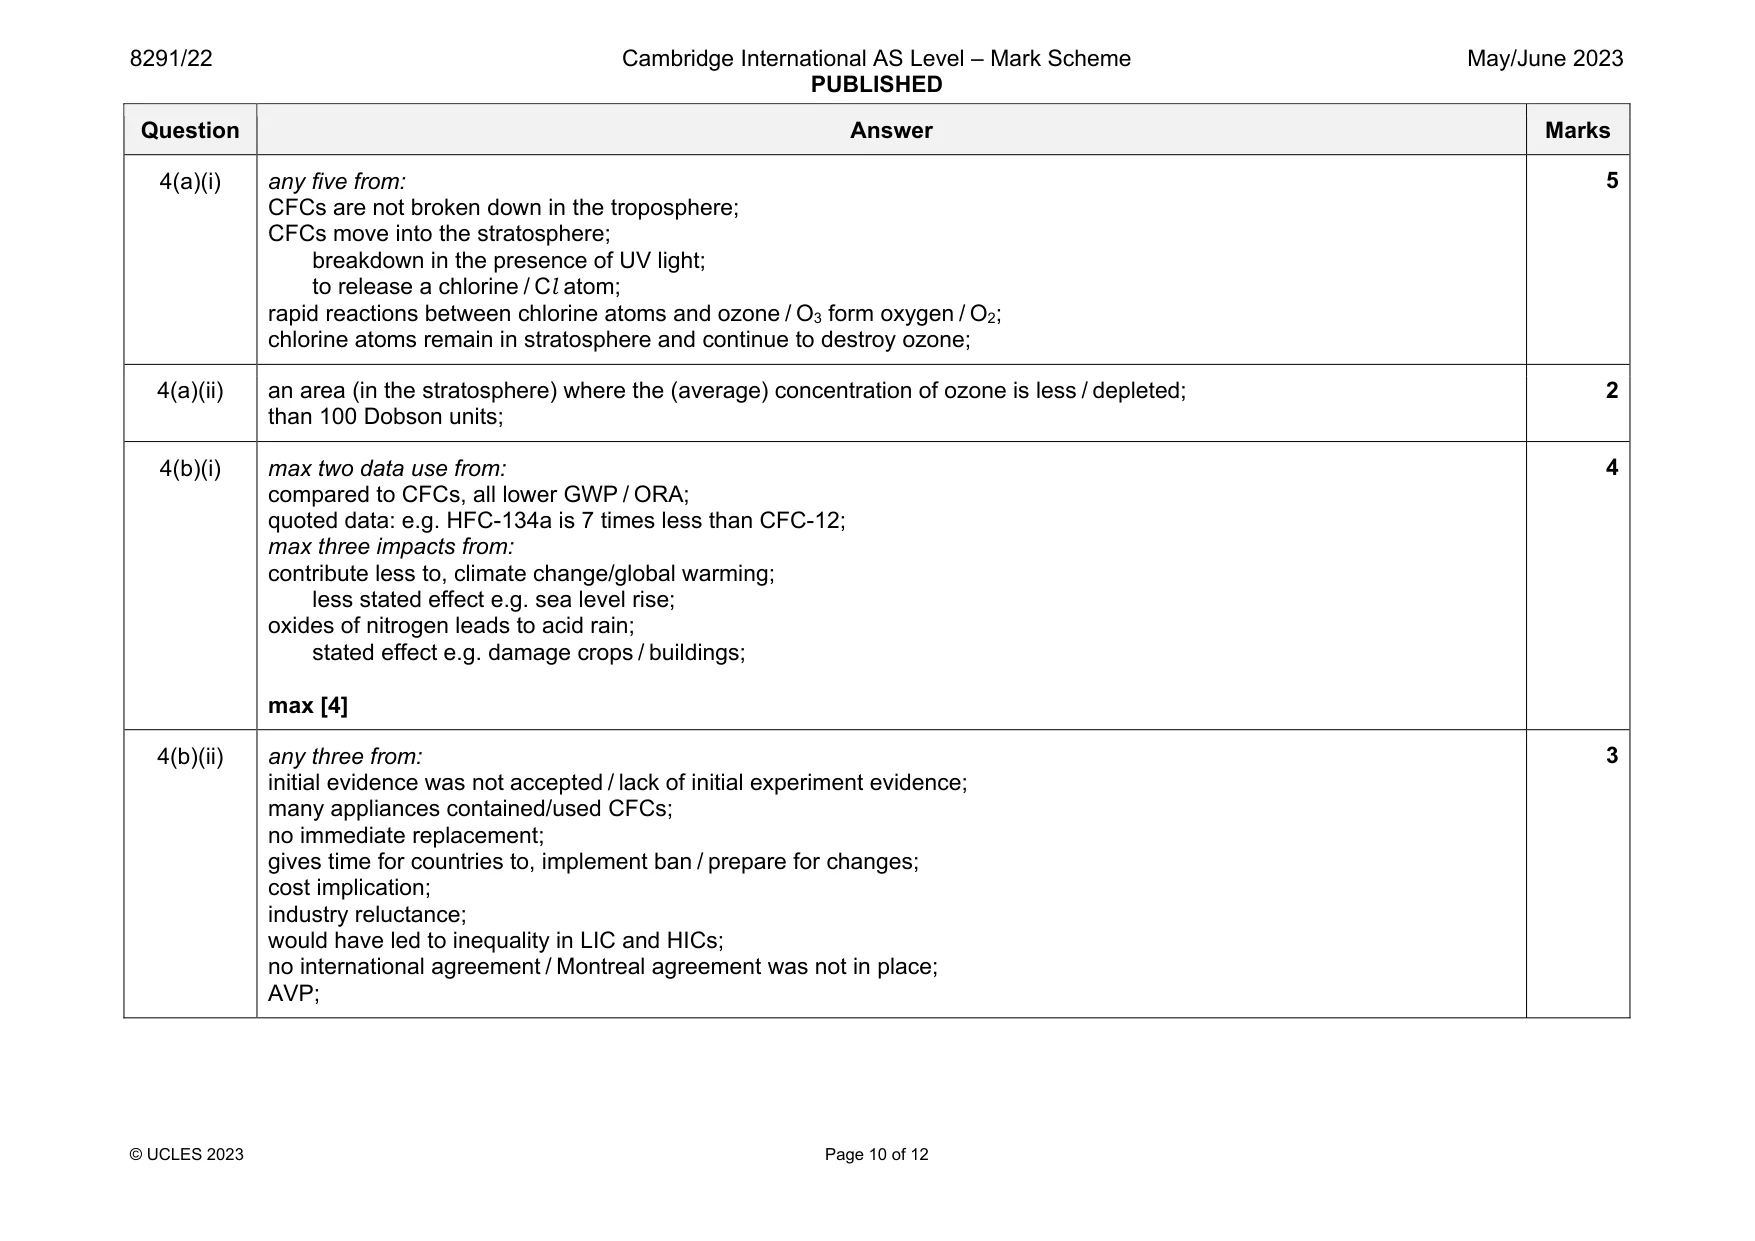
Mark scheme: 4(a)(i) any five from: CFCs are not broken down in the troposphere; CFCs move into the stratosphere; breakdown in the presence of UV light; to release a chlorine / Cl atom; rapid reactions between chlorine atoms and ozone / O3 form oxygen / O2; chlorine atoms remain in stratosphere and continue to destroy ozone; 4(a)(ii) an area (in the stratosphere) where the (average) concentration of ozone is less / depleted; than 100 Dobson units; 2 4(b)(i) max two data use from: compared to CFCs, all lower GWP / ORA; quoted data: e.g. HFC-134a is 7 times less than CFC-12; max three impacts from: contribute less to, climate change/global warming; less stated effect e.g. sea level rise; oxides of nitrogen leads to acid rain; stated effect e.g. damage crops / buildings; max [4] 4 4(b)(ii) any three from: initial evidence was not accepted / lack of initial experiment evidence; many appliances contained/used CFCs; no immediate replacement; gives time for countries to, implement ban / prepare for changes; cost implication; industry reluctance; would have led to inequality in LIC and HICs; no international agreement / Montreal agreement was not in place; AVP; 3
Q5 · It is estimated that air pollution kills seven million people per year
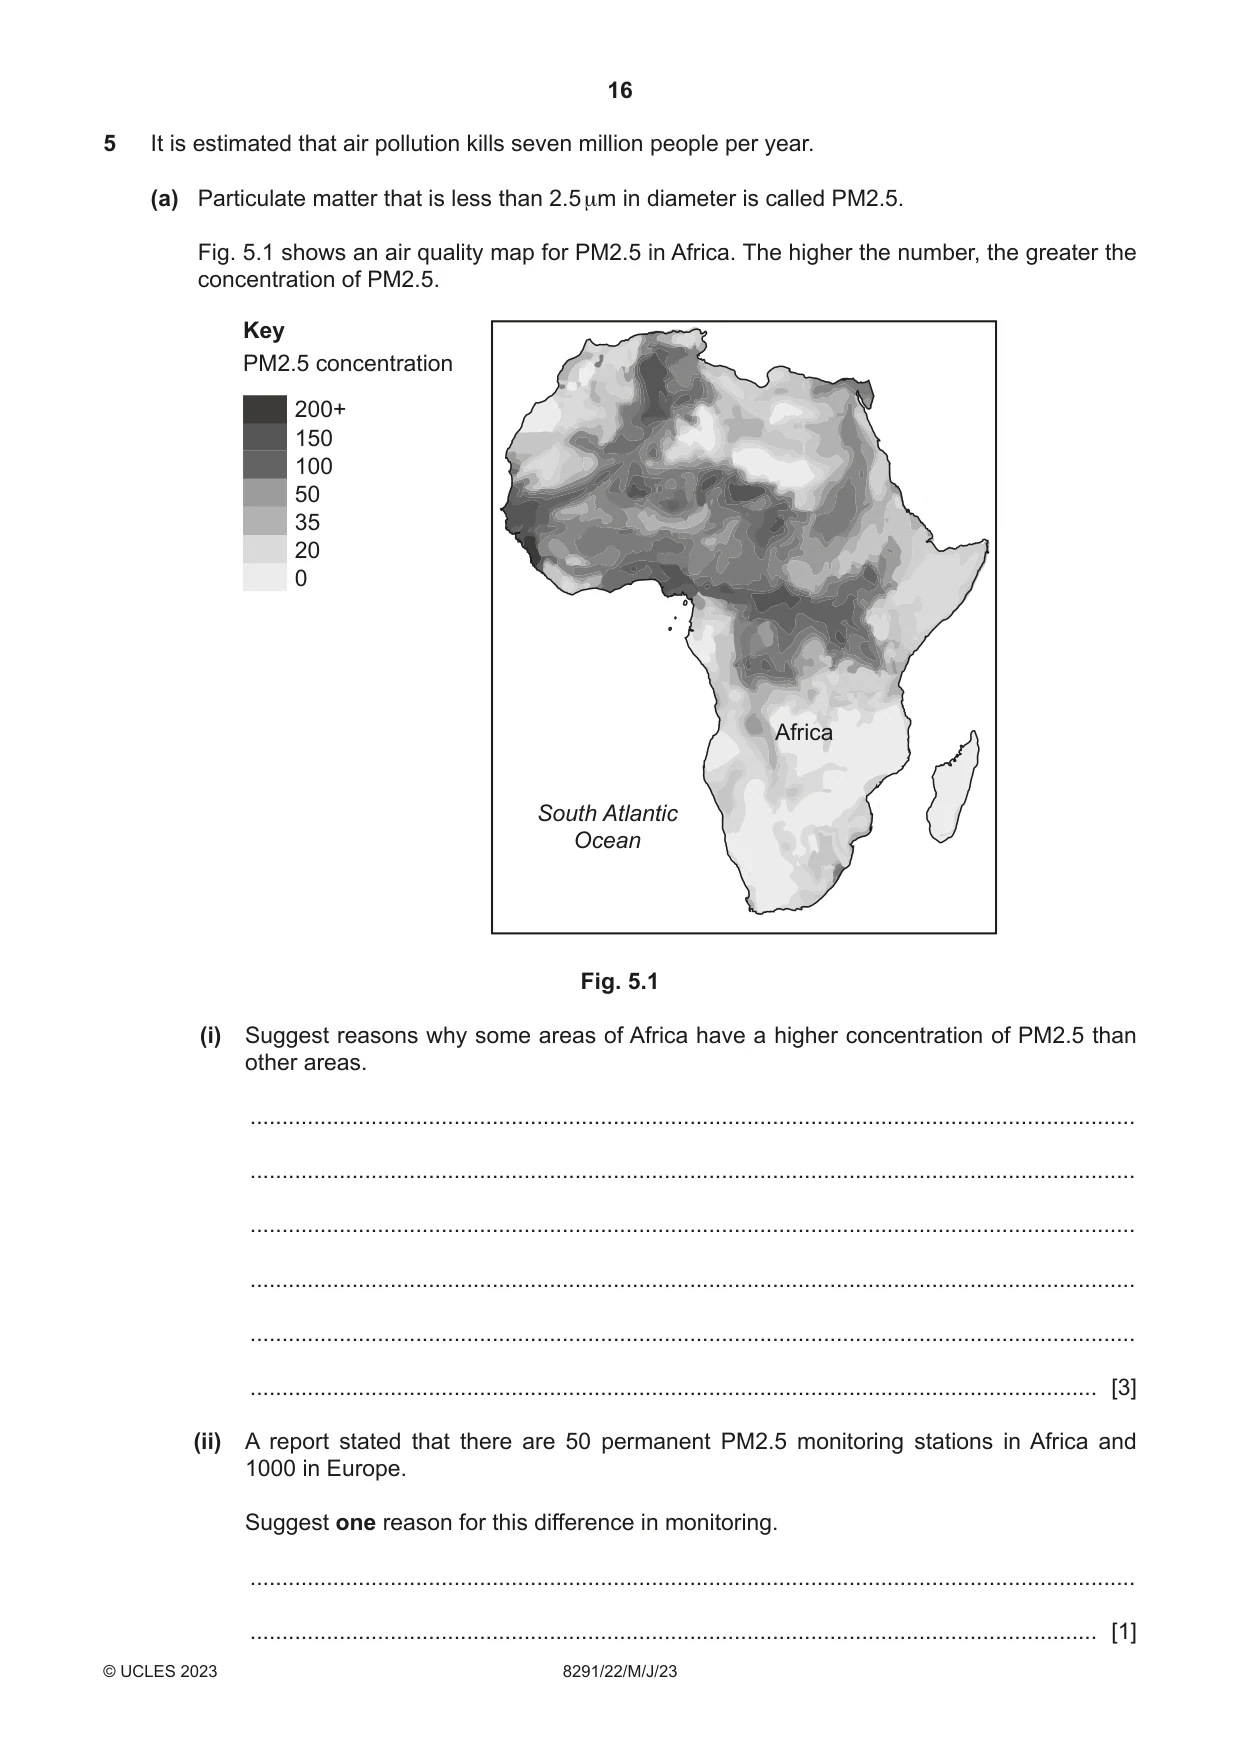
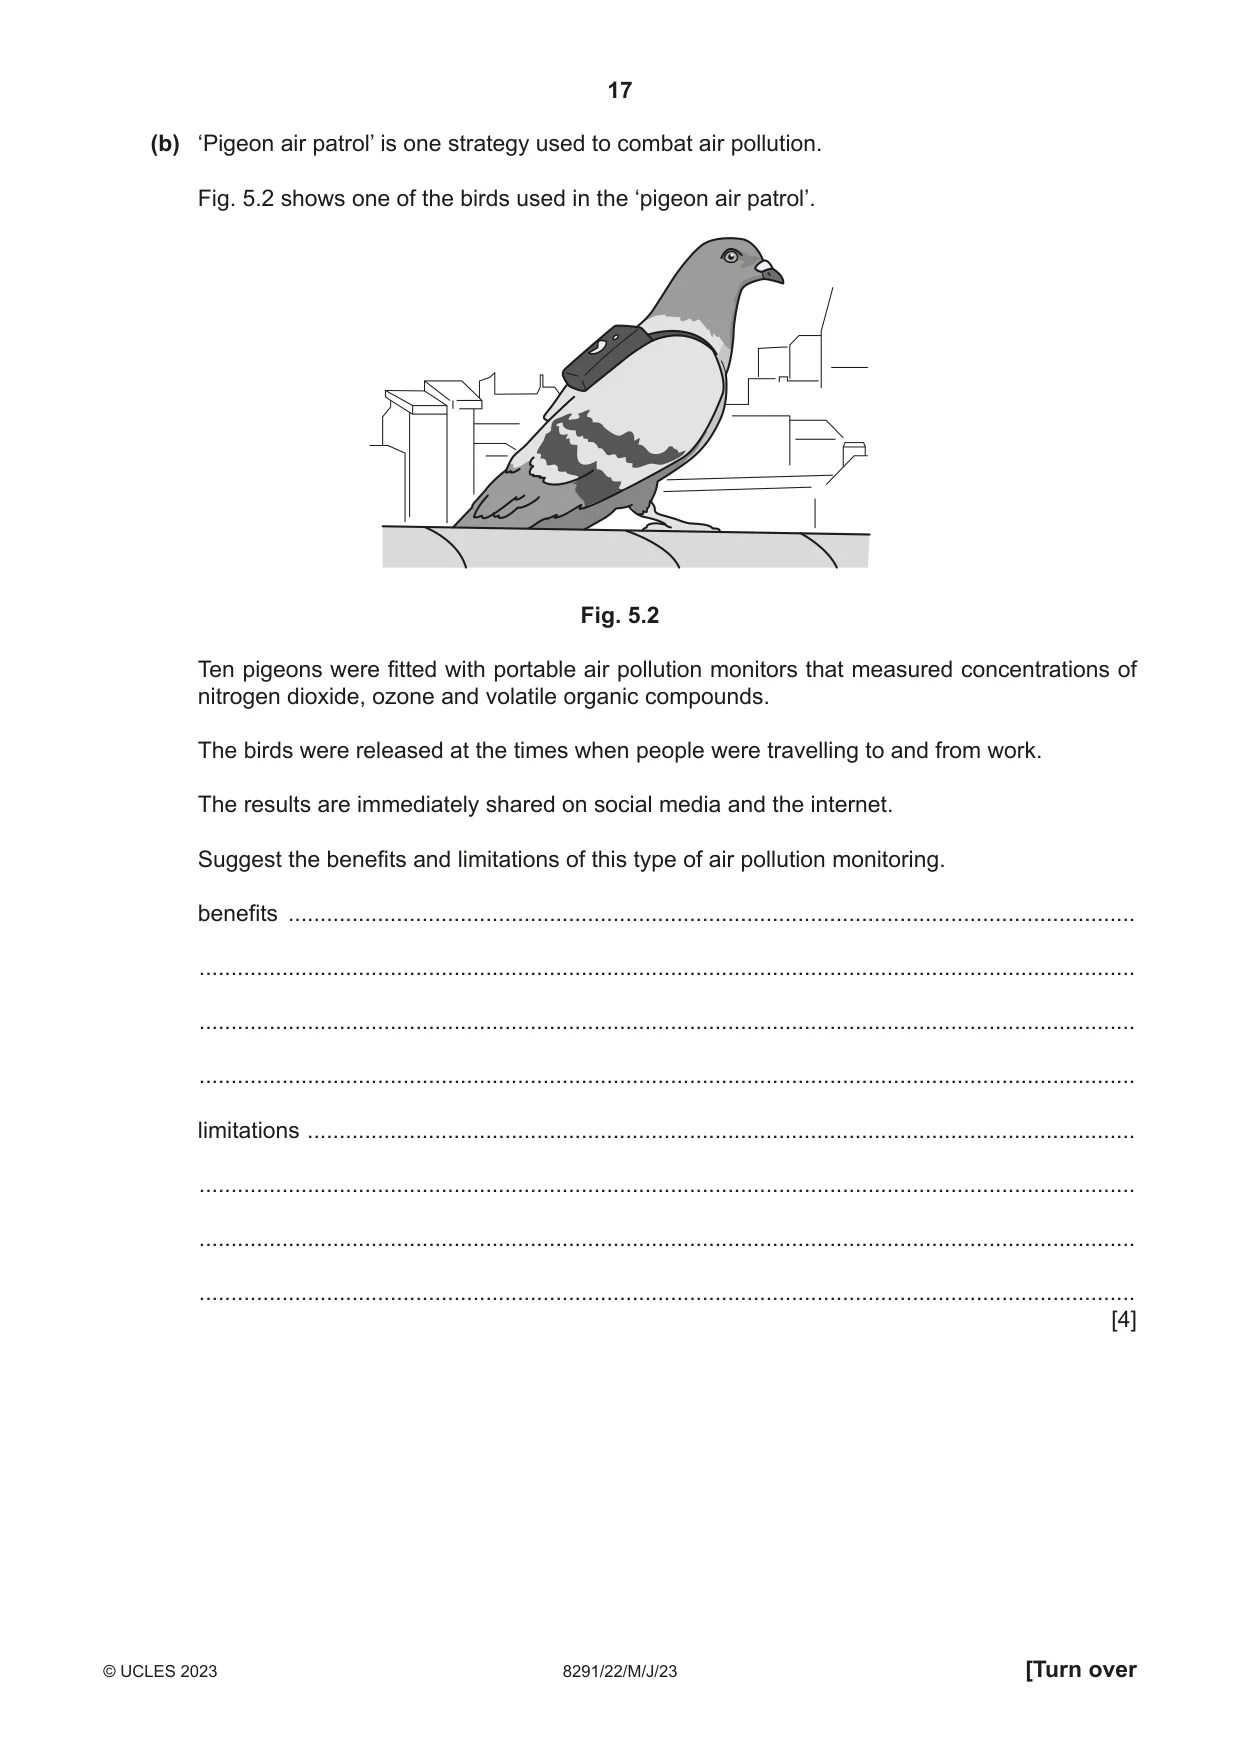
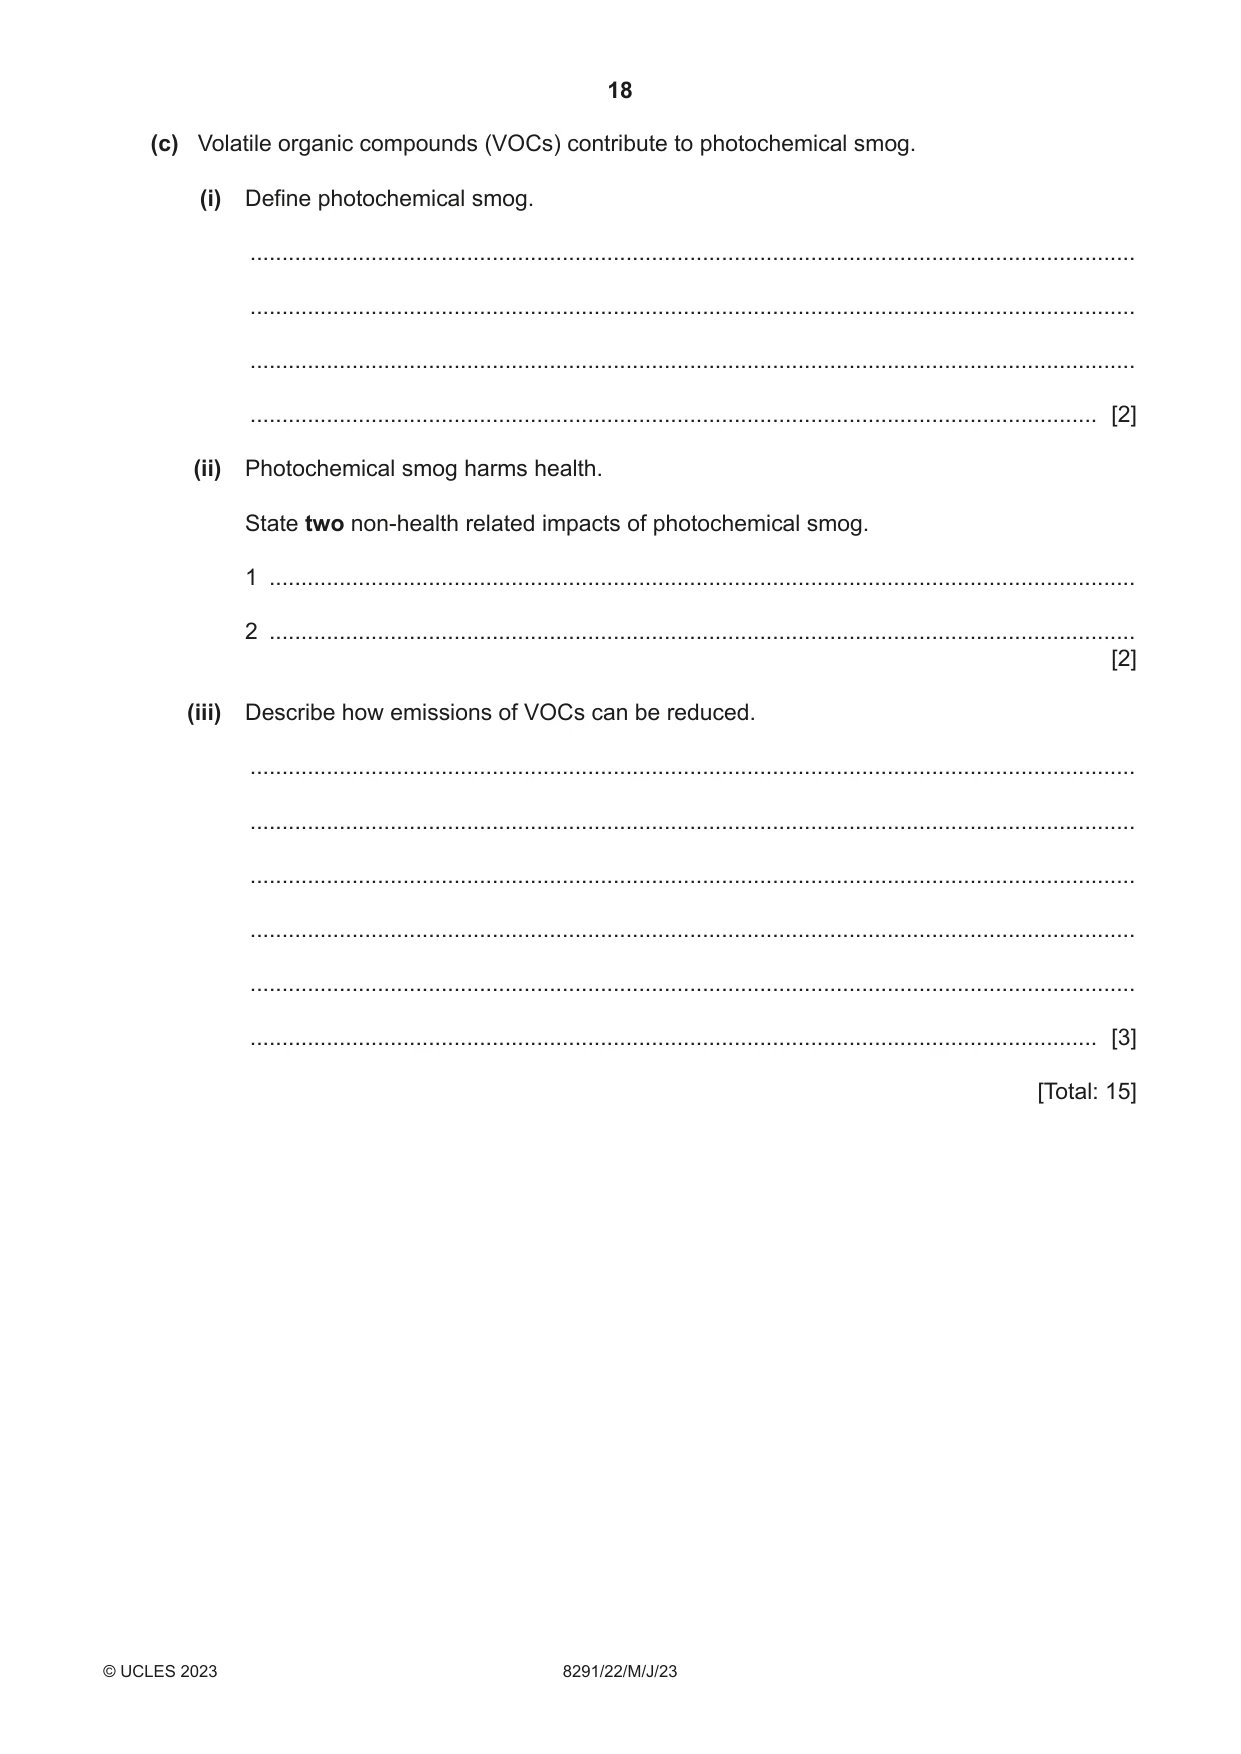
5 It is estimated that air pollution kills seven million people per year. (a) Particulate matter that is less than 2.5 μm in diameter is called PM2.5. Fig. 5.1 shows an air quality map for PM2.5 in Africa. The higher the number, the greater the concentration of PM2.5. Key PM2.5 concentration 200+ 150 100 50 35 20 0 Africa South Atlantic Ocean Fig. 5.1 (i) Suggest reasons why some areas of Africa have a higher concentration of PM2.5 than other areas. ........................................................................................................................................... ........................................................................................................................................... ........................................................................................................................................... ........................................................................................................................................... ........................................................................................................................................... ..................................................................................................................................... [3] (ii) A report stated that there are 50 permanent PM2.5 monitoring stations in Africa and 1000 in Europe. Suggest one reason for this difference in monitoring. ........................................................................................................................................... ..................................................................................................................................... [1] (b) ‘Pigeon air patrol’ is one strategy used to combat air pollution. Fig. 5.2 shows one of the birds used in the ‘pigeon air patrol’. Fig. 5.2 Ten pigeons were fitted with portable air pollution monitors that measured concentrations of nitrogen dioxide, ozone and volatile organic compounds. The birds were released at the times when people were travelling to and from work. The results are immediately shared on social media and the internet. Suggest the benefits and limitations of this type of air pollution monitoring. benefits ..................................................................................................................................... ................................................................................................................................................... ................................................................................................................................................... ................................................................................................................................................... limitations .................................................................................................................................. ................................................................................................................................................... ................................................................................................................................................... ................................................................................................................................................... [4] (c) Volatile organic compounds (VOCs) contribute to photochemical smog. (i) Define photochemical smog. ........................................................................................................................................... ........................................................................................................................................... ........................................................................................................................................... ..................................................................................................................................... [2] (ii) Photochemical smog harms health. State two non‑health related impacts of photochemical smog. 1 ........................................................................................................................................ 2 ........................................................................................................................................ [2] (iii) Describe how emissions of VOCs can be reduced. ........................................................................................................................................... ........................................................................................................................................... ........................................................................................................................................... ........................................................................................................................................... ........................................................................................................................................... ..................................................................................................................................... [3] [Total: 15]
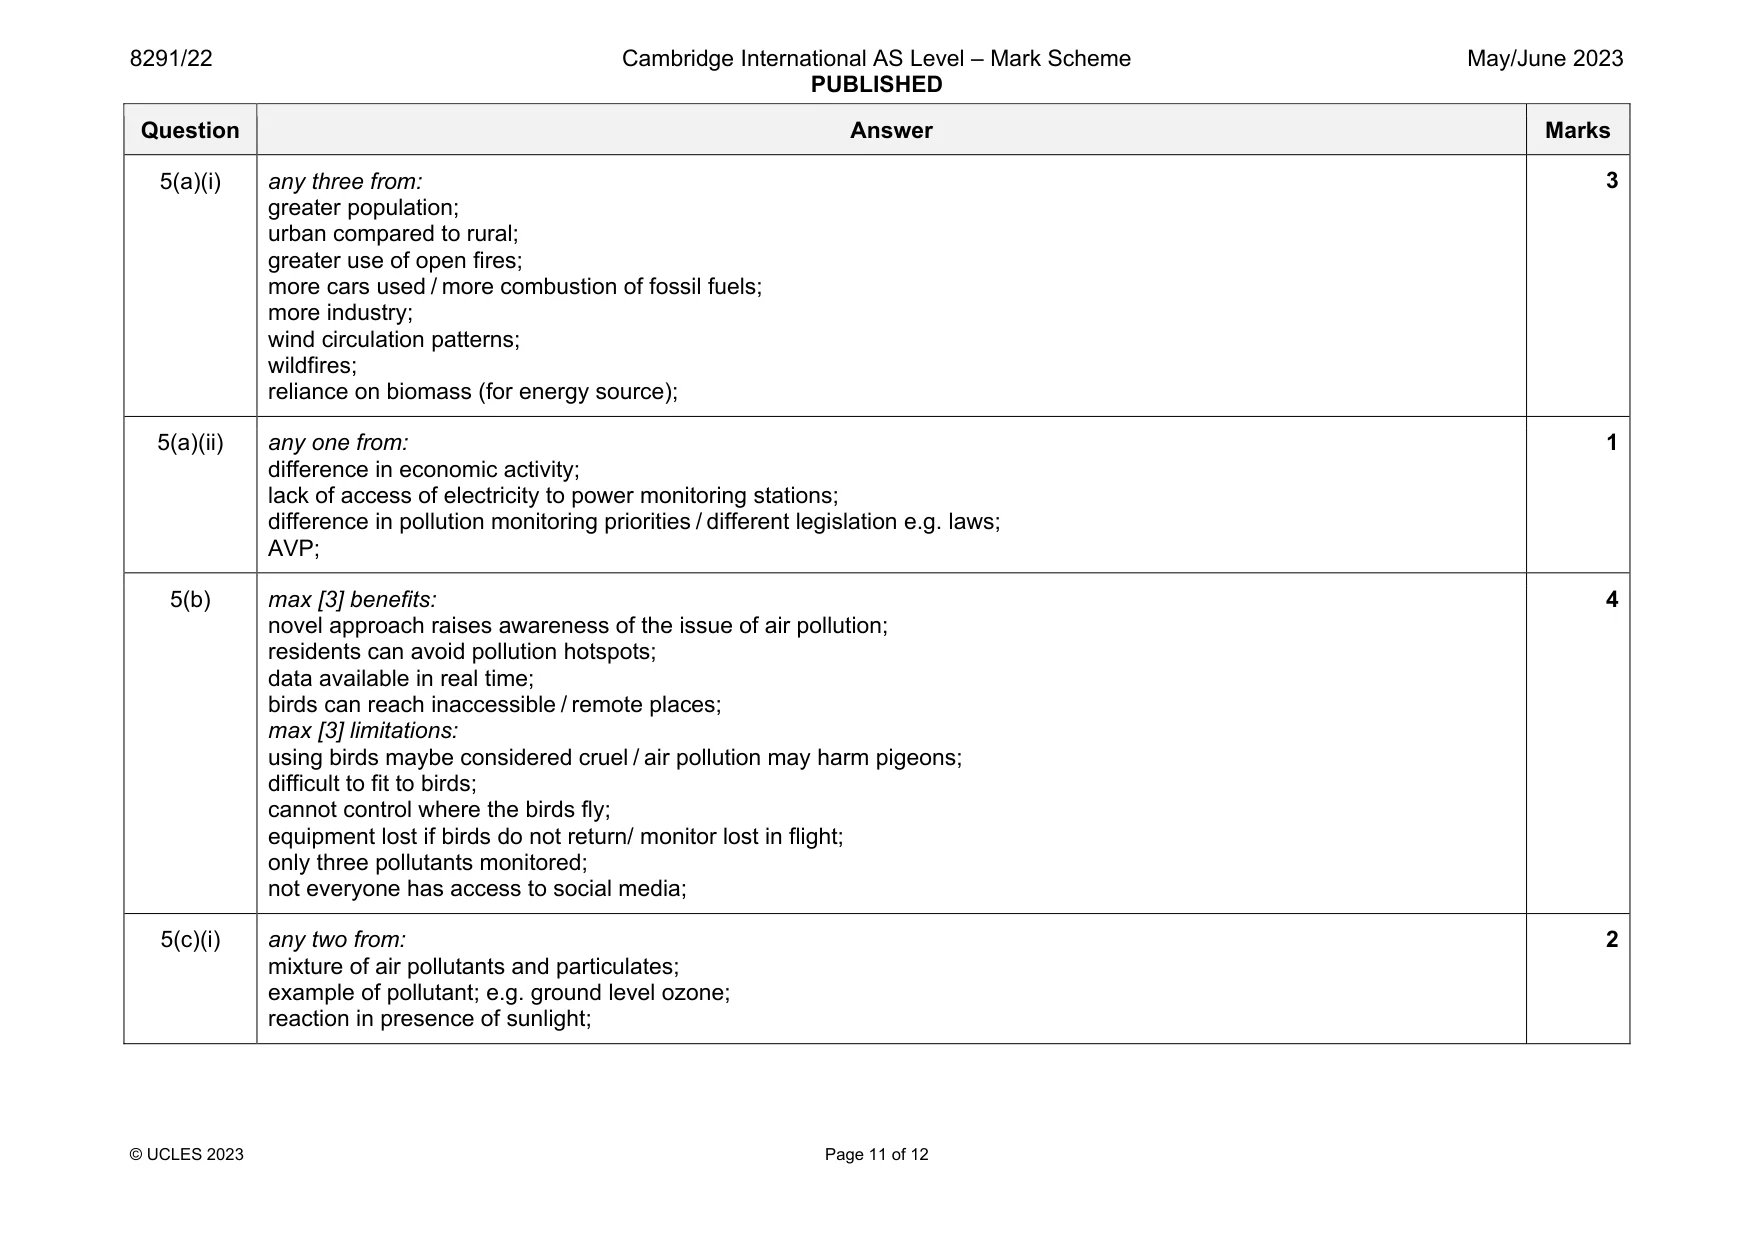
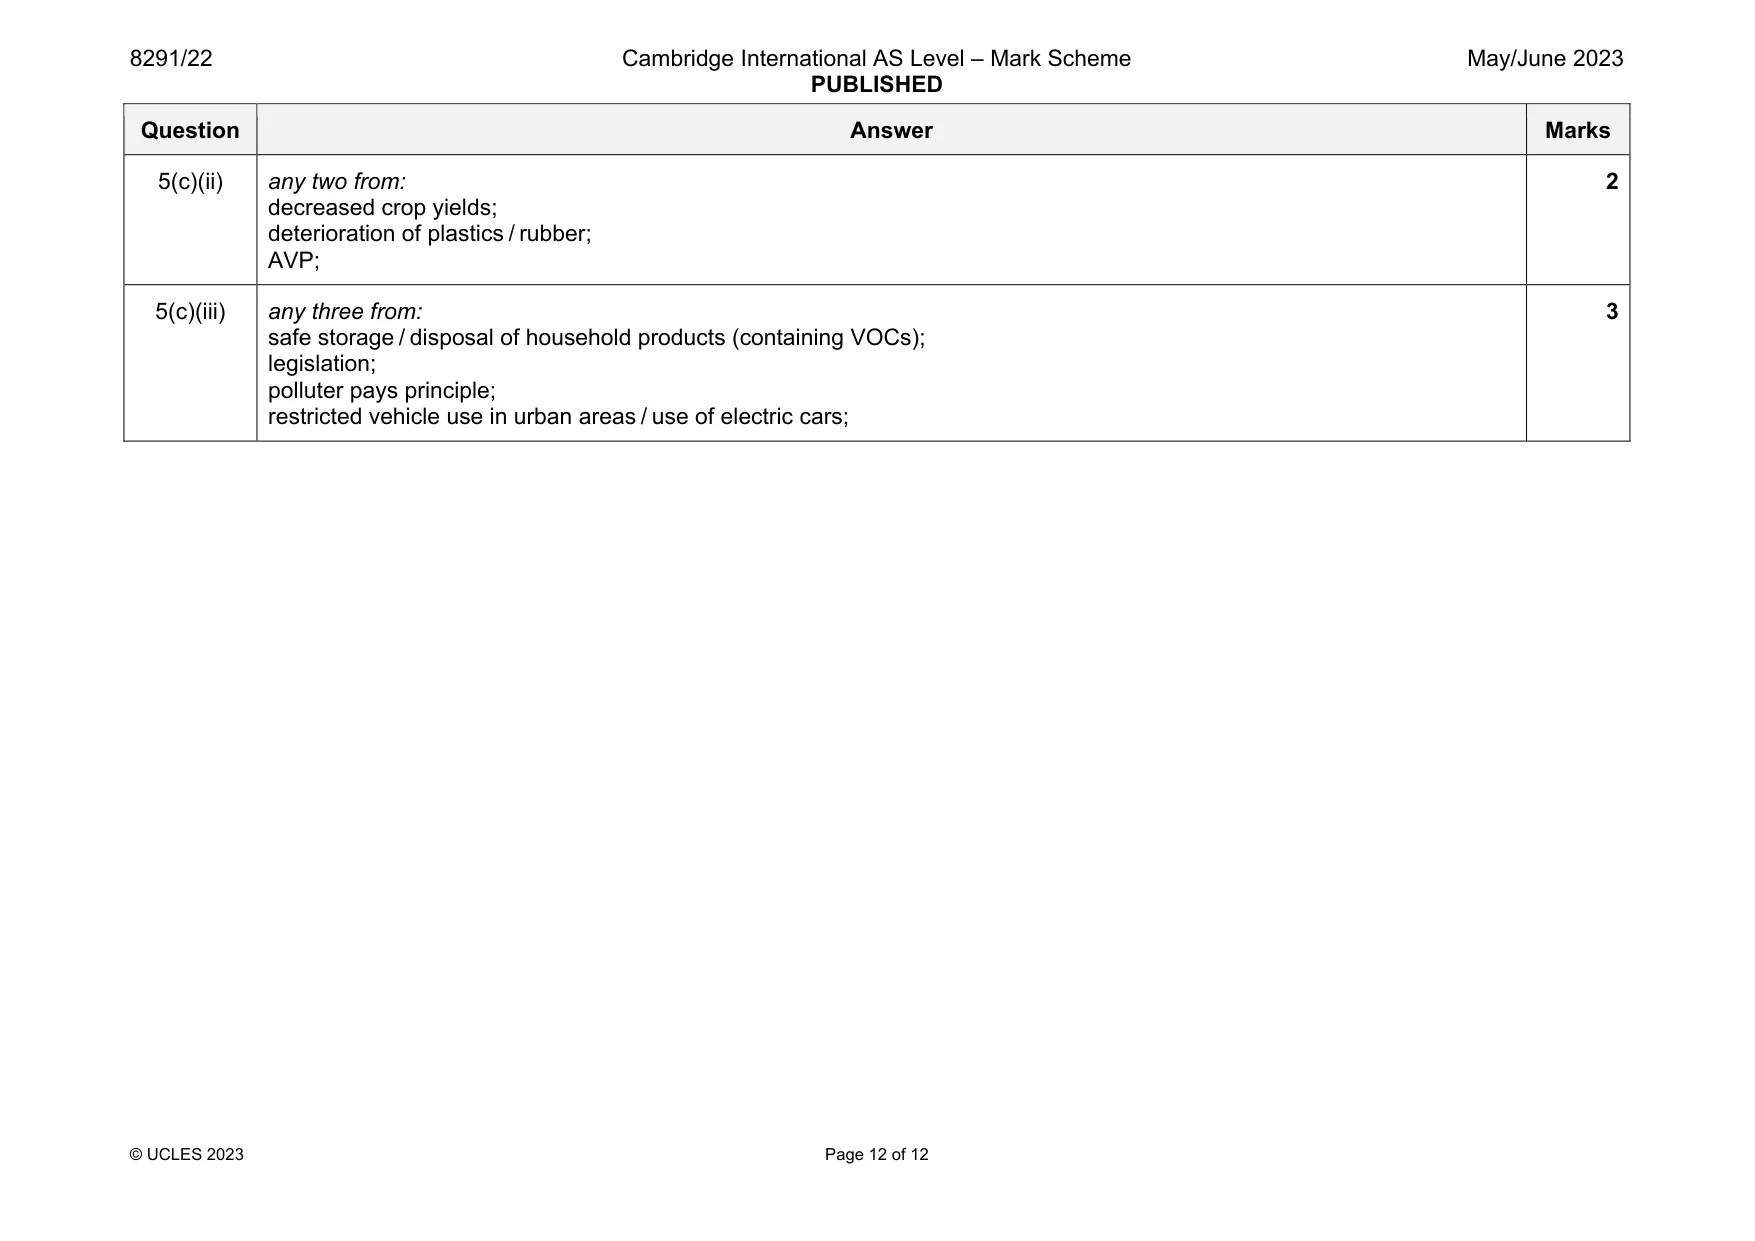
Mark scheme: 5(a)(i) any three from: greater population; urban compared to rural; greater use of open fires; more cars used / more combustion of fossil fuels; more industry; wind circulation patterns; wildfires; reliance on biomass (for energy source); 5(a)(ii) any one from: difference in economic activity; lack of access of electricity to power monitoring stations; difference in pollution monitoring priorities / different legislation e.g. laws; AVP; 1 5(b) max [3] benefits: novel approach raises awareness of the issue of air pollution; residents can avoid pollution hotspots; data available in real time; birds can reach inaccessible / remote places; max [3] limitations: using birds maybe considered cruel / air pollution may harm pigeons; difficult to fit to birds; cannot control where the birds fly; equipment lost if birds do not return/ monitor lost in flight; only three pollutants monitored; not everyone has access to social media; 4 5(c)(i) any two from: mixture of air pollutants and particulates; example of pollutant; e.g. ground level ozone; reaction in presence of sunlight; 2 Question Answer Marks 5(c)(ii) any two from: decreased crop yields; deterioration of plastics / rubber; AVP; 2 5(c)(iii) any three from: safe storage / disposal of household products (containing VOCs); legislation; polluter pays principle; restricted vehicle use in urban areas / use of electric cars; 3
What was in this paper
The subtopics covered by these 5 questions, and how many questions each got. Open one in a new tab to see every Cambridge question on it.
What you needed in this session
Cambridge’s own grade thresholds for 2023 May/June, Paper 2 · Variant 2. A higher threshold means an easier paper — the bar moves with how the cohort did.