Cambridge A Level Environmental Management (AS only) 8291 — 2025 Oct/Nov Paper 2 · Variant 2
8291/22/O/N/25 · 5 questions · 80 marks · 105 min
The question paper and its mark scheme, free to read here and free to download. This is Cambridge’s own paper, exactly as it was sat.
Question paper24 pages




Mark scheme16 pages
Answers below. Sit the paper first if you are practising.
Questions as text
Q1 · Bangladesh is a country in Asia
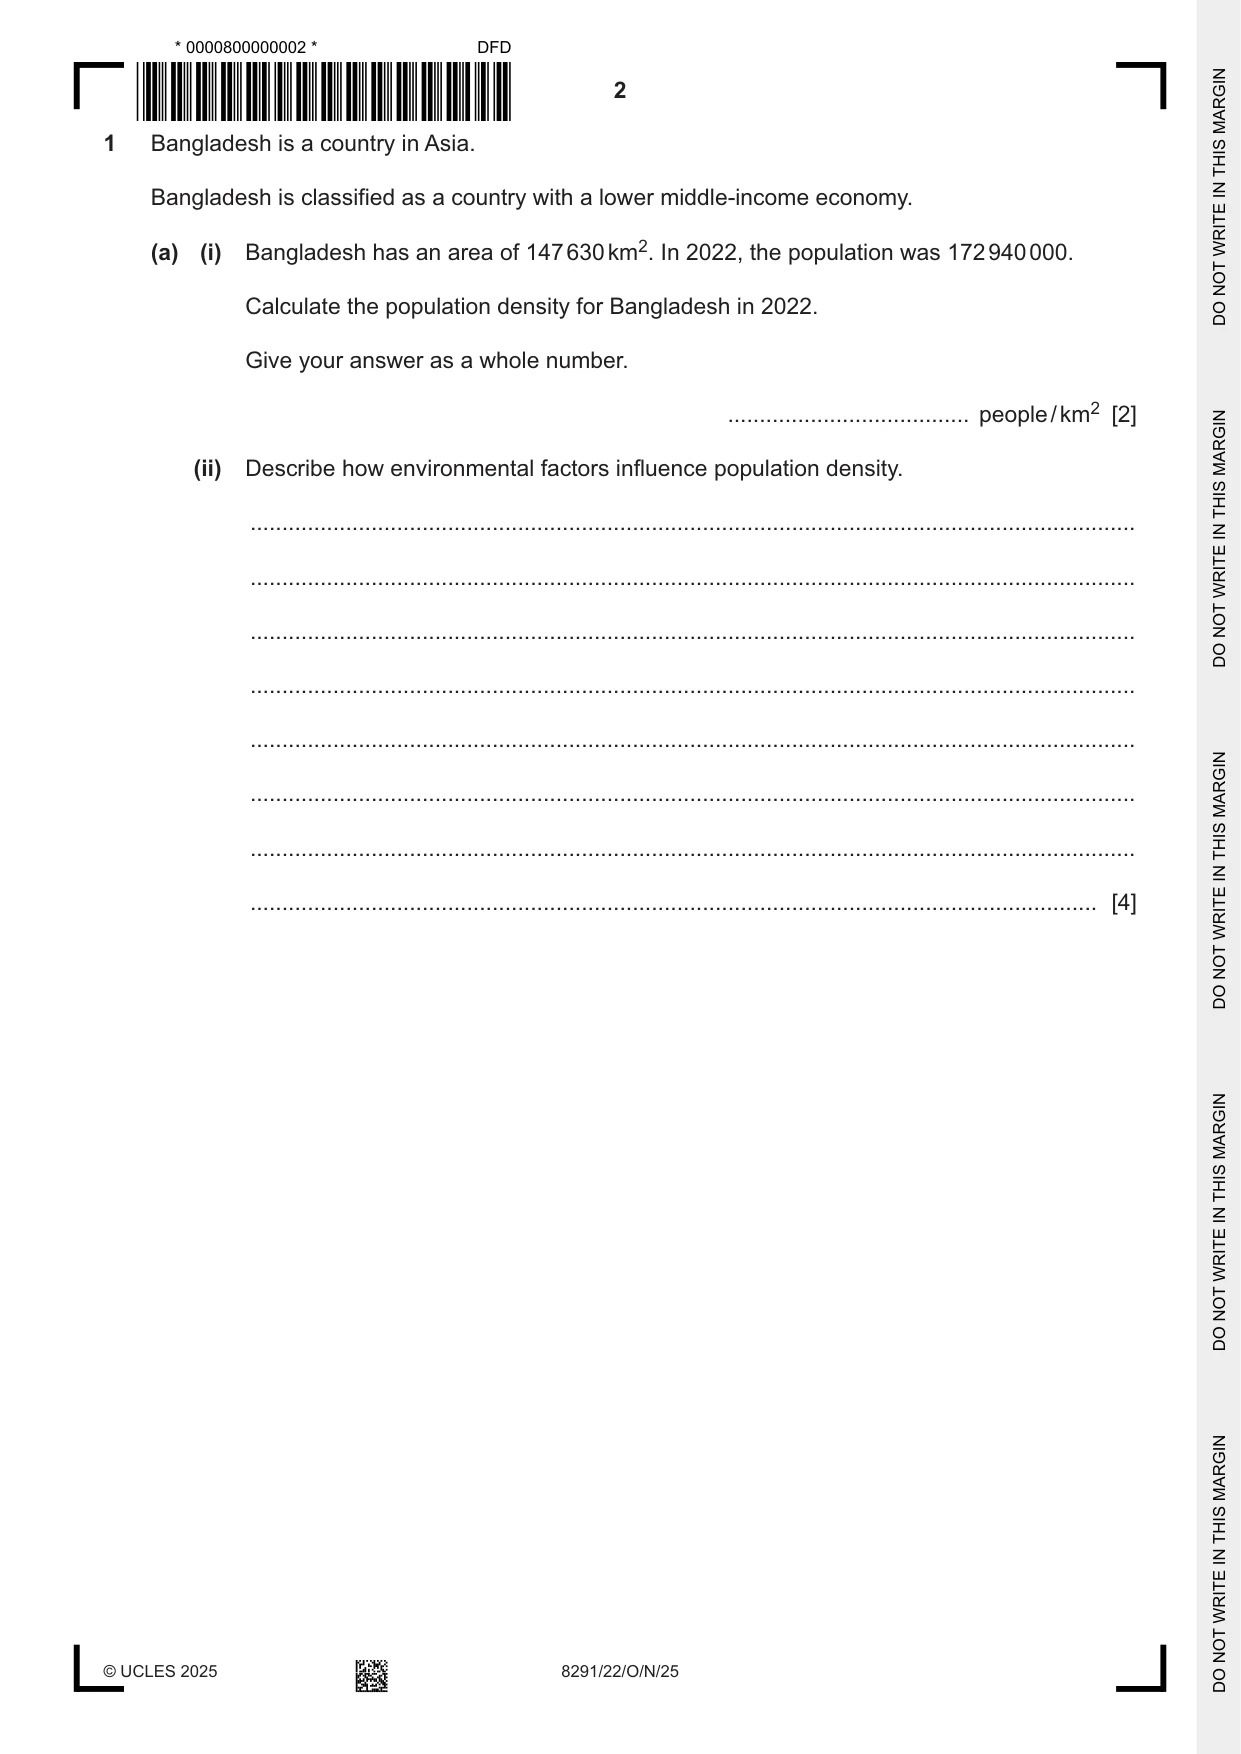
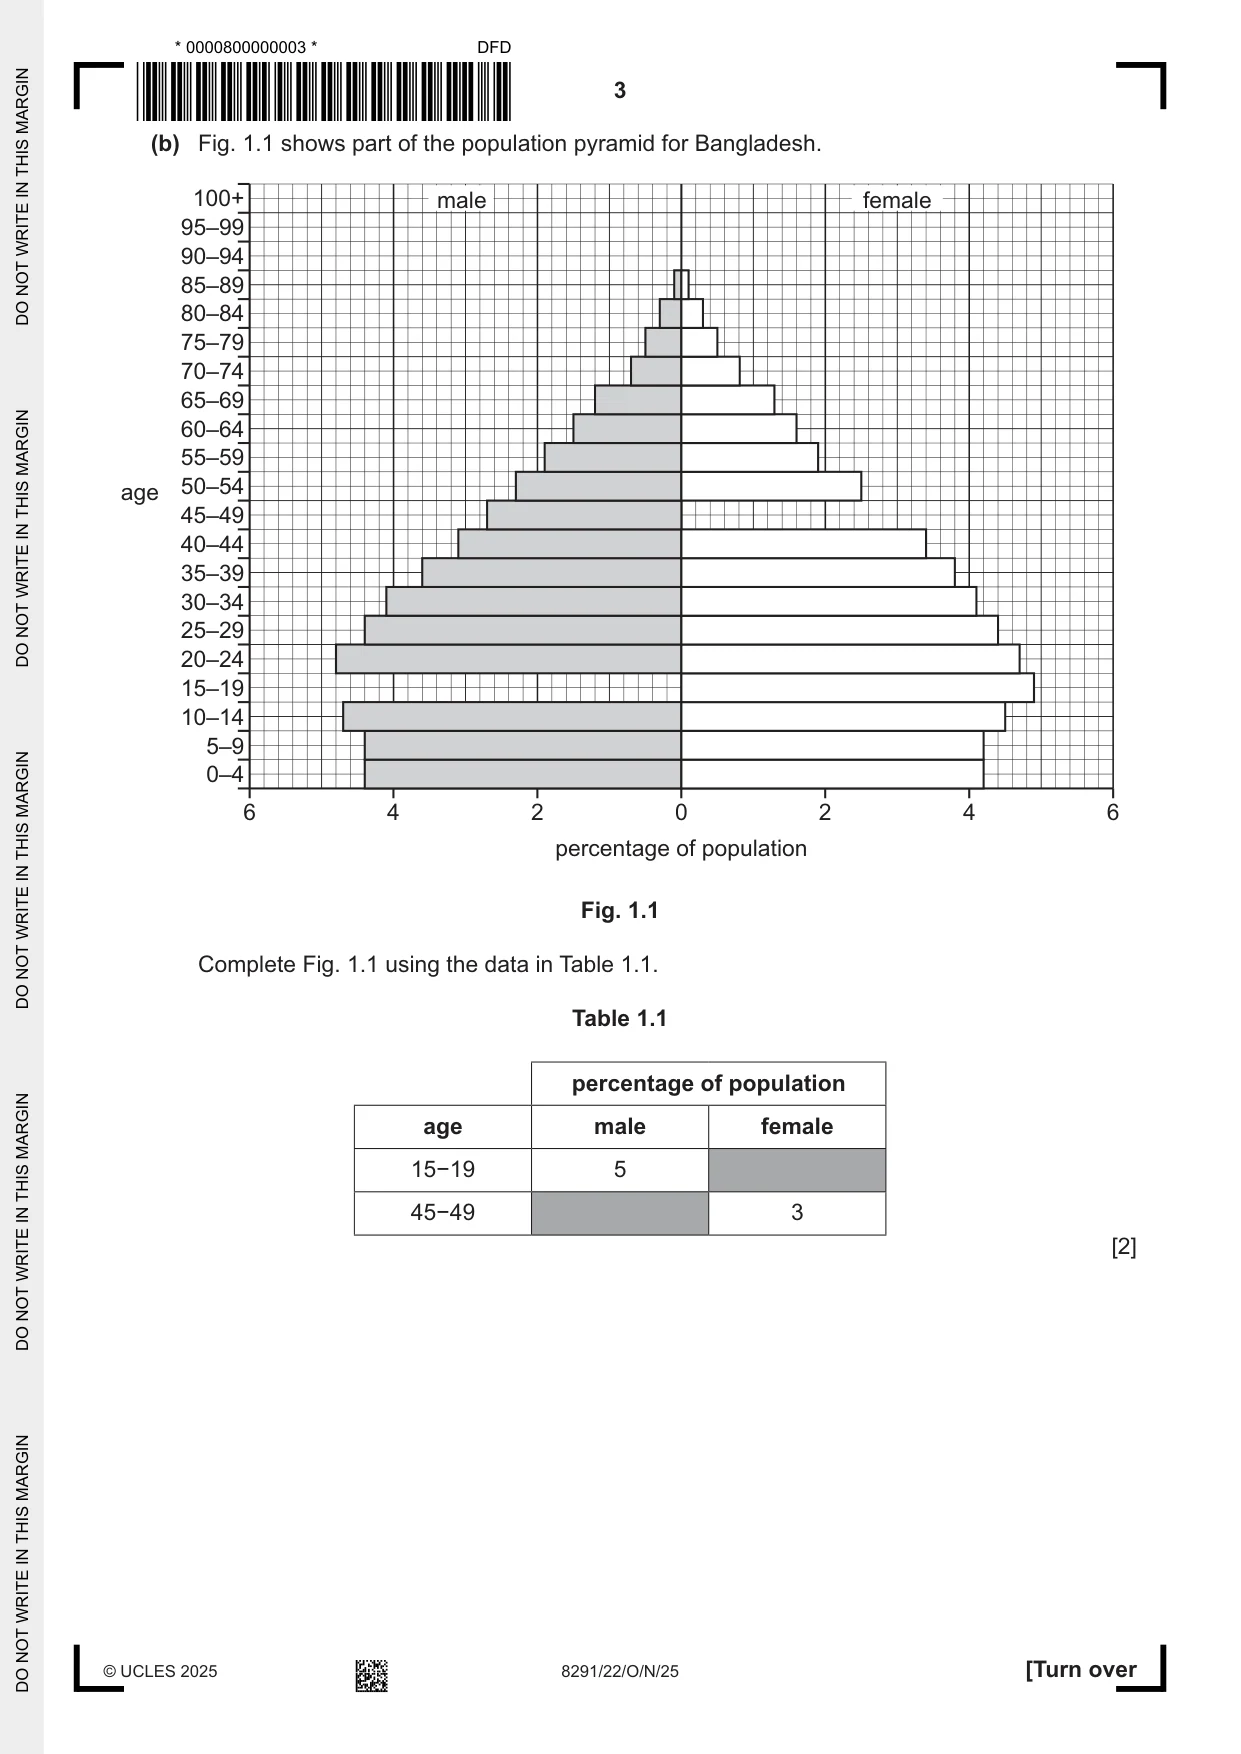
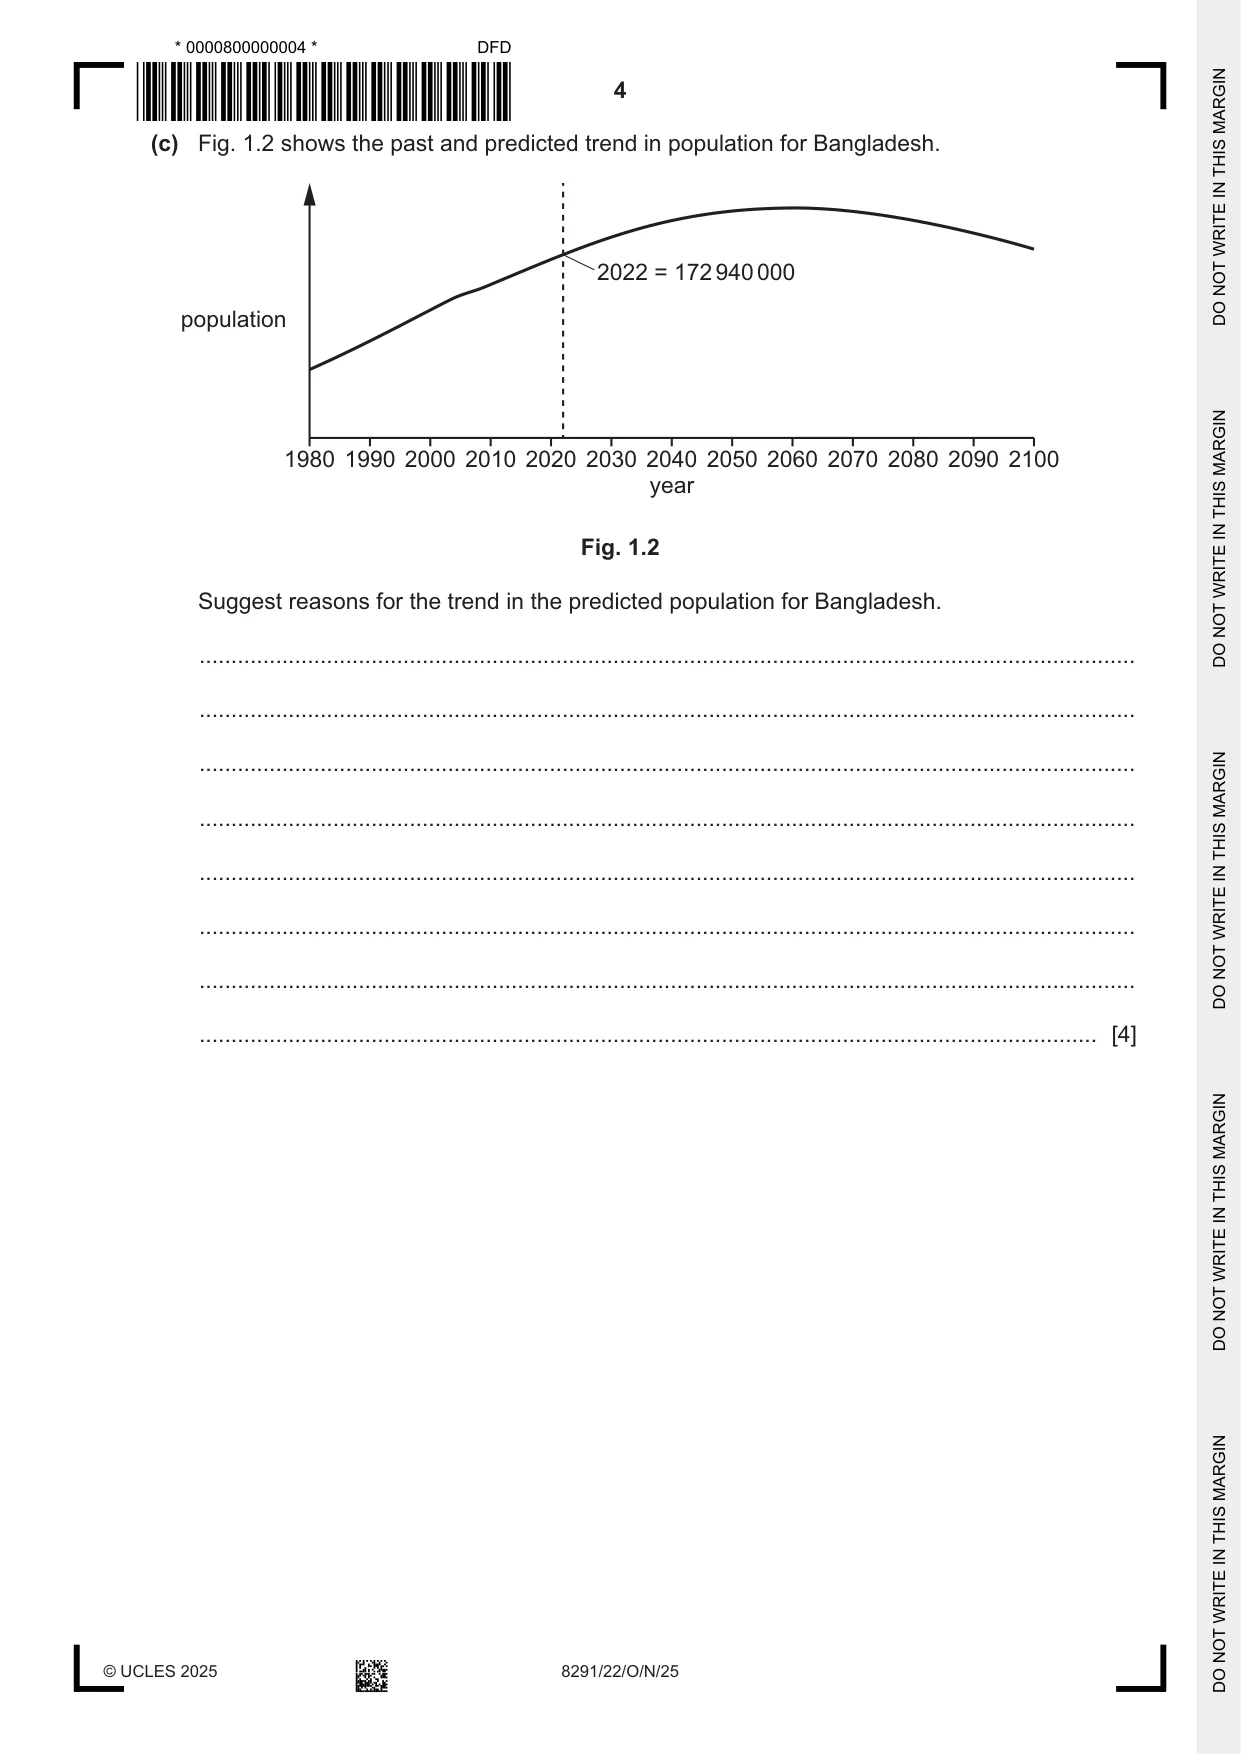
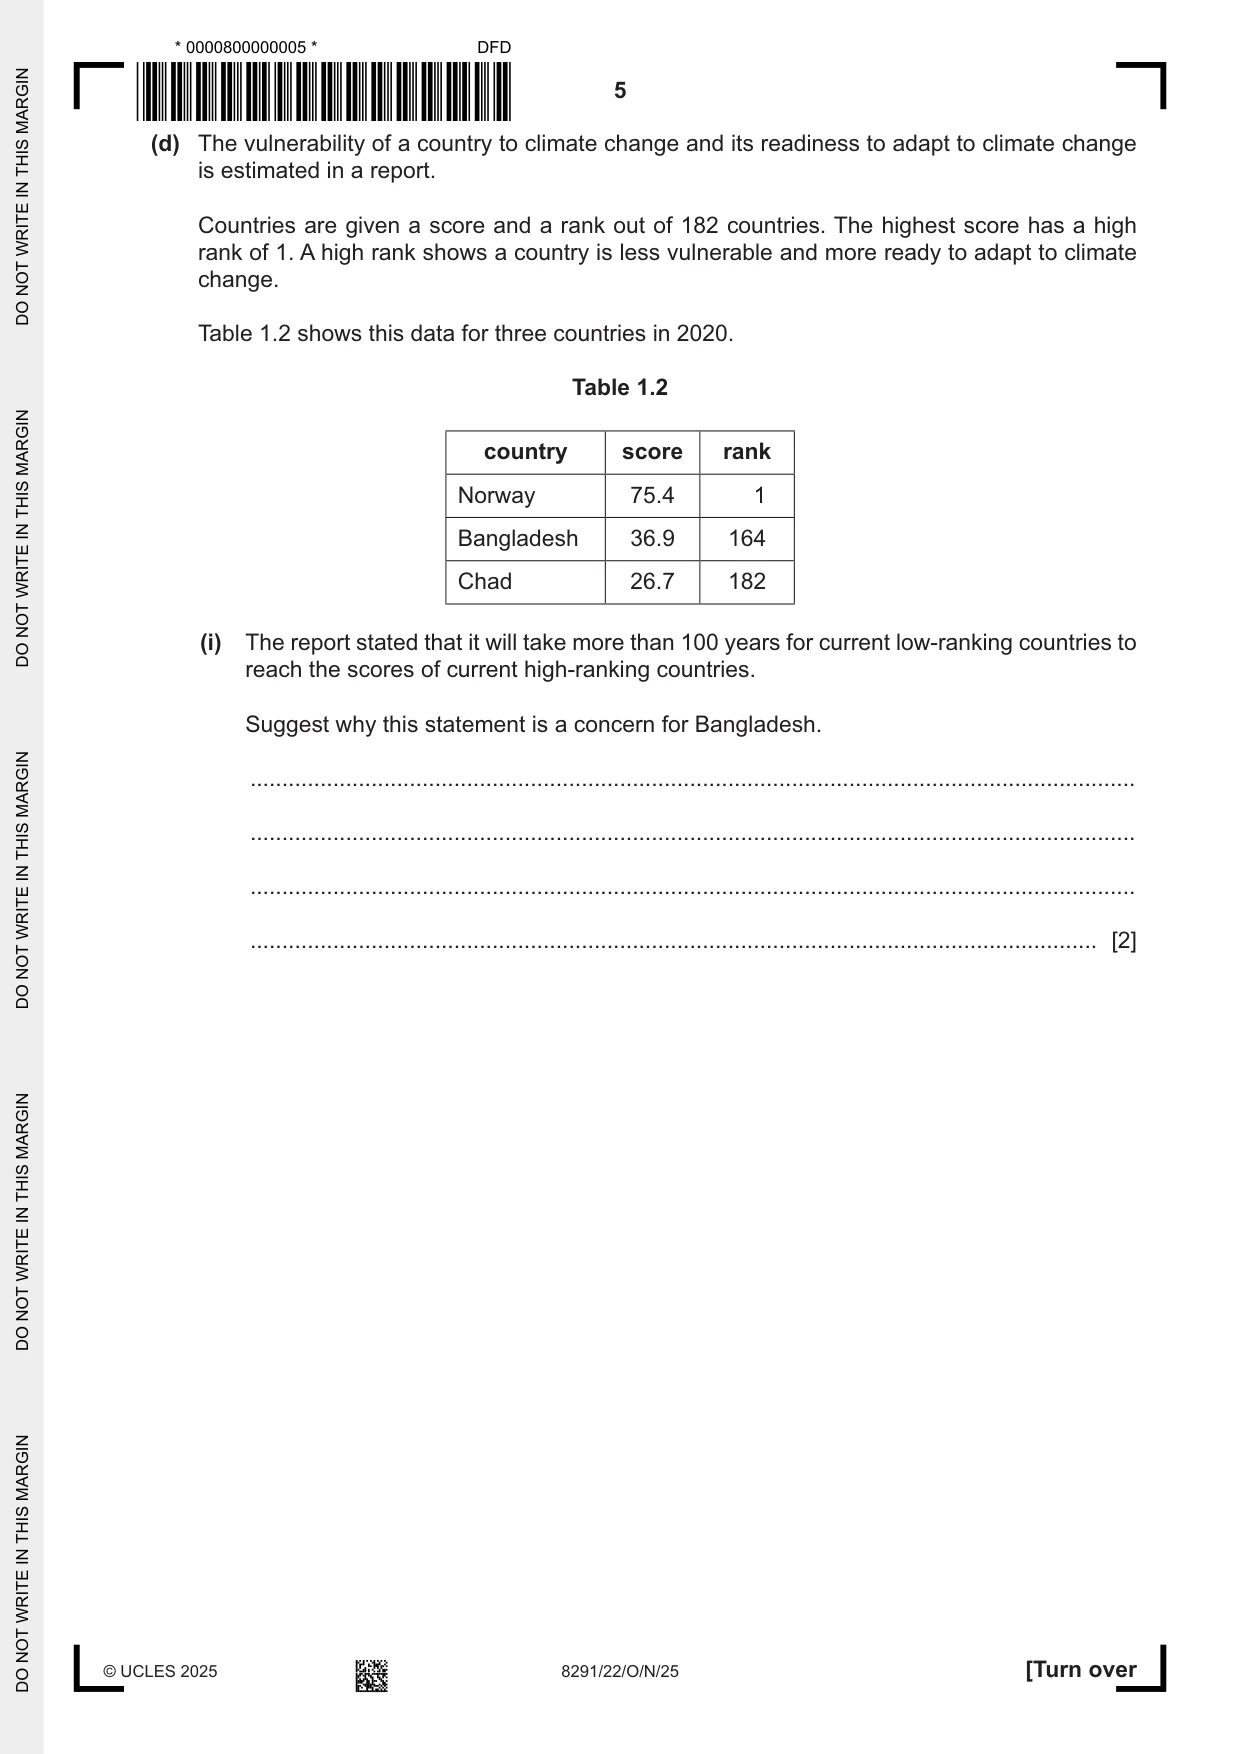
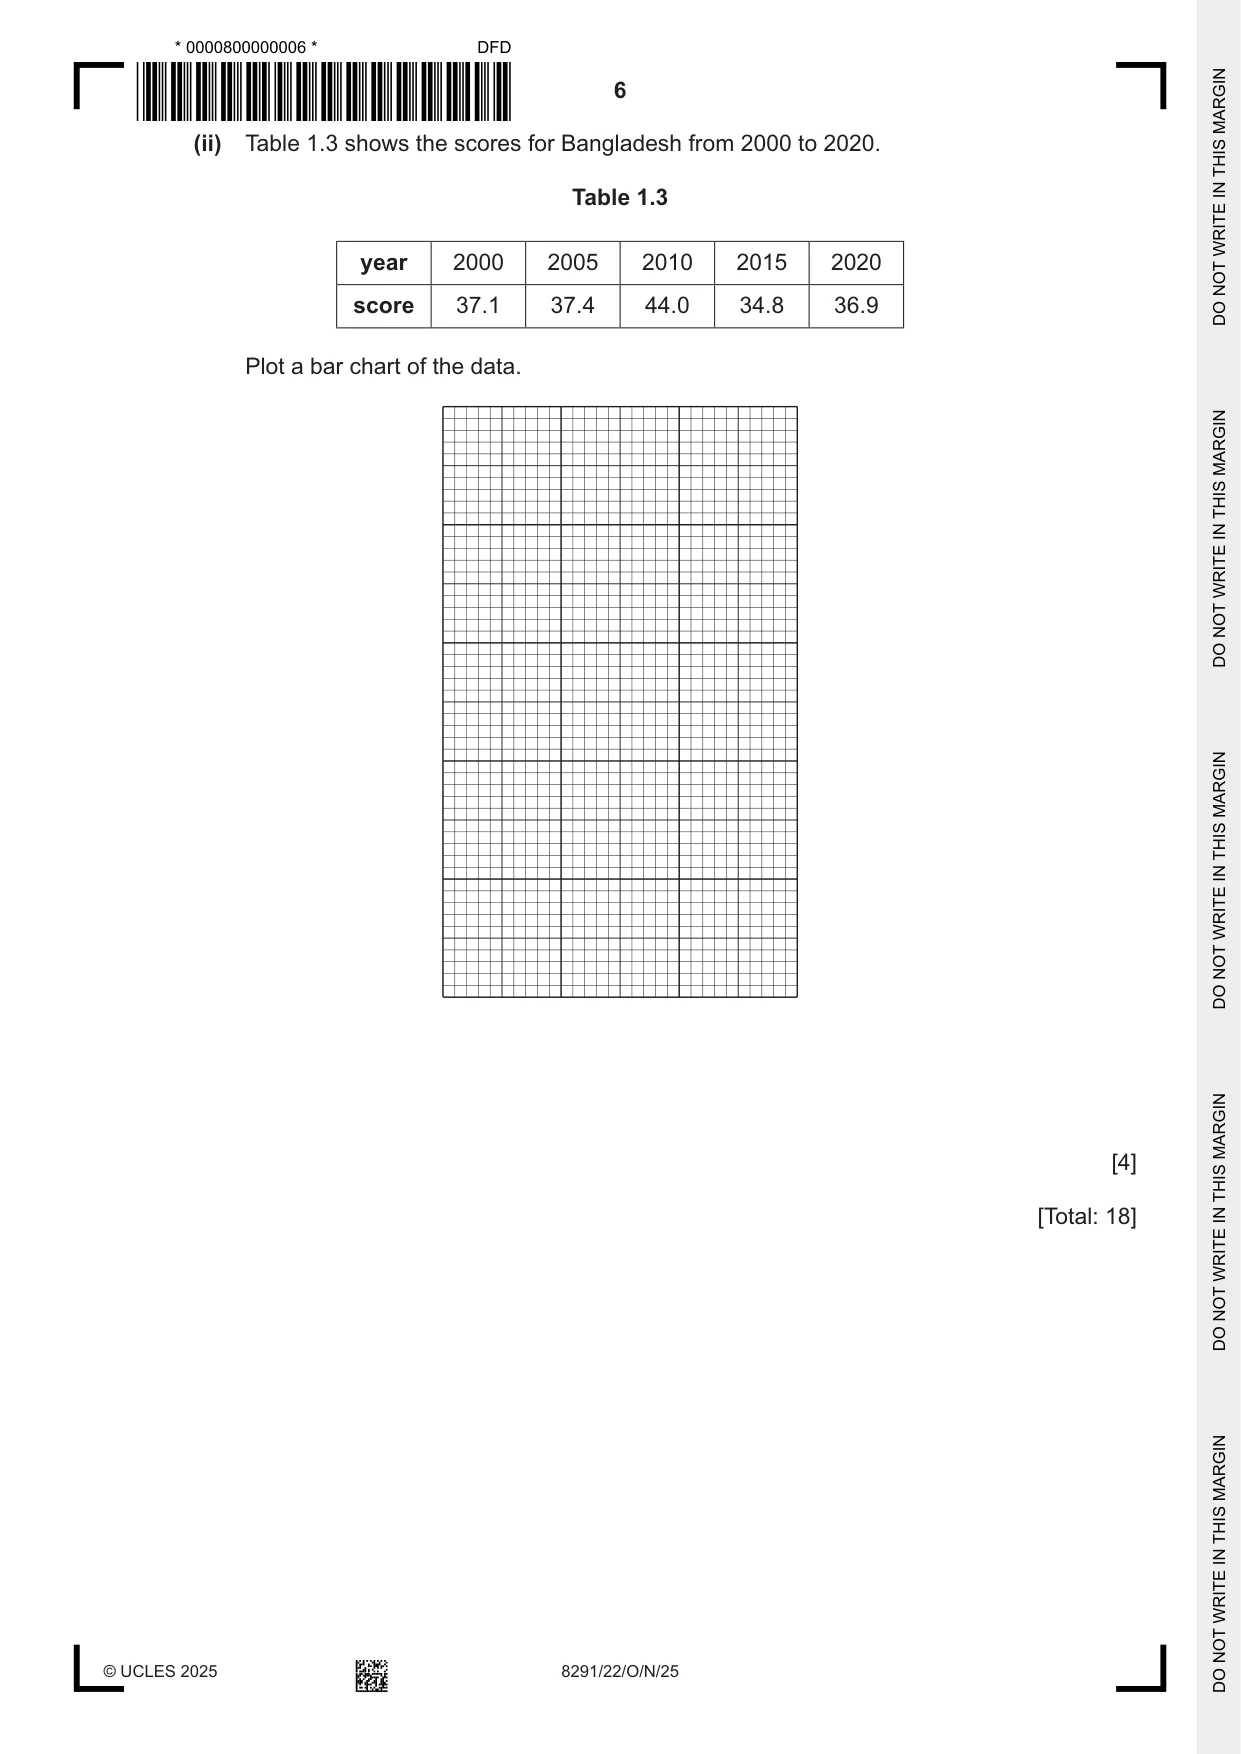
1 Bangladesh is a country in Asia. Bangladesh is classified as a country with a lower middle-income economy. (a) (i) Bangladesh has an area of 147 630 km2. In 2022, the population was 172 940 000. Calculate the population density for Bangladesh in 2022. Give your answer as a whole number. ...................................... people / km2 [2] (ii) Describe how environmental factors influence population density. ........................................................................................................................................... ........................................................................................................................................... ........................................................................................................................................... ........................................................................................................................................... ........................................................................................................................................... ........................................................................................................................................... ........................................................................................................................................... ..................................................................................................................................... [4] (b) Fig. 1.1 shows part of the population pyramid for Bangladesh. 100+ male female 95–99 90–94 85–89 80–84 75–79 70–74 65–69 60–64 55–59 age 50–54 45–49 40–44 35–39 30–34 25–29 20–24 15–19 10–14 5–9 0–4 6 4 2 0 2 4 6 percentage of population Fig. 1.1 Complete Fig. 1.1 using the data in Table 1.1. Table 1.1 percentage of population age male female 15−19 5 45−49 3 [2] (c) Fig. 1.2 shows the past and predicted trend in population for Bangladesh. 2022 = 172 940 000 population 1980 1990 2000 2010 2020 2030 2040 2050 2060 2070 2080 2090 2100 year Fig. 1.2 Suggest reasons for the trend in the predicted population for Bangladesh. ................................................................................................................................................... ................................................................................................................................................... ................................................................................................................................................... ................................................................................................................................................... ................................................................................................................................................... ................................................................................................................................................... ................................................................................................................................................... ............................................................................................................................................. [4] (d) The vulnerability of a country to climate change and its readiness to adapt to climate change is estimated in a report. Countries are given a score and a rank out of 182 countries. The highest score has a high rank of 1. A high rank shows a country is less vulnerable and more ready to adapt to climate change. Table 1.2 shows this data for three countries in 2020. Table 1.2 country score rank Norway 75.4 1 Bangladesh 36.9 164 Chad 26.7 182 (i) The report stated that it will take more than 100 years for current low-ranking countries to reach the scores of current high-ranking countries. Suggest why this statement is a concern for Bangladesh. ........................................................................................................................................... ........................................................................................................................................... ........................................................................................................................................... ..................................................................................................................................... [2] (ii) Table 1.3 shows the scores for Bangladesh from 2000 to 2020. Table 1.3 year 2000 2005 2010 2015 2020 score 37.1 37.4 44.0 34.8 36.9 Plot a bar chart of the data. [4] [Total: 18]
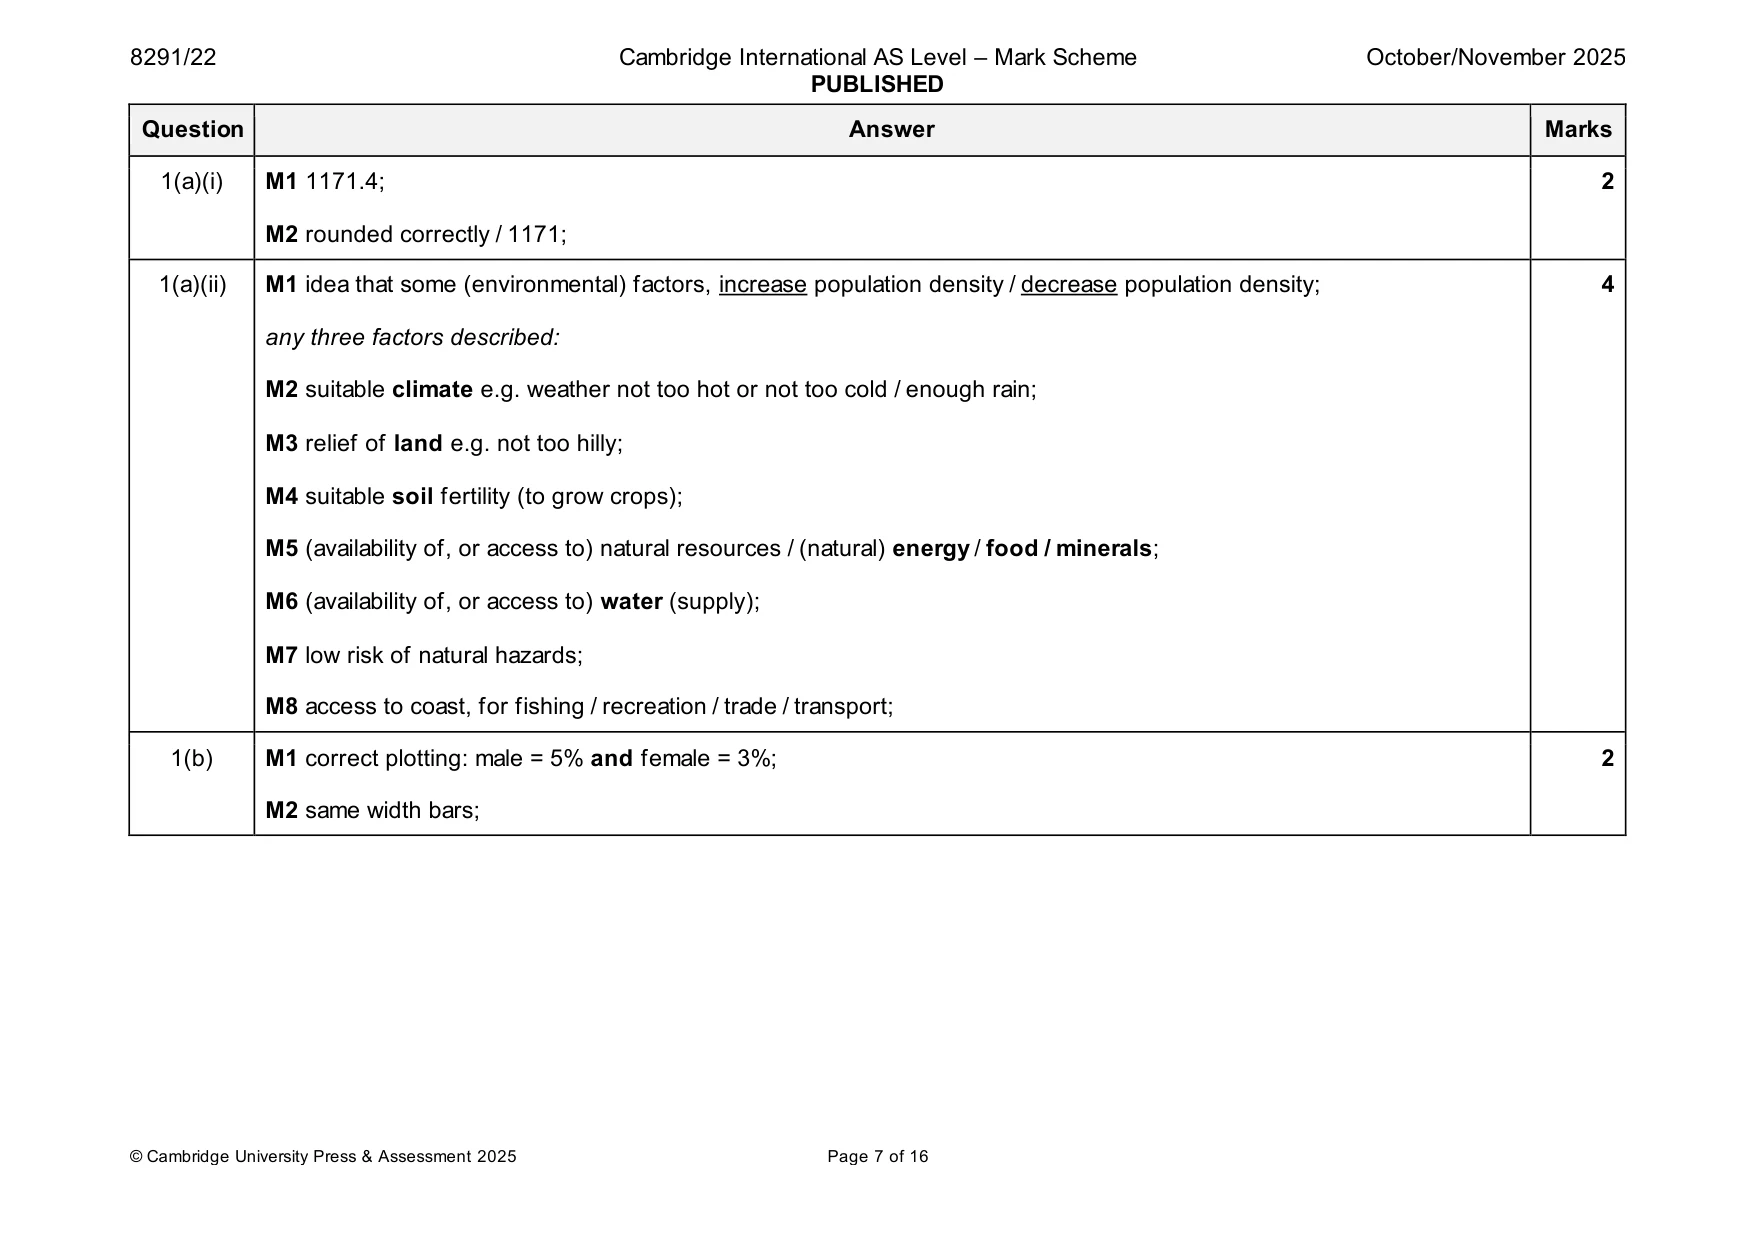
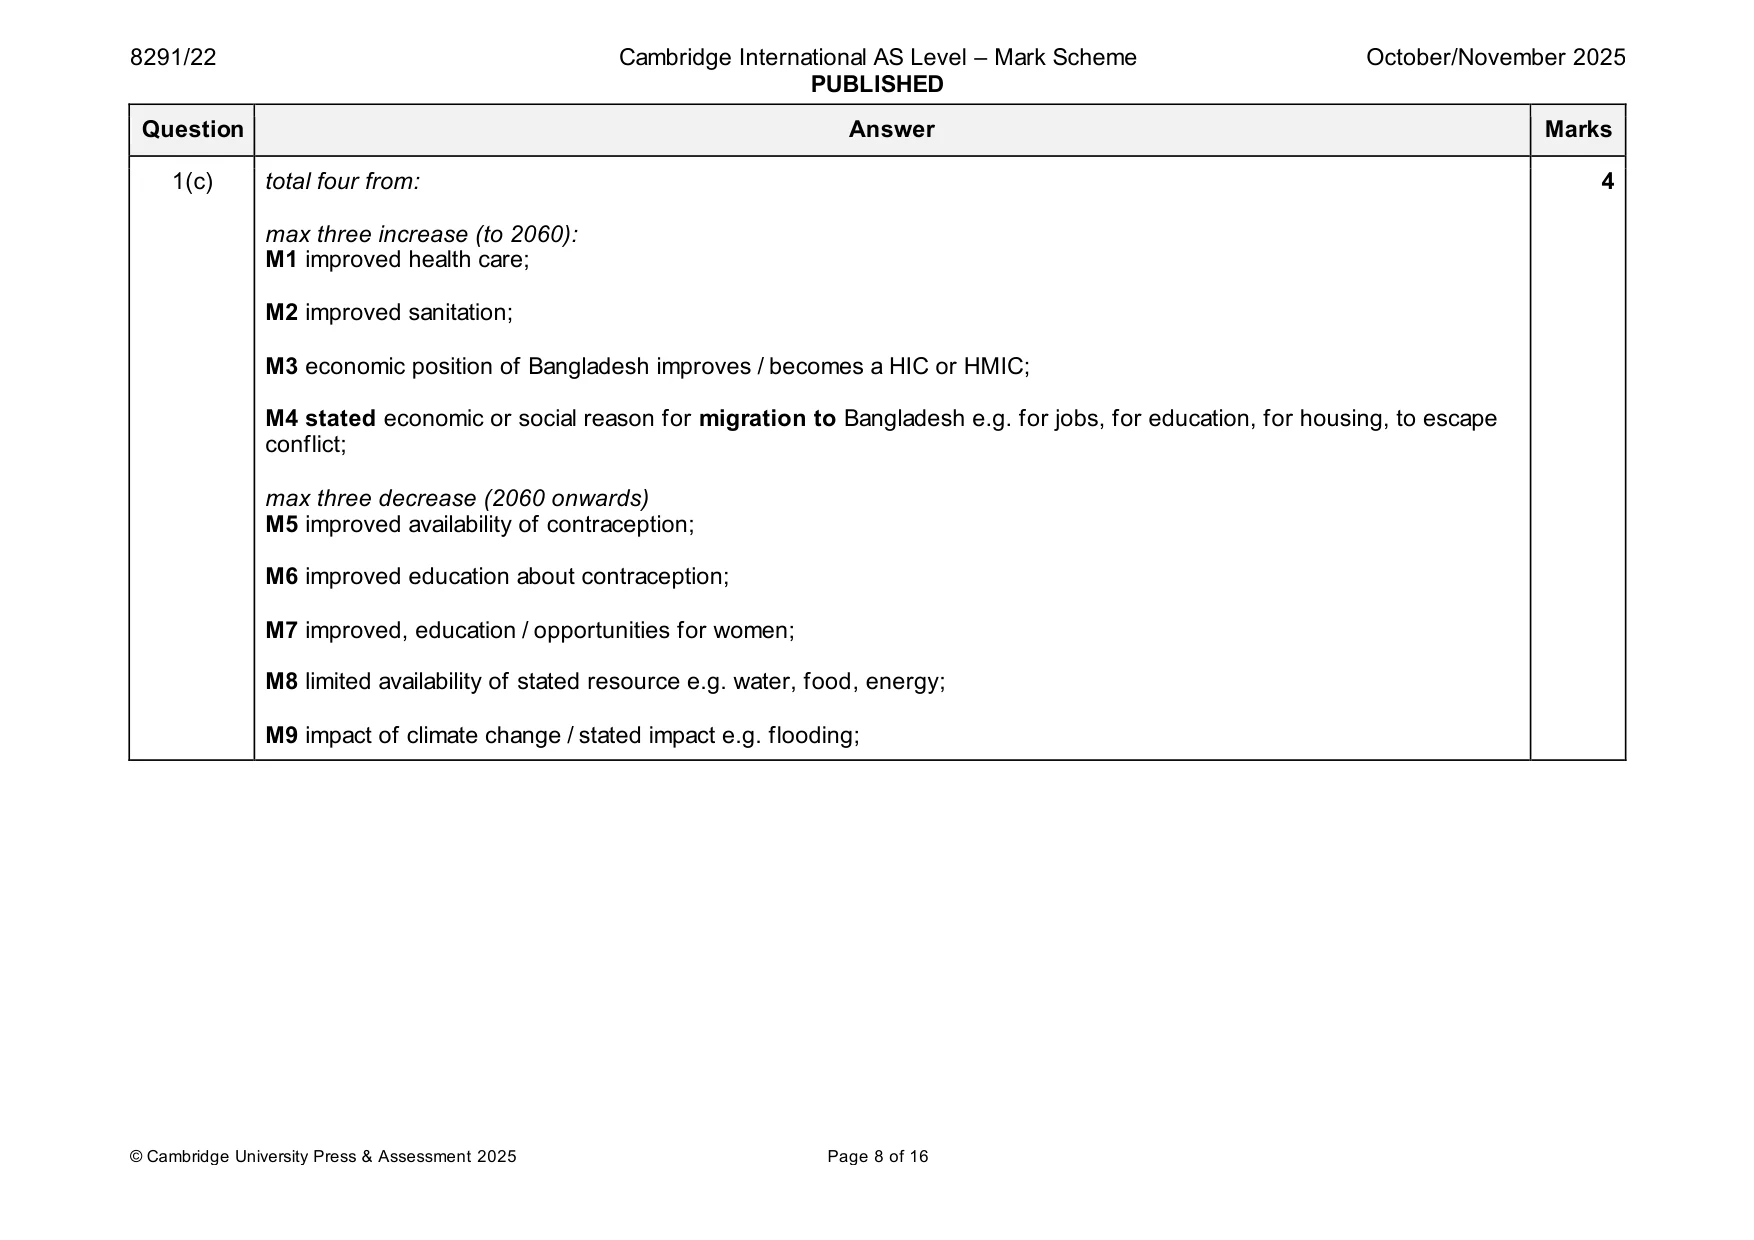
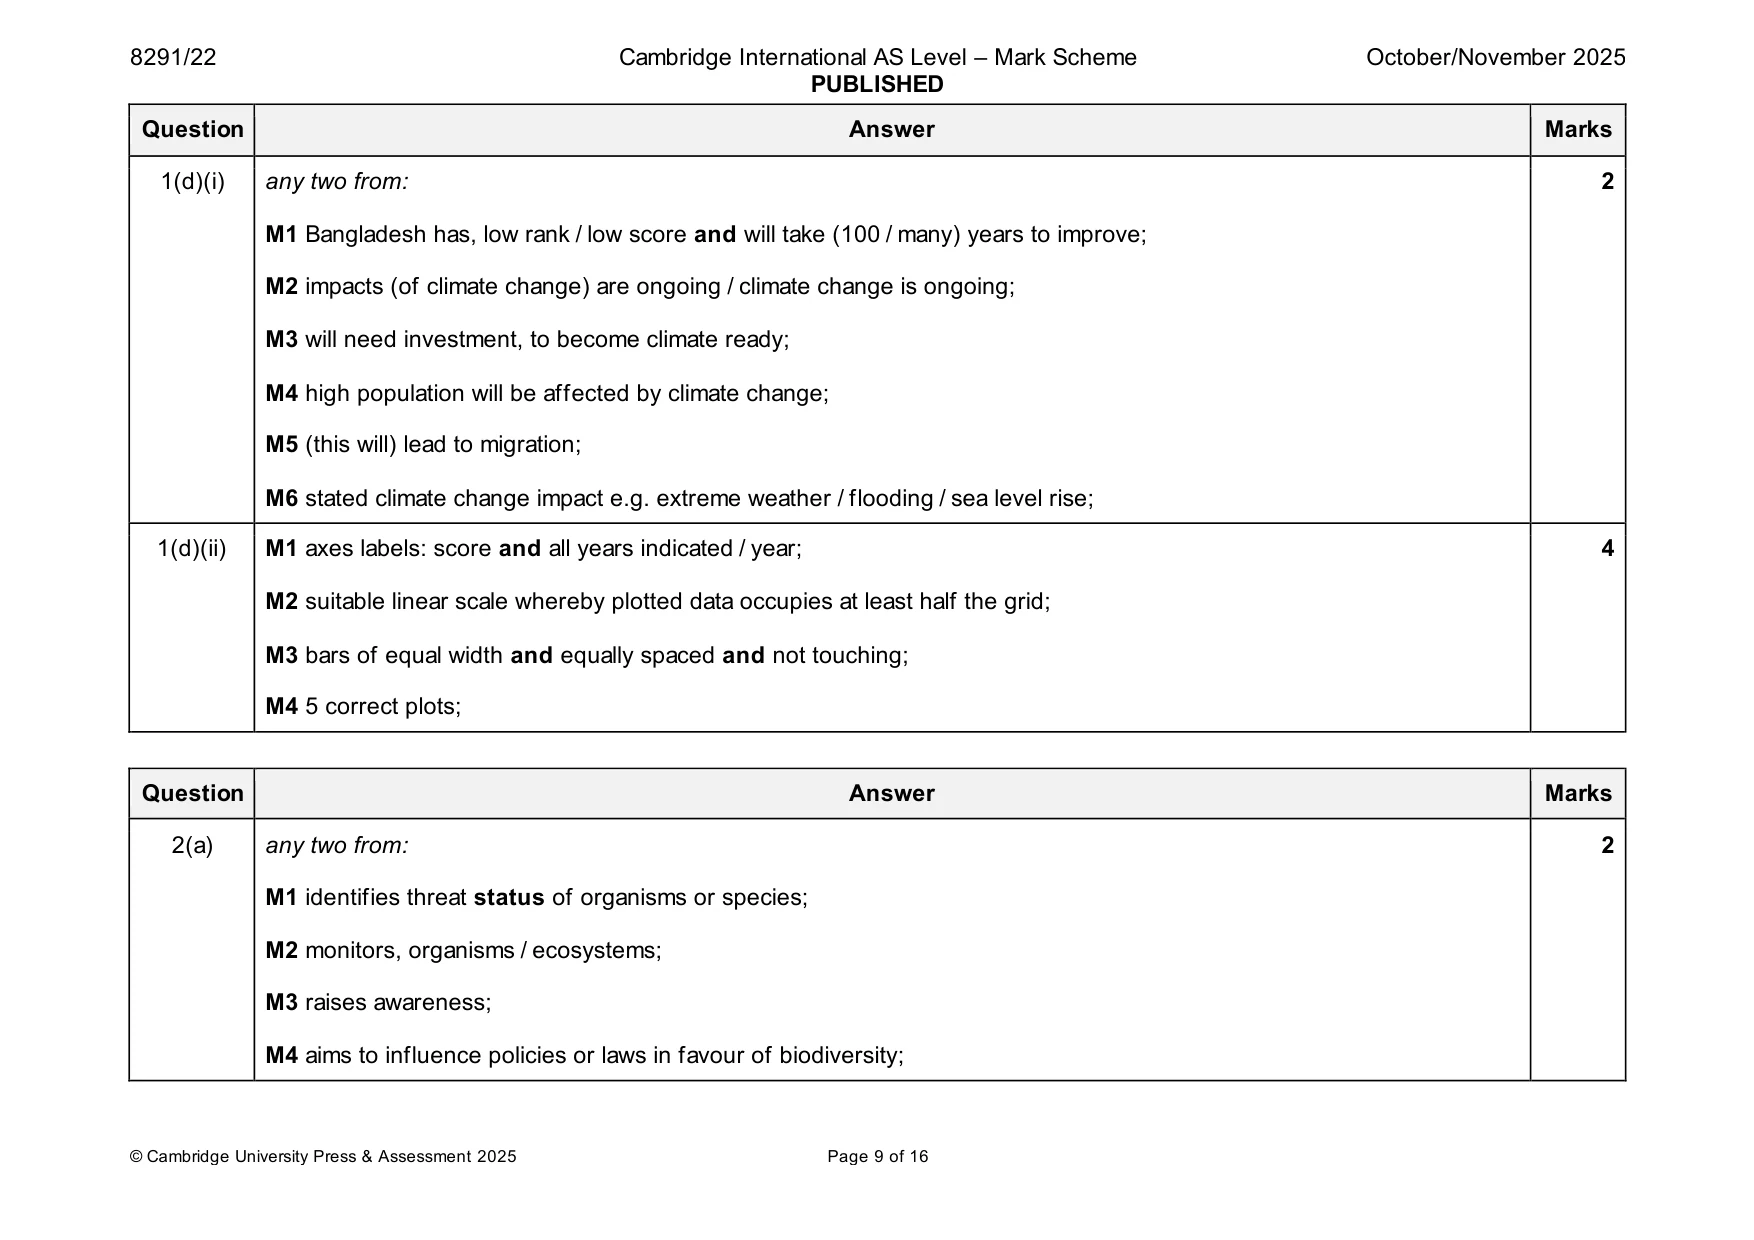
Mark scheme: Question Answer Marks 1(a)(i) M1 1171.4; 2 M2 rounded correctly / 1171; 1(a)(ii) M1 idea that some (environmental) factors, increase population density / decrease population density; 4 any three factors described: M2 suitable climate e.g. weather not too hot or not too cold / enough rain; M3 relief of land e.g. not too hilly; M4 suitable soil fertility (to grow crops); M5 (availability of, or access to) natural resources / (natural) energy / food / minerals; M6 (availability of, or access to) water (supply); M7 low risk of natural hazards; M8 access to coast, for fishing / recreation / trade / transport; 1(b) M1 correct plotting: male = 5% and female = 3%; 2 M2 same width bars; 1(c) total four from: 4 max three increase (to 2060): M1 improved health care; M2 improved sanitation; M3 economic position of Bangladesh improves / becomes a HIC or HMIC; M4 stated economic or social reason for migration to Bangladesh e.g. for jobs, for education, for housing, to escape conflict; max three decrease (2060 onwards) M5 improved availability of contraception; M6 improved education about contraception; M7 improved, education / opportunities for women; M8 limited availability of stated resource e.g. water, food, energy; M9 impact of climate change / stated impact e.g. flooding; 1(d)(i) any two from: 2 M1 Bangladesh has, low rank / low score and will take (100 / many) years to improve; M2 impacts (of climate change) are ongoing / climate change is ongoing; M3 will need investment, to become climate ready; M4 high population will be affected by climate change; M5 (this will) lead to migration; M6 stated climate change impact e.g. extreme weather / flooding / sea level rise; 1(d)(ii) M1 axes labels: score and all years indicated / year; 4 M2 suitable linear scale whereby plotted data occupies at least half the grid; M3 bars of equal width and equally spaced and not touching; M4 5 correct plots;
Question 2
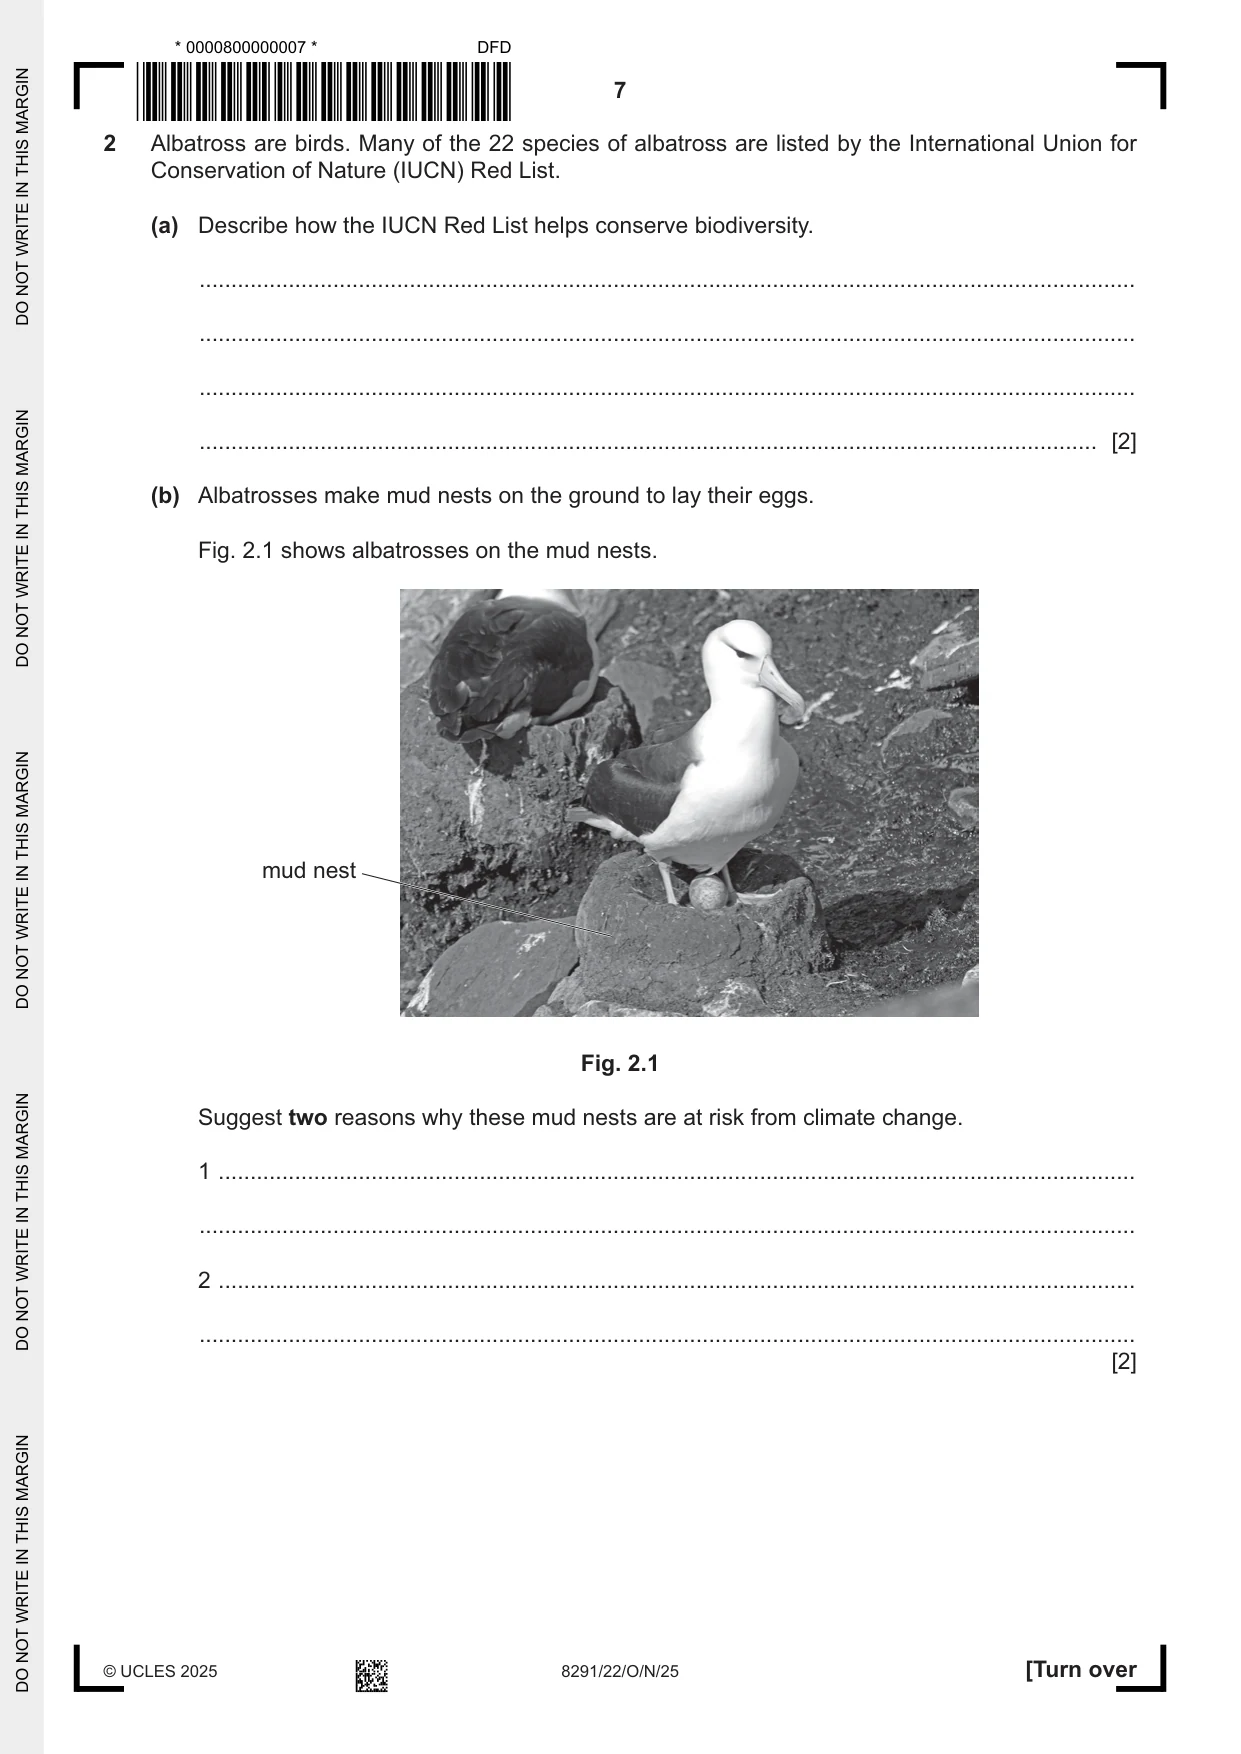
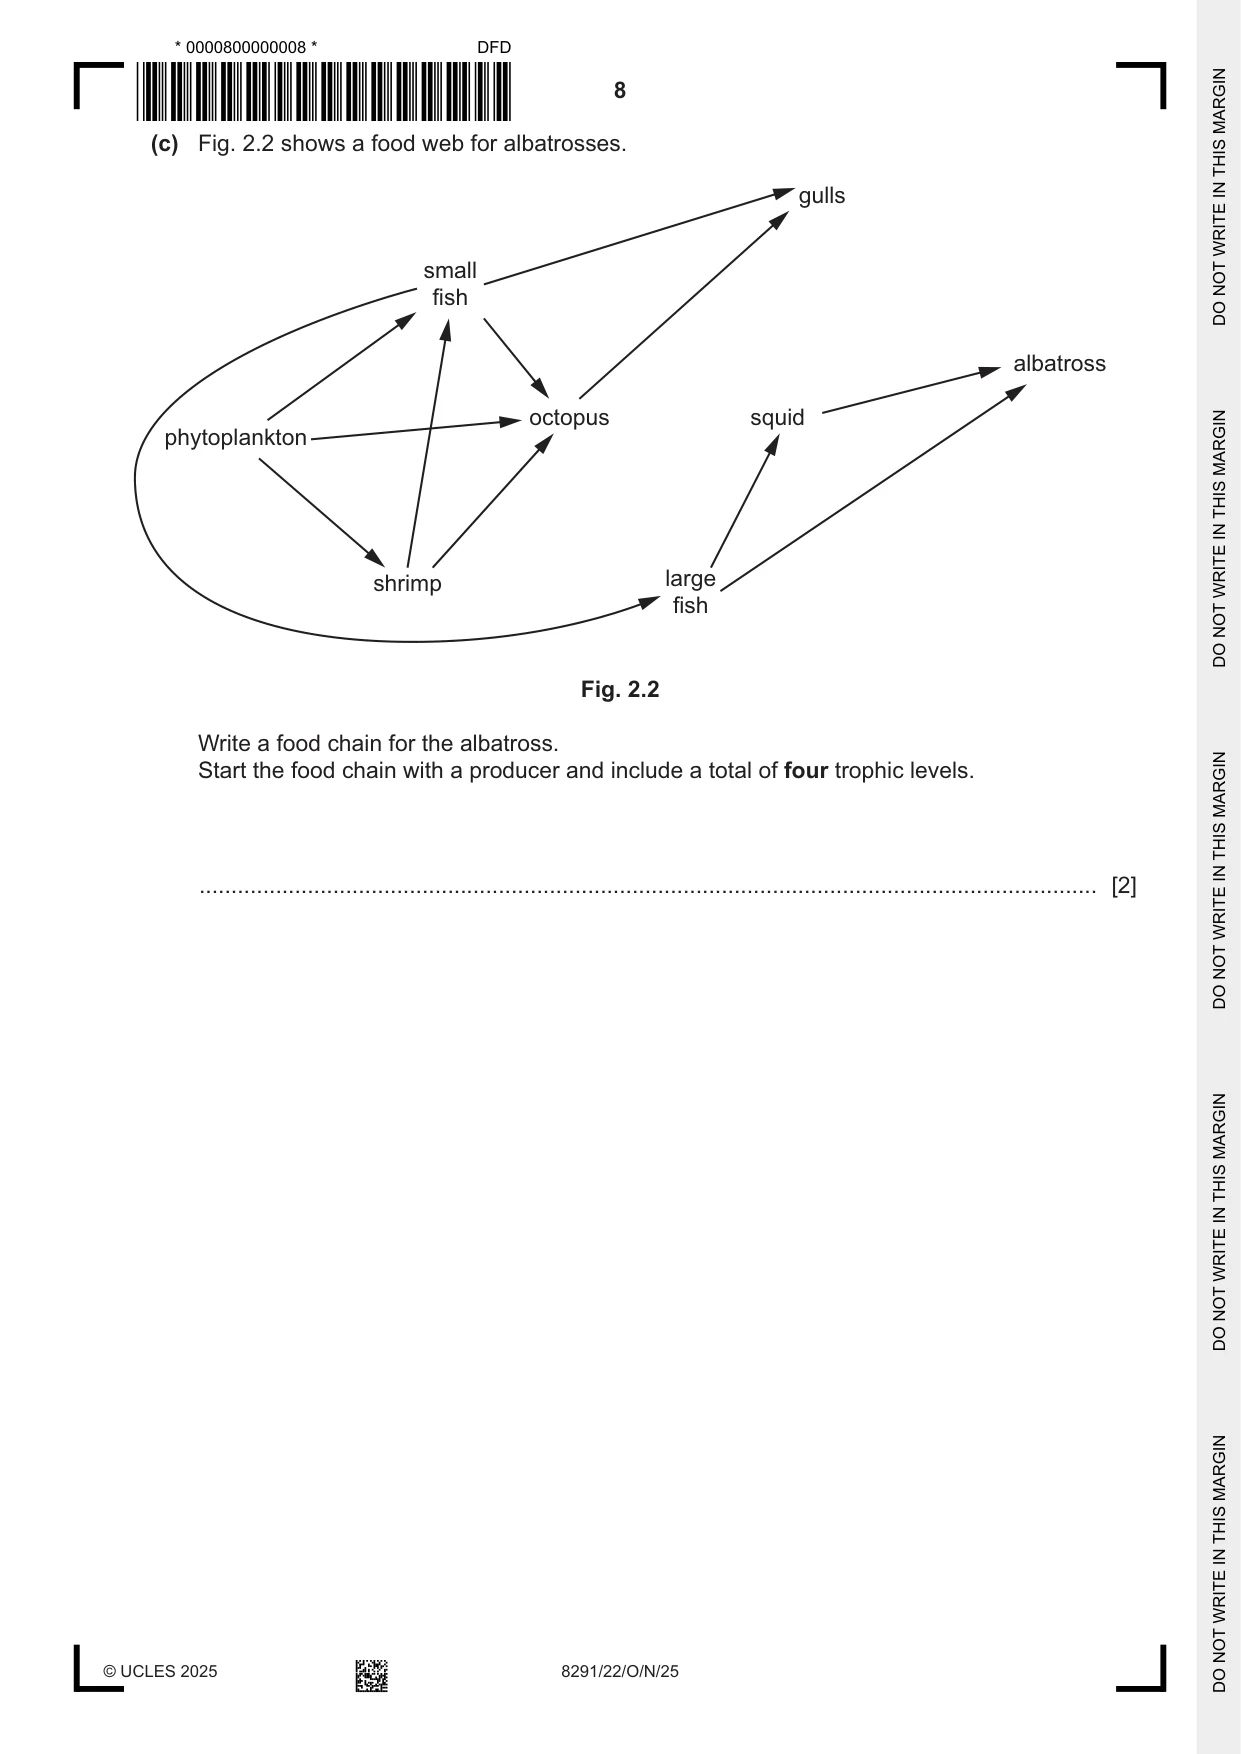
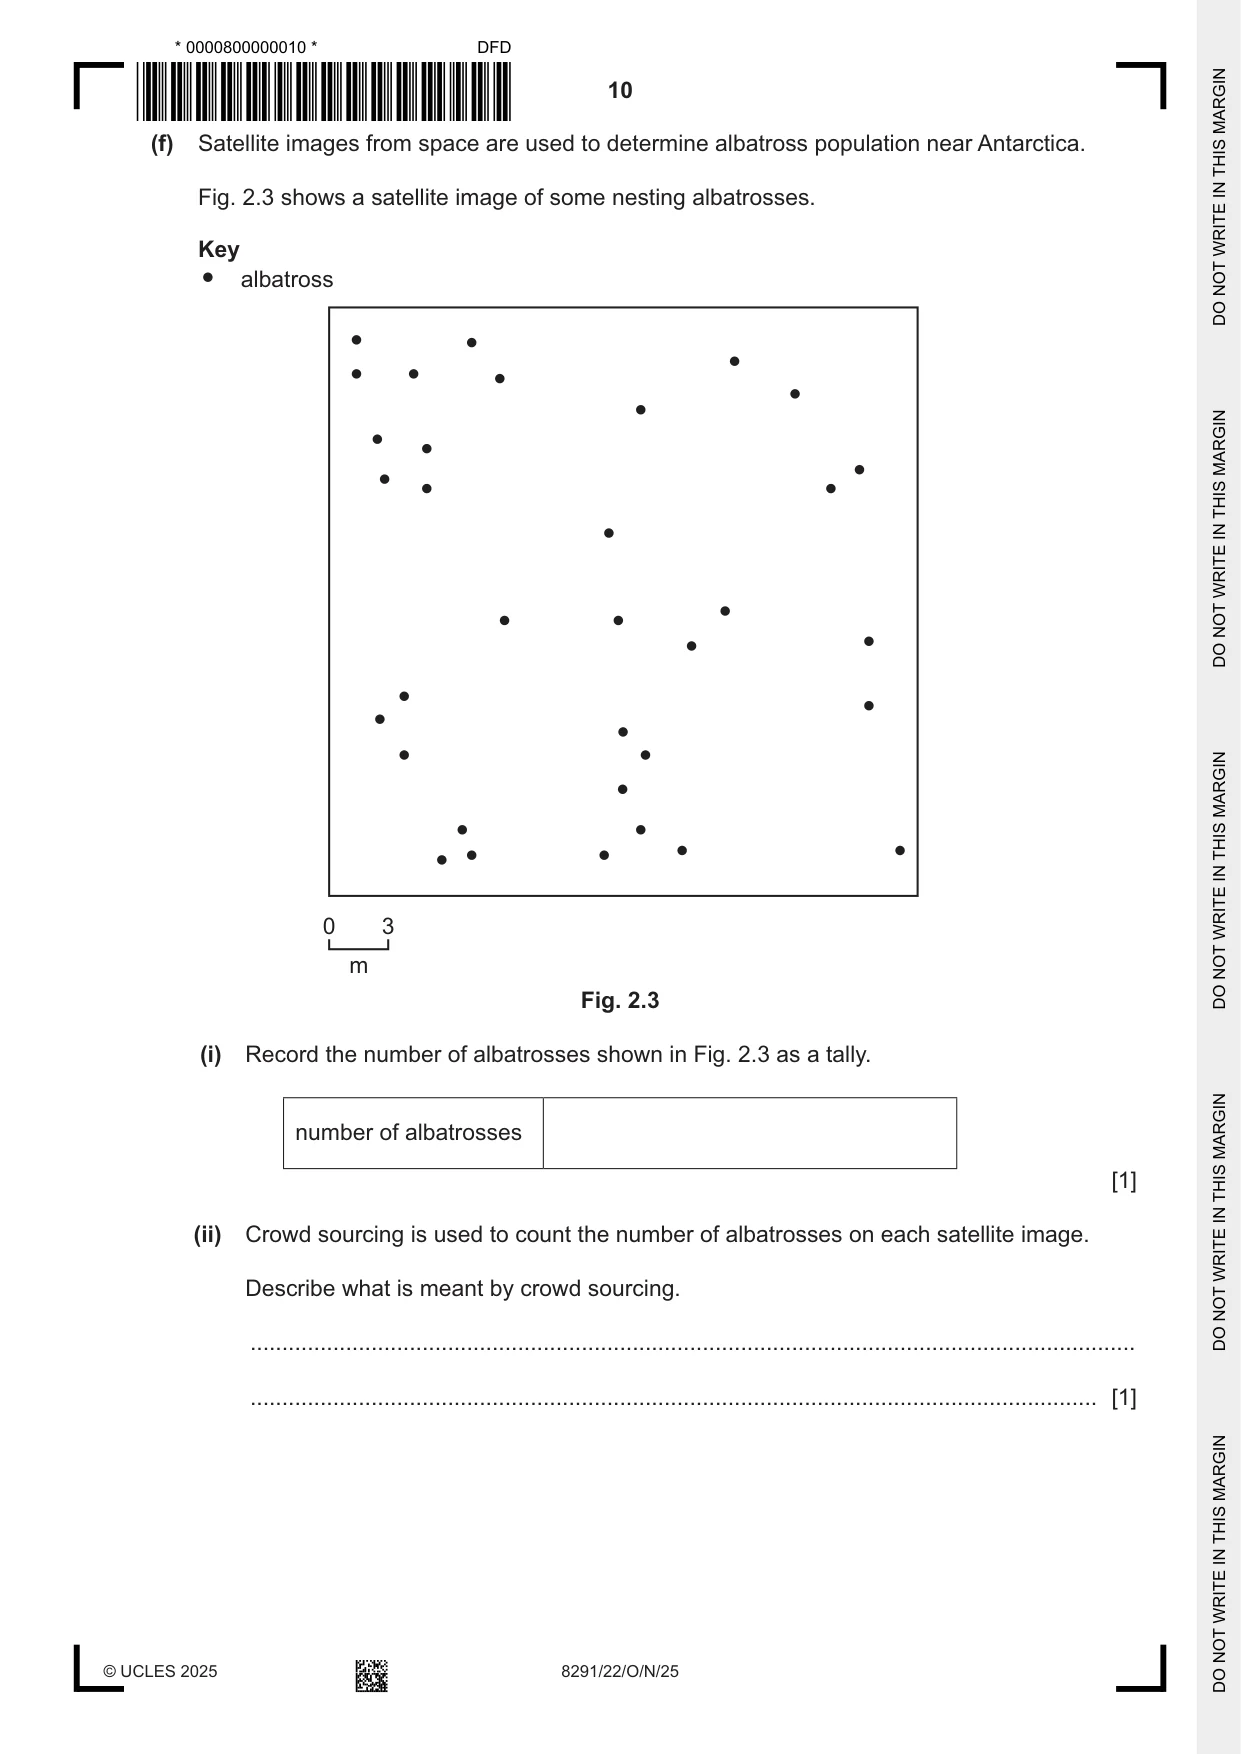
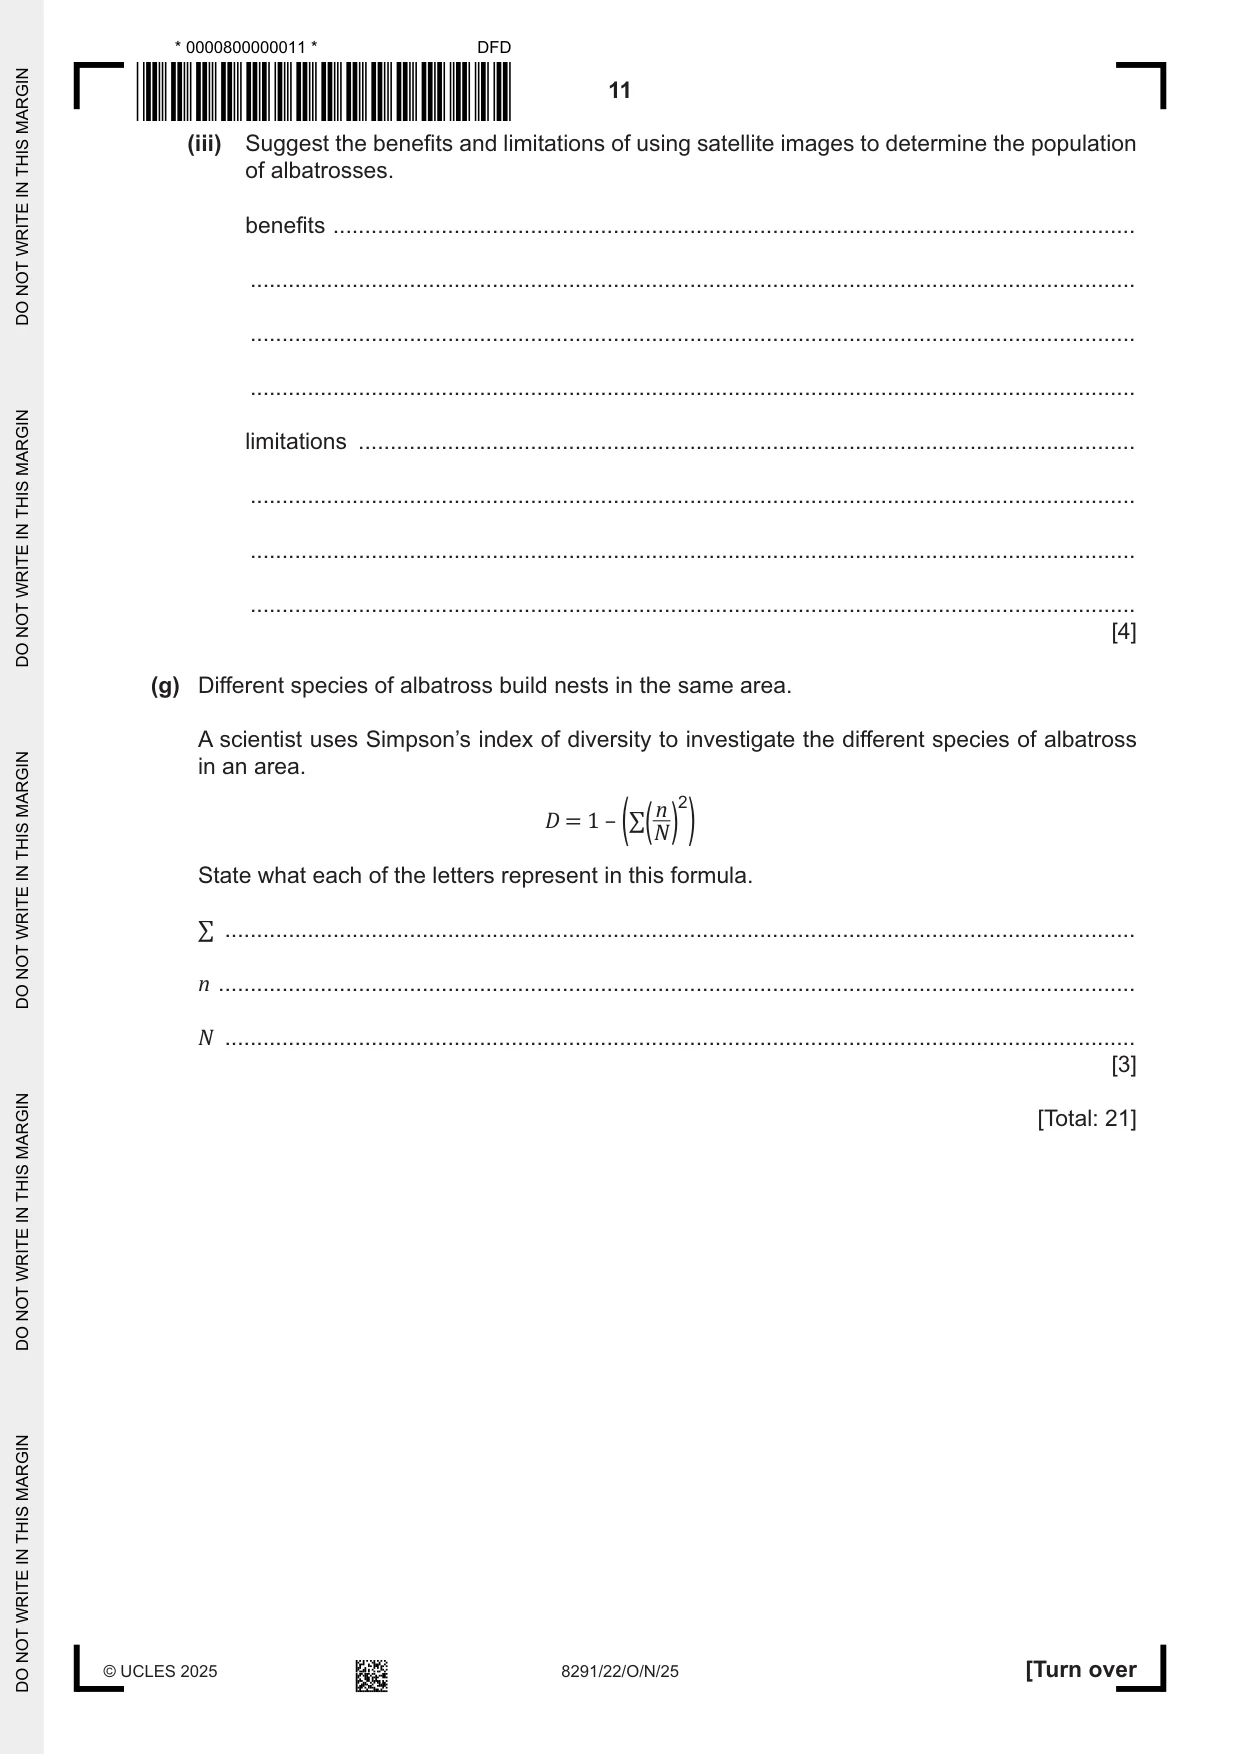
2 Albatross are birds. Many of the 22 species of albatross are listed by the International Union for Conservation of Nature (IUCN) Red List. (a) Describe how the IUCN Red List helps conserve biodiversity. ................................................................................................................................................... ................................................................................................................................................... ................................................................................................................................................... ............................................................................................................................................. [2] (b) Albatrosses make mud nests on the ground to lay their eggs. Fig. 2.1 shows albatrosses on the mud nests. mud nest Fig. 2.1 Suggest two reasons why these mud nests are at risk from climate change. 1 ................................................................................................................................................ ................................................................................................................................................... 2 ................................................................................................................................................ ................................................................................................................................................... [2] (c) Fig. 2.2 shows a food web for albatrosses. gulls small fish albatross octopus squid phytoplankton shrimp large fish Fig. 2.2 Write a food chain for the albatross. Start the food chain with a producer and include a total of four trophic levels. ............................................................................................................................................. [2] (d) Mercury is a toxic metal. The concentration of mercury in organisms in the food web in Fig. 2.2 is investigated. For albatrosses, their feathers are analysed. For the other organisms in the food web, their flesh is analysed. (i) Suggest two reasons why only the feathers are analysed for albatrosses. 1 ........................................................................................................................................ ........................................................................................................................................... 2 ........................................................................................................................................ ........................................................................................................................................... [2] (ii) The mean level of mercury in the prey of the albatross was 0.0005 μg per g. Circle the predicted mean level of mercury in albatrosses. Explain your answer. 0.0001 μg per g 0.0005 μg per g 3.88 μg per g ........................................................................................................................................... ........................................................................................................................................... [2] (e) Albatrosses can travel over 1500 km a day to find food. Suggest how radio tracking is used to record the distances albatrosses travel to find food. ................................................................................................................................................... ................................................................................................................................................... ................................................................................................................................................... ............................................................................................................................................. [2] (f) Satellite images from space are used to determine albatross population near Antarctica. Fig. 2.3 shows a satellite image of some nesting albatrosses. Key albatross 0 3 m Fig. 2.3 (i) Record the number of albatrosses shown in Fig. 2.3 as a tally. number of albatrosses [1] (ii) Crowd sourcing is used to count the number of albatrosses on each satellite image. Describe what is meant by crowd sourcing. ........................................................................................................................................... ..................................................................................................................................... [1] (iii) Suggest the benefits and limitations of using satellite images to determine the population of albatrosses. benefits .............................................................................................................................. ........................................................................................................................................... ........................................................................................................................................... ........................................................................................................................................... limitations .......................................................................................................................... ........................................................................................................................................... ........................................................................................................................................... ........................................................................................................................................... [4] (g) Different species of albatross build nests in the same area. A scientist uses Simpson’s index of diversity to investigate the different species of albatross in an area. D = 1 – (∑(nN) 2) State what each of the letters represent in this formula. ∑ ............................................................................................................................................... n ................................................................................................................................................ N ............................................................................................................................................... [3] [Total: 21]
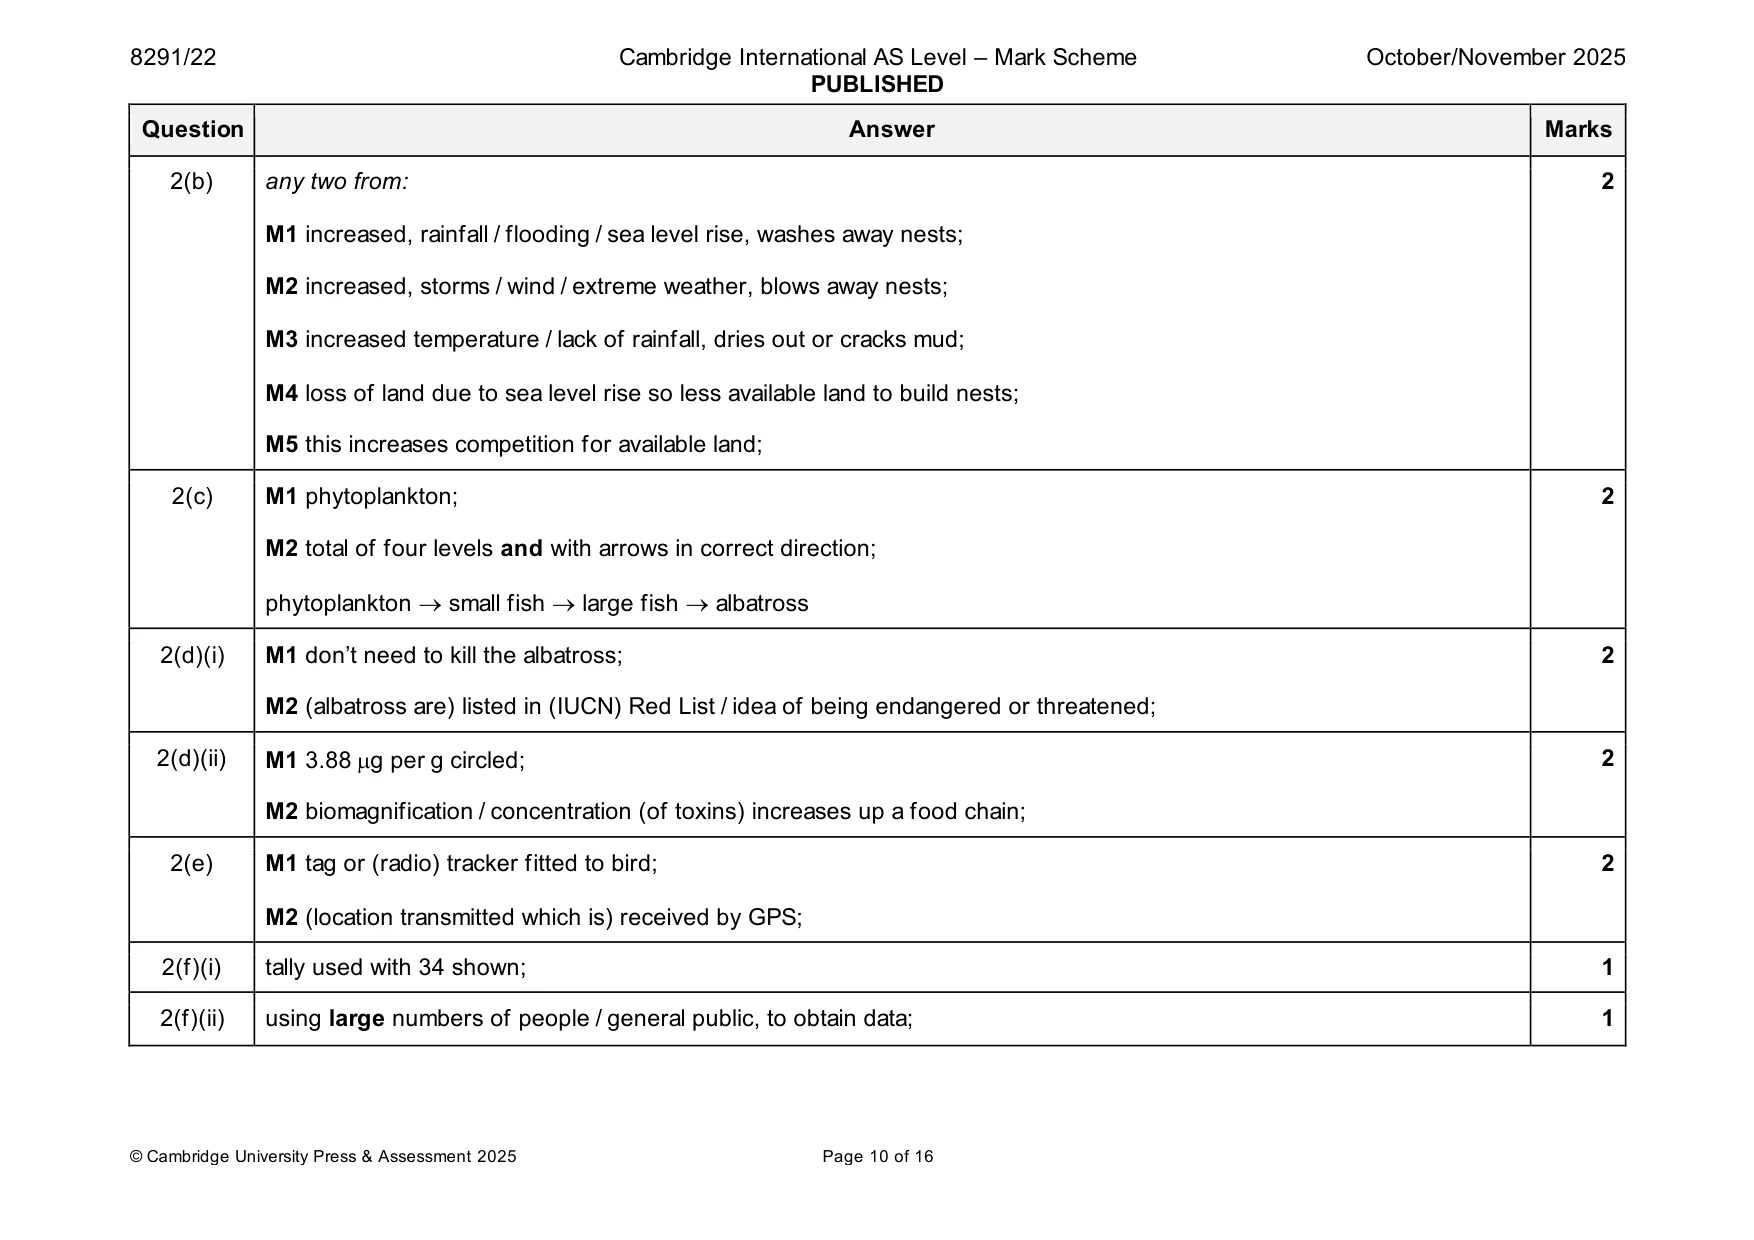
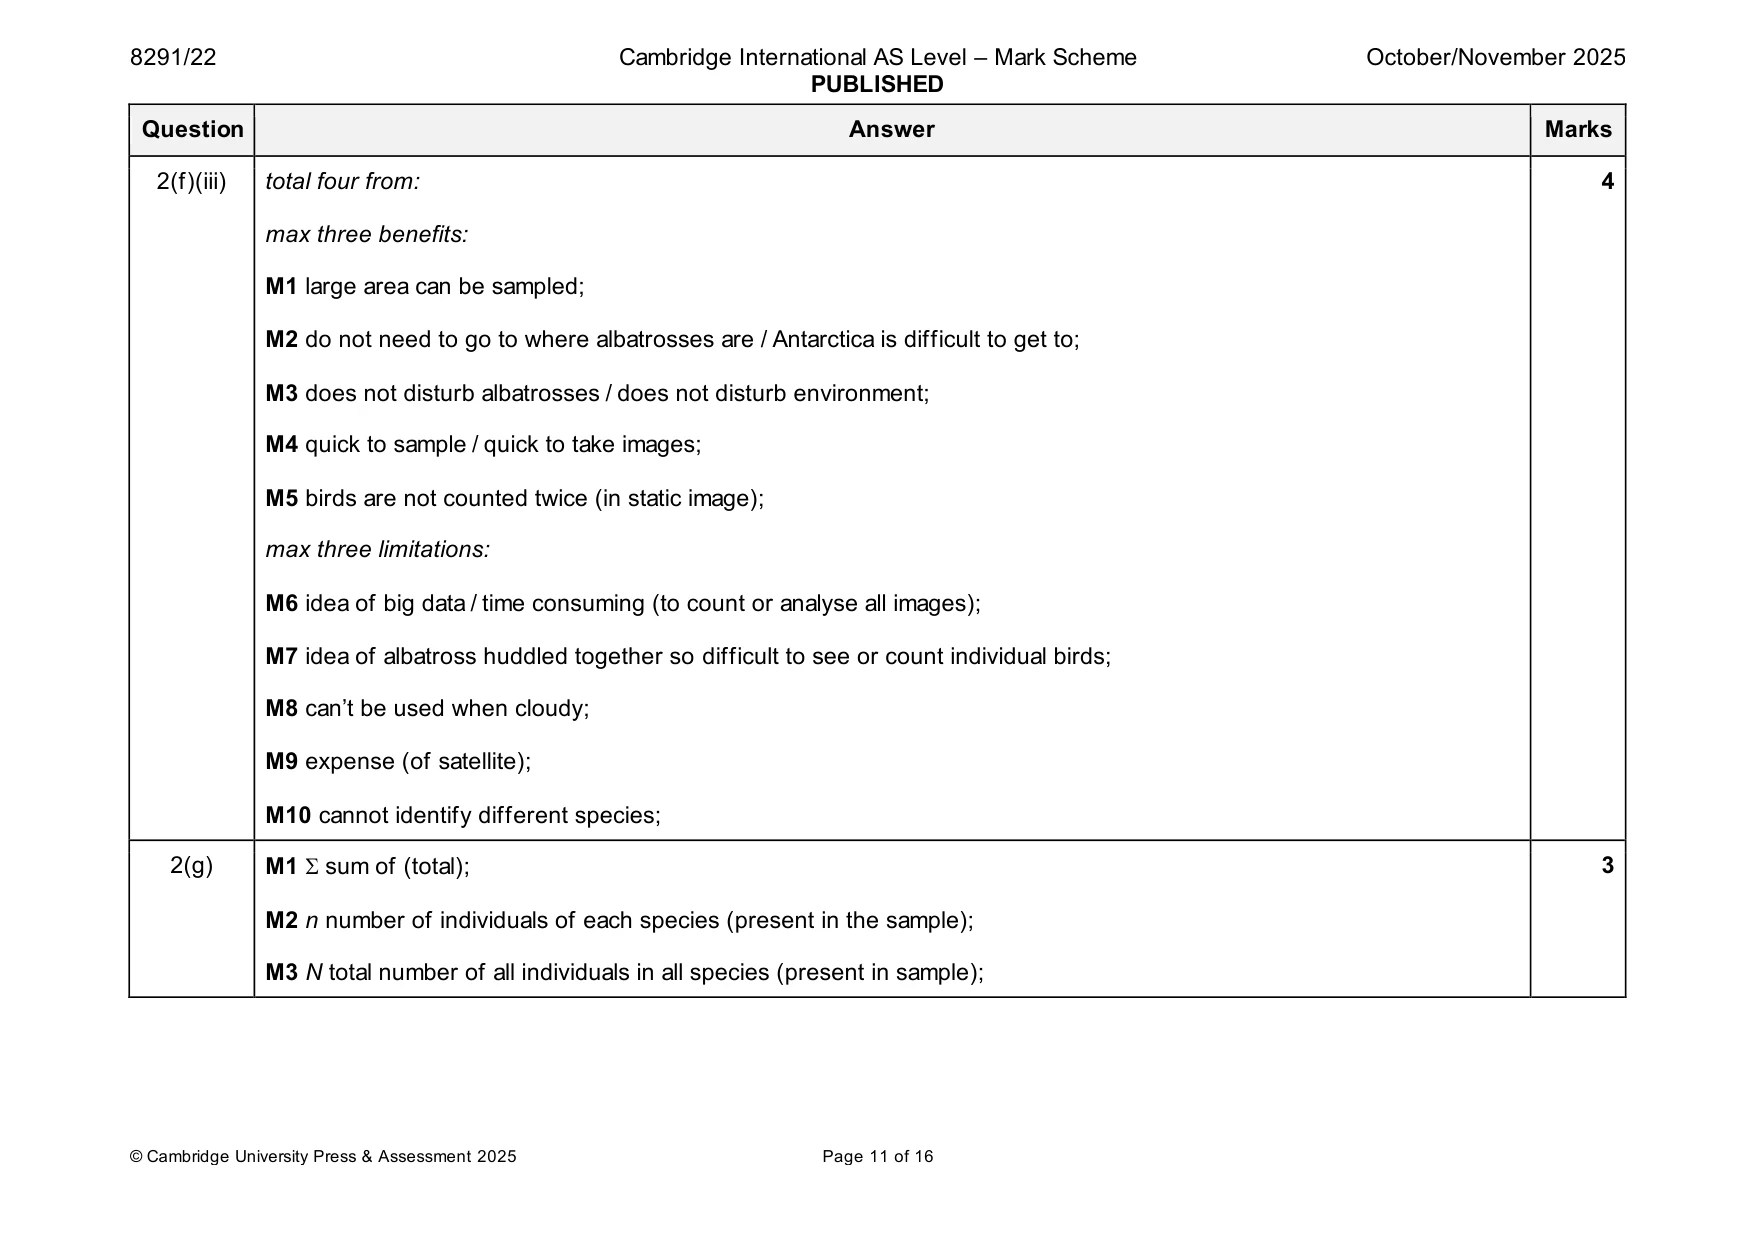
Mark scheme: 2(a) any two from: 2 M1 identifies threat status of organisms or species; M2 monitors, organisms / ecosystems; M3 raises awareness; M4 aims to influence policies or laws in favour of biodiversity; 2(b) any two from: 2 M1 increased, rainfall / flooding / sea level rise, washes away nests; M2 increased, storms / wind / extreme weather, blows away nests; M3 increased temperature / lack of rainfall, dries out or cracks mud; M4 loss of land due to sea level rise so less available land to build nests; M5 this increases competition for available land; 2(c) M1 phytoplankton; 2 M2 total of four levels and with arrows in correct direction; phytoplankton → small fish → large fish → albatross 2(d)(i) M1 don’t need to kill the albatross; 2 M2 (albatross are) listed in (IUCN) Red List / idea of being endangered or threatened; 2(d)(ii) M1 3.88 g per g circled; 2 M2 biomagnification / concentration (of toxins) increases up a food chain; 2(e) M1 tag or (radio) tracker fitted to bird; 2 M2 (location transmitted which is) received by GPS; 2(f)(i) tally used with 34 shown; 1 2(f)(ii) using large numbers of people / general public, to obtain data; 1 2(f)(iii) total four from: 4 max three benefits: M1 large area can be sampled; M2 do not need to go to where albatrosses are / Antarctica is difficult to get to; M3 does not disturb albatrosses / does not disturb environment; M4 quick to sample / quick to take images; M5 birds are not counted twice (in static image); max three limitations: M6 idea of big data / time consuming (to count or analyse all images); M7 idea of albatross huddled together so difficult to see or count individual birds; M8 can’t be used when cloudy; M9 expense (of satellite); M10 cannot identify different species; 2(g) M1 sum of (total); 3 M2 n number of individuals of each species (present in the sample); M3 N total number of all individuals in all species (present in sample);
More questions on The use of technology in data collection and analysis
Q3 · Part of a sand dune
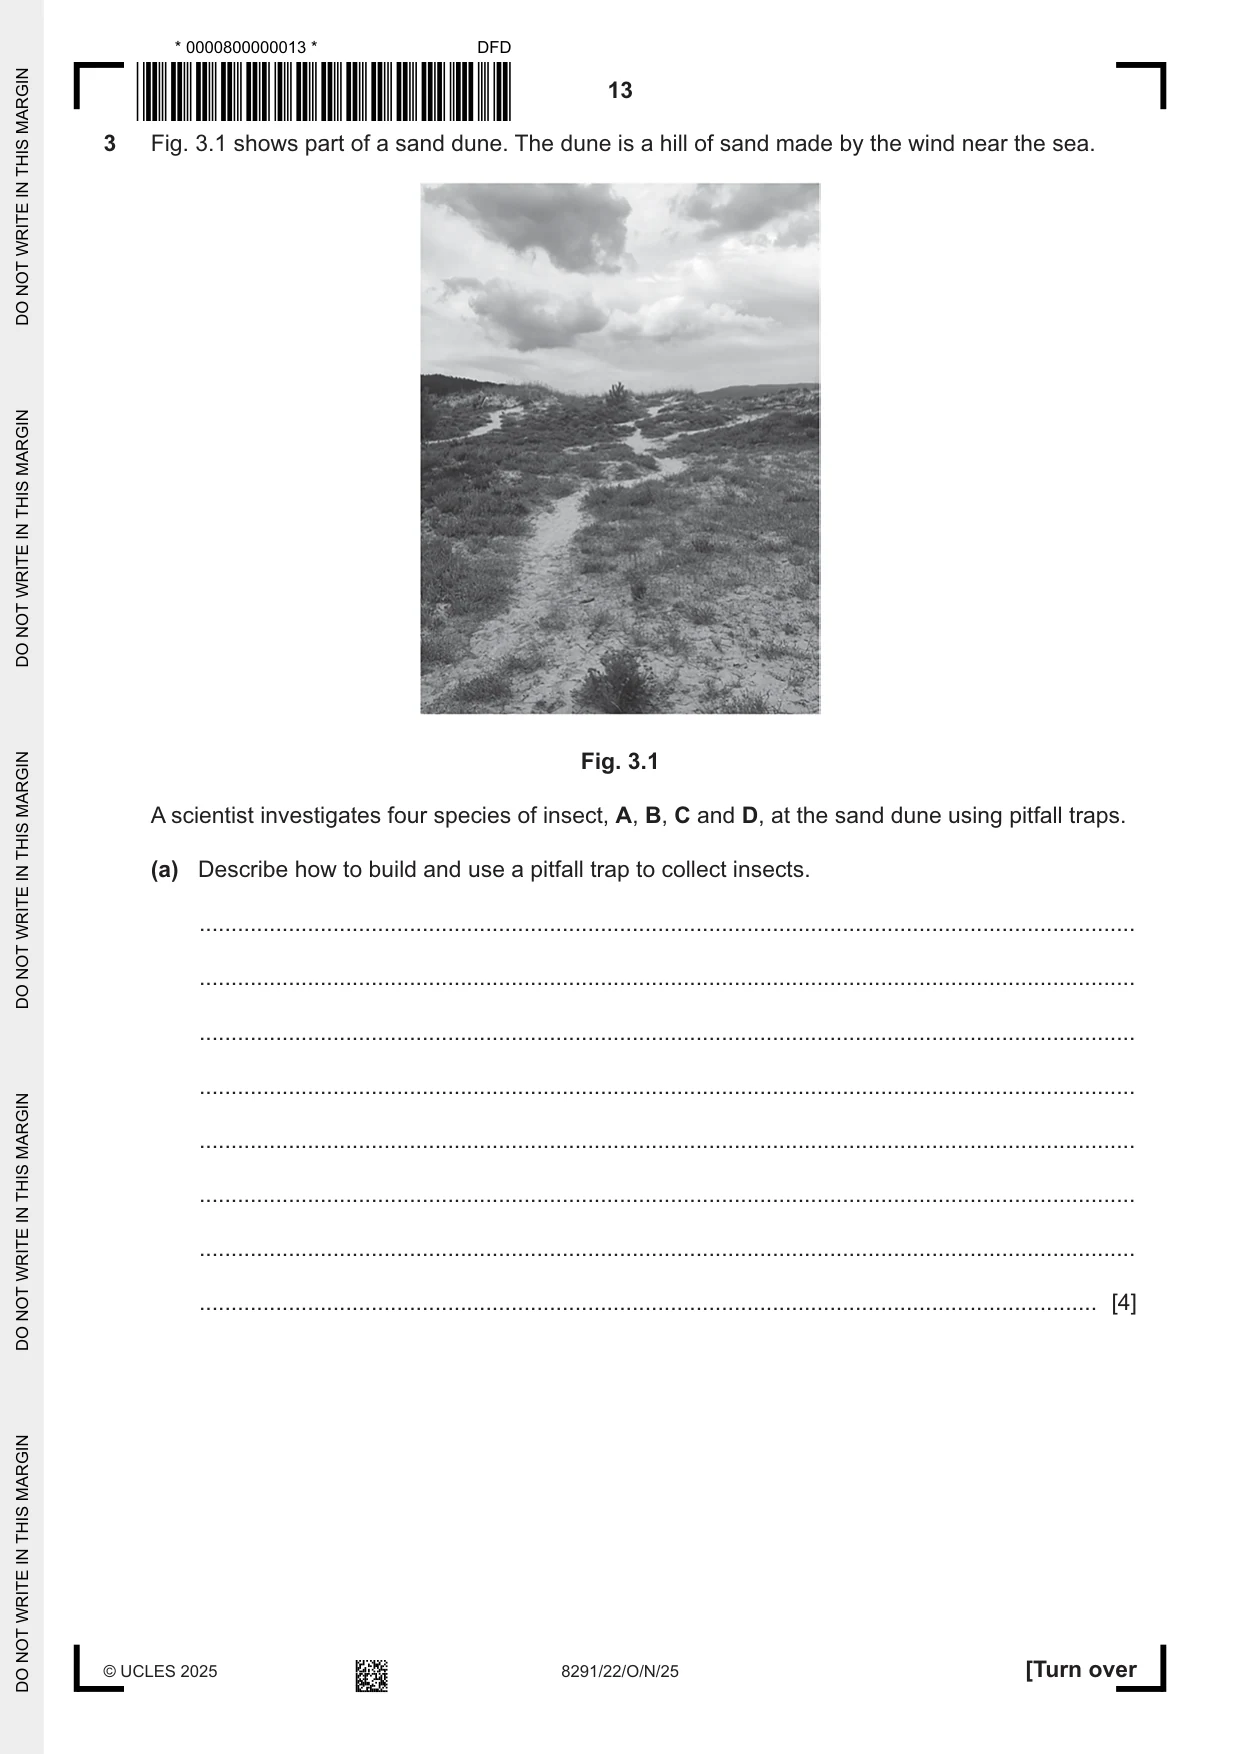
3 Fig. 3.1 shows part of a sand dune. The dune is a hill of sand made by the wind near the sea. Fig. 3.1 A scientist investigates four species of insect, A, B, C and D, at the sand dune using pitfall traps. (a) Describe how to build and use a pitfall trap to collect insects. ................................................................................................................................................... ................................................................................................................................................... ................................................................................................................................................... ................................................................................................................................................... ................................................................................................................................................... ................................................................................................................................................... ................................................................................................................................................... ............................................................................................................................................. [4]
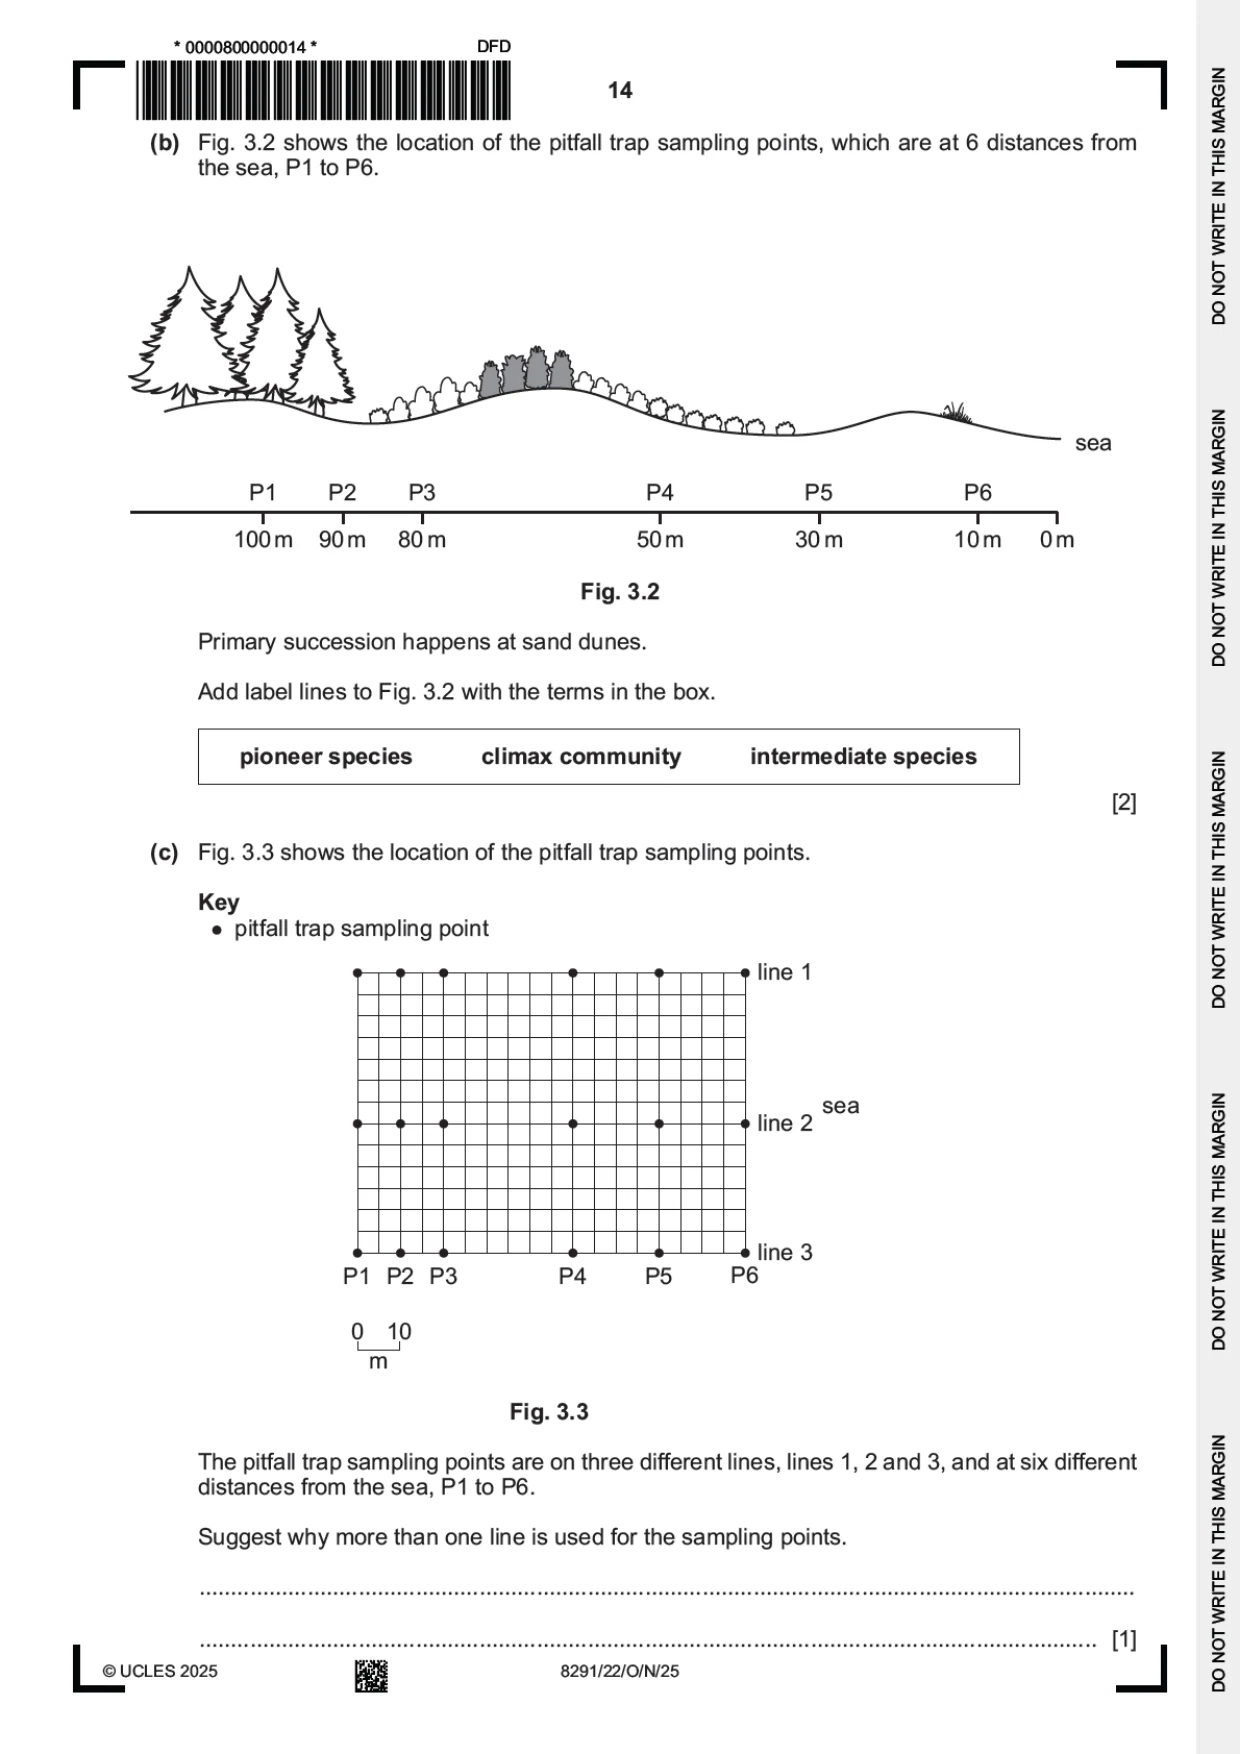
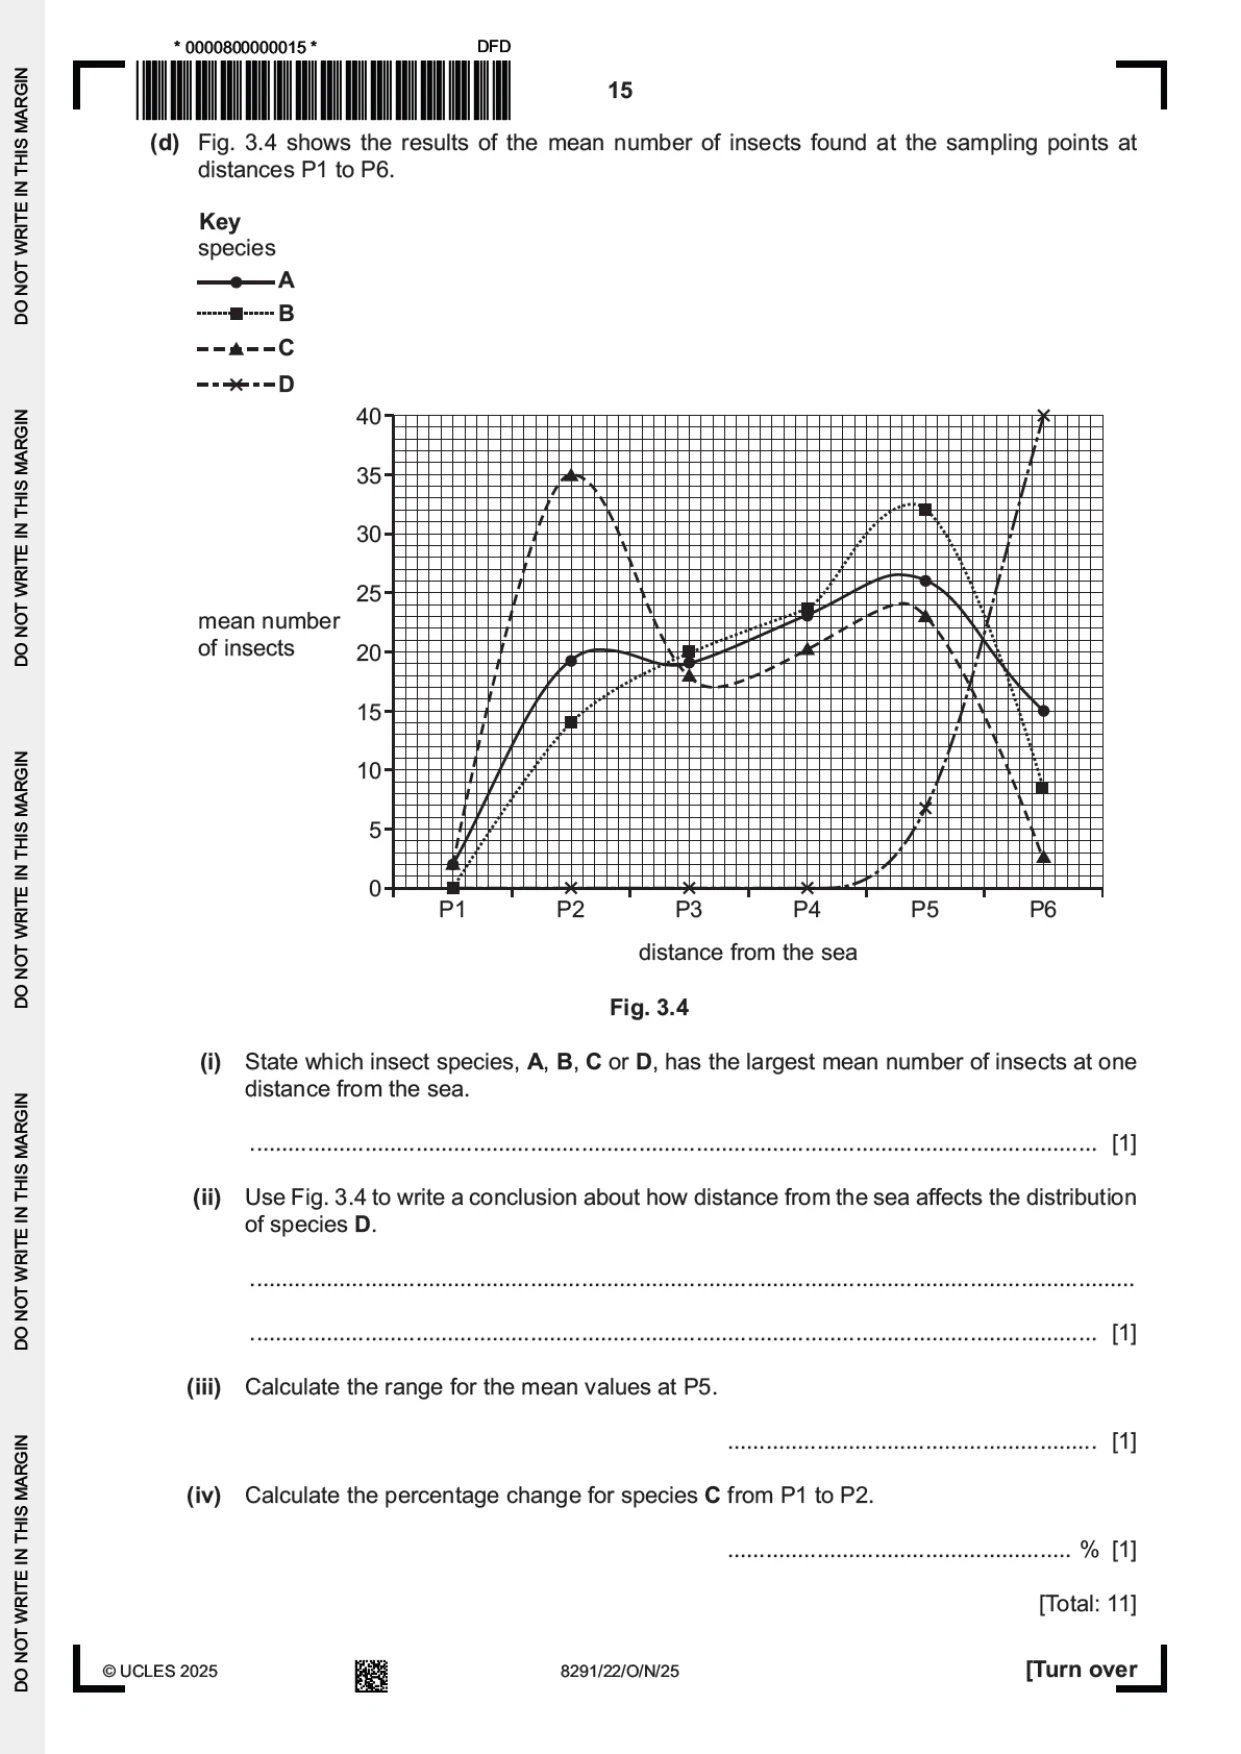
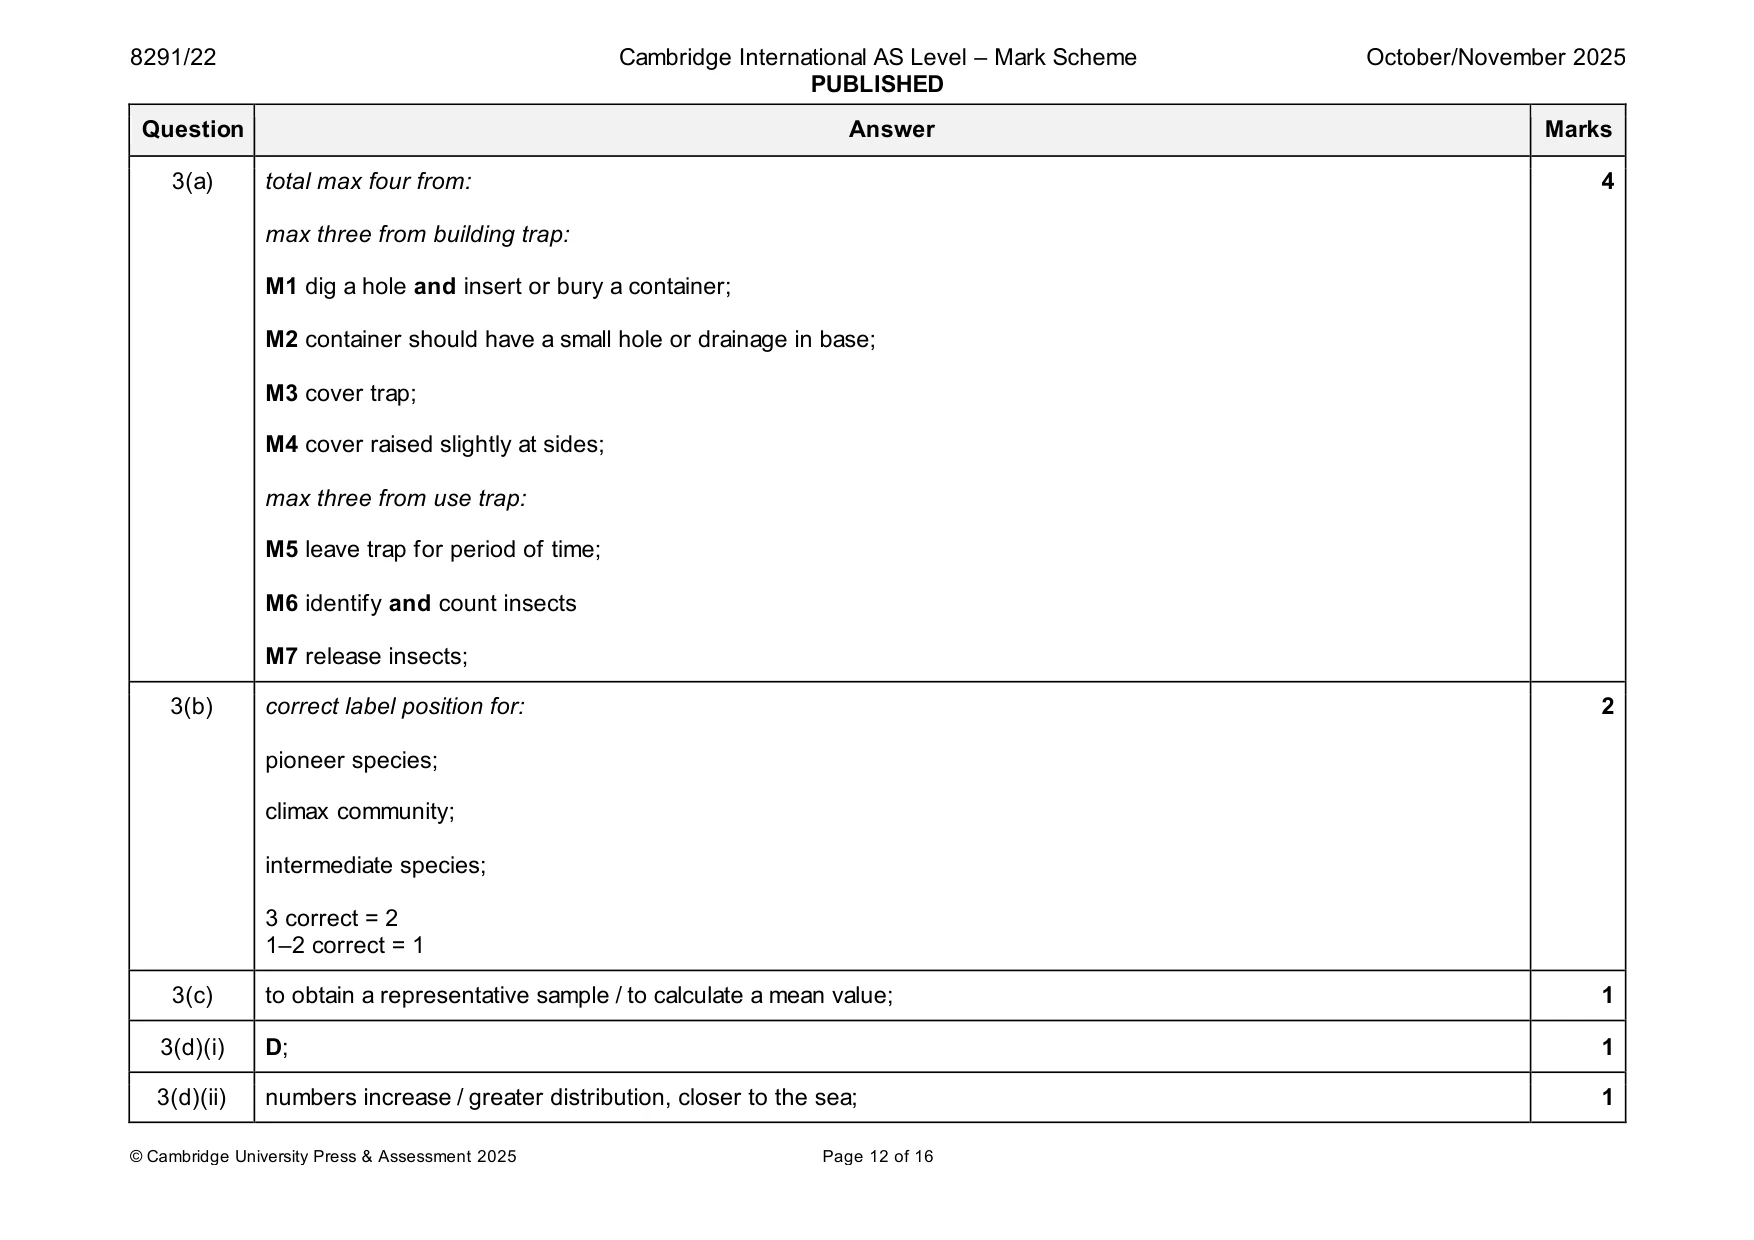
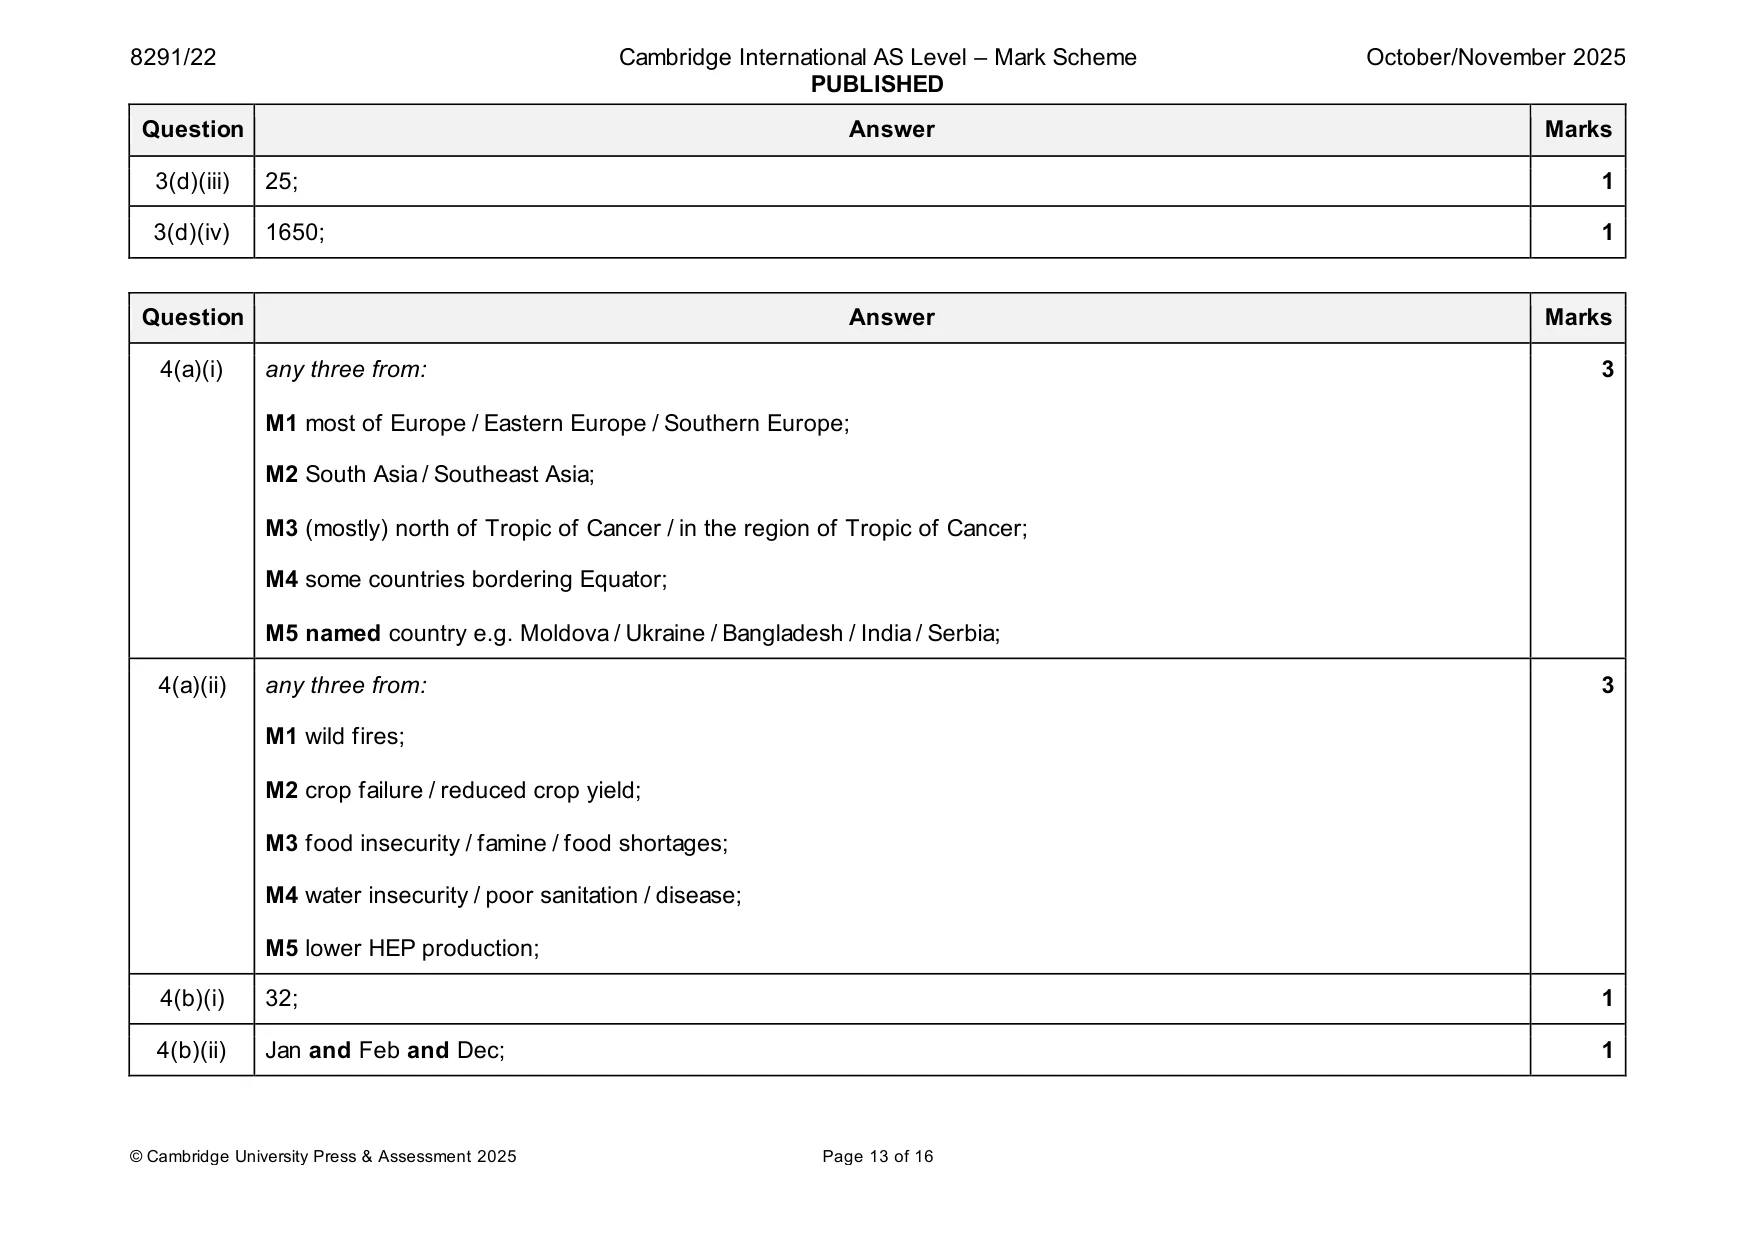
Mark scheme: 3(a) total max four from: 4 max three from building trap: M1 dig a hole and insert or bury a container; M2 container should have a small hole or drainage in base; M3 cover trap; M4 cover raised slightly at sides; max three from use trap: M5 leave trap for period of time; M6 identify and count insects M7 release insects; 3(b) correct label position for: 2 pioneer species; climax community; intermediate species; 3 correct = 2 1–2 correct = 1 3(c) to obtain a representative sample / to calculate a mean value; 1 3(d)(i) D; 1 3(d)(ii) numbers increase / greater distribution, closer to the sea; 1 3(d)(iii) 25; 1 3(d)(iv) 1650; 1
More questions on Data collection techniques and data analysis
Q4 · A map of drought risk
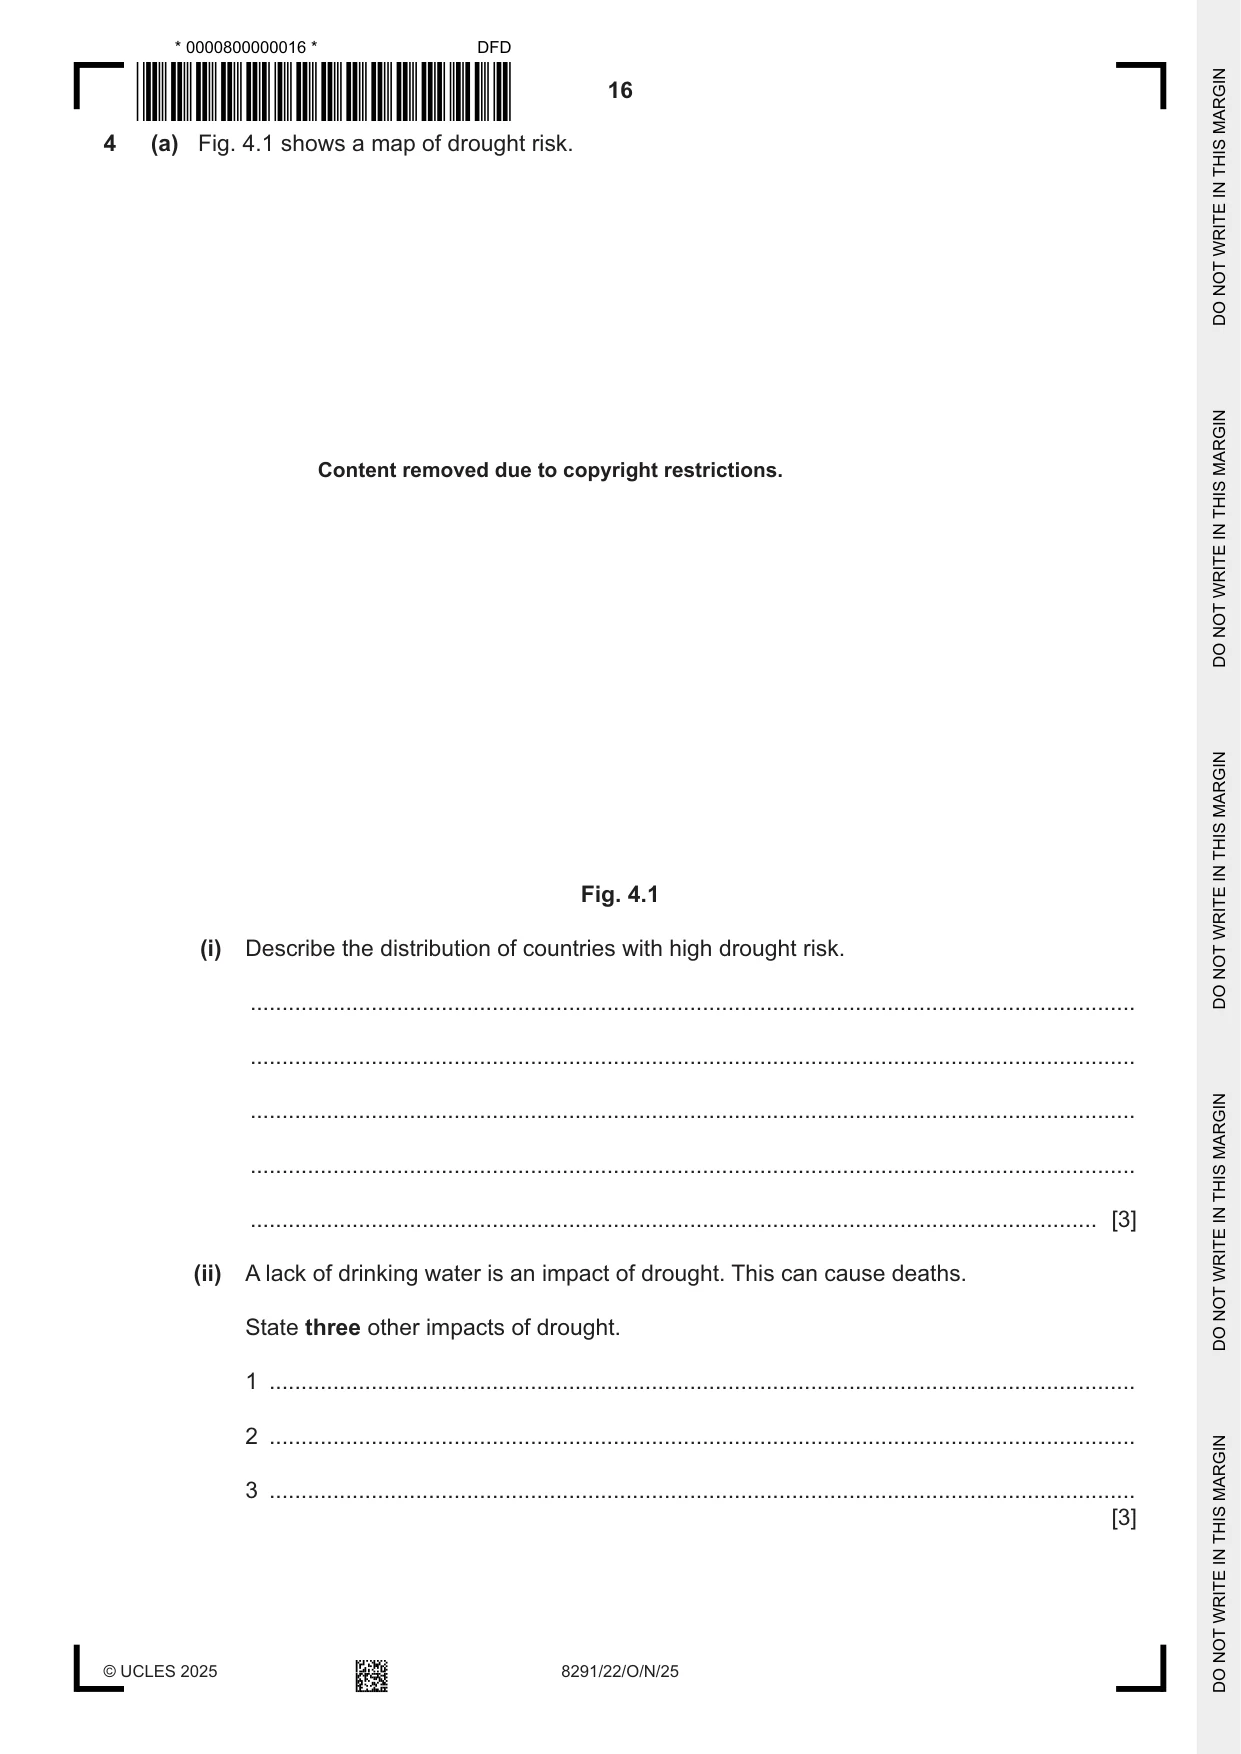
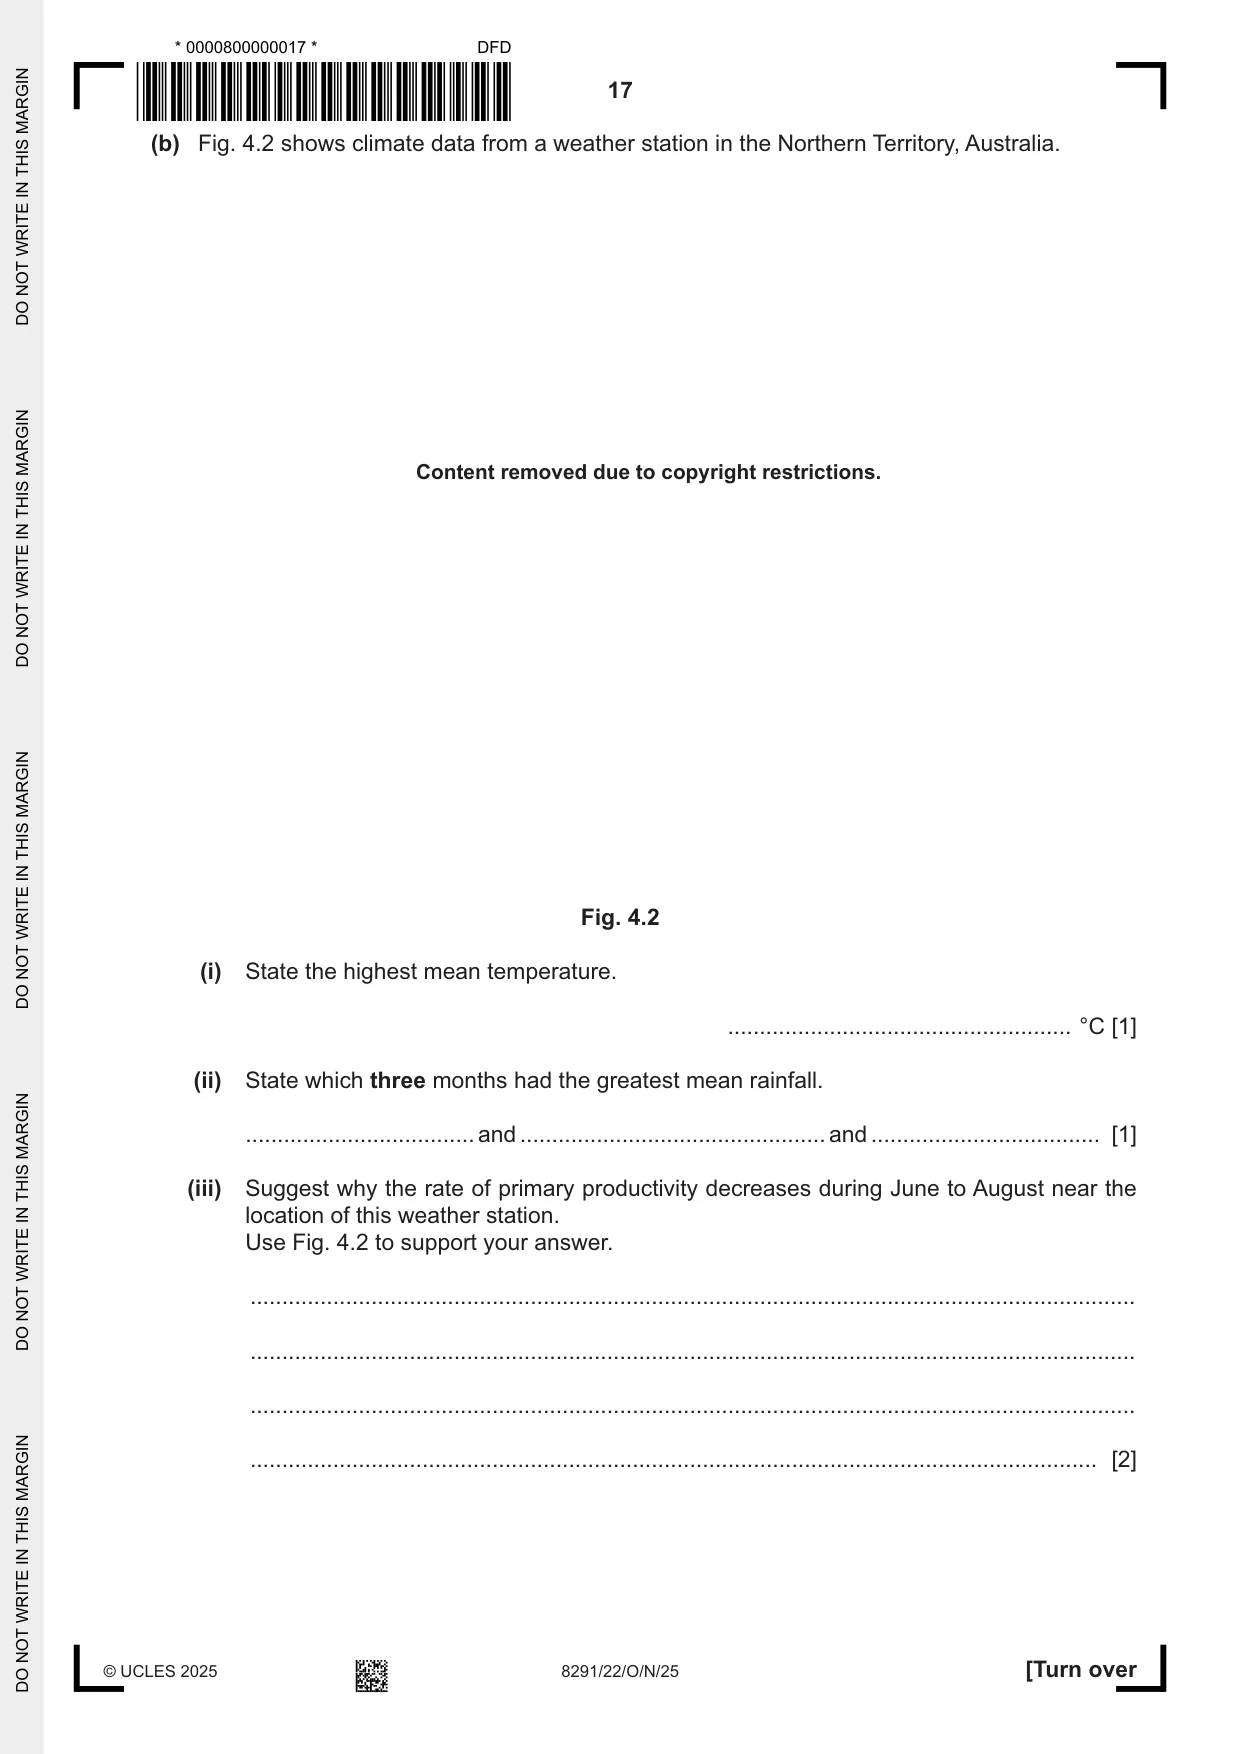
4 (a) Fig. 4.1 shows a map of drought risk. Content removed due to copyright restrictions. Fig. 4.1 (i) Describe the distribution of countries with high drought risk. ........................................................................................................................................... ........................................................................................................................................... ........................................................................................................................................... ........................................................................................................................................... ..................................................................................................................................... [3] (ii) A lack of drinking water is an impact of drought. This can cause deaths. State three other impacts of drought. 1 ........................................................................................................................................ 2 ........................................................................................................................................ 3 ........................................................................................................................................ [3] (b) Fig. 4.2 shows climate data from a weather station in the Northern Territory, Australia. Content removed due to copyright restrictions. Fig. 4.2 (i) State the highest mean temperature. ...................................................... °C [1] (ii) State which three months had the greatest mean rainfall. .................................... and ................................................ and .................................... [1] (iii) Suggest why the rate of primary productivity decreases during June to August near the location of this weather station. Use Fig. 4.2 to support your answer. ........................................................................................................................................... ........................................................................................................................................... ........................................................................................................................................... ..................................................................................................................................... [2] (c) Some areas of the Northern Territory have a grassland biome. Describe the soil type in a grassland biome. ................................................................................................................................................... ................................................................................................................................................... ................................................................................................................................................... ............................................................................................................................................. [2] (d) Cane toads are an invasive species in the Northern Territory. Explain the impacts of invasive species on biodiversity. ................................................................................................................................................... ................................................................................................................................................... ................................................................................................................................................... ................................................................................................................................................... ................................................................................................................................................... ............................................................................................................................................. [3] [Total: 15]
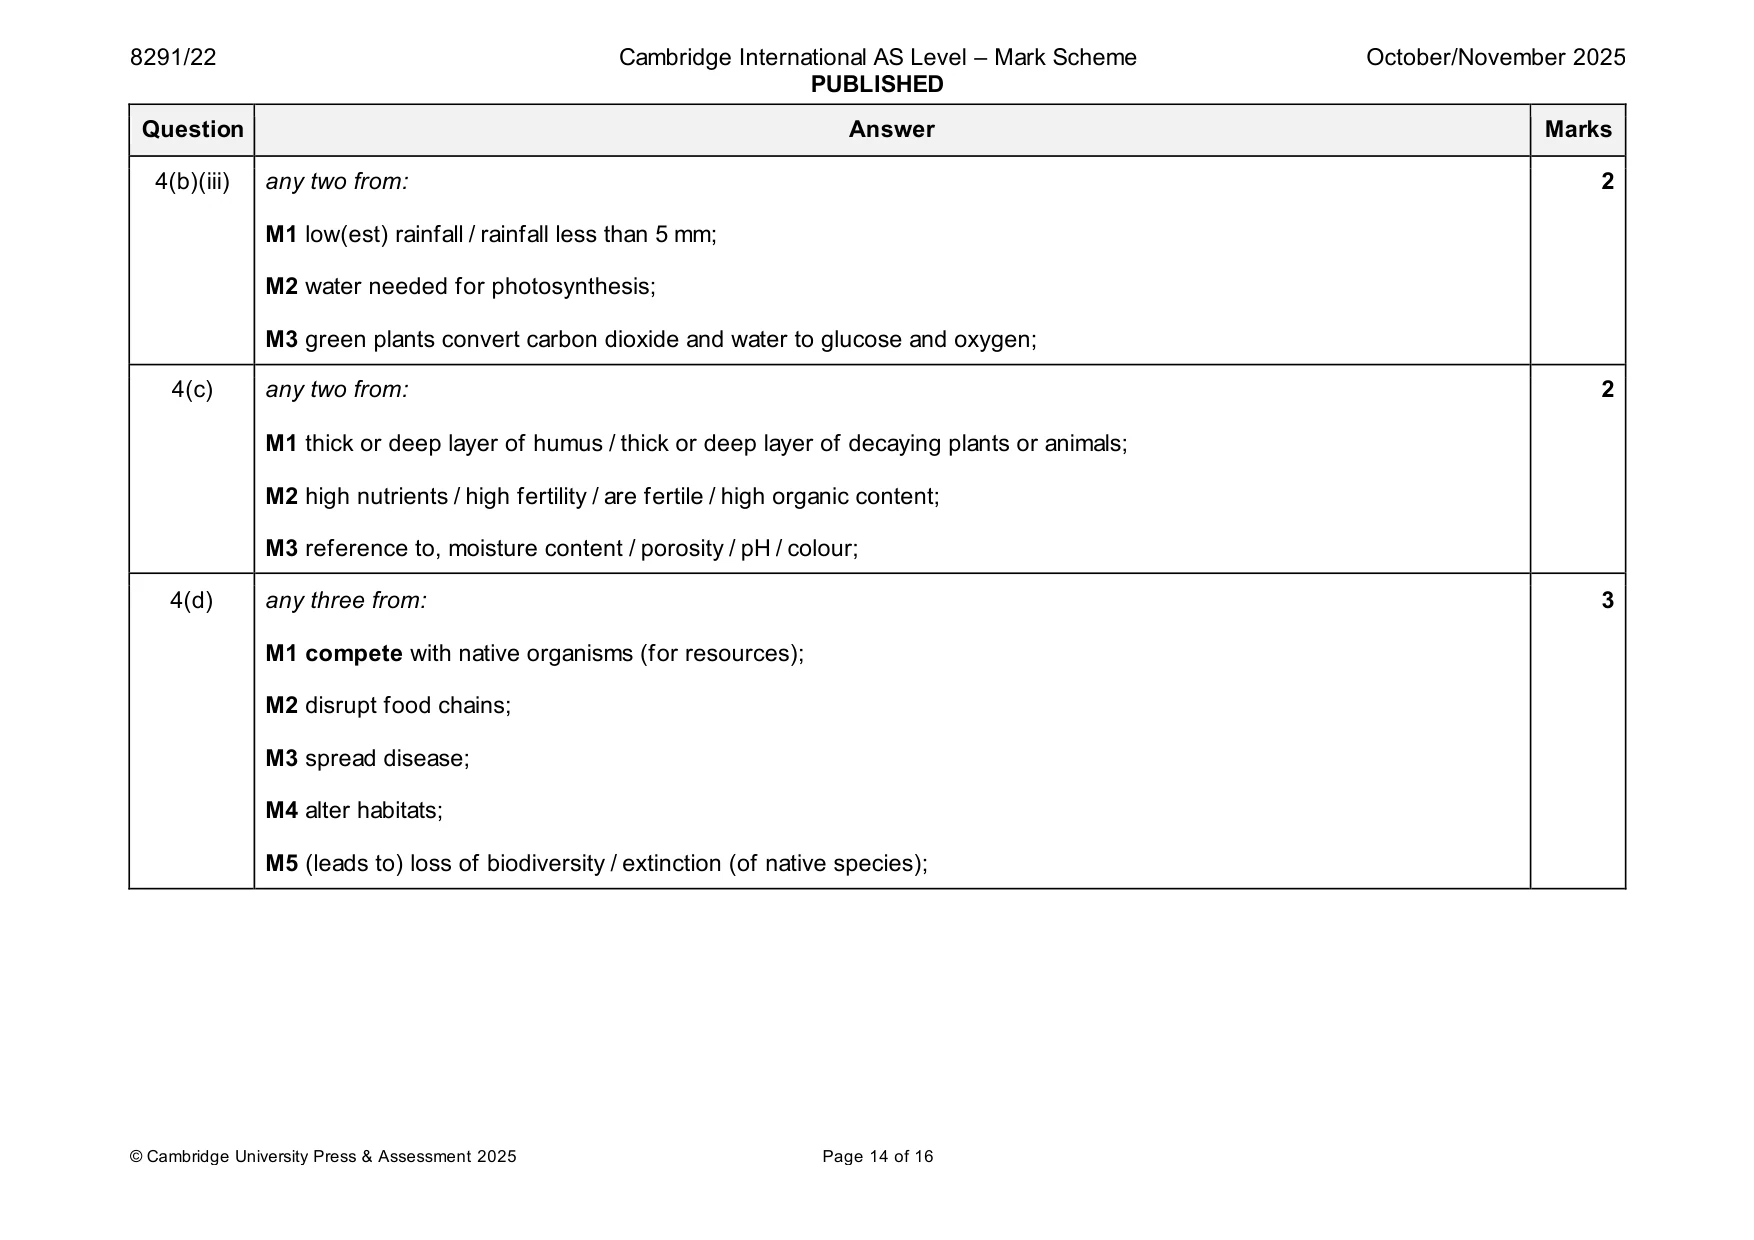
Mark scheme: 4(a)(i) any three from: 3 M1 most of Europe / Eastern Europe / Southern Europe; M2 South Asia / Southeast Asia; M3 (mostly) north of Tropic of Cancer / in the region of Tropic of Cancer; M4 some countries bordering Equator; M5 named country e.g. Moldova / Ukraine / Bangladesh / India / Serbia; 4(a)(ii) any three from: 3 M1 wild fires; M2 crop failure / reduced crop yield; M3 food insecurity / famine / food shortages; M4 water insecurity / poor sanitation / disease; M5 lower HEP production; 4(b)(i) 32; 1 4(b)(ii) Jan and Feb and Dec; 1 4(b)(iii) any two from: 2 M1 low(est) rainfall / rainfall less than 5 mm; M2 water needed for photosynthesis; M3 green plants convert carbon dioxide and water to glucose and oxygen; 4(c) any two from: 2 M1 thick or deep layer of humus / thick or deep layer of decaying plants or animals; M2 high nutrients / high fertility / are fertile / high organic content; M3 reference to, moisture content / porosity / pH / colour; 4(d) any three from: 3 M1 compete with native organisms (for resources); M2 disrupt food chains; M3 spread disease; M4 alter habitats; M5 (leads to) loss of biodiversity / extinction (of native species);
Q5 · The annual volume of fresh water extracted for agriculture, industry and domestic uses in…
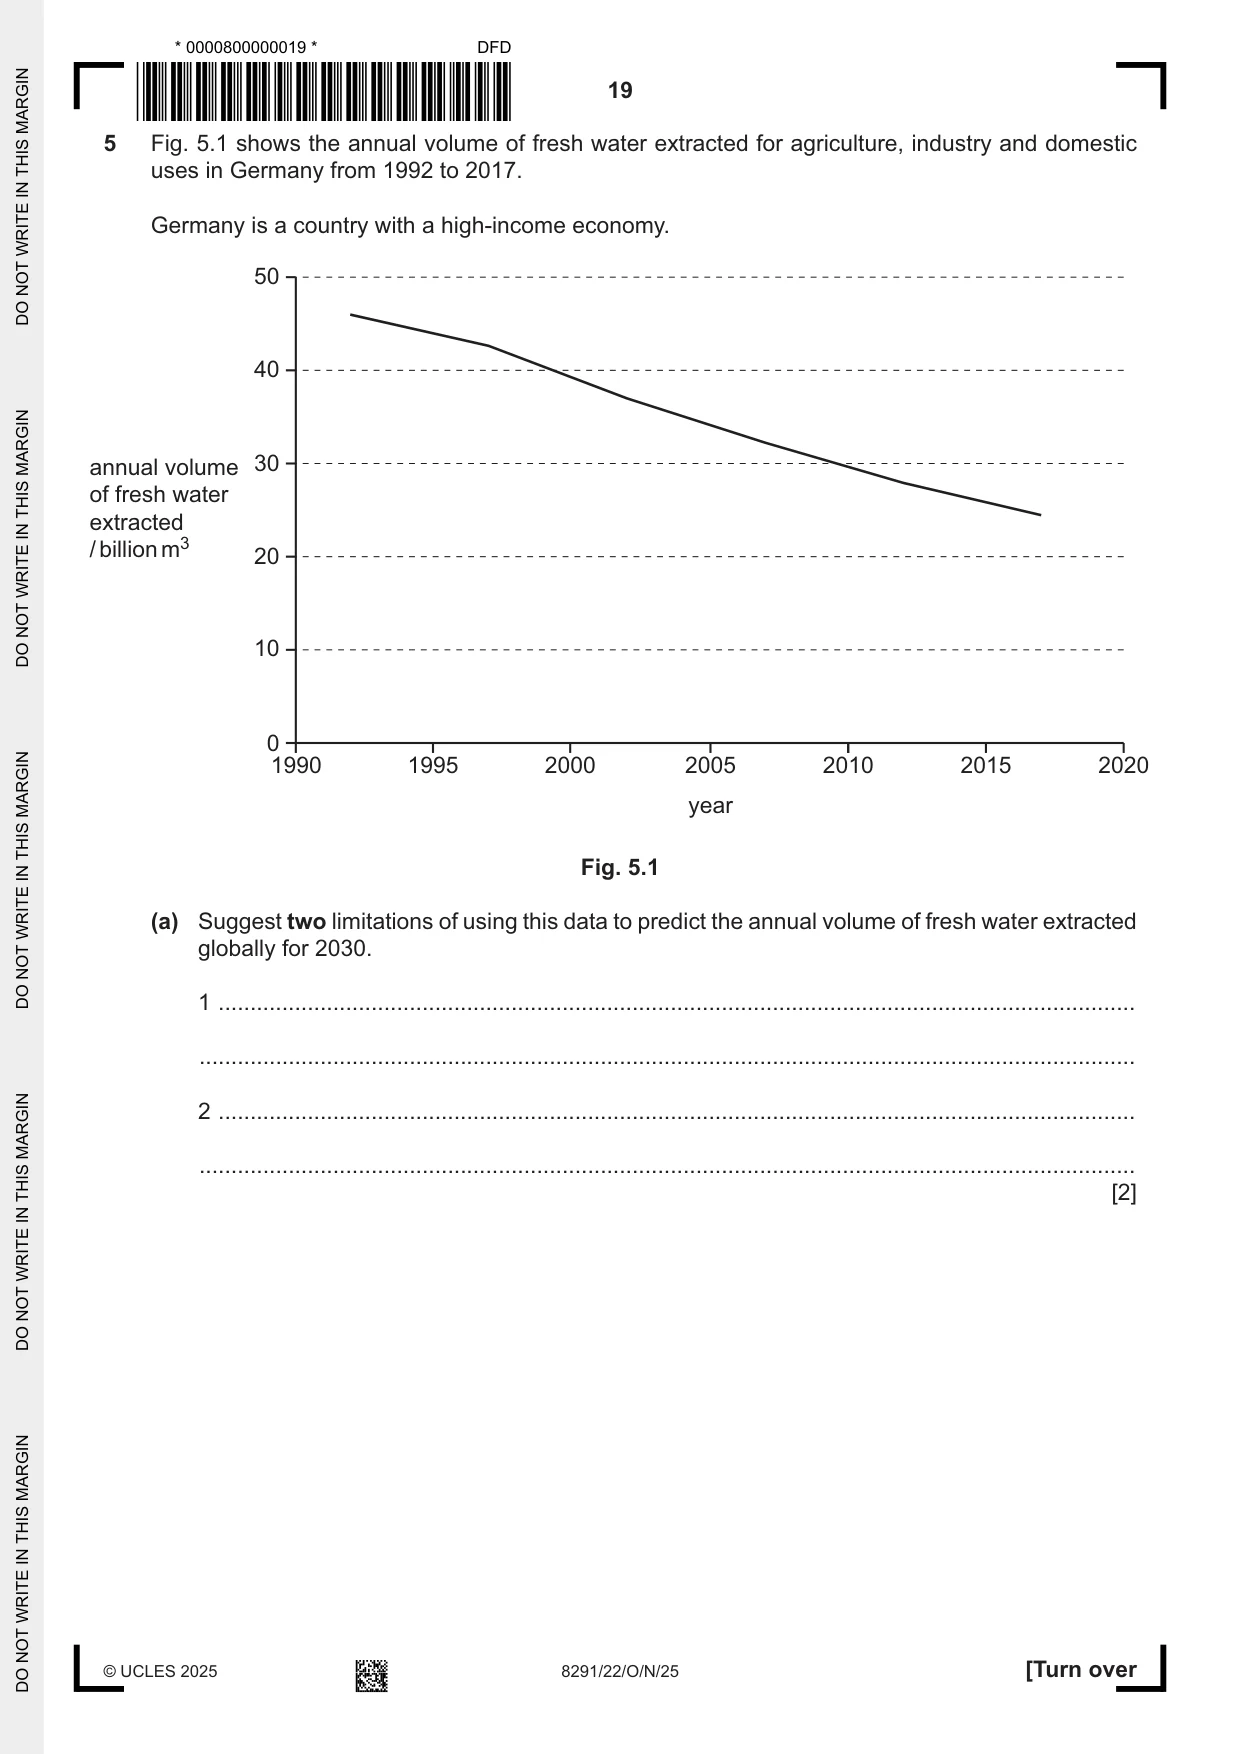
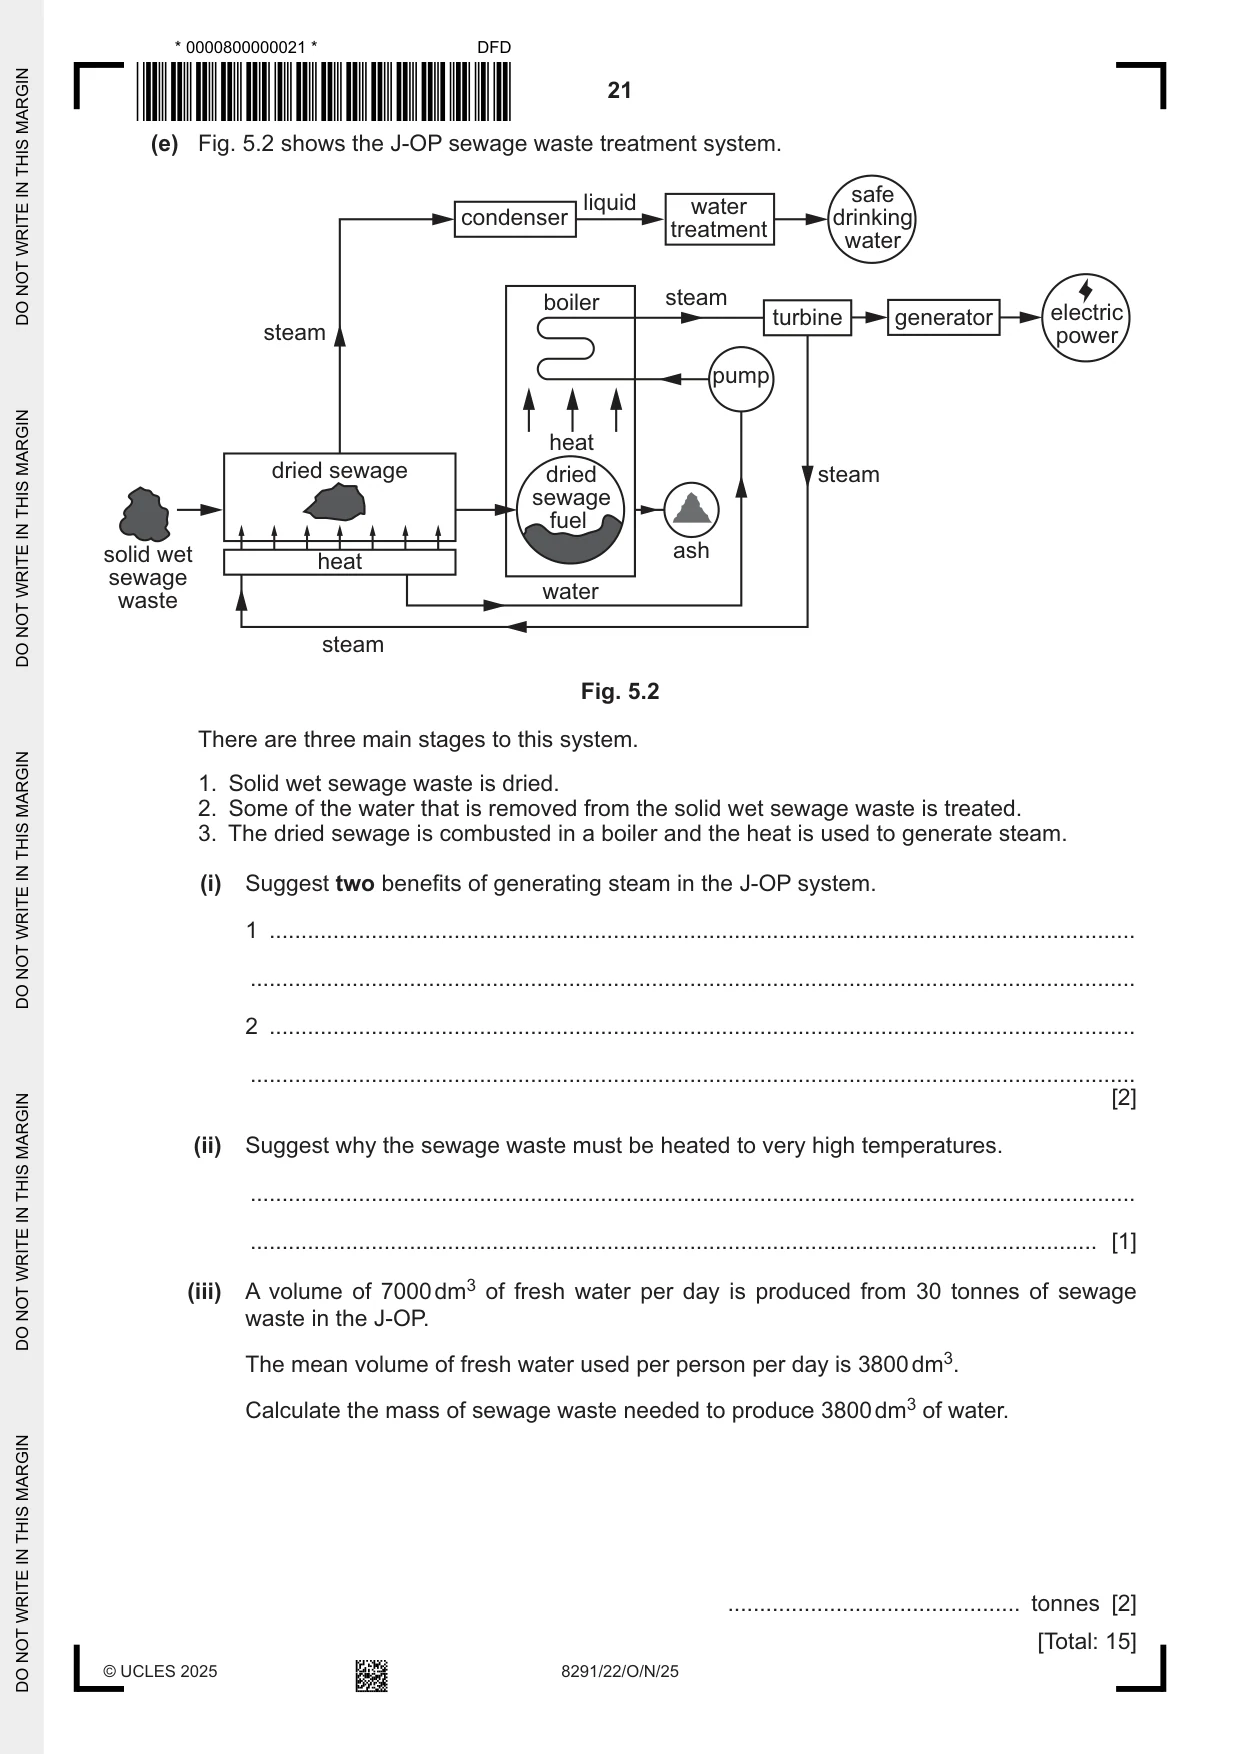
5 Fig. 5.1 shows the annual volume of fresh water extracted for agriculture, industry and domestic uses in Germany from 1992 to 2017. Germany is a country with a high-income economy. 50 40 annual volume 30 of fresh water extracted / billion m3 20 10 0 1990 1995 2000 2005 2010 2015 2020 year Fig. 5.1 (a) Suggest two limitations of using this data to predict the annual volume of fresh water extracted globally for 2030. 1 ................................................................................................................................................ ................................................................................................................................................... 2 ................................................................................................................................................ ................................................................................................................................................... [2] (b) Tick (✓) all the sources of surface fresh water. glaciers ground water permafrost swamps [1] (c) Describe how an artesian well is used to supply safe drinking water to a village. ................................................................................................................................................... ................................................................................................................................................... ................................................................................................................................................... ................................................................................................................................................... ................................................................................................................................................... ................................................................................................................................................... ................................................................................................................................................... ............................................................................................................................................. [4] (d) Sustainable water extraction and improved sanitation are strategies for managing water security. State three other strategies for managing water security. 1 ................................................................................................................................................ ................................................................................................................................................... 2 ................................................................................................................................................ ................................................................................................................................................... 3 ................................................................................................................................................ ................................................................................................................................................... [3] (e) Fig. 5.2 shows the J-OP sewage waste treatment system. safe liquid water condenser drinking treatment water boiler steam turbine generator electric steam power pump heat dried sewage dried steam sewage fuel solid wet ash heat sewage water waste steam Fig. 5.2 There are three main stages to this system. 1. Solid wet sewage waste is dried. 2. Some of the water that is removed from the solid wet sewage waste is treated. 3. The dried sewage is combusted in a boiler and the heat is used to generate steam. (i) Suggest two benefits of generating steam in the J-OP system. 1 ........................................................................................................................................ ........................................................................................................................................... 2 ........................................................................................................................................ ........................................................................................................................................... [2] (ii) Suggest why the sewage waste must be heated to very high temperatures. ........................................................................................................................................... ..................................................................................................................................... [1] (iii) A volume of 7000 dm3 of fresh water per day is produced from 30 tonnes of sewage waste in the J-OP. The mean volume of fresh water used per person per day is 3800 dm3. Calculate the mass of sewage waste needed to produce 3800 dm3 of water. .............................................. tonnes [2] [Total: 15] © UCLES 2025 8291/22/O/N/25
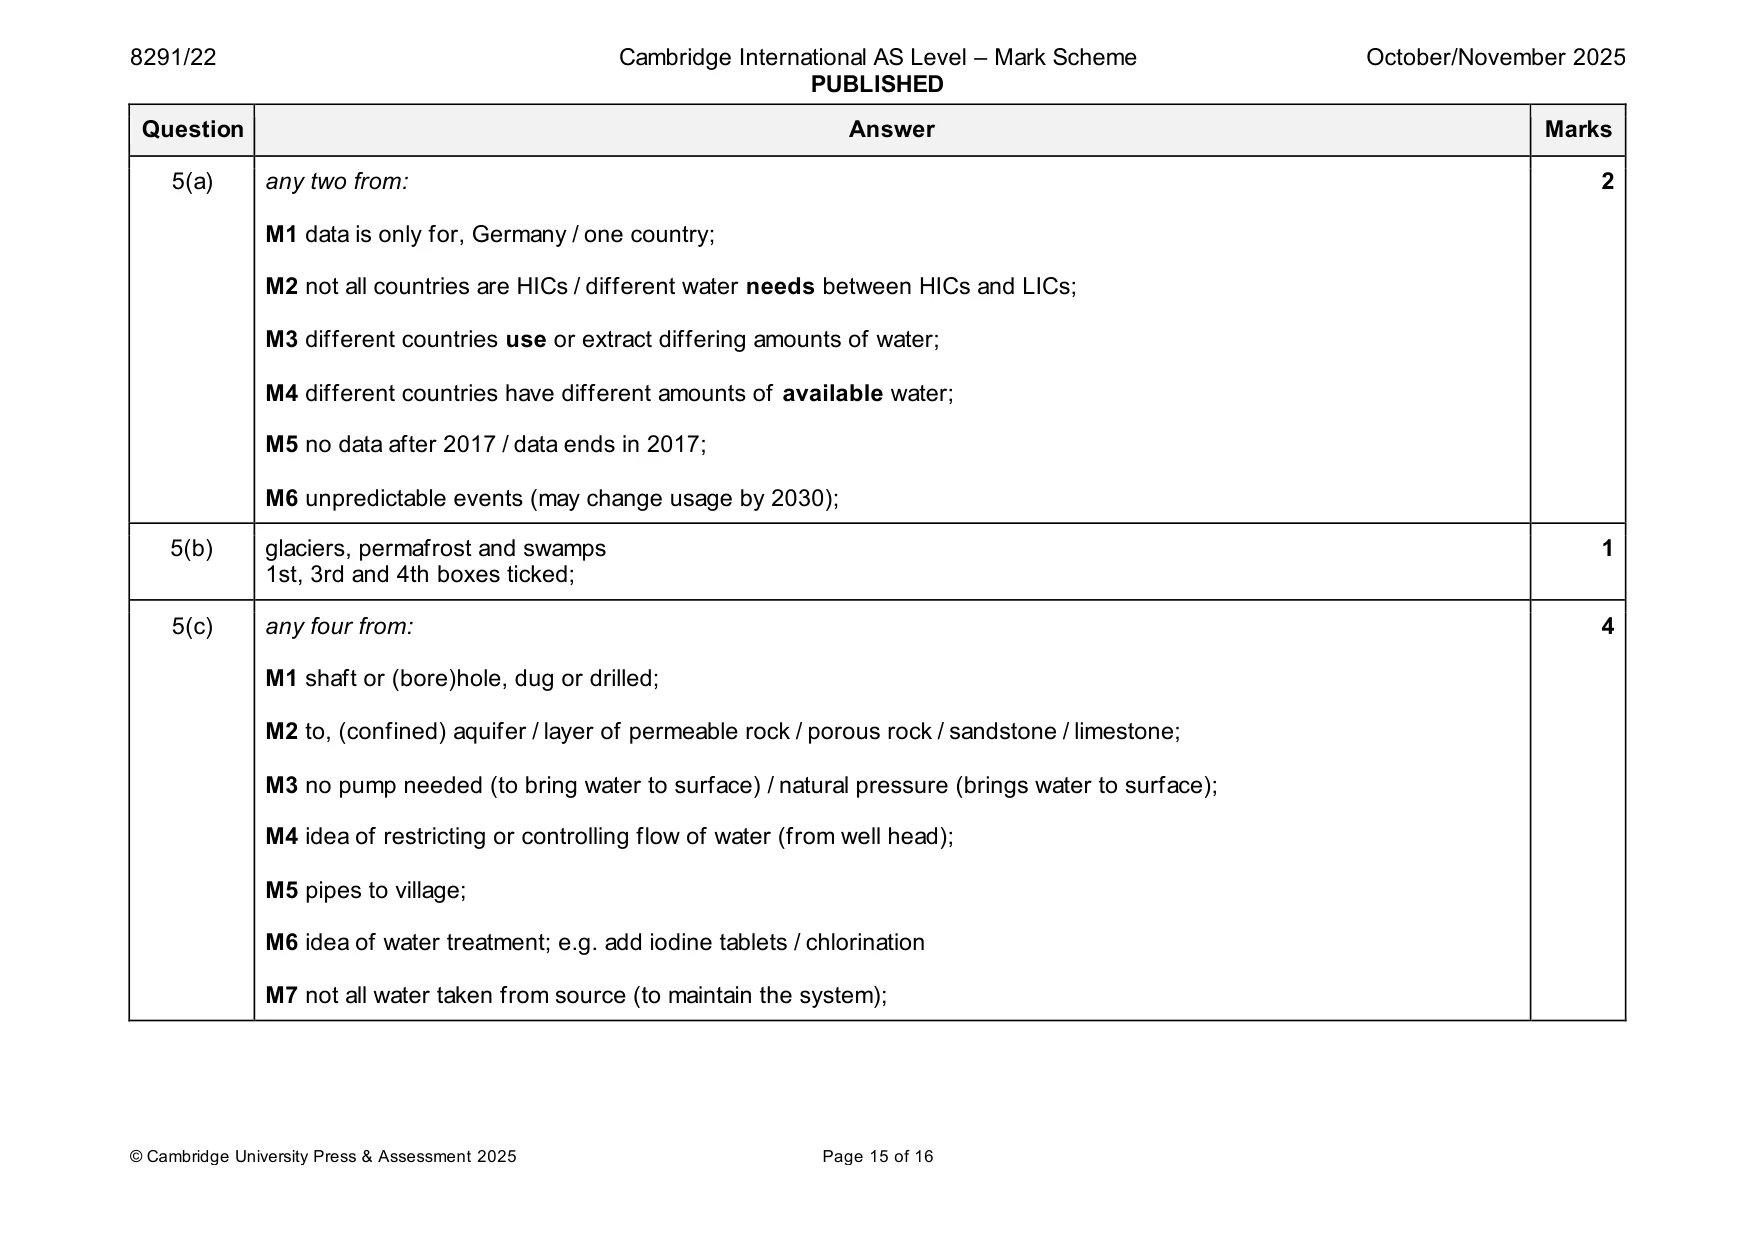
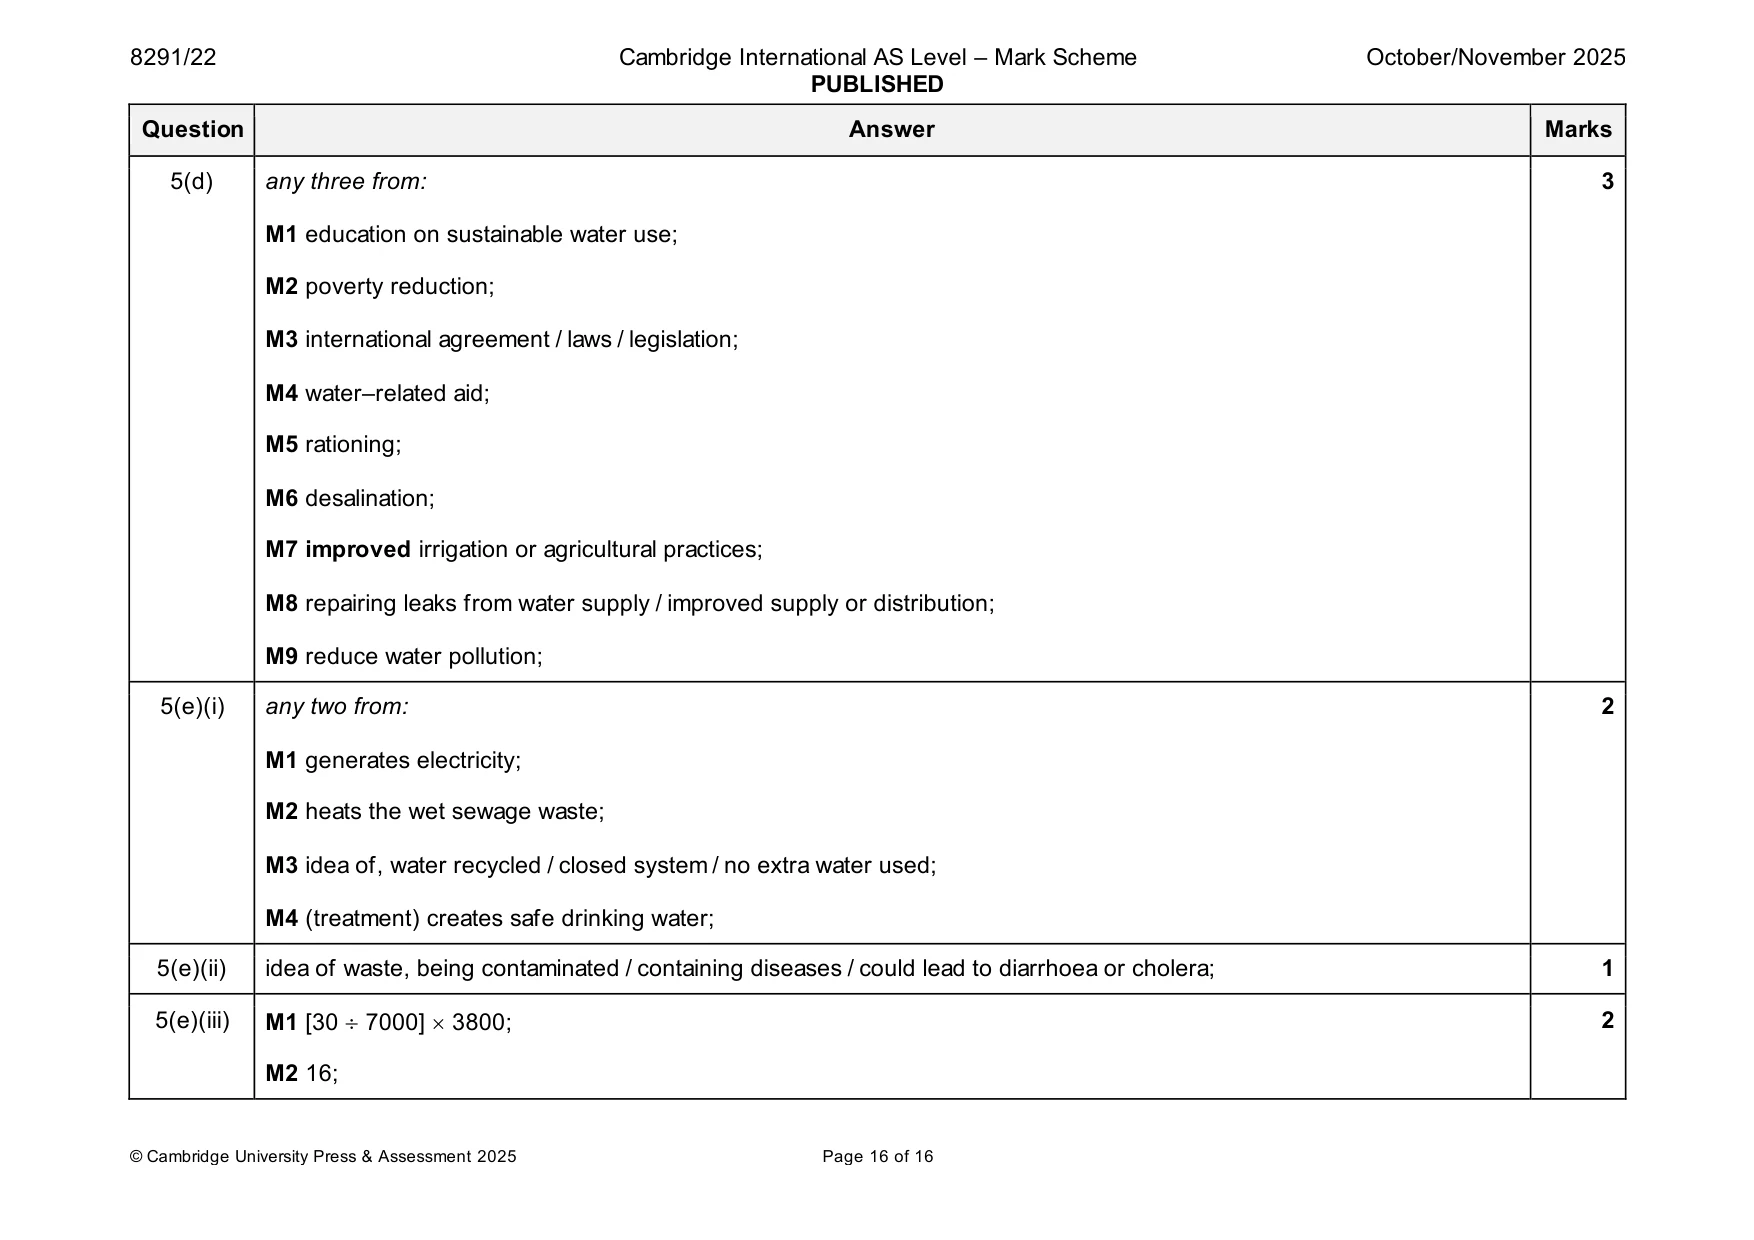
Mark scheme: 5(a) any two from: 2 M1 data is only for, Germany / one country; M2 not all countries are HICs / different water needs between HICs and LICs; M3 different countries use or extract differing amounts of water; M4 different countries have different amounts of available water; M5 no data after 2017 / data ends in 2017; M6 unpredictable events (may change usage by 2030); 5(b) glaciers, permafrost and swamps 1 1st, 3rd and 4th boxes ticked; 5(c) any four from: 4 M1 shaft or (bore)hole, dug or drilled; M2 to, (confined) aquifer / layer of permeable rock / porous rock / sandstone / limestone; M3 no pump needed (to bring water to surface) / natural pressure (brings water to surface); M4 idea of restricting or controlling flow of water (from well head); M5 pipes to village; M6 idea of water treatment; e.g. add iodine tablets / chlorination M7 not all water taken from source (to maintain the system); 5(d) any three from: 3 M1 education on sustainable water use; M2 poverty reduction; M3 international agreement / laws / legislation; M4 water–related aid; M5 rationing; M6 desalination; M7 improved irrigation or agricultural practices; M8 repairing leaks from water supply / improved supply or distribution; M9 reduce water pollution; 5(e)(i) any two from: 2 M1 generates electricity; M2 heats the wet sewage waste; M3 idea of, water recycled / closed system / no extra water used; M4 (treatment) creates safe drinking water; 5(e)(ii) idea of waste, being contaminated / containing diseases / could lead to diarrhoea or cholera; 1 5(e)(iii) M1 [30 7000] 3800; 2 M2 16;
What was in this paper
The subtopics covered by these 5 questions, and how many questions each got. Open one in a new tab to see every Cambridge question on it.
What you needed in this session
Cambridge’s own grade thresholds for 2025 Oct/Nov, Paper 2 · Variant 2. A higher threshold means an easier paper — the bar moves with how the cohort did.