Cambridge A Level Environmental Management (AS only) 8291 — 2024 Oct/Nov Paper 2 · Variant 2
8291/22/O/N/24 · 4 questions · 80 marks · ≈90 min
The question paper and its mark scheme, free to read here and free to download. This is Cambridge’s own paper, exactly as it was sat.
Question paper24 pages






Mark scheme15 pages
Answers below. Sit the paper first if you are practising.
Questions as text
Q1 · A vertical aquaculture farm
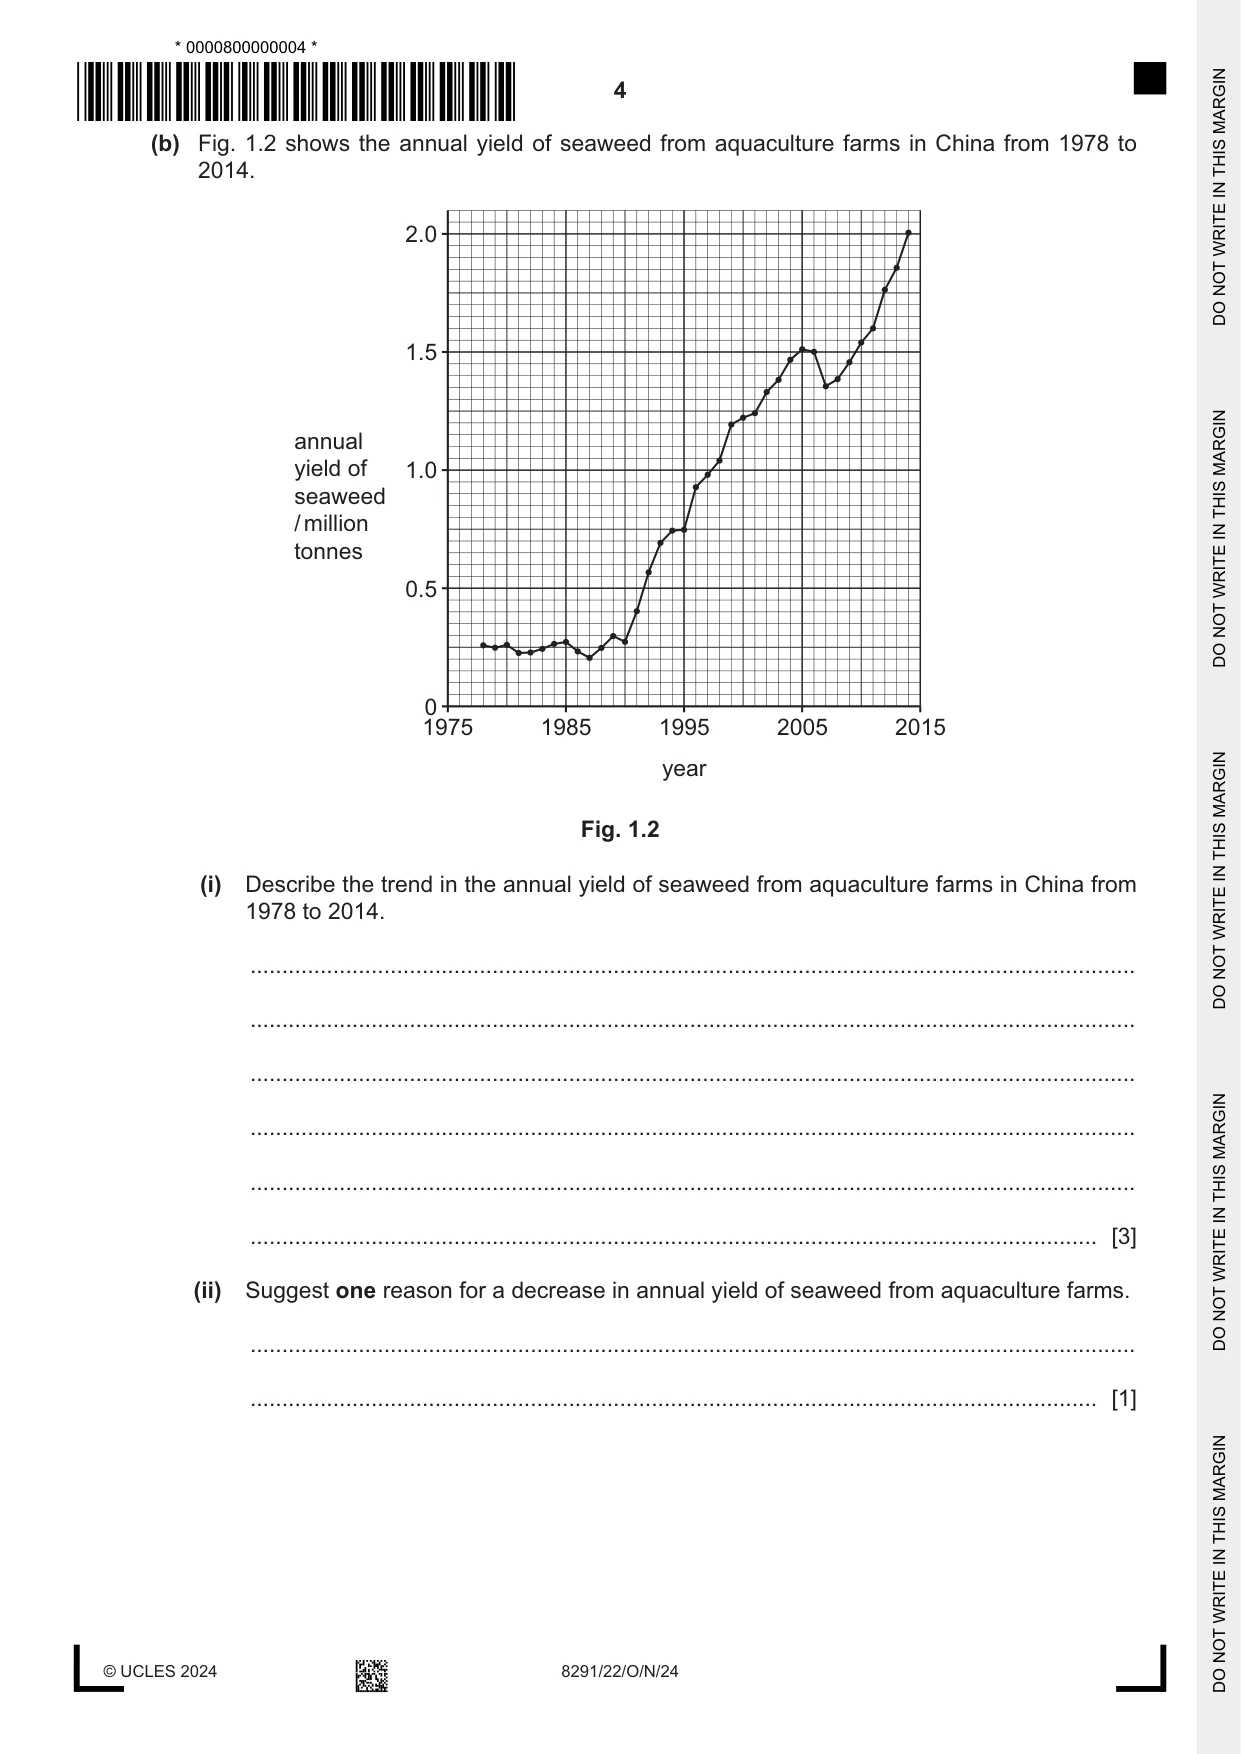
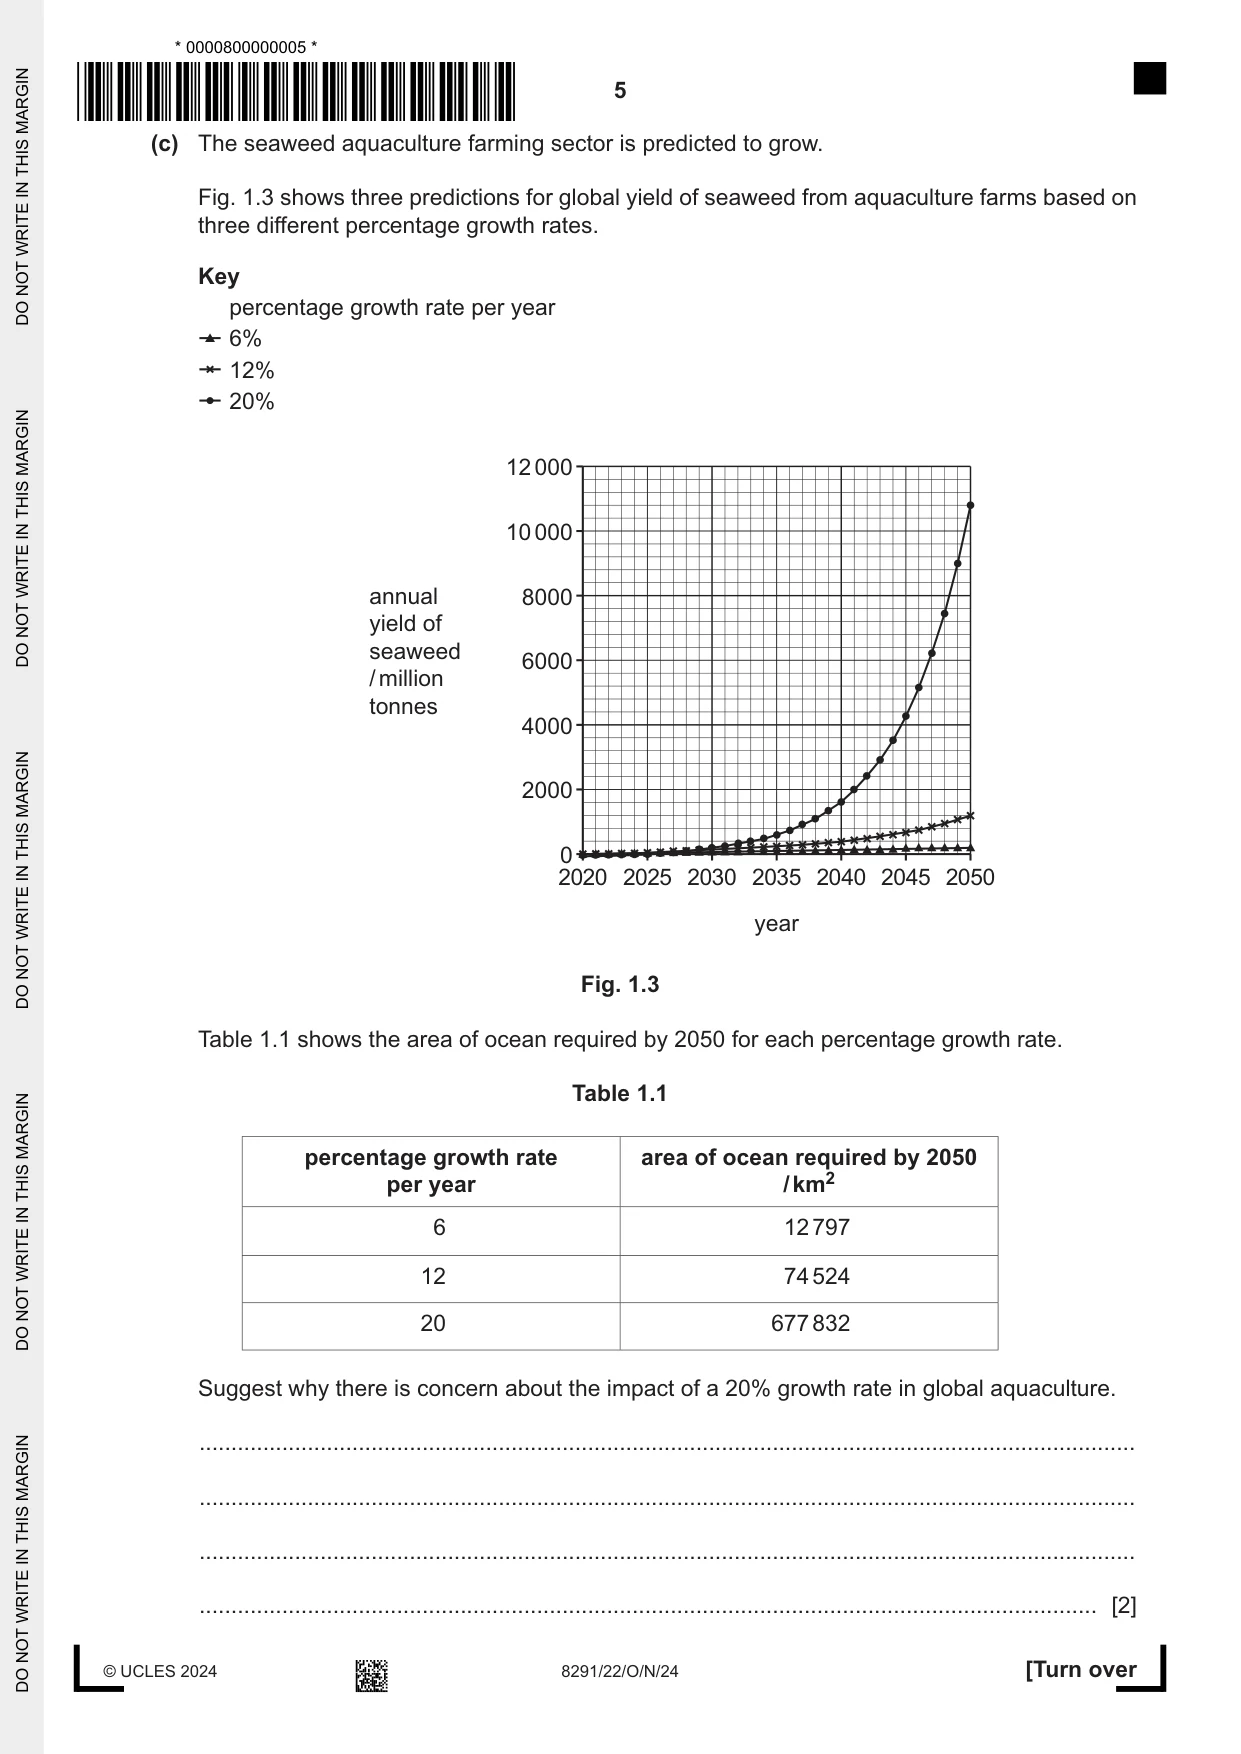
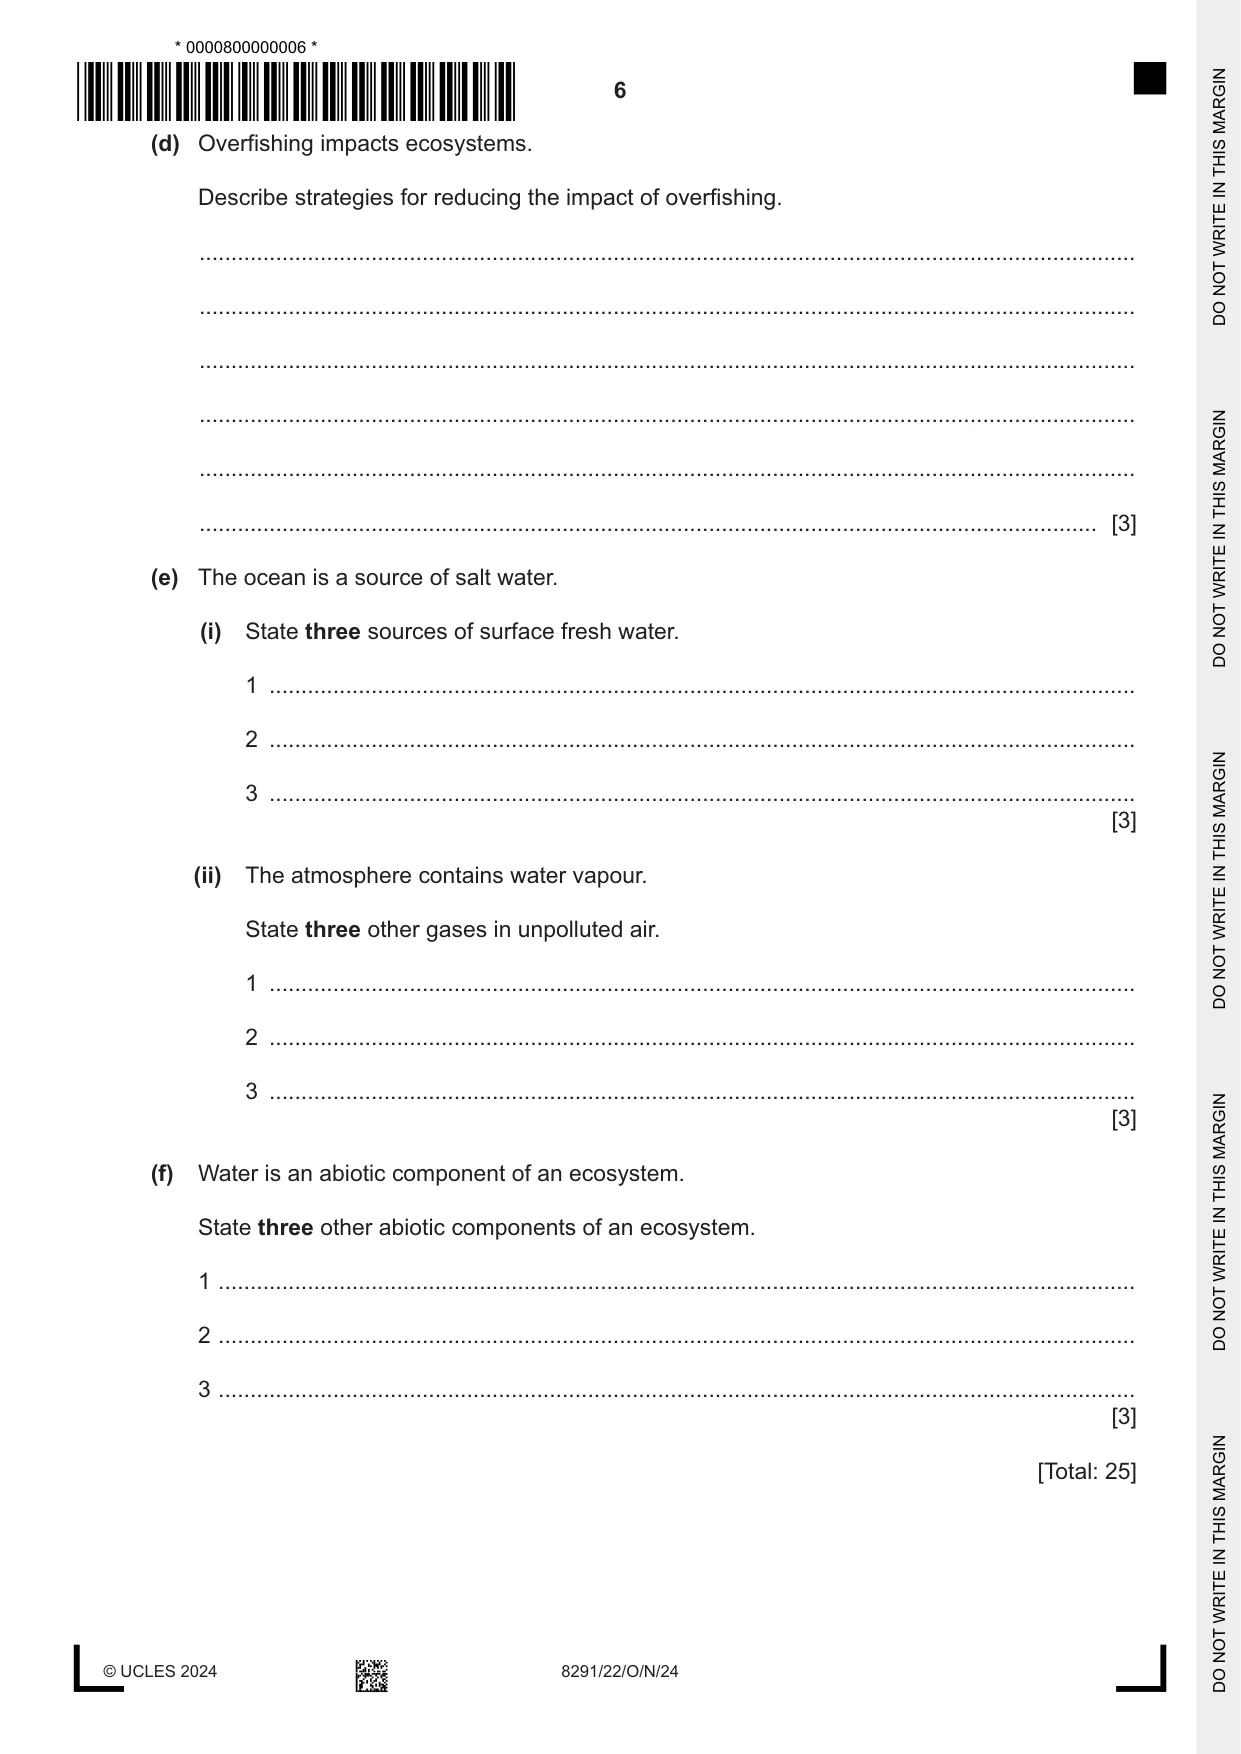
1 Fig. 1.1 shows a vertical aquaculture farm. Content removed due to copyright restrictions. Fig. 1.1 In Fig. 1.1, seaweed grows from ropes under the water. Shellfish such as mussels grow on chains. Scallops and oysters are farmed in nets and cages. Seaweed photosynthesises. Some species of seaweed grow up to 0.5 m in one day. The seaweed is harvested for use as human and animal food, organic fertiliser and biofuel; it is also used as an ingredient in natural medicines, cosmetics and bioplastics. Any seaweed that is not harvested falls to the sea floor and is covered by layers of sediment. (a) Vertical aquaculture farming is an example of adaptation to climate change. (i) Suggest why some crop farmers need to adapt to climate change by investing in aquaculture. ........................................................................................................................................... ........................................................................................................................................... ........................................................................................................................................... ........................................................................................................................................... ........................................................................................................................................... ..................................................................................................................................... [3] (ii) Suggest how vertical aquaculture can reduce the concentration of carbon dioxide in the atmosphere. ........................................................................................................................................... ........................................................................................................................................... ........................................................................................................................................... ........................................................................................................................................... ........................................................................................................................................... ..................................................................................................................................... [3] (iii) Suggest one benefit of vertical aquaculture farming other than reducing the impacts of climate change. ..................................................................................................................................... [1] (b) Fig. 1.2 shows the annual yield of seaweed from aquaculture farms in China from 1978 to 2014. 2.0 1.5 annual yield of 1.0 seaweed / million tonnes 0.5 0 1975 1985 1995 2005 2015 year Fig. 1.2 (i) Describe the trend in the annual yield of seaweed from aquaculture farms in China from 1978 to 2014. ........................................................................................................................................... ........................................................................................................................................... ........................................................................................................................................... ........................................................................................................................................... ........................................................................................................................................... ..................................................................................................................................... [3] (ii) Suggest one reason for a decrease in annual yield of seaweed from aquaculture farms. ........................................................................................................................................... ..................................................................................................................................... [1] (c) The seaweed aquaculture farming sector is predicted to grow. Fig. 1.3 shows three predictions for global yield of seaweed from aquaculture farms based on three different percentage growth rates. Key percentage growth rate per year 6% 12% 20% 12 000 10 000 annual 8000 yield of seaweed 6000 / million tonnes 4000 2000 0 2020 2025 2030 2035 2040 2045 2050 year Fig. 1.3 Table 1.1 shows the area of ocean required by 2050 for each percentage growth rate. Table 1.1 percentage growth rate area of ocean required by 2050 per year / km2 6 12 797 12 74 524 20 677 832 Suggest why there is concern about the impact of a 20% growth rate in global aquaculture. ................................................................................................................................................... ................................................................................................................................................... ................................................................................................................................................... ............................................................................................................................................. [2] (d) Overfishing impacts ecosystems. Describe strategies for reducing the impact of overfishing. ................................................................................................................................................... ................................................................................................................................................... ................................................................................................................................................... ................................................................................................................................................... ................................................................................................................................................... ............................................................................................................................................. [3] (e) The ocean is a source of salt water. (i) State three sources of surface fresh water. 1 ........................................................................................................................................ 2 ........................................................................................................................................ 3 ........................................................................................................................................ [3] (ii) The atmosphere contains water vapour. State three other gases in unpolluted air. 1 ........................................................................................................................................ 2 ........................................................................................................................................ 3 ........................................................................................................................................ [3] (f) Water is an abiotic component of an ecosystem. State three other abiotic components of an ecosystem. 1 ................................................................................................................................................ 2 ................................................................................................................................................ 3 ................................................................................................................................................ [3] [Total: 25]
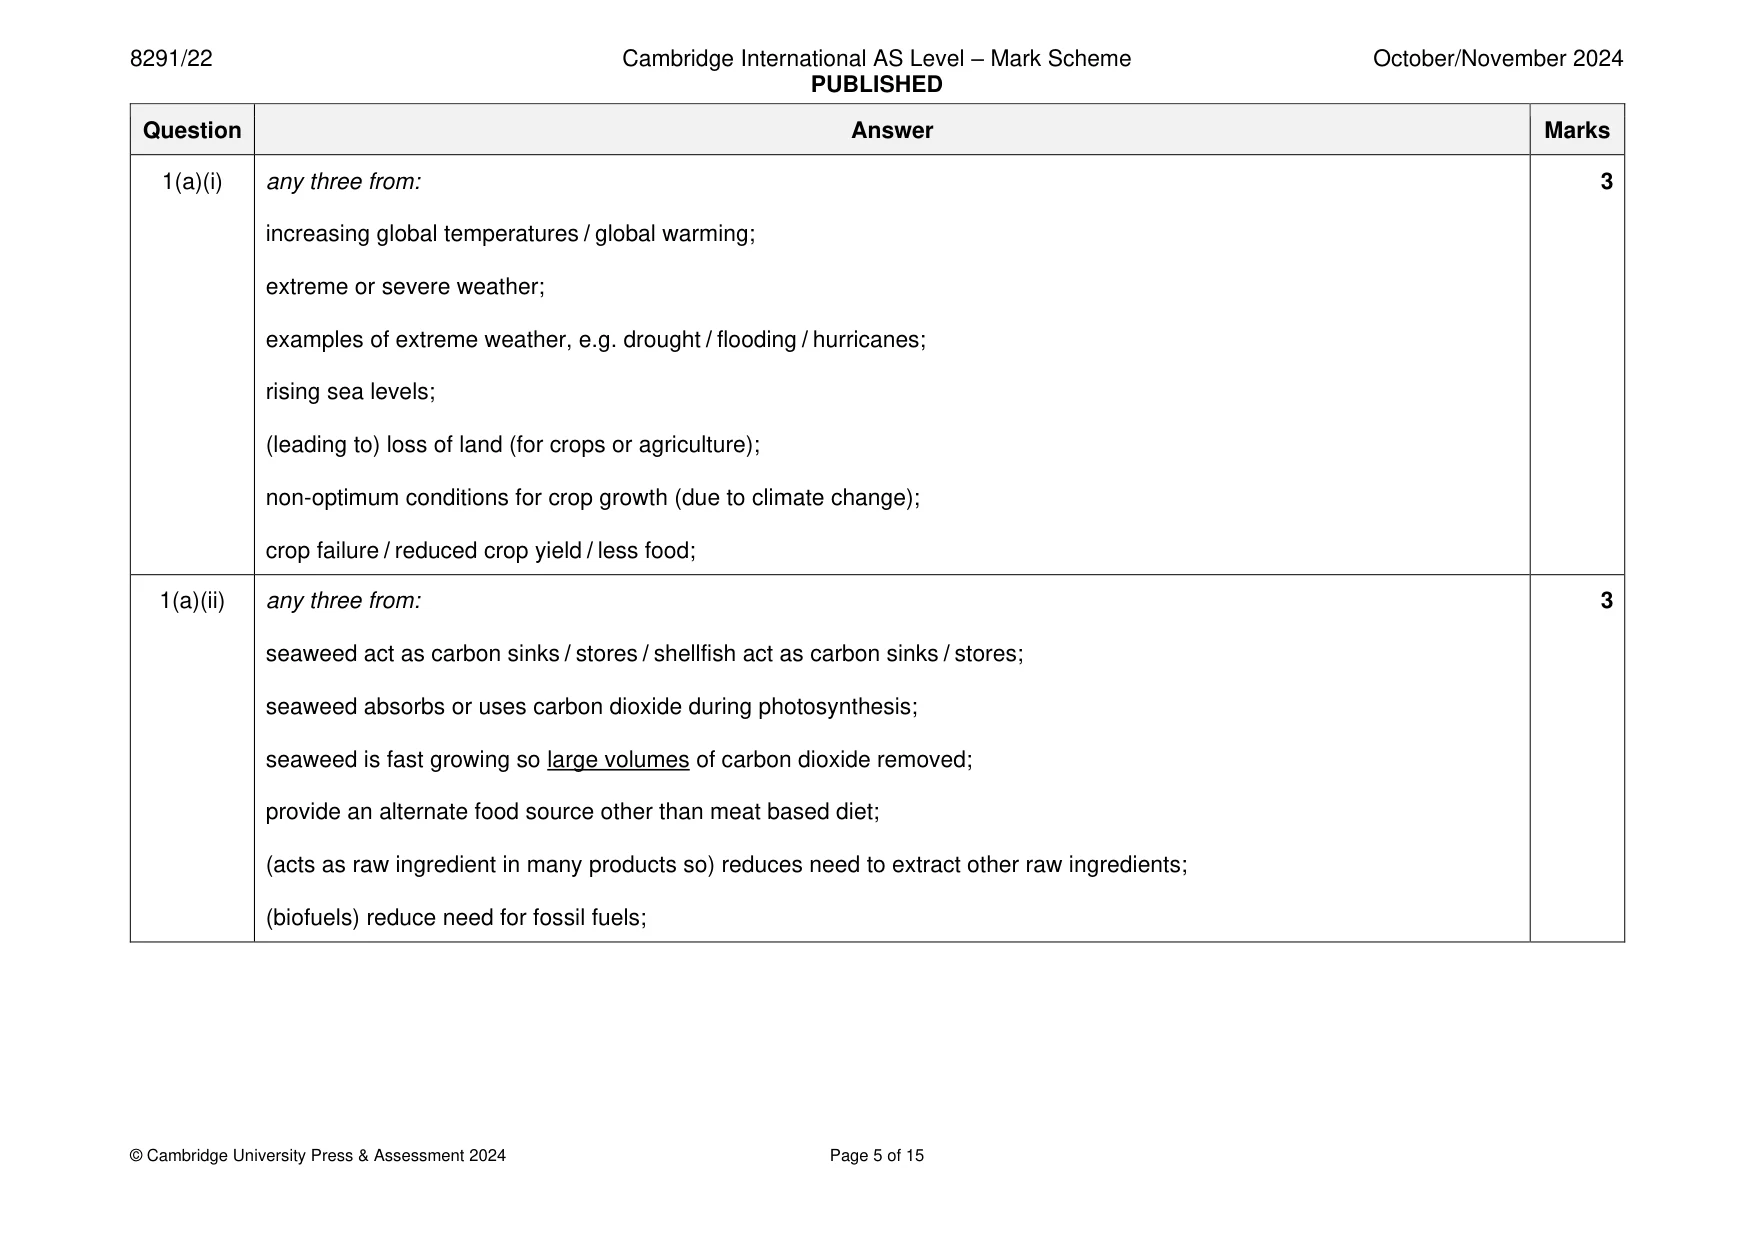
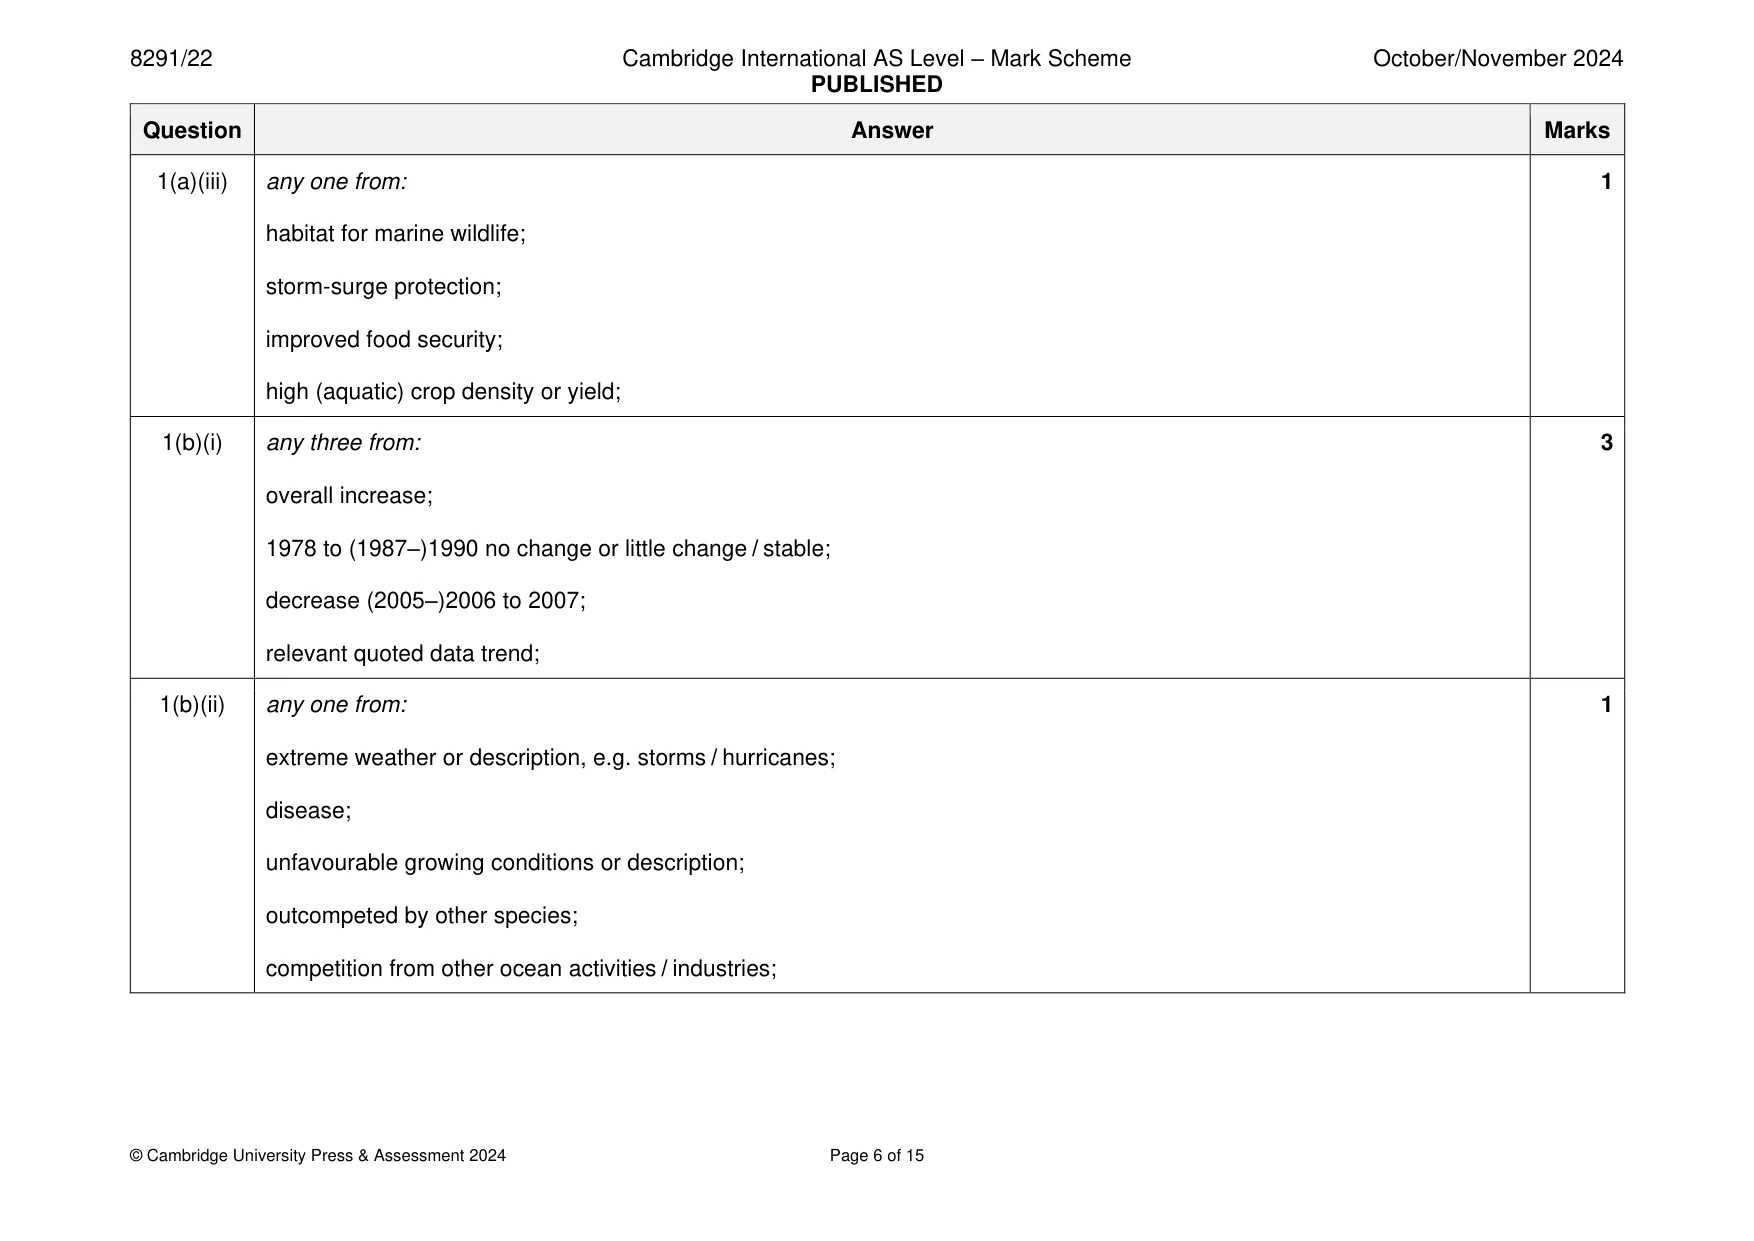
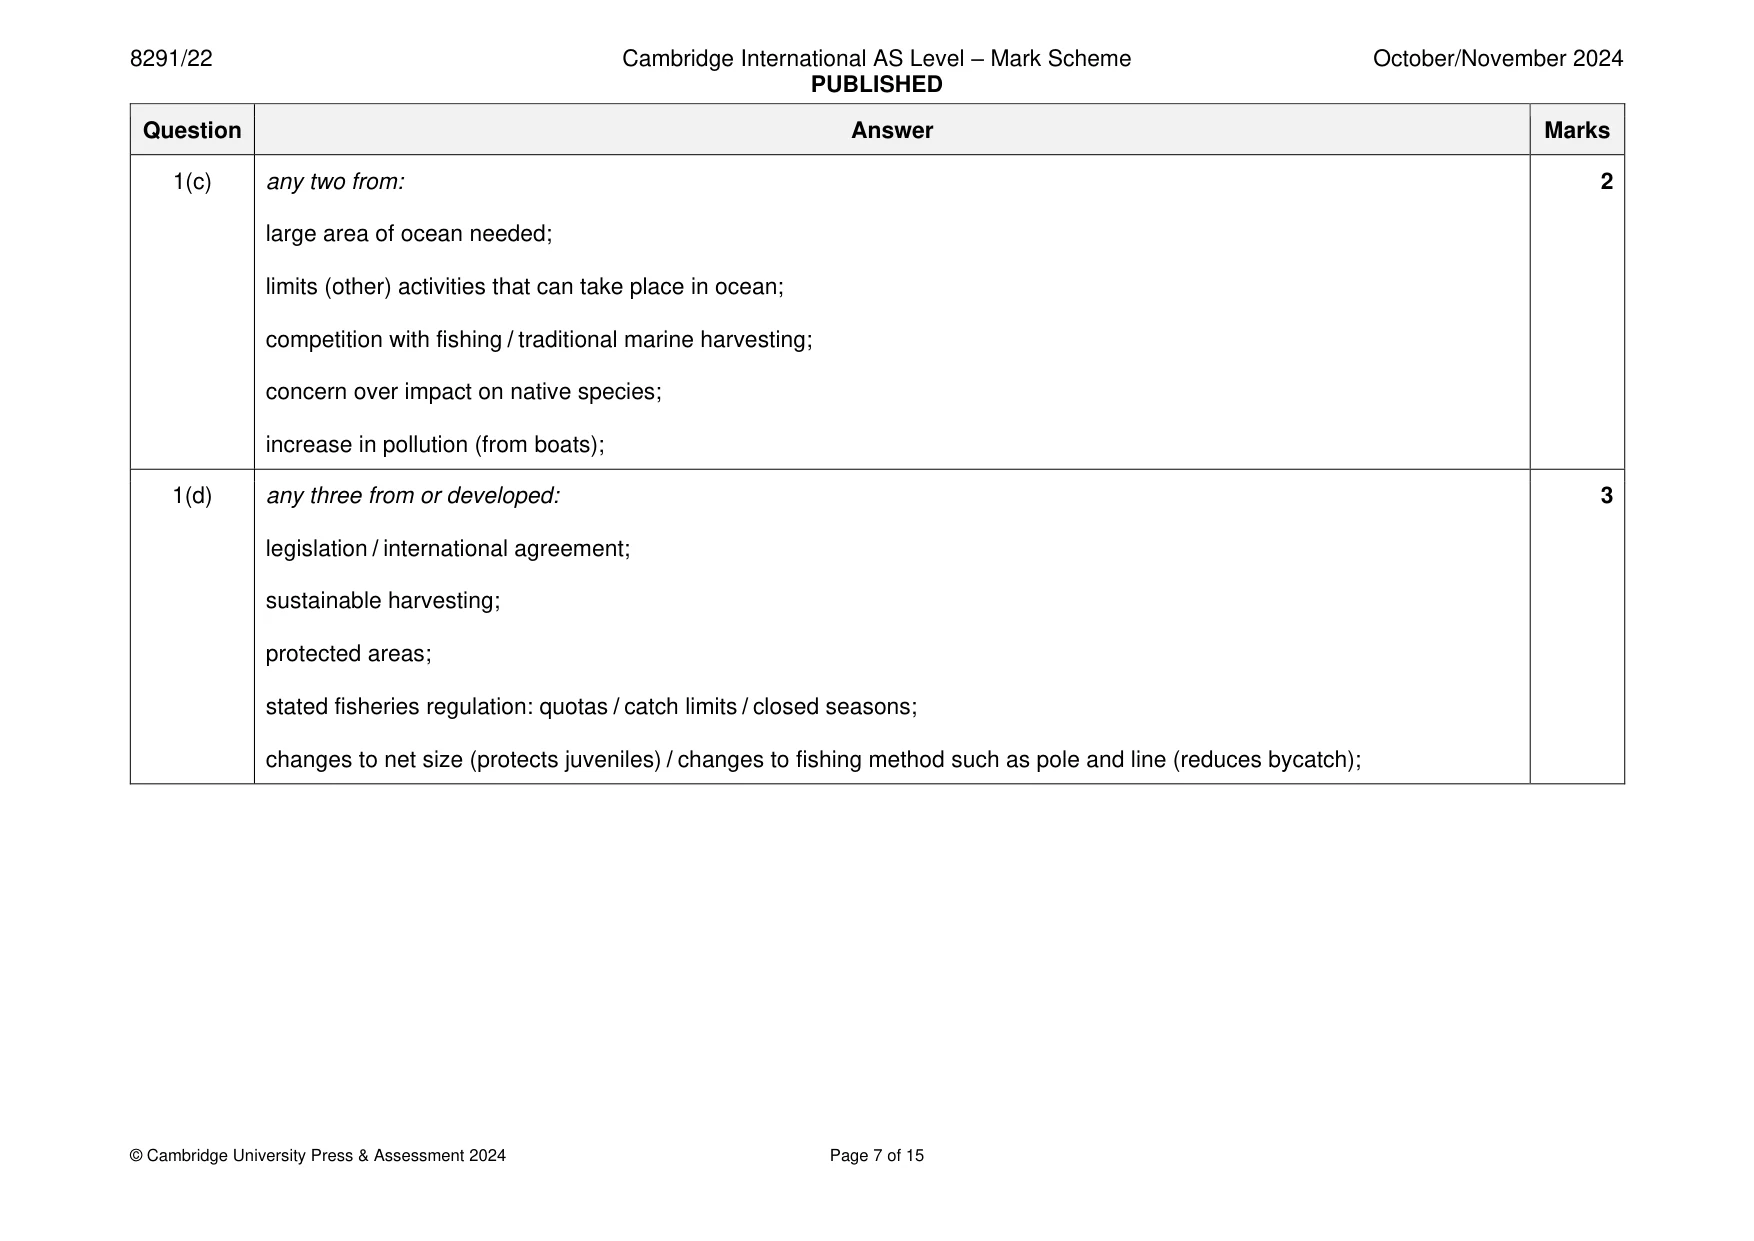
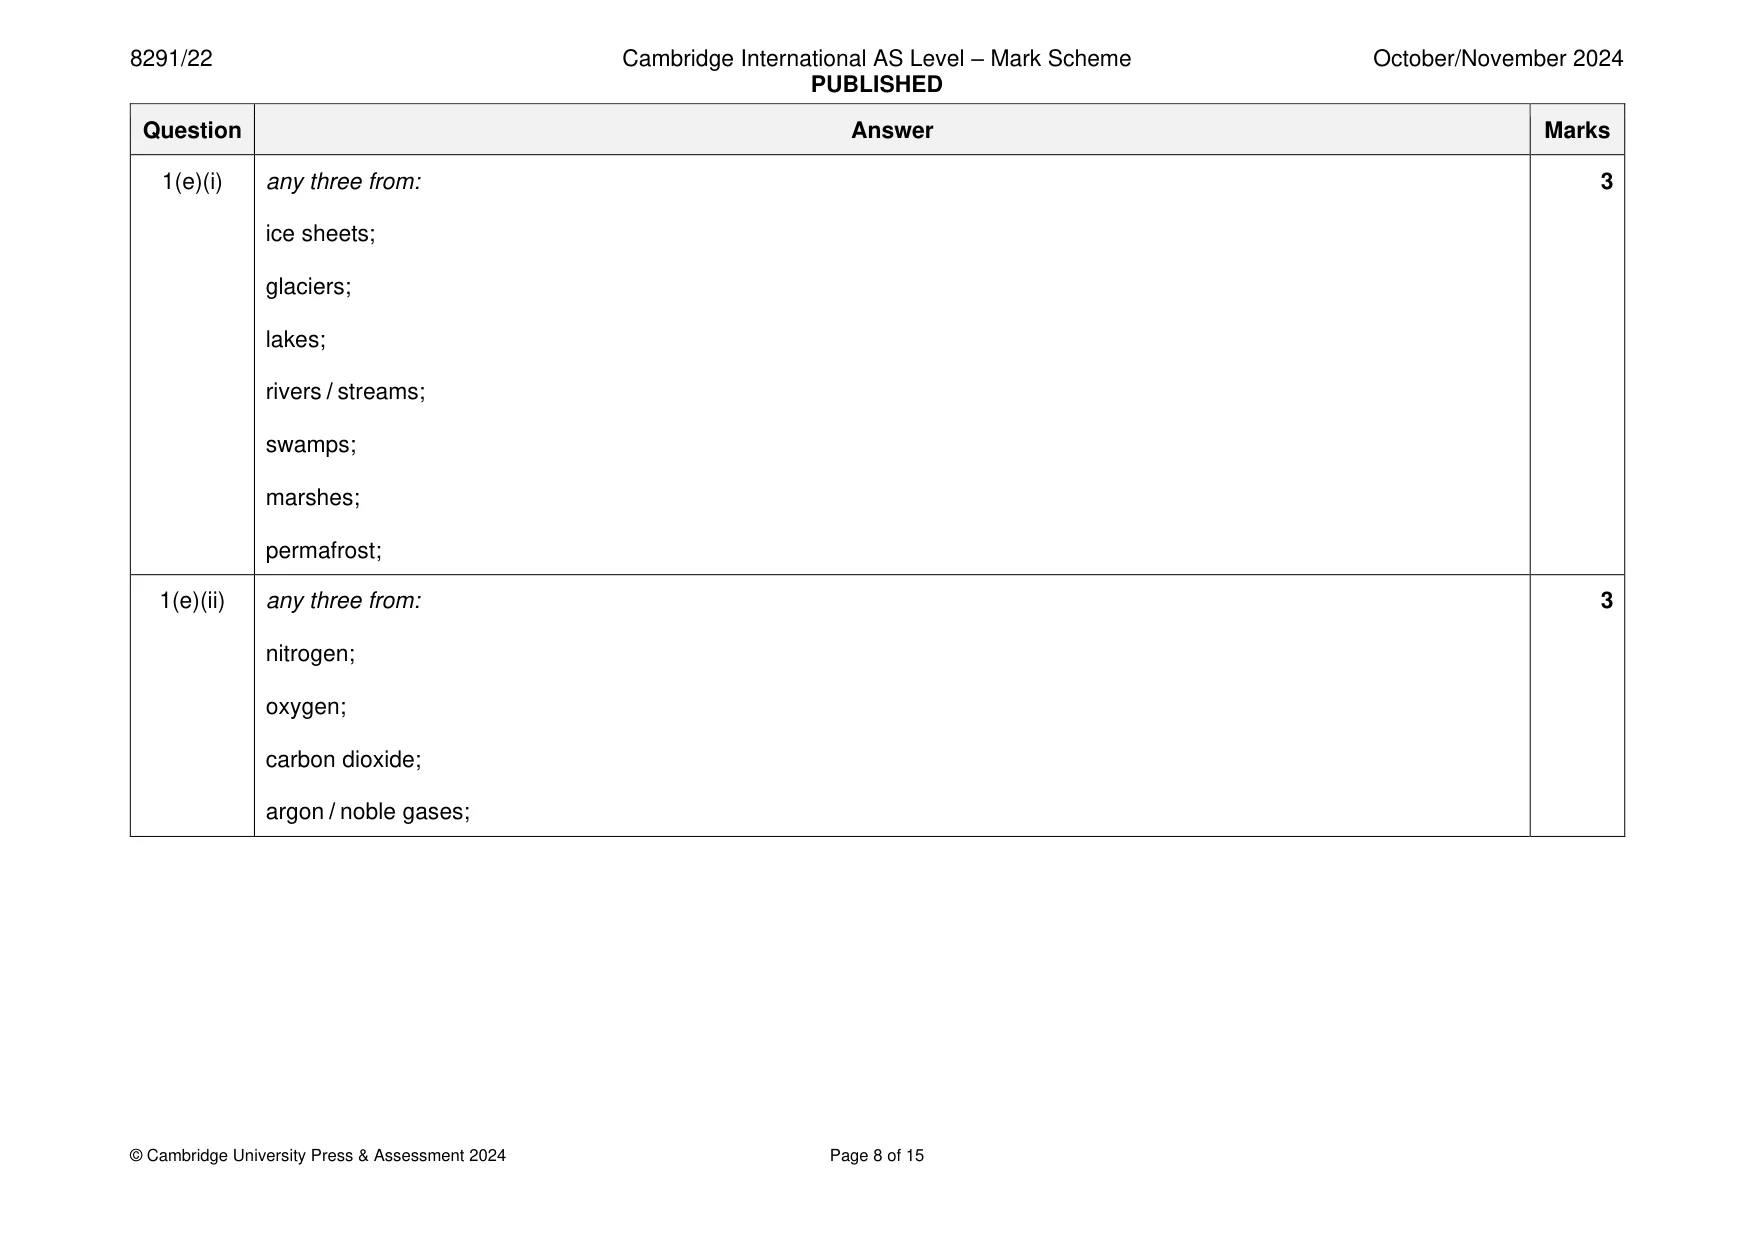
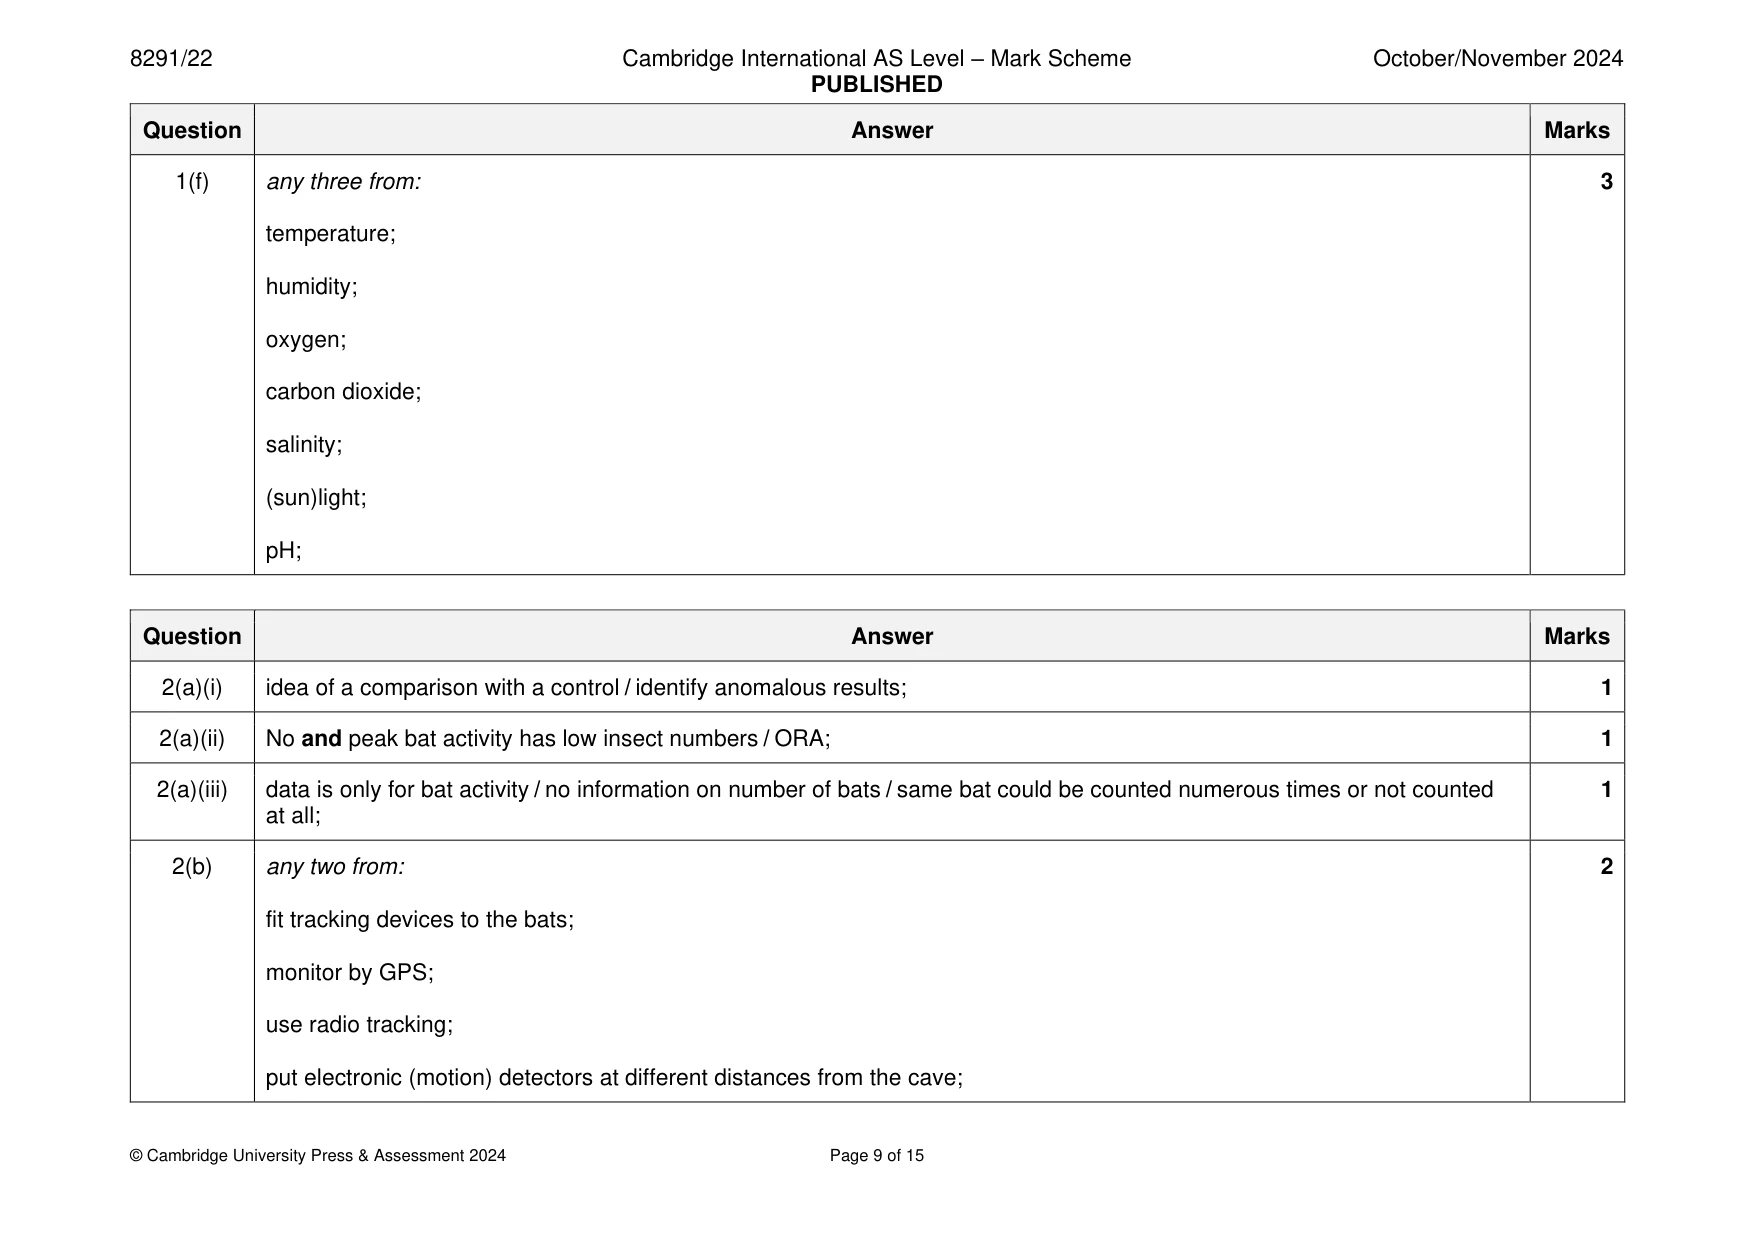
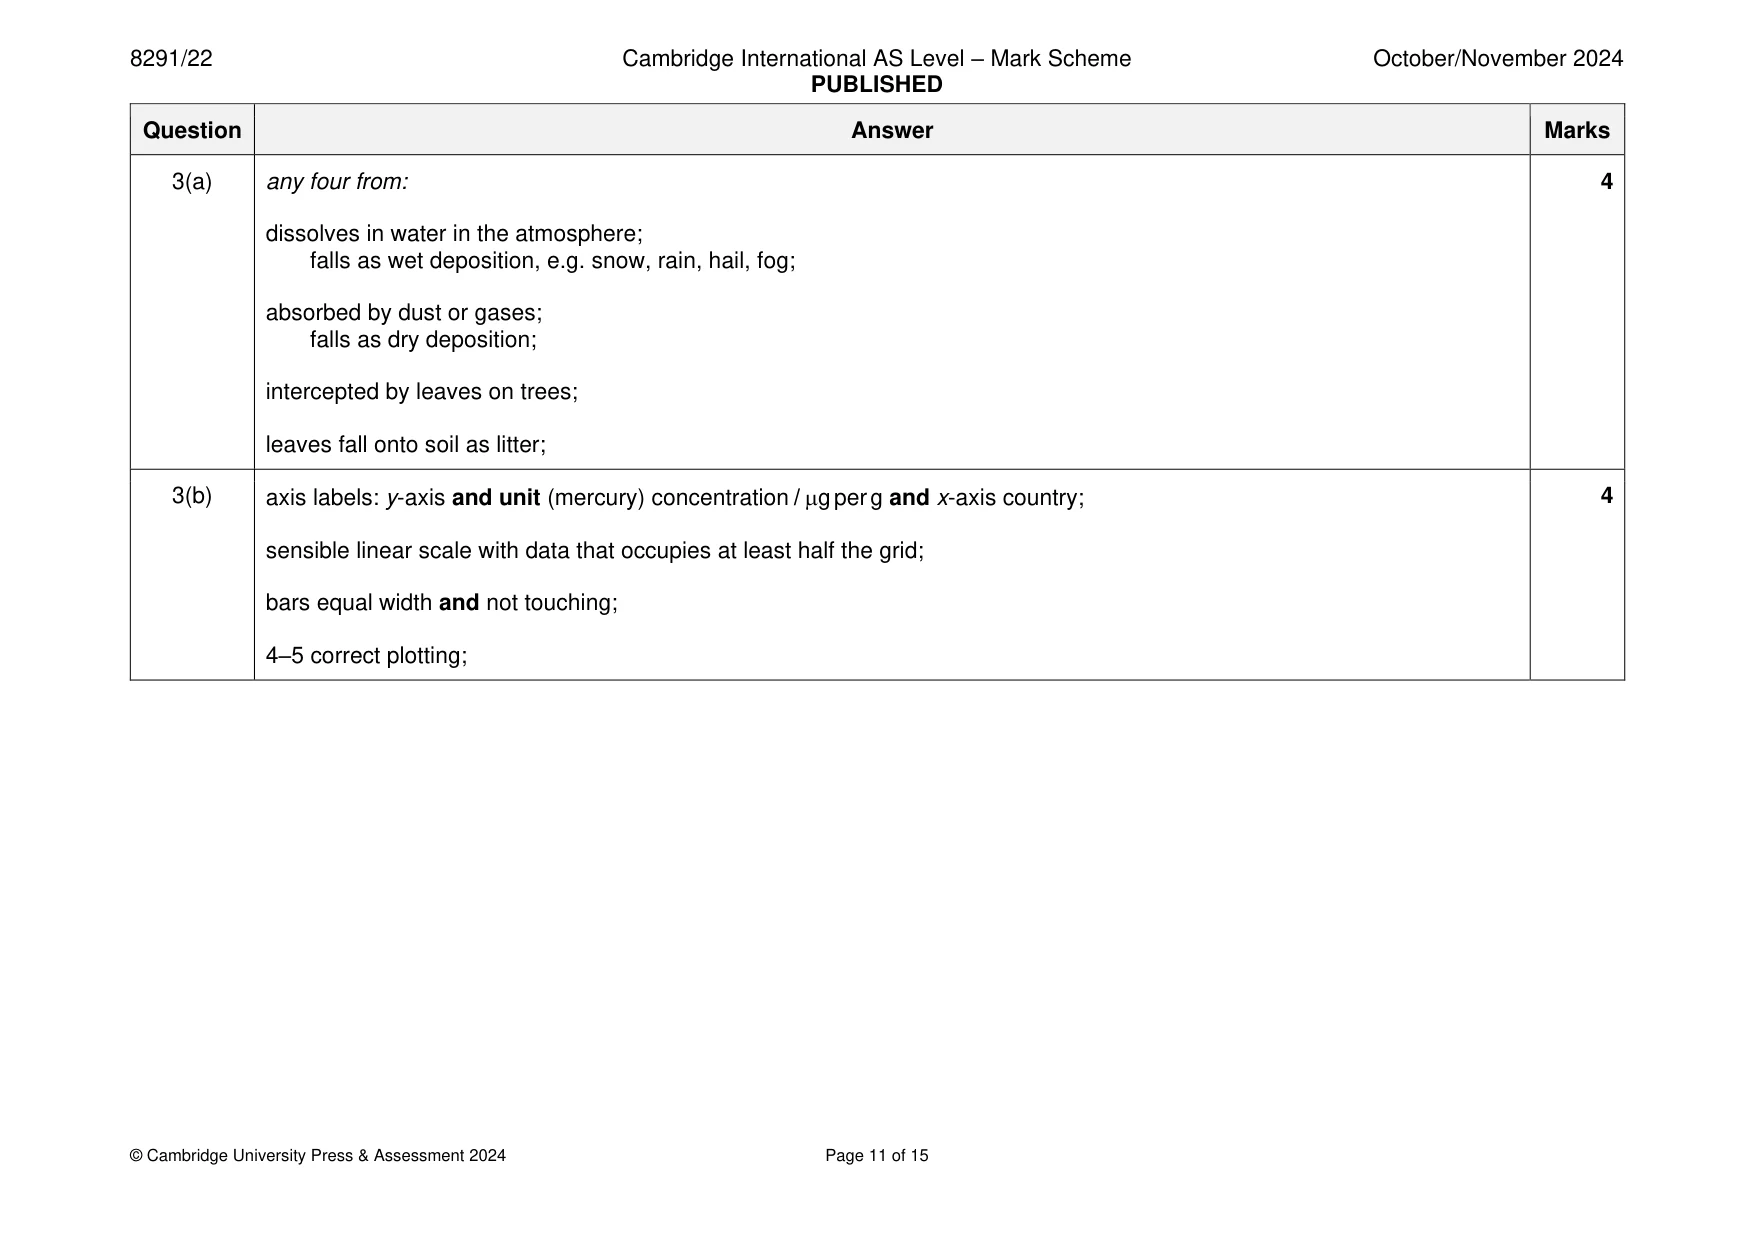
Mark scheme: Question Answer Marks 1(a)(i) any three from: 3 increasing global temperatures / global warming; extreme or severe weather; examples of extreme weather, e.g. drought / flooding / hurricanes; rising sea levels; (leading to) loss of land (for crops or agriculture); non-optimum conditions for crop growth (due to climate change); crop failure / reduced crop yield / less food; 1(a)(ii) any three from: 3 seaweed act as carbon sinks / stores / shellfish act as carbon sinks / stores; seaweed absorbs or uses carbon dioxide during photosynthesis; seaweed is fast growing so large volumes of carbon dioxide removed; provide an alternate food source other than meat based diet; (acts as raw ingredient in many products so) reduces need to extract other raw ingredients; (biofuels) reduce need for fossil fuels; 1(a)(iii) any one from: 1 habitat for marine wildlife; storm-surge protection; improved food security; high (aquatic) crop density or yield; 1(b)(i) any three from: 3 overall increase; 1978 to (1987–)1990 no change or little change / stable; decrease (2005–)2006 to 2007; relevant quoted data trend; 1(b)(ii) any one from: 1 extreme weather or description, e.g. storms / hurricanes; disease; unfavourable growing conditions or description; outcompeted by other species; competition from other ocean activities / industries; 1(c) any two from: 2 large area of ocean needed; limits (other) activities that can take place in ocean; competition with fishing / traditional marine harvesting; concern over impact on native species; increase in pollution (from boats); 1(d) any three from or developed: 3 legislation / international agreement; sustainable harvesting; protected areas; stated fisheries regulation: quotas / catch limits / closed seasons; changes to net size (protects juveniles) / changes to fishing method such as pole and line (reduces bycatch); 1(e)(i) any three from: 3 ice sheets; glaciers; lakes; rivers / streams; swamps; marshes; permafrost; 1(e)(ii) any three from: 3 nitrogen; oxygen; carbon dioxide; argon / noble gases; 1(f) any three from: 3 temperature; humidity; oxygen; carbon dioxide; salinity; (sun)light; pH;
Q2 · Bats are flying nocturnal mammals
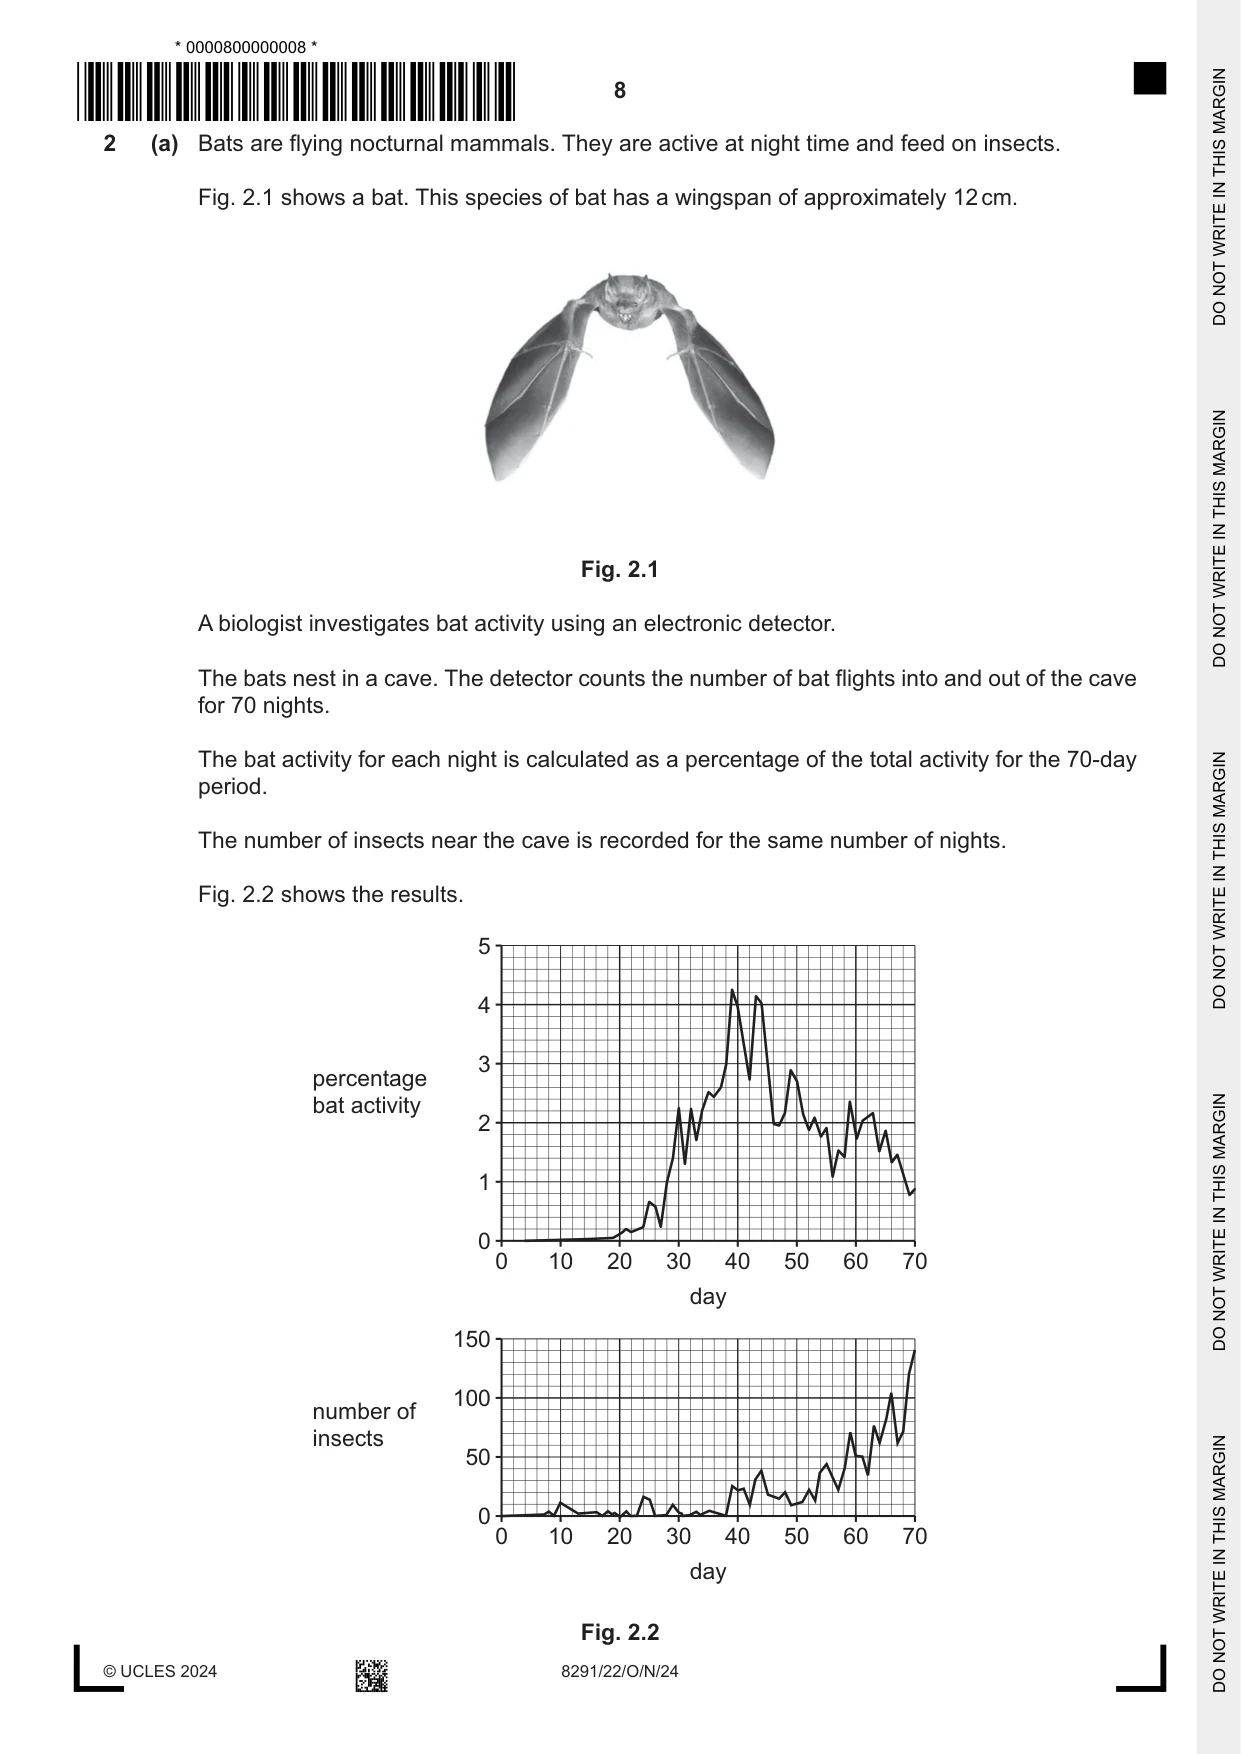
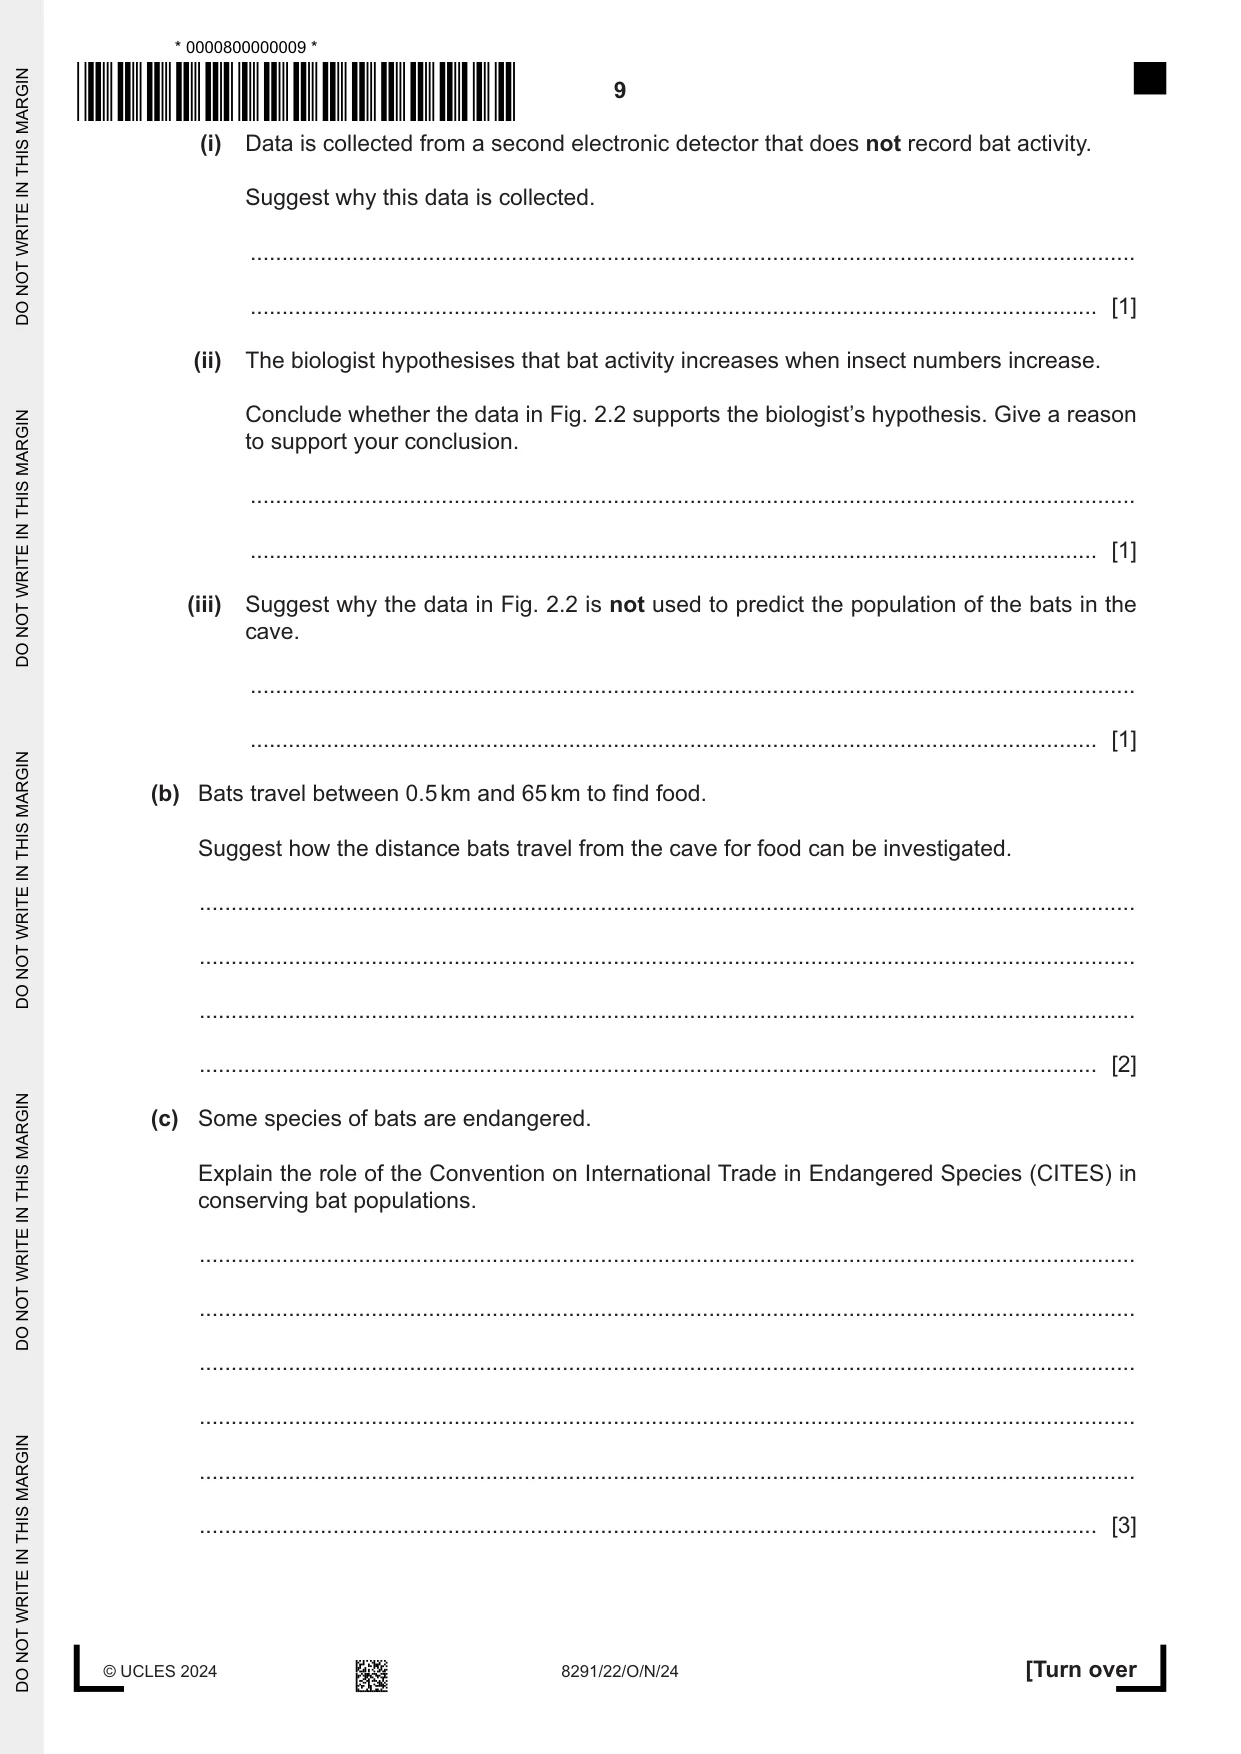
2 (a) Bats are flying nocturnal mammals. They are active at night time and feed on insects. Fig. 2.1 shows a bat. This species of bat has a wingspan of approximately 12 cm. Fig. 2.1 A biologist investigates bat activity using an electronic detector. The bats nest in a cave. The detector counts the number of bat flights into and out of the cave for 70 nights. The bat activity for each night is calculated as a percentage of the total activity for the 70-day period. The number of insects near the cave is recorded for the same number of nights. Fig. 2.2 shows the results. 5 4 3 percentage bat activity 2 1 0 0 10 20 30 40 50 60 70 day 150 100 number of insects 50 0 0 10 20 30 40 50 60 70 day Fig. 2.2 (i) Data is collected from a second electronic detector that does not record bat activity. Suggest why this data is collected. ........................................................................................................................................... ..................................................................................................................................... [1] (ii) The biologist hypothesises that bat activity increases when insect numbers increase. Conclude whether the data in Fig. 2.2 supports the biologist’s hypothesis. Give a reason to support your conclusion. ........................................................................................................................................... ..................................................................................................................................... [1] (iii) Suggest why the data in Fig. 2.2 is not used to predict the population of the bats in the cave. ........................................................................................................................................... ..................................................................................................................................... [1] (b) Bats travel between 0.5 km and 65 km to find food. Suggest how the distance bats travel from the cave for food can be investigated. ................................................................................................................................................... ................................................................................................................................................... ................................................................................................................................................... ............................................................................................................................................. [2] (c) Some species of bats are endangered. Explain the role of the Convention on International Trade in Endangered Species (CITES) in conserving bat populations. ................................................................................................................................................... ................................................................................................................................................... ................................................................................................................................................... ................................................................................................................................................... ................................................................................................................................................... ............................................................................................................................................. [3] (d) The data for the number of insects in Fig. 2.2 were collected using the large suction device shown in Fig. 2.3. Content removed due to copyright restrictions. Fig. 2.3 Suggest the benefits and limitations of using this large suction device to monitor insect population. benefits ..................................................................................................................................... ................................................................................................................................................... ................................................................................................................................................... ................................................................................................................................................... limitations .................................................................................................................................. ................................................................................................................................................... ................................................................................................................................................... ................................................................................................................................................... [4] [Total: 12]
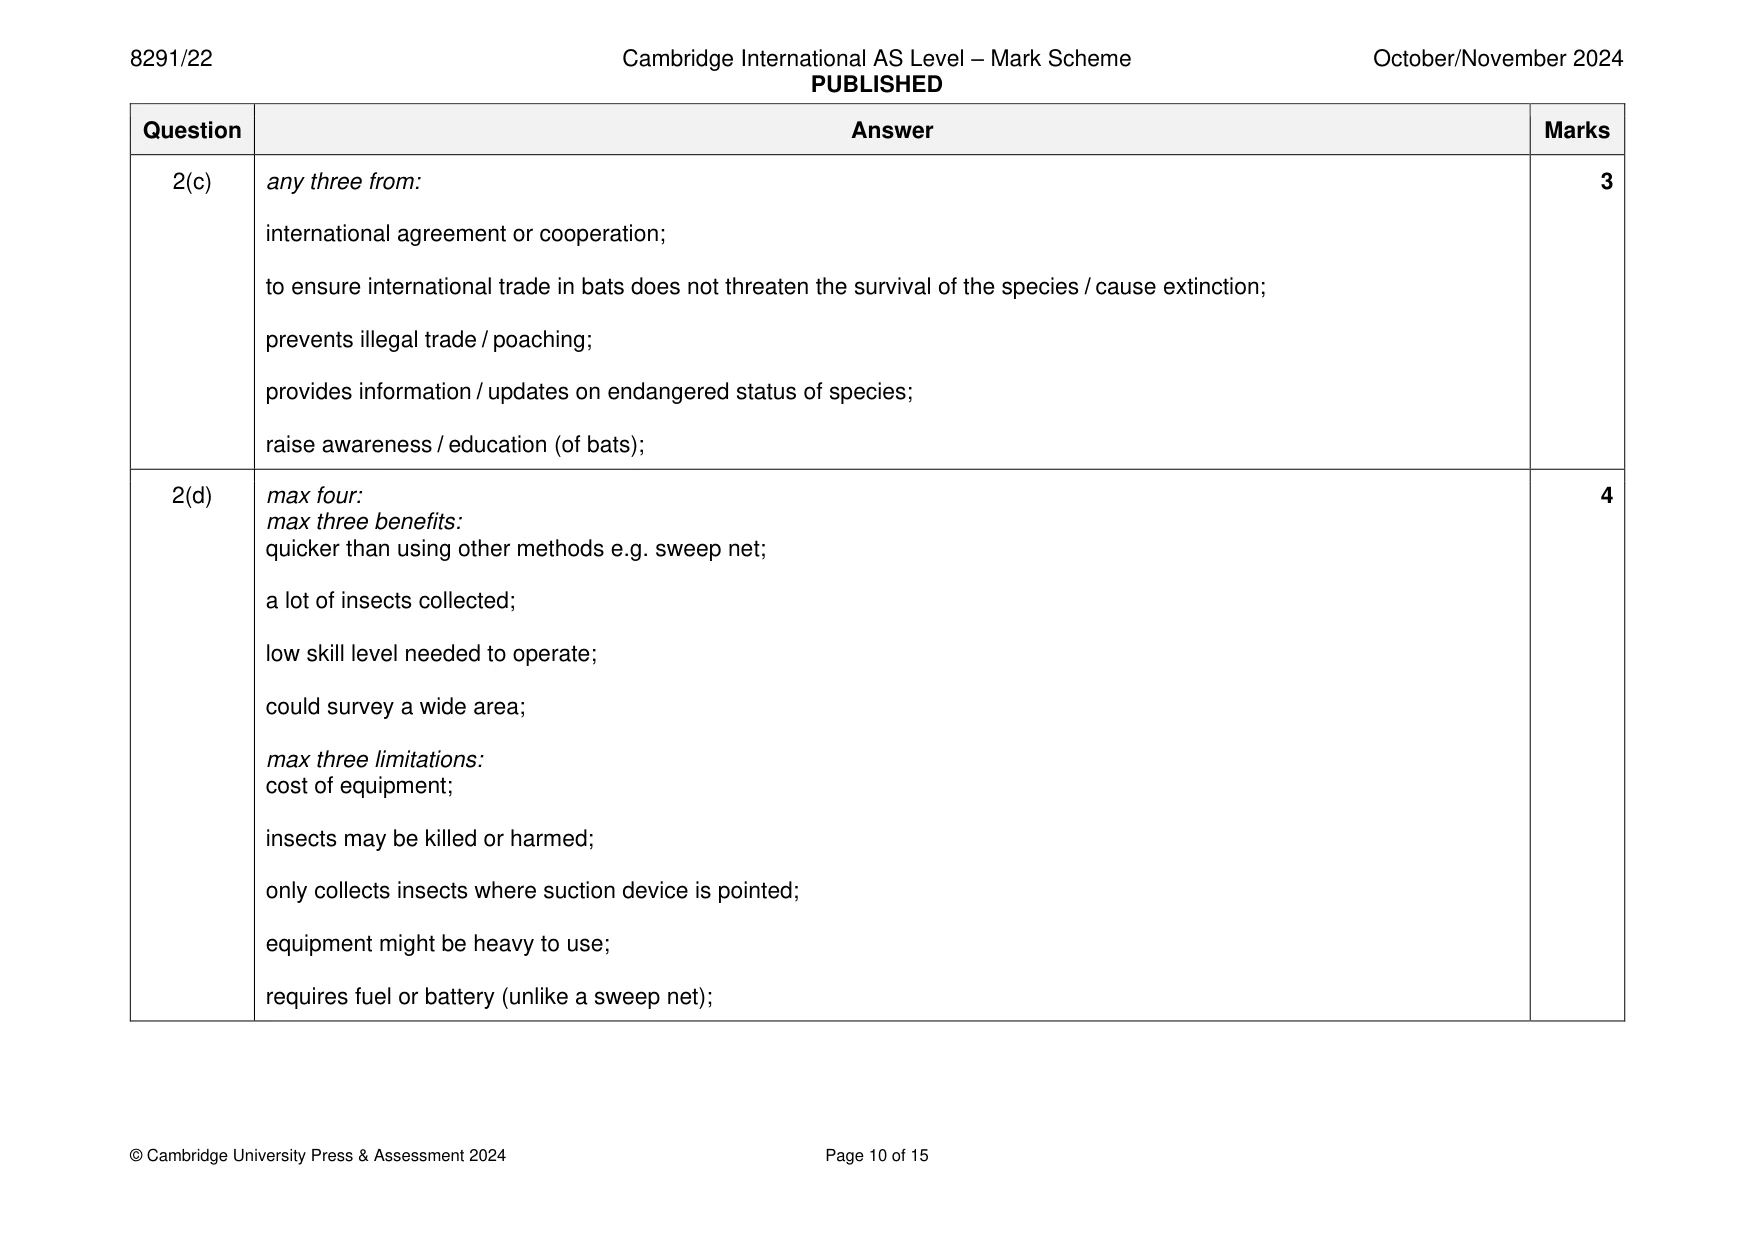
Mark scheme: 2(a)(i) idea of a comparison with a control / identify anomalous results; 1 2(a)(ii) No and peak bat activity has low insect numbers / ORA; 1 2(a)(iii) data is only for bat activity / no information on number of bats / same bat could be counted numerous times or not counted 1 at all; 2(b) any two from: 2 fit tracking devices to the bats; monitor by GPS; use radio tracking; put electronic (motion) detectors at different distances from the cave; 2(c) any three from: 3 international agreement or cooperation; to ensure international trade in bats does not threaten the survival of the species / cause extinction; prevents illegal trade / poaching; provides information / updates on endangered status of species; raise awareness / education (of bats); 2(d) max four: 4 max three benefits: quicker than using other methods e.g. sweep net; a lot of insects collected; low skill level needed to operate; could survey a wide area; max three limitations: cost of equipment; insects may be killed or harmed; only collects insects where suction device is pointed; equipment might be heavy to use; requires fuel or battery (unlike a sweep net);
More questions on Data collection techniques and data analysis
Q3 · Gold is a valuable metal
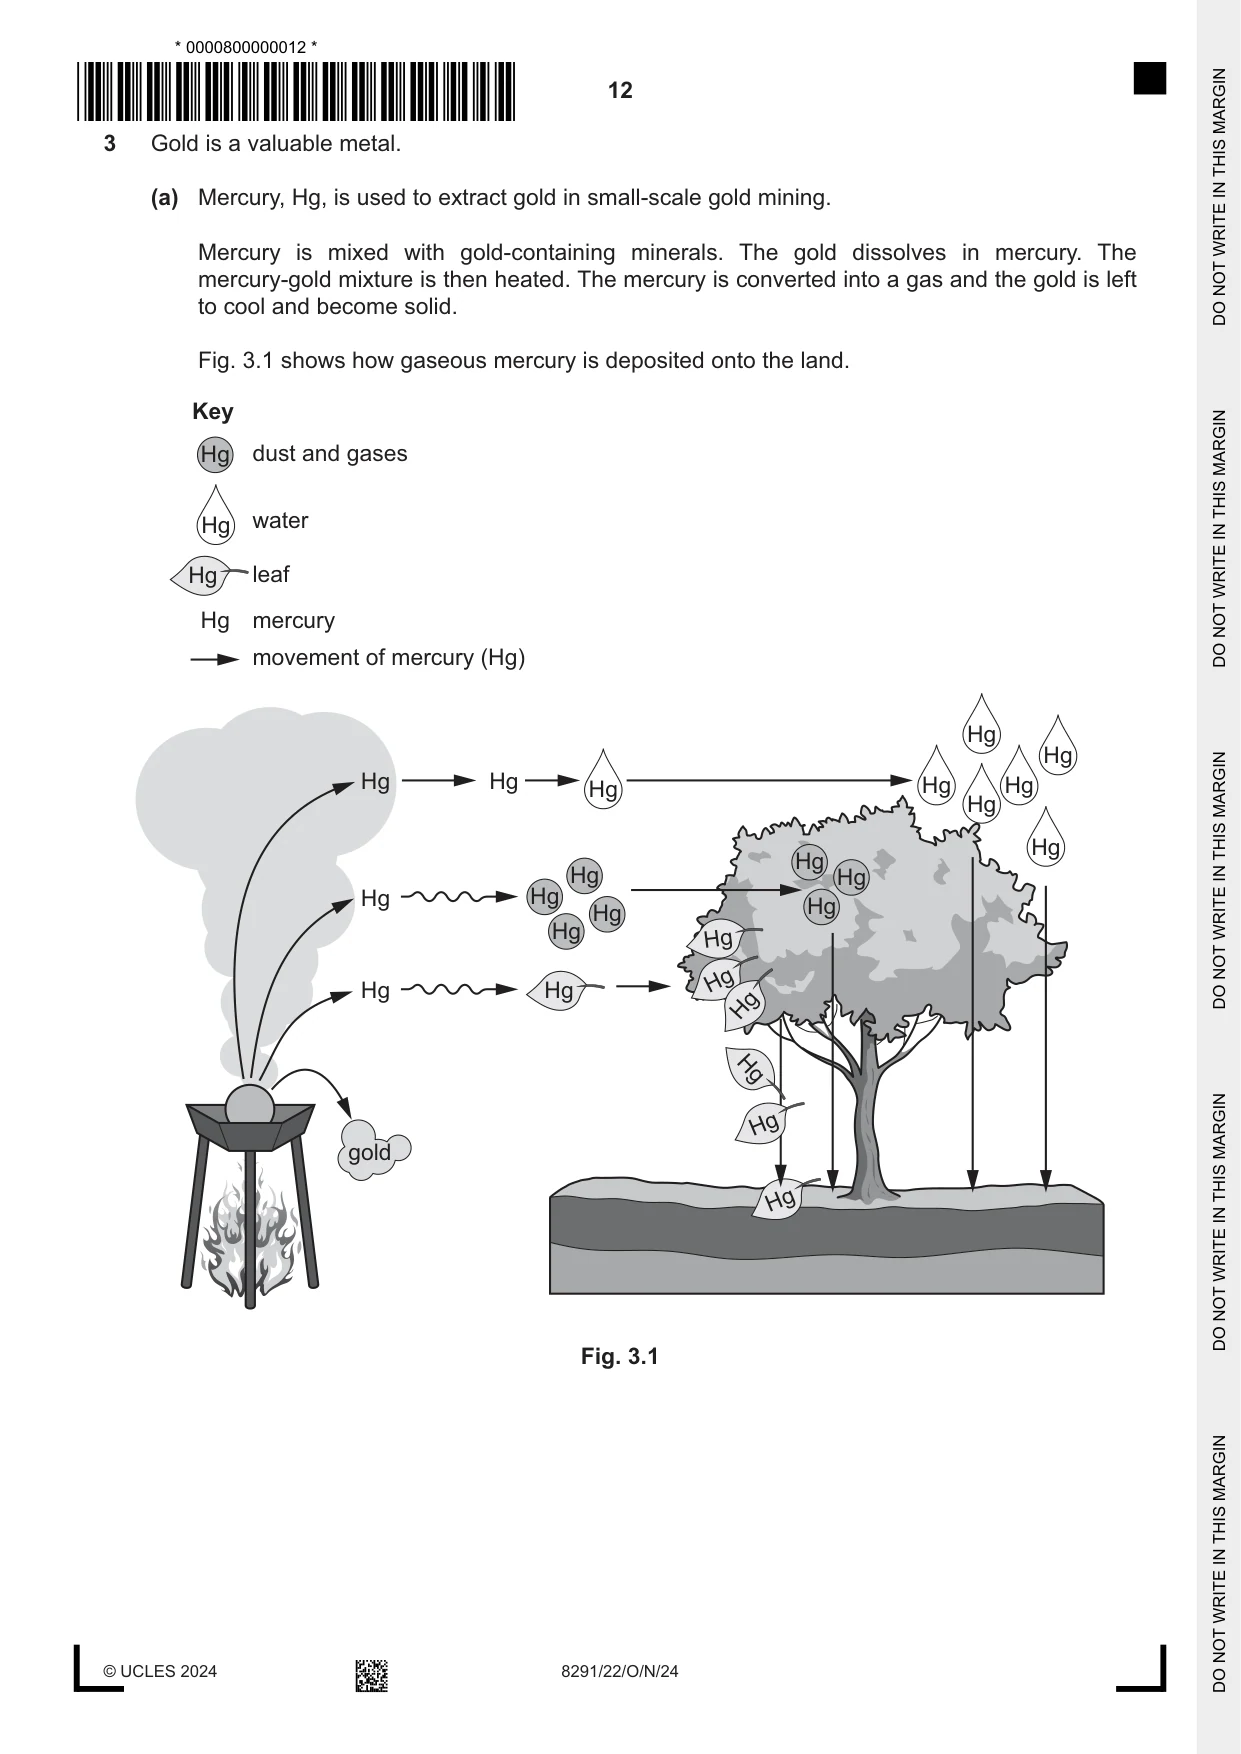
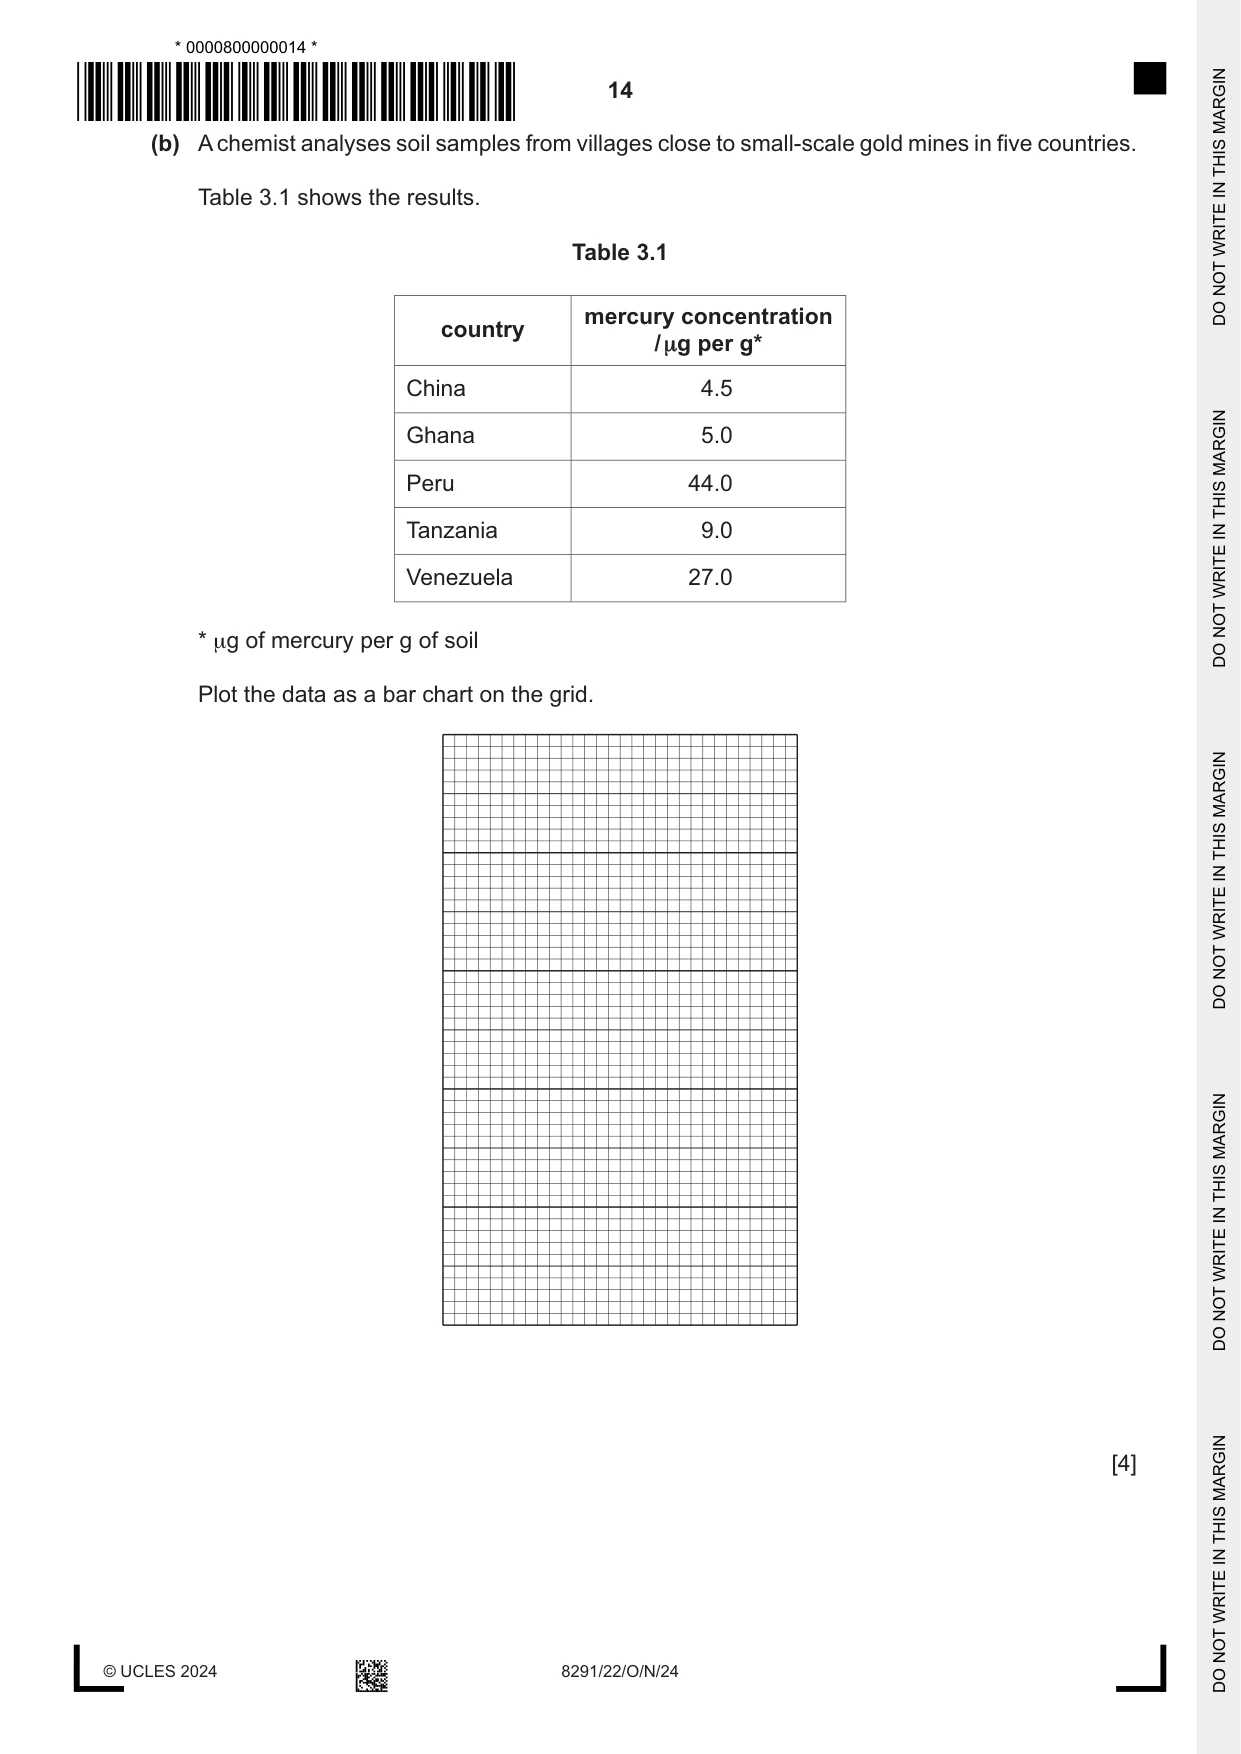
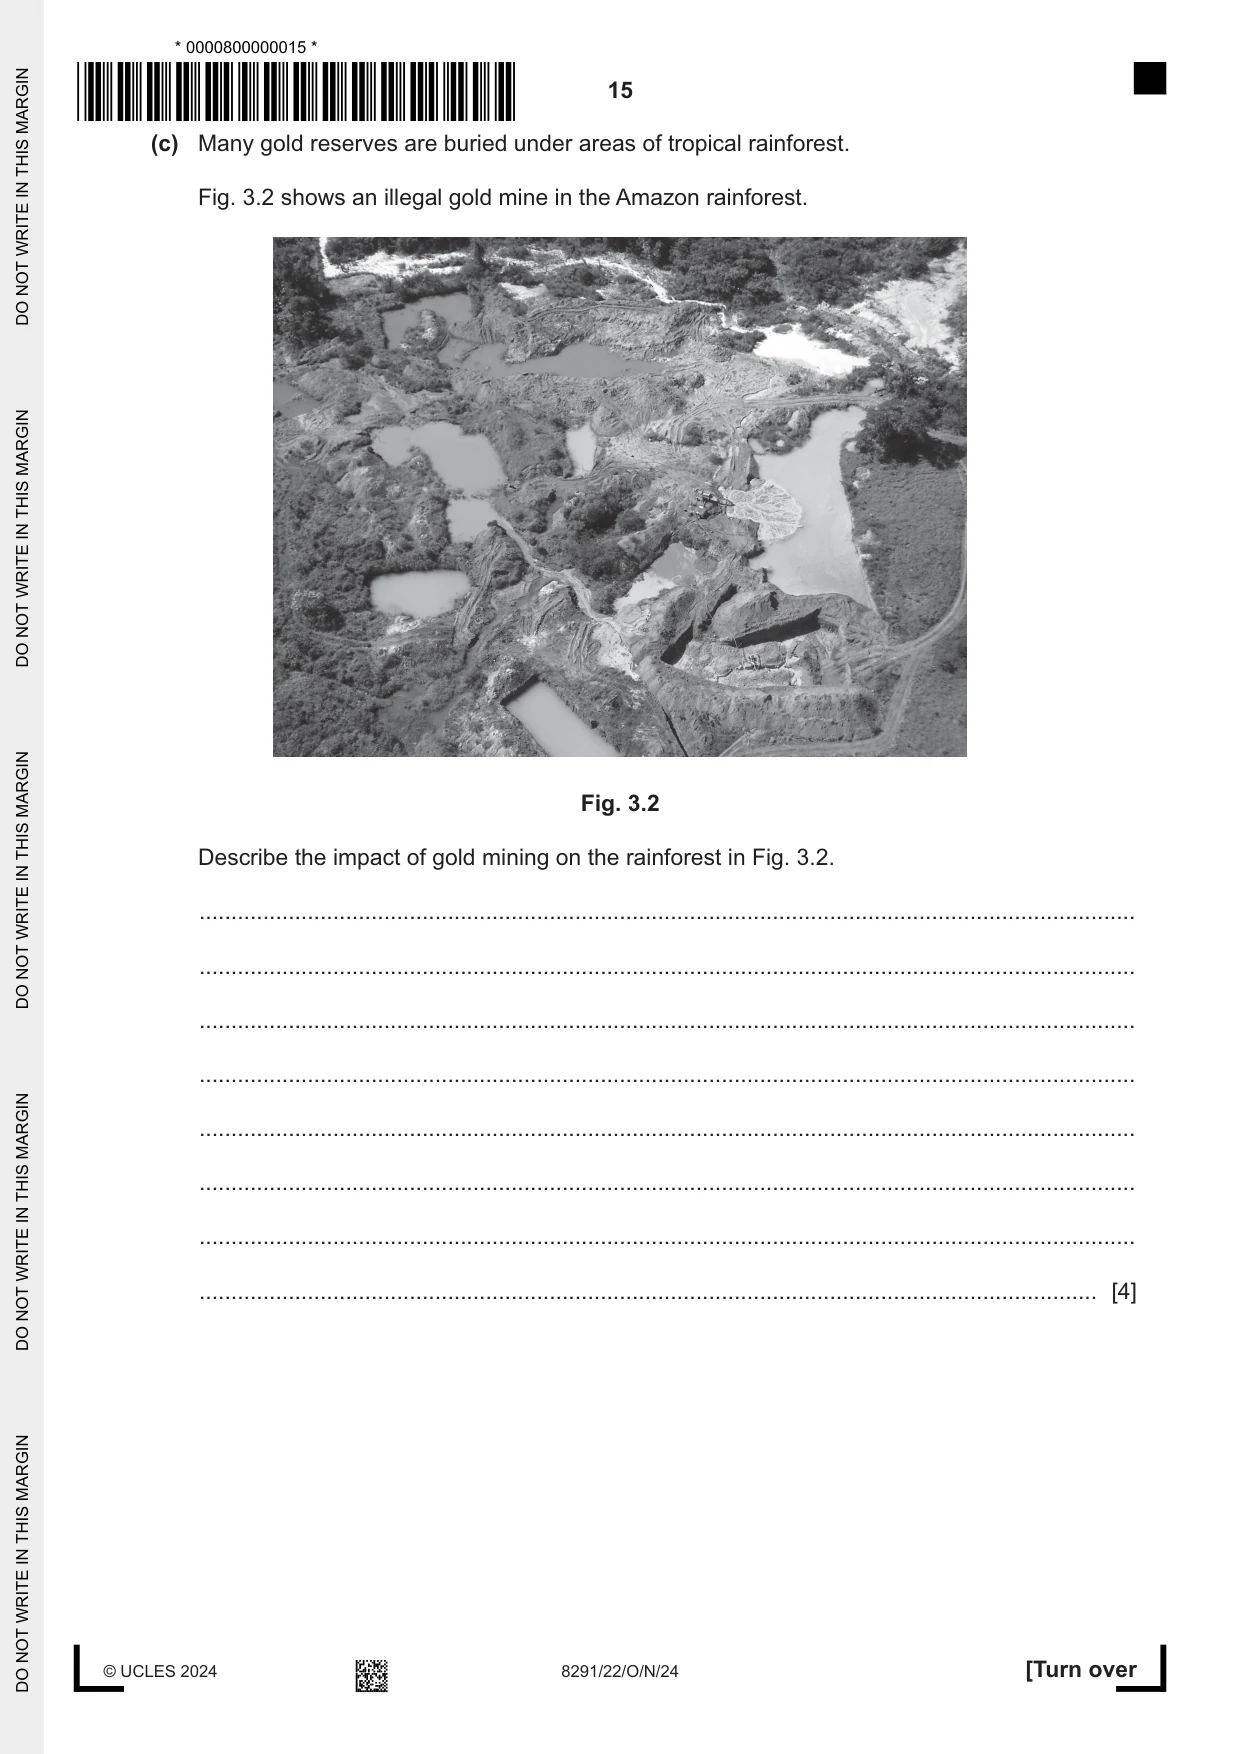
3 Gold is a valuable metal. (a) Mercury, Hg, is used to extract gold in small-scale gold mining. Mercury is mixed with gold-containing minerals. The gold dissolves in mercury. The mercury-gold mixture is then heated. The mercury is converted into a gas and the gold is left to cool and become solid. Fig. 3.1 shows how gaseous mercury is deposited onto the land. Key Hg dust and gases Hg water Hg leaf Hg mercury movement of mercury (Hg) Hg Hg Hg Hg Hg Hg Hg Hg Hg Hg Hg Hg Hg Hg Hg Hg Hg Hg Hg Hg Hg Hg Hg Hg gold Hg Fig. 3.1 Use Fig. 3.1 to explain how mercury is deposited onto the land. ................................................................................................................................................... ................................................................................................................................................... ................................................................................................................................................... ................................................................................................................................................... ................................................................................................................................................... ................................................................................................................................................... ................................................................................................................................................... ............................................................................................................................................. [4] (b) A chemist analyses soil samples from villages close to small-scale gold mines in five countries. Table 3.1 shows the results. Table 3.1 mercury concentration country / μg per g* China 4.5 Ghana 5.0 Peru 44.0 Tanzania 9.0 Venezuela 27.0 * μg of mercury per g of soil Plot the data as a bar chart on the grid. [4] (c) Many gold reserves are buried under areas of tropical rainforest. Fig. 3.2 shows an illegal gold mine in the Amazon rainforest. Fig. 3.2 Describe the impact of gold mining on the rainforest in Fig. 3.2. ................................................................................................................................................... ................................................................................................................................................... ................................................................................................................................................... ................................................................................................................................................... ................................................................................................................................................... ................................................................................................................................................... ................................................................................................................................................... ............................................................................................................................................. [4] (d) The polluter pays principle is a strategy for managing the impacts of pollution. (i) Describe how the polluter pays principle could manage the impacts of gold mining. ........................................................................................................................................... ........................................................................................................................................... ........................................................................................................................................... ..................................................................................................................................... [2] (ii) State two limitations of this principle for dealing with the impacts shown in Fig. 3.2. 1 ........................................................................................................................................ ........................................................................................................................................... 2 ........................................................................................................................................ ........................................................................................................................................... [2] (e) Sustainable management of resources is an environmental management strategy. (i) Define the term sustainability. ........................................................................................................................................... ........................................................................................................................................... ........................................................................................................................................... ..................................................................................................................................... [2] (ii) Suggest two strategies for managing gold as a resource. 1 ........................................................................................................................................ ........................................................................................................................................... 2 ........................................................................................................................................ ........................................................................................................................................... [2] [Total: 20]
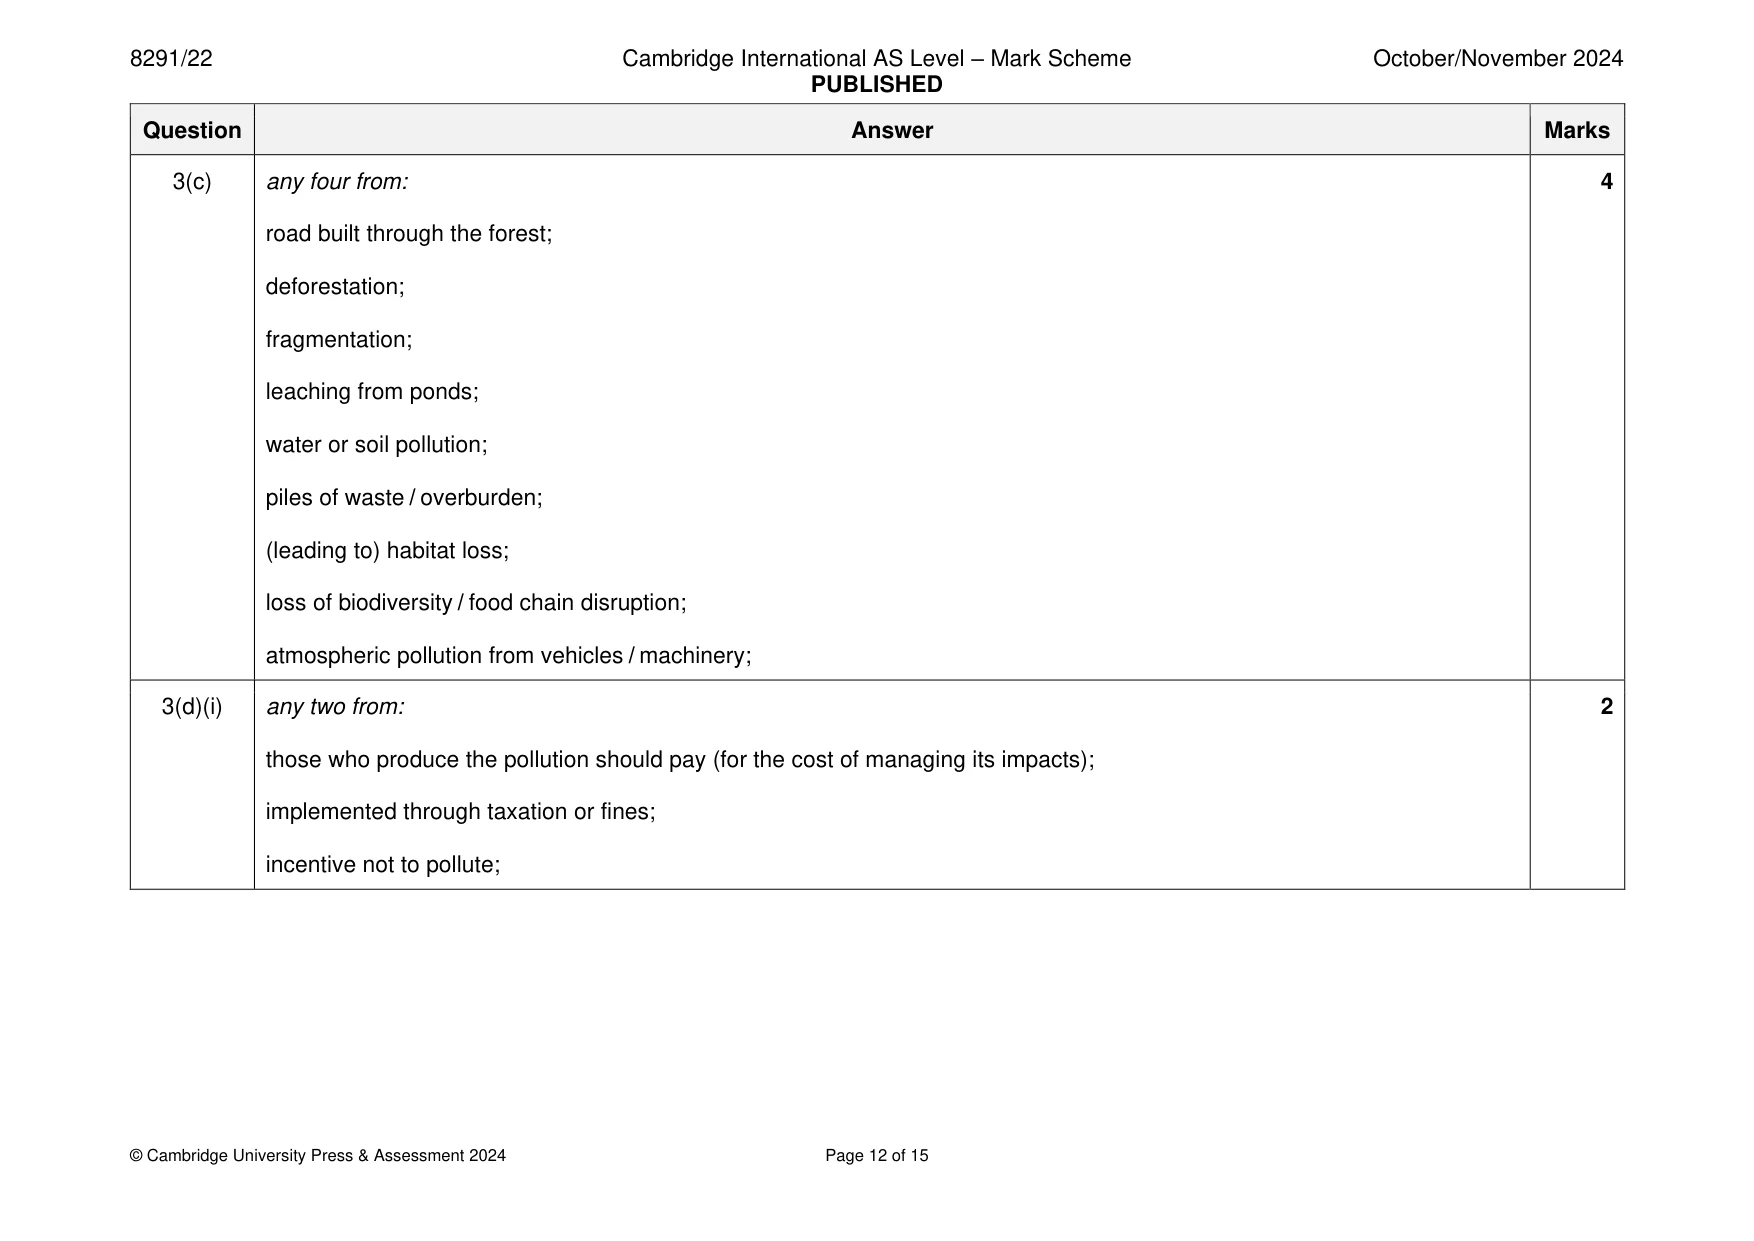
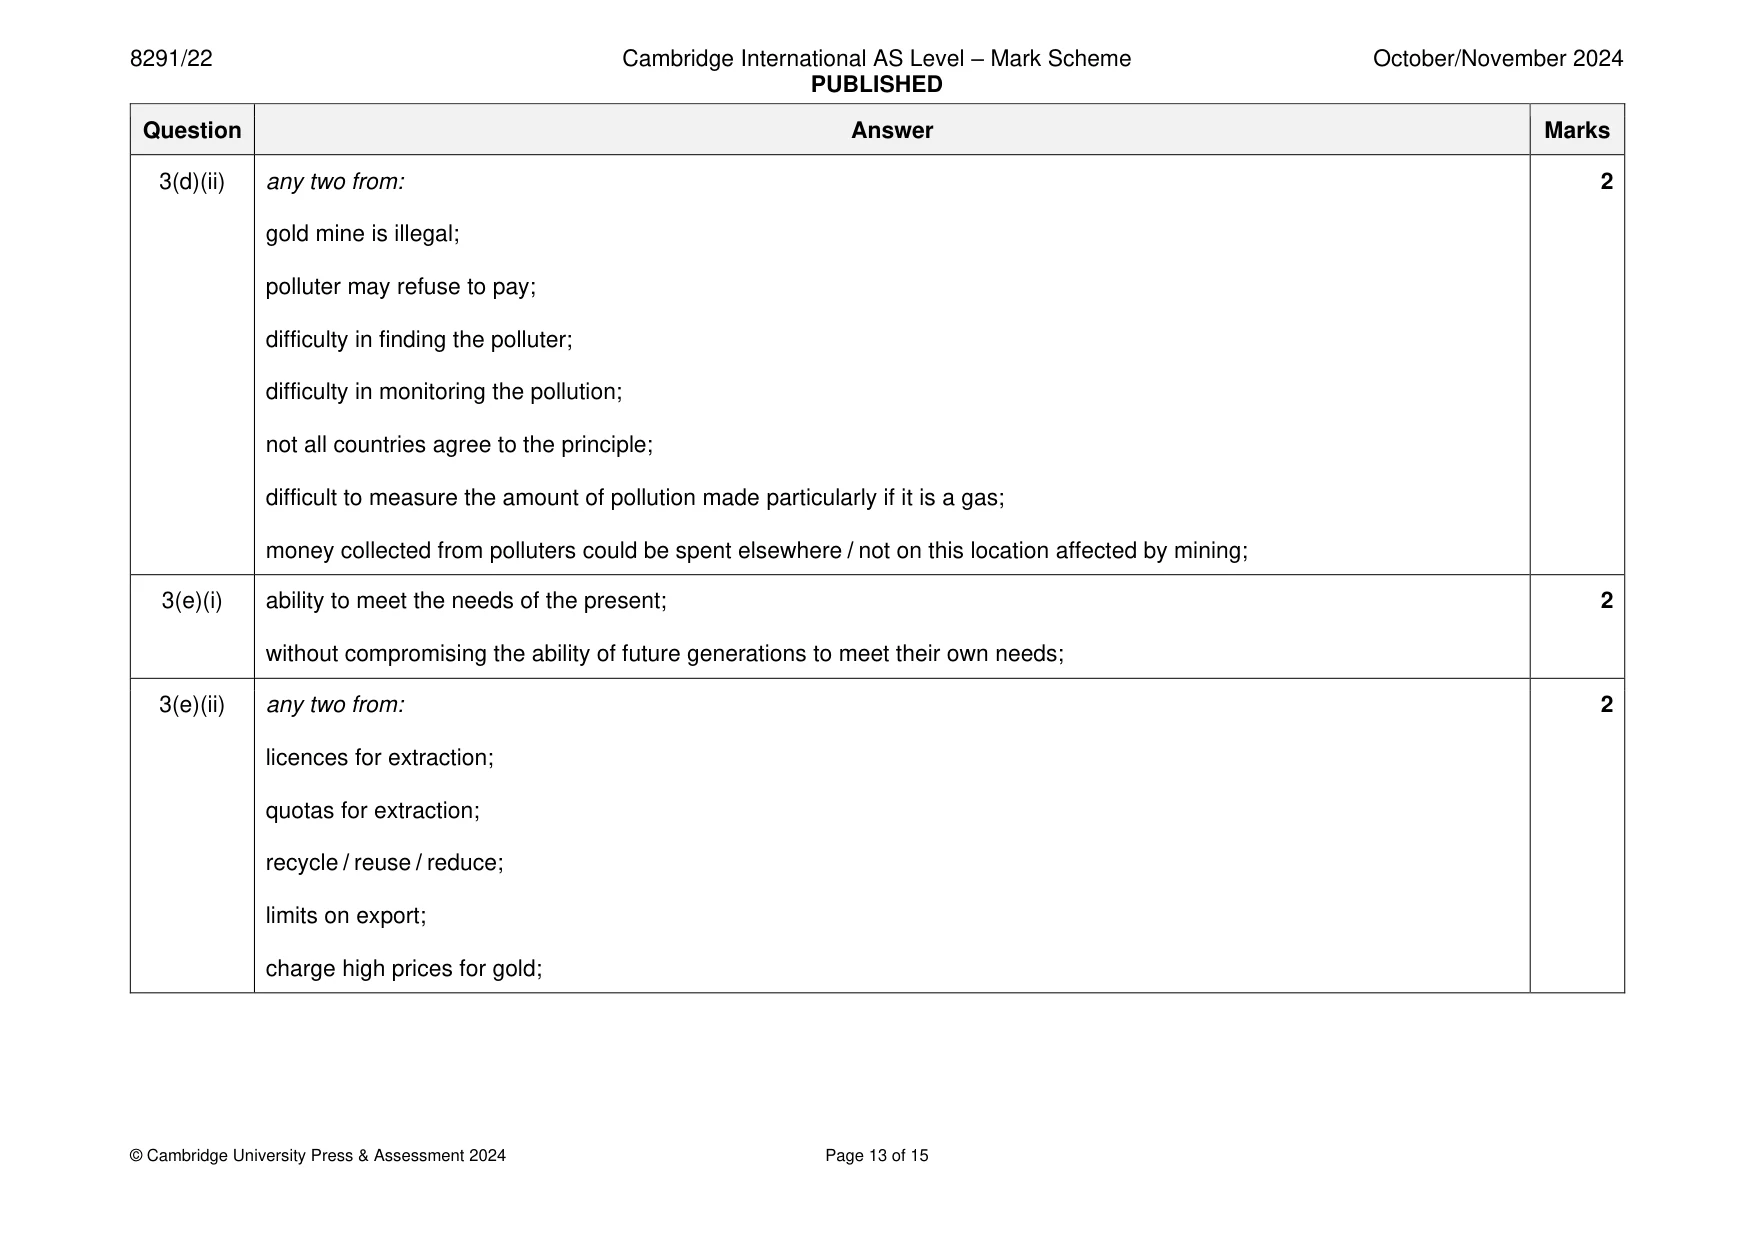
Mark scheme: 3(a) any four from: 4 dissolves in water in the atmosphere; falls as wet deposition, e.g. snow, rain, hail, fog; absorbed by dust or gases; falls as dry deposition; intercepted by leaves on trees; leaves fall onto soil as litter; 3(b) axis labels: y-axis and unit (mercury) concentration / g per g and x-axis country; 4 sensible linear scale with data that occupies at least half the grid; bars equal width and not touching; 4–5 correct plotting; 3(c) any four from: 4 road built through the forest; deforestation; fragmentation; leaching from ponds; water or soil pollution; piles of waste / overburden; (leading to) habitat loss; loss of biodiversity / food chain disruption; atmospheric pollution from vehicles / machinery; 3(d)(i) any two from: 2 those who produce the pollution should pay (for the cost of managing its impacts); implemented through taxation or fines; incentive not to pollute; 3(d)(ii) any two from: 2 gold mine is illegal; polluter may refuse to pay; difficulty in finding the polluter; difficulty in monitoring the pollution; not all countries agree to the principle; difficult to measure the amount of pollution made particularly if it is a gas; money collected from polluters could be spent elsewhere / not on this location affected by mining; 3(e)(i) ability to meet the needs of the present; 2 without compromising the ability of future generations to meet their own needs; 3(e)(ii) any two from: 2 licences for extraction; quotas for extraction; recycle / reuse / reduce; limits on export; charge high prices for gold;
Q4 · Areas of tundra biome
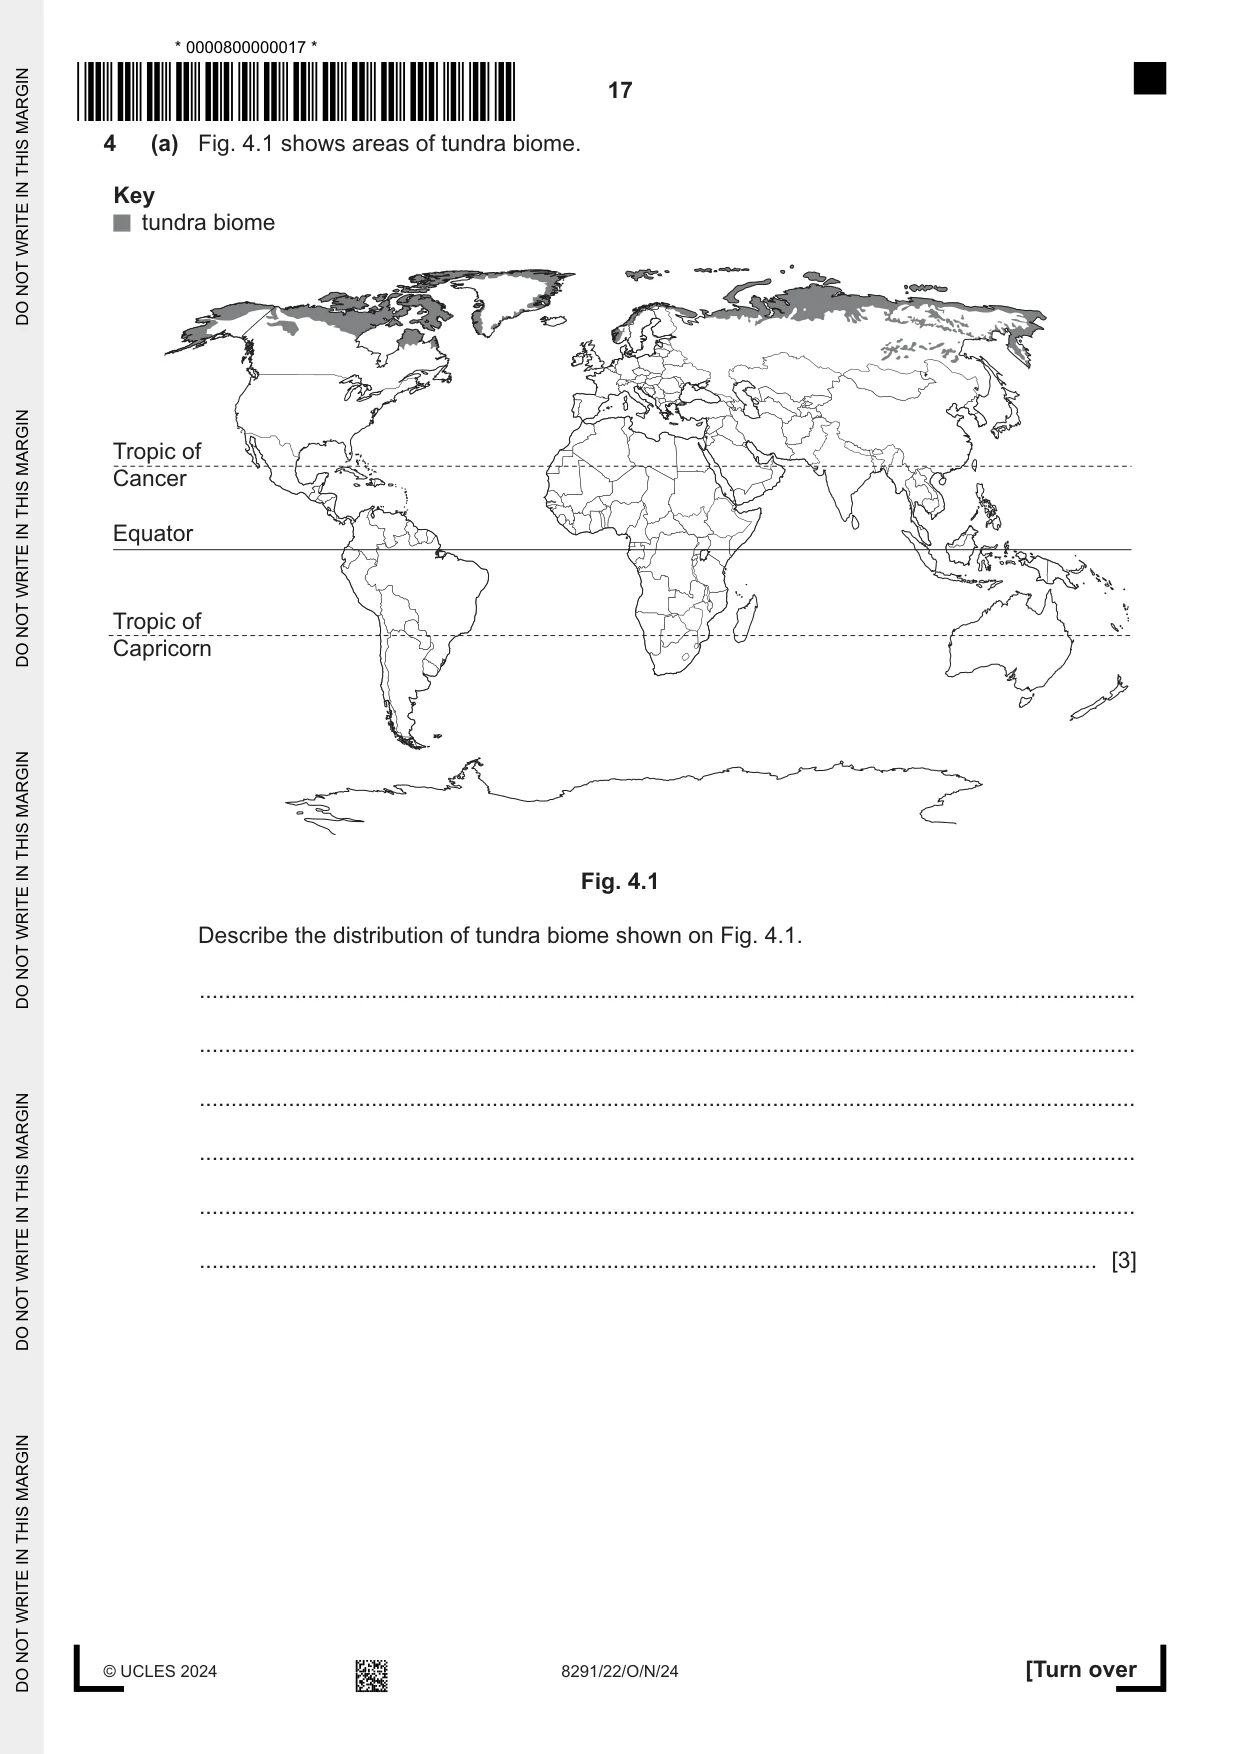
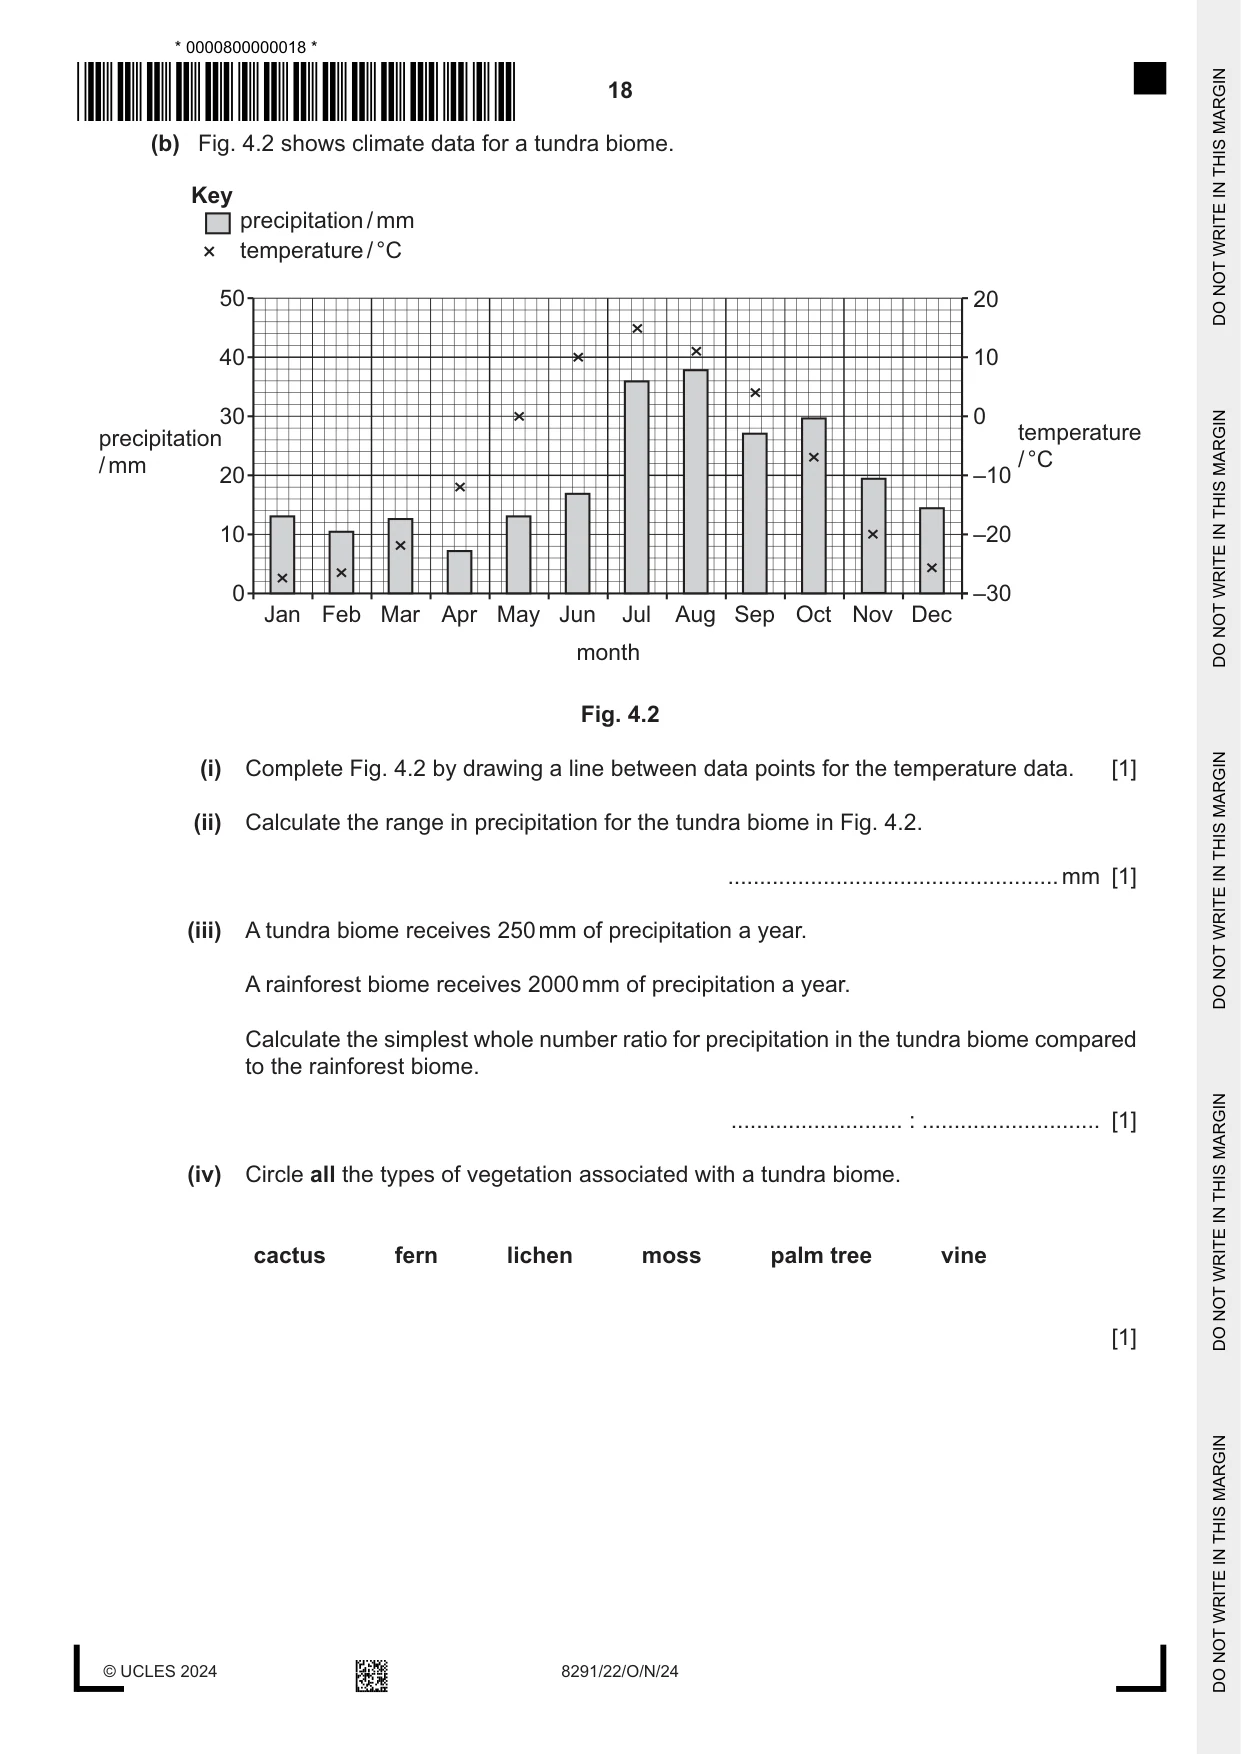
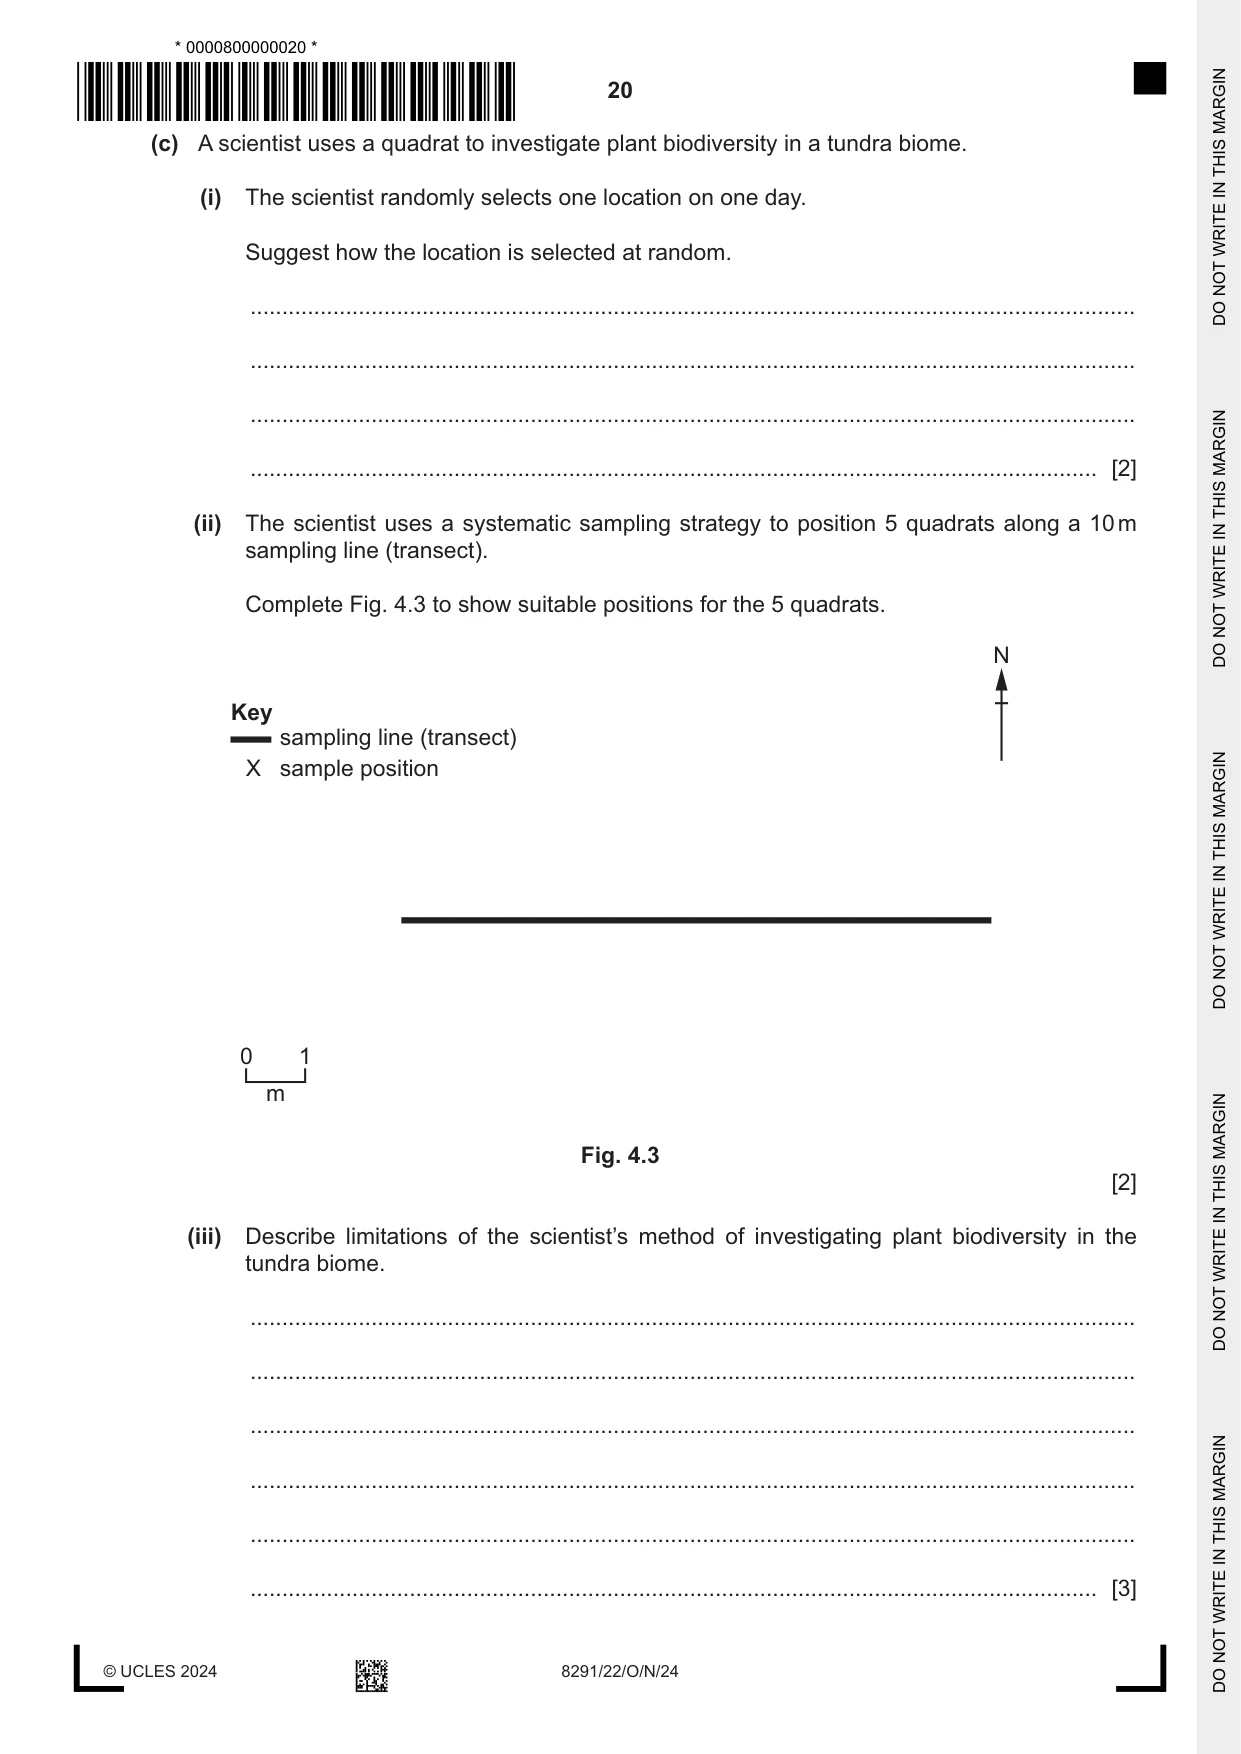
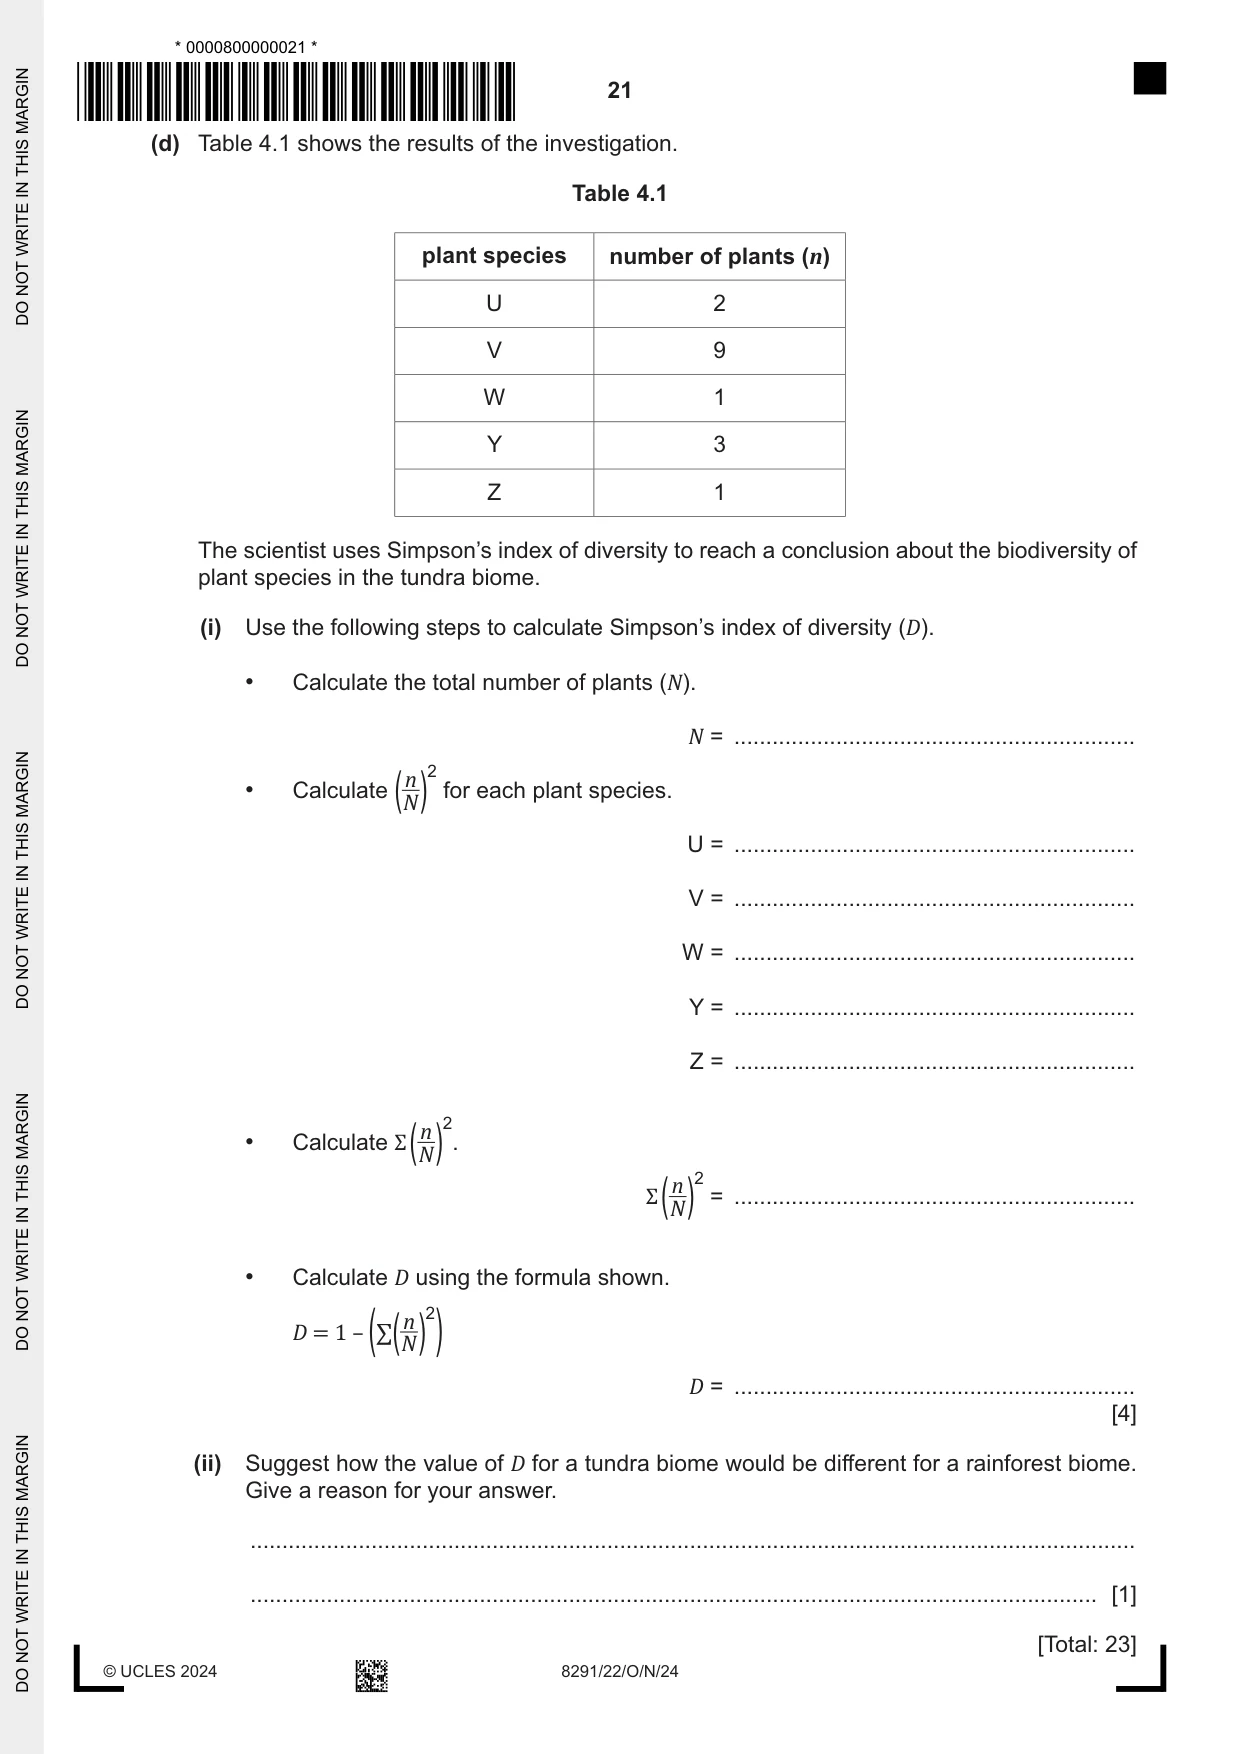
4 (a) Fig. 4.1 shows areas of tundra biome. Key tundra biome Tropic of Cancer Equator Tropic of Capricorn Fig. 4.1 Describe the distribution of tundra biome shown on Fig. 4.1. ................................................................................................................................................... ................................................................................................................................................... ................................................................................................................................................... ................................................................................................................................................... ................................................................................................................................................... ............................................................................................................................................. [3] (b) Fig. 4.2 shows climate data for a tundra biome. Key precipitation / mm temperature / °C 50 20 40 10 30 0 precipitation temperature / mm / °C 20 –10 10 –20 0 –30 Jan Feb Mar Apr May Jun Jul Aug Sep Oct Nov Dec month Fig. 4.2 (i) Complete Fig. 4.2 by drawing a line between data points for the temperature data. [1] (ii) Calculate the range in precipitation for the tundra biome in Fig. 4.2. .................................................... mm [1] (iii) A tundra biome receives 250 mm of precipitation a year. A rainforest biome receives 2000 mm of precipitation a year. Calculate the simplest whole number ratio for precipitation in the tundra biome compared to the rainforest biome. ........................... : ............................ [1] (iv) Circle all the types of vegetation associated with a tundra biome. cactus fern lichen moss palm tree vine [1] (v) Suggest why crops are not grown in tundra biomes. ........................................................................................................................................... ........................................................................................................................................... ........................................................................................................................................... ........................................................................................................................................... ........................................................................................................................................... ........................................................................................................................................... ........................................................................................................................................... ..................................................................................................................................... [4]
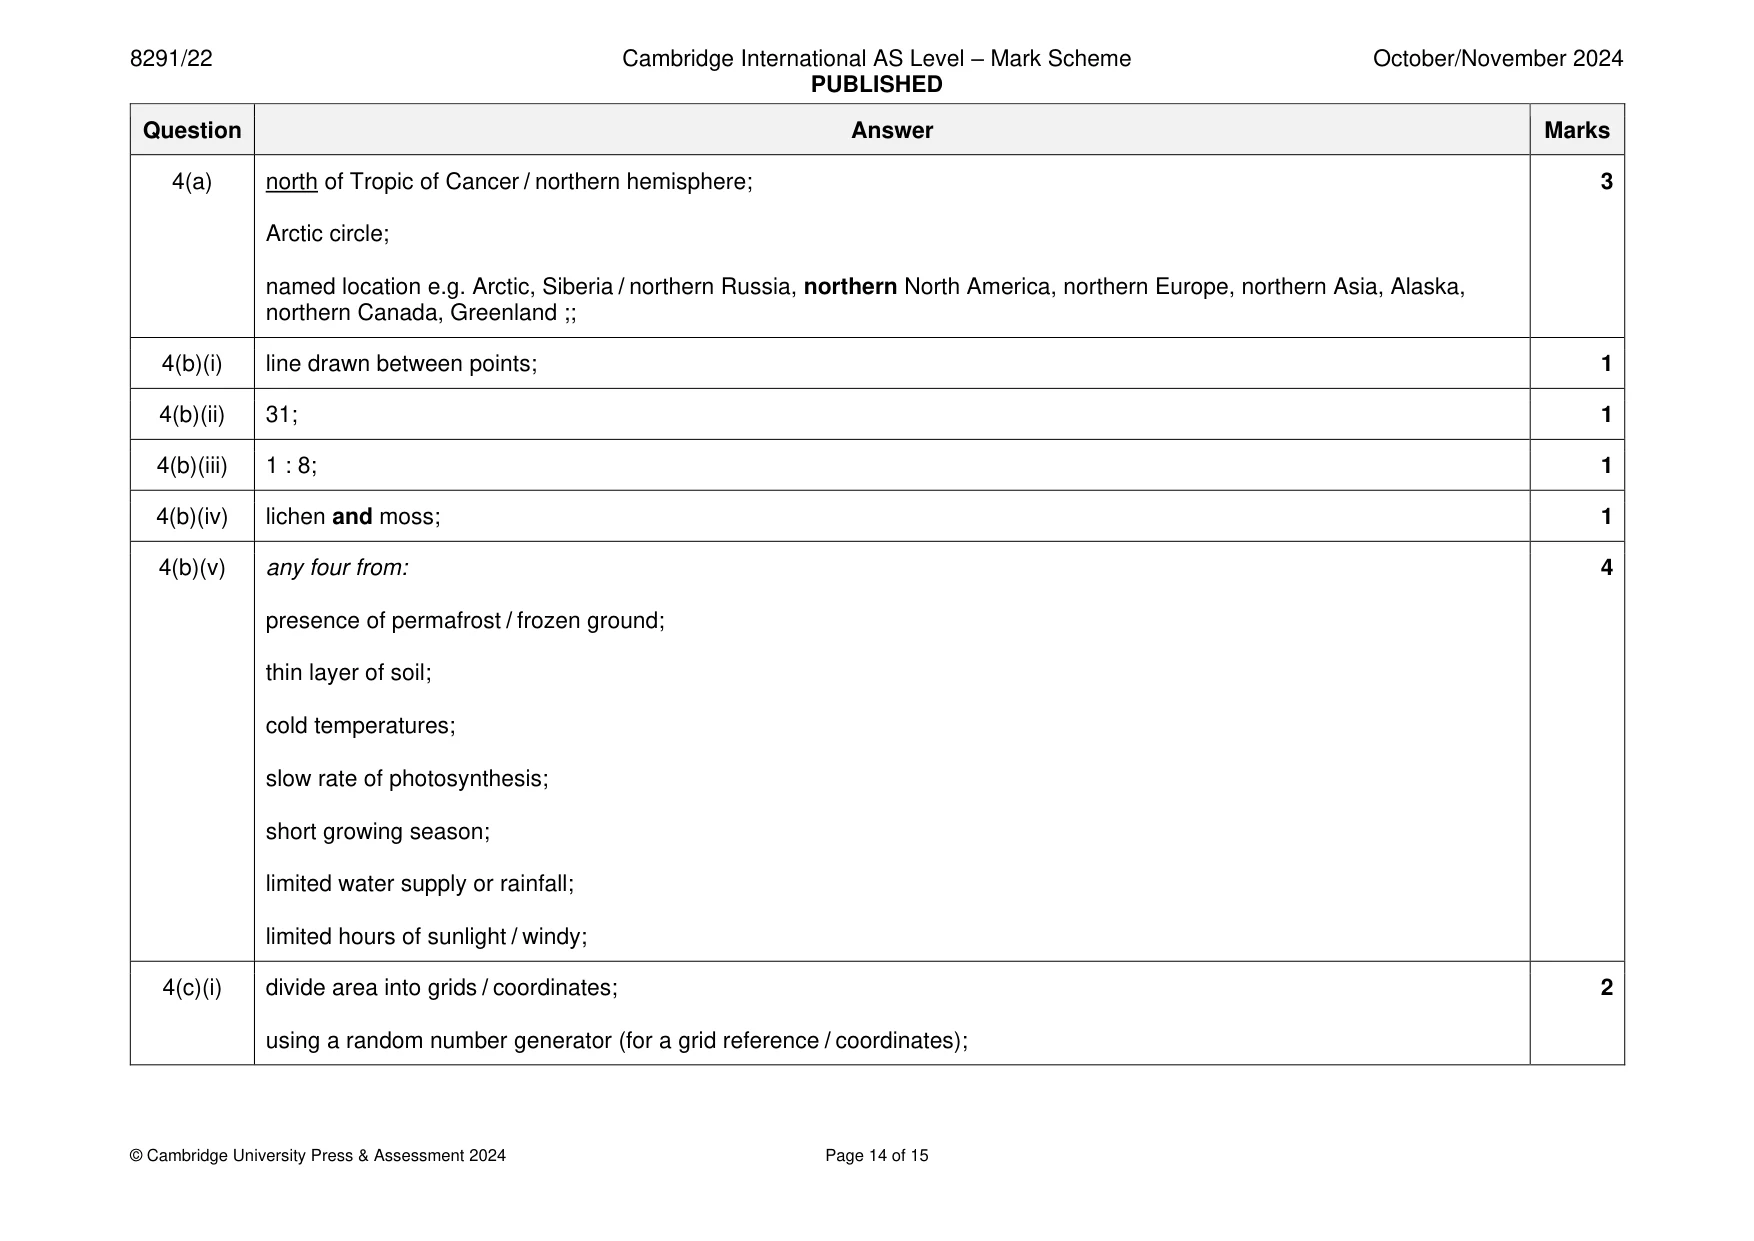
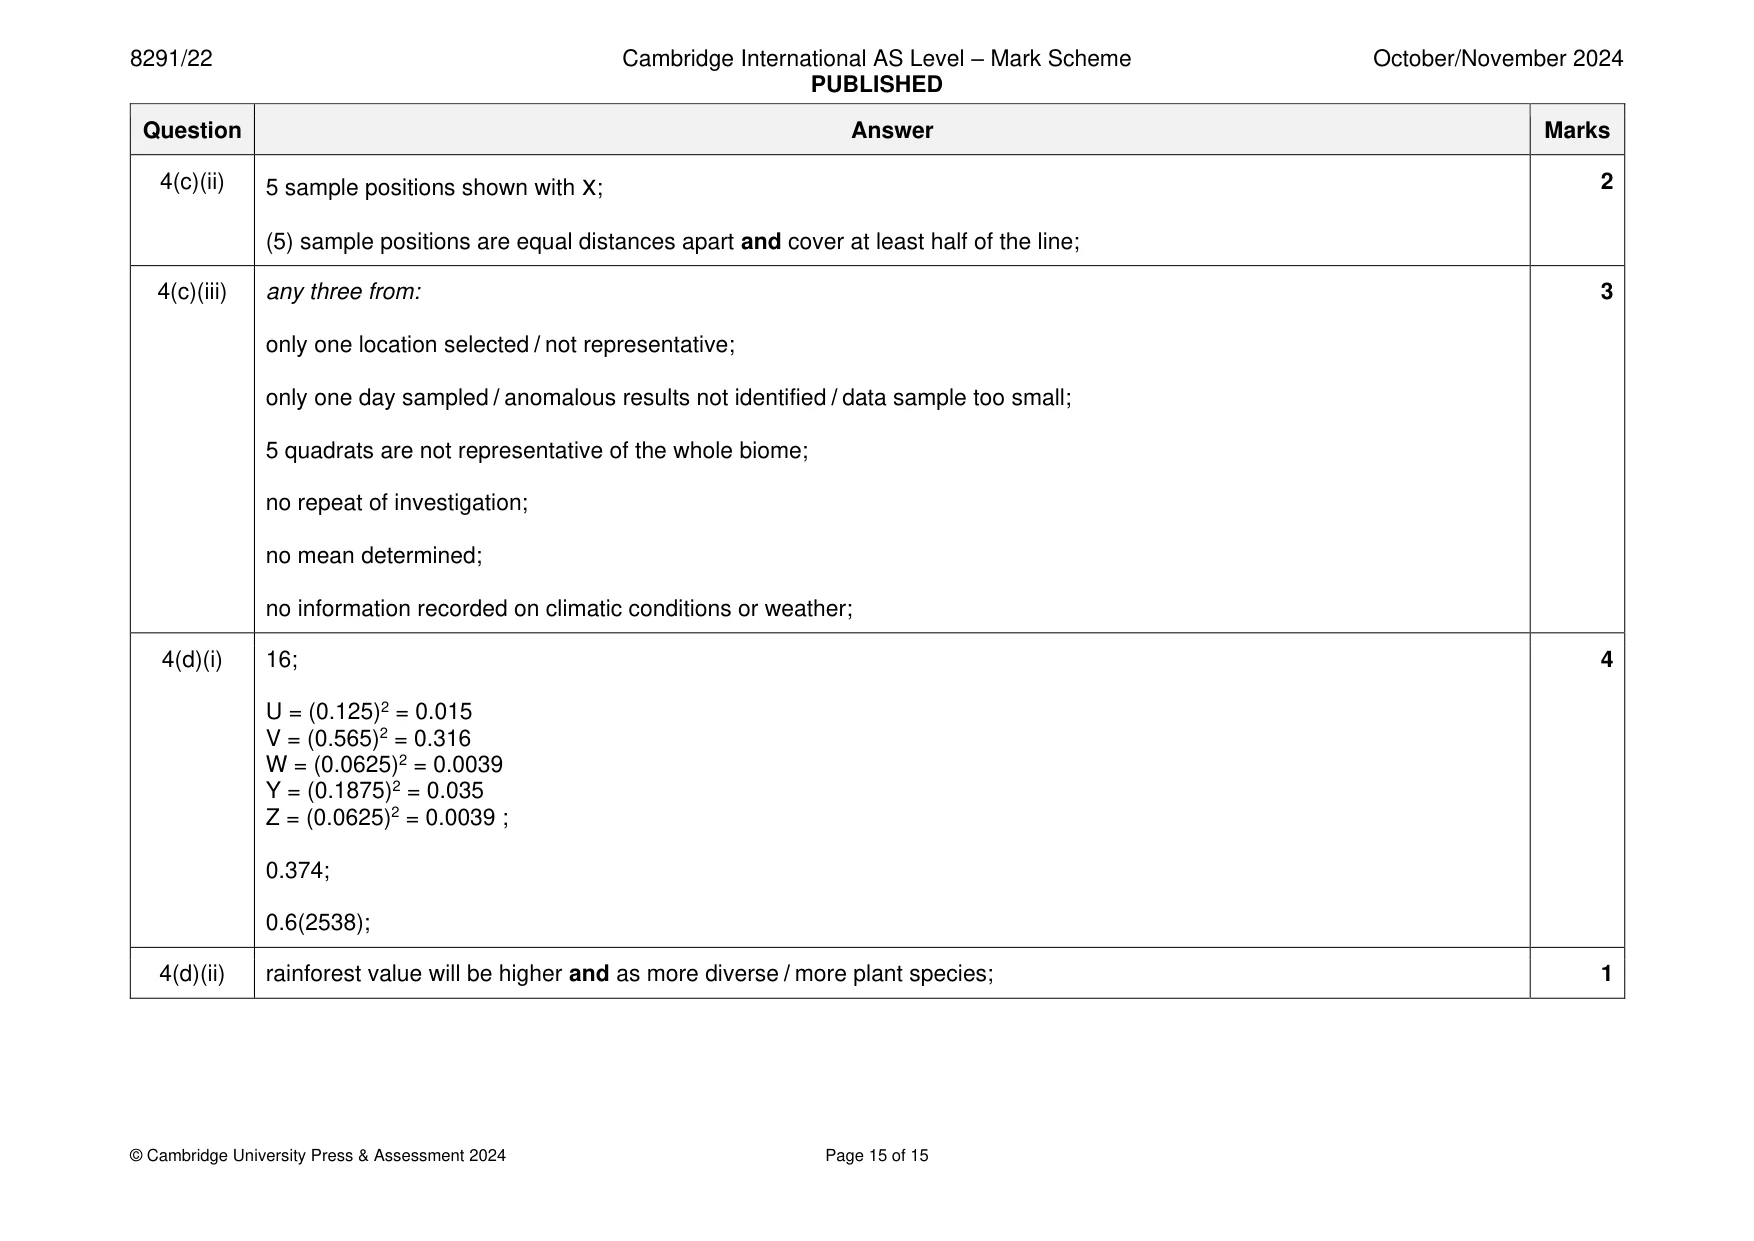
Mark scheme: 4(a) north of Tropic of Cancer / northern hemisphere; 3 Arctic circle; named location e.g. Arctic, Siberia / northern Russia, northern North America, northern Europe, northern Asia, Alaska, northern Canada, Greenland ;; 4(b)(i) line drawn between points; 1 4(b)(ii) 31; 1 4(b)(iii) 1 : 8; 1 4(b)(iv) lichen and moss; 1 4(b)(v) any four from: 4 presence of permafrost / frozen ground; thin layer of soil; cold temperatures; slow rate of photosynthesis; short growing season; limited water supply or rainfall; limited hours of sunlight / windy; 4(c)(i) divide area into grids / coordinates; 2 using a random number generator (for a grid reference / coordinates); 4(c)(ii) 5 sample positions shown with x; 2 (5) sample positions are equal distances apart and cover at least half of the line; 4(c)(iii) any three from: 3 only one location selected / not representative; only one day sampled / anomalous results not identified / data sample too small; 5 quadrats are not representative of the whole biome; no repeat of investigation; no mean determined; no information recorded on climatic conditions or weather; 4(d)(i) 16; 4 U = (0.125)2 = 0.015 V = (0.565)2 = 0.316 W = (0.0625)2 = 0.0039 Y = (0.1875)2 = 0.035 Z = (0.0625)2 = 0.0039 ; 0.374; 0.6(2538); 4(d)(ii) rainforest value will be higher and as more diverse / more plant species; 1
What was in this paper
The subtopics covered by these 4 questions, and how many questions each got. Open one in a new tab to see every Cambridge question on it.
What you needed in this session
Cambridge’s own grade thresholds for 2024 Oct/Nov, Paper 2 · Variant 2. A higher threshold means an easier paper — the bar moves with how the cohort did.