Cambridge A Level Environmental Management (AS only) 8291 — 2023 Oct/Nov Paper 2 · Variant 2
8291/22/O/N/23 · 4 questions · 80 marks · ≈90 min
The question paper and its mark scheme, free to read here and free to download. This is Cambridge’s own paper, exactly as it was sat.
Question paper24 pages









Mark scheme13 pages
Answers below. Sit the paper first if you are practising.
Questions as text
Q1 · Spraying aerosols into the stratosphere and growing crops with shiny leaves are two…
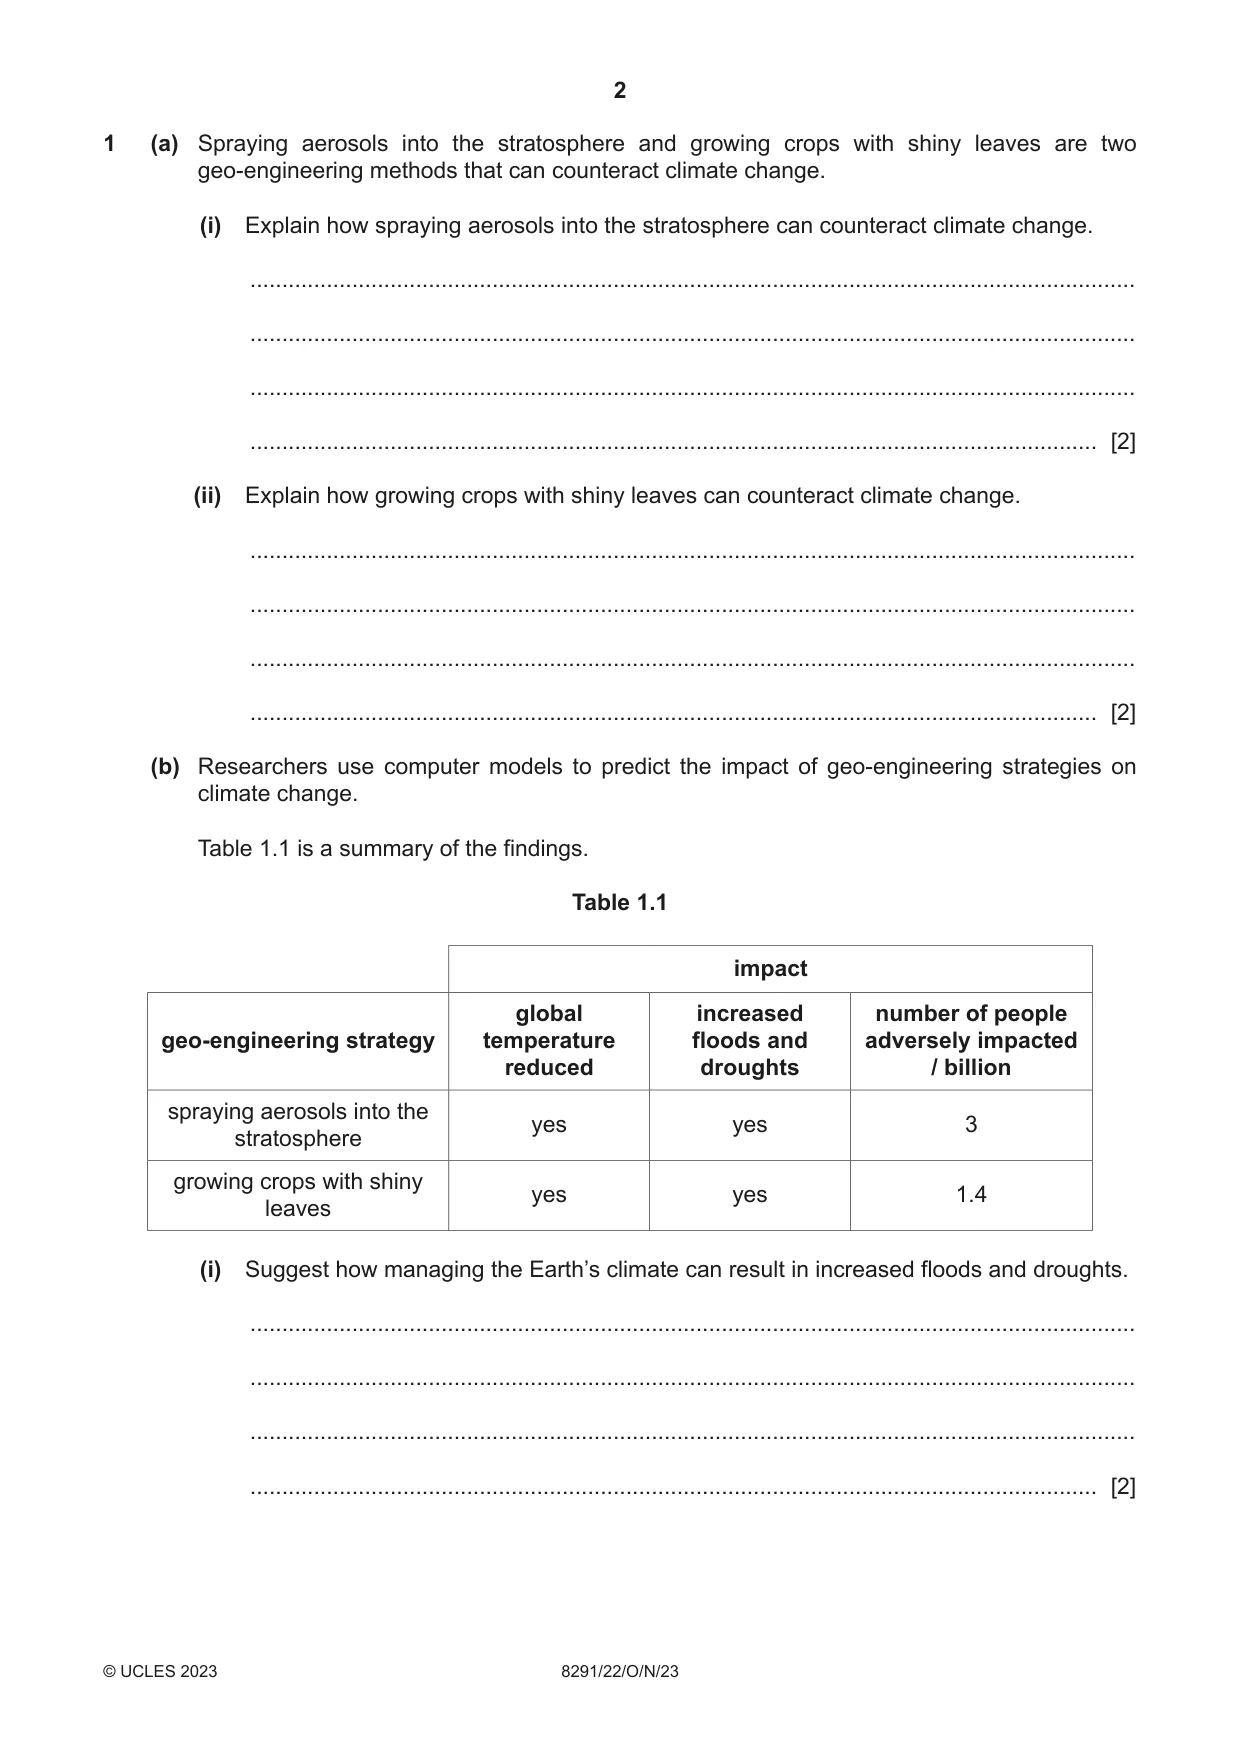
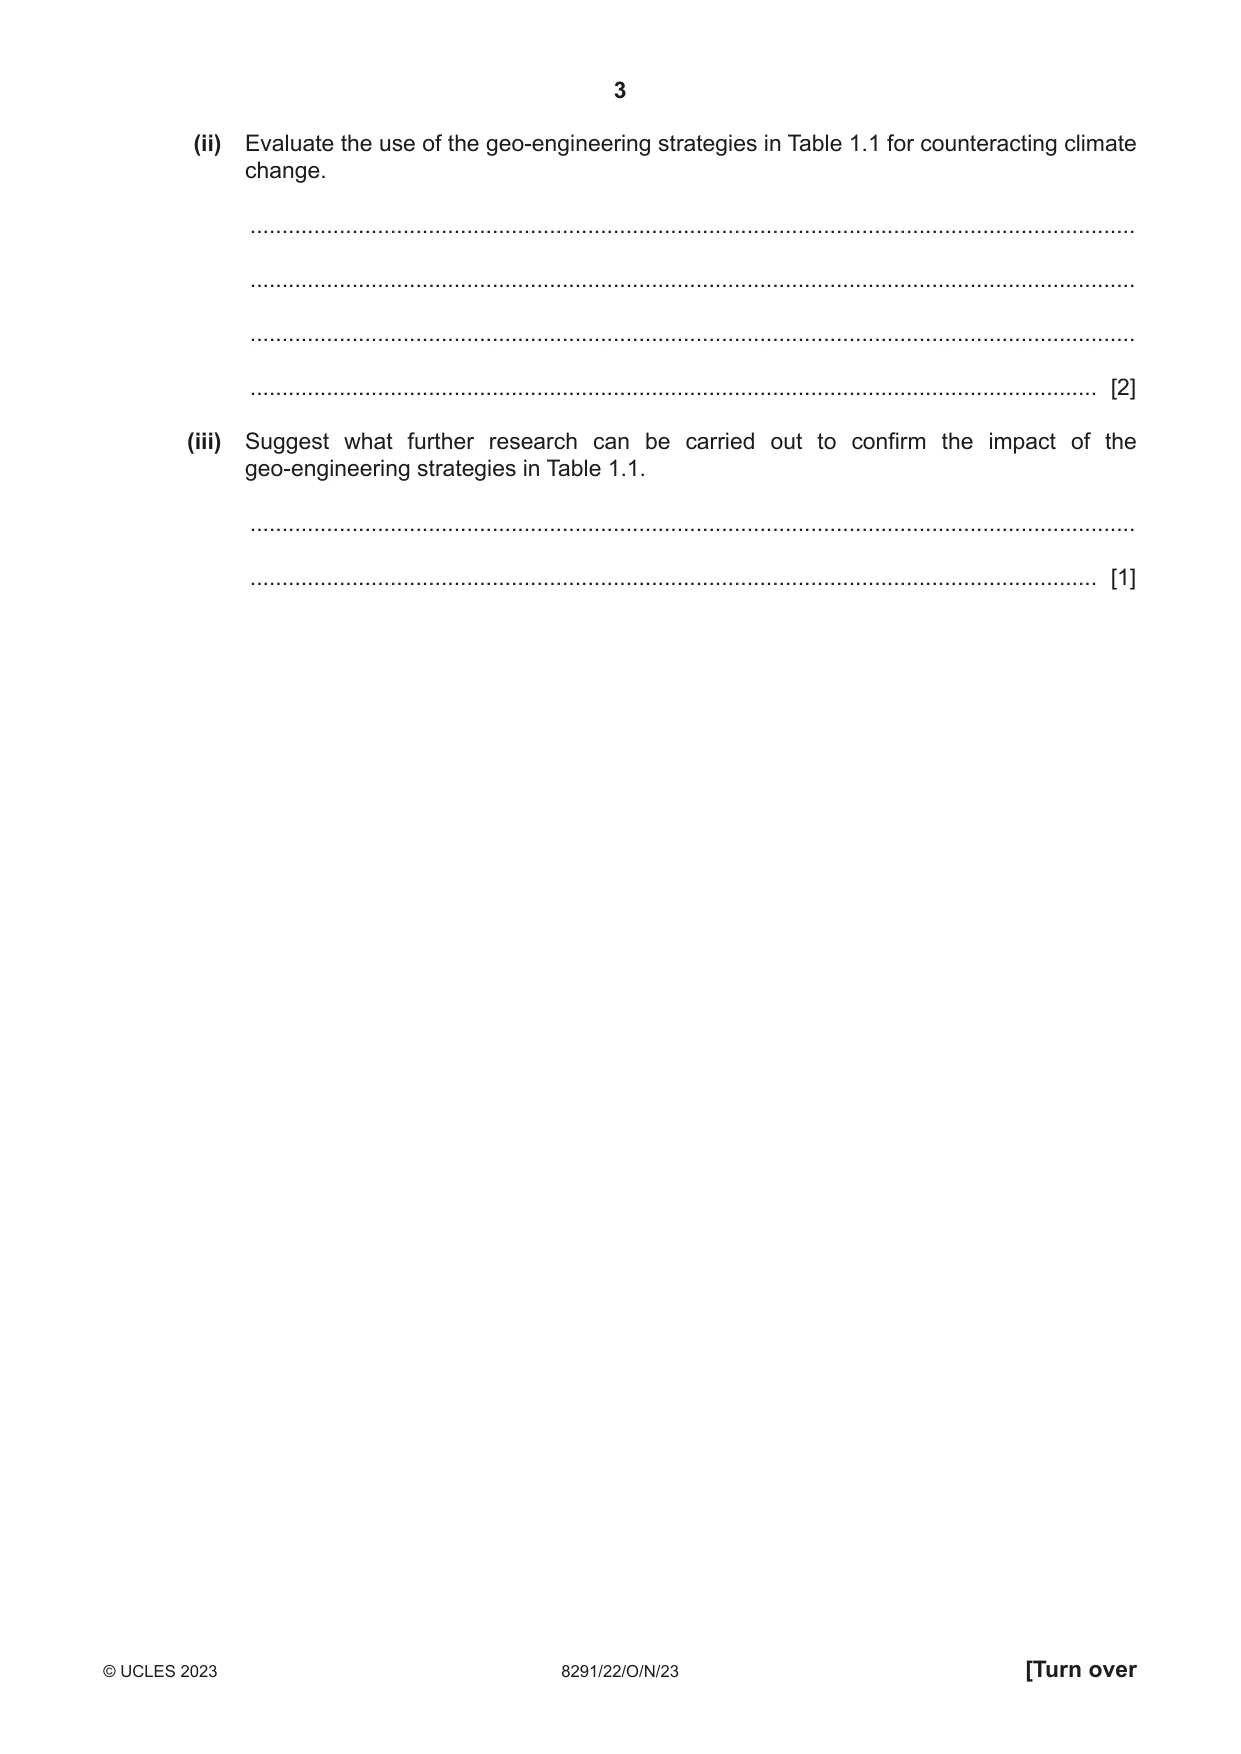
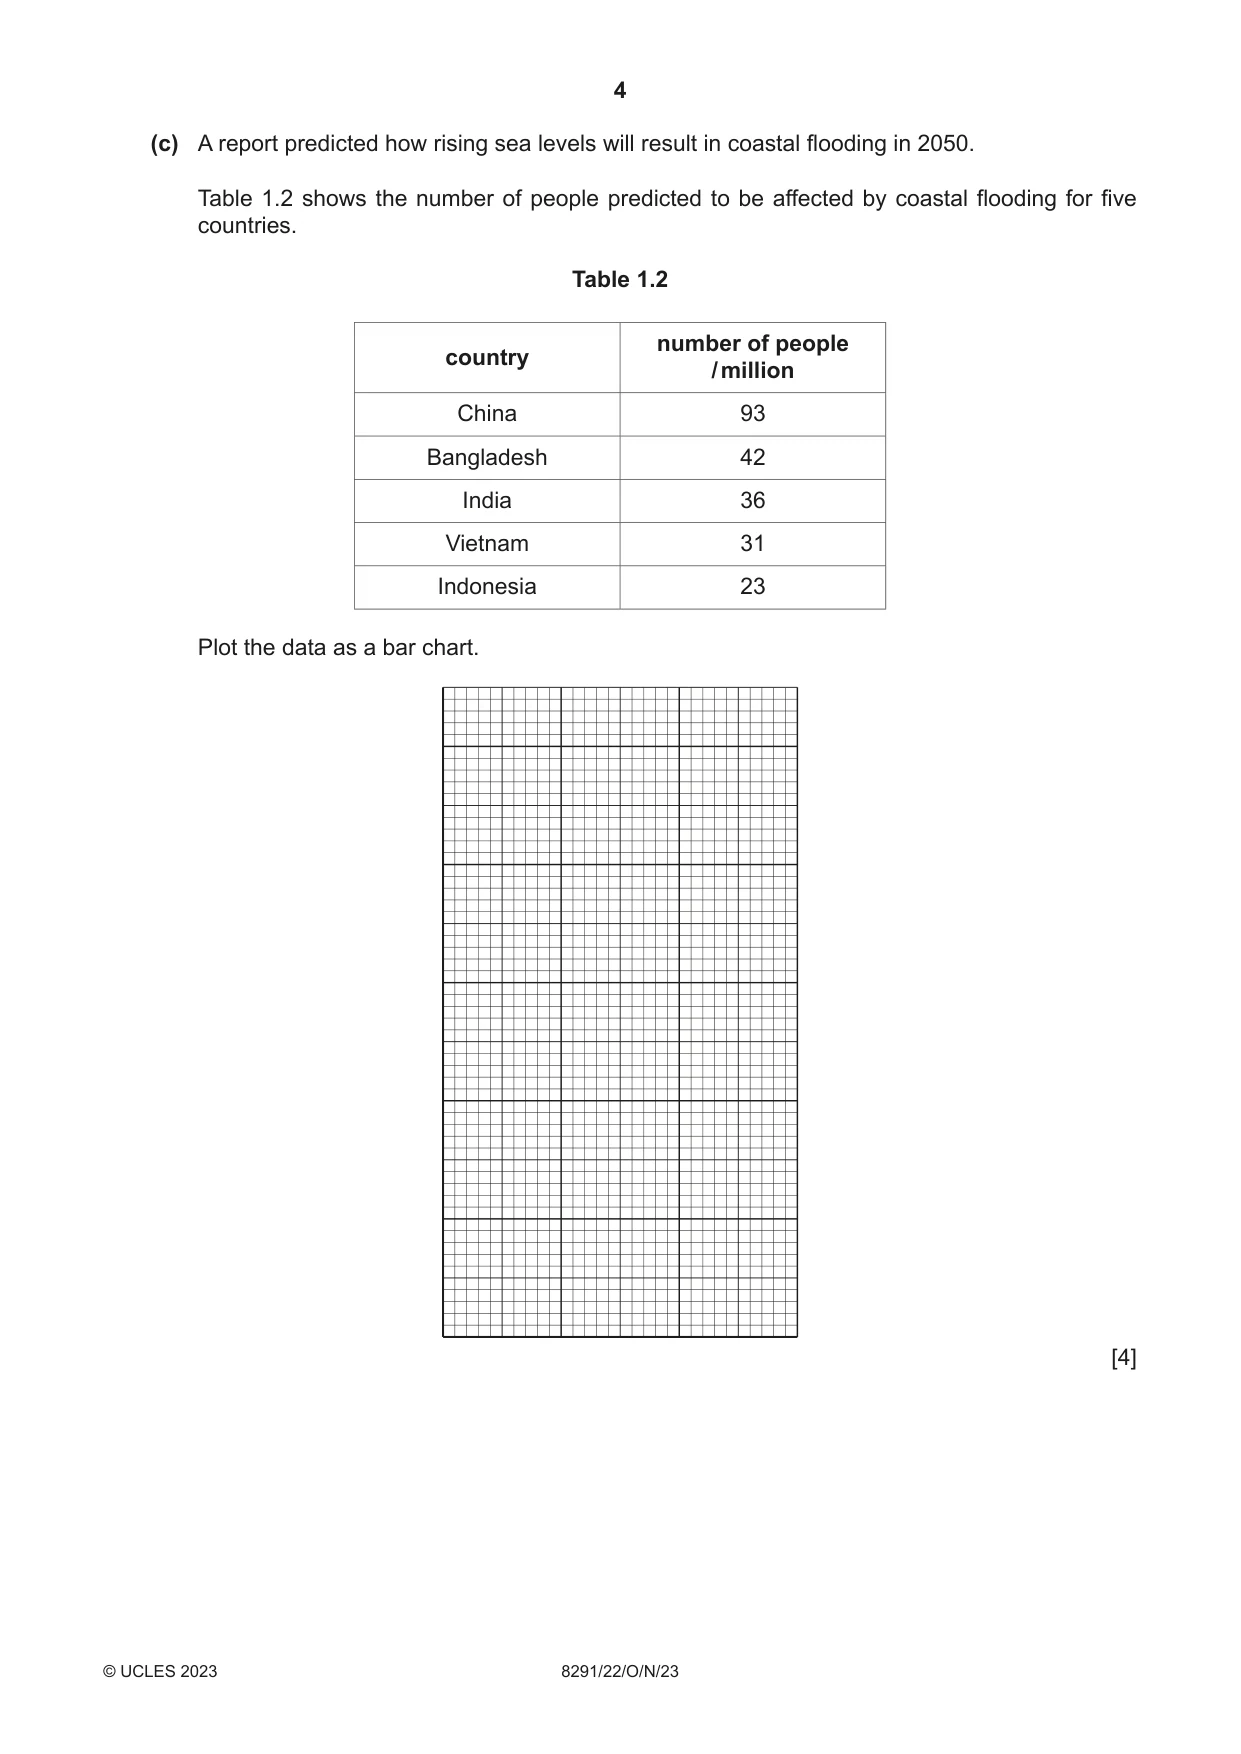
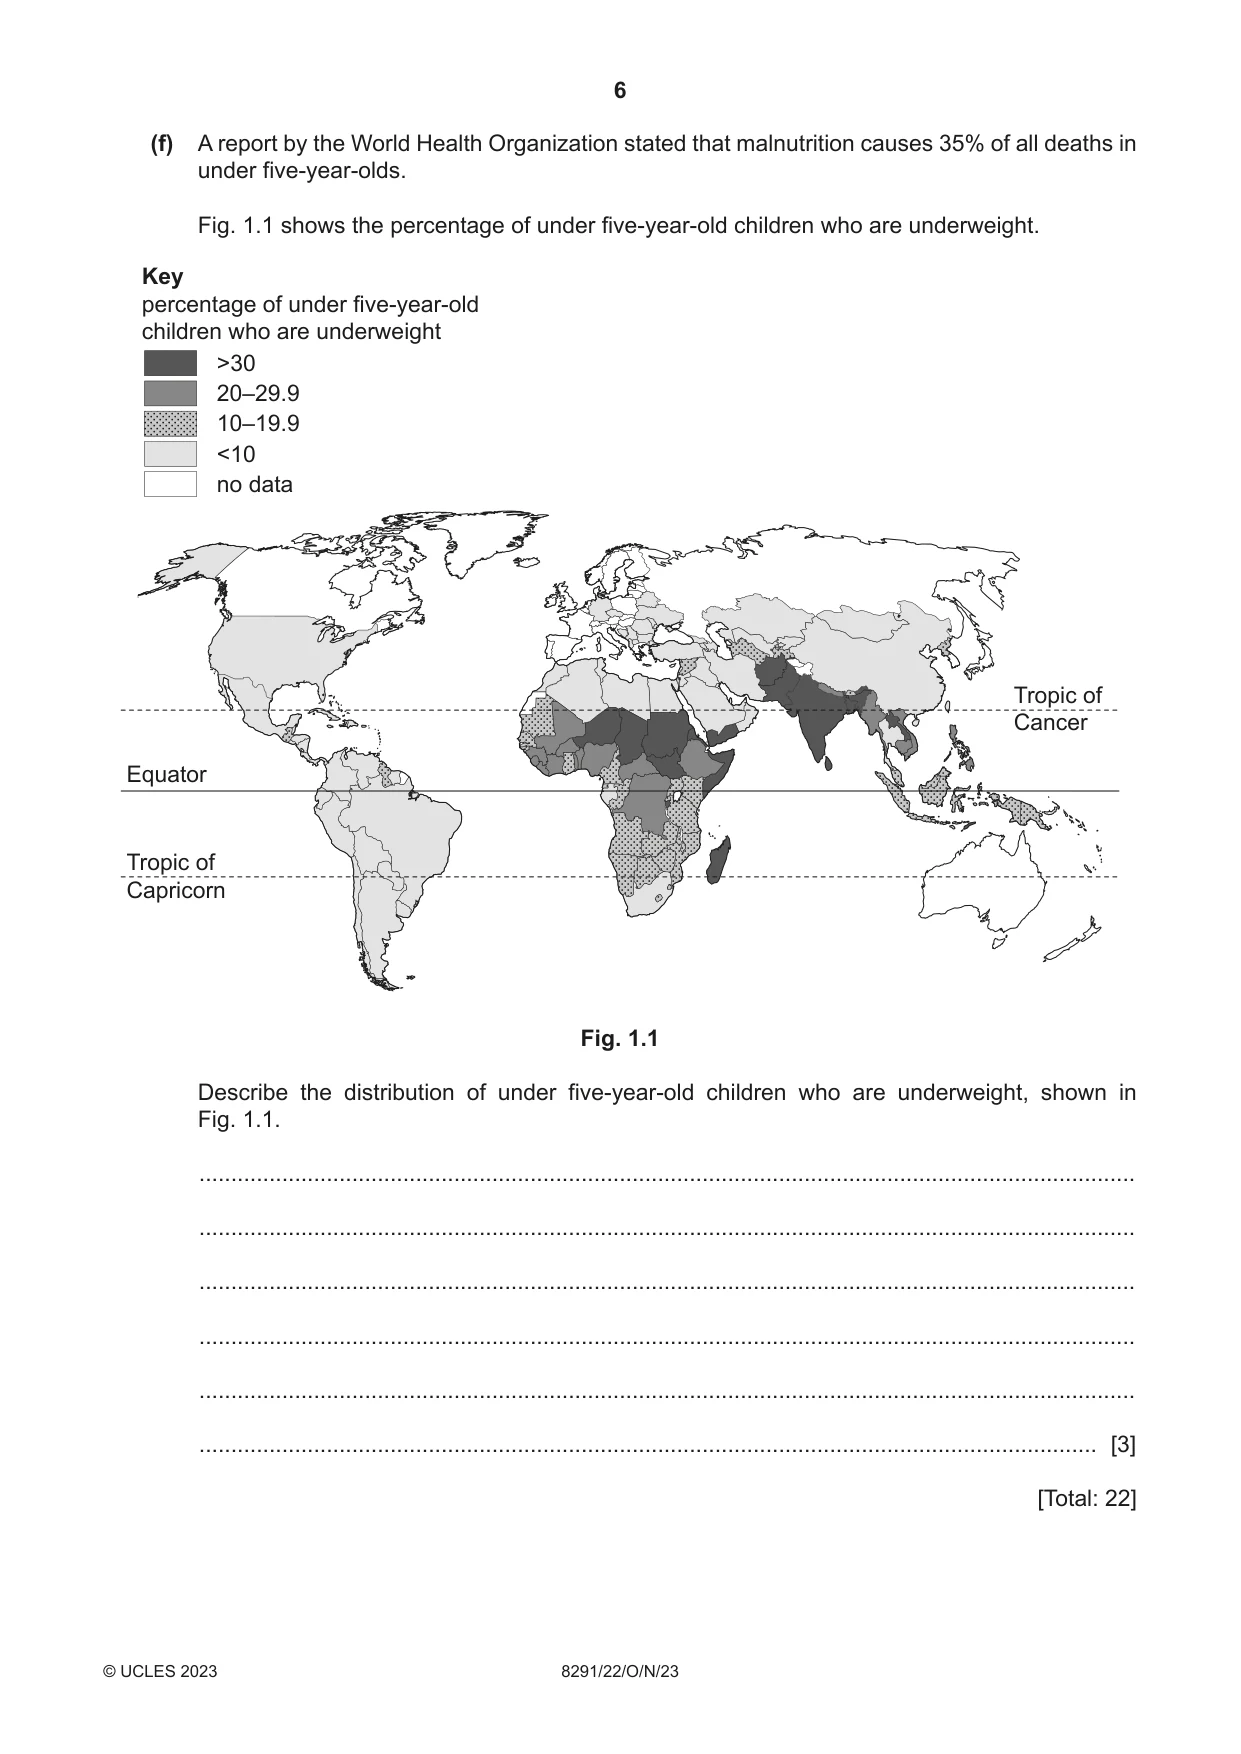
1 (a) Spraying aerosols into the stratosphere and growing crops with shiny leaves are two geo-engineering methods that can counteract climate change. (i) Explain how spraying aerosols into the stratosphere can counteract climate change. ........................................................................................................................................... ........................................................................................................................................... ........................................................................................................................................... ..................................................................................................................................... [2] (ii) Explain how growing crops with shiny leaves can counteract climate change. ........................................................................................................................................... ........................................................................................................................................... ........................................................................................................................................... ..................................................................................................................................... [2] (b) Researchers use computer models to predict the impact of geo-engineering strategies on climate change. Table 1.1 is a summary of the findings. Table 1.1 impact global increased number of people geo-engineering strategy temperature floods and adversely impacted reduced droughts / billion spraying aerosols into the yes yes 3 stratosphere growing crops with shiny yes yes 1.4 leaves (i) Suggest how managing the Earth’s climate can result in increased floods and droughts. ........................................................................................................................................... ........................................................................................................................................... ........................................................................................................................................... ..................................................................................................................................... [2] (ii) Evaluate the use of the geo-engineering strategies in Table 1.1 for counteracting climate change. ........................................................................................................................................... ........................................................................................................................................... ........................................................................................................................................... ..................................................................................................................................... [2] (iii) Suggest what further research can be carried out to confirm the impact of the geo-engineering strategies in Table 1.1. ........................................................................................................................................... ..................................................................................................................................... [1] (c) A report predicted how rising sea levels will result in coastal flooding in 2050. Table 1.2 shows the number of people predicted to be affected by coastal flooding for five countries. Table 1.2 number of people country / million China 93 Bangladesh 42 India 36 Vietnam 31 Indonesia 23 Plot the data as a bar chart. [4] (d) Explain why flooding can lead to water insecurity. ................................................................................................................................................... ................................................................................................................................................... ................................................................................................................................................... ................................................................................................................................................... ................................................................................................................................................... ............................................................................................................................................. [3] (e) Explain why drought leads to food shortages and malnutrition. ................................................................................................................................................... ................................................................................................................................................... ................................................................................................................................................... ................................................................................................................................................... ................................................................................................................................................... ............................................................................................................................................. [3] (f) A report by the World Health Organization stated that malnutrition causes 35% of all deaths in under five-year-olds. Fig. 1.1 shows the percentage of under five-year-old children who are underweight. Key percentage of under five-year-old children who are underweight >30 20–29.9 10–19.9 <10 no data Tropic of Cancer Equator Tropic of Capricorn Fig. 1.1 Describe the distribution of under five-year-old children who are underweight, shown in Fig. 1.1. ................................................................................................................................................... ................................................................................................................................................... ................................................................................................................................................... ................................................................................................................................................... ................................................................................................................................................... ............................................................................................................................................. [3] [Total: 22]
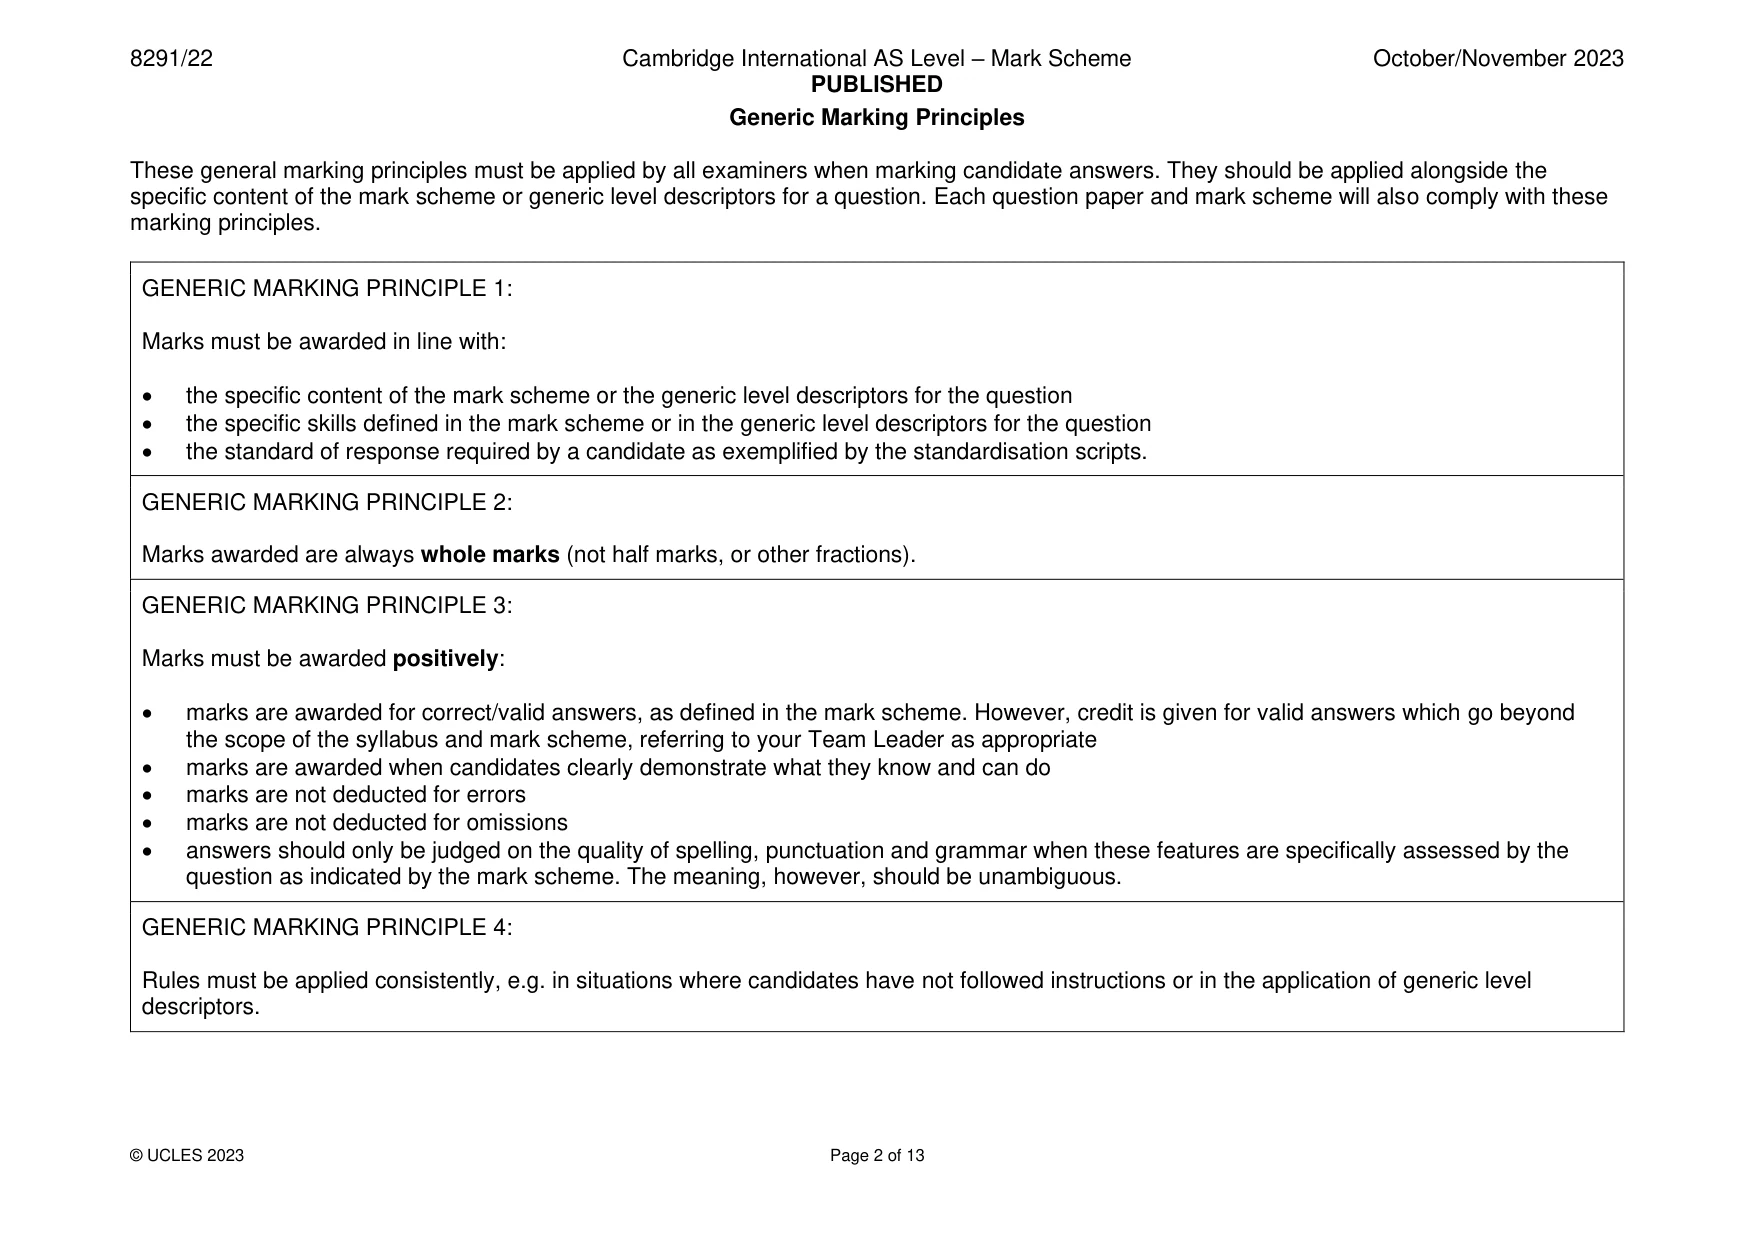
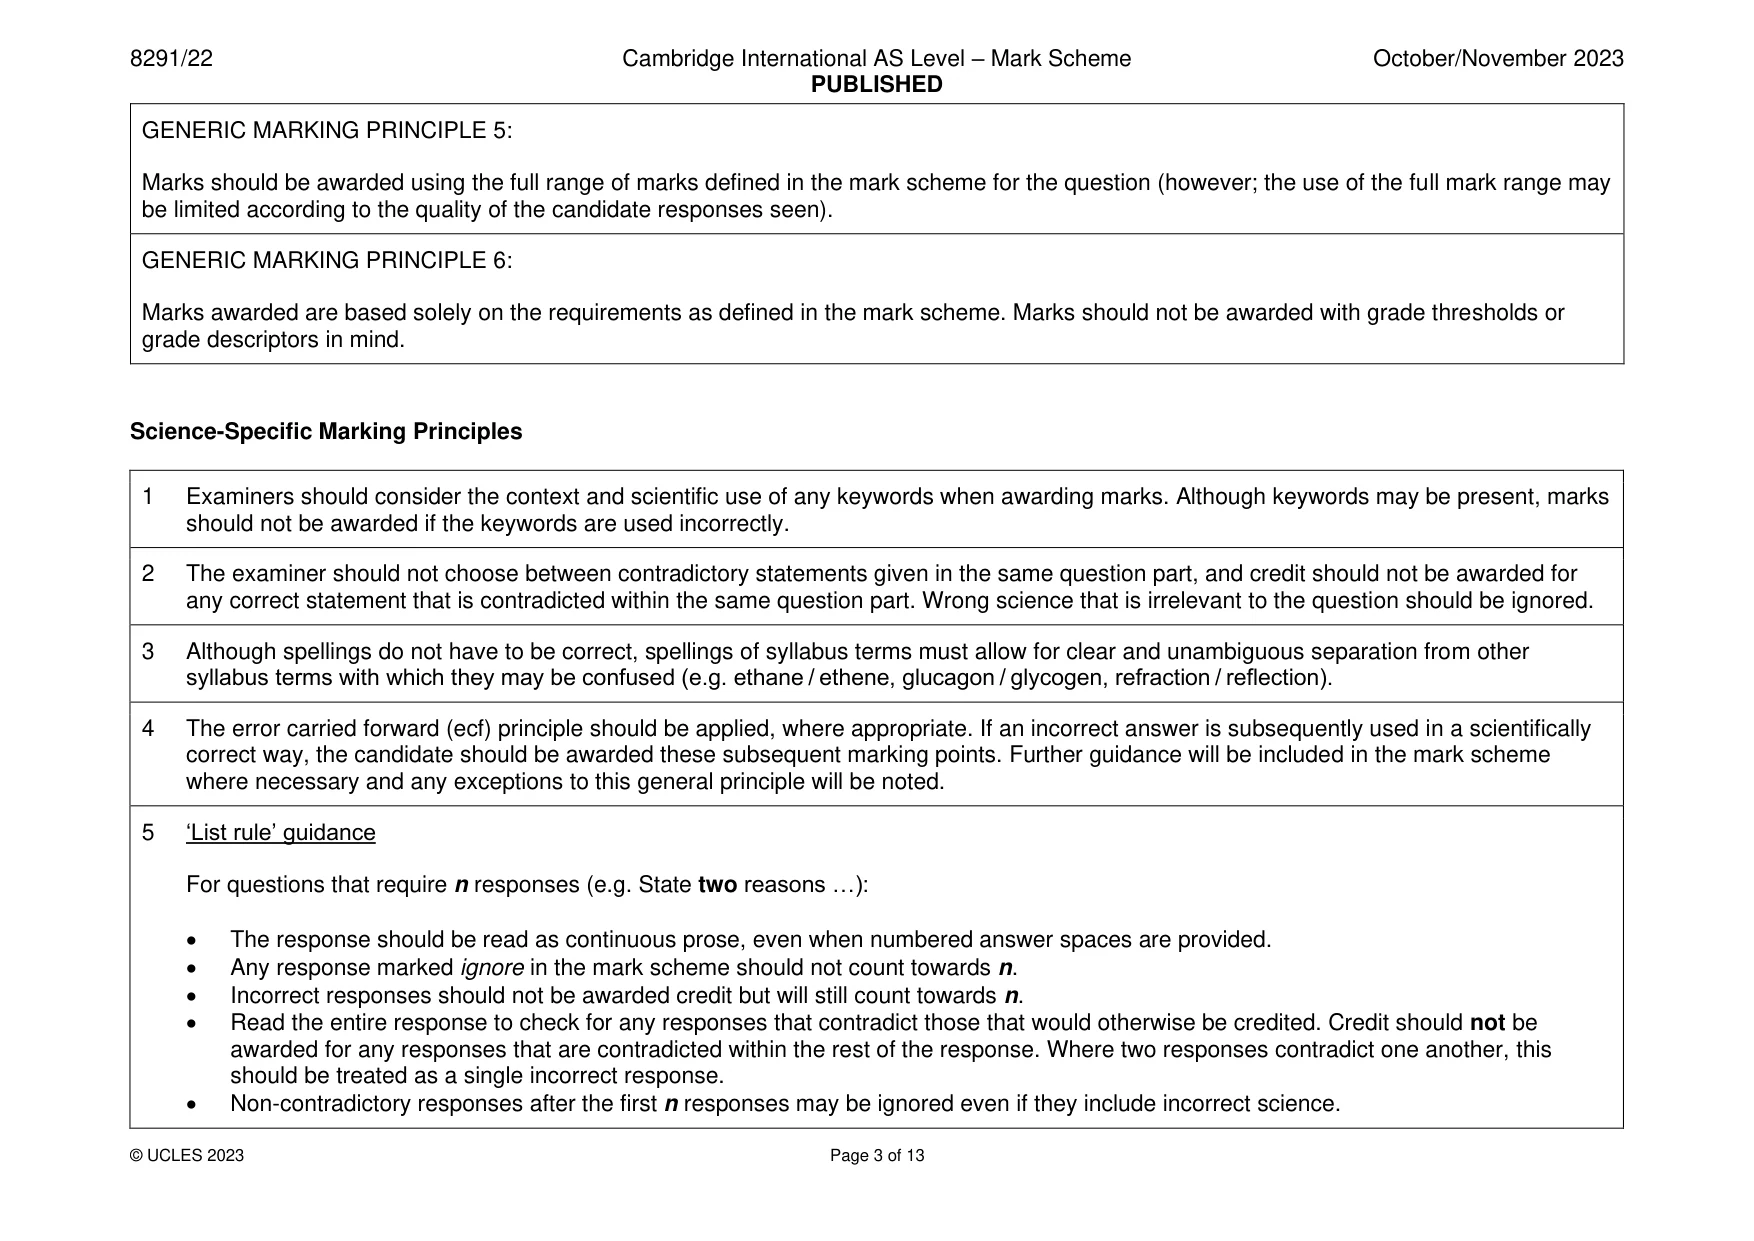
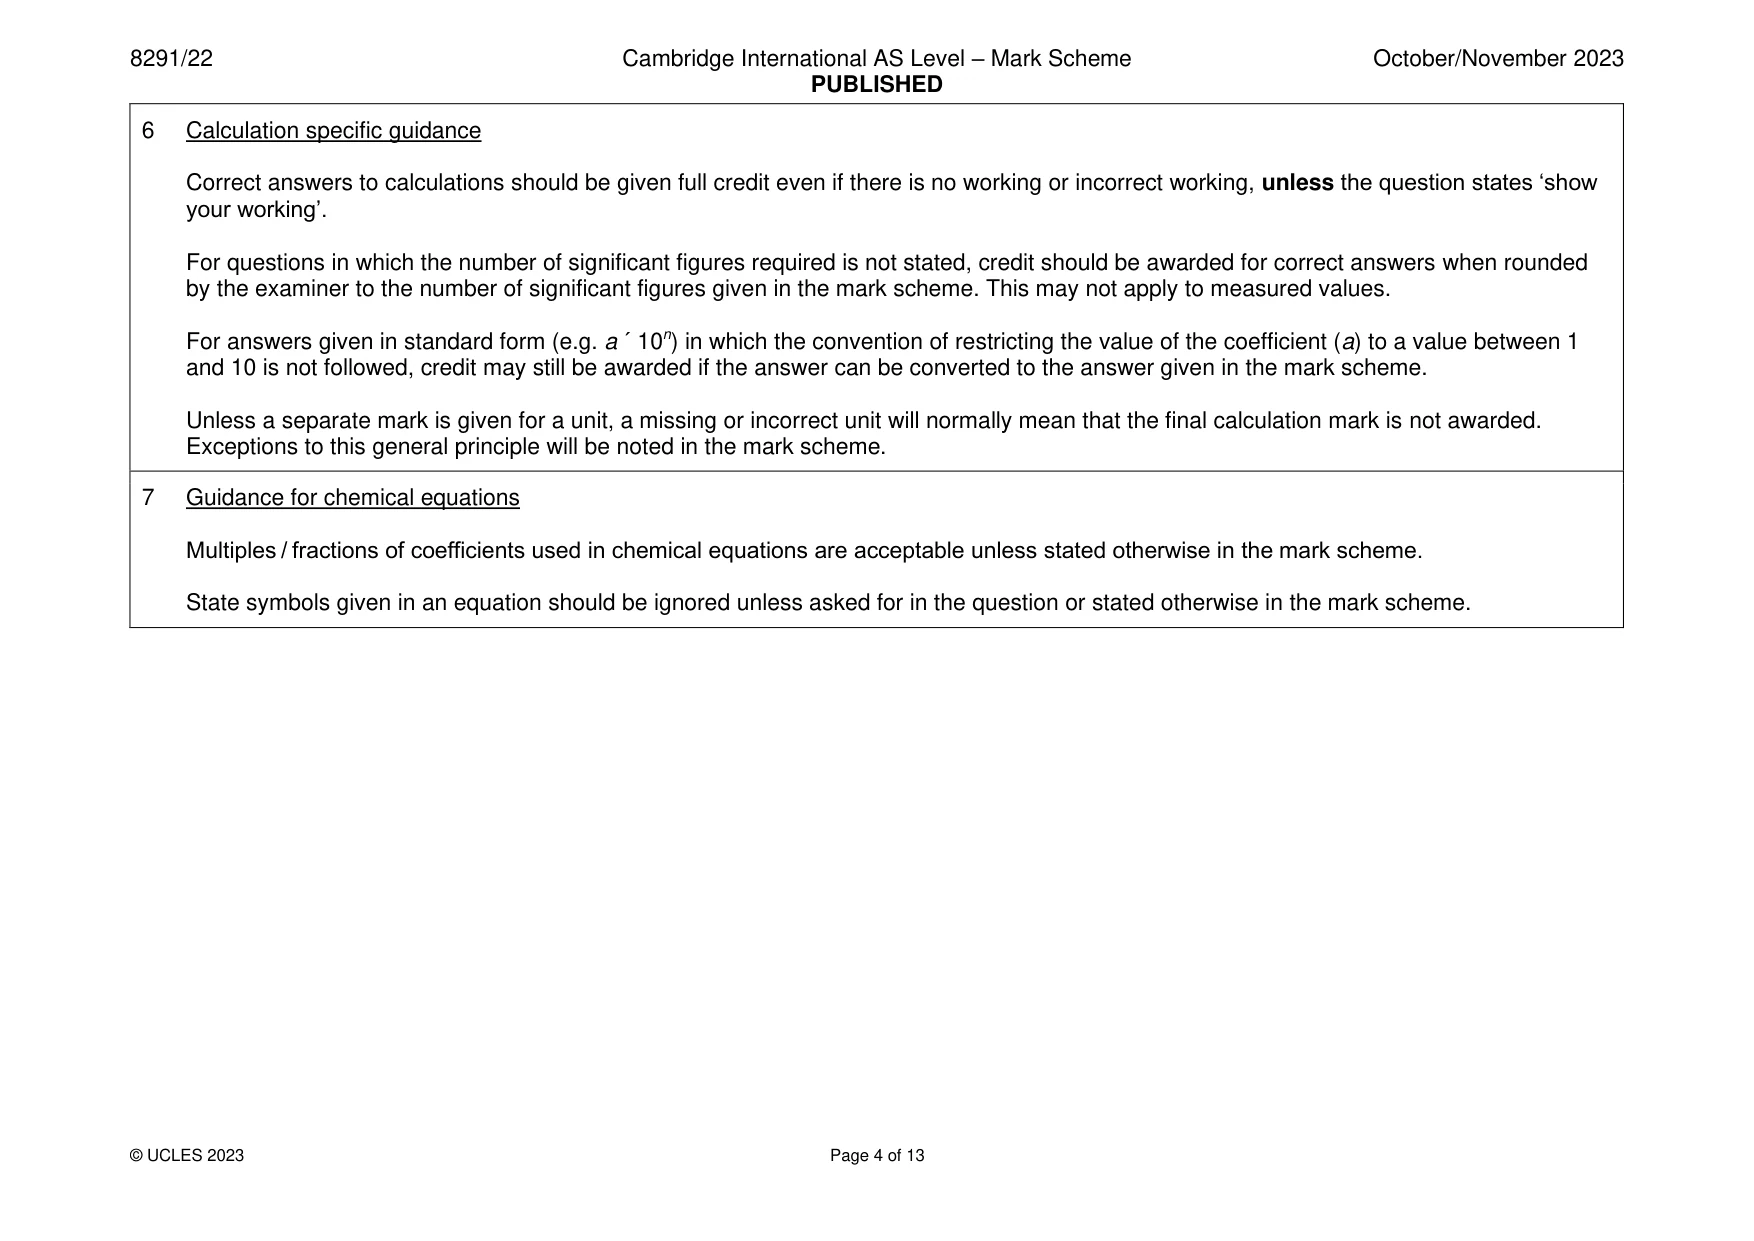
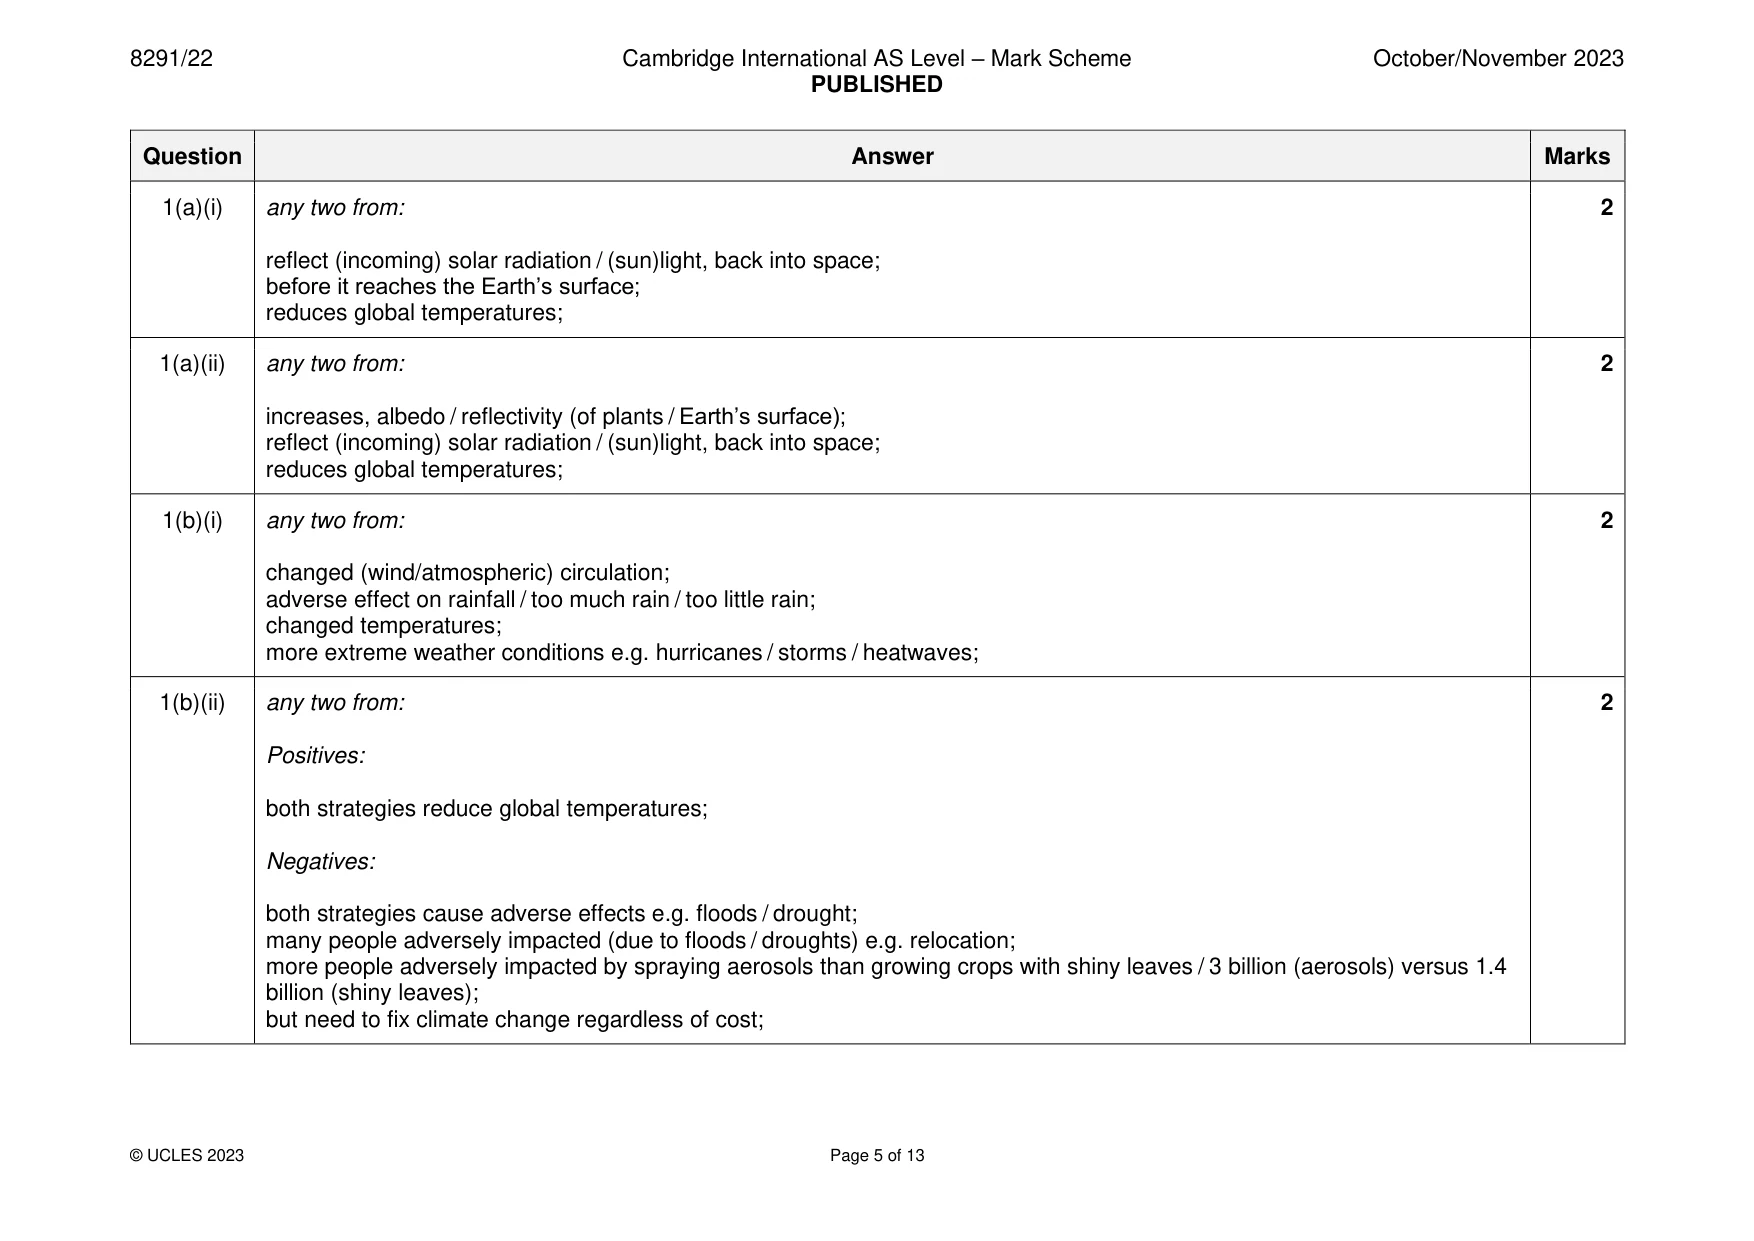
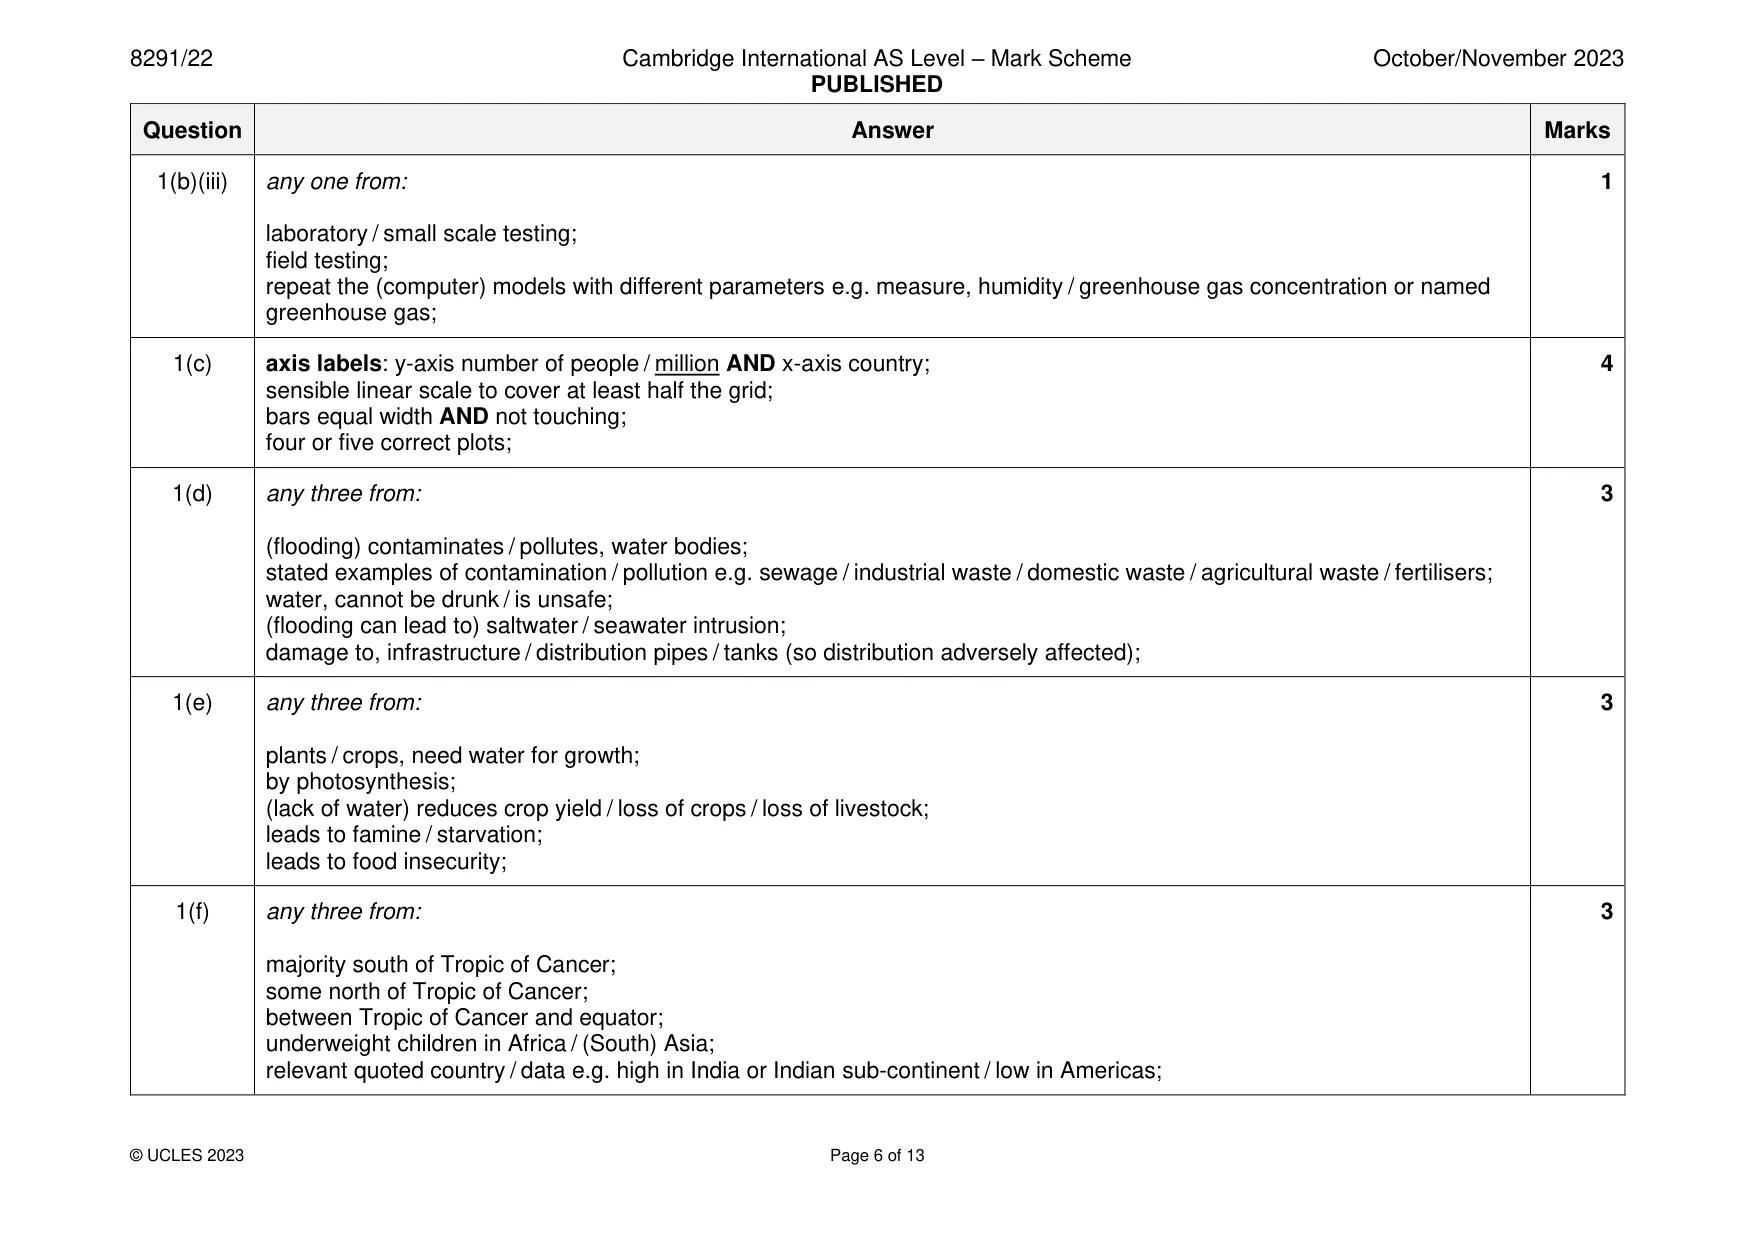
Mark scheme: Question Answer Marks 1(a)(i) any two from: 2 reflect (incoming) solar radiation / (sun)light, back into space; before it reaches the Earth’s surface; reduces global temperatures; 1(a)(ii) any two from: 2 increases, albedo / reflectivity (of plants / Earth’s surface); reflect (incoming) solar radiation / (sun)light, back into space; reduces global temperatures; 1(b)(i) any two from: 2 changed (wind/atmospheric) circulation; adverse effect on rainfall / too much rain / too little rain; changed temperatures; more extreme weather conditions e.g. hurricanes / storms / heatwaves; 1(b)(ii) any two from: 2 Positives: both strategies reduce global temperatures; Negatives: both strategies cause adverse effects e.g. floods / drought; many people adversely impacted (due to floods / droughts) e.g. relocation; more people adversely impacted by spraying aerosols than growing crops with shiny leaves / 3 billion (aerosols) versus 1.4 billion (shiny leaves); but need to fix climate change regardless of cost; 1(b)(iii) any one from: 1 laboratory / small scale testing; field testing; repeat the (computer) models with different parameters e.g. measure, humidity / greenhouse gas concentration or named greenhouse gas; 1(c) axis labels: y-axis number of people / million AND x-axis country; 4 sensible linear scale to cover at least half the grid; bars equal width AND not touching; four or five correct plots; 1(d) any three from: 3 (flooding) contaminates / pollutes, water bodies; stated examples of contamination / pollution e.g. sewage / industrial waste / domestic waste / agricultural waste / fertilisers; water, cannot be drunk / is unsafe; (flooding can lead to) saltwater / seawater intrusion; damage to, infrastructure / distribution pipes / tanks (so distribution adversely affected); 1(e) any three from: 3 plants / crops, need water for growth; by photosynthesis; (lack of water) reduces crop yield / loss of crops / loss of livestock; leads to famine / starvation; leads to food insecurity; 1(f) any three from: 3 majority south of Tropic of Cancer; some north of Tropic of Cancer; between Tropic of Cancer and equator; underweight children in Africa / (South) Asia; relevant quoted country / data e.g. high in India or Indian sub-continent / low in Americas;
Q2 · A student investigates the concentration of sulfate ions in a lake
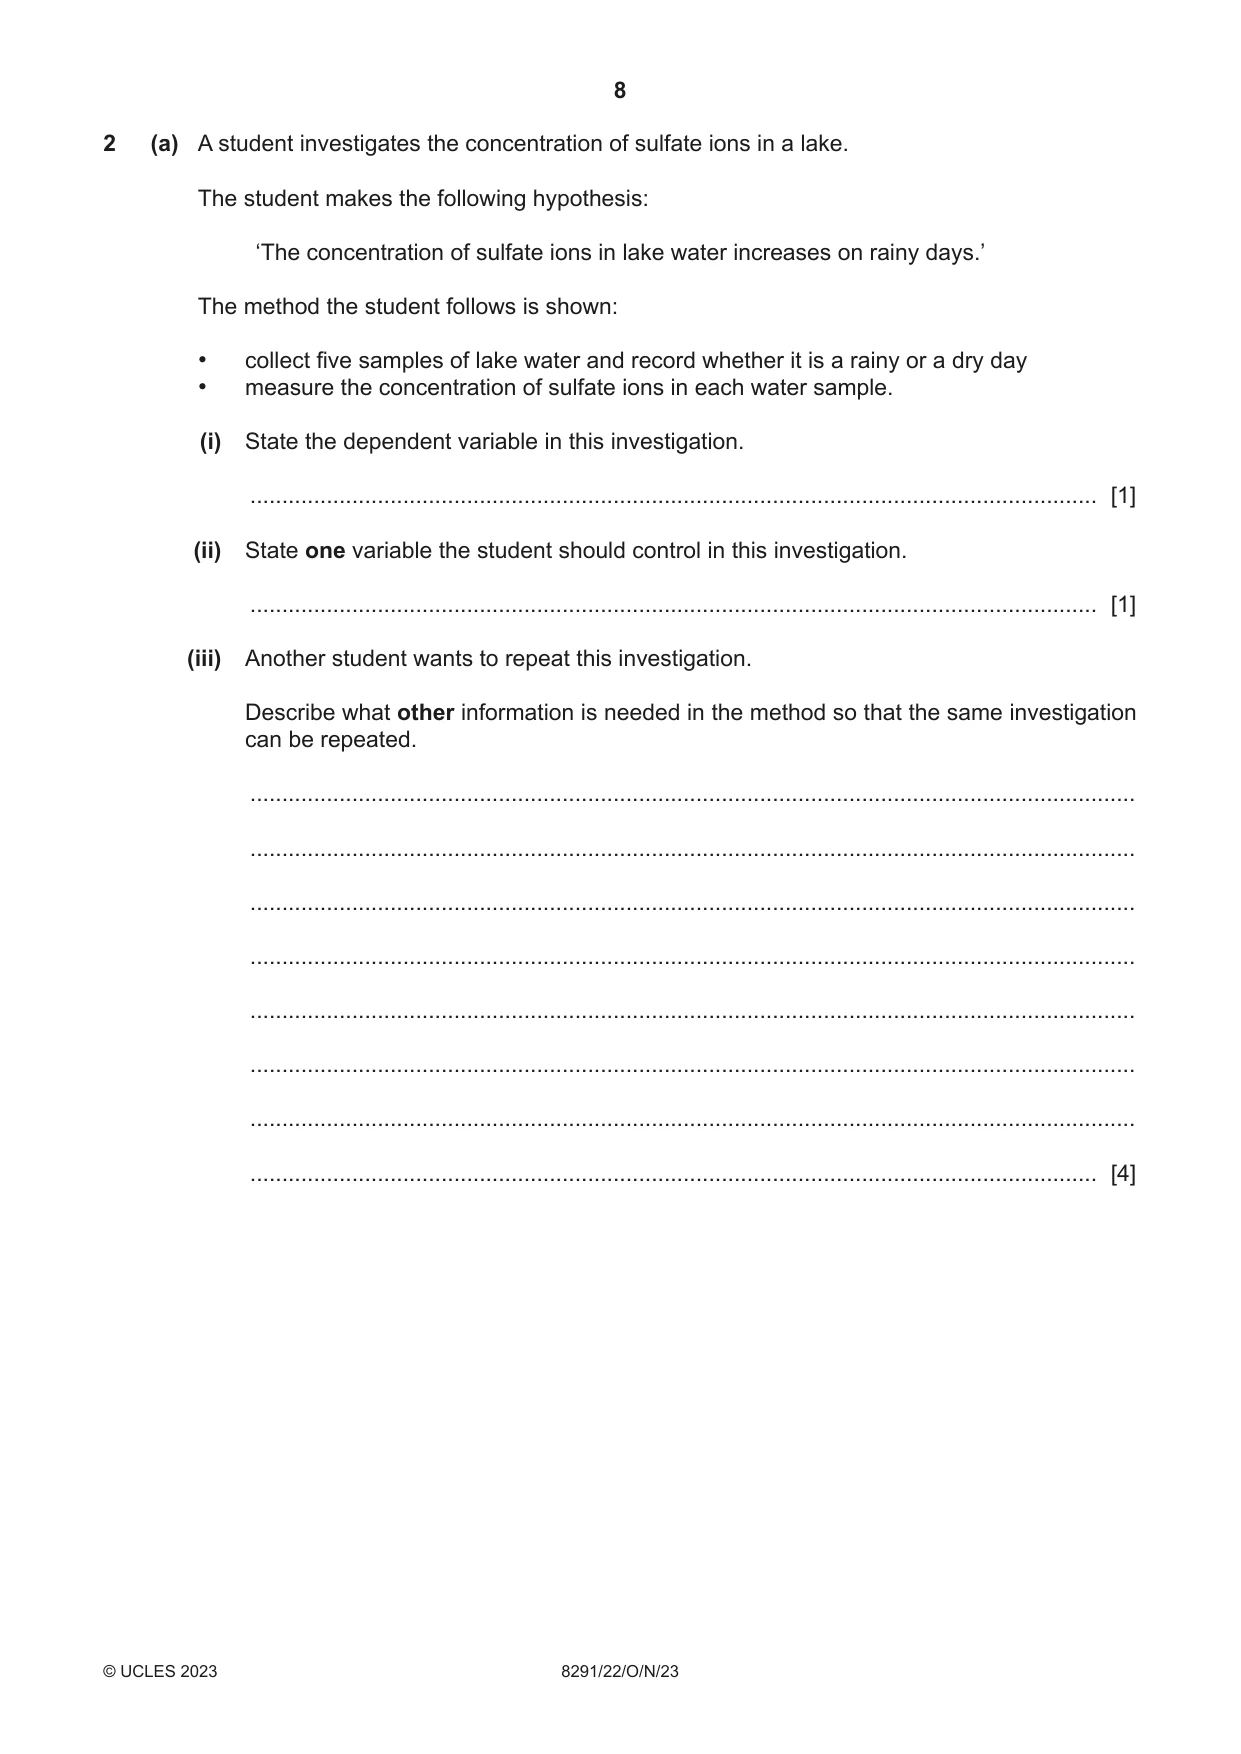
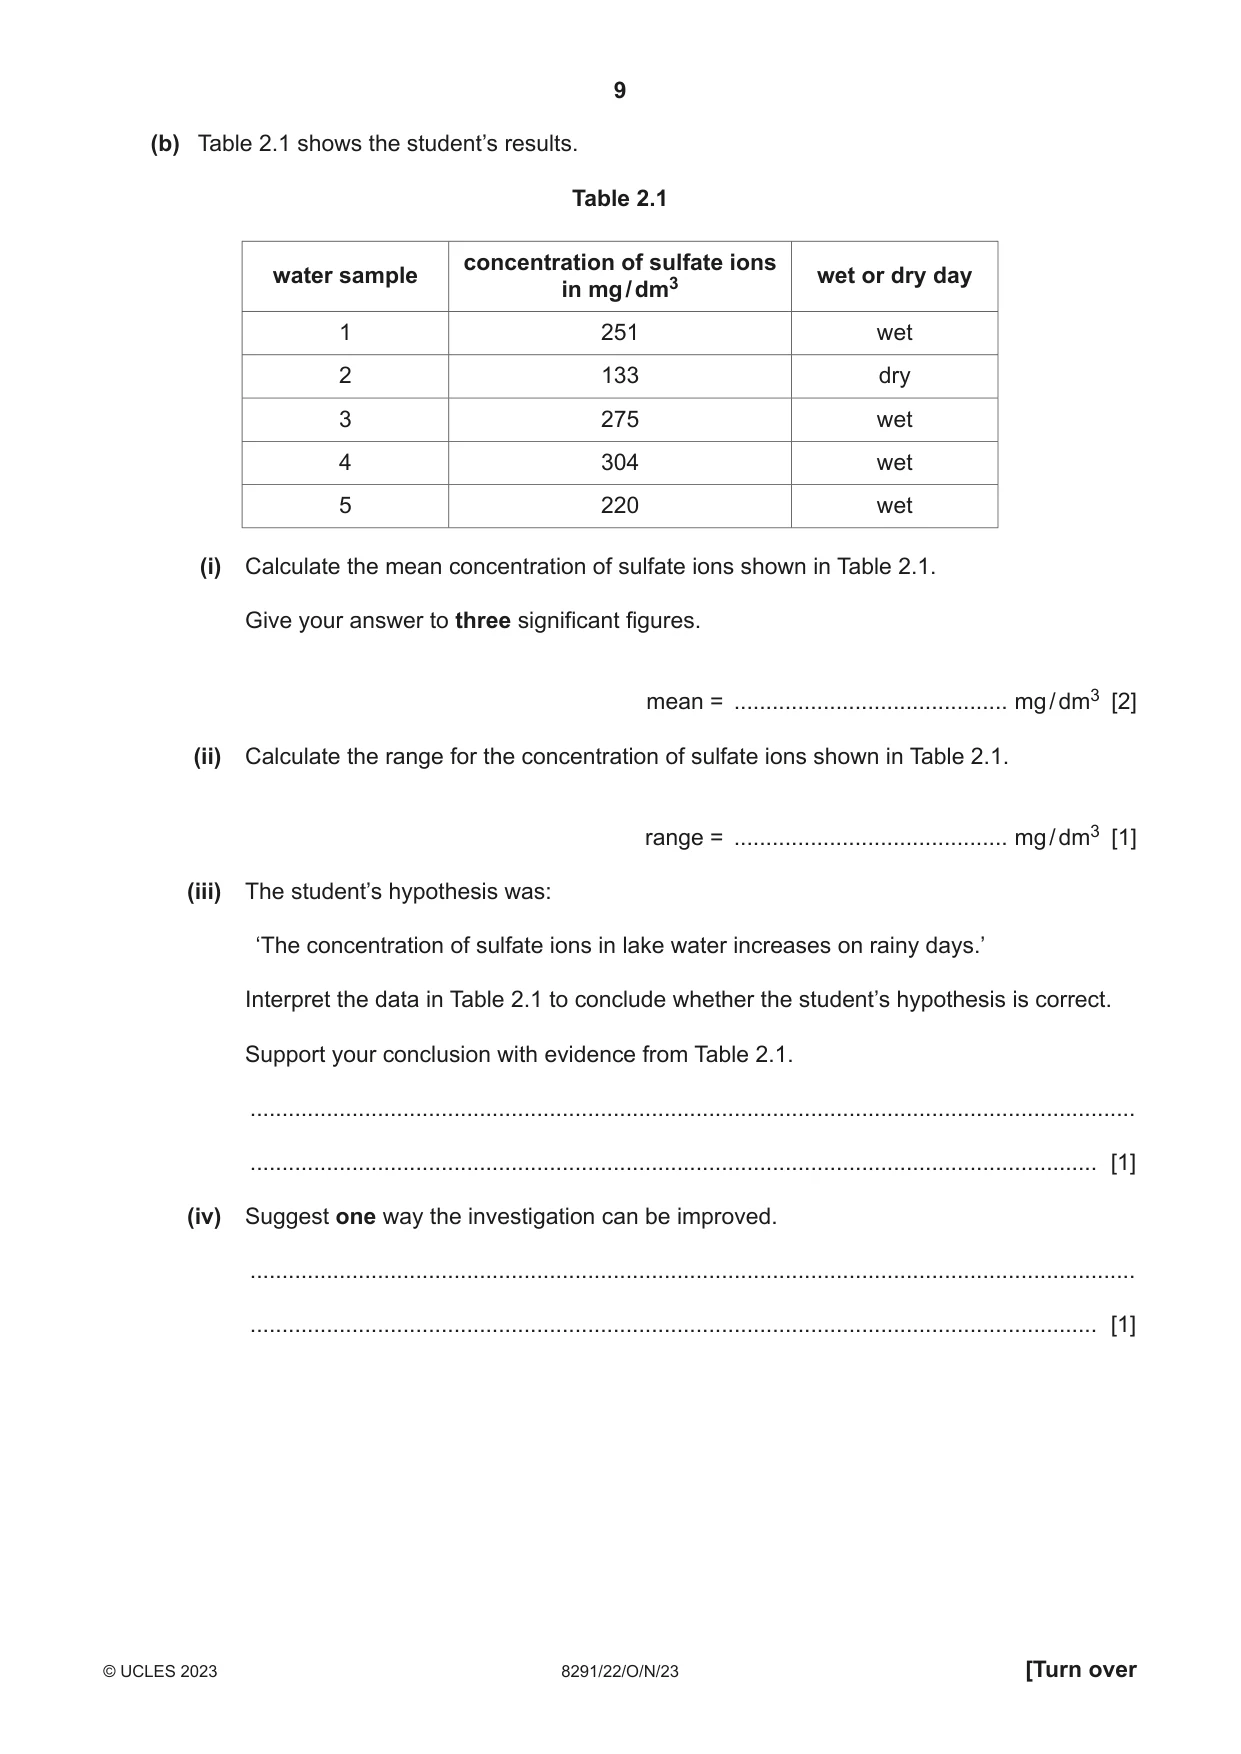
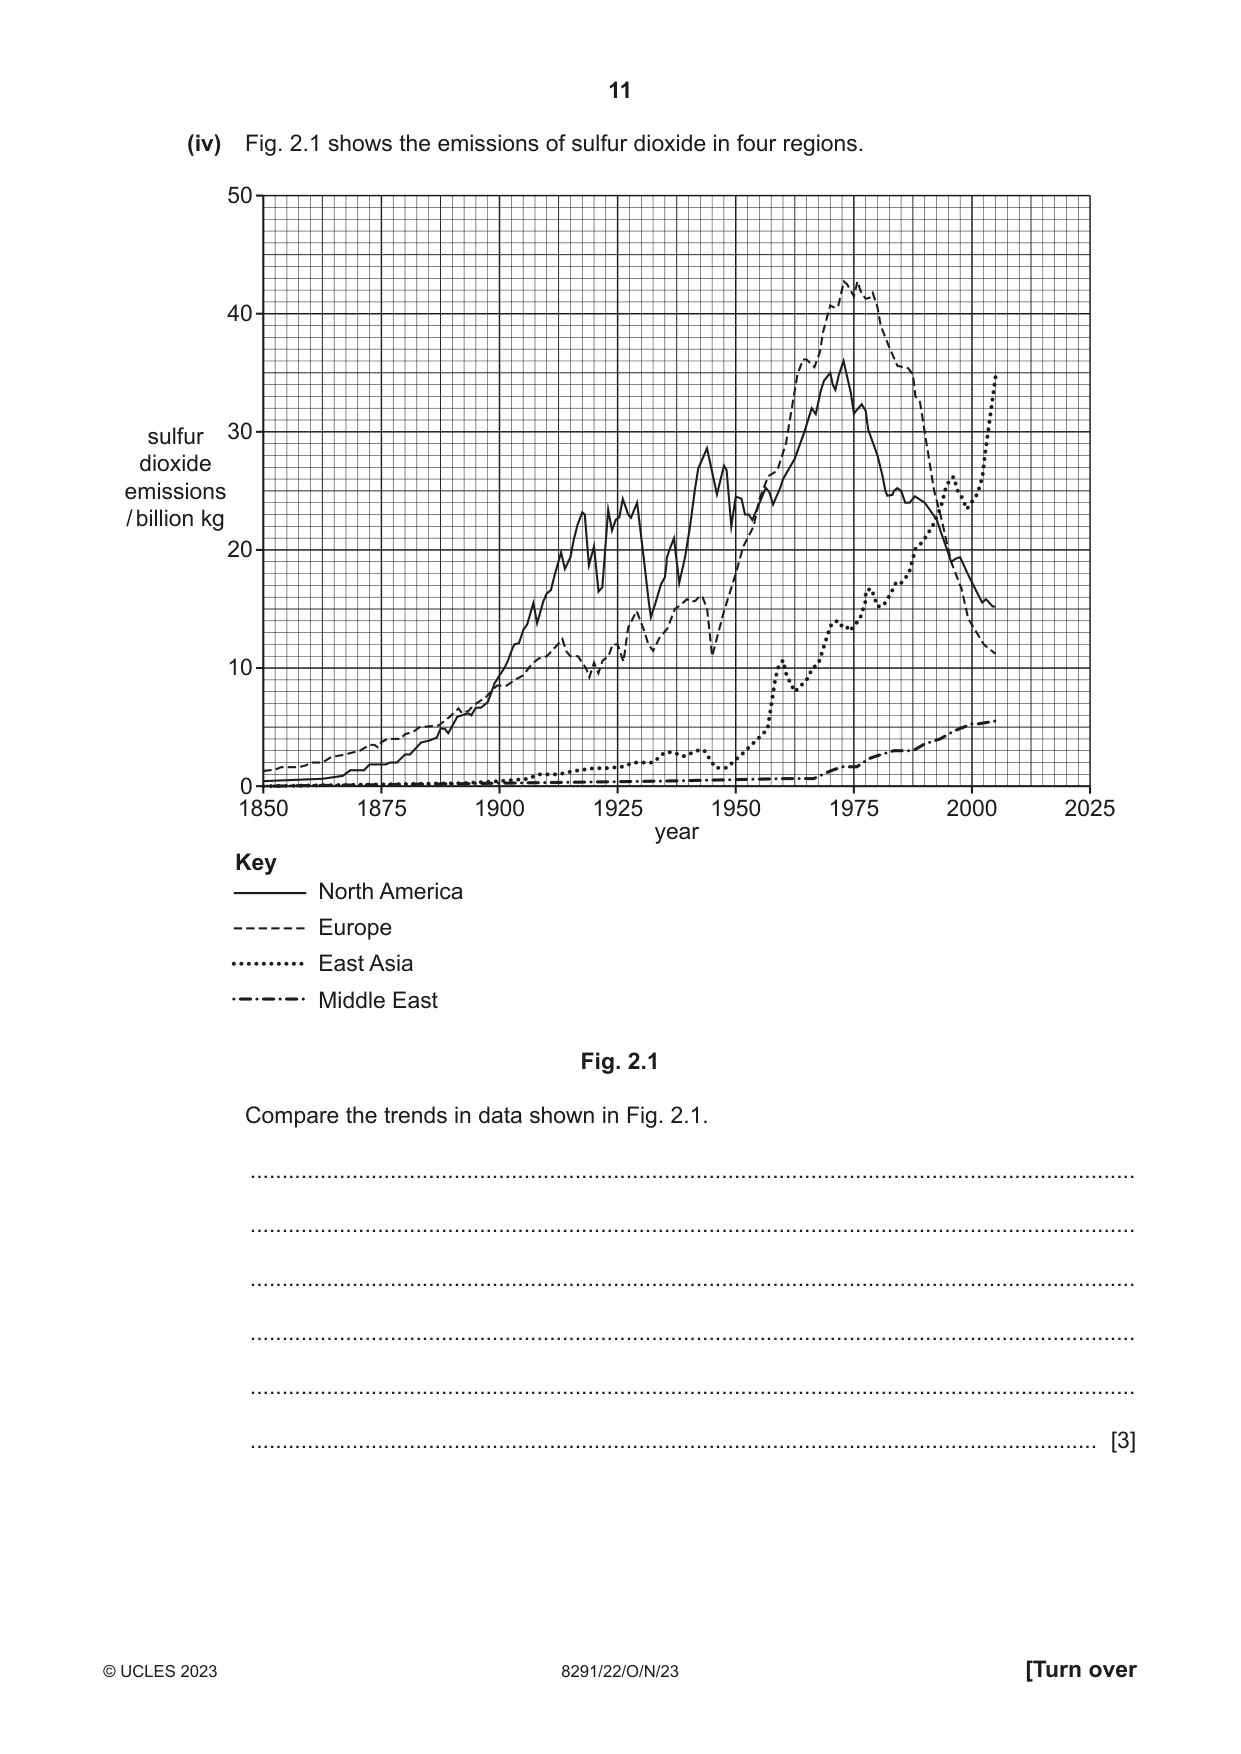
2 (a) A student investigates the concentration of sulfate ions in a lake. The student makes the following hypothesis: ‘The concentration of sulfate ions in lake water increases on rainy days.’ The method the student follows is shown: • collect five samples of lake water and record whether it is a rainy or a dry day • measure the concentration of sulfate ions in each water sample. (i) State the dependent variable in this investigation. ..................................................................................................................................... [1] (ii) State one variable the student should control in this investigation. ..................................................................................................................................... [1] (iii) Another student wants to repeat this investigation. Describe what other information is needed in the method so that the same investigation can be repeated. ........................................................................................................................................... ........................................................................................................................................... ........................................................................................................................................... ........................................................................................................................................... ........................................................................................................................................... ........................................................................................................................................... ........................................................................................................................................... ..................................................................................................................................... [4] (b) Table 2.1 shows the student’s results. Table 2.1 concentration of sulfate ions water sample wet or dry day in mg / dm3 1 251 wet 2 133 dry 3 275 wet 4 304 wet 5 220 wet (i) Calculate the mean concentration of sulfate ions shown in Table 2.1. Give your answer to three significant figures. mean = ........................................... mg / dm3 [2] (ii) Calculate the range for the concentration of sulfate ions shown in Table 2.1. range = ........................................... mg / dm3 [1] (iii) The student’s hypothesis was: ‘The concentration of sulfate ions in lake water increases on rainy days.’ Interpret the data in Table 2.1 to conclude whether the student’s hypothesis is correct. Support your conclusion with evidence from Table 2.1. ........................................................................................................................................... ..................................................................................................................................... [1] (iv) Suggest one way the investigation can be improved. ........................................................................................................................................... ..................................................................................................................................... [1] (c) One source of sulfate ions in water is acid deposition. (i) State the maximum pH for wet deposition to be classed as acidic. pH = ......................................................... [1] (ii) Outline the formation of acid deposition from sulfur dioxide. ........................................................................................................................................... ........................................................................................................................................... ........................................................................................................................................... ........................................................................................................................................... ........................................................................................................................................... ..................................................................................................................................... [3] (iii) State two impacts of acid deposition on crops. 1 ........................................................................................................................................ 2 ........................................................................................................................................ [2] (iv) Fig. 2.1 shows the emissions of sulfur dioxide in four regions. 50 40 sulfur 30 dioxide emissions / billion kg 20 10 0 1850 1875 1900 1925 1950 1975 2000 2025 year Key North America Europe East Asia Middle East Fig. 2.1 Compare the trends in data shown in Fig. 2.1. ........................................................................................................................................... ........................................................................................................................................... ........................................................................................................................................... ........................................................................................................................................... ........................................................................................................................................... ..................................................................................................................................... [3] (v) Suggest why legislation at a local level is not enough to reduce emissions of sulfur dioxide. ........................................................................................................................................... ........................................................................................................................................... ........................................................................................................................................... ..................................................................................................................................... [2] [Total: 22]
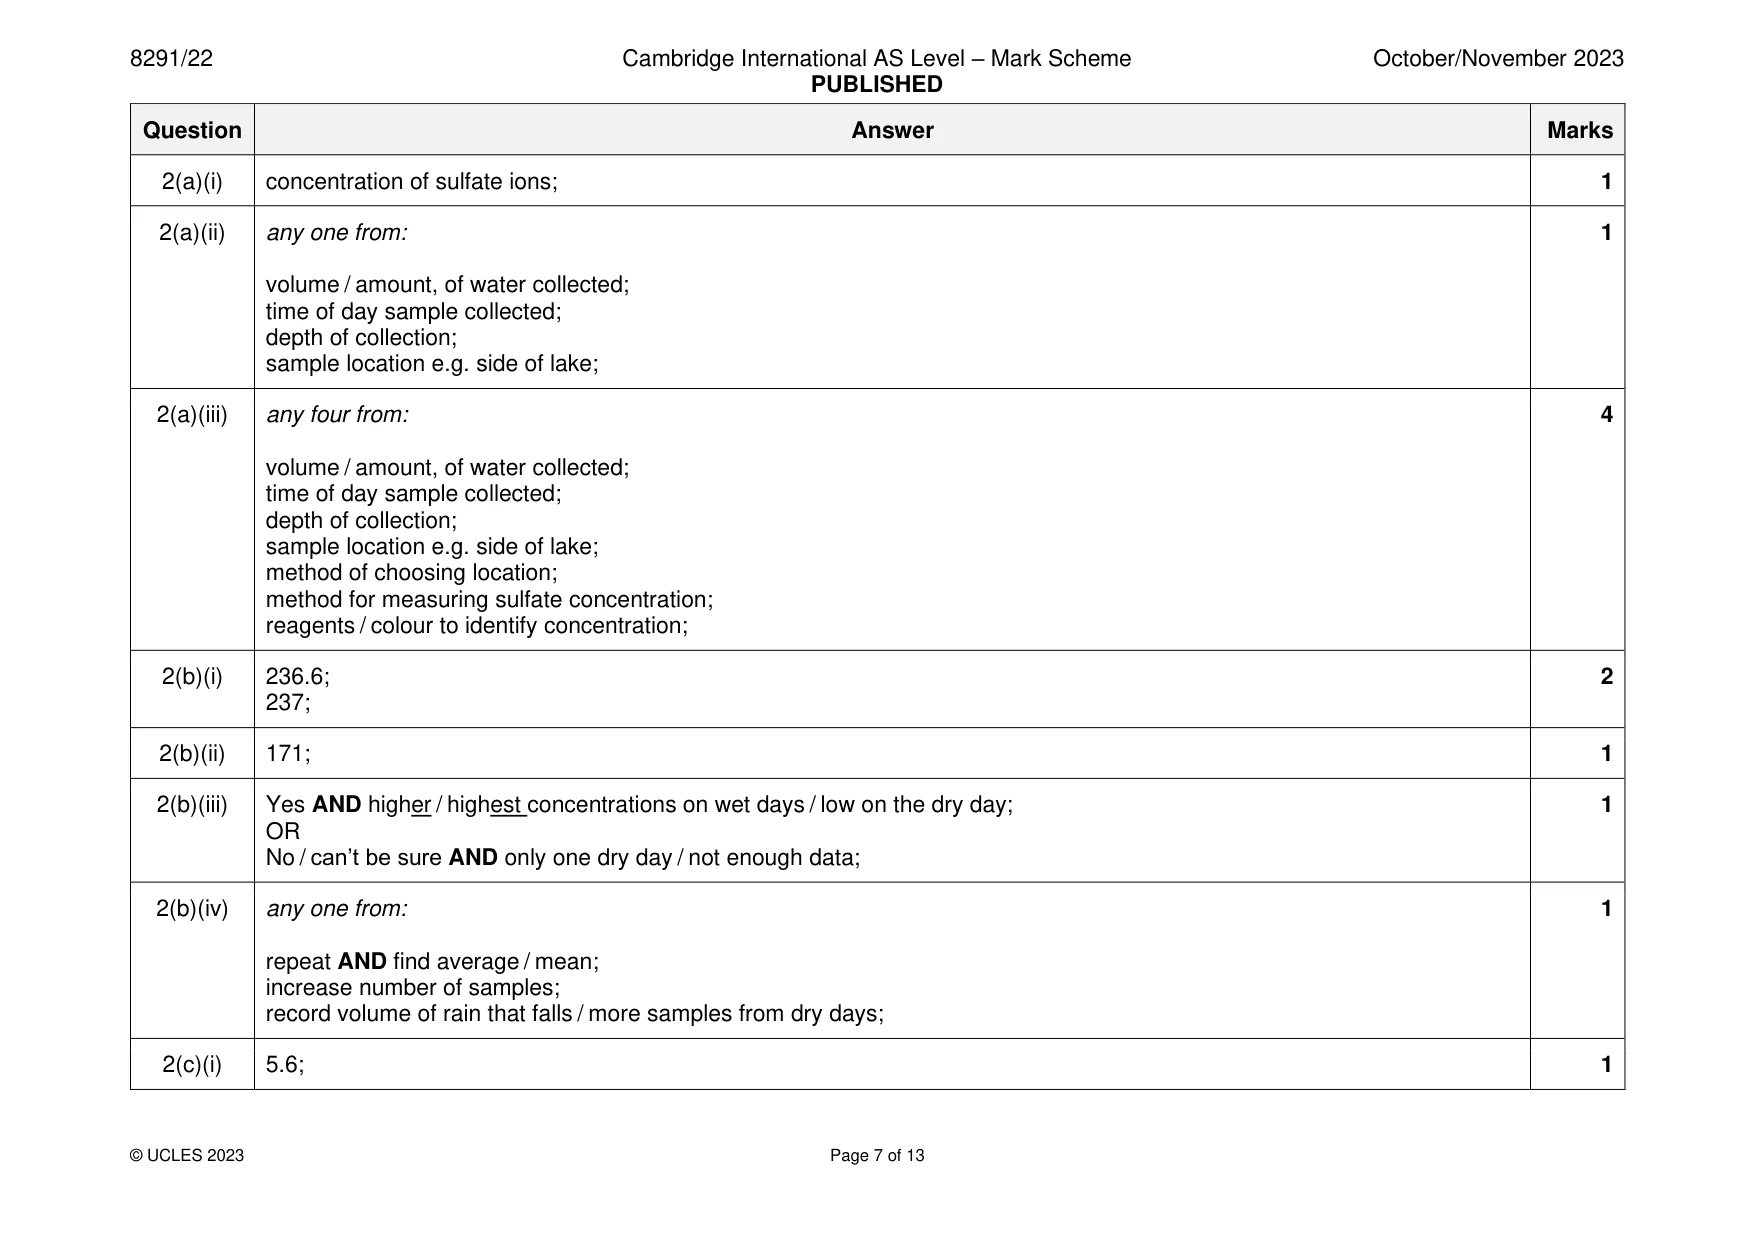
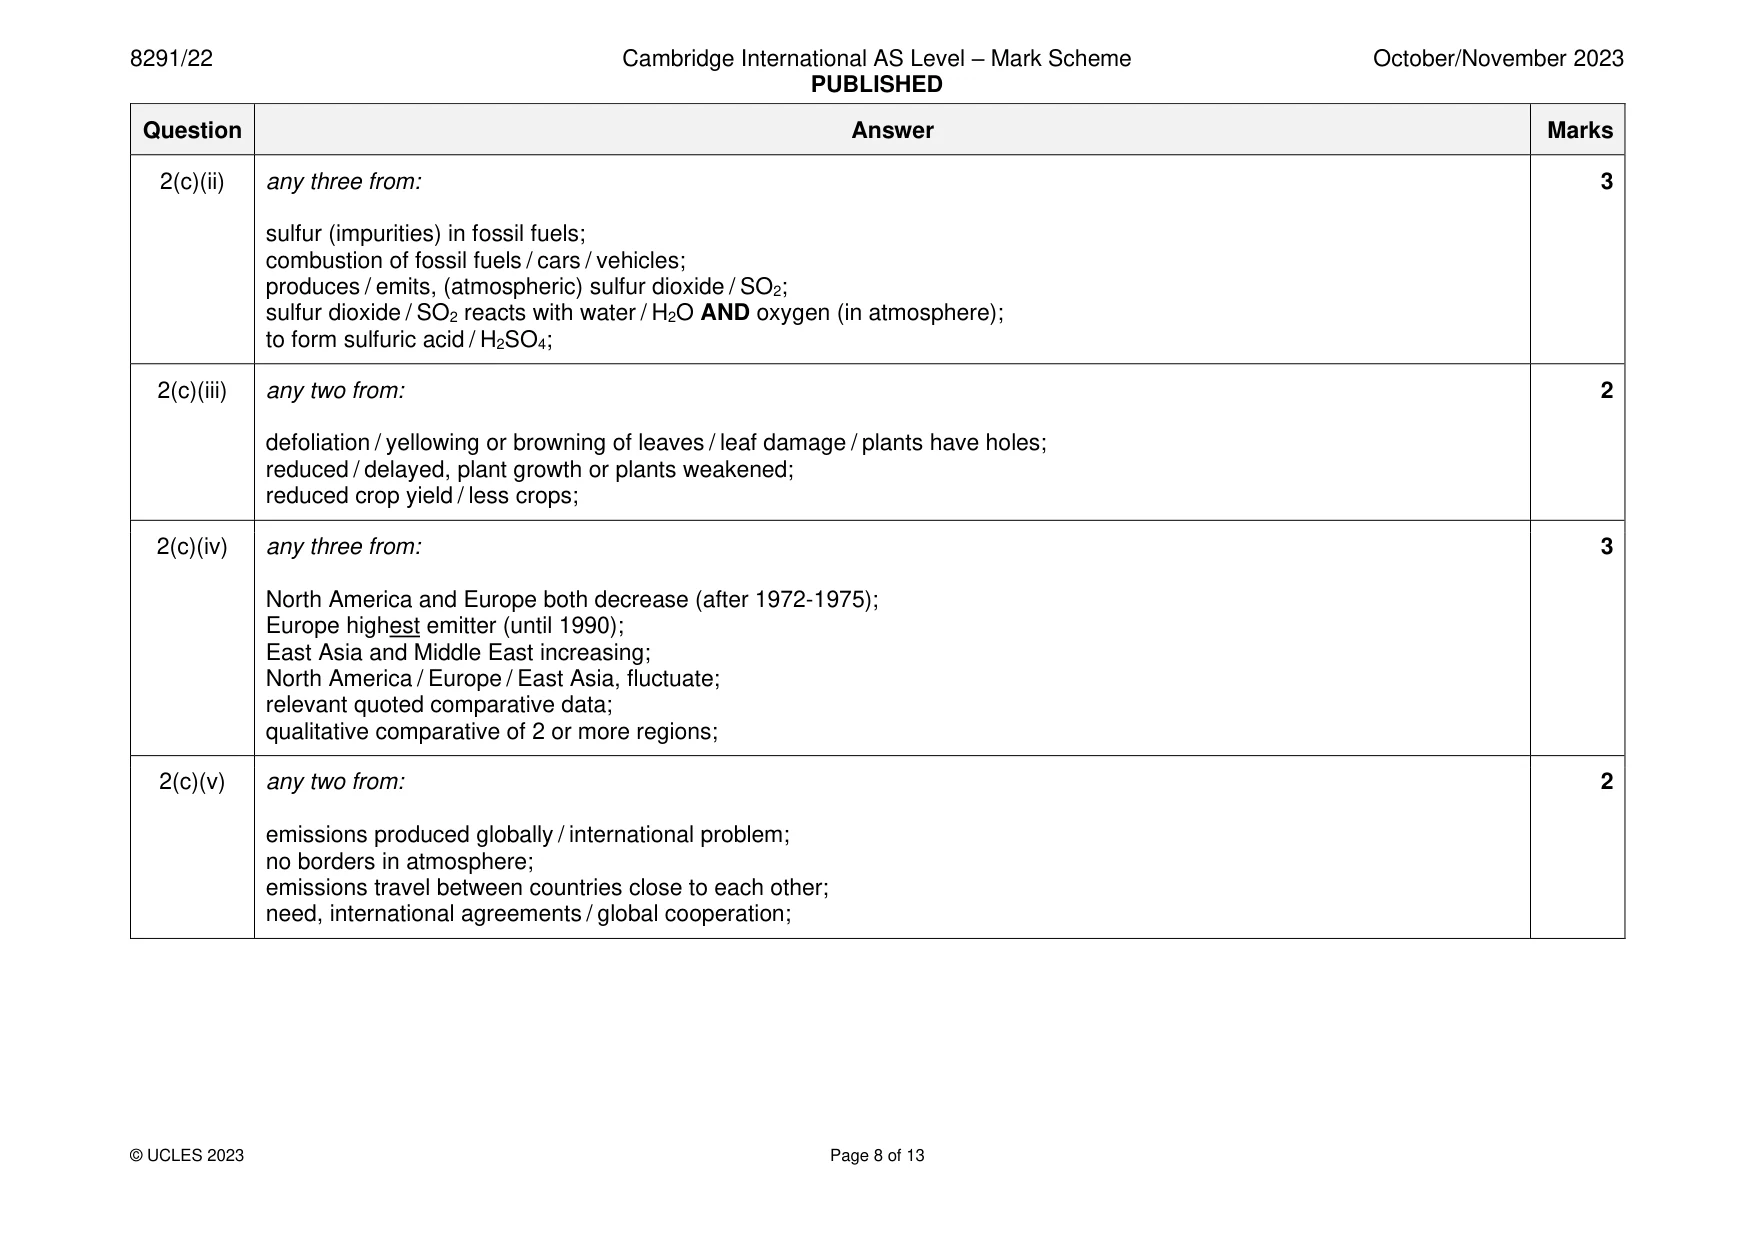
Mark scheme: 2(a)(i) concentration of sulfate ions; 1 2(a)(ii) any one from: 1 volume / amount, of water collected; time of day sample collected; depth of collection; sample location e.g. side of lake; 2(a)(iii) any four from: 4 volume / amount, of water collected; time of day sample collected; depth of collection; sample location e.g. side of lake; method of choosing location; method for measuring sulfate concentration; reagents / colour to identify concentration; 2(b)(i) 236.6; 2 237; 2(b)(ii) 171; 1 2(b)(iii) Yes AND higher / highest concentrations on wet days / low on the dry day; 1 OR No / can’t be sure AND only one dry day / not enough data; 2(b)(iv) any one from: 1 repeat AND find average / mean; increase number of samples; record volume of rain that falls / more samples from dry days; 2(c)(i) 5.6; 1 2(c)(ii) any three from: 3 sulfur (impurities) in fossil fuels; combustion of fossil fuels / cars / vehicles; produces / emits, (atmospheric) sulfur dioxide / SO2; sulfur dioxide / SO2 reacts with water / H2O AND oxygen (in atmosphere); to form sulfuric acid / H2SO4; 2(c)(iii) any two from: 2 defoliation / yellowing or browning of leaves / leaf damage / plants have holes; reduced / delayed, plant growth or plants weakened; reduced crop yield / less crops; 2(c)(iv) any three from: 3 North America and Europe both decrease (after 1972-1975); Europe highest emitter (until 1990); East Asia and Middle East increasing; North America / Europe / East Asia, fluctuate; relevant quoted comparative data; qualitative comparative of 2 or more regions; 2(c)(v) any two from: 2 emissions produced globally / international problem; no borders in atmosphere; emissions travel between countries close to each other; need, international agreements / global cooperation;
Q3 · Rice is the main food of three billion people and provides one fifth of the calories…
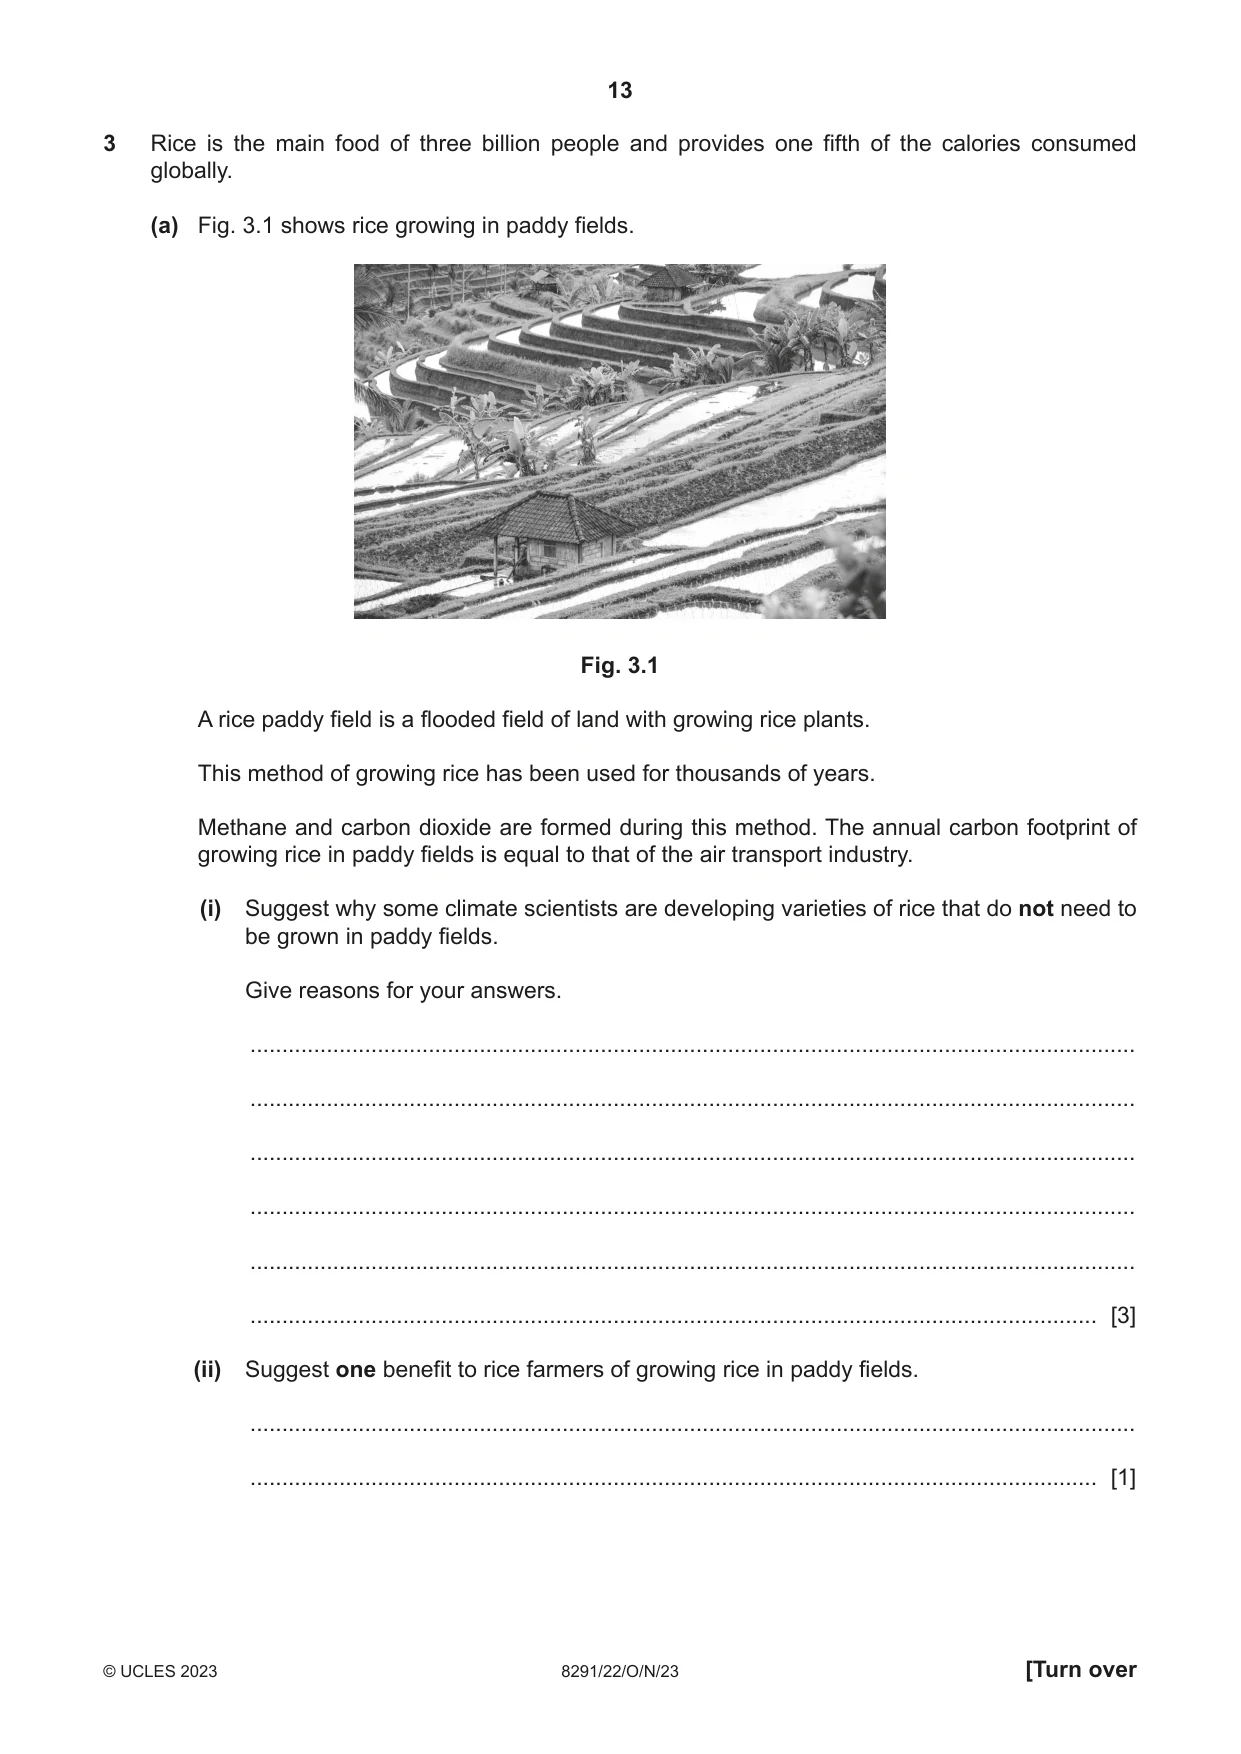
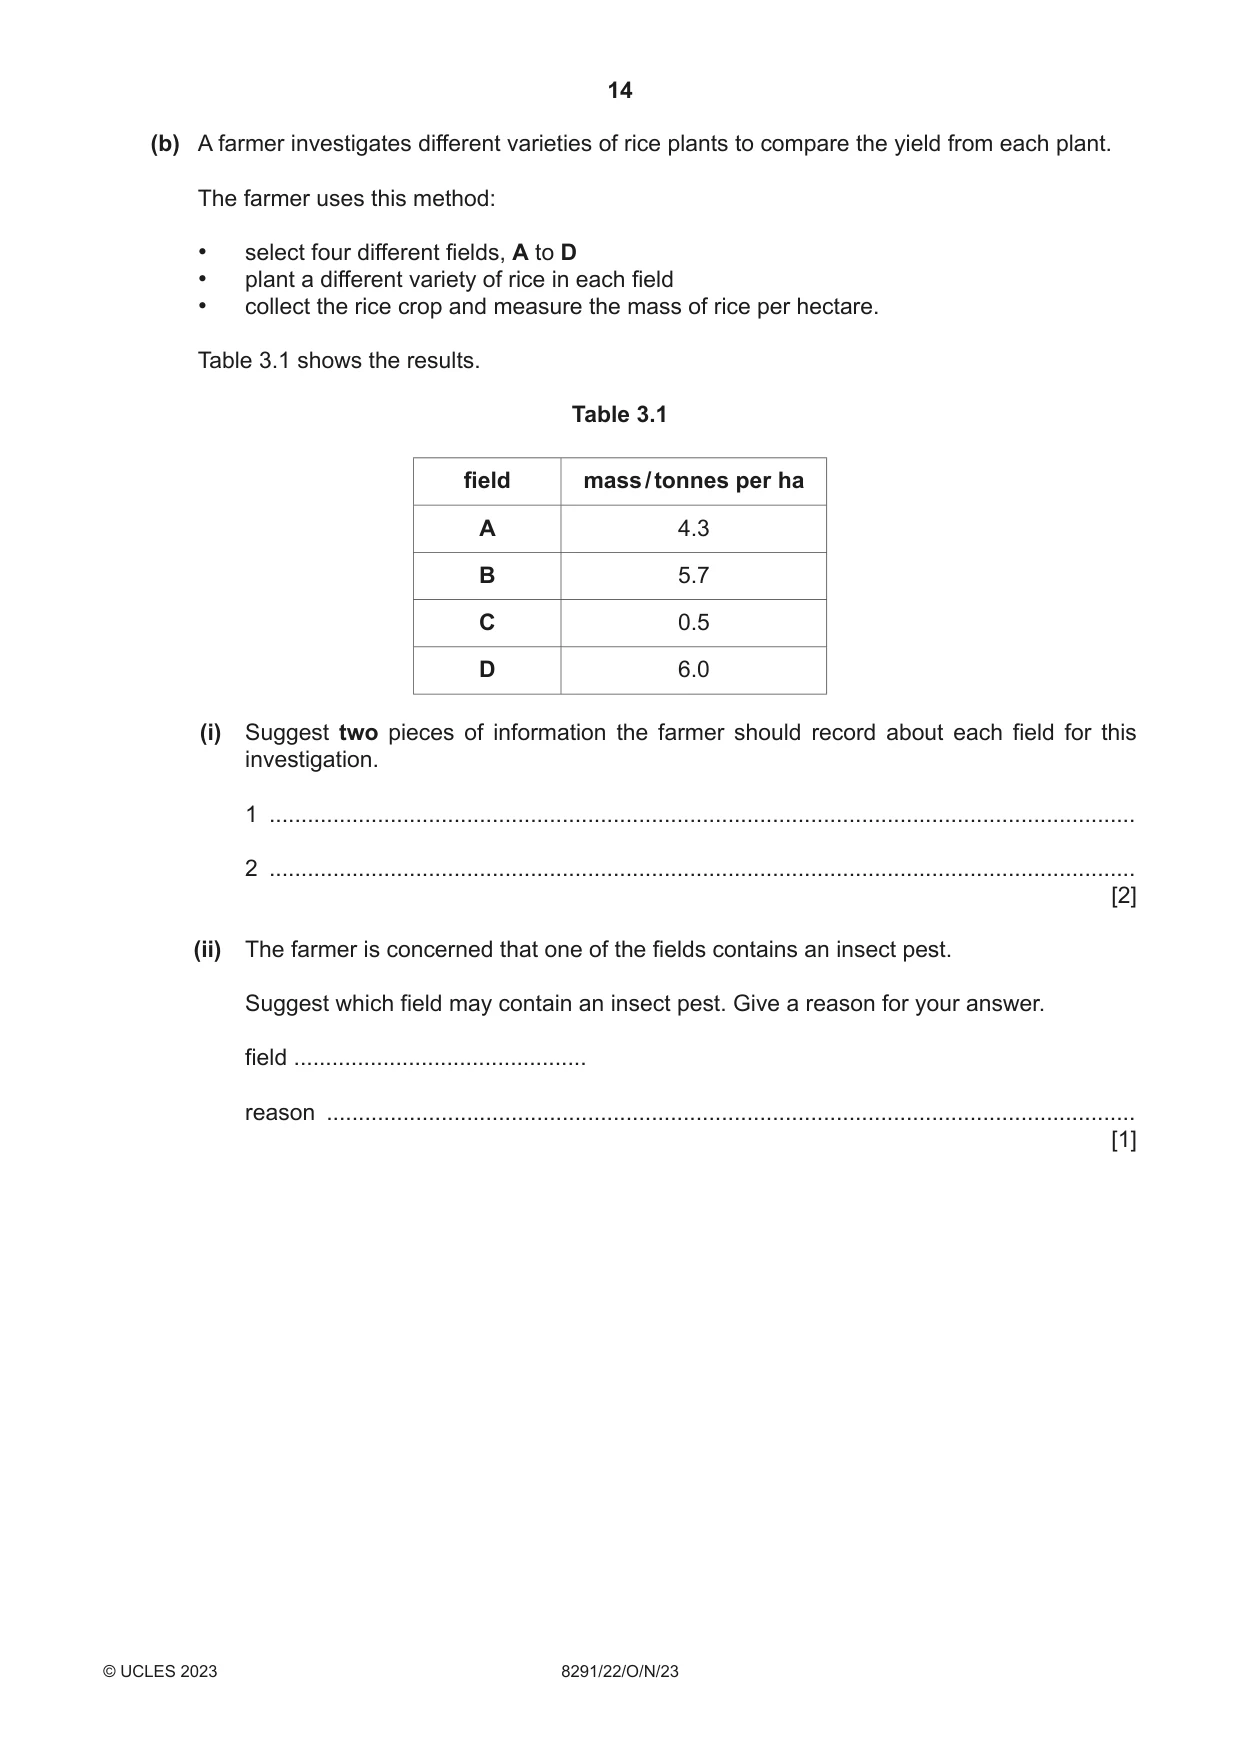
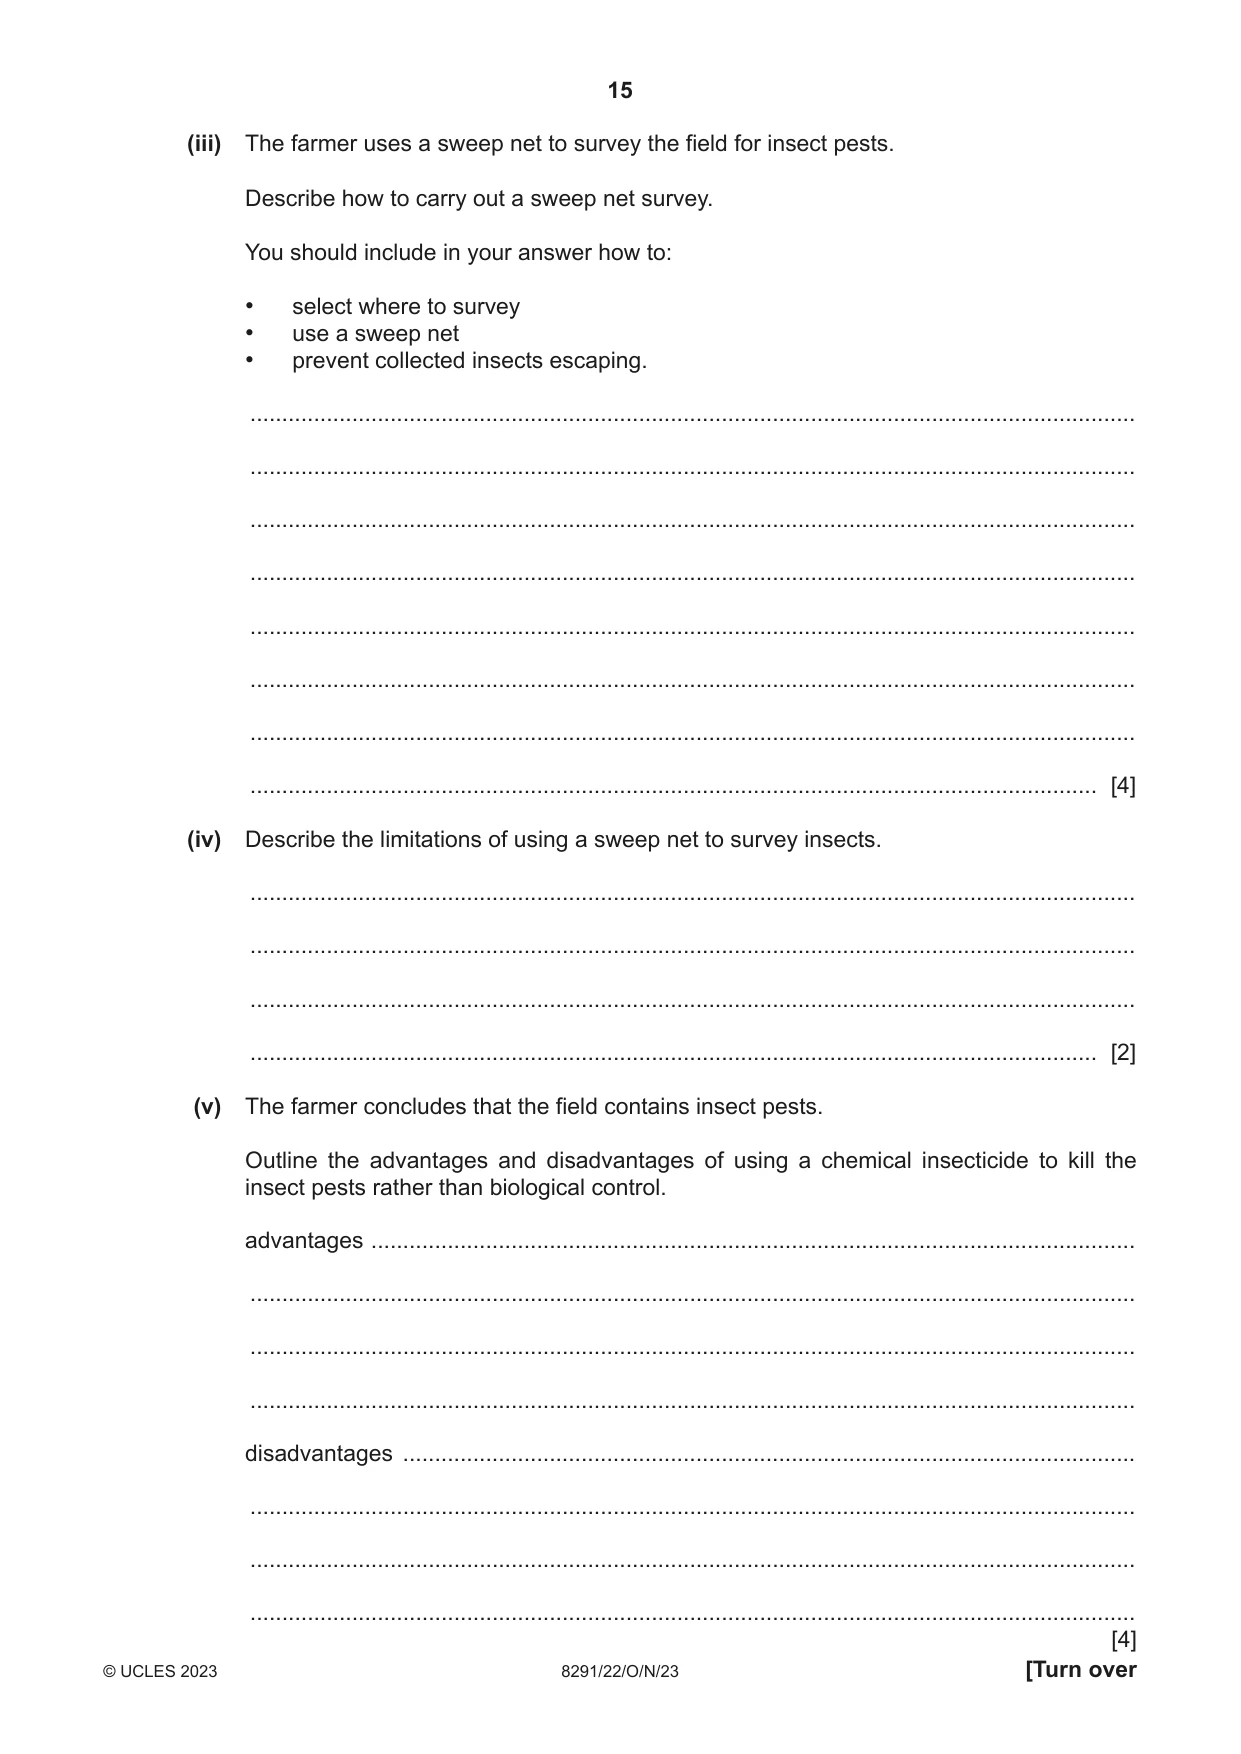
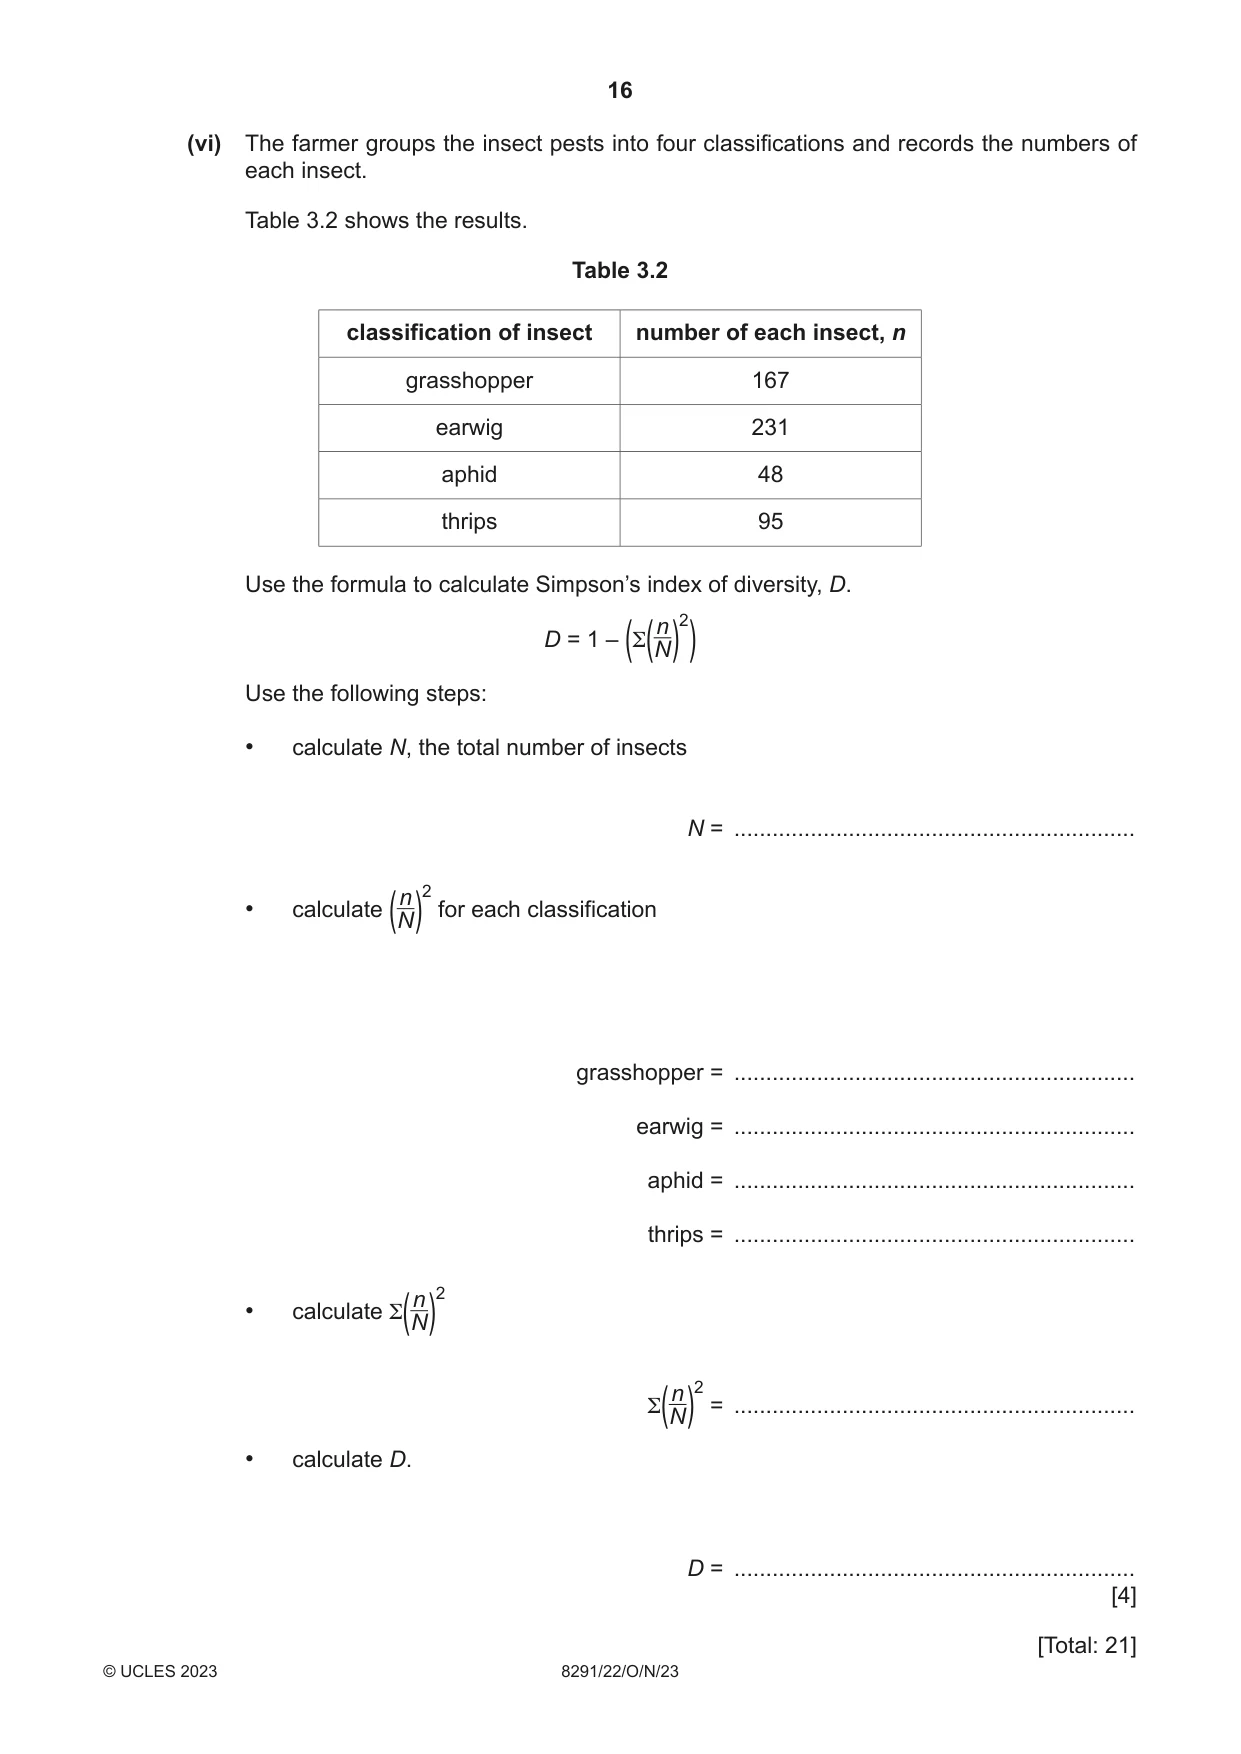
3 Rice is the main food of three billion people and provides one fifth of the calories consumed globally. (a) Fig. 3.1 shows rice growing in paddy fields. Fig. 3.1 A rice paddy field is a flooded field of land with growing rice plants. This method of growing rice has been used for thousands of years. Methane and carbon dioxide are formed during this method. The annual carbon footprint of growing rice in paddy fields is equal to that of the air transport industry. (i) Suggest why some climate scientists are developing varieties of rice that do not need to be grown in paddy fields. Give reasons for your answers. ........................................................................................................................................... ........................................................................................................................................... ........................................................................................................................................... ........................................................................................................................................... ........................................................................................................................................... ..................................................................................................................................... [3] (ii) Suggest one benefit to rice farmers of growing rice in paddy fields. ........................................................................................................................................... ..................................................................................................................................... [1] (b) A farmer investigates different varieties of rice plants to compare the yield from each plant. The farmer uses this method: • select four different fields, A to D • plant a different variety of rice in each field • collect the rice crop and measure the mass of rice per hectare. Table 3.1 shows the results. Table 3.1 field mass / tonnes per ha A 4.3 B 5.7 C 0.5 D 6.0 (i) Suggest two pieces of information the farmer should record about each field for this investigation. 1 ........................................................................................................................................ 2 ........................................................................................................................................ [2] (ii) The farmer is concerned that one of the fields contains an insect pest. Suggest which field may contain an insect pest. Give a reason for your answer. field .............................................. reason ............................................................................................................................... [1] (iii) The farmer uses a sweep net to survey the field for insect pests. Describe how to carry out a sweep net survey. You should include in your answer how to: • select where to survey • use a sweep net • prevent collected insects escaping. ........................................................................................................................................... ........................................................................................................................................... ........................................................................................................................................... ........................................................................................................................................... ........................................................................................................................................... ........................................................................................................................................... ........................................................................................................................................... ..................................................................................................................................... [4] (iv) Describe the limitations of using a sweep net to survey insects. ........................................................................................................................................... ........................................................................................................................................... ........................................................................................................................................... ..................................................................................................................................... [2] (v) The farmer concludes that the field contains insect pests. Outline the advantages and disadvantages of using a chemical insecticide to kill the insect pests rather than biological control. advantages ........................................................................................................................ ........................................................................................................................................... ........................................................................................................................................... ........................................................................................................................................... disadvantages ................................................................................................................... ........................................................................................................................................... ........................................................................................................................................... ........................................................................................................................................... [4] (vi) The farmer groups the insect pests into four classifications and records the numbers of each insect. Table 3.2 shows the results. Table 3.2 classification of insect number of each insect, n grasshopper 167 earwig 231 aphid 48 thrips 95 Use the formula to calculate Simpson’s index of diversity, D. n 2 D = 1 – (Σ( N) ) Use the following steps: • calculate N, the total number of insects N = ............................................................... n 2 • calculate for each classification ( N) grasshopper = ............................................................... earwig = ............................................................... aphid = ............................................................... thrips = ............................................................... n 2 • calculate Σ( N) n 2 = ............................................................... Σ( N) • calculate D. D = ............................................................... [4] [Total: 21]
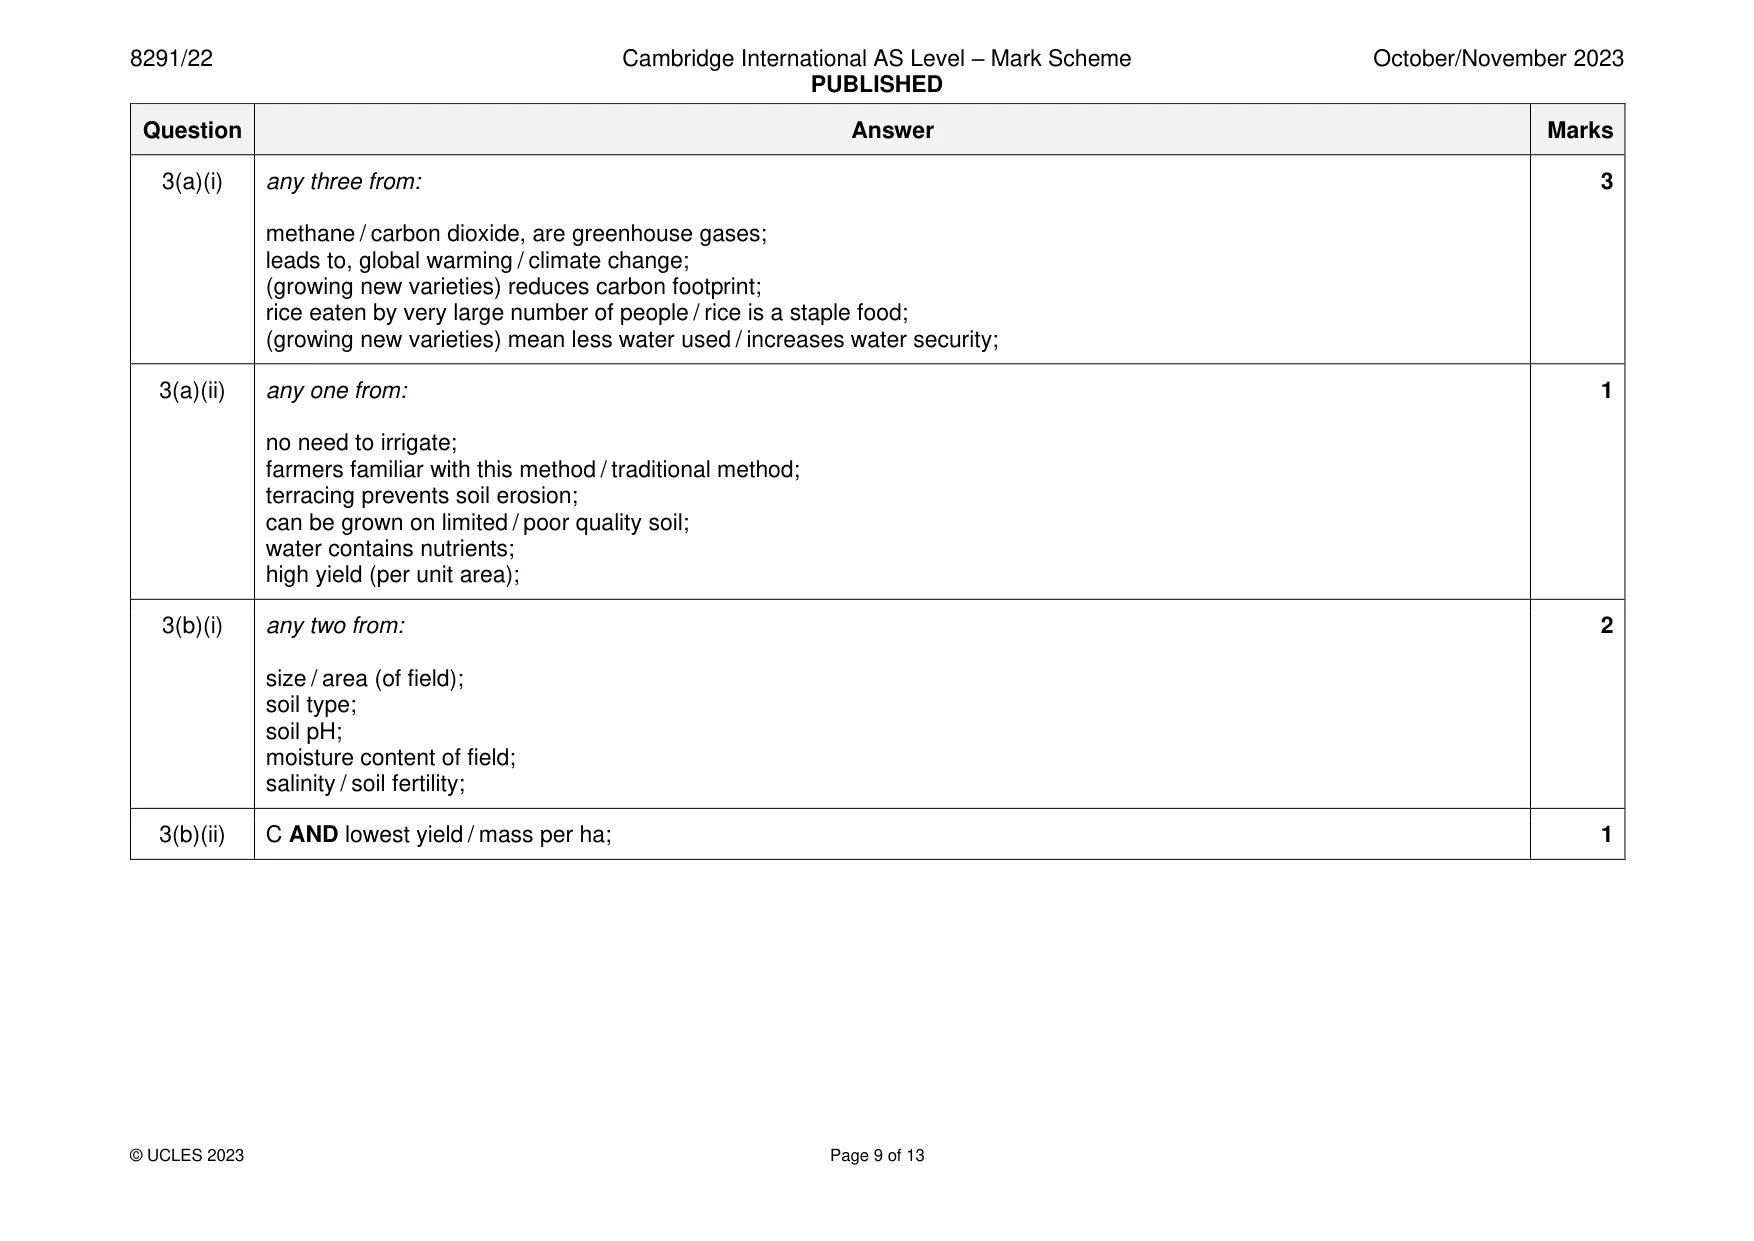
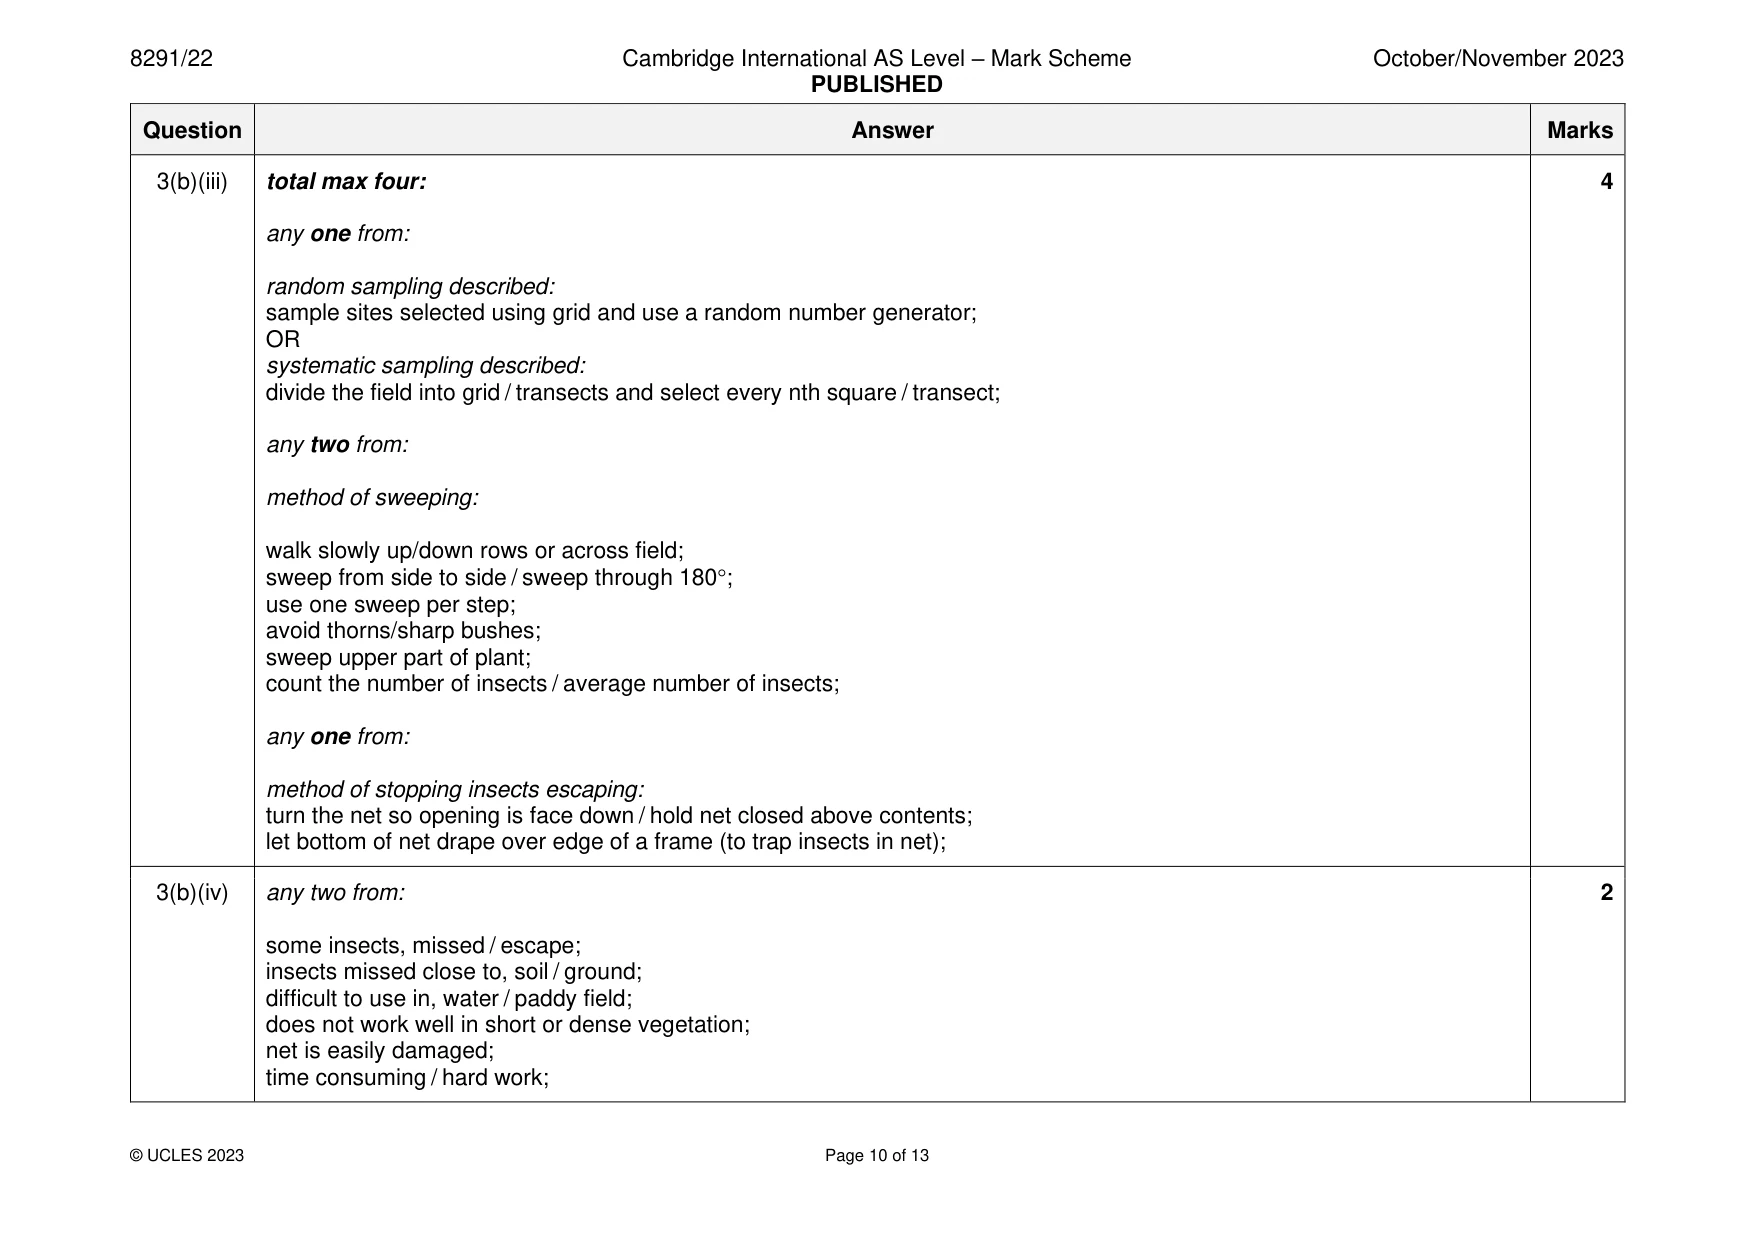
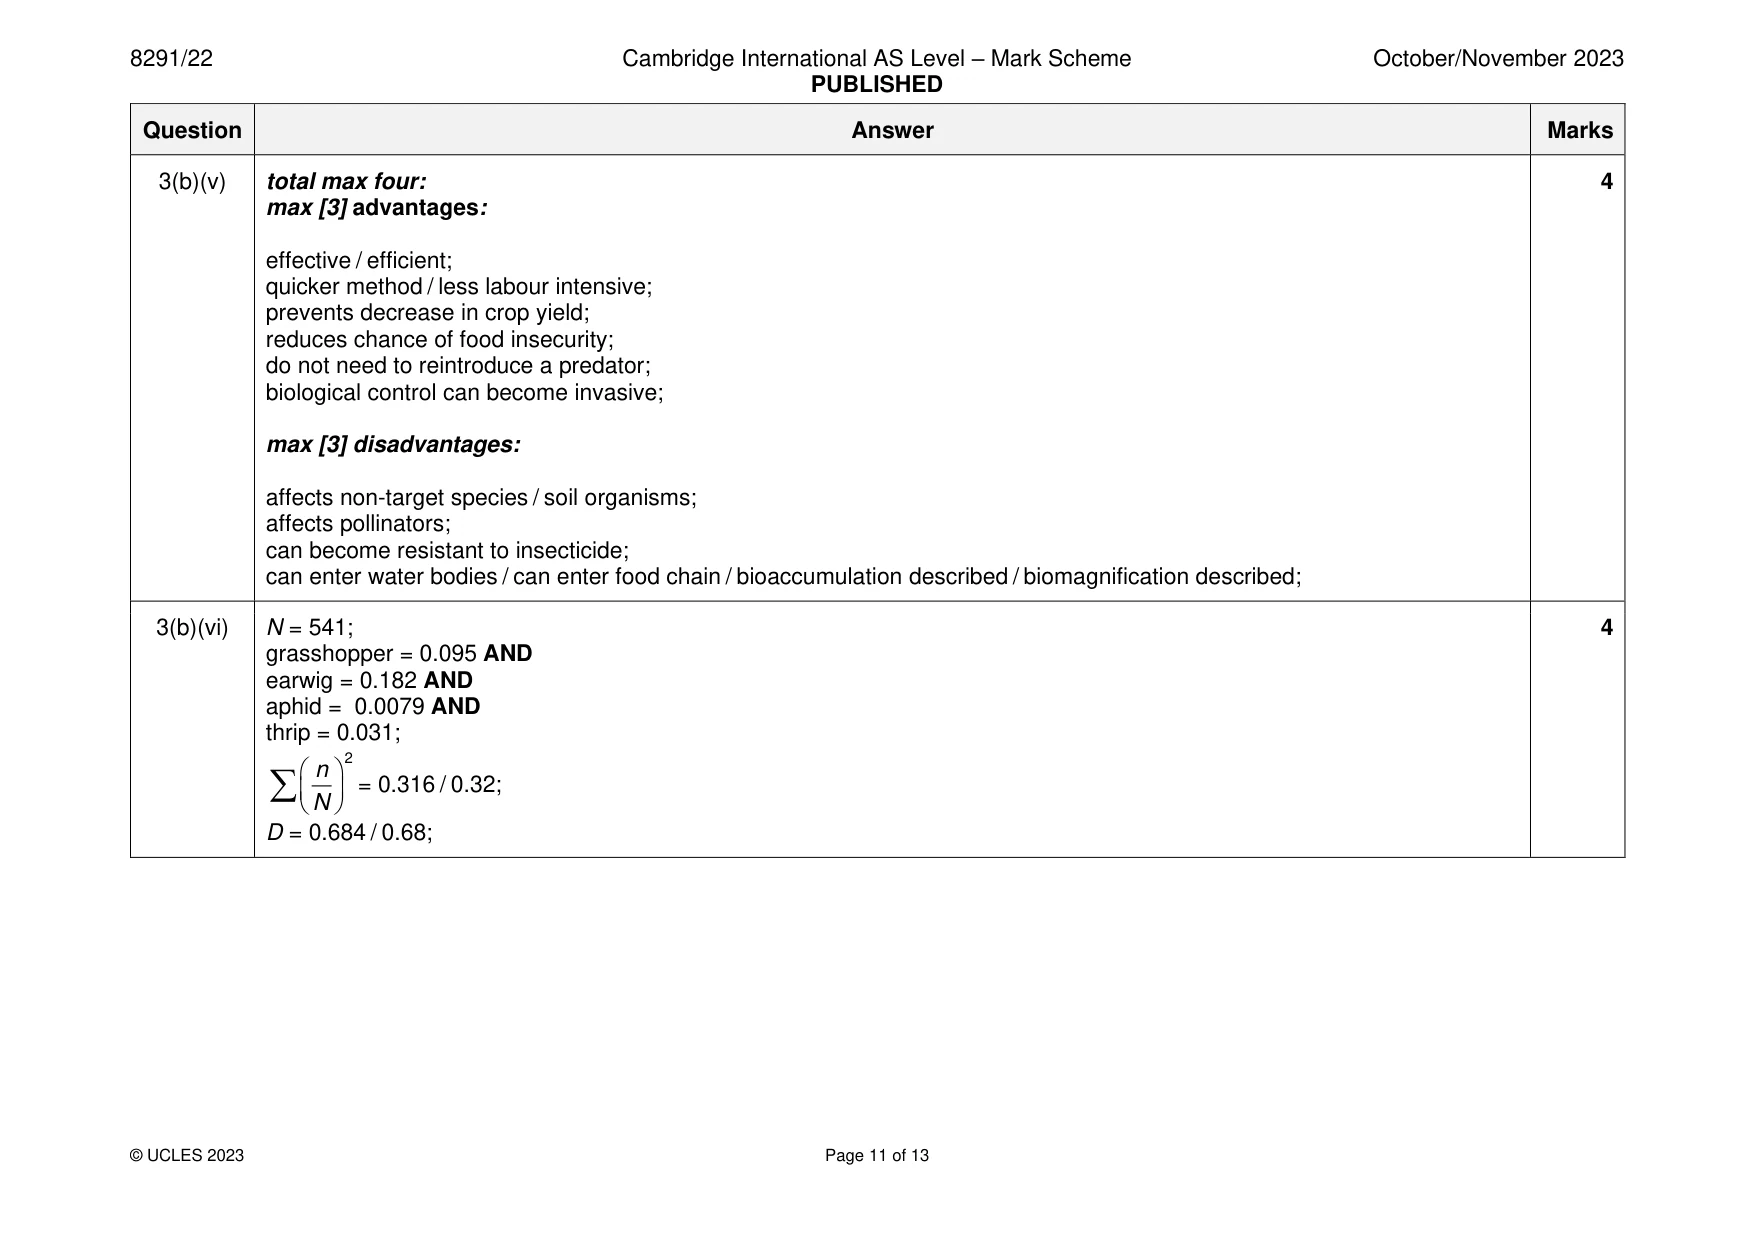
Mark scheme: 3(a)(i) any three from: 3 methane / carbon dioxide, are greenhouse gases; leads to, global warming / climate change; (growing new varieties) reduces carbon footprint; rice eaten by very large number of people / rice is a staple food; (growing new varieties) mean less water used / increases water security; 3(a)(ii) any one from: 1 no need to irrigate; farmers familiar with this method / traditional method; terracing prevents soil erosion; can be grown on limited / poor quality soil; water contains nutrients; high yield (per unit area); 3(b)(i) any two from: 2 size / area (of field); soil type; soil pH; moisture content of field; salinity / soil fertility; 3(b)(ii) C AND lowest yield / mass per ha; 1 3(b)(iii) total max four: 4 any one from: random sampling described: sample sites selected using grid and use a random number generator; OR systematic sampling described: divide the field into grid / transects and select every nth square / transect; any two from: method of sweeping: walk slowly up/down rows or across field; sweep from side to side / sweep through 180; use one sweep per step; avoid thorns/sharp bushes; sweep upper part of plant; count the number of insects / average number of insects; any one from: method of stopping insects escaping: turn the net so opening is face down / hold net closed above contents; let bottom of net drape over edge of a frame (to trap insects in net); 3(b)(iv) any two from: 2 some insects, missed / escape; insects missed close to, soil / ground; difficult to use in, water / paddy field; does not work well in short or dense vegetation; net is easily damaged; time consuming / hard work; 3(b)(v) total max four: 4 max [3] advantages: effective / efficient; quicker method / less labour intensive; prevents decrease in crop yield; reduces chance of food insecurity; do not need to reintroduce a predator; biological control can become invasive; max [3] disadvantages: affects non-target species / soil organisms; affects pollinators; can become resistant to insecticide; can enter water bodies / can enter food chain / bioaccumulation described / biomagnification described; 3(b)(vi) N = 541; 4 grasshopper = 0.095 AND earwig = 0.182 AND aphid = 0.0079 AND thrip = 0.031; n 2 = 0.316 / 0.32; N D = 0.684 / 0.68;
More questions on Data collection techniques and data analysis
Q4 · The UK government promotes the use of electric cars
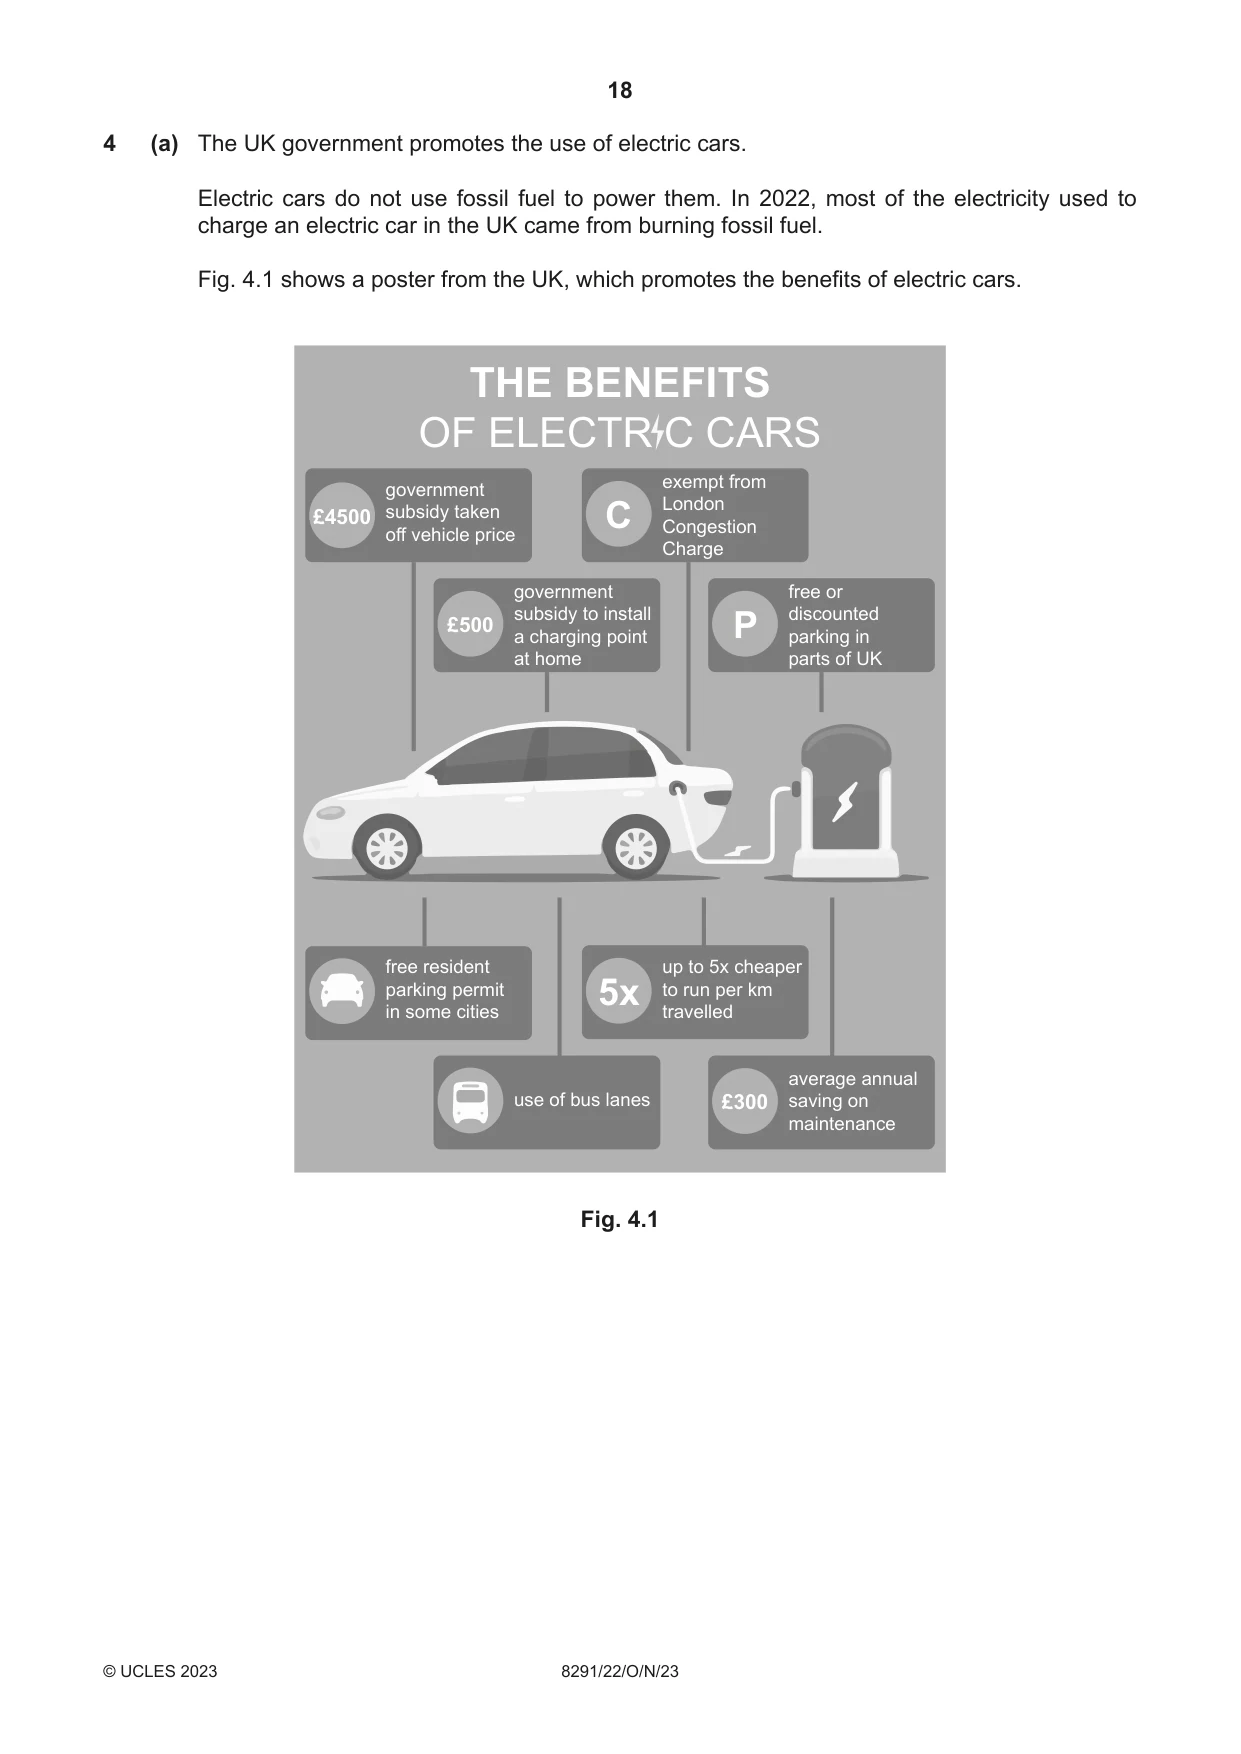
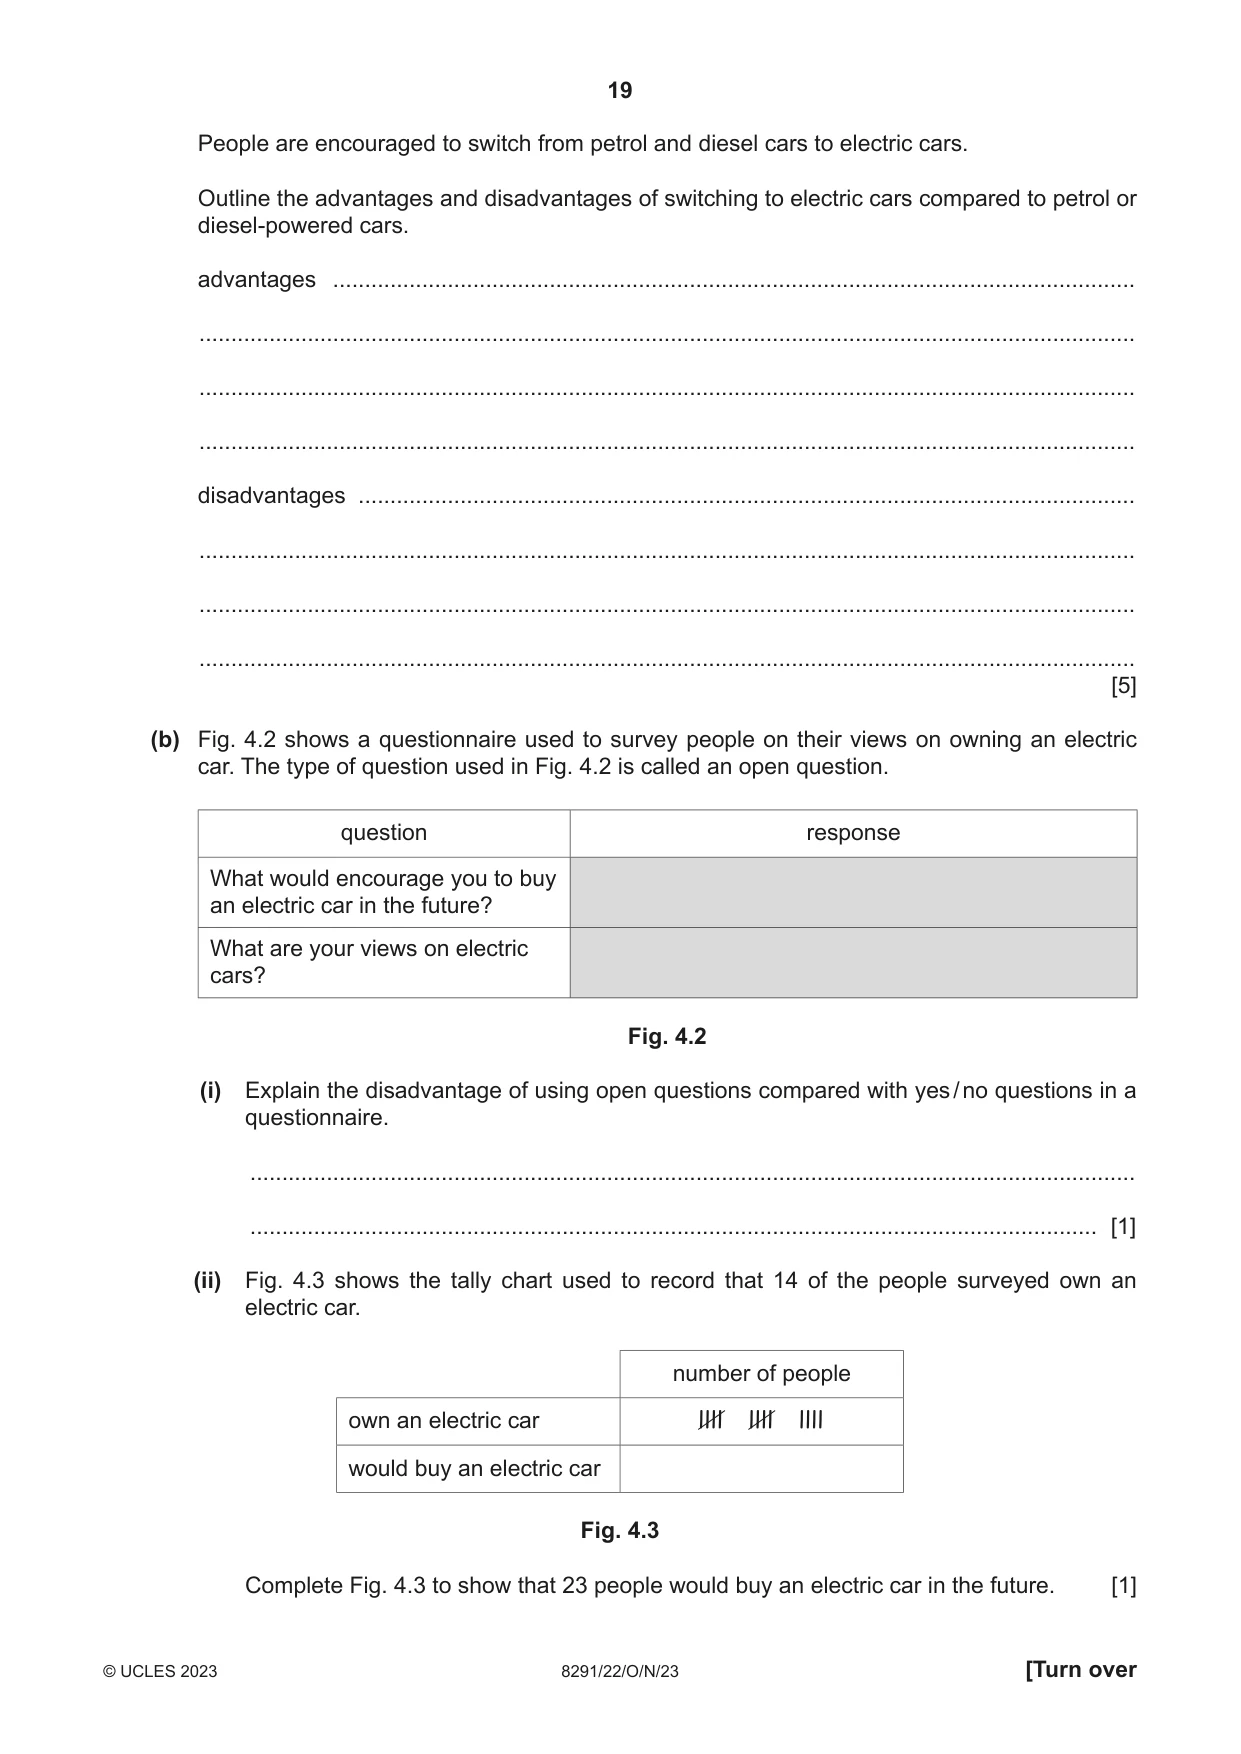
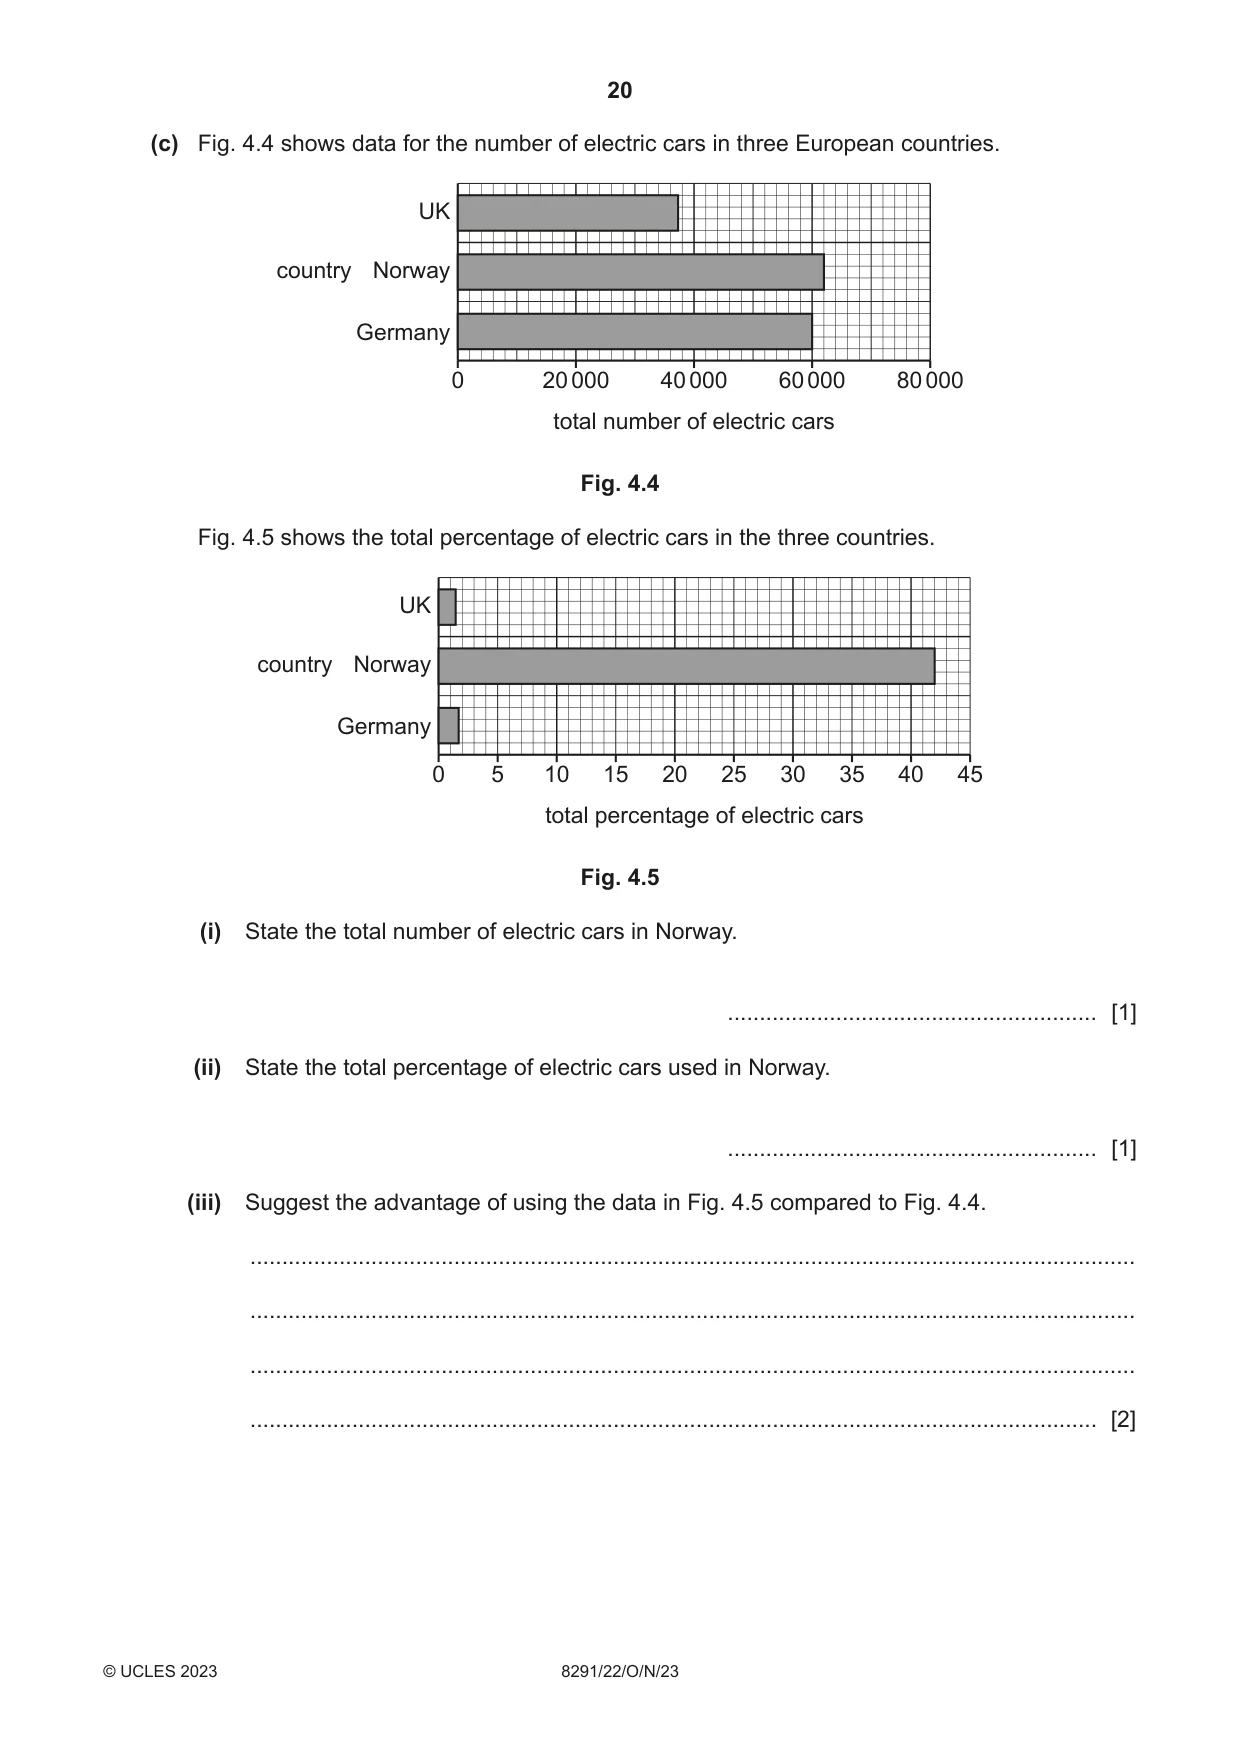
4 (a) The UK government promotes the use of electric cars. Electric cars do not use fossil fuel to power them. In 2022, most of the electricity used to charge an electric car in the UK came from burning fossil fuel. Fig. 4.1 shows a poster from the UK, which promotes the benefits of electric cars. THE BENEFITS OF ELECTR C CARS exempt from government London £4500 subsidy taken Congestion off vehicle price C Charge government free or subsidy to install discounted £500 a charging point P parking in at home parts of UK free resident up to 5x cheaper parking permit to run per km in some cities 5x travelled average annual use of bus lanes £300 saving on maintenance Fig. 4.1 People are encouraged to switch from petrol and diesel cars to electric cars. Outline the advantages and disadvantages of switching to electric cars compared to petrol or diesel-powered cars. advantages .............................................................................................................................. ................................................................................................................................................... ................................................................................................................................................... ................................................................................................................................................... disadvantages .......................................................................................................................... ................................................................................................................................................... ................................................................................................................................................... ................................................................................................................................................... [5] (b) Fig. 4.2 shows a questionnaire used to survey people on their views on owning an electric car. The type of question used in Fig. 4.2 is called an open question. question response What would encourage you to buy an electric car in the future? What are your views on electric cars? Fig. 4.2 (i) Explain the disadvantage of using open questions compared with yes / no questions in a questionnaire. ........................................................................................................................................... ..................................................................................................................................... [1] (ii) Fig. 4.3 shows the tally chart used to record that 14 of the people surveyed own an electric car. number of people own an electric car llll llll llll would buy an electric car Fig. 4.3 Complete Fig. 4.3 to show that 23 people would buy an electric car in the future. [1] (c) Fig. 4.4 shows data for the number of electric cars in three European countries. UK country Norway Germany 0 20 000 40 000 60 000 80 000 total number of electric cars Fig. 4.4 Fig. 4.5 shows the total percentage of electric cars in the three countries. UK country Norway Germany 0 5 10 15 20 25 30 35 40 45 total percentage of electric cars Fig. 4.5 (i) State the total number of electric cars in Norway. .......................................................... [1] (ii) State the total percentage of electric cars used in Norway. .......................................................... [1] (iii) Suggest the advantage of using the data in Fig. 4.5 compared to Fig. 4.4. ........................................................................................................................................... ........................................................................................................................................... ........................................................................................................................................... ..................................................................................................................................... [2]
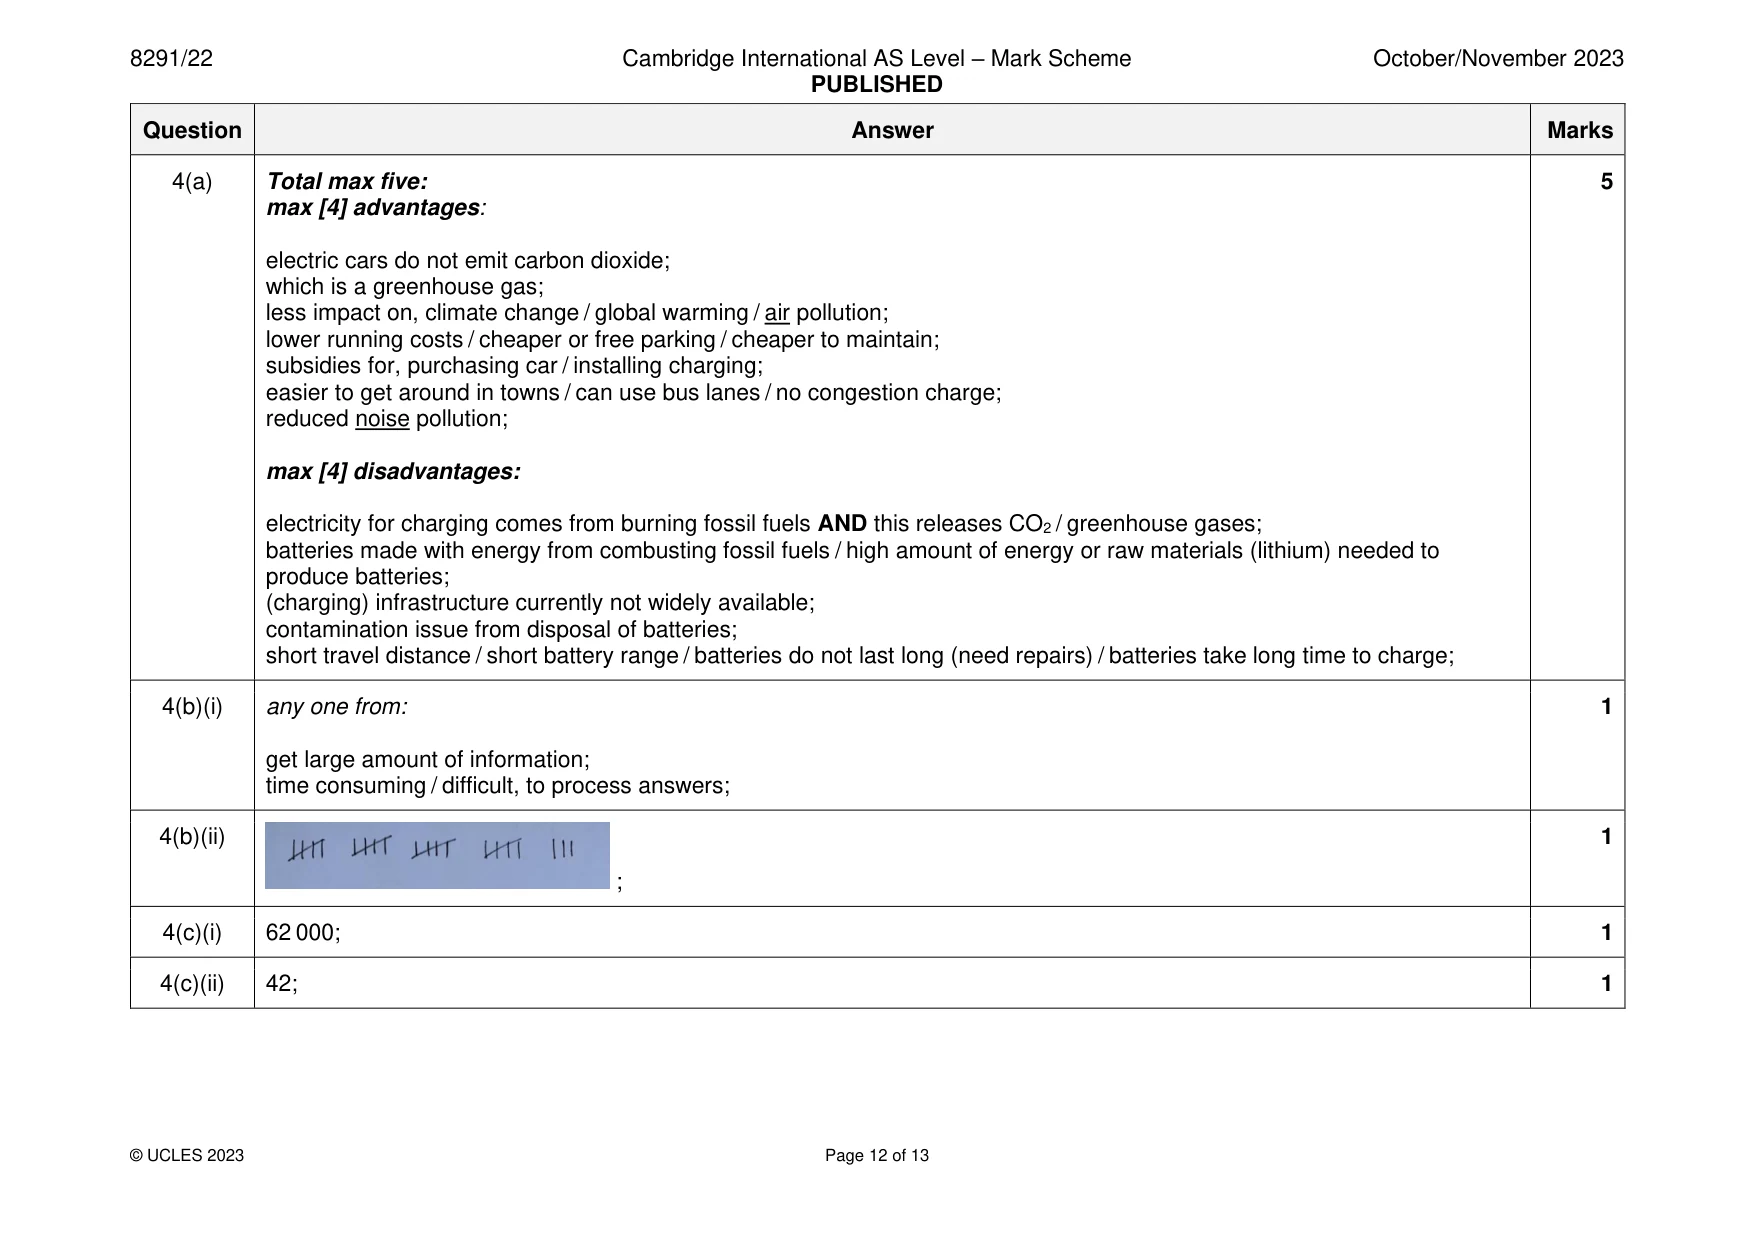
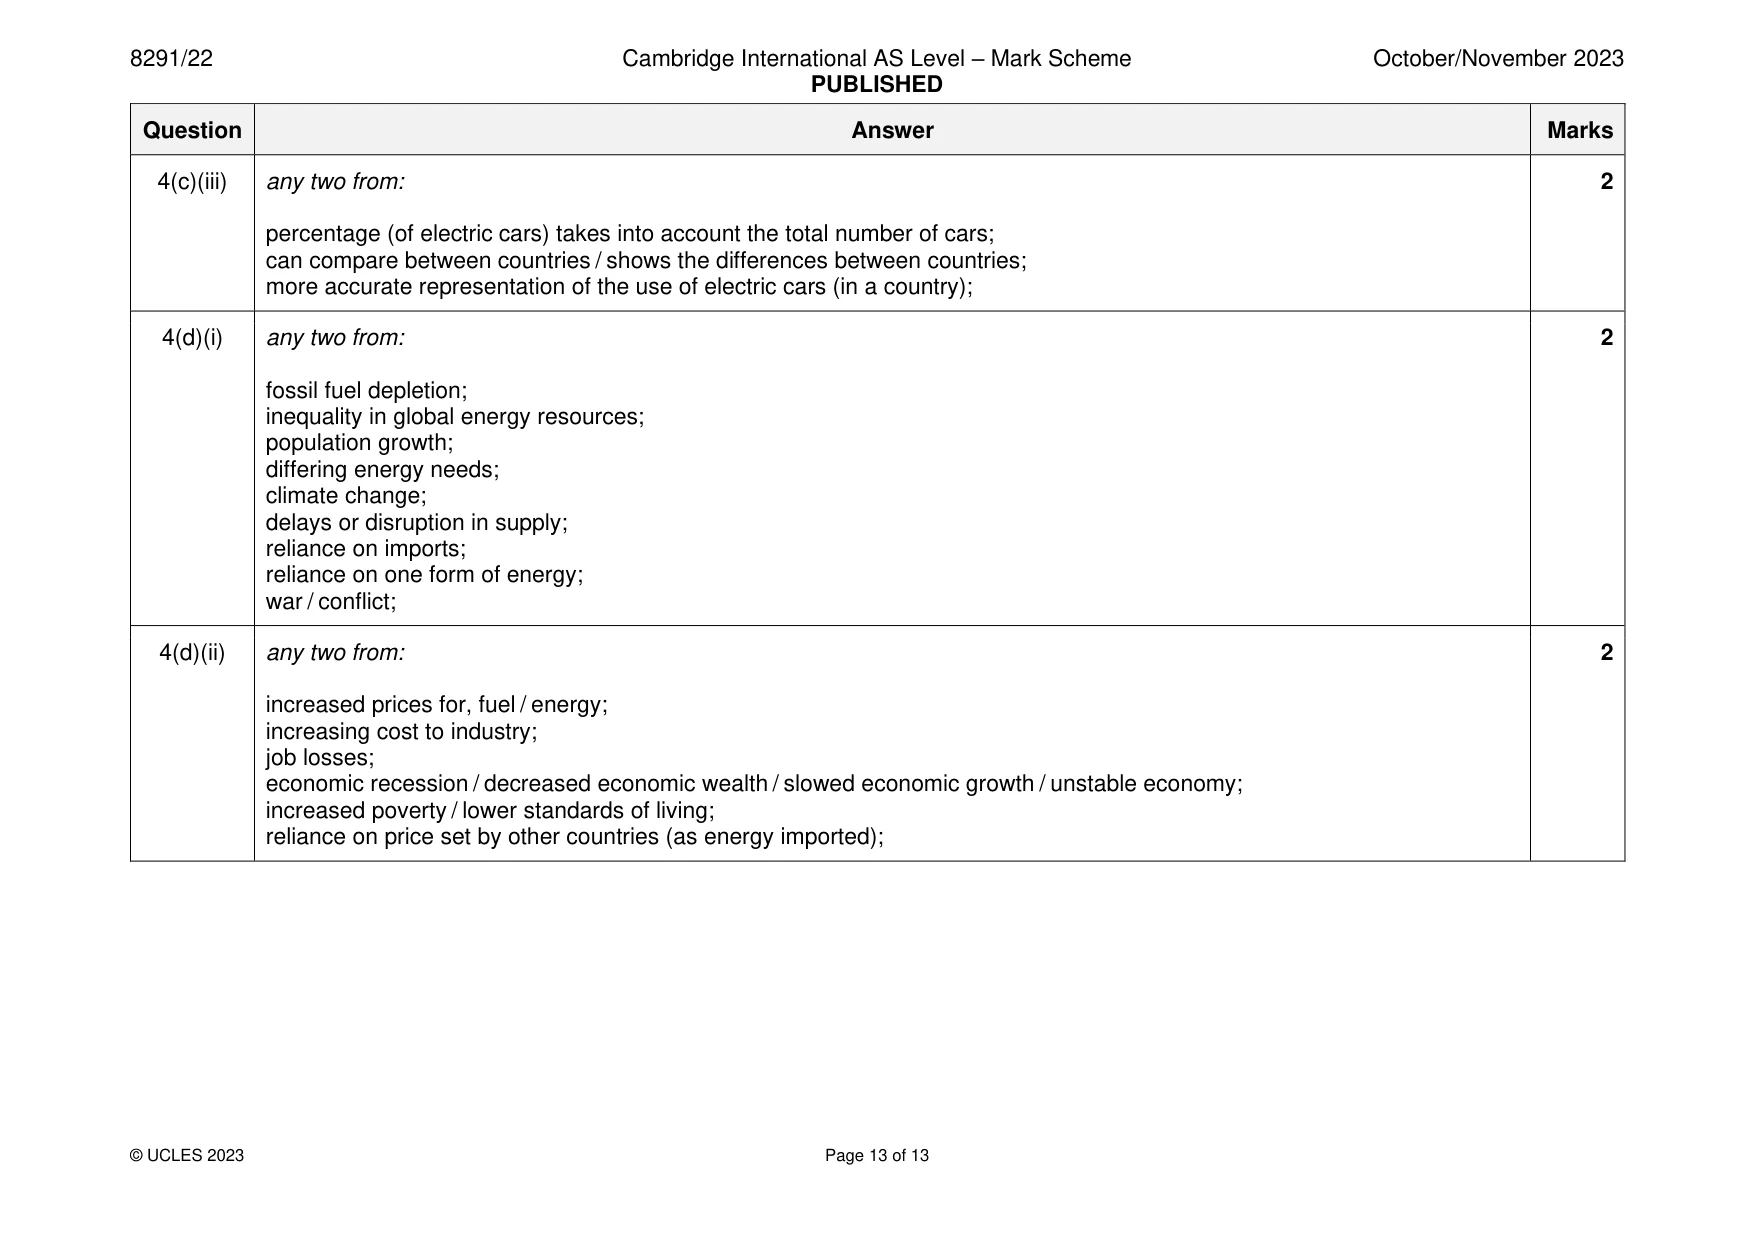
Mark scheme: 4(a) Total max five: 5 max [4] advantages: electric cars do not emit carbon dioxide; which is a greenhouse gas; less impact on, climate change / global warming / air pollution; lower running costs / cheaper or free parking / cheaper to maintain; subsidies for, purchasing car / installing charging; easier to get around in towns / can use bus lanes / no congestion charge; reduced noise pollution; max [4] disadvantages: electricity for charging comes from burning fossil fuels AND this releases CO2 / greenhouse gases; batteries made with energy from combusting fossil fuels / high amount of energy or raw materials (lithium) needed to produce batteries; (charging) infrastructure currently not widely available; contamination issue from disposal of batteries; short travel distance / short battery range / batteries do not last long (need repairs) / batteries take long time to charge; 4(b)(i) any one from: 1 get large amount of information; time consuming / difficult, to process answers; 4(b)(ii) 1 ; 4(c)(i) 62 000; 1 4(c)(ii) 42; 1 4(c)(iii) any two from: 2 percentage (of electric cars) takes into account the total number of cars; can compare between countries / shows the differences between countries; more accurate representation of the use of electric cars (in a country); 4(d)(i) any two from: 2 fossil fuel depletion; inequality in global energy resources; population growth; differing energy needs; climate change; delays or disruption in supply; reliance on imports; reliance on one form of energy; war / conflict; 4(d)(ii) any two from: 2 increased prices for, fuel / energy; increasing cost to industry; job losses; economic recession / decreased economic wealth / slowed economic growth / unstable economy; increased poverty / lower standards of living; reliance on price set by other countries (as energy imported);
More questions on Data collection techniques and data analysis
What was in this paper
The subtopics covered by these 4 questions, and how many questions each got. Open one in a new tab to see every Cambridge question on it.
What you needed in this session
Cambridge’s own grade thresholds for 2023 Oct/Nov, Paper 2 · Variant 2. A higher threshold means an easier paper — the bar moves with how the cohort did.