Cambridge A Level Environmental Management (AS only) 8291 — 2021 Oct/Nov Paper 2 · Variant 2
8291/22/O/N/21 · 5 questions · 80 marks · ≈90 min
The question paper and its mark scheme, free to read here and free to download. This is Cambridge’s own paper, exactly as it was sat.
Question paper16 pages





Mark scheme14 pages
Answers below. Sit the paper first if you are practising.
Questions as text
Q1 · Information about water needed to produce cotton for clothing
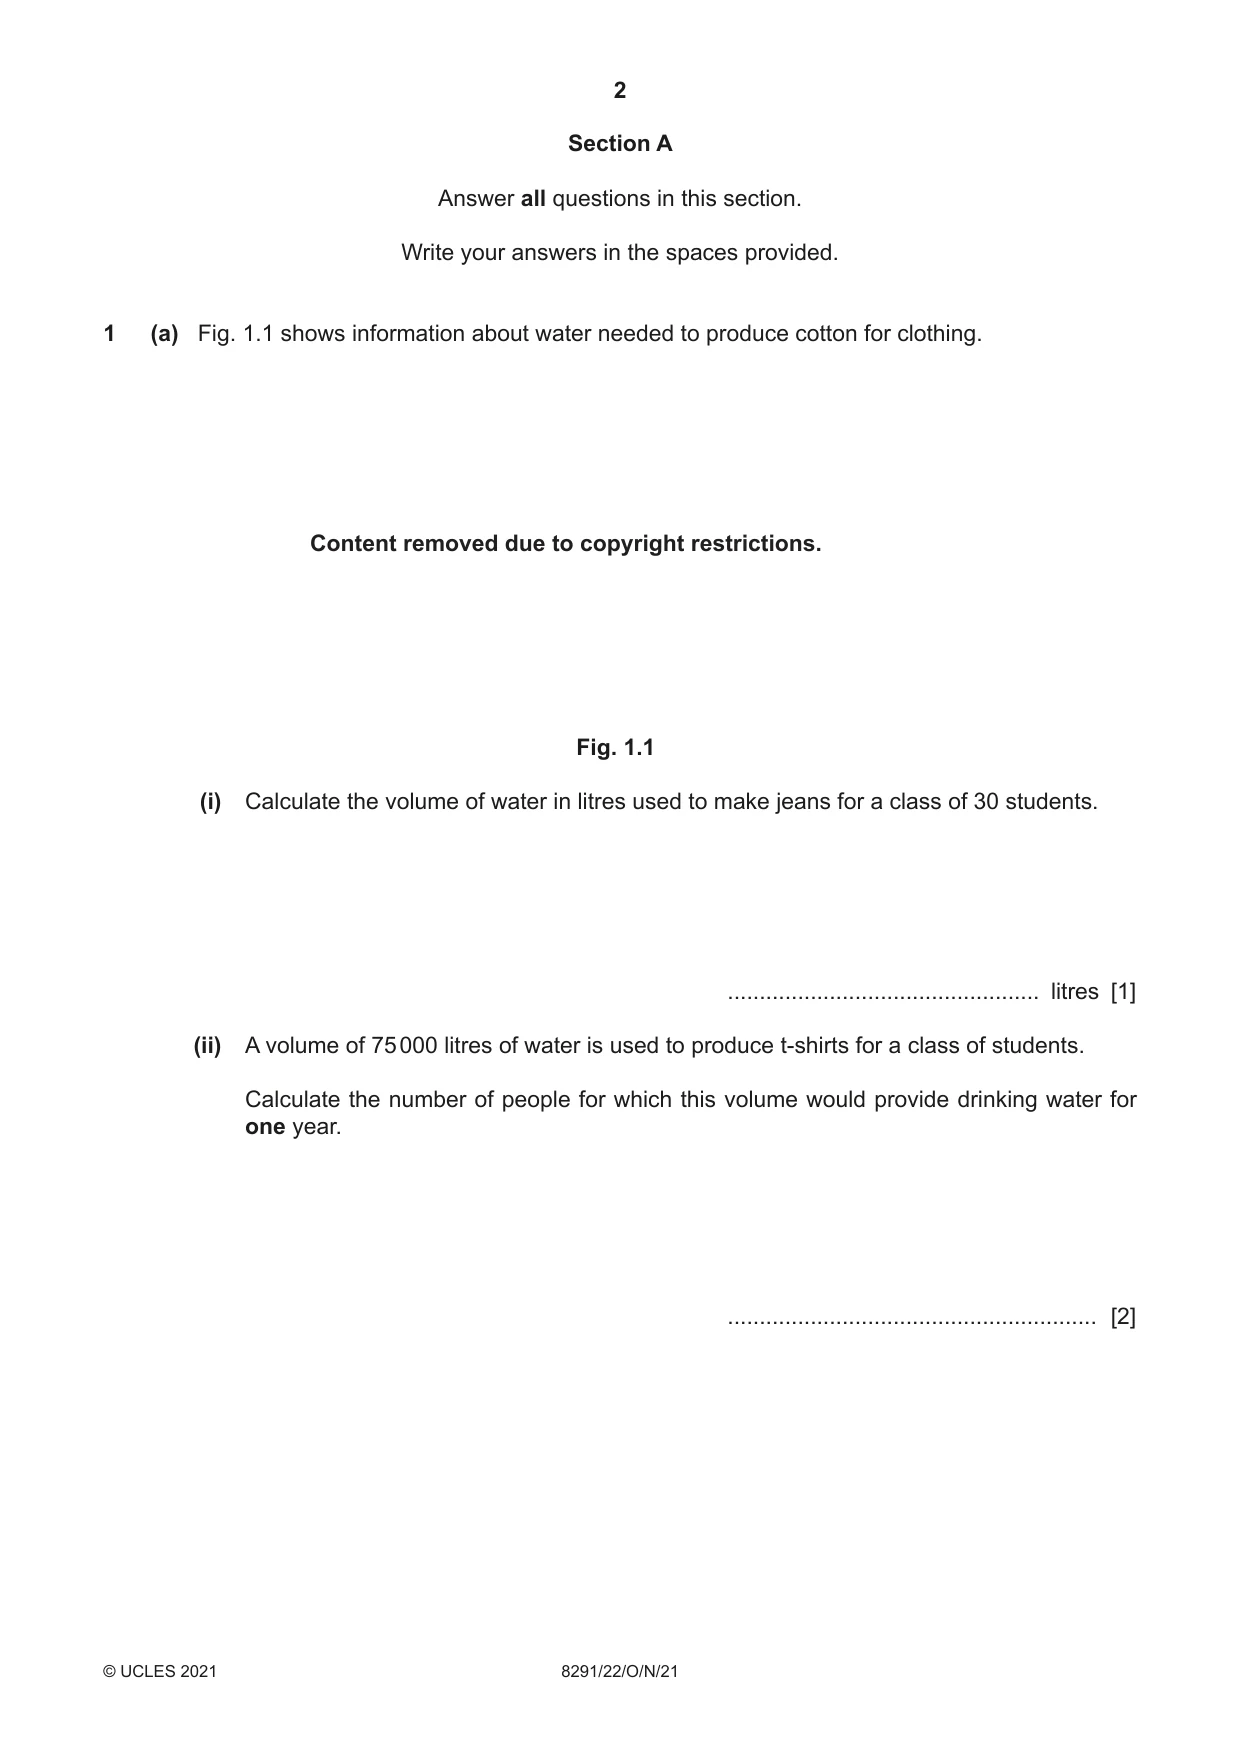
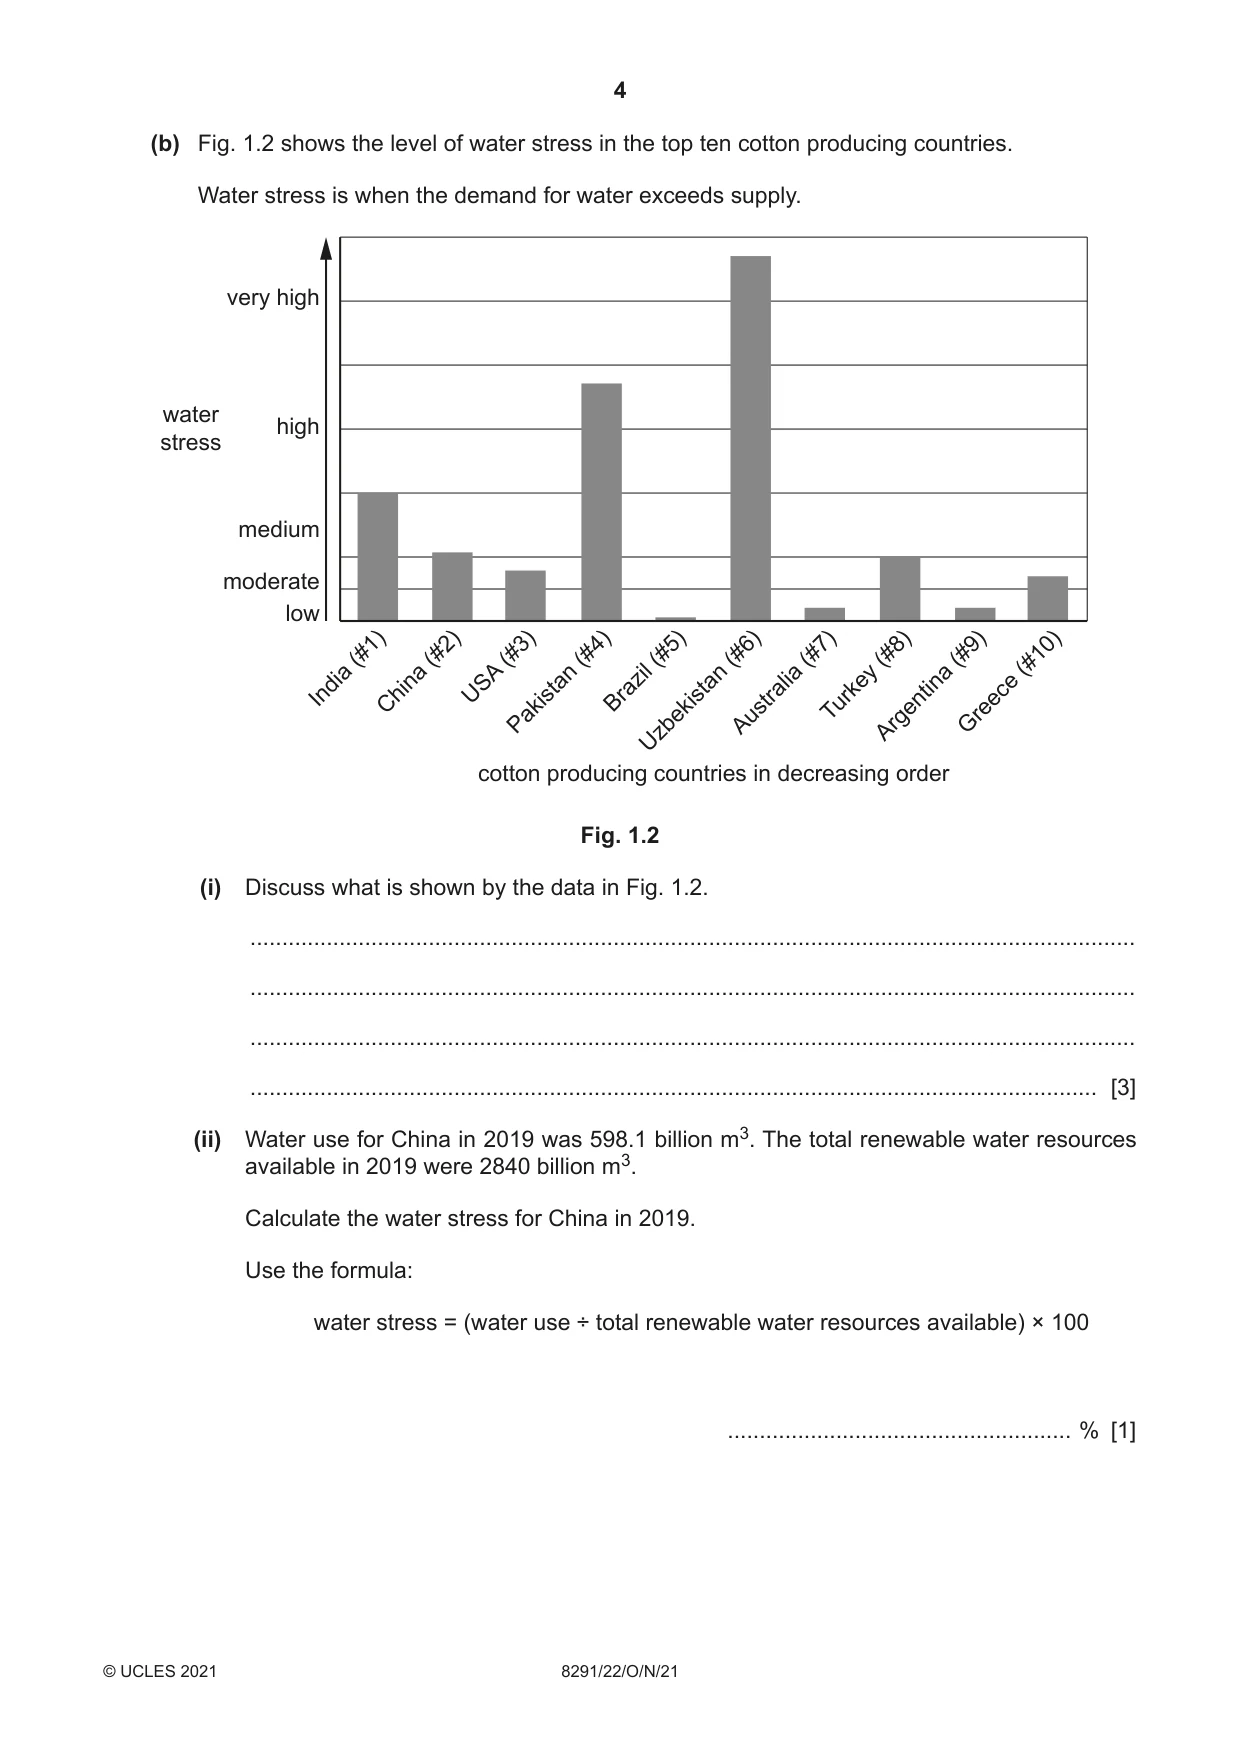
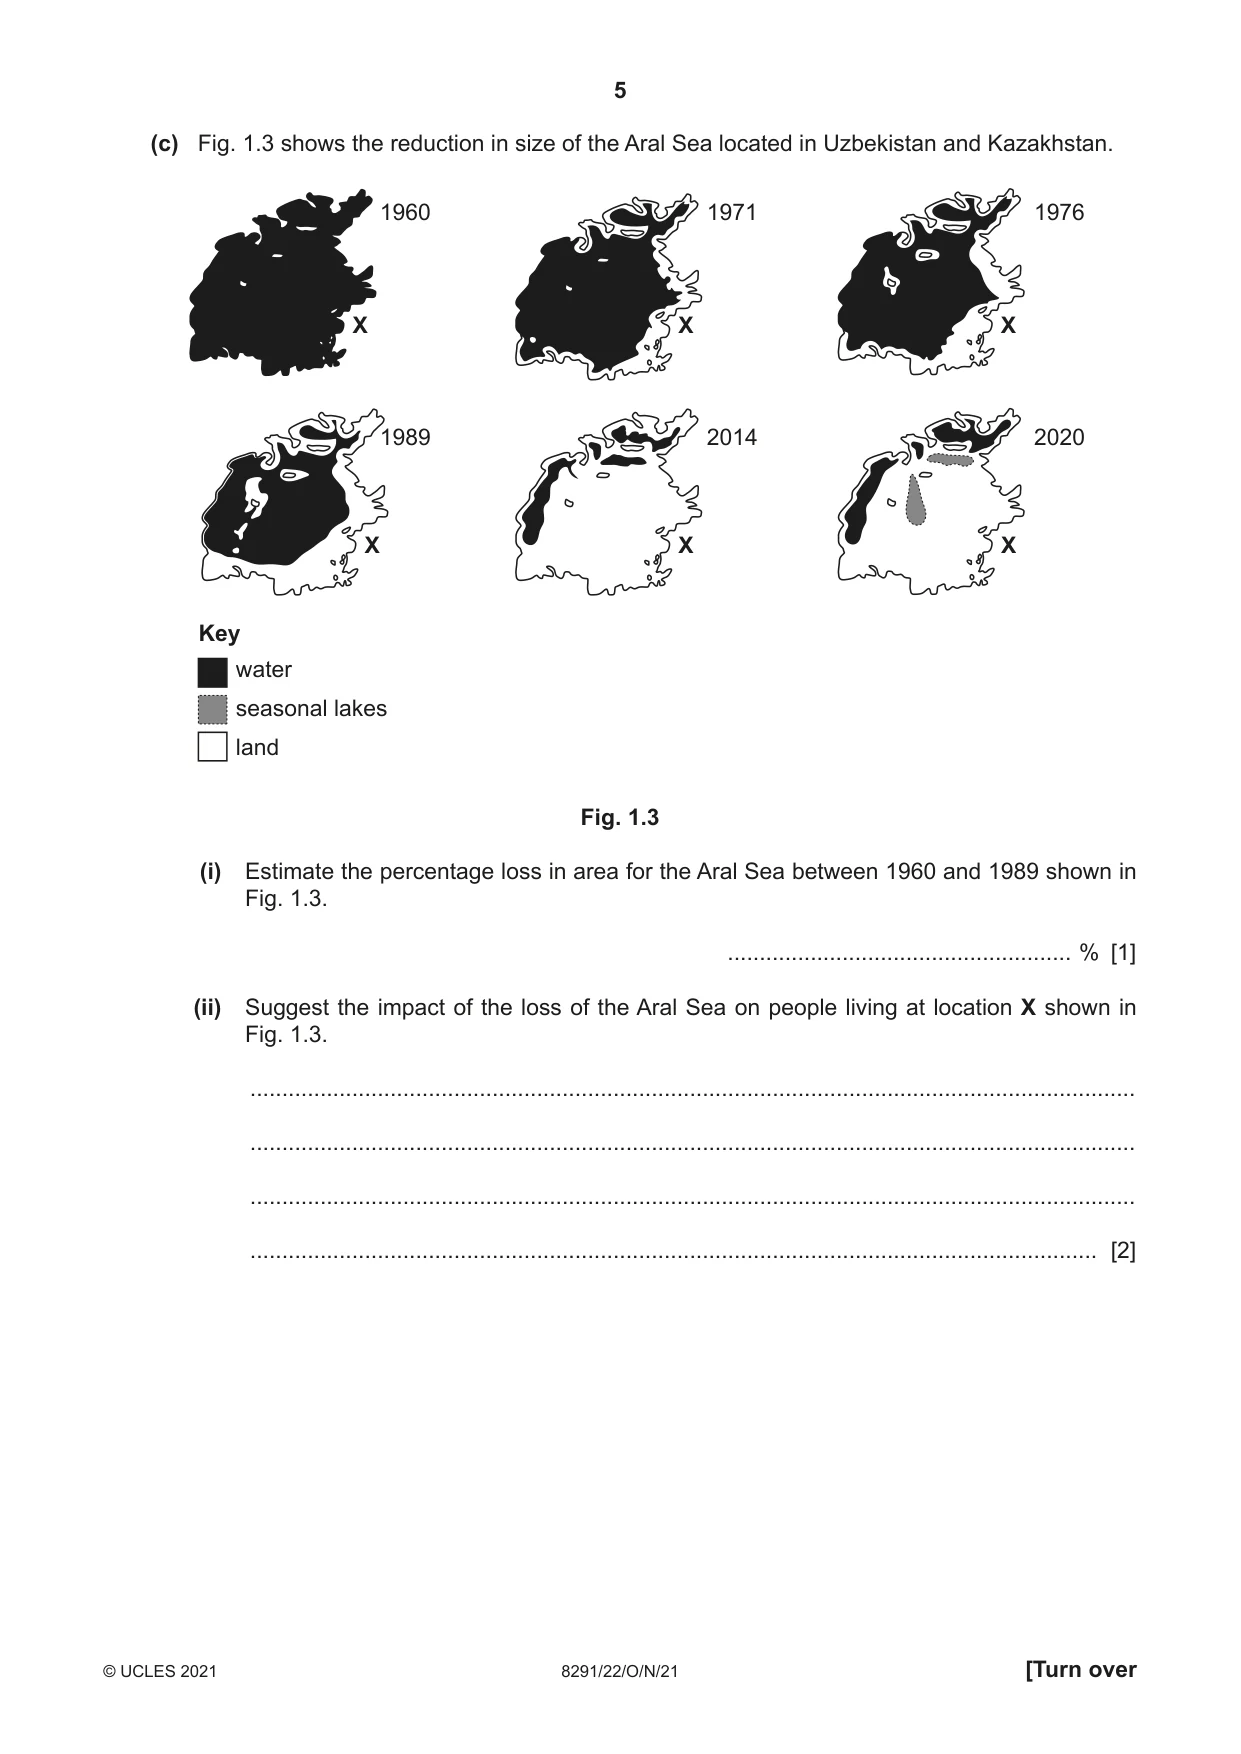
1 (a) Fig. 1.1 shows information about water needed to produce cotton for clothing. Content removed due to copyright restrictions. Fig. 1.1 (i) Calculate the volume of water in litres used to make jeans for a class of 30 students. ................................................. litres [1] (ii) A volume of 75 000 litres of water is used to produce t-shirts for a class of students. Calculate the number of people for which this volume would provide drinking water for one year. .......................................................... [2] (iii) Describe the impact of growing cotton on water stores and flows. Use information from Fig. 1.1 to support your answer. ........................................................................................................................................... ........................................................................................................................................... ........................................................................................................................................... ........................................................................................................................................... ........................................................................................................................................... ........................................................................................................................................... ........................................................................................................................................... ..................................................................................................................................... [4] (b) Fig. 1.2 shows the level of water stress in the top ten cotton producing countries. Water stress is when the demand for water exceeds supply. very high water high stress medium moderate low (#1) (#2) (#3) (#4) (#5) (#6) (#7) (#8) (#9) (#10) Greece India China USAPakistan BrazilUzbekistanAustralia TurkeyArgentina cotton producing countries in decreasing order Fig. 1.2 (i) Discuss what is shown by the data in Fig. 1.2. ........................................................................................................................................... ........................................................................................................................................... ........................................................................................................................................... ..................................................................................................................................... [3] (ii) Water use for China in 2019 was 598.1 billion m3. The total renewable water resources available in 2019 were 2840 billion m3. Calculate the water stress for China in 2019. Use the formula: water stress = (water use ÷ total renewable water resources available) × 100 ...................................................... % [1] (c) Fig. 1.3 shows the reduction in size of the Aral Sea located in Uzbekistan and Kazakhstan. 1960 1971 1976 X X X 1989 2014 2020 X X X Key water seasonal lakes land Fig. 1.3 (i) Estimate the percentage loss in area for the Aral Sea between 1960 and 1989 shown in Fig. 1.3. ...................................................... % [1] (ii) Suggest the impact of the loss of the Aral Sea on people living at location X shown in Fig. 1.3. ........................................................................................................................................... ........................................................................................................................................... ........................................................................................................................................... ..................................................................................................................................... [2] (iii) A new dam project is planned to divert water to help increase water levels in the Aral Sea. Suggest reasons why people may object to the construction of a dam. ........................................................................................................................................... ........................................................................................................................................... ........................................................................................................................................... ........................................................................................................................................... ........................................................................................................................................... ..................................................................................................................................... [3] (d) Growing cotton uses more pesticides than any other crop. Suggest the negative impacts of pesticide use. ................................................................................................................................................... ................................................................................................................................................... ................................................................................................................................................... ................................................................................................................................................... ................................................................................................................................................... ............................................................................................................................................. [3] [Total: 20]
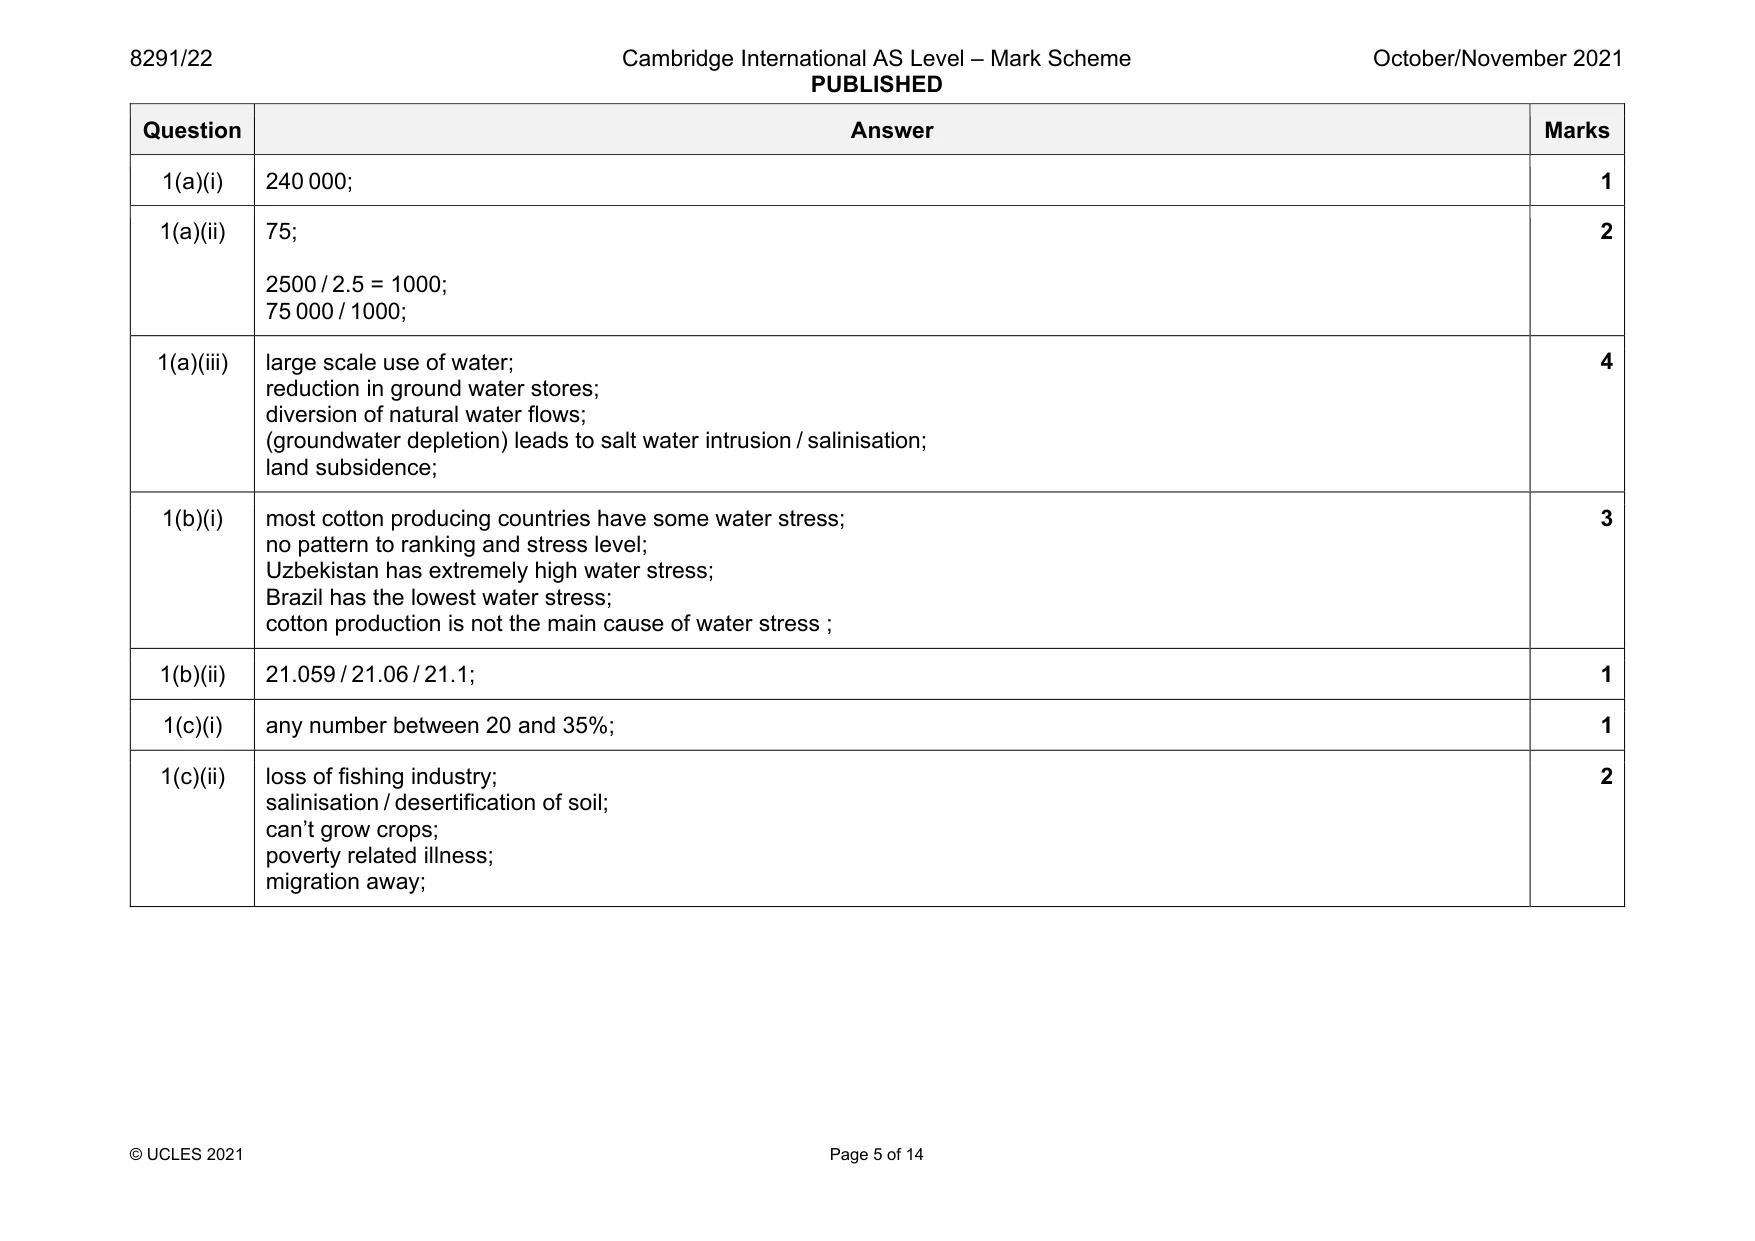
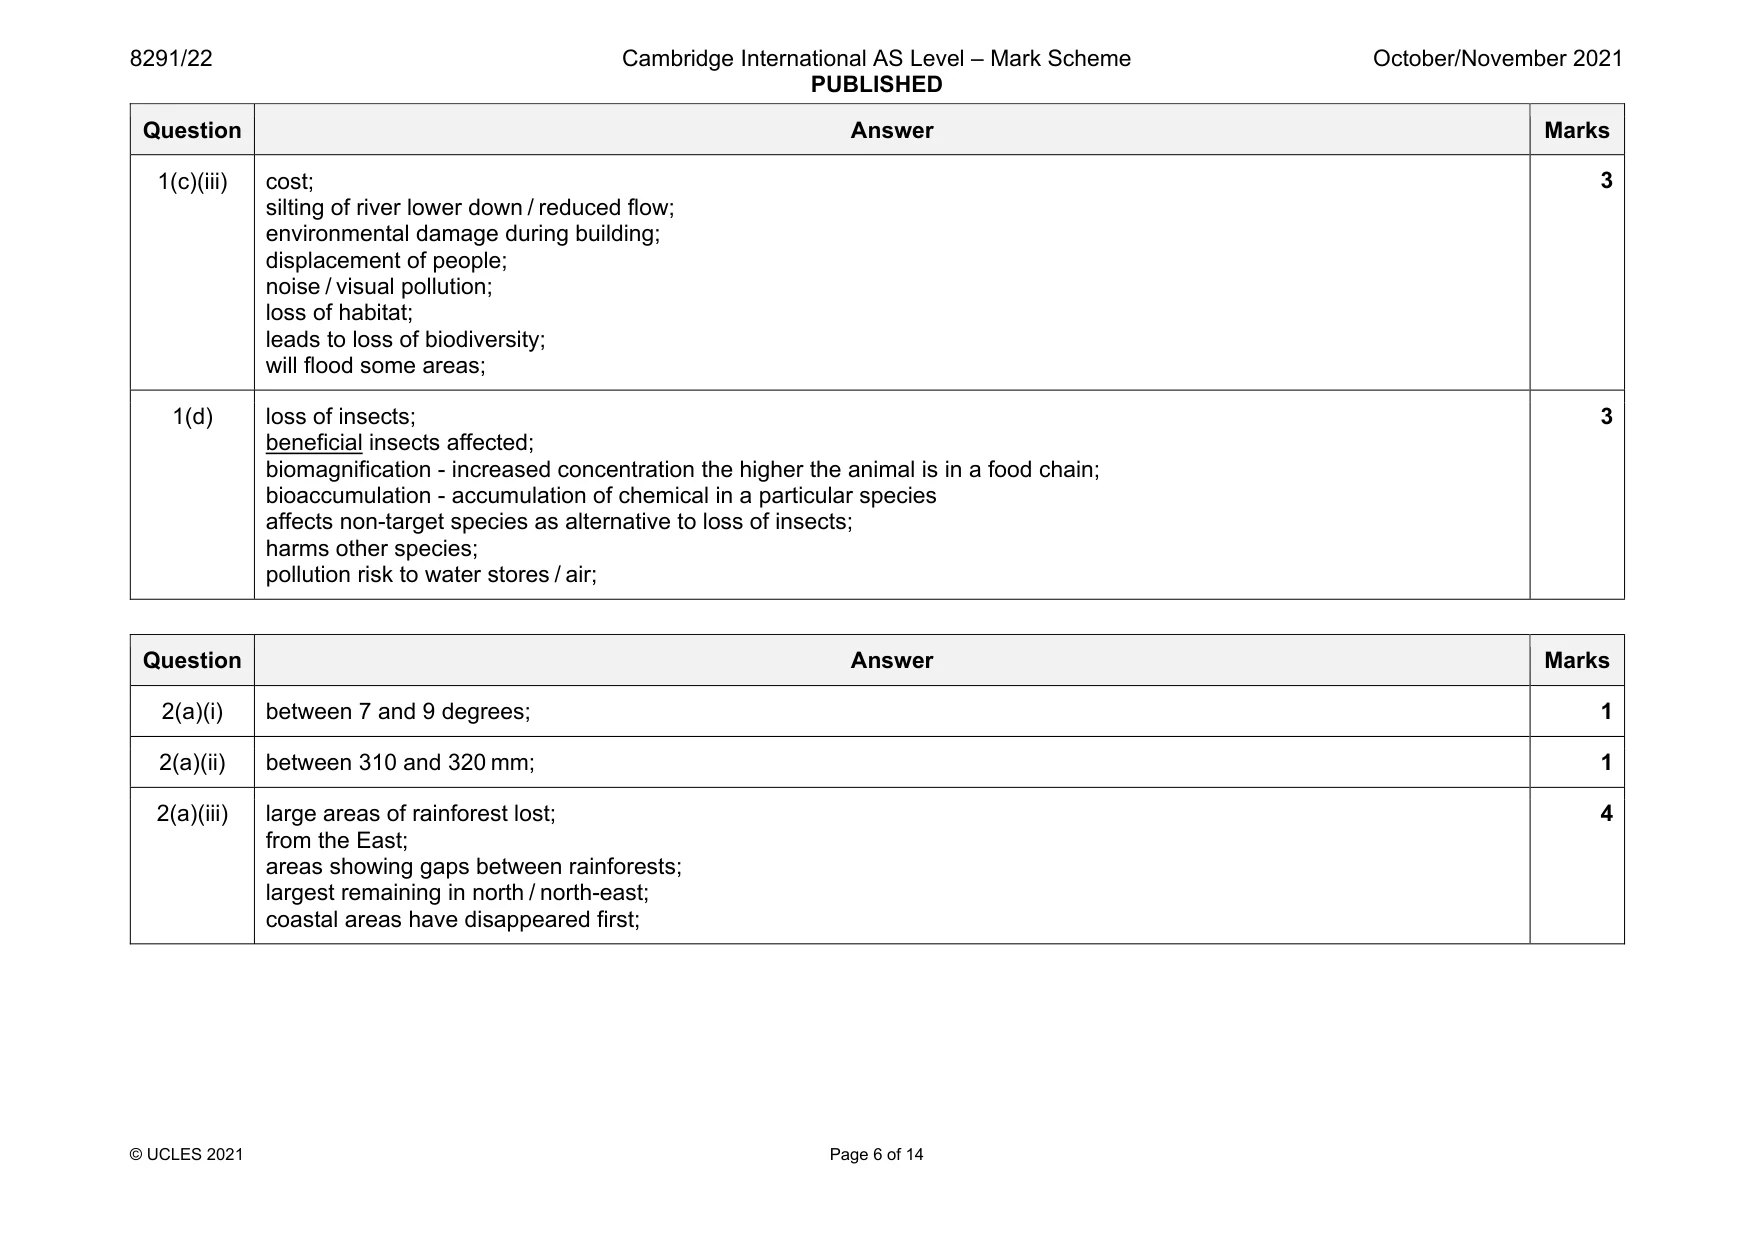
Mark scheme: 1(a)(i) 240 000; 1 1(a)(ii) 75; 2500 / 2.5 = 1000; 75 000 / 1000; 2 1(a)(iii) large scale use of water; reduction in ground water stores; diversion of natural water flows; (groundwater depletion) leads to salt water intrusion / salinisation; land subsidence; 4 1(b)(i) most cotton producing countries have some water stress; no pattern to ranking and stress level; Uzbekistan has extremely high water stress; Brazil has the lowest water stress; cotton production is not the main cause of water stress ; 3 1(b)(ii) 21.059 / 21.06 / 21.1; 1 1(c)(i) any number between 20 and 35%; 1 1(c)(ii) loss of fishing industry; salinisation / desertification of soil; can’t grow crops; poverty related illness; migration away; 2 Question Answer Marks 1(c)(iii) cost; silting of river lower down / reduced flow; environmental damage during building; displacement of people; noise / visual pollution; loss of habitat; leads to loss of biodiversity; will flood some areas; 3 1(d) loss of insects; beneficial insects affected; biomagnification - increased concentration the higher the animal is in a food chain; bioaccumulation - accumulation of chemical in a particular species affects non-target species as alternative to loss of insects; harms other species; pollution risk to water stores / air; 3
Q2 · An annual climate graph for Madagascar and the changes in the area of the Madagascar…
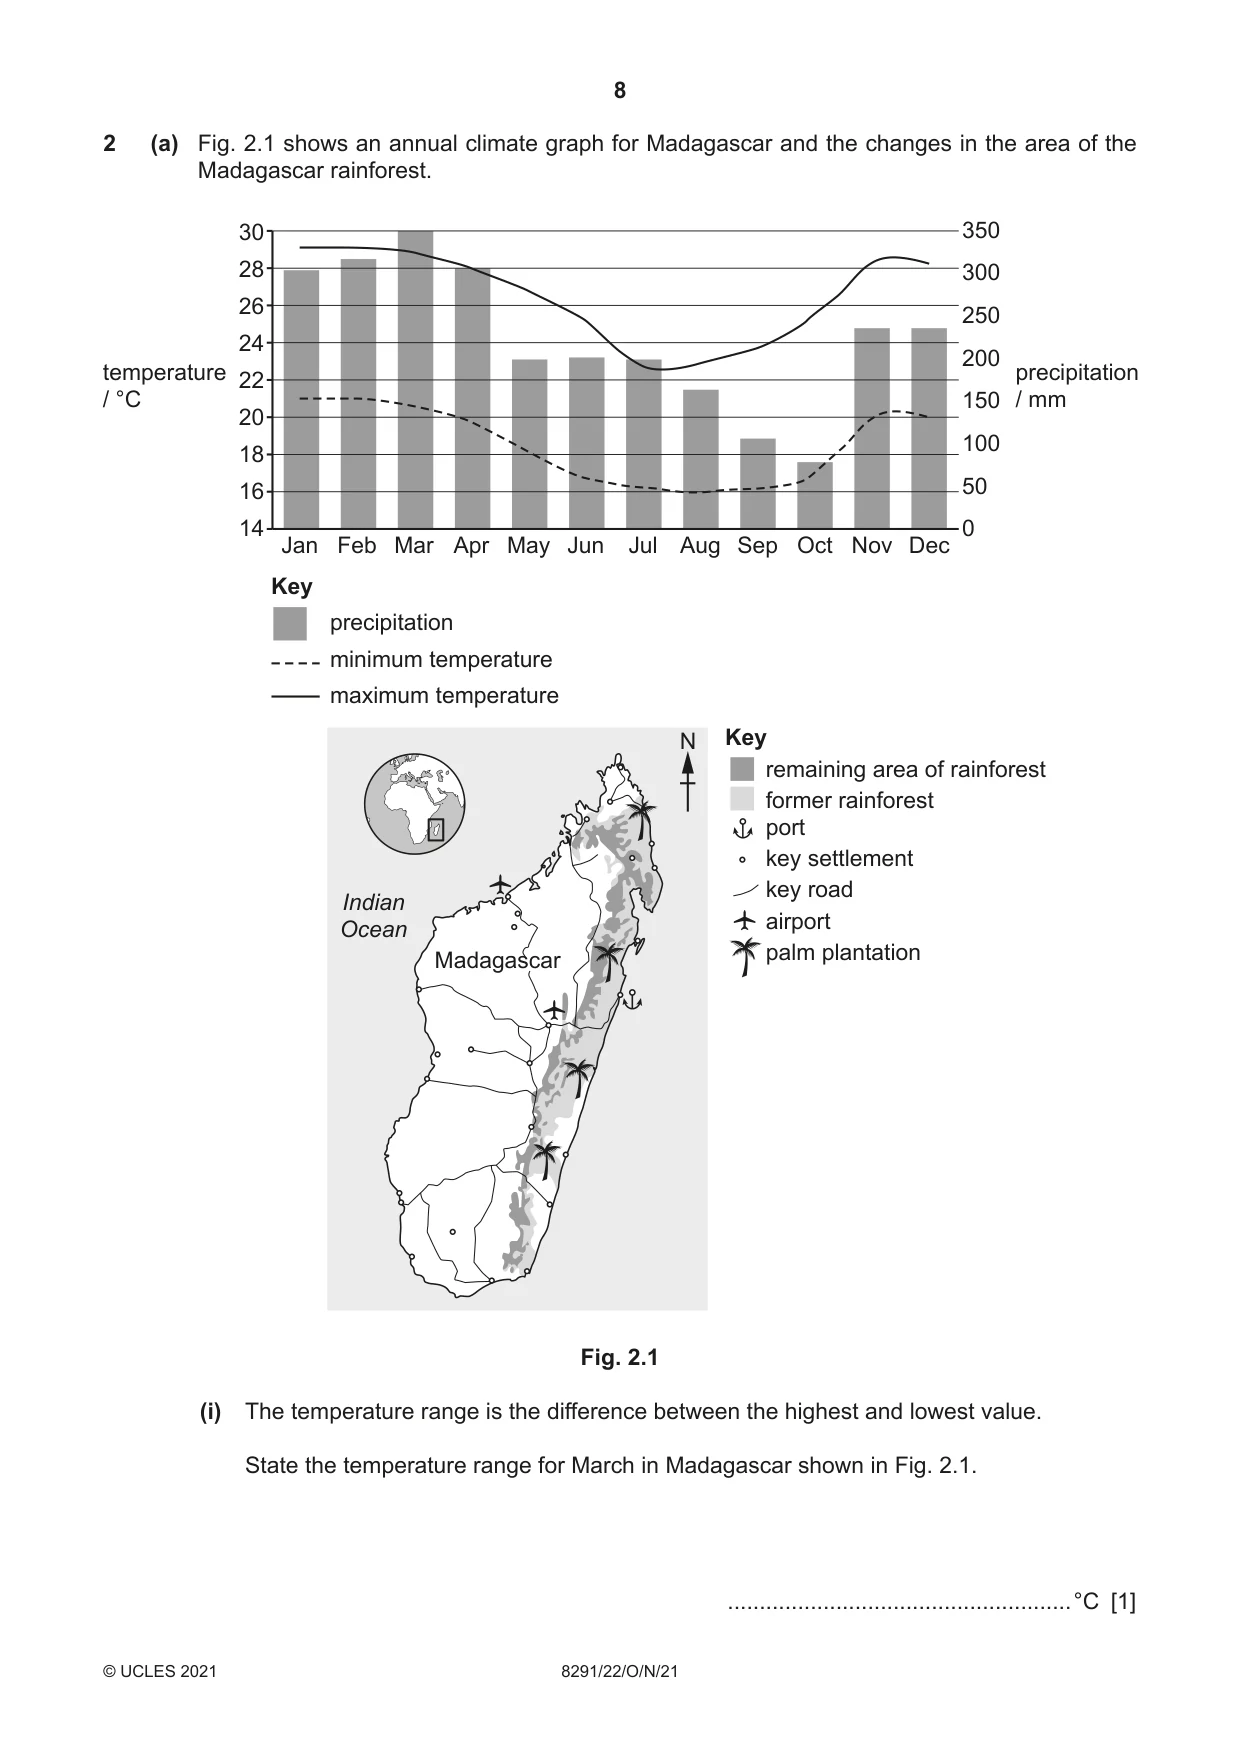
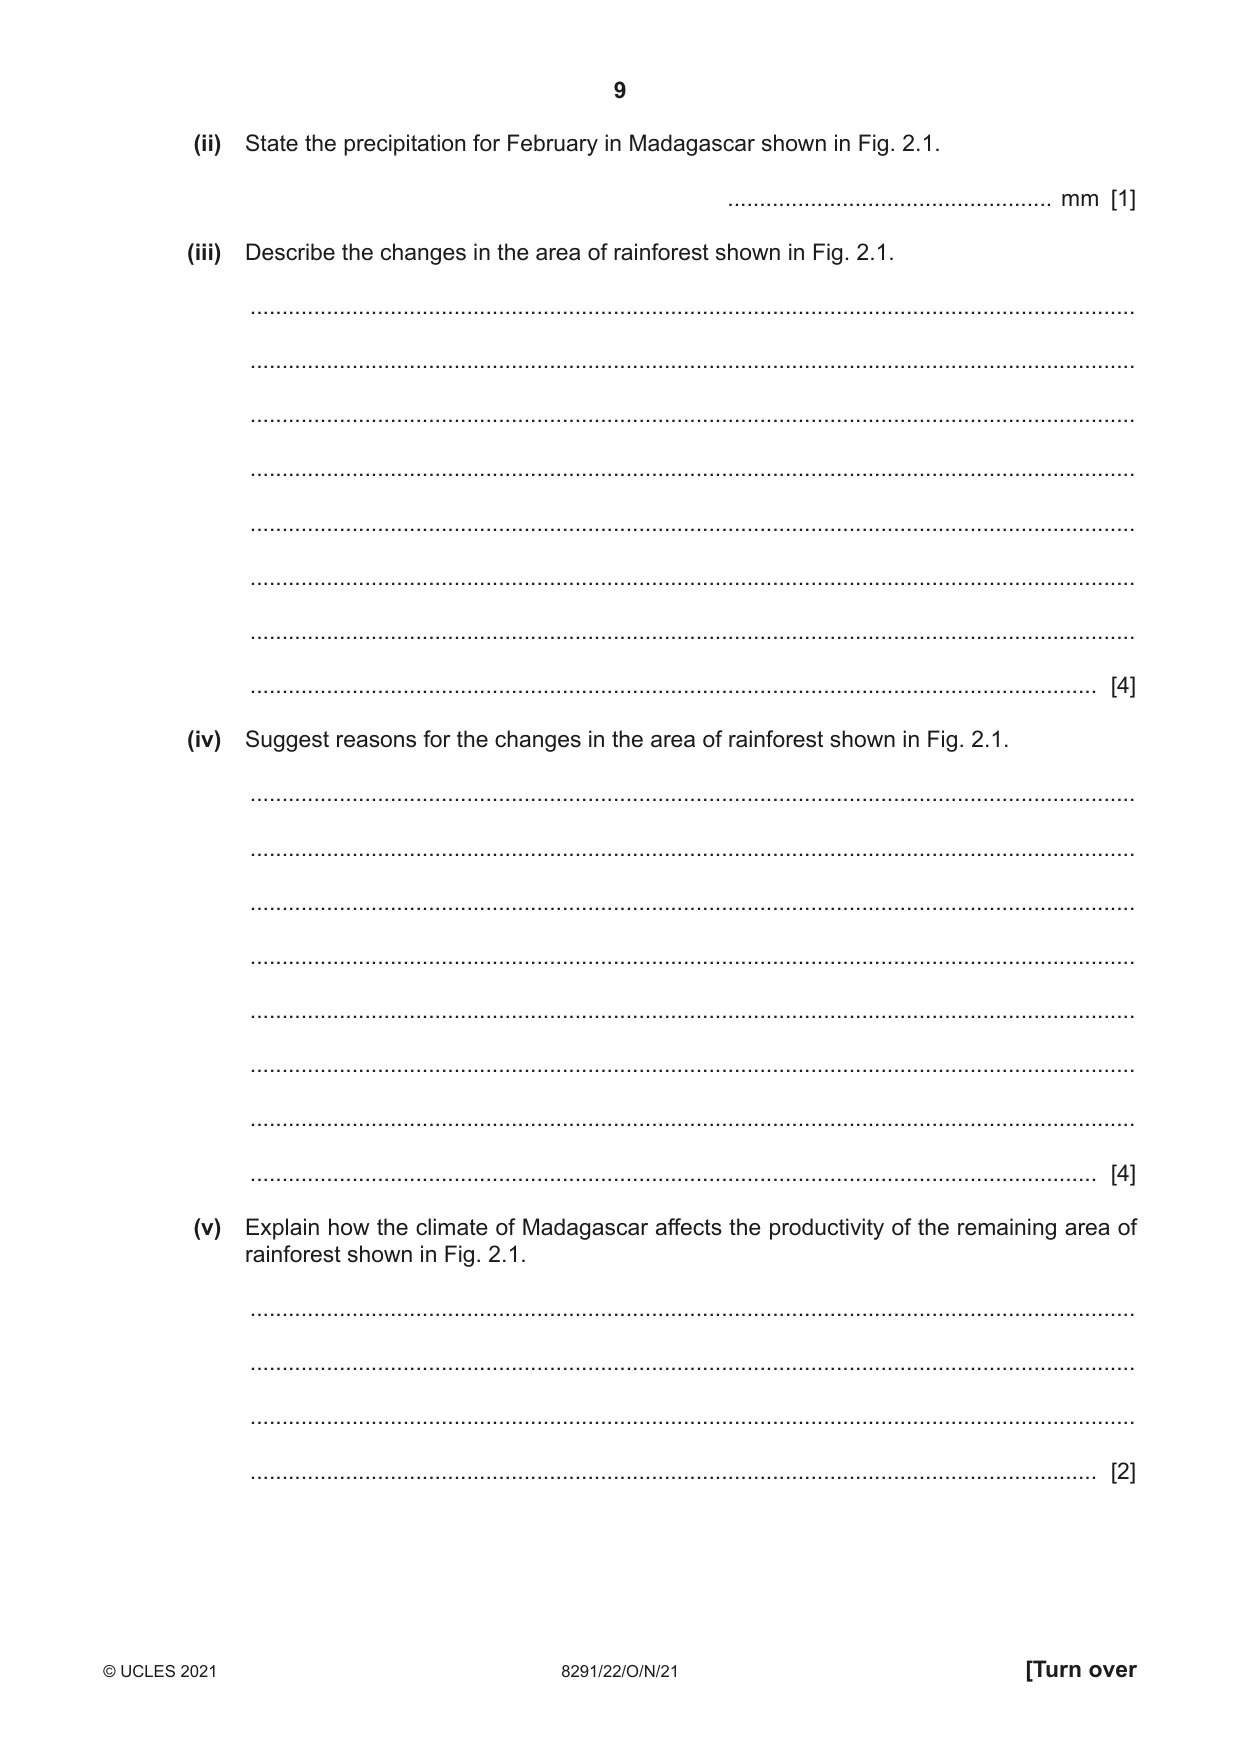
2 (a) Fig. 2.1 shows an annual climate graph for Madagascar and the changes in the area of the Madagascar rainforest. 30 350 28 300 26 250 24 200temperature precipitation 22 / °C 150 / mm 20 100 18 16 50 14 0 Jan Feb Mar Apr May Jun Jul Aug Sep Oct Nov Dec Key precipitation minimum temperature maximum temperature N Key remaining area of rainforest former rainforest port key settlement key road Indian airport Ocean palm plantation Madagascar Fig. 2.1 (i) The temperature range is the difference between the highest and lowest value. State the temperature range for March in Madagascar shown in Fig. 2.1. ......................................................°C [1] (ii) State the precipitation for February in Madagascar shown in Fig. 2.1. ................................................... mm [1] (iii) Describe the changes in the area of rainforest shown in Fig. 2.1. ........................................................................................................................................... ........................................................................................................................................... ........................................................................................................................................... ........................................................................................................................................... ........................................................................................................................................... ........................................................................................................................................... ........................................................................................................................................... ..................................................................................................................................... [4] (iv) Suggest reasons for the changes in the area of rainforest shown in Fig. 2.1. ........................................................................................................................................... ........................................................................................................................................... ........................................................................................................................................... ........................................................................................................................................... ........................................................................................................................................... ........................................................................................................................................... ........................................................................................................................................... ..................................................................................................................................... [4] (v) Explain how the climate of Madagascar affects the productivity of the remaining area of rainforest shown in Fig. 2.1. ........................................................................................................................................... ........................................................................................................................................... ........................................................................................................................................... ..................................................................................................................................... [2] (b) Soil quality has decreased in some parts of Madagascar. Explain the impacts of decreased soil quality on vegetation. ................................................................................................................................................... ................................................................................................................................................... ................................................................................................................................................... ................................................................................................................................................... ................................................................................................................................................... ................................................................................................................................................... ................................................................................................................................................... ............................................................................................................................................. [4] (c) Suggest strategies to sustainably manage rainforests in less economically developed countries (LEDCs). ................................................................................................................................................... ................................................................................................................................................... ................................................................................................................................................... ................................................................................................................................................... ................................................................................................................................................... ................................................................................................................................................... ................................................................................................................................................... ............................................................................................................................................. [4] [Total: 20]
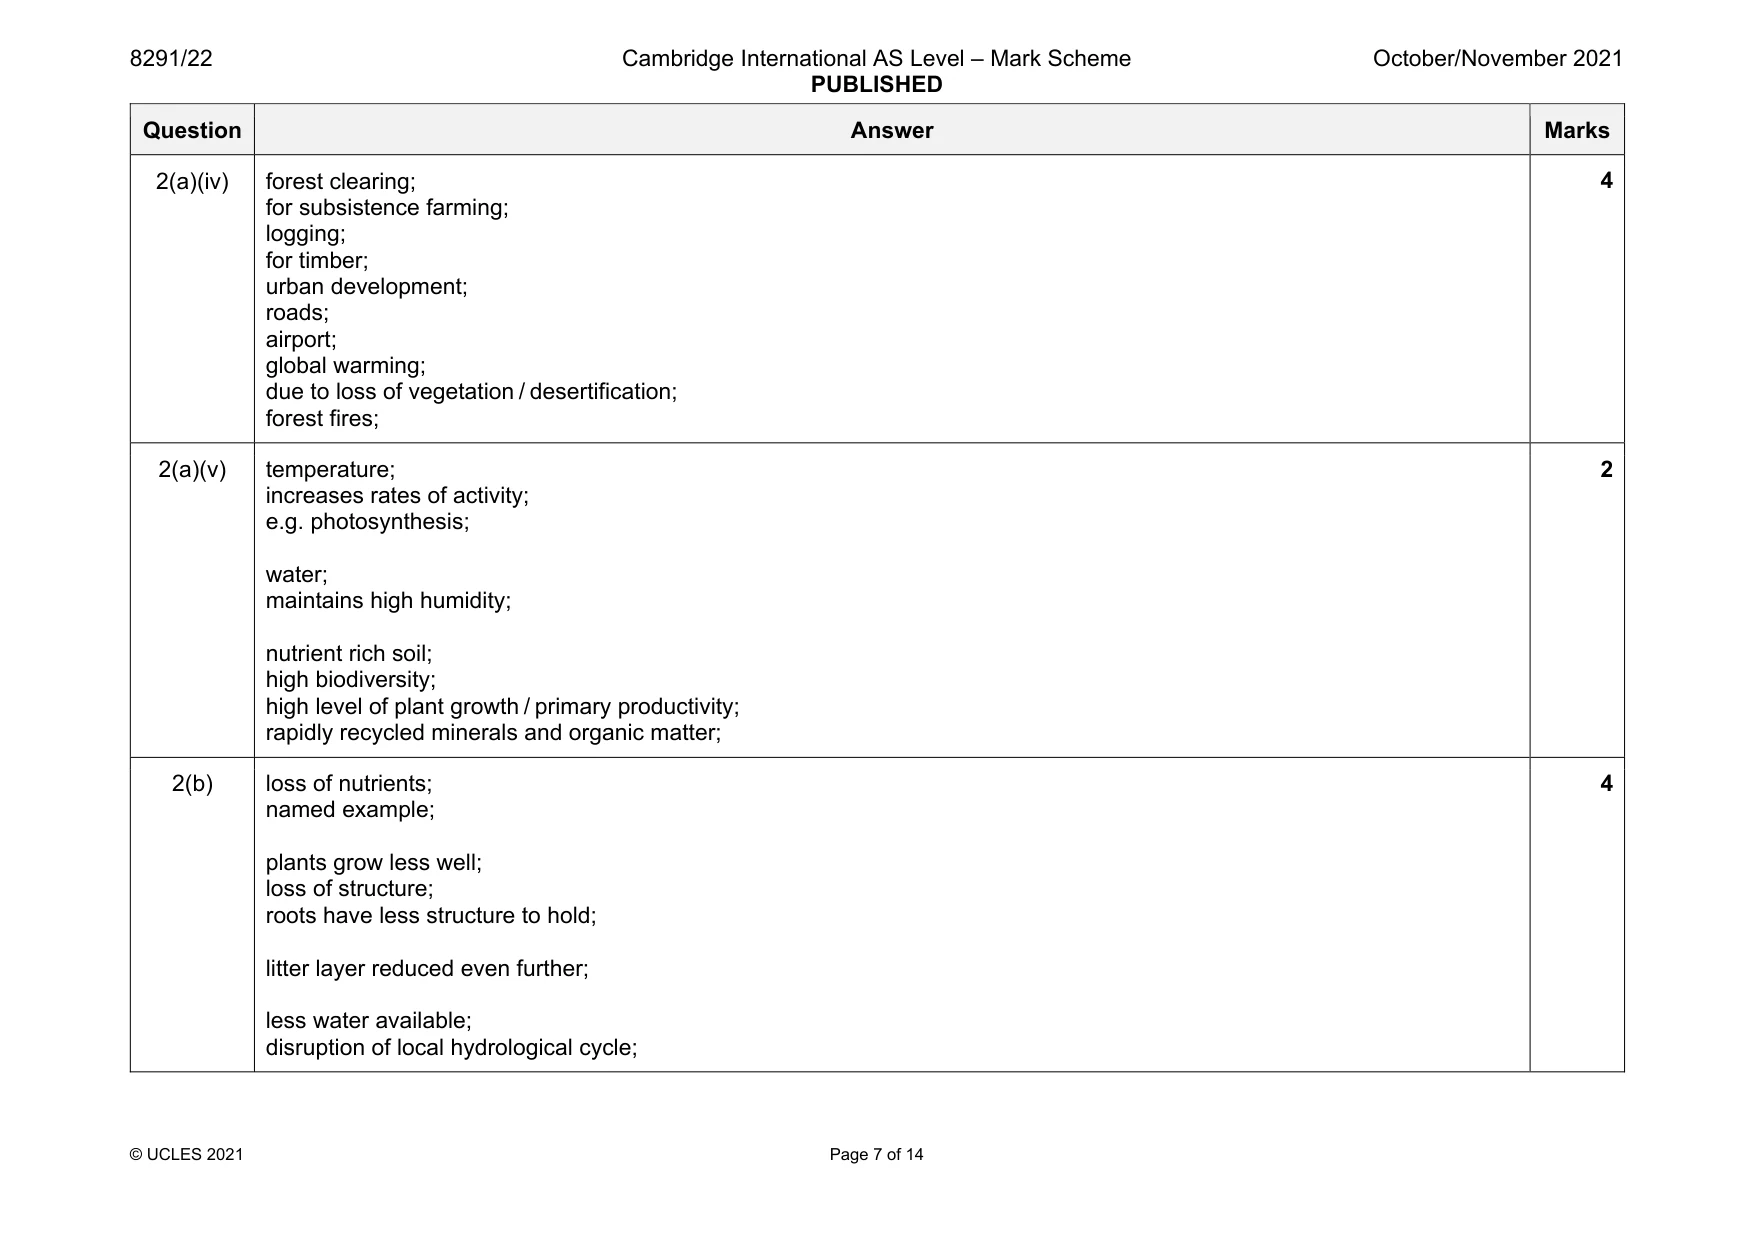
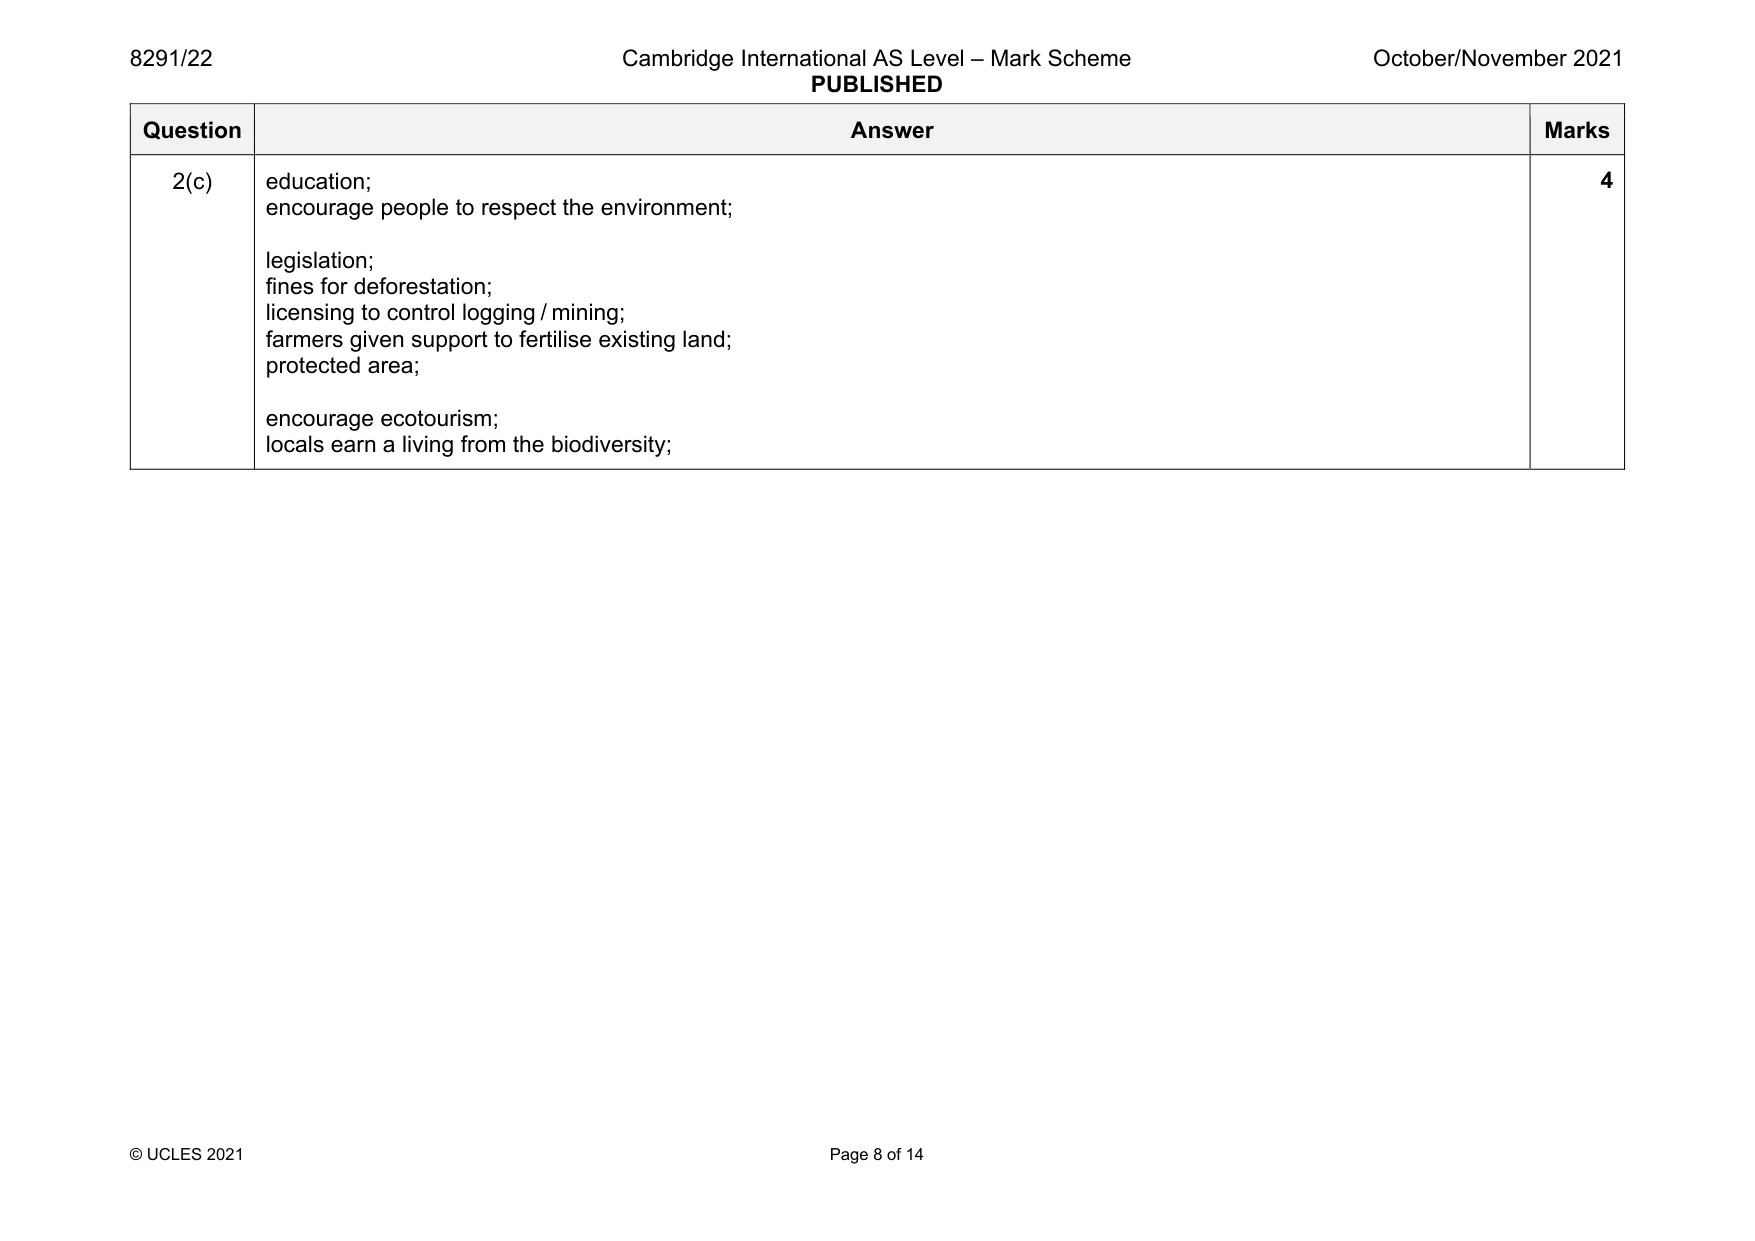
Mark scheme: 2(a)(i) between 7 and 9 degrees; 1 2(a)(ii) between 310 and 320 mm; 1 2(a)(iii) large areas of rainforest lost; from the East; areas showing gaps between rainforests; largest remaining in north / north-east; coastal areas have disappeared first; 4 Question Answer Marks 2(a)(iv) forest clearing; for subsistence farming; logging; for timber; urban development; roads; airport; global warming; due to loss of vegetation / desertification; forest fires; 4 2(a)(v) temperature; increases rates of activity; e.g. photosynthesis; water; maintains high humidity; nutrient rich soil; high biodiversity; high level of plant growth / primary productivity; rapidly recycled minerals and organic matter; 2 2(b) loss of nutrients; named example; plants grow less well; loss of structure; roots have less structure to hold; litter layer reduced even further; less water available; disruption of local hydrological cycle; 4 Question Answer Marks 2(c) education; encourage people to respect the environment; legislation; fines for deforestation; licensing to control logging / mining; farmers given support to fertilise existing land; protected area; encourage ecotourism; locals earn a living from the biodiversity; 4
More questions on Data collection techniques and data analysis
Q3 · Information about ecotourism in Costa Rica
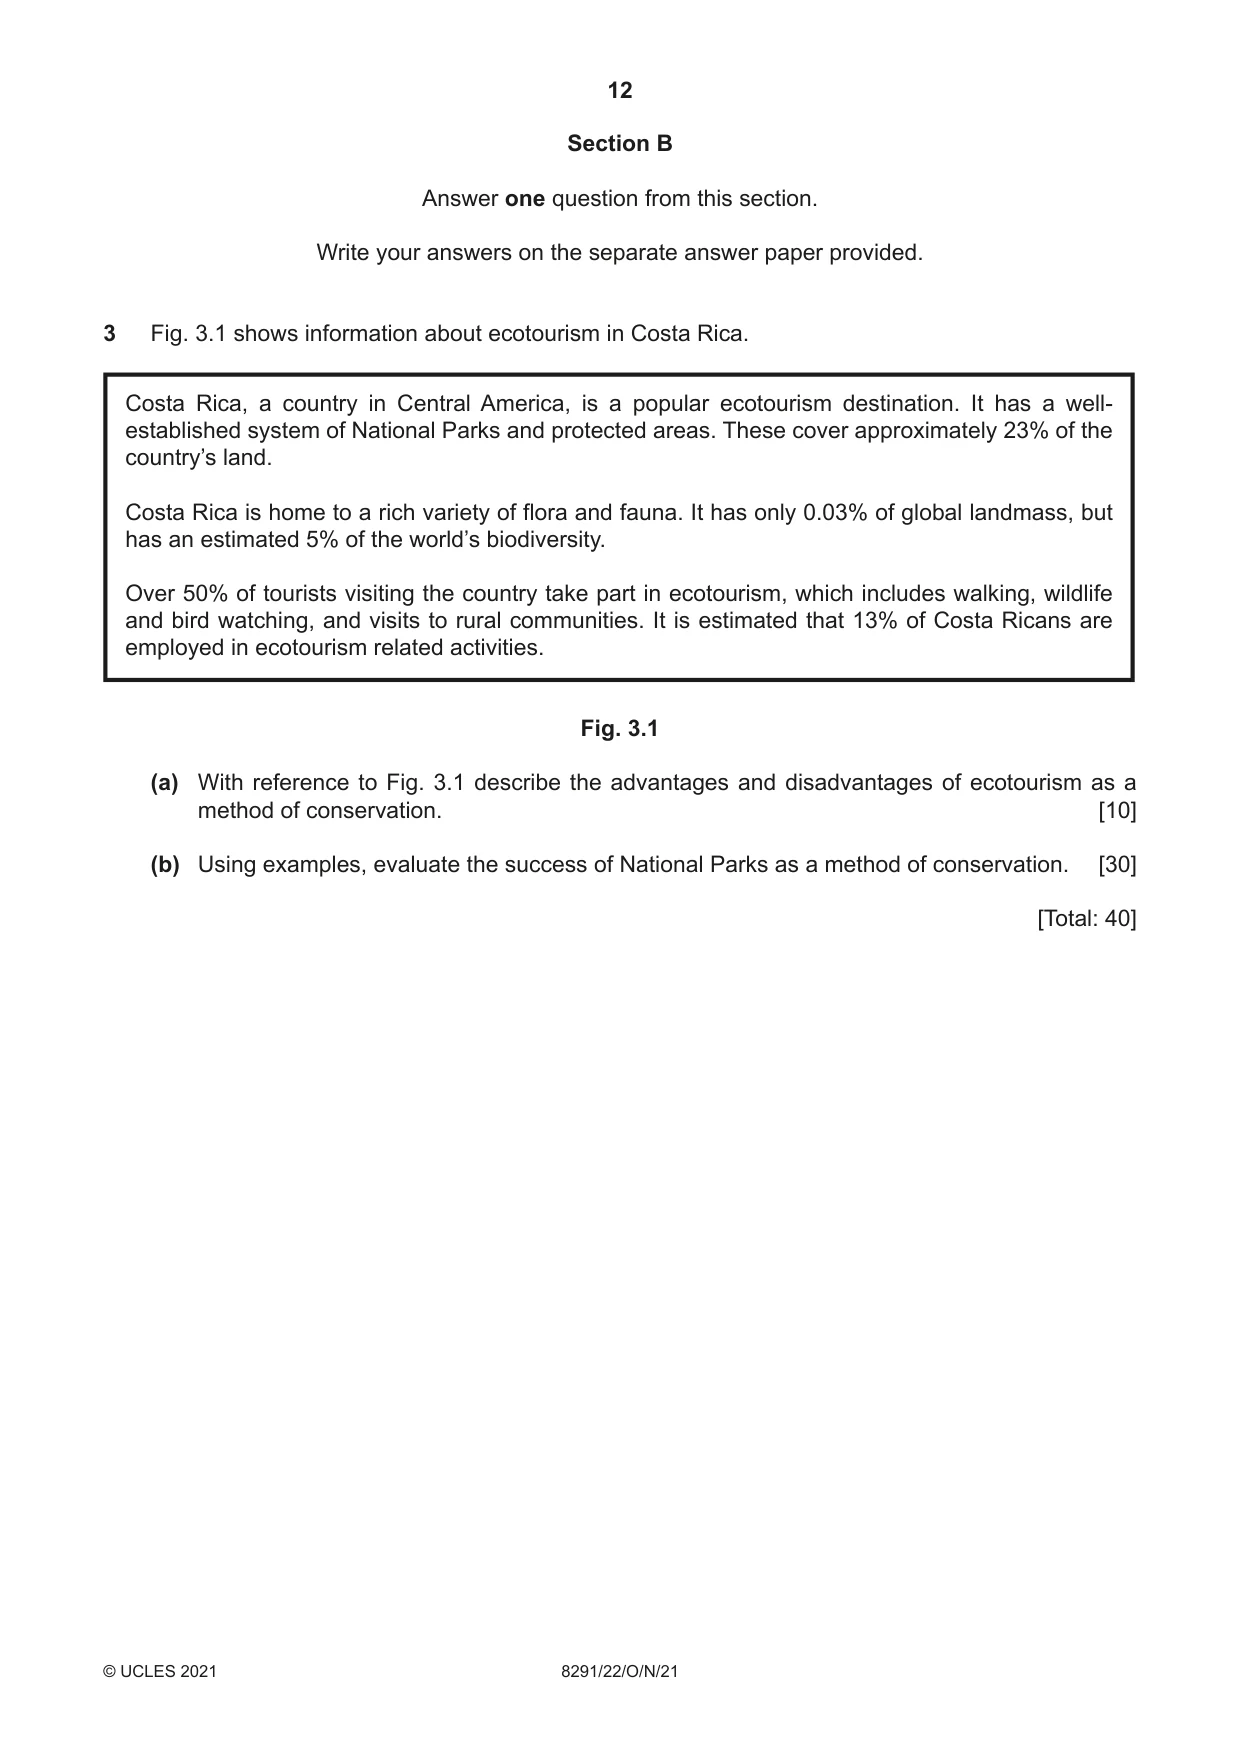
3 Fig. 3.1 shows information about ecotourism in Costa Rica. Costa Rica, a country in Central America, is a popular ecotourism destination. It has a well- established system of National Parks and protected areas. These cover approximately 23% of the country’s land. Costa Rica is home to a rich variety of flora and fauna. It has only 0.03% of global landmass, but has an estimated 5% of the world’s biodiversity. Over 50% of tourists visiting the country take part in ecotourism, which includes walking, wildlife and bird watching, and visits to rural communities. It is estimated that 13% of Costa Ricans are employed in ecotourism related activities. Fig. 3.1 (a) With reference to Fig. 3.1 describe the advantages and disadvantages of ecotourism as a method of conservation. [10] (b) Using examples, evaluate the success of National Parks as a method of conservation. [30] [Total: 40]
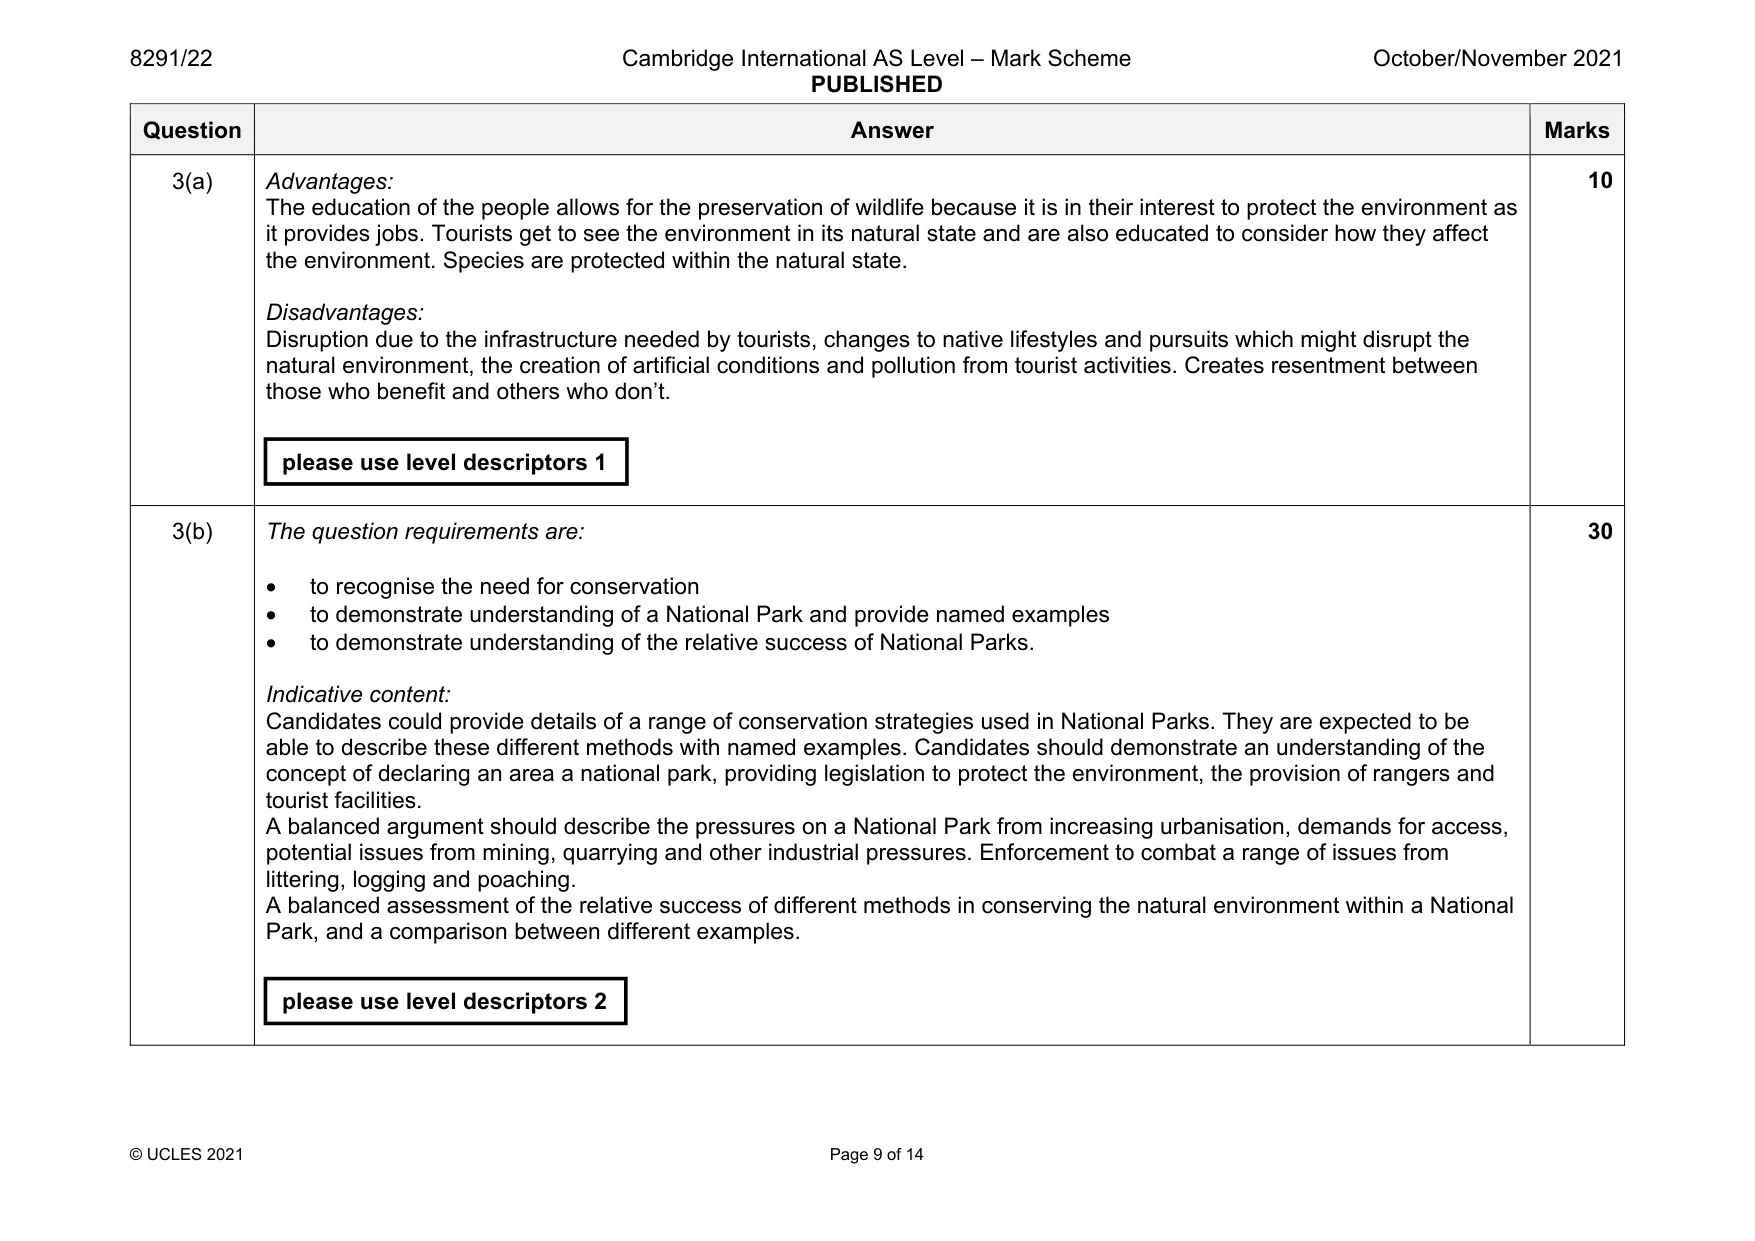
Mark scheme: 3(a) Advantages: The education of the people allows for the preservation of wildlife because it is in their interest to protect the environment as it provides jobs. Tourists get to see the environment in its natural state and are also educated to consider how they affect the environment. Species are protected within the natural state. Disadvantages: Disruption due to the infrastructure needed by tourists, changes to native lifestyles and pursuits which might disrupt the natural environment, the creation of artificial conditions and pollution from tourist activities. Creates resentment between those who benefit and others who don’t. 3(b) The question requirements are: • to recognise the need for conservation • to demonstrate understanding of a National Park and provide named examples • to demonstrate understanding of the relative success of National Parks. Indicative content: Candidates could provide details of a range of conservation strategies used in National Parks. They are expected to be able to describe these different methods with named examples. Candidates should demonstrate an understanding of the concept of declaring an area a national park, providing legislation to protect the environment, the provision of rangers and tourist facilities. A balanced argument should describe the pressures on a National Park from increasing urbanisation, demands for access, potential issues from mining, quarrying and other industrial pressures. Enforcement to combat a range of issues from littering, logging and poaching. A balanced assessment of the relative success of different methods in conserving the natural environment within a National Park, and a comparison between different examples. 30 please use level descriptors 1 please use level descriptors 2
Q4 · Sea level change using estimates from the past, actual records and predictions for the…
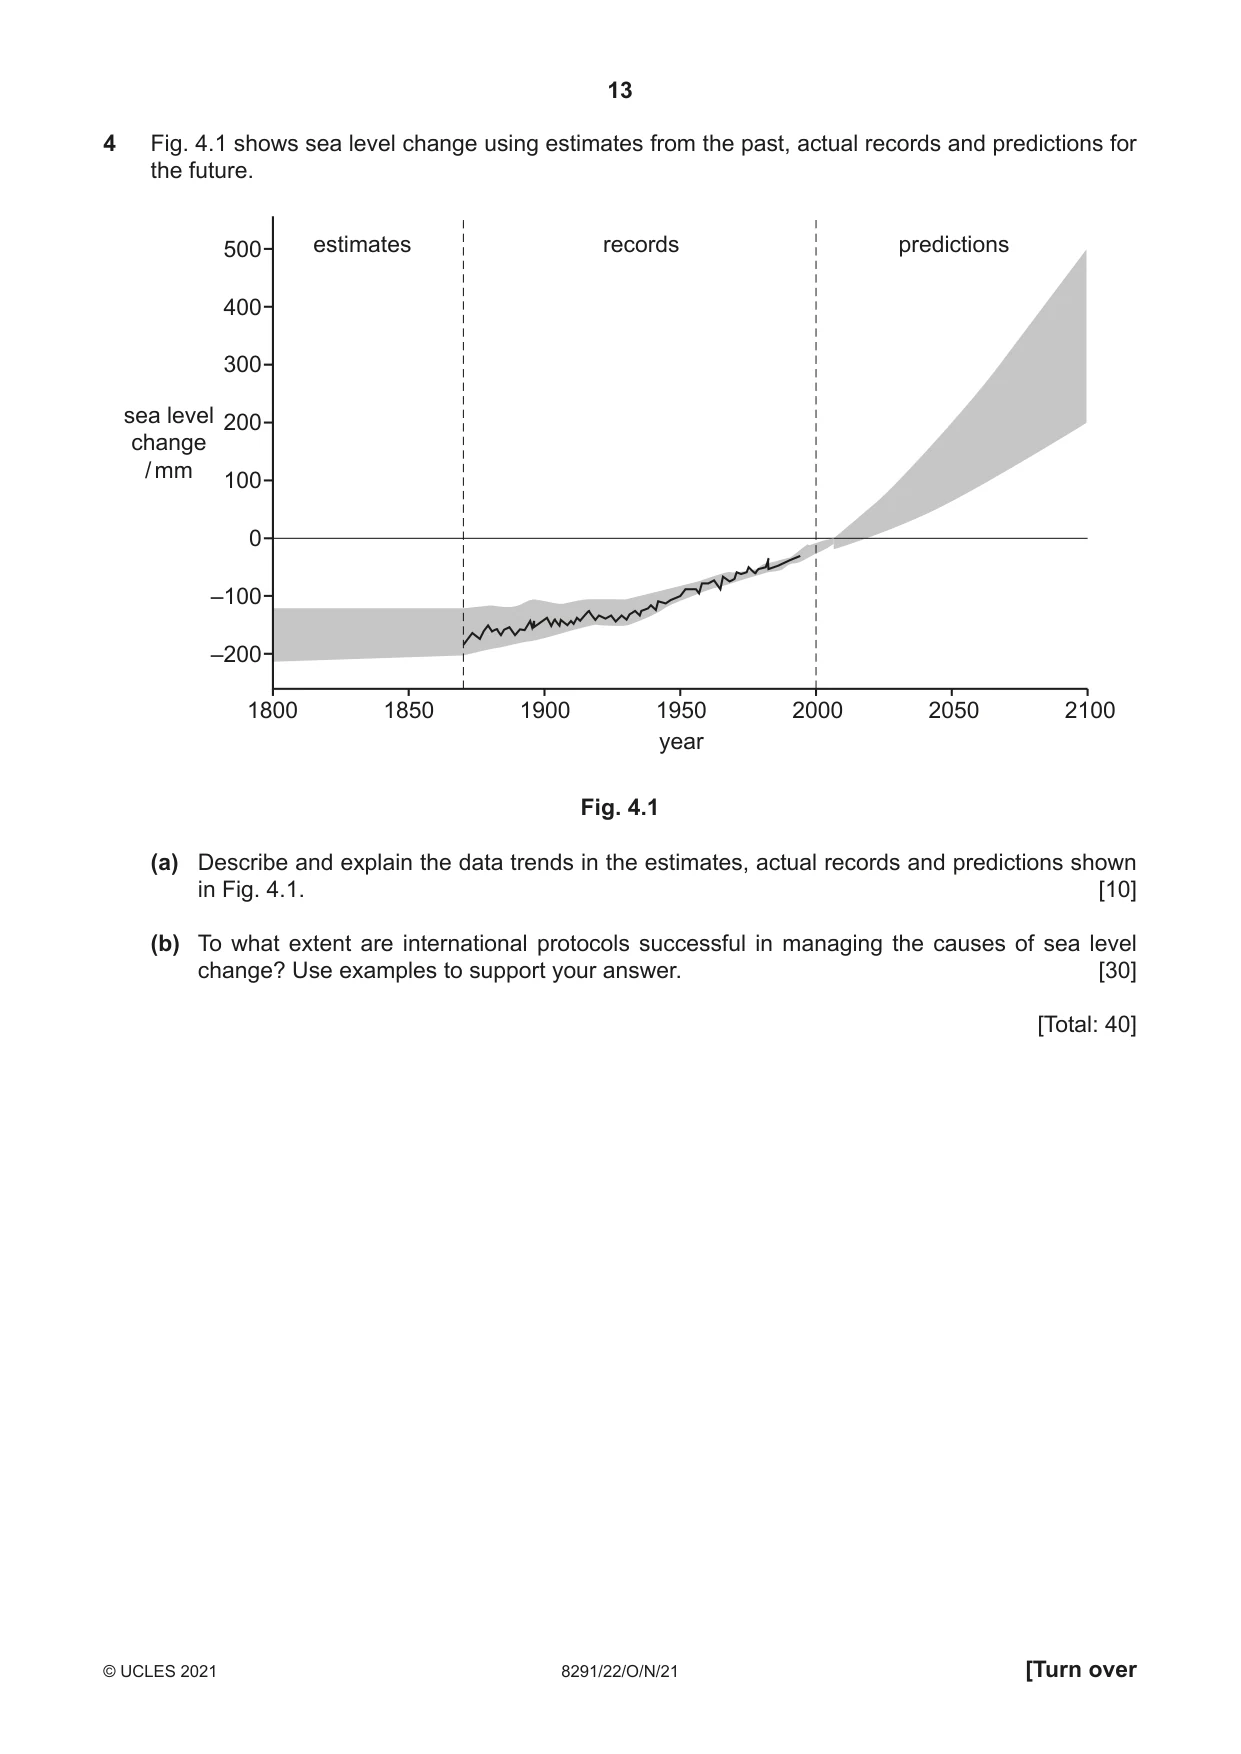
4 Fig. 4.1 shows sea level change using estimates from the past, actual records and predictions for the future. 500 estimates records predictions 400 300 sea level 200 change / mm 100 0 –100 –200 1800 1850 1900 1950 2000 2050 2100 year Fig. 4.1 (a) Describe and explain the data trends in the estimates, actual records and predictions shown in Fig. 4.1. [10] (b) To what extent are international protocols successful in managing the causes of sea level change? Use examples to support your answer. [30] [Total: 40]
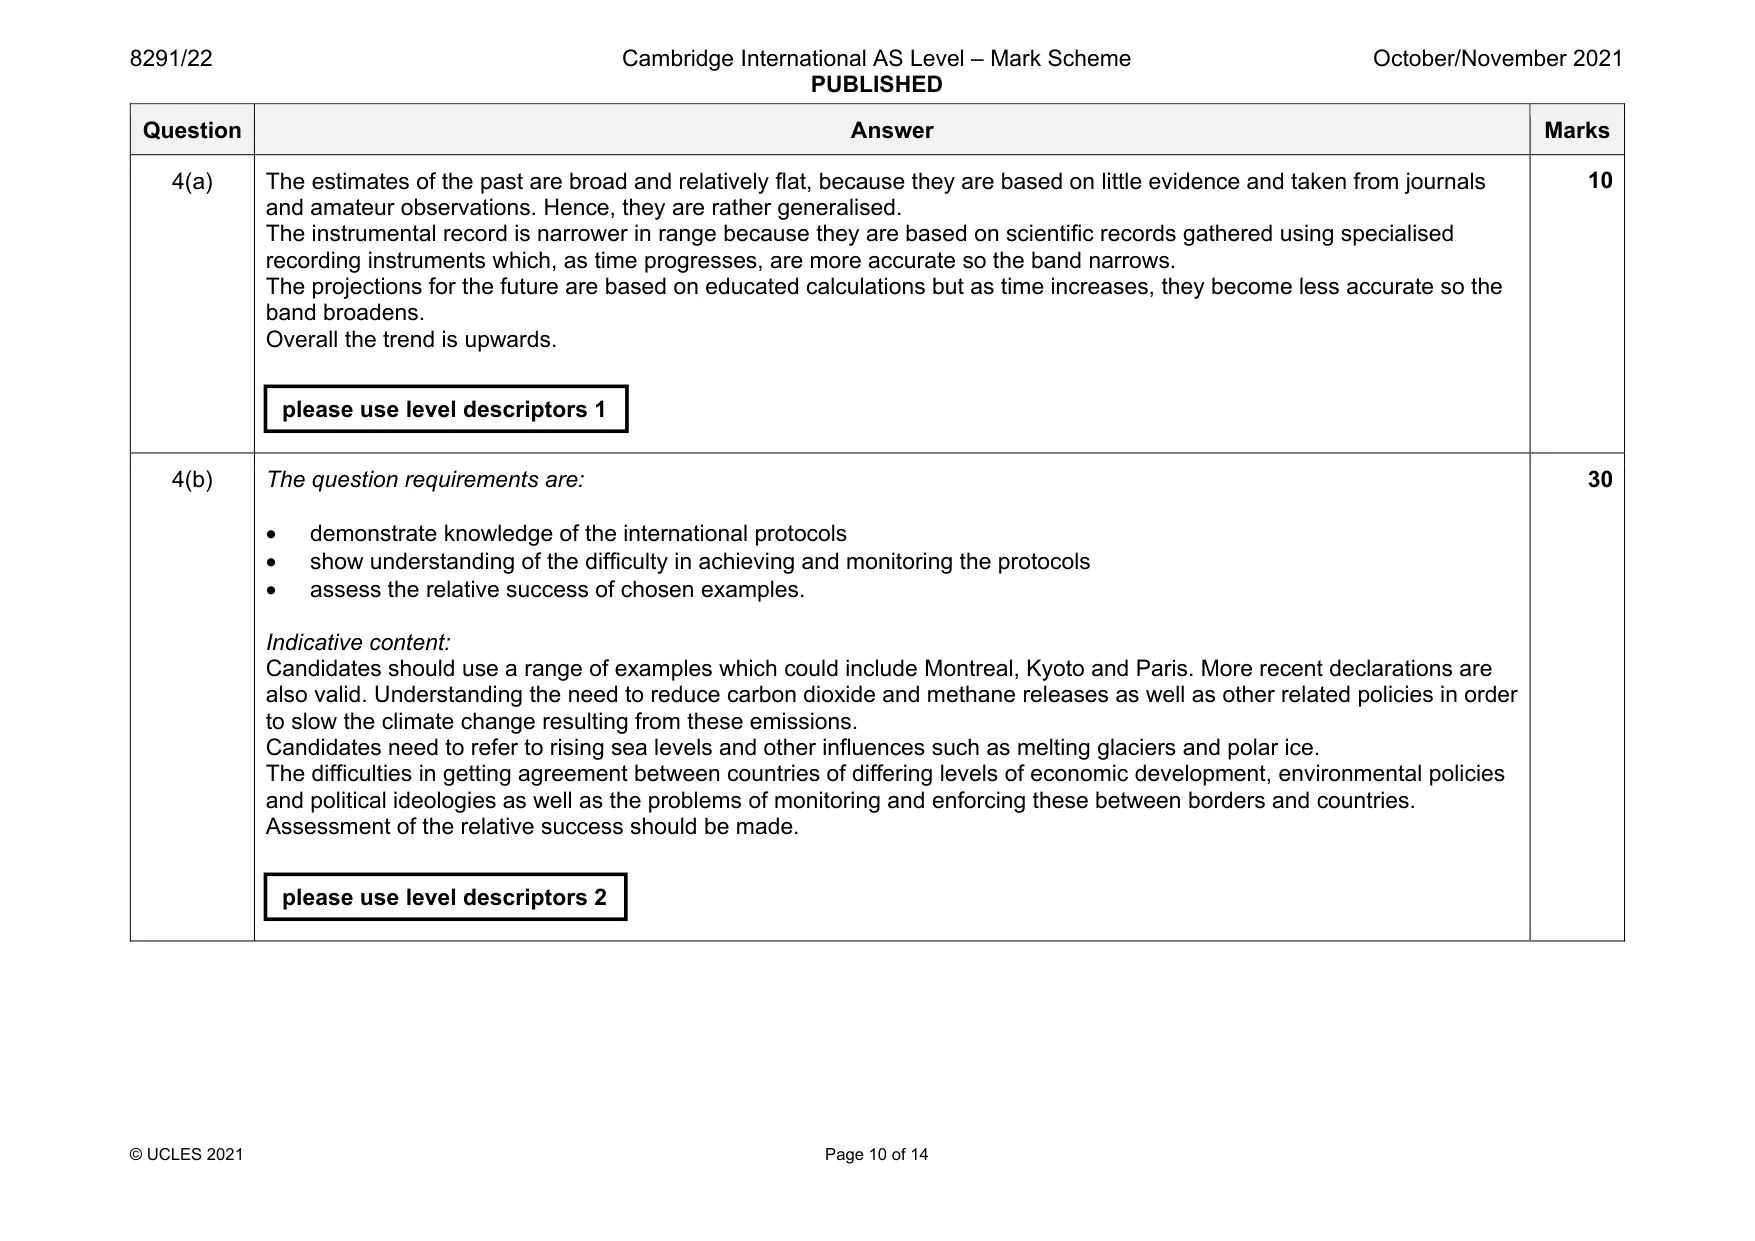
Mark scheme: 4(a) The estimates of the past are broad and relatively flat, because they are based on little evidence and taken from journals and amateur observations. Hence, they are rather generalised. The instrumental record is narrower in range because they are based on scientific records gathered using specialised recording instruments which, as time progresses, are more accurate so the band narrows. The projections for the future are based on educated calculations but as time increases, they become less accurate so the band broadens. Overall the trend is upwards. 4(b) The question requirements are: • demonstrate knowledge of the international protocols • show understanding of the difficulty in achieving and monitoring the protocols • assess the relative success of chosen examples. Indicative content: Candidates should use a range of examples which could include Montreal, Kyoto and Paris. More recent declarations are also valid. Understanding the need to reduce carbon dioxide and methane releases as well as other related policies in order to slow the climate change resulting from these emissions. Candidates need to refer to rising sea levels and other influences such as melting glaciers and polar ice. The difficulties in getting agreement between countries of differing levels of economic development, environmental policies and political ideologies as well as the problems of monitoring and enforcing these between borders and countries. Assessment of the relative success should be made. 30 please use level descriptors 1 please use level descriptors 2
Q5 · Predicted percentage change in human population by continent from 2019 to 2100
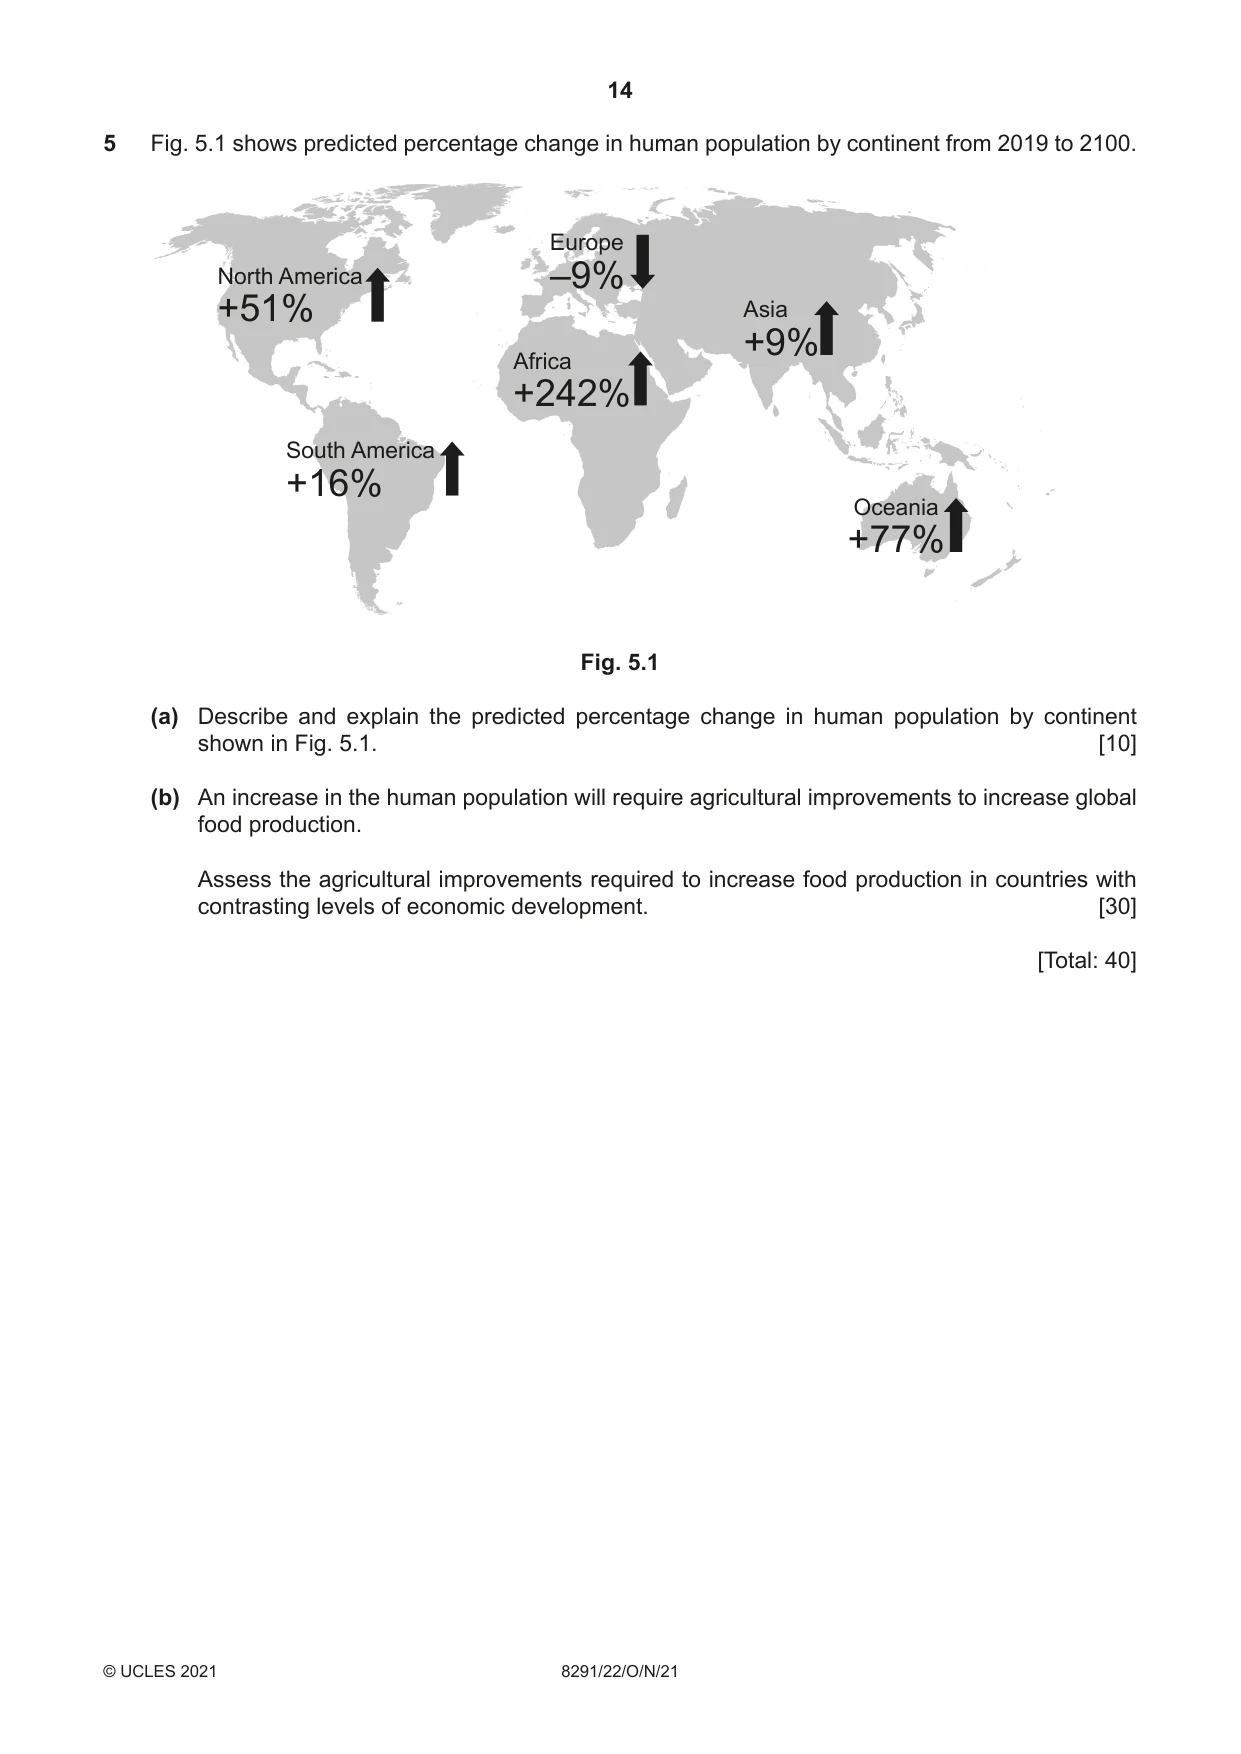
5 Fig. 5.1 shows predicted percentage change in human population by continent from 2019 to 2100. Europe North America –9% Asia +51% +9% Africa +242% South America +16% Oceania +77% Fig. 5.1 (a) Describe and explain the predicted percentage change in human population by continent shown in Fig. 5.1. [10] (b) An increase in the human population will require agricultural improvements to increase global food production. Assess the agricultural improvements required to increase food production in countries with contrasting levels of economic development. [30] [Total: 40]
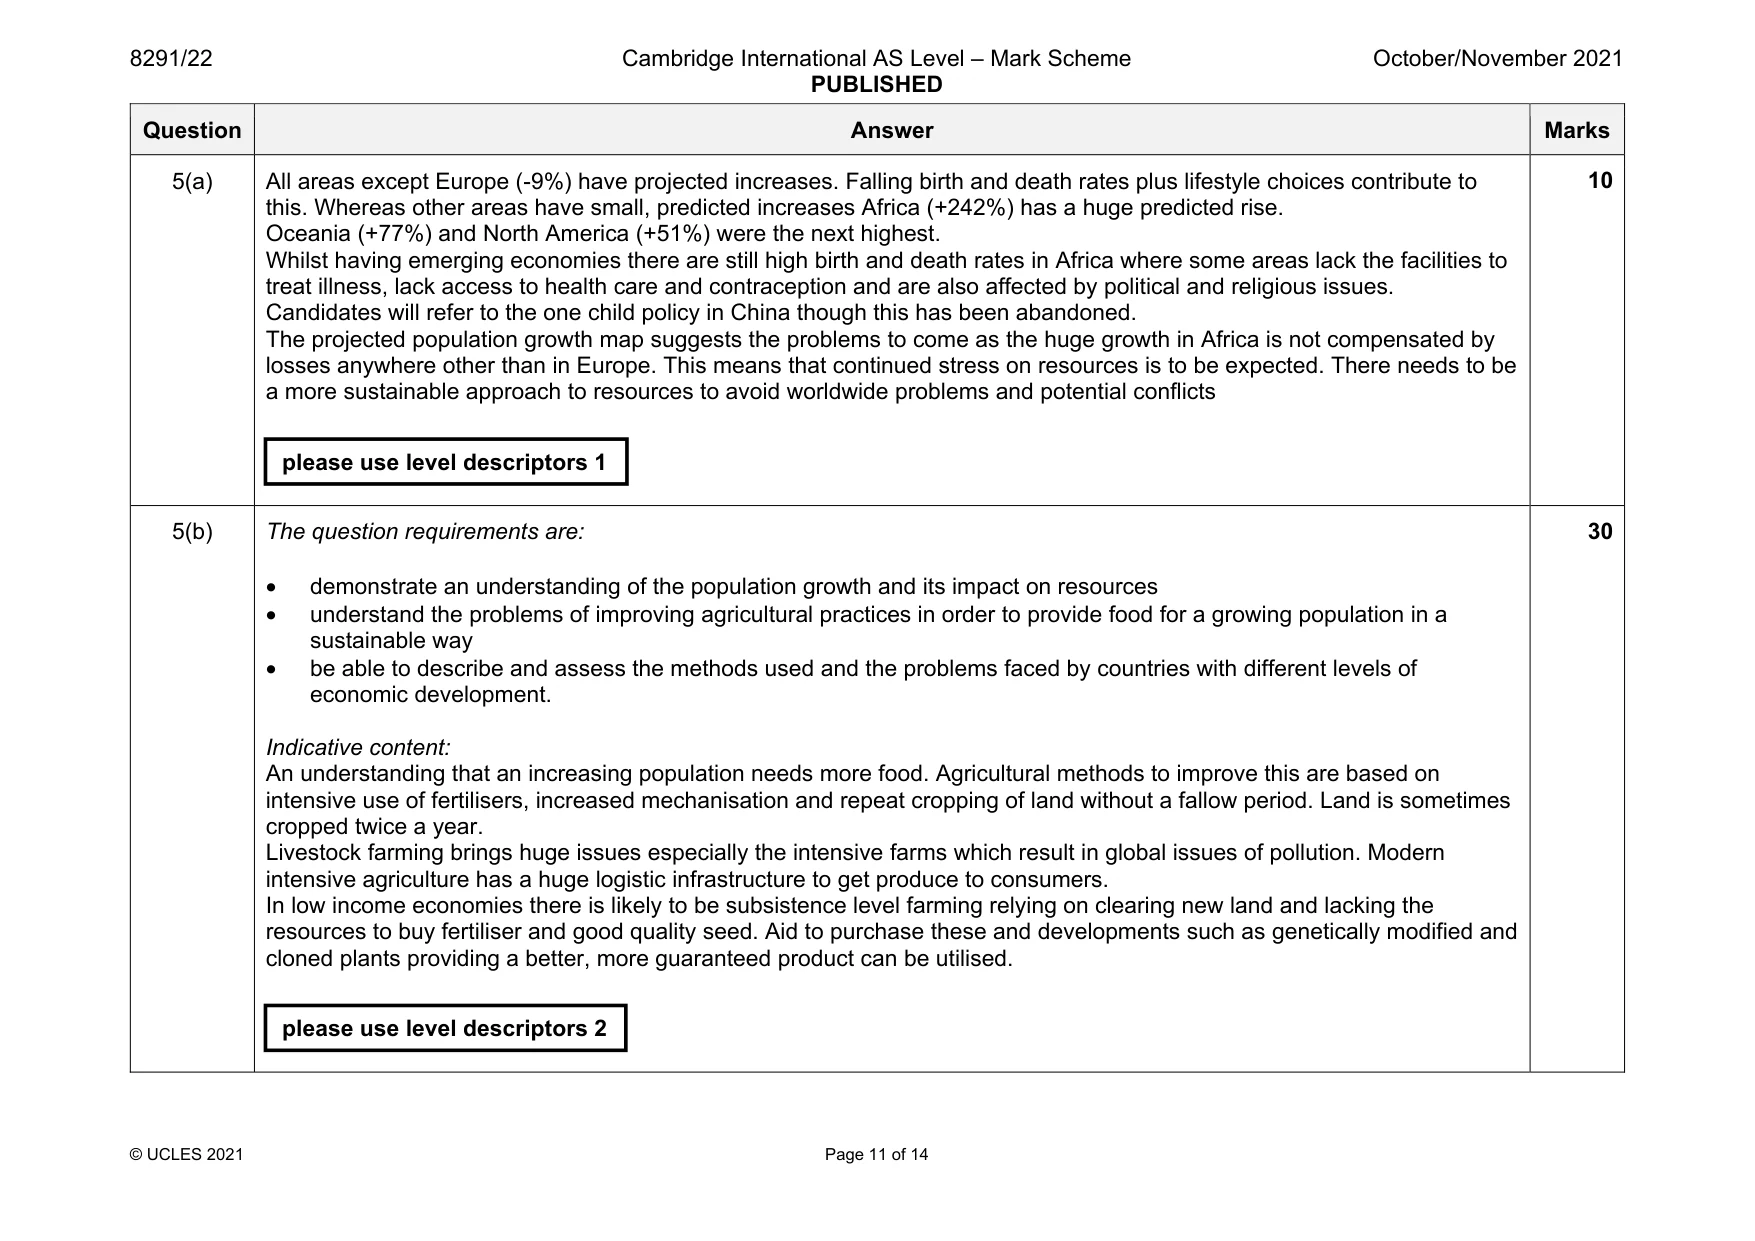
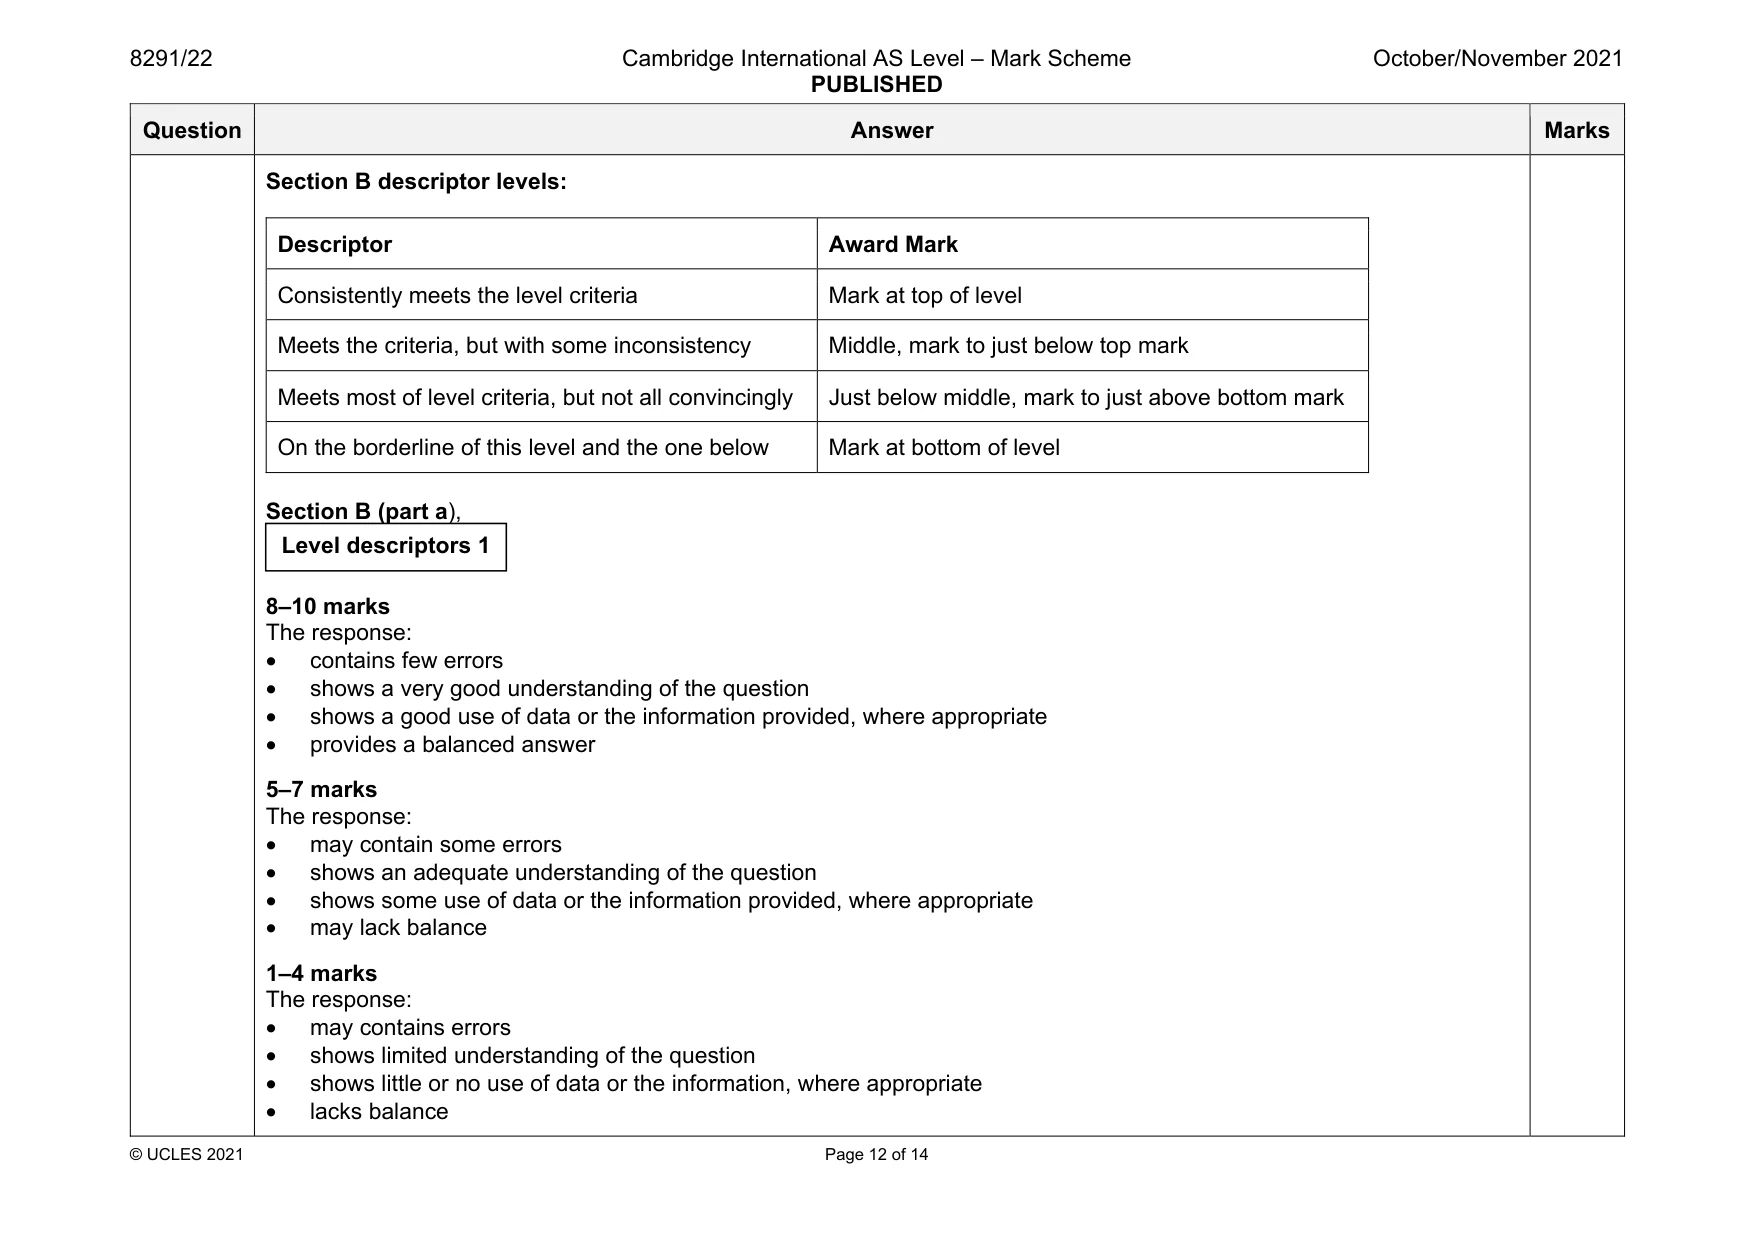
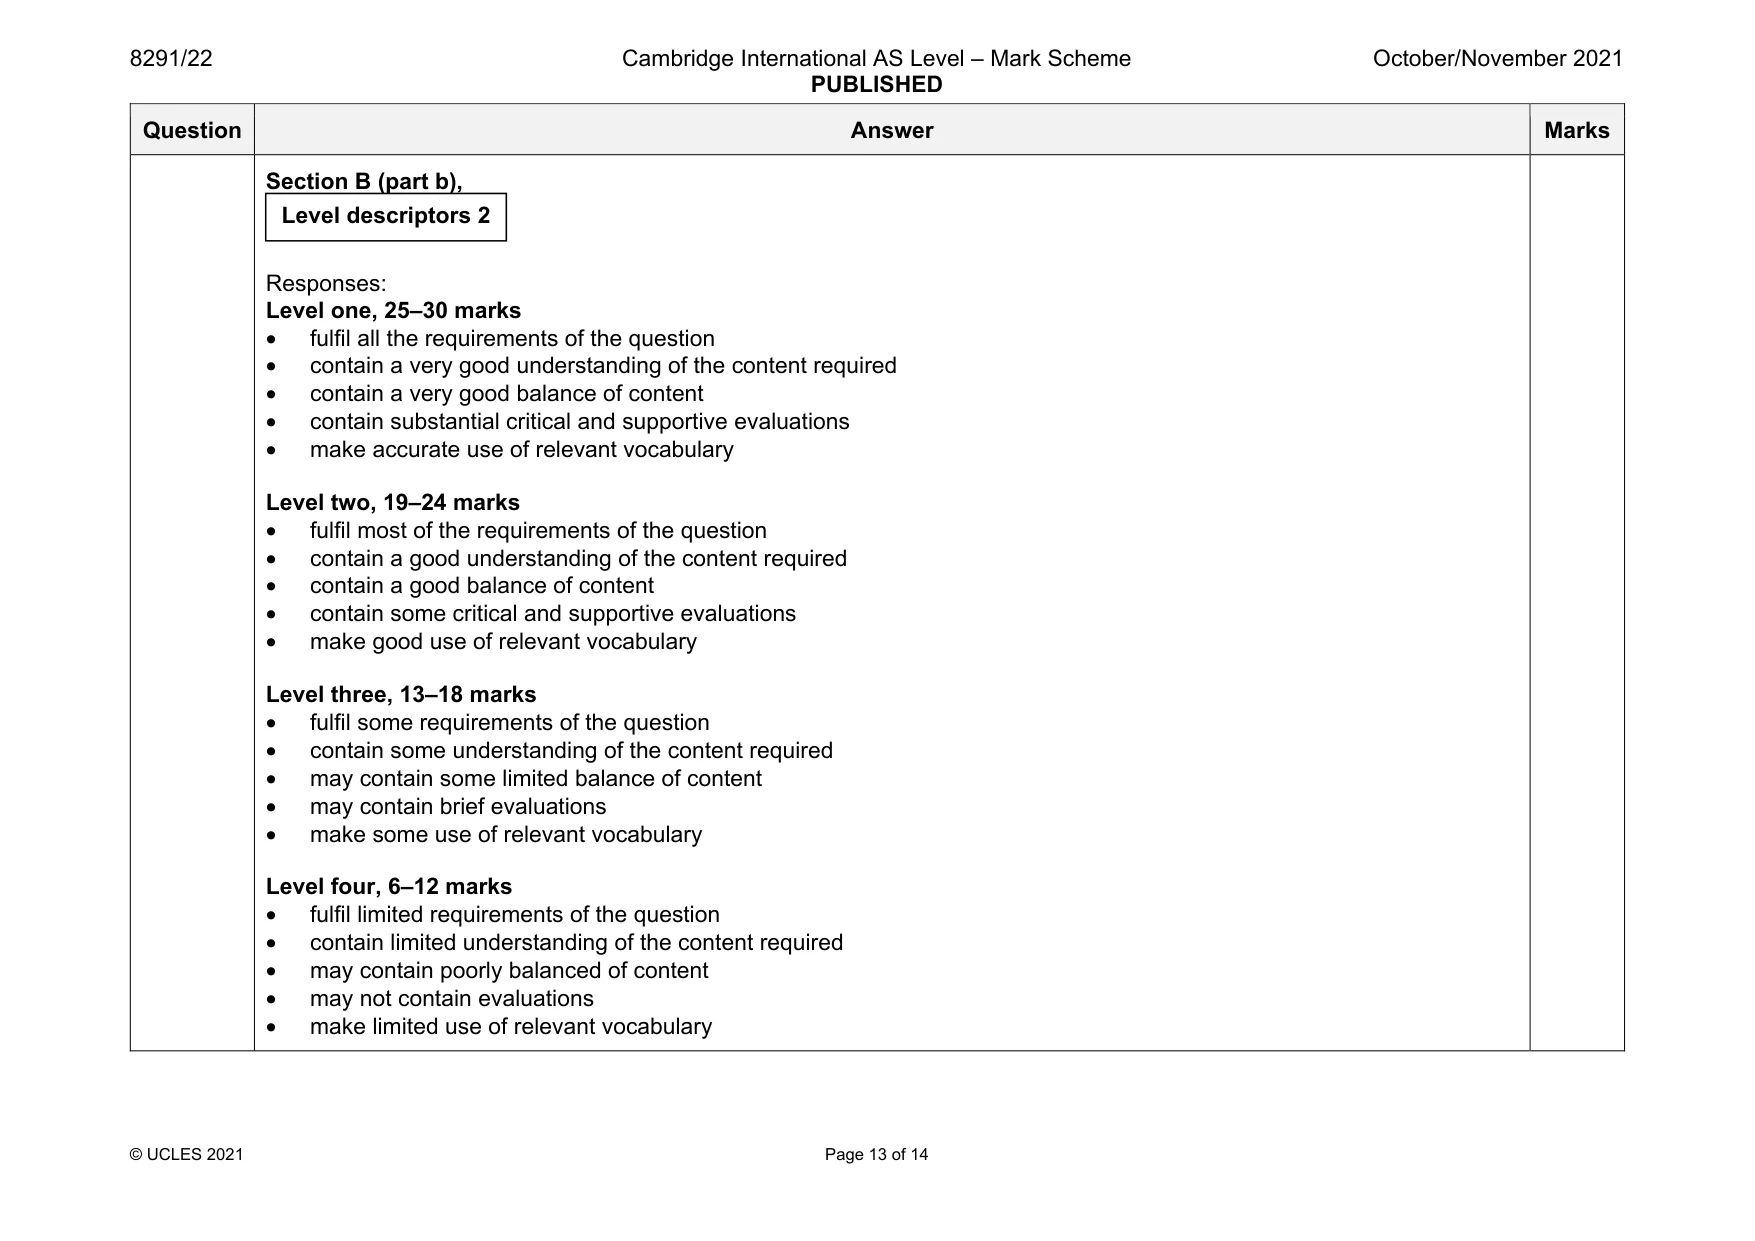
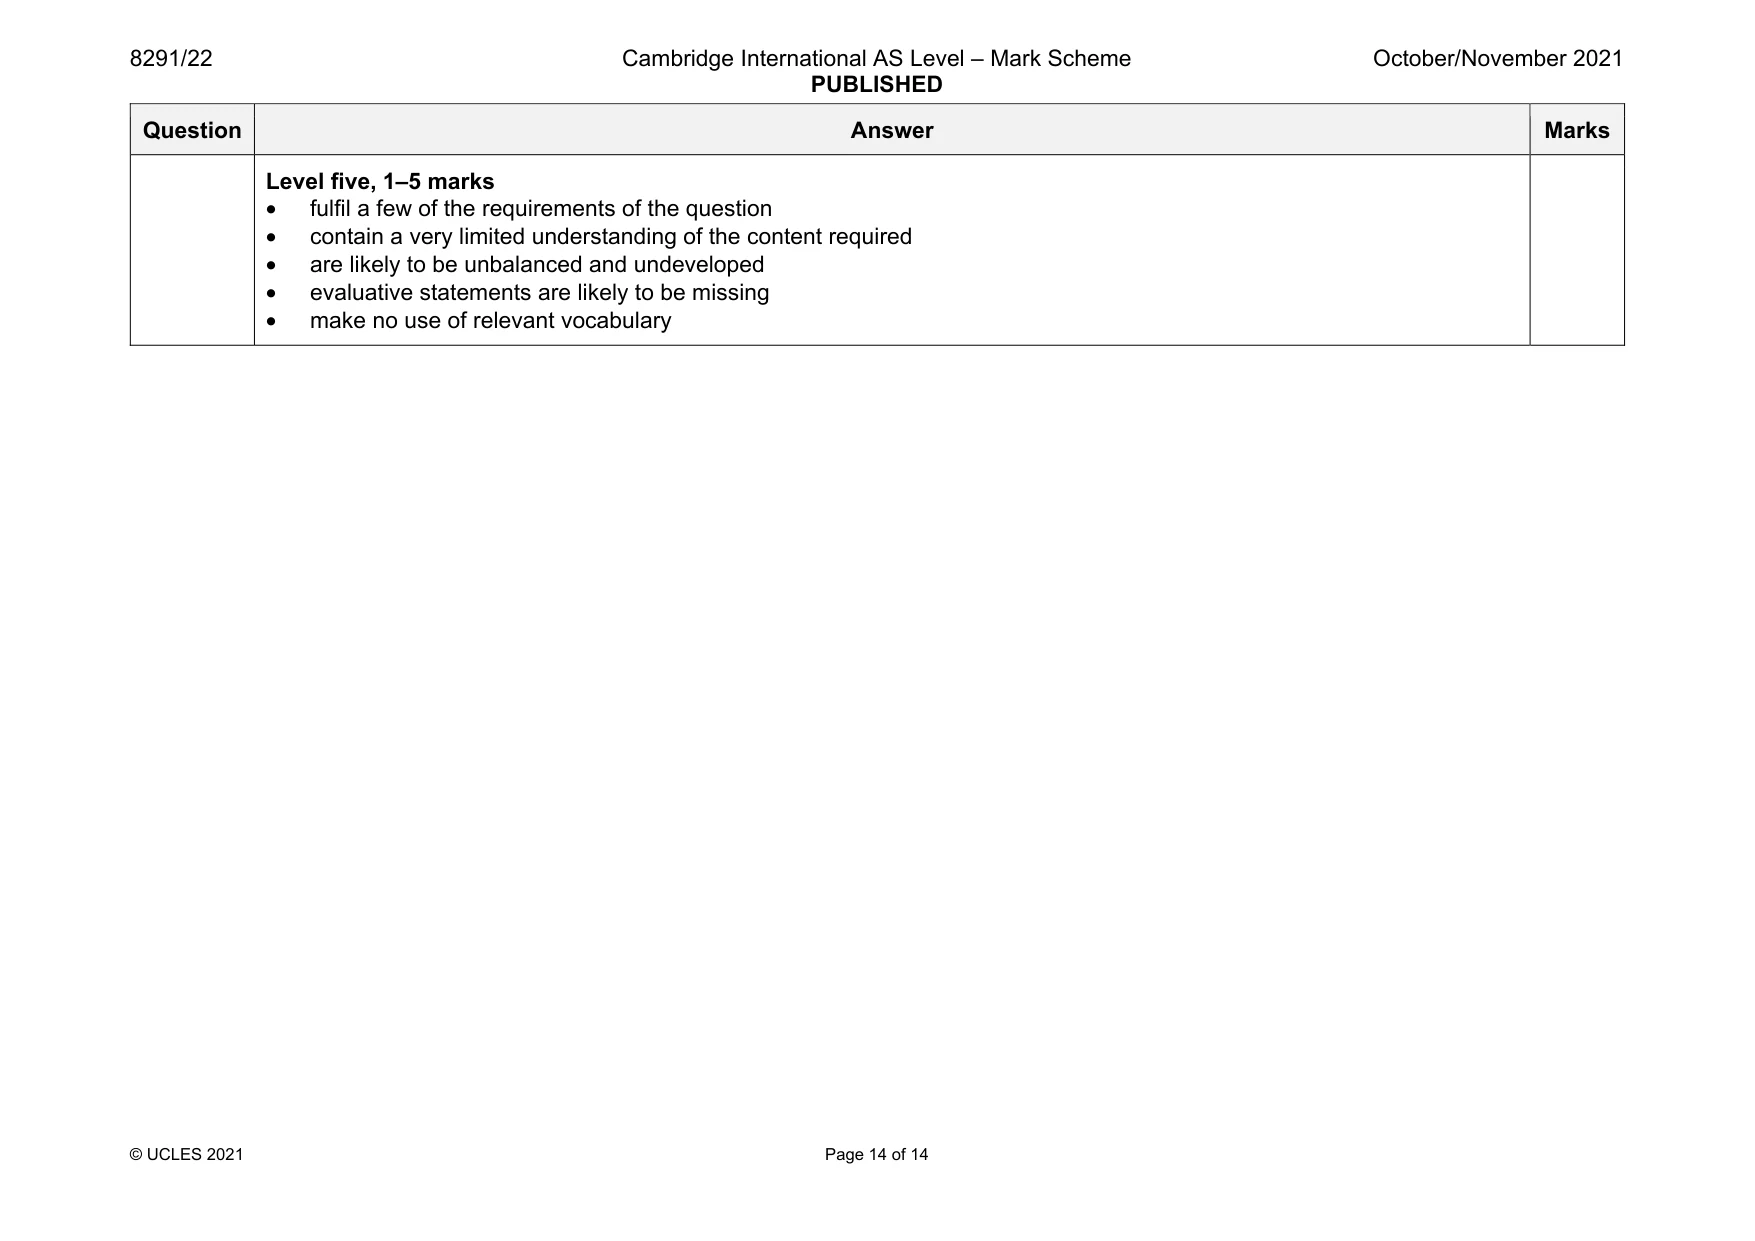
Mark scheme: 5(a) All areas except Europe (-9%) have projected increases. Falling birth and death rates plus lifestyle choices contribute to this. Whereas other areas have small, predicted increases Africa (+242%) has a huge predicted rise. Oceania (+77%) and North America (+51%) were the next highest. Whilst having emerging economies there are still high birth and death rates in Africa where some areas lack the facilities to treat illness, lack access to health care and contraception and are also affected by political and religious issues. Candidates will refer to the one child policy in China though this has been abandoned. The projected population growth map suggests the problems to come as the huge growth in Africa is not compensated by losses anywhere other than in Europe. This means that continued stress on resources is to be expected. There needs to be a more sustainable approach to resources to avoid worldwide problems and potential conflicts 5(b) The question requirements are: • demonstrate an understanding of the population growth and its impact on resources • understand the problems of improving agricultural practices in order to provide food for a growing population in a sustainable way • be able to describe and assess the methods used and the problems faced by countries with different levels of economic development. Indicative content: An understanding that an increasing population needs more food. Agricultural methods to improve this are based on intensive use of fertilisers, increased mechanisation and repeat cropping of land without a fallow period. Land is sometimes cropped twice a year. Livestock farming brings huge issues especially the intensive farms which result in global issues of pollution. Modern intensive agriculture has a huge logistic infrastructure to get produce to consumers. In low income economies there is likely to be subsistence level farming relying on clearing new land and lacking the resources to buy fertiliser and good quality seed. Aid to purchase these and developments such as genetically modified and cloned plants providing a better, more guaranteed product can be utilised. 30 please use level descriptors 1 please use level descriptors 2 Question Answer Marks Section B descriptor levels: Descriptor Award Mark Consistently meets the level criteria Mark at top of level Meets the criteria, but with some inconsistency Middle, mark to just below top mark Meets most of level criteria, but not all convincingly Just below middle, mark to just above bottom mark On the borderline of this level and the one below Mark at bottom of level Section B (part a), 8–10 marks The response: • contains few errors • shows a very good understanding of the question • shows a good use of data or the information provided, where appropriate • provides a balanced answer 5–7 marks The response: • may contain some errors • shows an adequate understanding of the question • shows some use of data or the information provided, where appropriate • may lack balance 1–4 marks The response: • may contains errors • shows limited understanding of the question • shows little or no use of data or the information, where appropriate • lacks balance Level descriptors 1 Question Answer Marks Section B (part b), Responses: Level one, 25–30 marks • fulfil all the requirements of the question • contain a very good understanding of the content required • contain a very good balance of content • contain substantial critical and supportive evaluations • make accurate use of relevant vocabulary Level two, 19–24 marks • fulfil most of the requirements of the question • contain a good understanding of the content required • contain a good balance of content • contain some critical and supportive evaluations • make good use of relevant vocabulary Level three, 13–18 marks • fulfil some requirements of the question • contain some understanding of the content required • may contain some limited balance of content • may contain brief evaluations • make some use of relevant vocabulary Level four, 6–12 marks • fulfil limited requirements of the question • contain limited understanding of the content required • may contain poorly balanced of content • may not contain evaluations • make limited use of relevant vocabulary Level descriptors 2 Question Answer Marks Level five, 1–5 marks • fulfil a few of the requirements of the question • contain a very limited understanding of the content required • are likely to be unbalanced and undeveloped • evaluative statements are likely to be missing • make no use of relevant vocabulary
What was in this paper
The subtopics covered by these 5 questions, and how many questions each got. Open one in a new tab to see every Cambridge question on it.
What you needed in this session
Cambridge’s own grade thresholds for 2021 Oct/Nov, Paper 2 · Variant 2. A higher threshold means an easier paper — the bar moves with how the cohort did.