Cambridge A Level Environmental Management (AS only) 8291 — 2021 Oct/Nov Paper 2 · Variant 3
8291/23/O/N/21 · 5 questions · 80 marks · ≈90 min
The question paper and its mark scheme, free to read here and free to download. This is Cambridge’s own paper, exactly as it was sat.
Question paper12 pages

Mark scheme14 pages
Answers below. Sit the paper first if you are practising.
Questions as text
Q1 · The number of marine wildlife affected by marine debris in one year
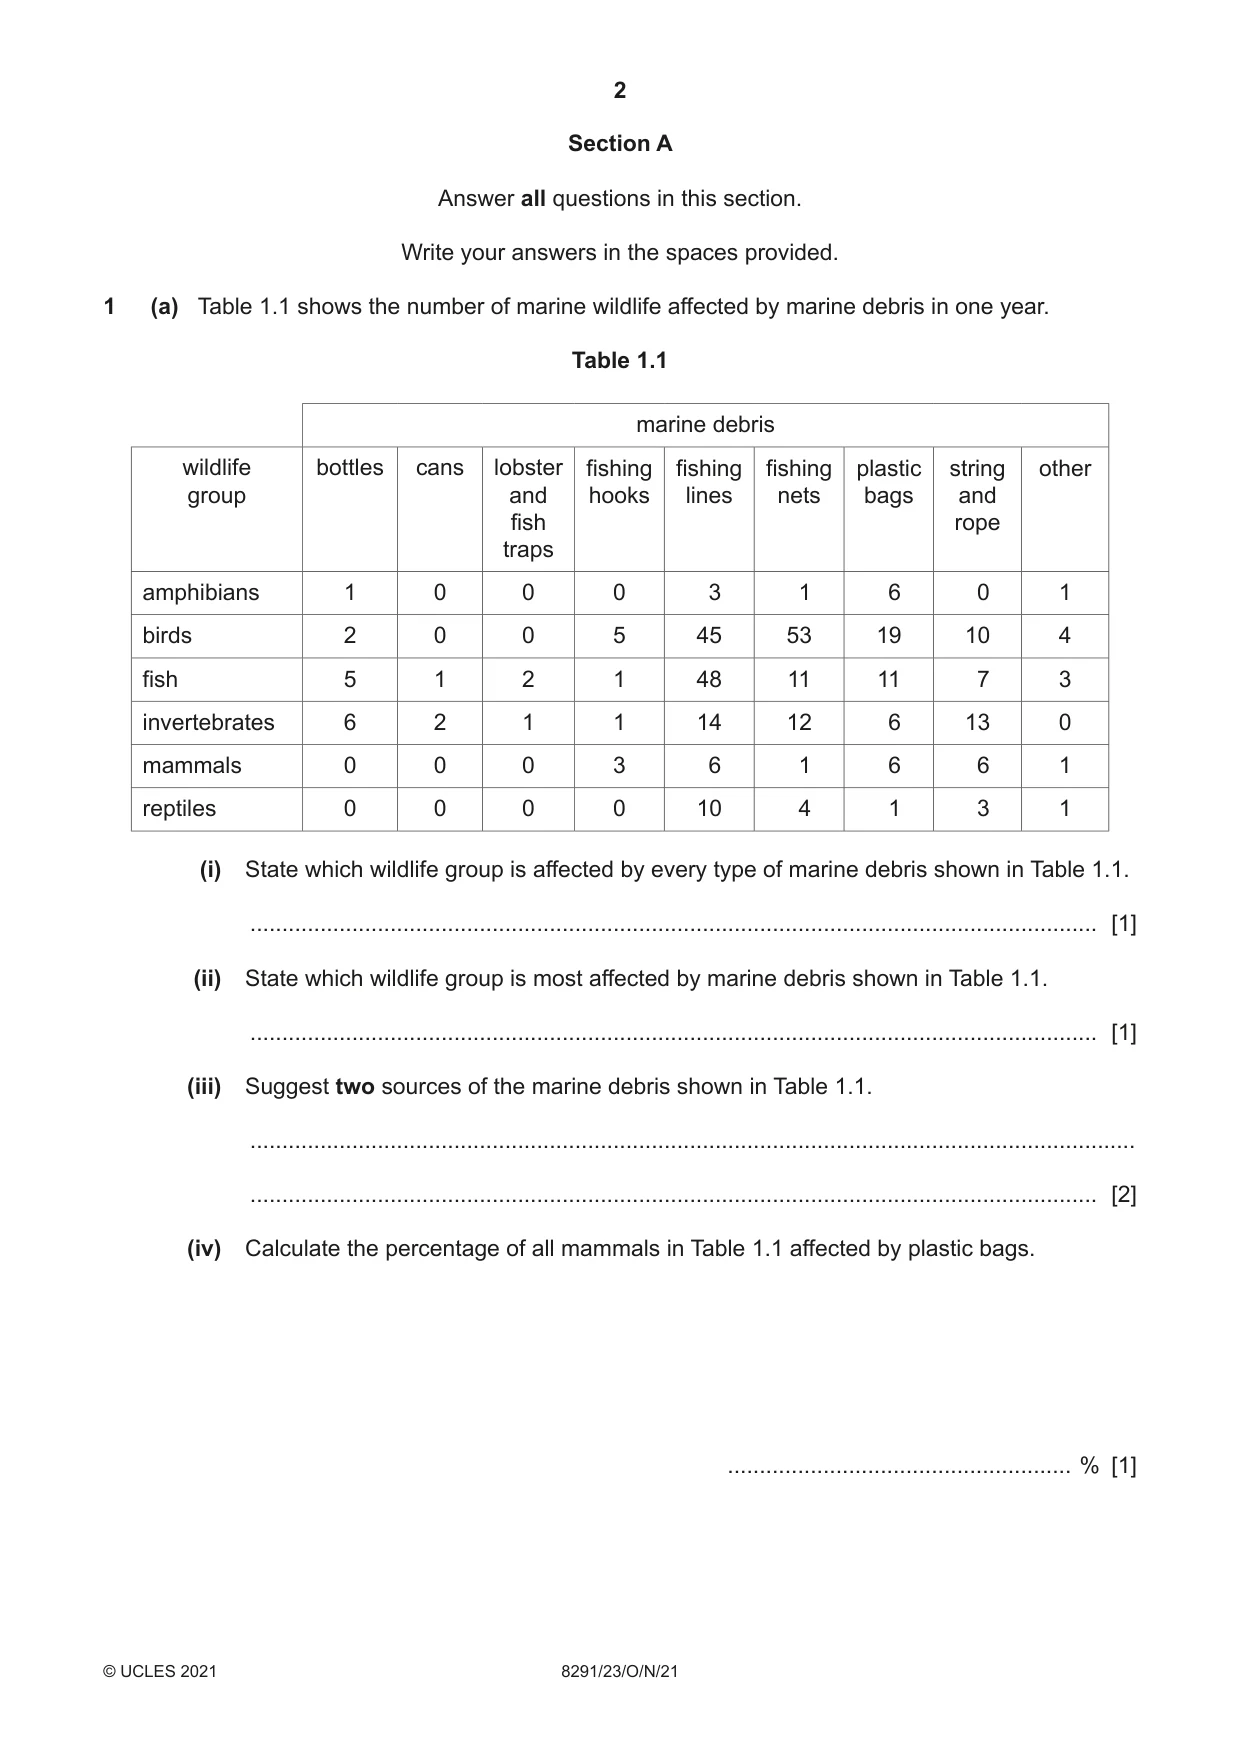
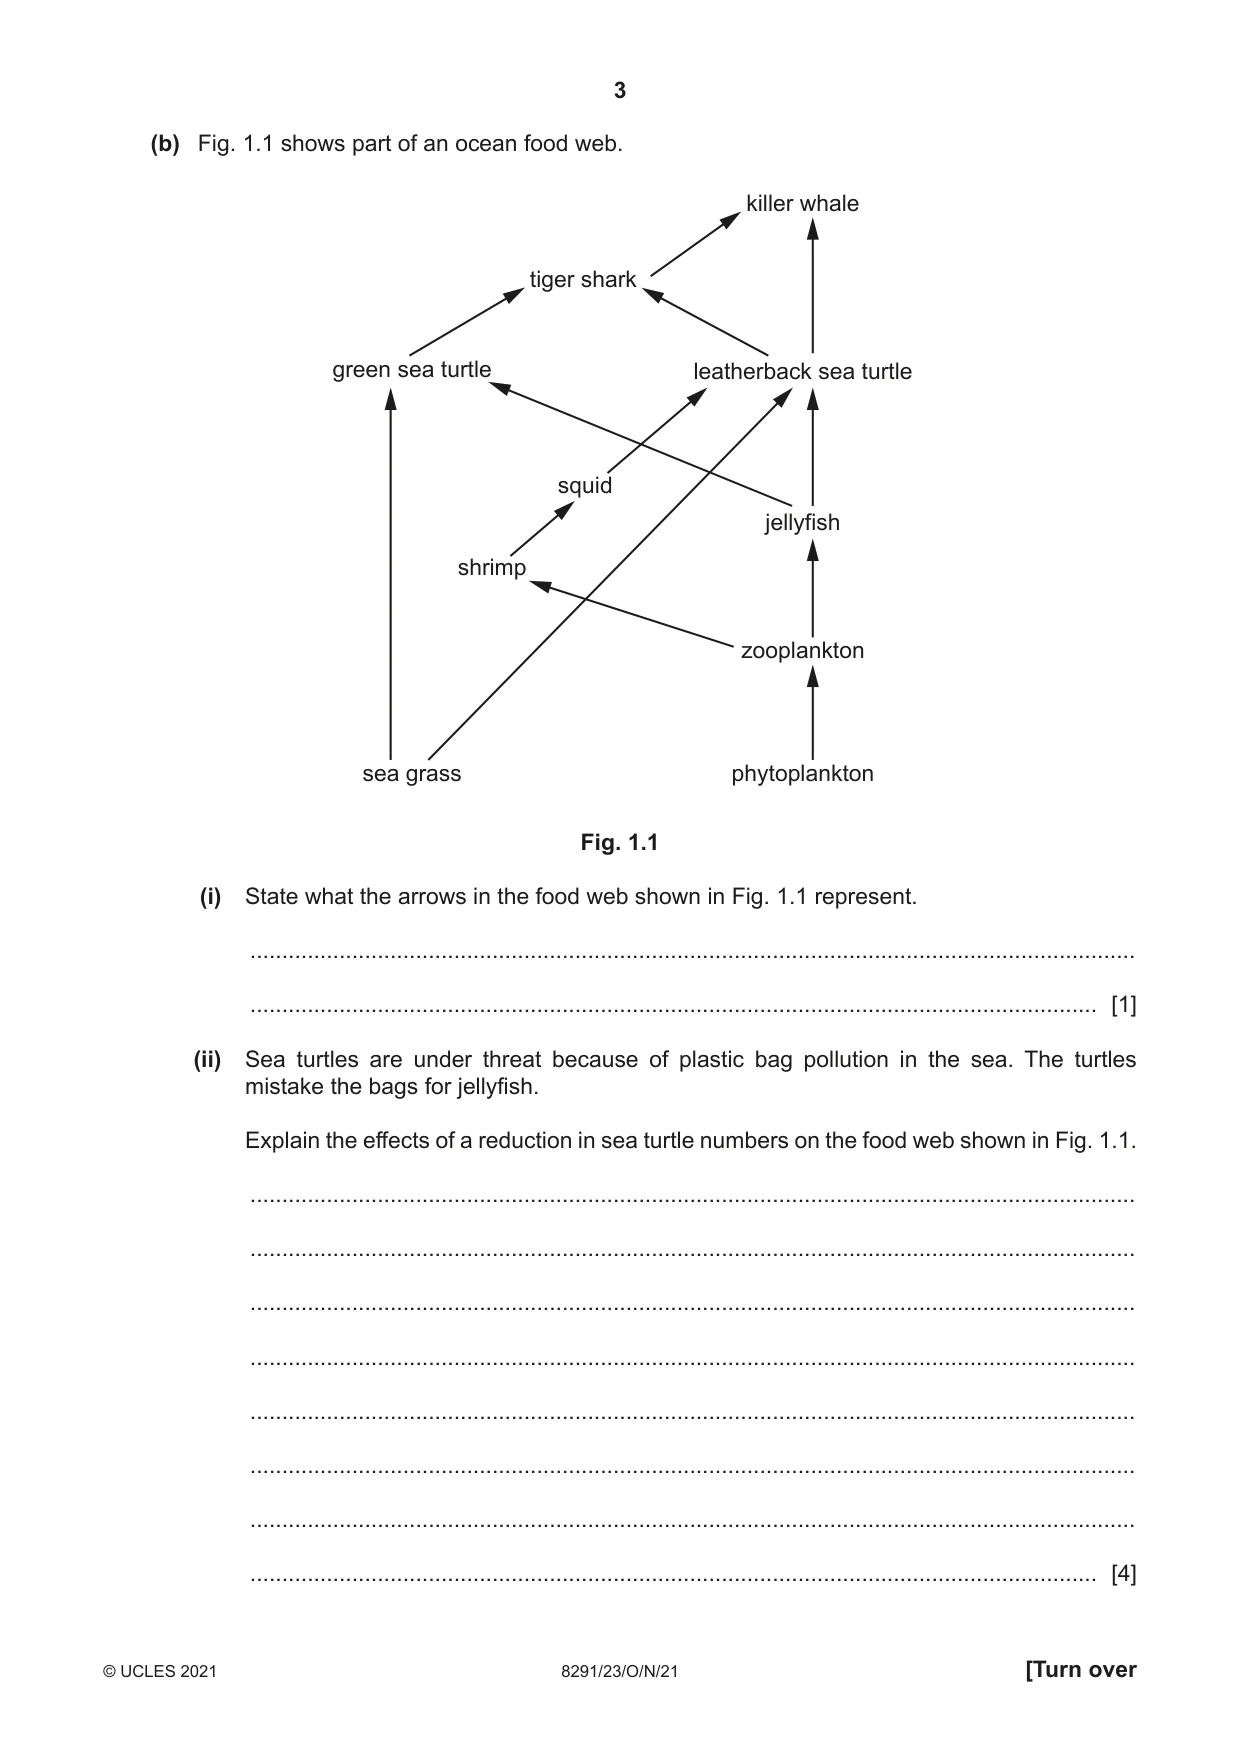
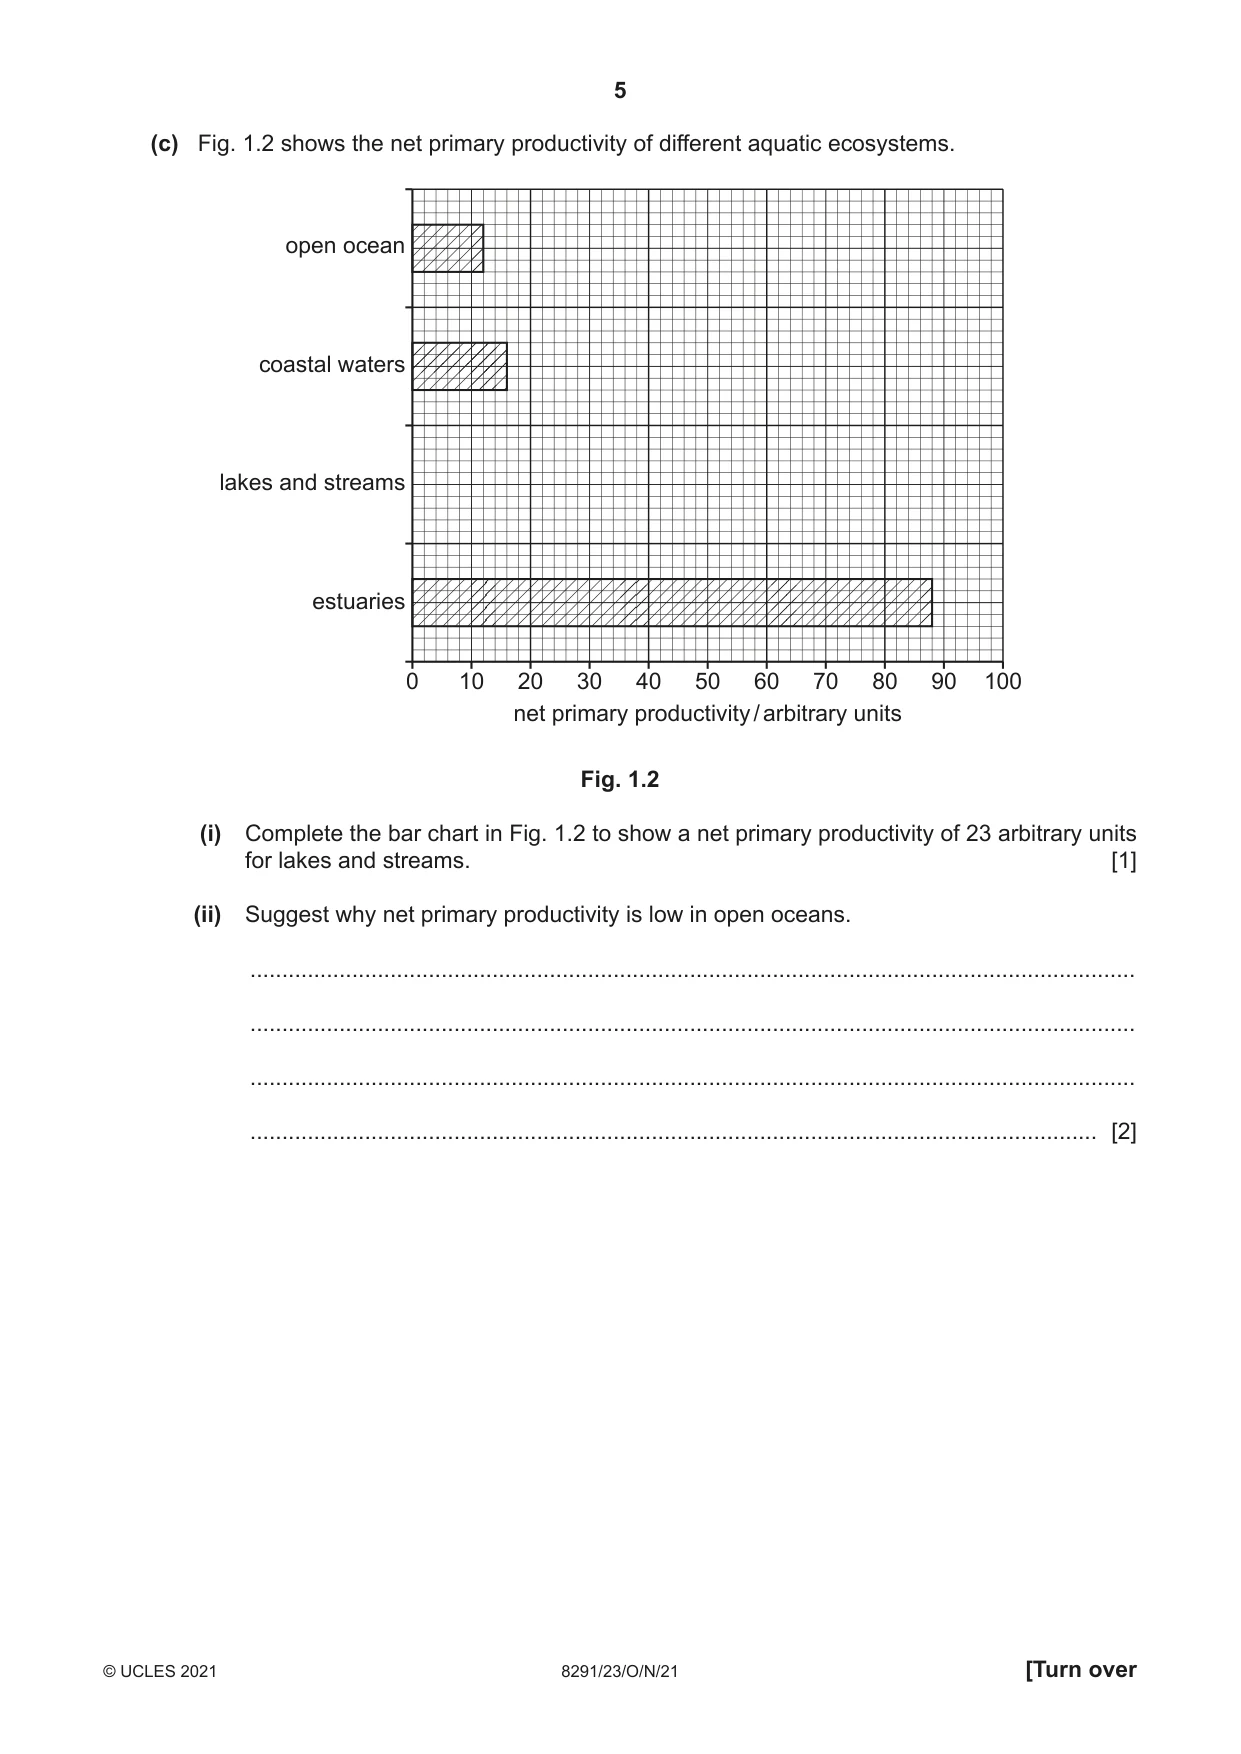
1 (a) Table 1.1 shows the number of marine wildlife affected by marine debris in one year. Table 1.1 marine debris wildlife bottles cans lobster fishing fishing fishing plastic string other group and hooks lines nets bags and fish rope traps amphibians 1 0 0 0 3 1 6 0 1 birds 2 0 0 5 45 53 19 10 4 fish 5 1 2 1 48 11 11 7 3 invertebrates 6 2 1 1 14 12 6 13 0 mammals 0 0 0 3 6 1 6 6 1 reptiles 0 0 0 0 10 4 1 3 1 (i) State which wildlife group is affected by every type of marine debris shown in Table 1.1. ..................................................................................................................................... [1] (ii) State which wildlife group is most affected by marine debris shown in Table 1.1. ..................................................................................................................................... [1] (iii) Suggest two sources of the marine debris shown in Table 1.1. ........................................................................................................................................... ..................................................................................................................................... [2] (iv) Calculate the percentage of all mammals in Table 1.1 affected by plastic bags. ...................................................... % [1] (b) Fig. 1.1 shows part of an ocean food web. killer whale tiger shark green sea turtle leatherback sea turtle squid jellyfish shrimp zooplankton sea grass phytoplankton Fig. 1.1 (i) State what the arrows in the food web shown in Fig. 1.1 represent. ........................................................................................................................................... ..................................................................................................................................... [1] (ii) Sea turtles are under threat because of plastic bag pollution in the sea. The turtles mistake the bags for jellyfish. Explain the effects of a reduction in sea turtle numbers on the food web shown in Fig. 1.1. ........................................................................................................................................... ........................................................................................................................................... ........................................................................................................................................... ........................................................................................................................................... ........................................................................................................................................... ........................................................................................................................................... ........................................................................................................................................... ..................................................................................................................................... [4] (iii) Suggest strategies to prevent plastic bag pollution reaching oceans. ........................................................................................................................................... ........................................................................................................................................... ........................................................................................................................................... ........................................................................................................................................... ........................................................................................................................................... ........................................................................................................................................... ........................................................................................................................................... ..................................................................................................................................... [4] (c) Fig. 1.2 shows the net primary productivity of different aquatic ecosystems. open ocean coastal waters lakes and streams estuaries 0 10 20 30 40 50 60 70 80 90 100 net primary productivity / arbitrary units Fig. 1.2 (i) Complete the bar chart in Fig. 1.2 to show a net primary productivity of 23 arbitrary units for lakes and streams. [1] (ii) Suggest why net primary productivity is low in open oceans. ........................................................................................................................................... ........................................................................................................................................... ........................................................................................................................................... ..................................................................................................................................... [2] (iii) An estuary is found where a river meets coastal waters. The net primary productivity of an estuary is high because there is a high concentration of nutrients. Suggest reasons why the concentration of nutrients is high. ........................................................................................................................................... ........................................................................................................................................... ........................................................................................................................................... ........................................................................................................................................... ........................................................................................................................................... ..................................................................................................................................... [3] [Total: 20]
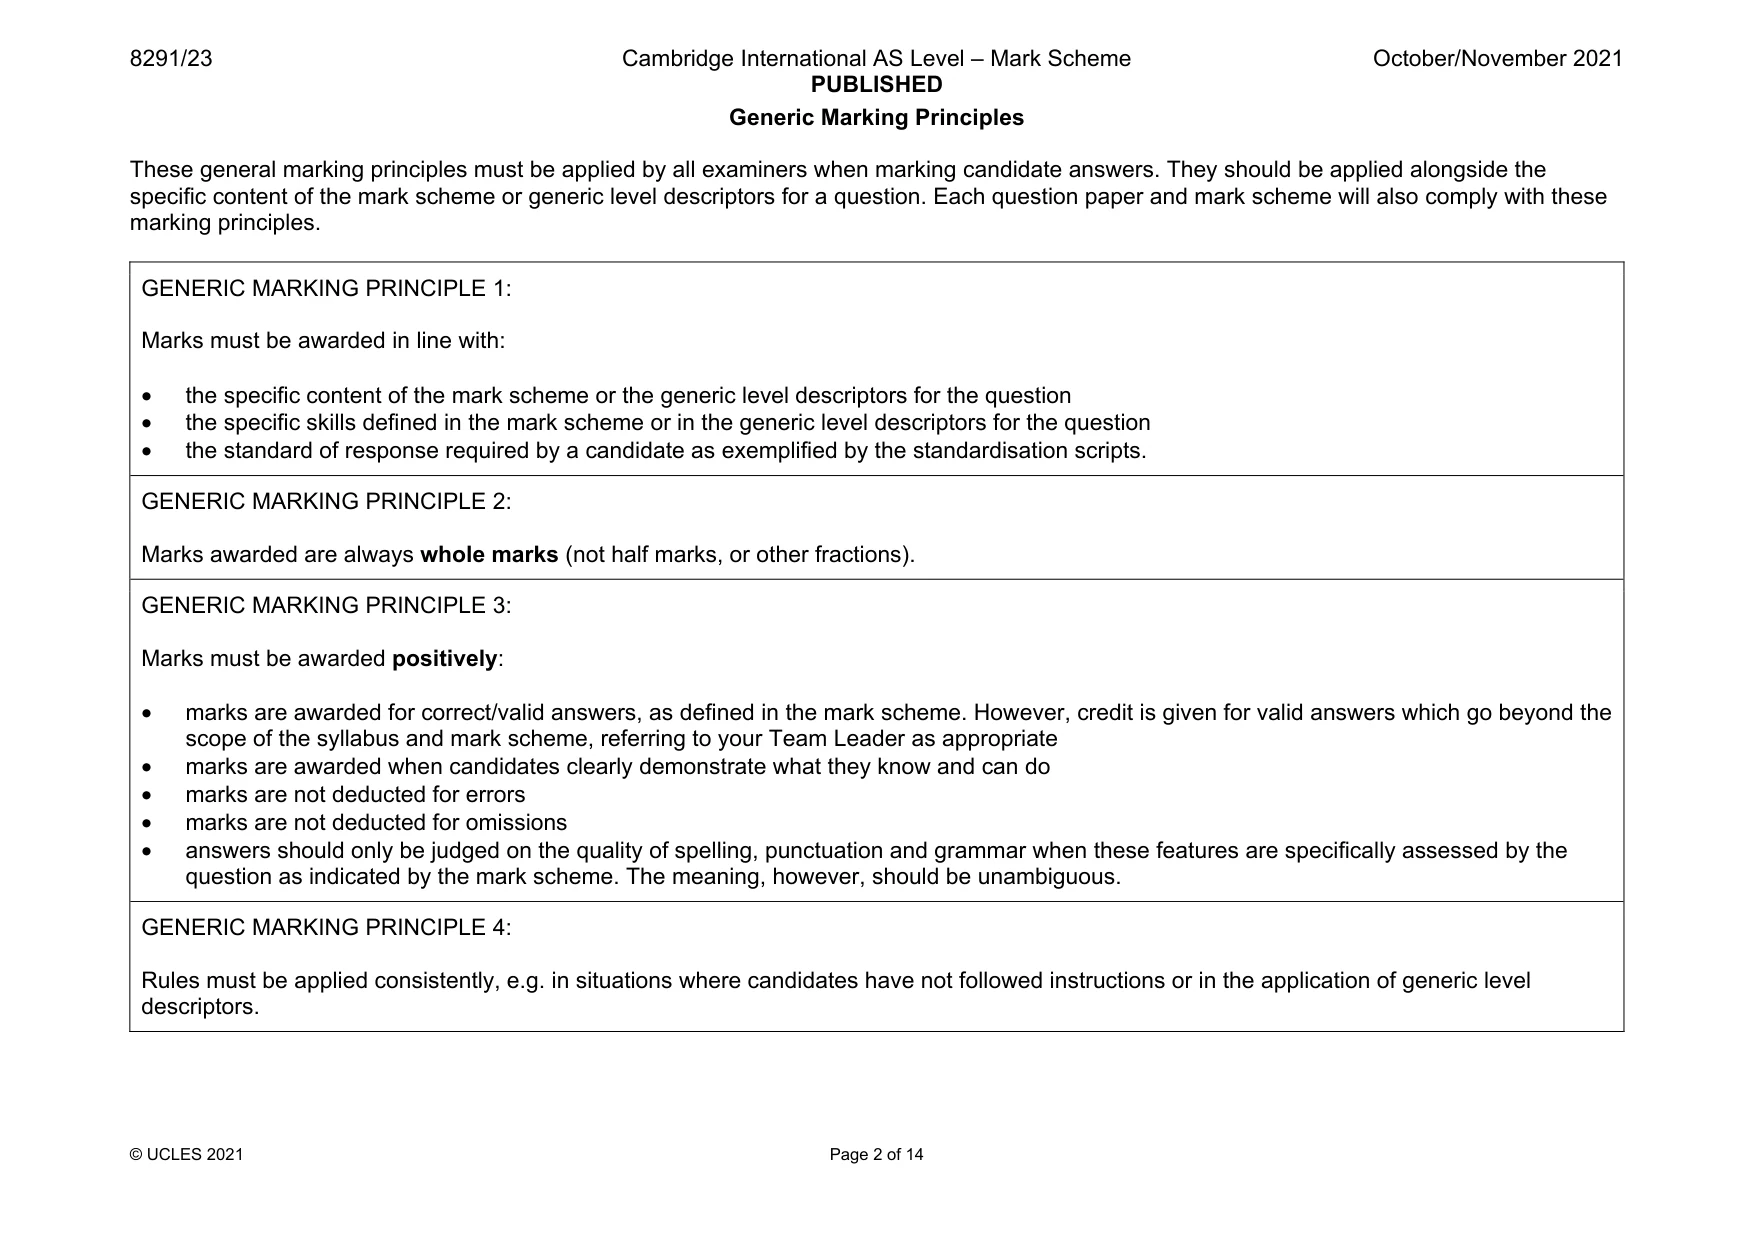
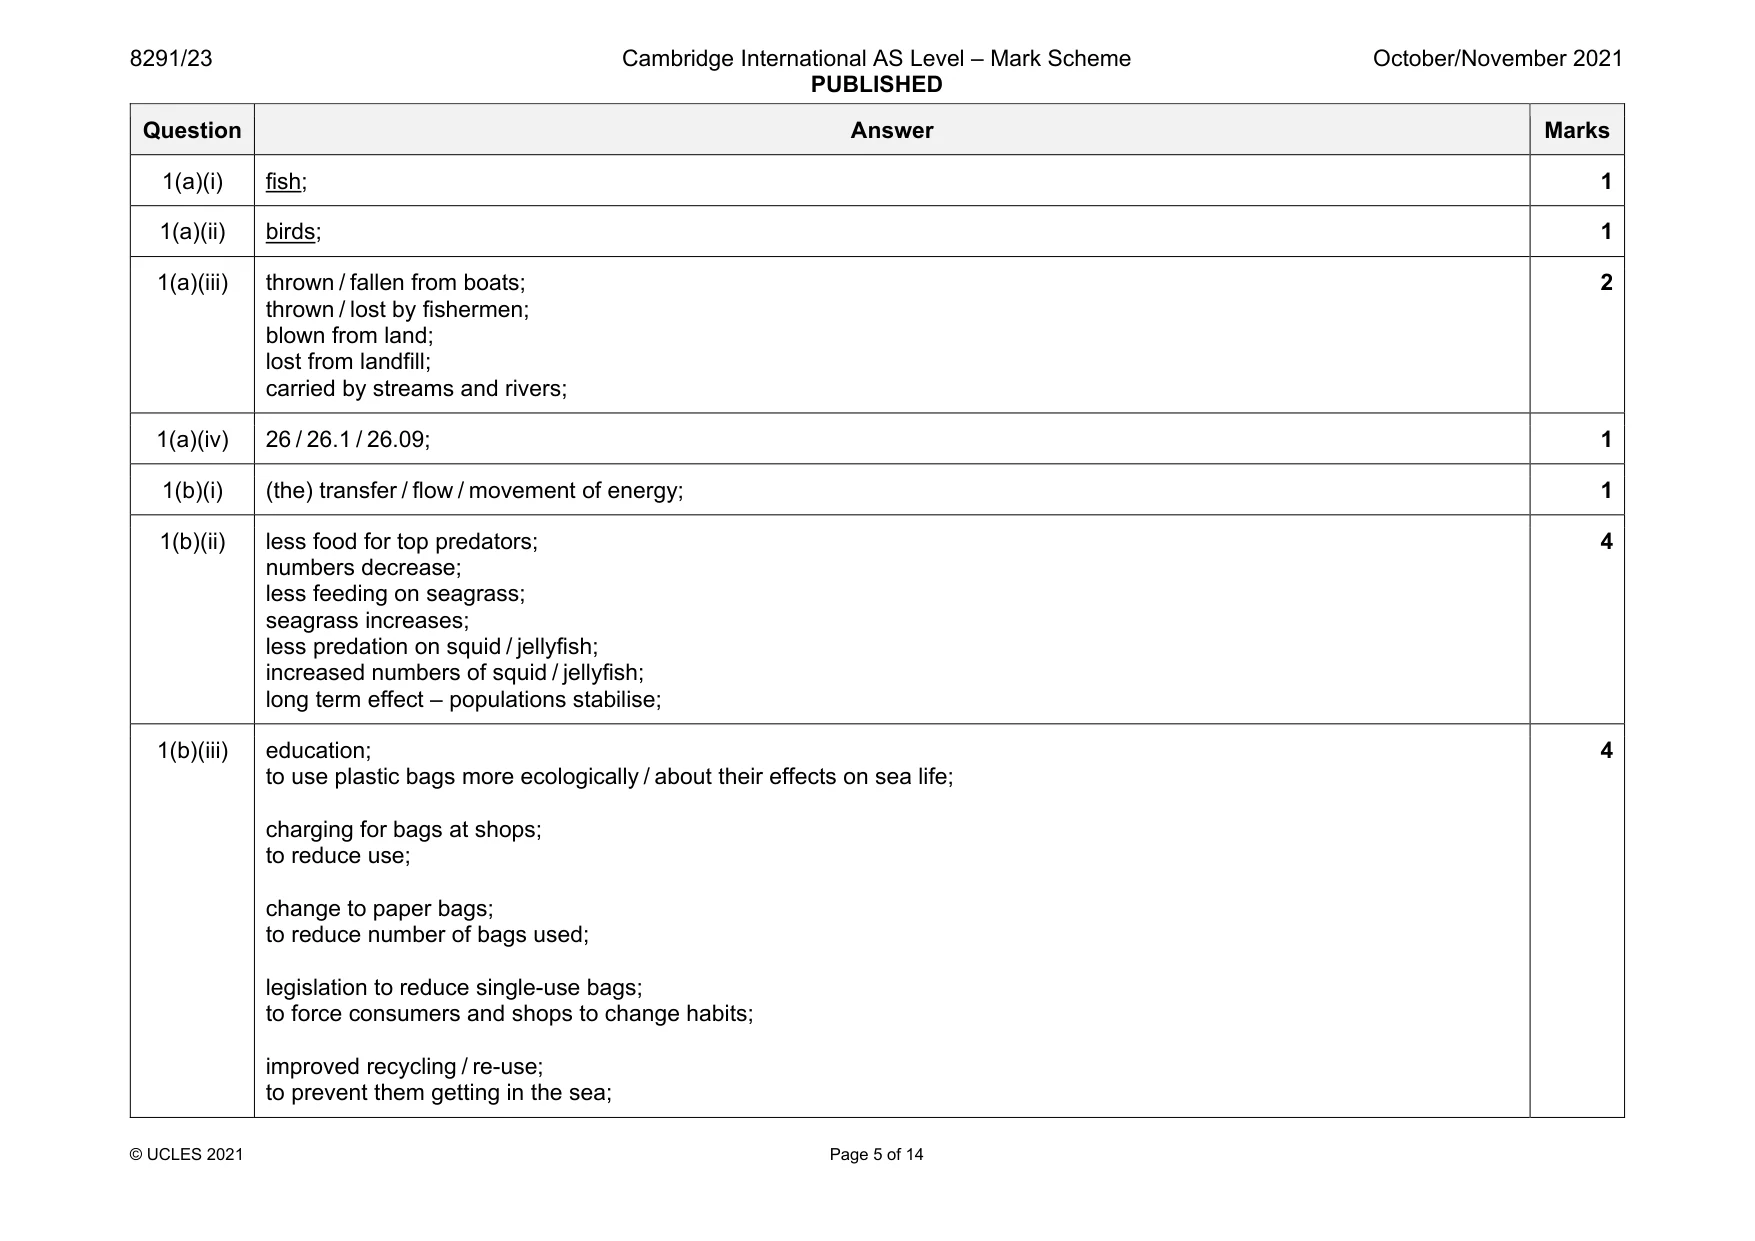
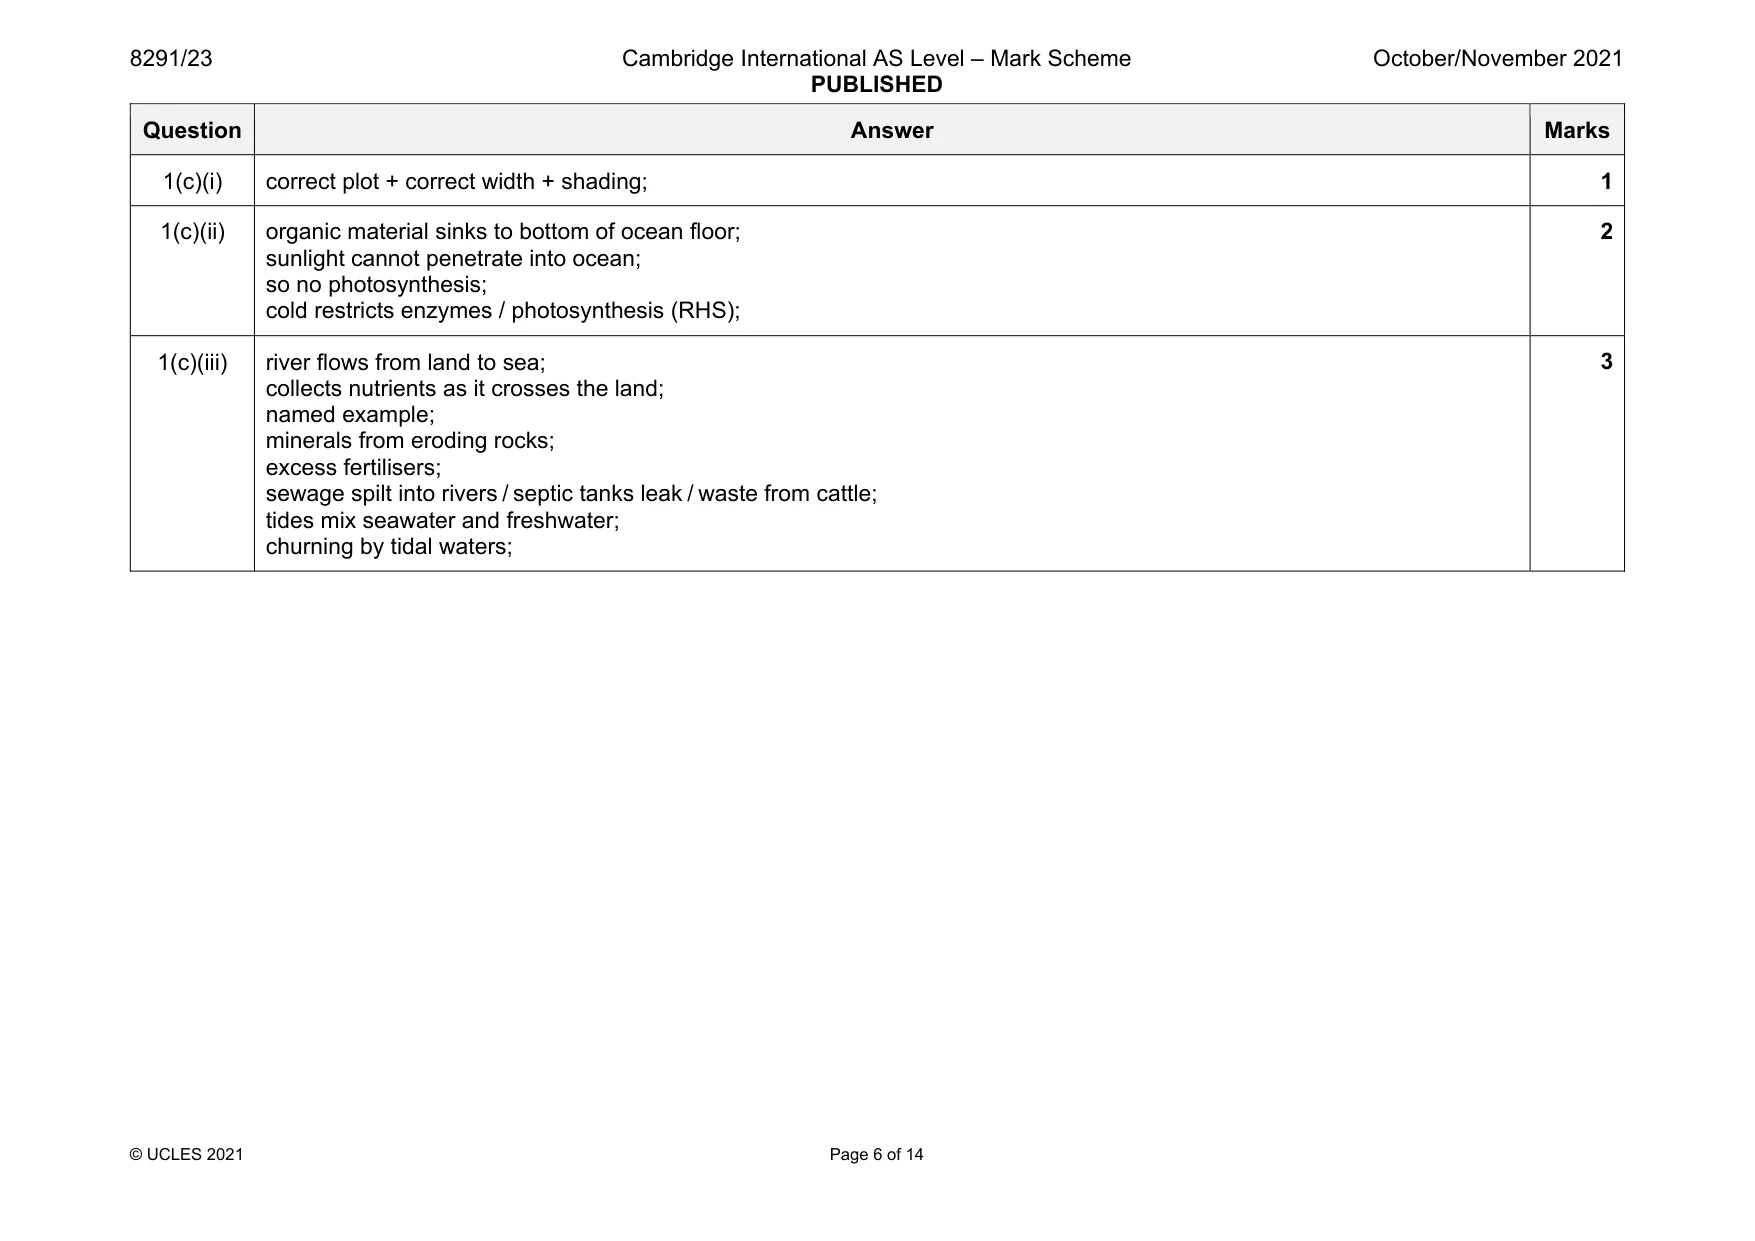
Mark scheme: 1(a)(i) fish; 1 1(a)(ii) birds; 1 1(a)(iii) thrown / fallen from boats; thrown / lost by fishermen; blown from land; lost from landfill; carried by streams and rivers; 2 1(a)(iv) 26 / 26.1 / 26.09; 1 1(b)(i) (the) transfer / flow / movement of energy; 1 1(b)(ii) less food for top predators; numbers decrease; less feeding on seagrass; seagrass increases; less predation on squid / jellyfish; increased numbers of squid / jellyfish; long term effect – populations stabilise; 4 1(b)(iii) education; to use plastic bags more ecologically / about their effects on sea life; charging for bags at shops; to reduce use; change to paper bags; to reduce number of bags used; legislation to reduce single-use bags; to force consumers and shops to change habits; improved recycling / re-use; to prevent them getting in the sea; 4 Question Answer Marks 1(c)(i) correct plot + correct width + shading; 1 1(c)(ii) organic material sinks to bottom of ocean floor; sunlight cannot penetrate into ocean; so no photosynthesis; cold restricts enzymes / photosynthesis (RHS); 2 1(c)(iii) river flows from land to sea; collects nutrients as it crosses the land; named example; minerals from eroding rocks; excess fertilisers; sewage spilt into rivers / septic tanks leak / waste from cattle; tides mix seawater and freshwater; churning by tidal waters; 3
Q2 · A habitat changing over time from open water to mixed woodland
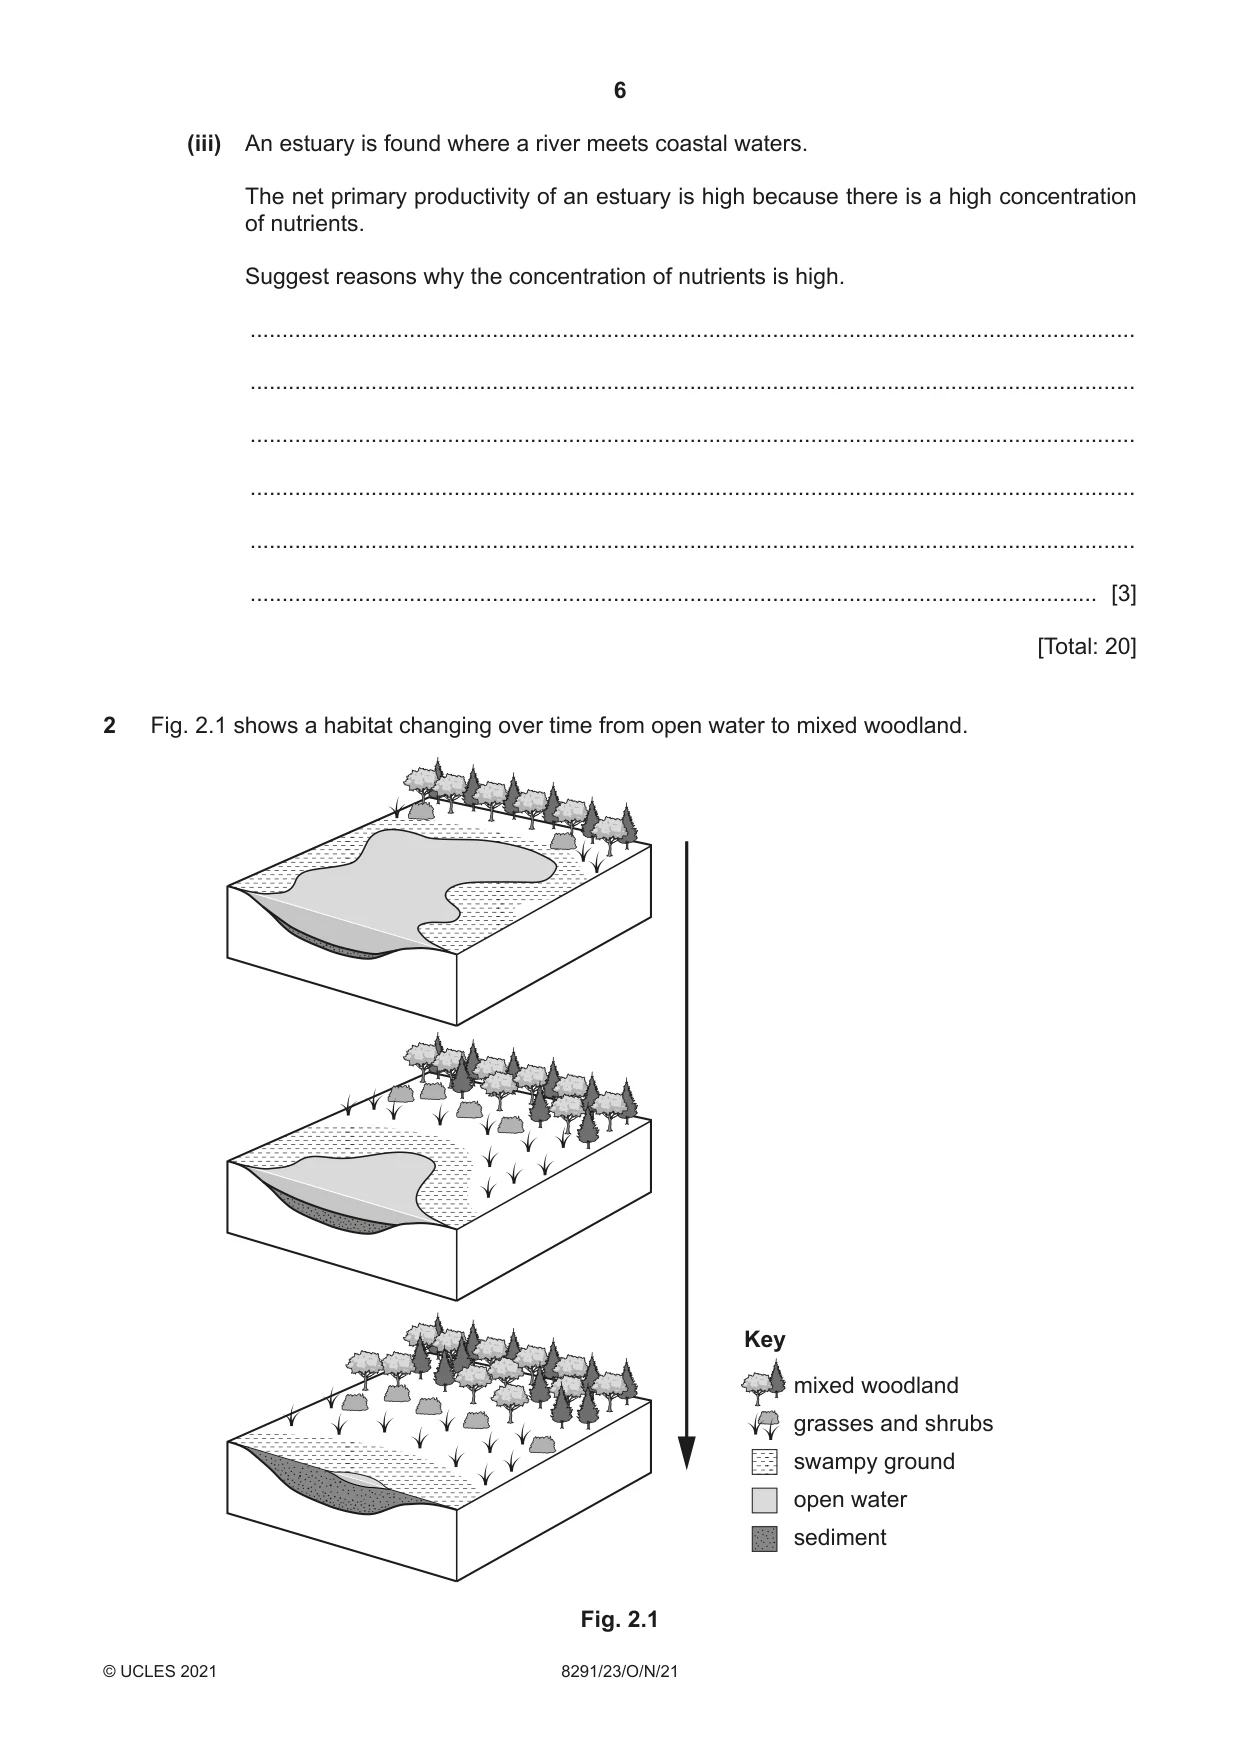
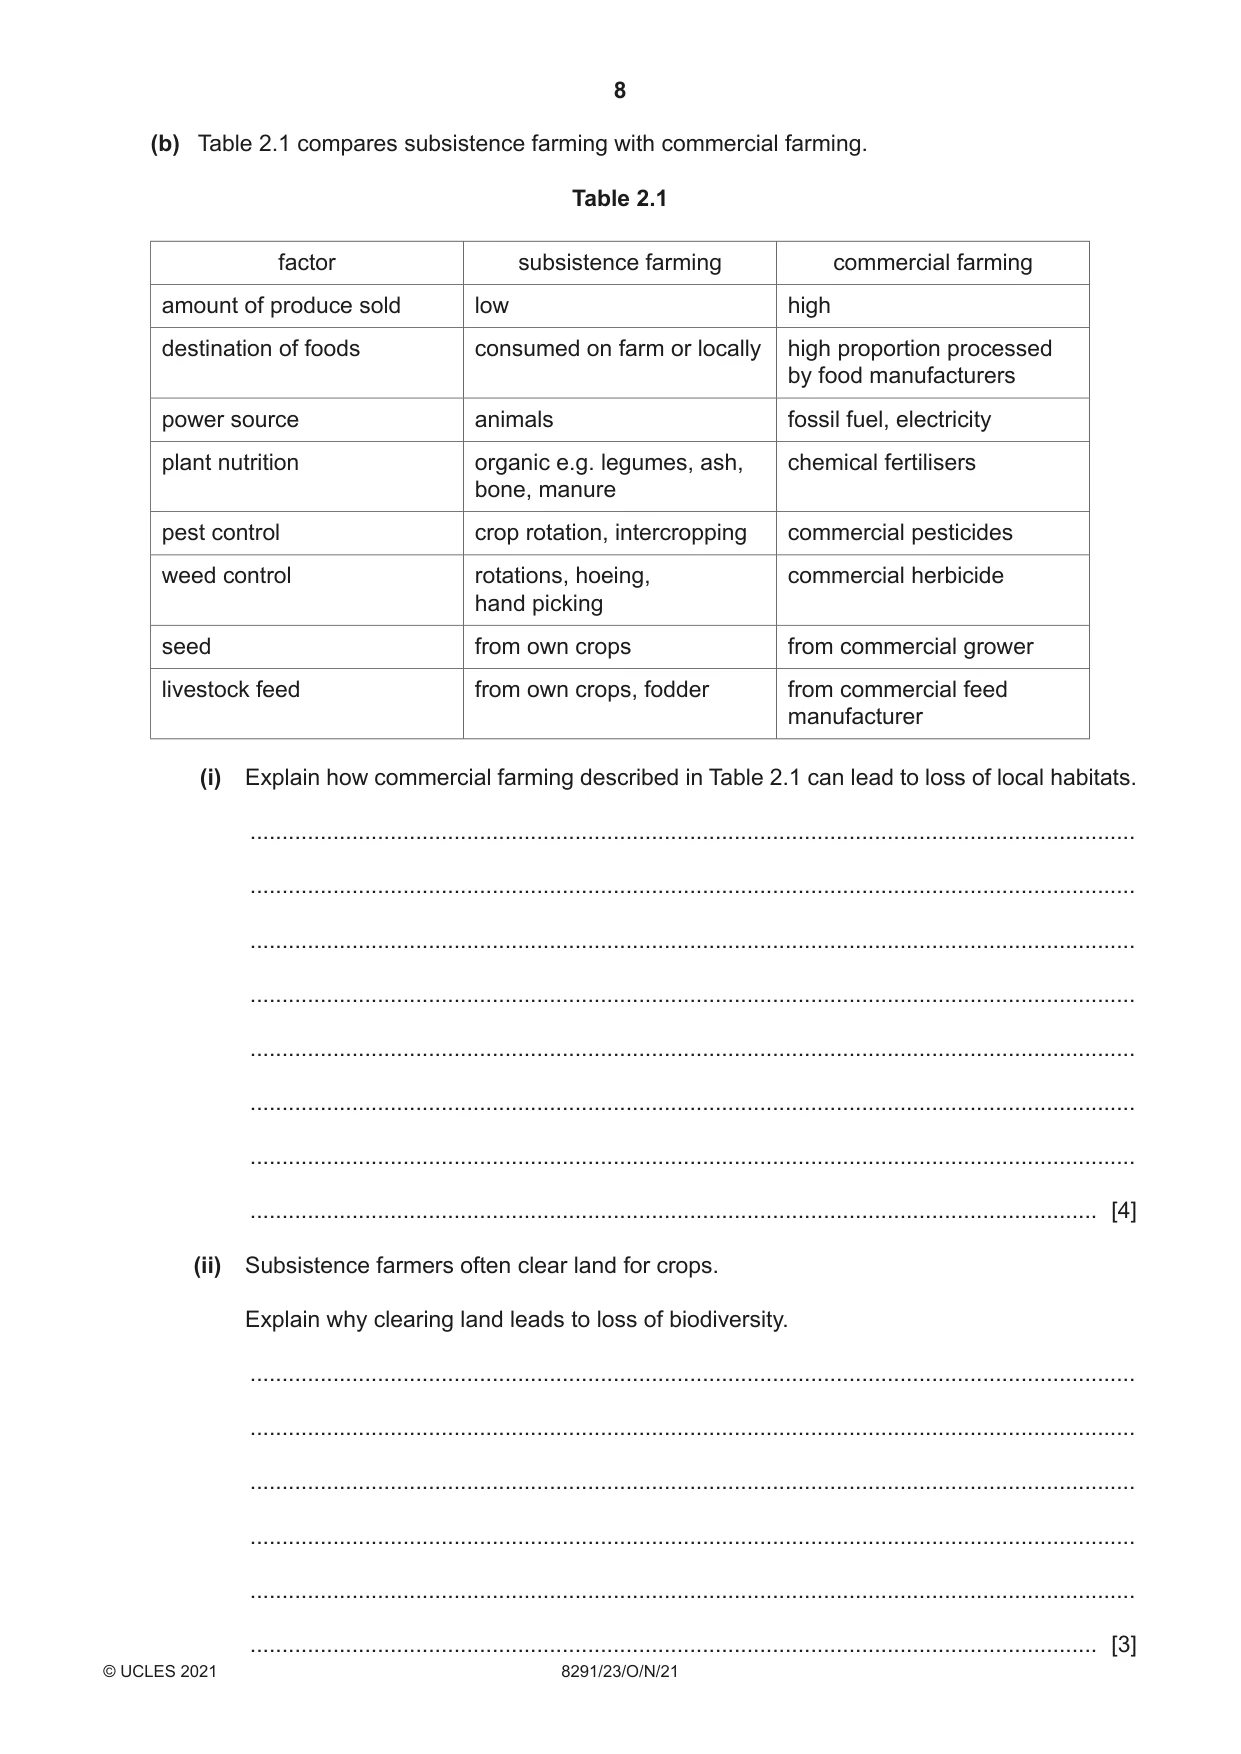
2 Fig. 2.1 shows a habitat changing over time from open water to mixed woodland. Key mixed woodland grasses and shrubs swampy ground open water sediment Fig. 2.1 (a) (i) State the process shown in Fig. 2.1. ..................................................................................................................................... [1] (ii) Explain the reasons for the changes shown in Fig. 2.1. ........................................................................................................................................... ........................................................................................................................................... ........................................................................................................................................... ........................................................................................................................................... ........................................................................................................................................... ........................................................................................................................................... ........................................................................................................................................... ........................................................................................................................................... ........................................................................................................................................... ........................................................................................................................................... ........................................................................................................................................... ..................................................................................................................................... [6] (iii) Explain what is meant by abiotic and biotic factors of an ecosystem. Give an example for each. abiotic ................................................................................................................................ ........................................................................................................................................... ........................................................................................................................................... example ....................................................... biotic .................................................................................................................................. ........................................................................................................................................... ........................................................................................................................................... example ....................................................... [4] (b) Table 2.1 compares subsistence farming with commercial farming. Table 2.1 factor subsistence farming commercial farming amount of produce sold low high destination of foods consumed on farm or locally high proportion processed by food manufacturers power source animals fossil fuel, electricity plant nutrition organic e.g. legumes, ash, chemical fertilisers bone, manure pest control crop rotation, intercropping commercial pesticides weed control rotations, hoeing, commercial herbicide hand picking seed from own crops from commercial grower livestock feed from own crops, fodder from commercial feed manufacturer (i) Explain how commercial farming described in Table 2.1 can lead to loss of local habitats. ........................................................................................................................................... ........................................................................................................................................... ........................................................................................................................................... ........................................................................................................................................... ........................................................................................................................................... ........................................................................................................................................... ........................................................................................................................................... ..................................................................................................................................... [4] (ii) Subsistence farmers often clear land for crops. Explain why clearing land leads to loss of biodiversity. ........................................................................................................................................... ........................................................................................................................................... ........................................................................................................................................... ........................................................................................................................................... ........................................................................................................................................... ..................................................................................................................................... [3] (iii) Describe a strategy to prevent land being cleared for crops. ........................................................................................................................................... ........................................................................................................................................... ........................................................................................................................................... ..................................................................................................................................... [2] [Total: 20]
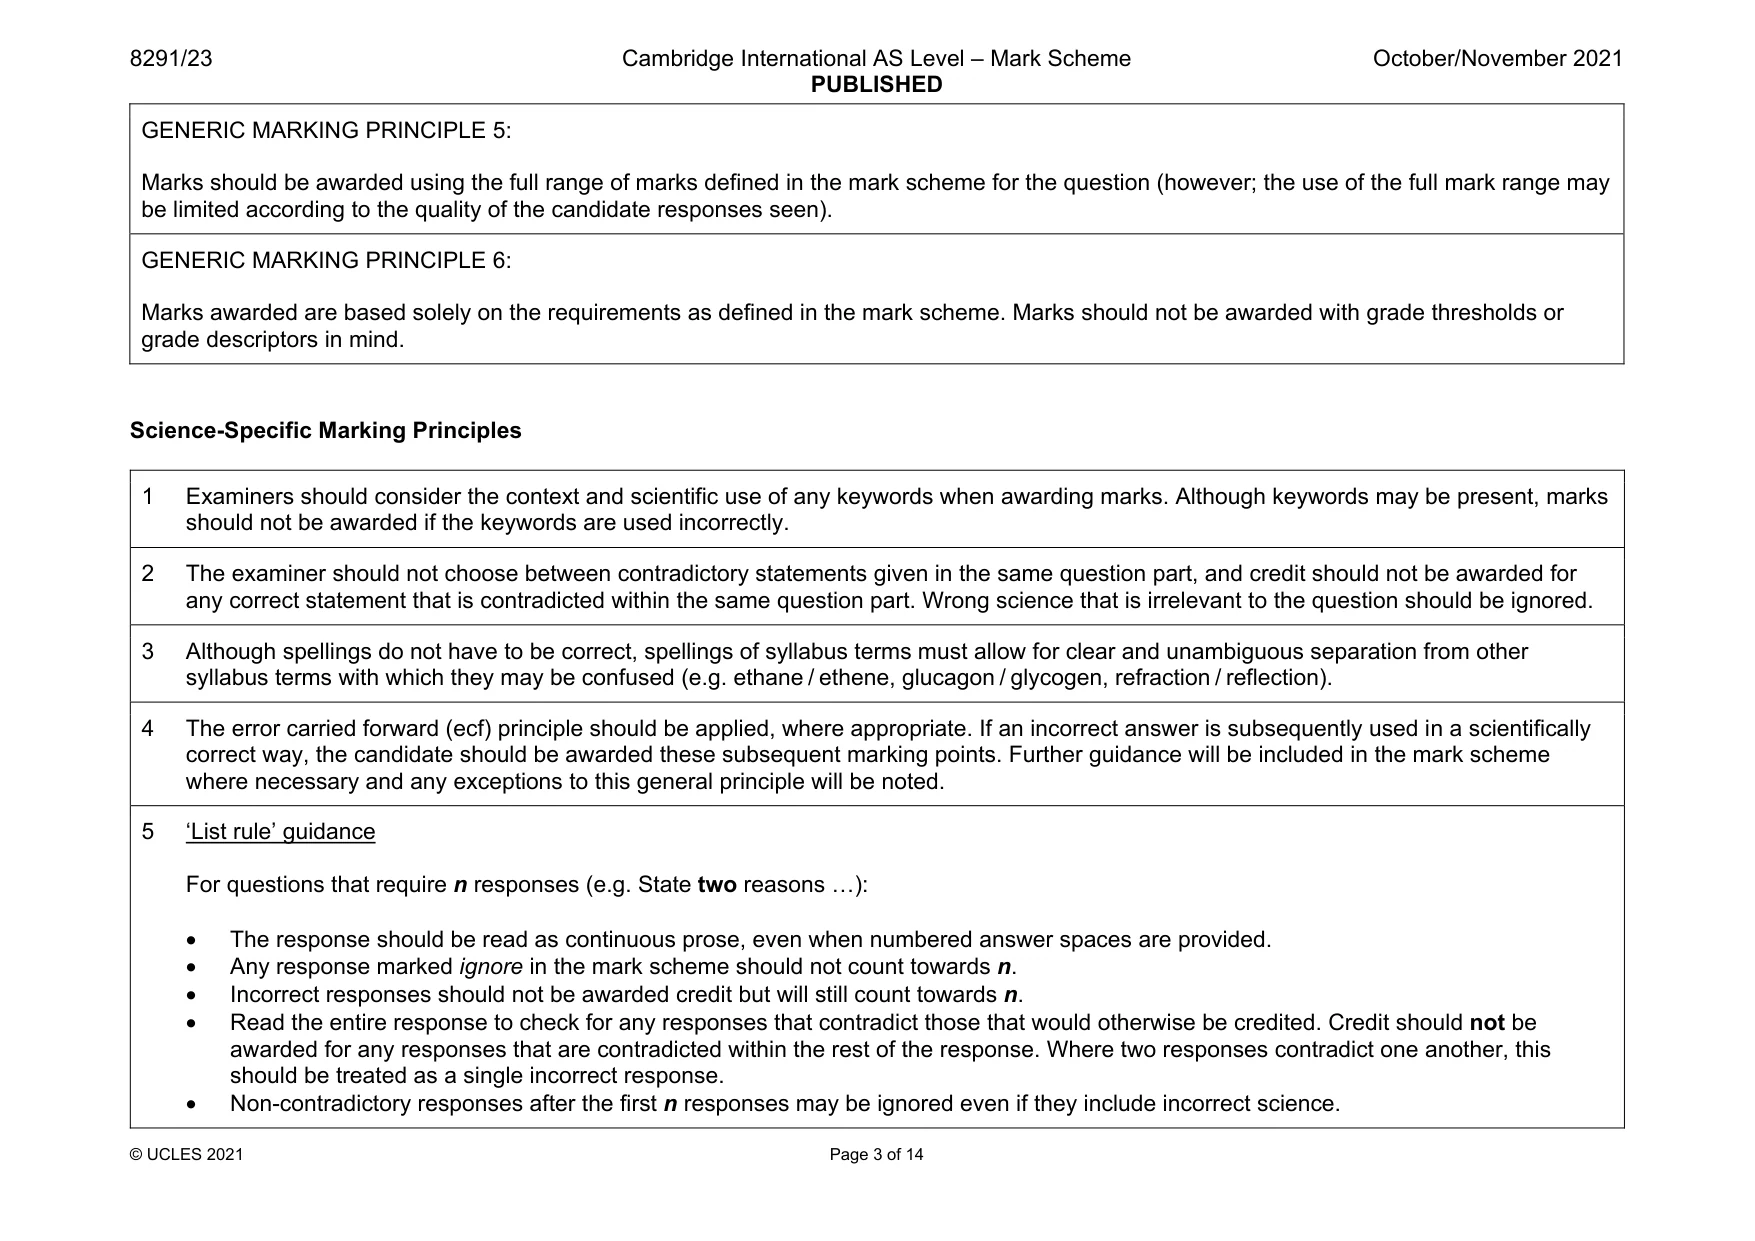
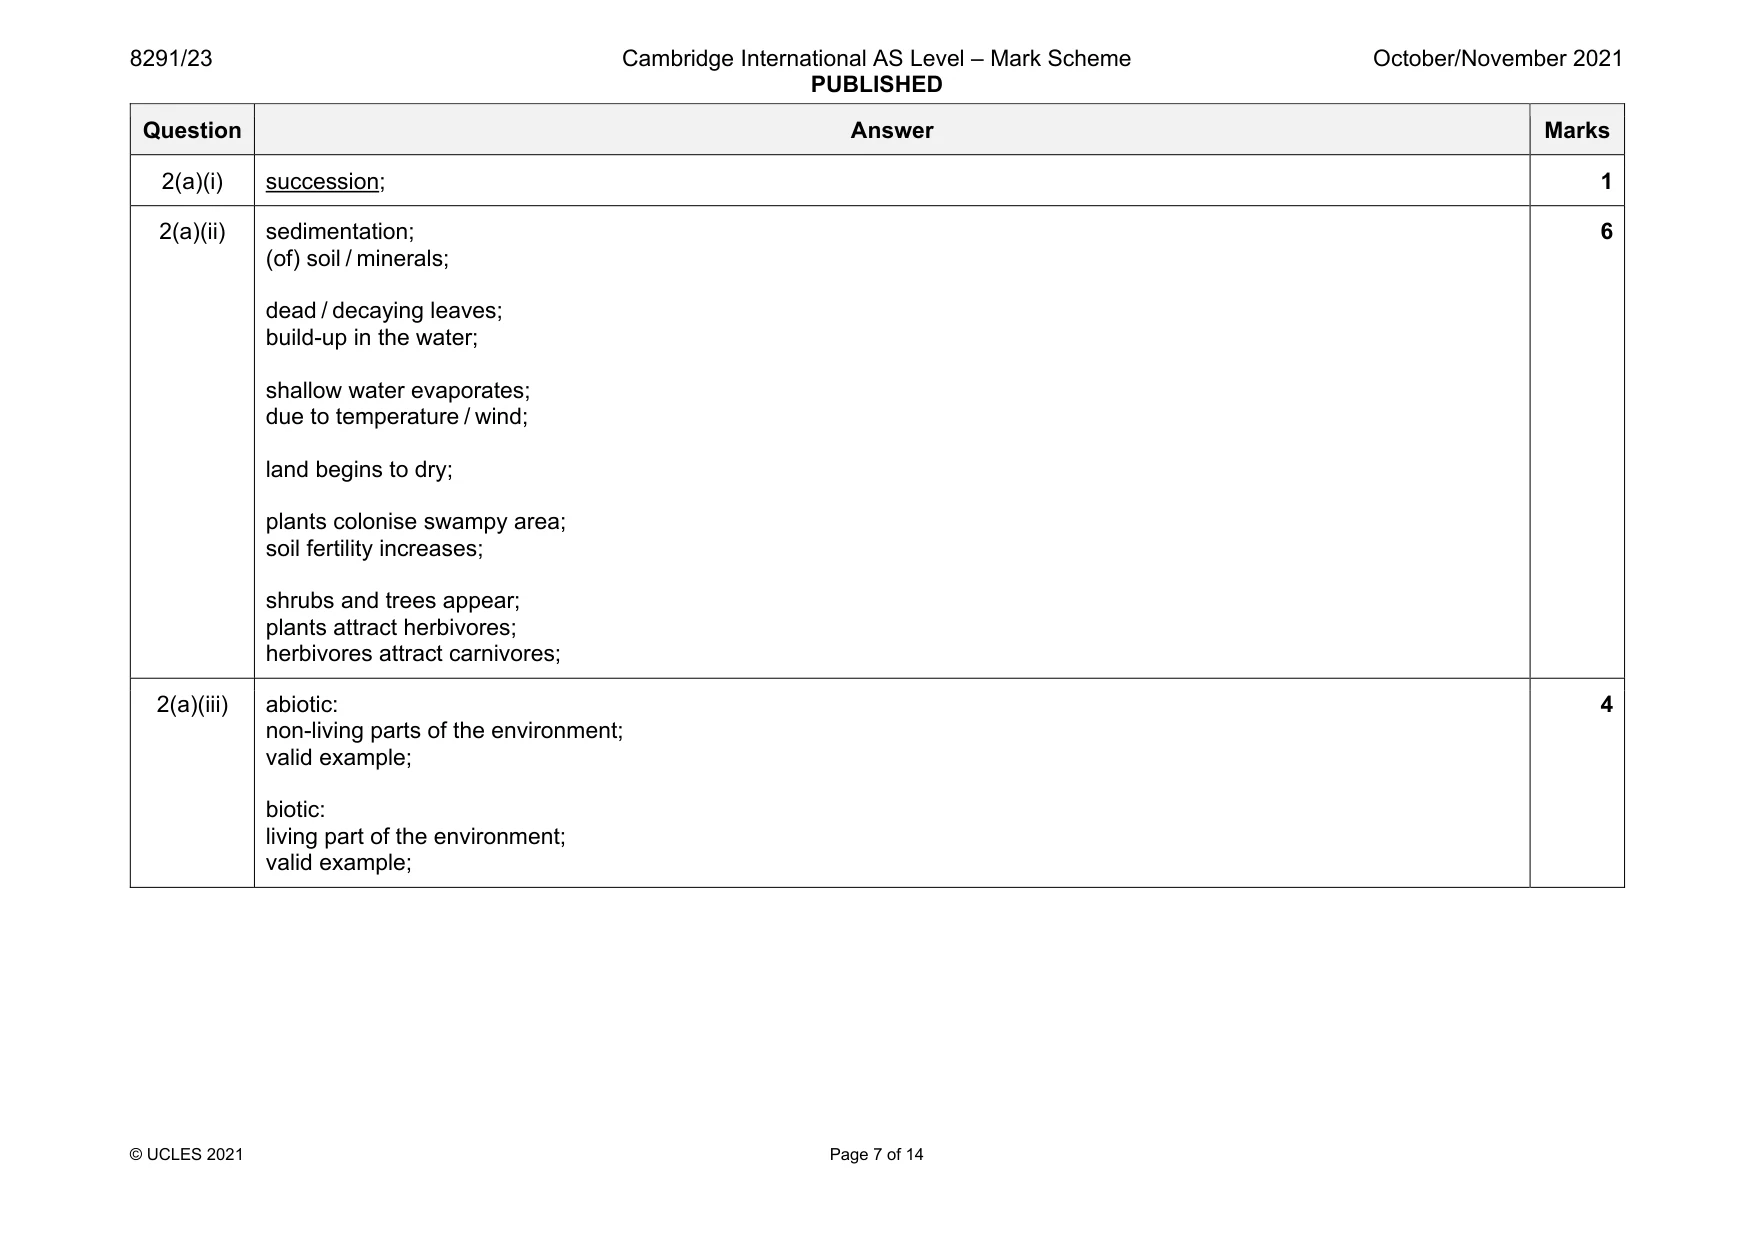
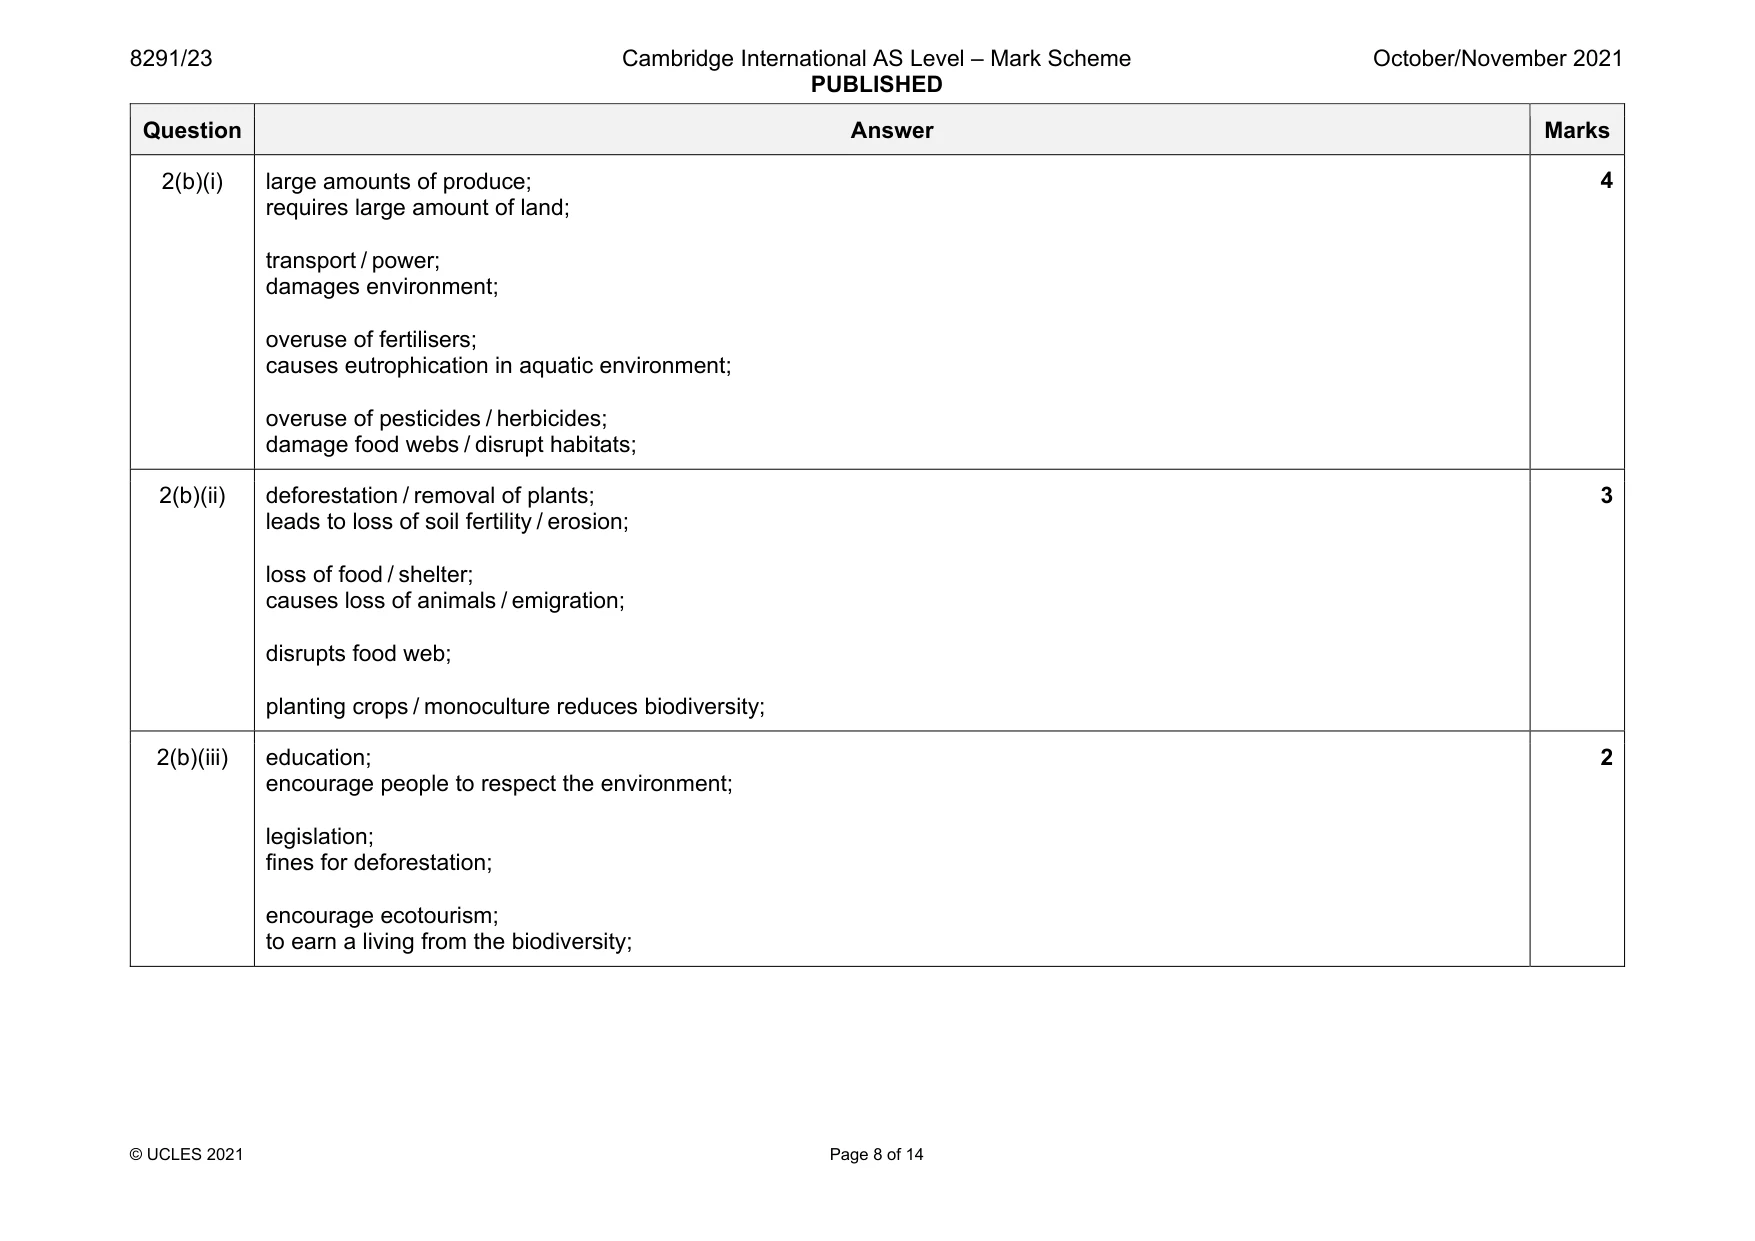
Mark scheme: 2(a)(i) succession; 1 2(a)(ii) sedimentation; (of) soil / minerals; dead / decaying leaves; build-up in the water; shallow water evaporates; due to temperature / wind; land begins to dry; plants colonise swampy area; soil fertility increases; shrubs and trees appear; plants attract herbivores; herbivores attract carnivores; 6 2(a)(iii) abiotic: non-living parts of the environment; valid example; biotic: living part of the environment; valid example; 4 Question Answer Marks 2(b)(i) large amounts of produce; requires large amount of land; transport / power; damages environment; overuse of fertilisers; causes eutrophication in aquatic environment; overuse of pesticides / herbicides; damage food webs / disrupt habitats; 4 2(b)(ii) deforestation / removal of plants; leads to loss of soil fertility / erosion; loss of food / shelter; causes loss of animals / emigration; disrupts food web; planting crops / monoculture reduces biodiversity; 3 2(b)(iii) education; encourage people to respect the environment; legislation; fines for deforestation; encourage ecotourism; to earn a living from the biodiversity; 2
Q3 · Animal breeding programmes and release into National Parks is one method of wildlife…
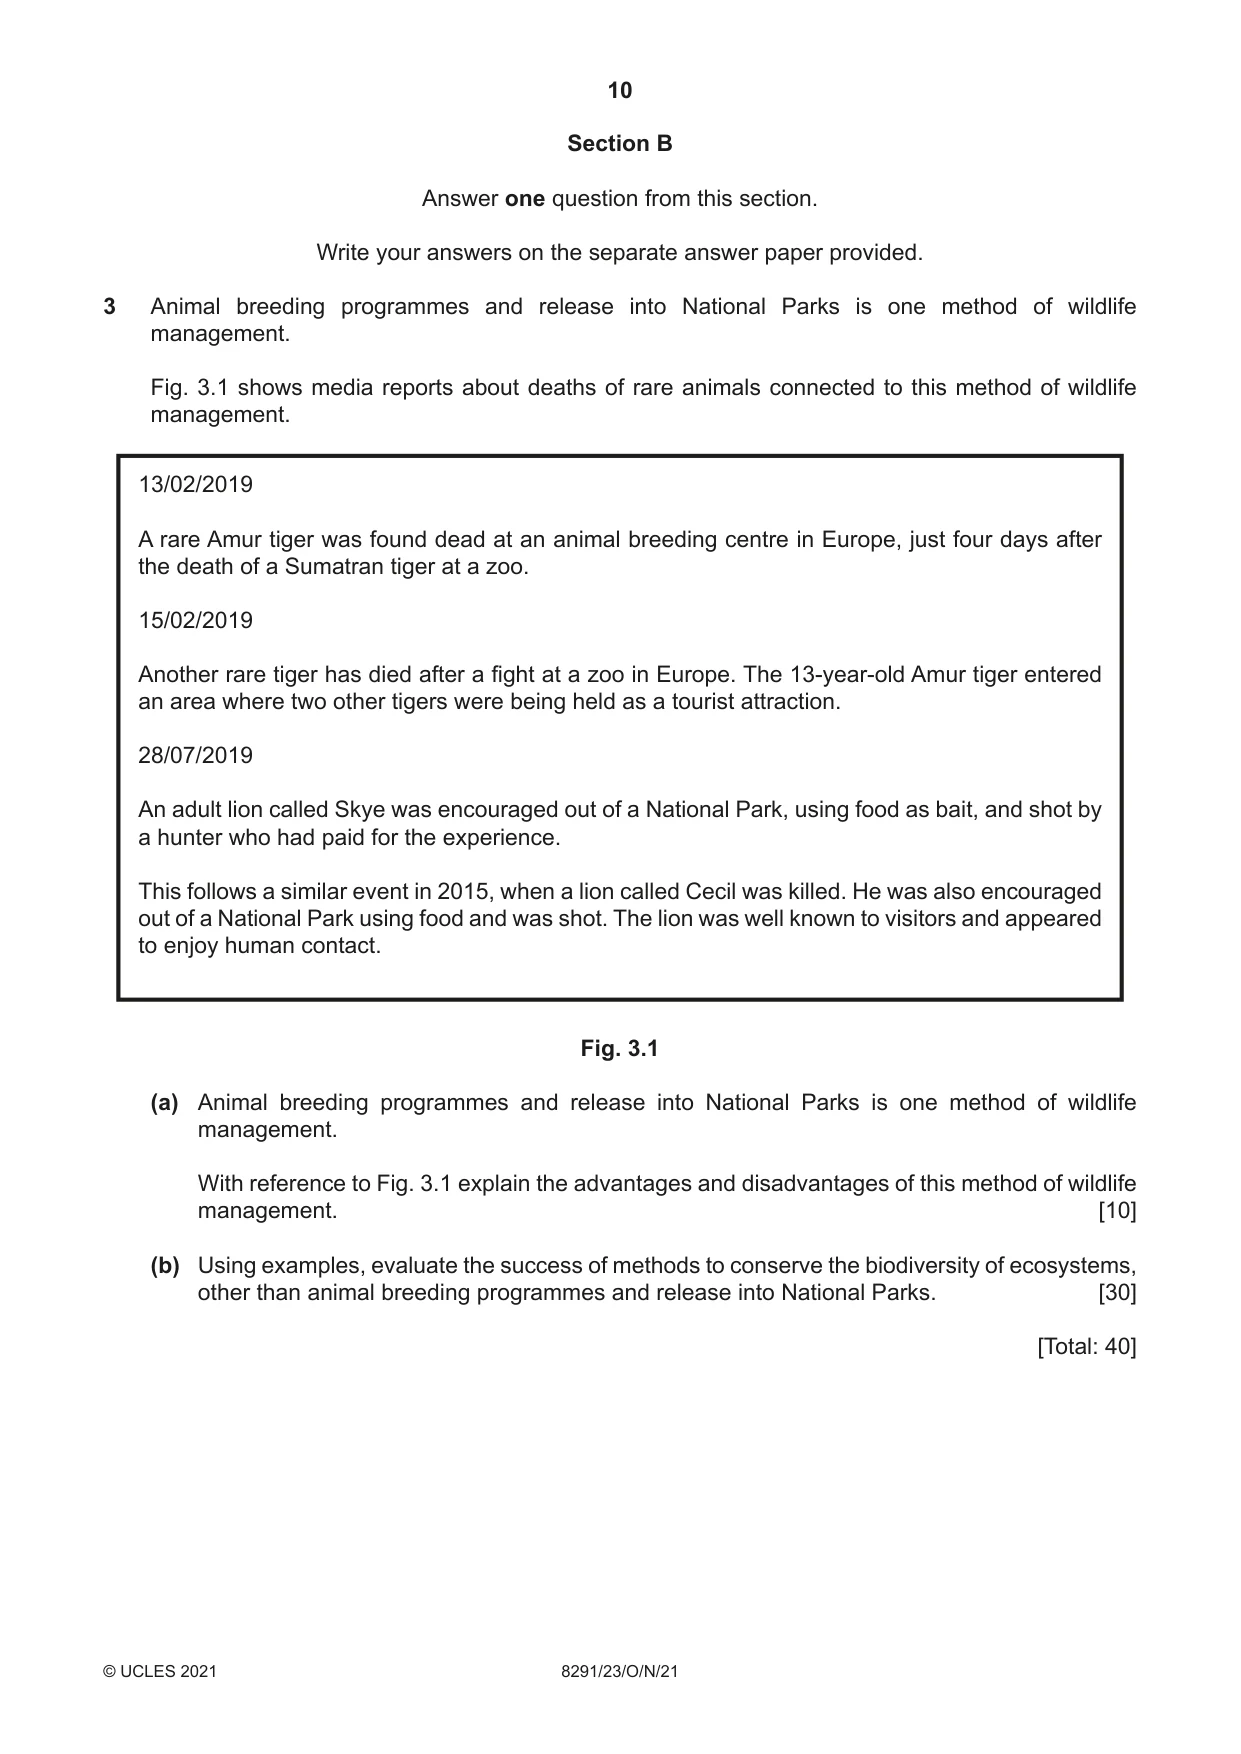
3 Animal breeding programmes and release into National Parks is one method of wildlife management. Fig. 3.1 shows media reports about deaths of rare animals connected to this method of wildlife management. 13/02/2019 A rare Amur tiger was found dead at an animal breeding centre in Europe, just four days after the death of a Sumatran tiger at a zoo. 15/02/2019 Another rare tiger has died after a fight at a zoo in Europe. The 13-year-old Amur tiger entered an area where two other tigers were being held as a tourist attraction. 28/07/2019 An adult lion called Skye was encouraged out of a National Park, using food as bait, and shot by a hunter who had paid for the experience. This follows a similar event in 2015, when a lion called Cecil was killed. He was also encouraged out of a National Park using food and was shot. The lion was well known to visitors and appeared to enjoy human contact. Fig. 3.1 (a) Animal breeding programmes and release into National Parks is one method of wildlife management. With reference to Fig. 3.1 explain the advantages and disadvantages of this method of wildlife management. [10] (b) Using examples, evaluate the success of methods to conserve the biodiversity of ecosystems, other than animal breeding programmes and release into National Parks. [30] [Total: 40]
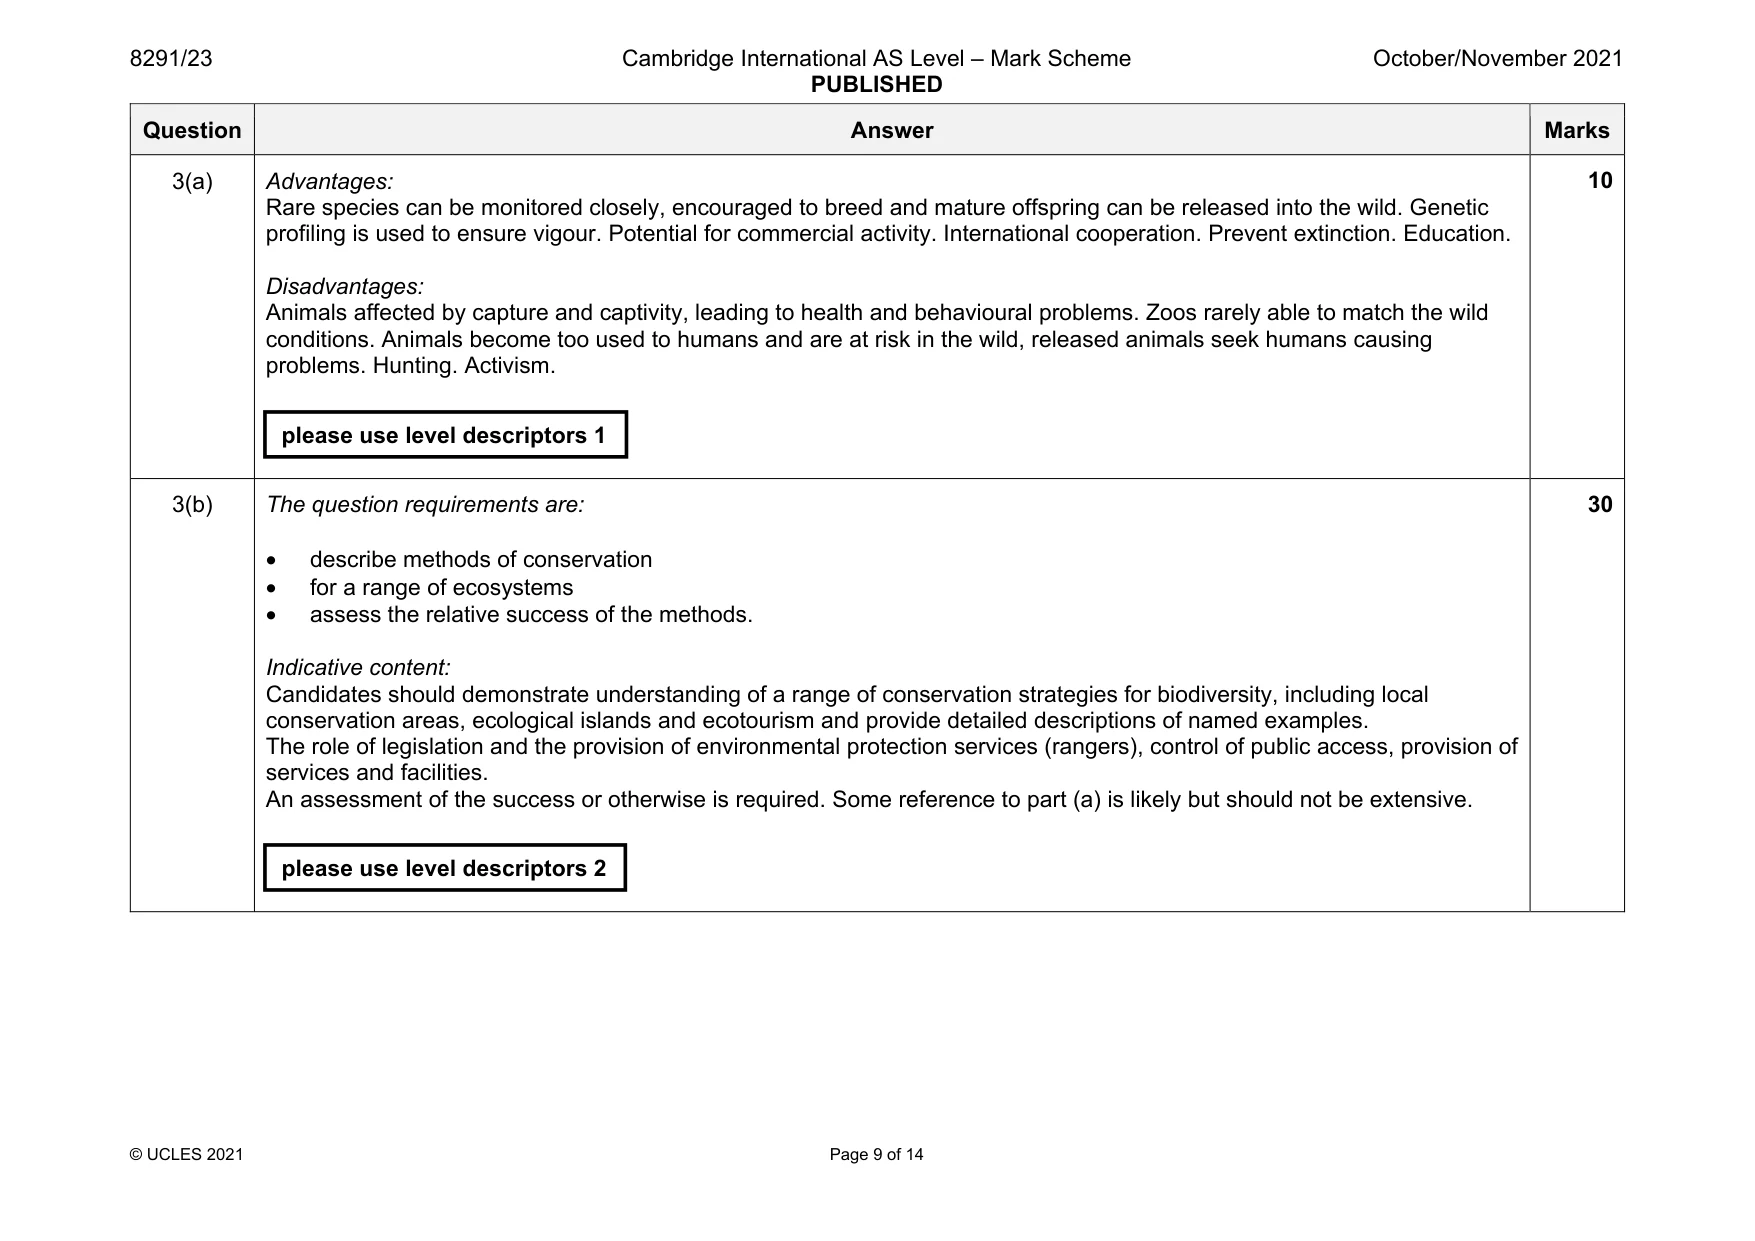
Mark scheme: 3(a) Advantages: Rare species can be monitored closely, encouraged to breed and mature offspring can be released into the wild. Genetic profiling is used to ensure vigour. Potential for commercial activity. International cooperation. Prevent extinction. Education. Disadvantages: Animals affected by capture and captivity, leading to health and behavioural problems. Zoos rarely able to match the wild conditions. Animals become too used to humans and are at risk in the wild, released animals seek humans causing problems. Hunting. Activism. 3(b) The question requirements are: • describe methods of conservation • for a range of ecosystems • assess the relative success of the methods. Indicative content: Candidates should demonstrate understanding of a range of conservation strategies for biodiversity, including local conservation areas, ecological islands and ecotourism and provide detailed descriptions of named examples. The role of legislation and the provision of environmental protection services (rangers), control of public access, provision of services and facilities. An assessment of the success or otherwise is required. Some reference to part (a) is likely but should not be extensive. 30 please use level descriptors 2 please use level descriptors 1
Q4 · A graph of average Arctic sea ice extent for March each year from 1979 – 2019
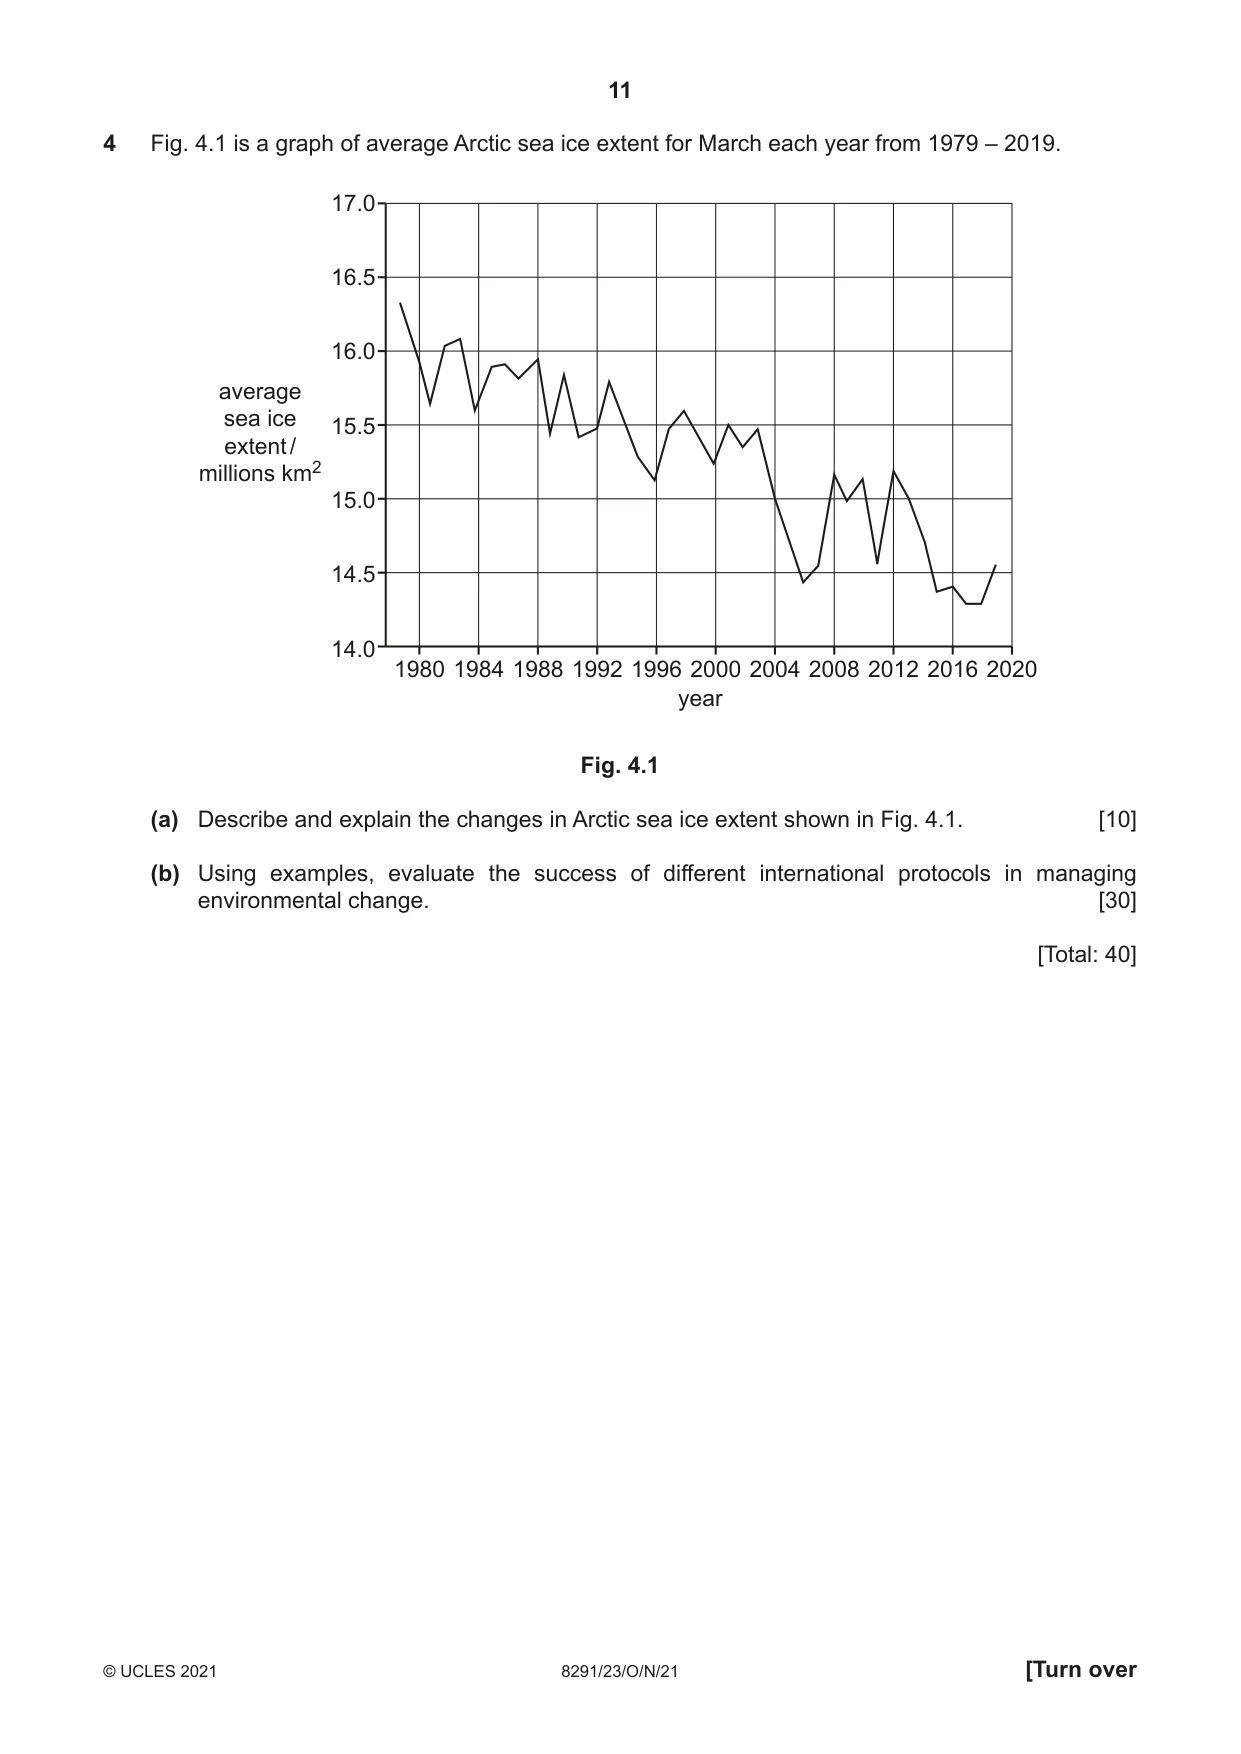
4 Fig. 4.1 is a graph of average Arctic sea ice extent for March each year from 1979 – 2019. 17.0 16.5 16.0 average sea ice 15.5 extent / millions km2 15.0 14.5 14.0 1980 1984 1988 1992 1996 2000 2004 2008 2012 2016 2020 year Fig. 4.1 (a) Describe and explain the changes in Arctic sea ice extent shown in Fig. 4.1. [10] (b) Using examples, evaluate the success of different international protocols in managing environmental change. [30] [Total: 40]
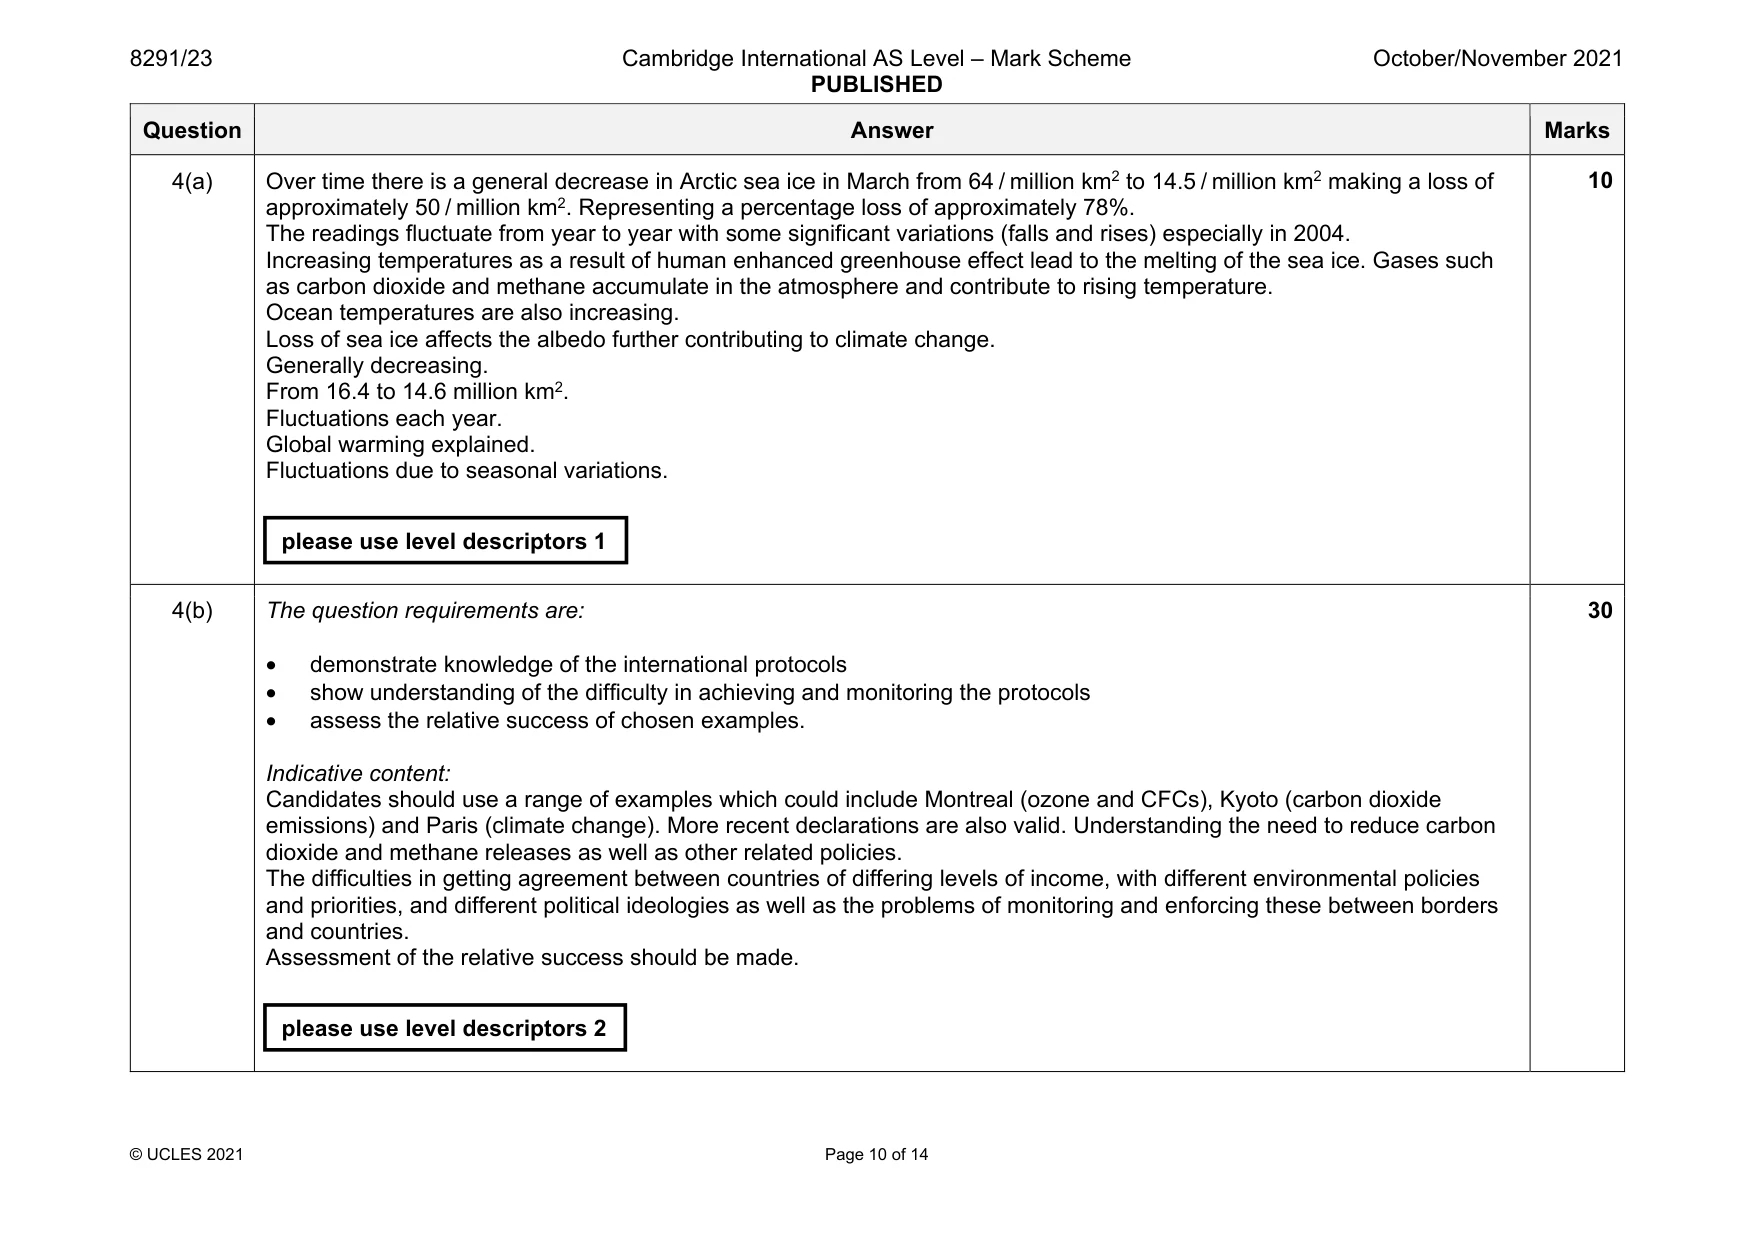
Mark scheme: 4(a) Over time there is a general decrease in Arctic sea ice in March from 64 / million km2 to 14.5 / million km2 making a loss of approximately 50 / million km2. Representing a percentage loss of approximately 78%. The readings fluctuate from year to year with some significant variations (falls and rises) especially in 2004. Increasing temperatures as a result of human enhanced greenhouse effect lead to the melting of the sea ice. Gases such as carbon dioxide and methane accumulate in the atmosphere and contribute to rising temperature. Ocean temperatures are also increasing. Loss of sea ice affects the albedo further contributing to climate change. Generally decreasing. From 16.4 to 14.6 million km2. Fluctuations each year. Global warming explained. Fluctuations due to seasonal variations. 4(b) The question requirements are: • demonstrate knowledge of the international protocols • show understanding of the difficulty in achieving and monitoring the protocols • assess the relative success of chosen examples. Indicative content: Candidates should use a range of examples which could include Montreal (ozone and CFCs), Kyoto (carbon dioxide emissions) and Paris (climate change). More recent declarations are also valid. Understanding the need to reduce carbon dioxide and methane releases as well as other related policies. The difficulties in getting agreement between countries of differing levels of income, with different environmental policies and priorities, and different political ideologies as well as the problems of monitoring and enforcing these between borders and countries. Assessment of the relative success should be made. 30 please use level descriptors 1 please use level descriptors 2
Q5 · A graph showing human population from 1800 with a prediction to 2100
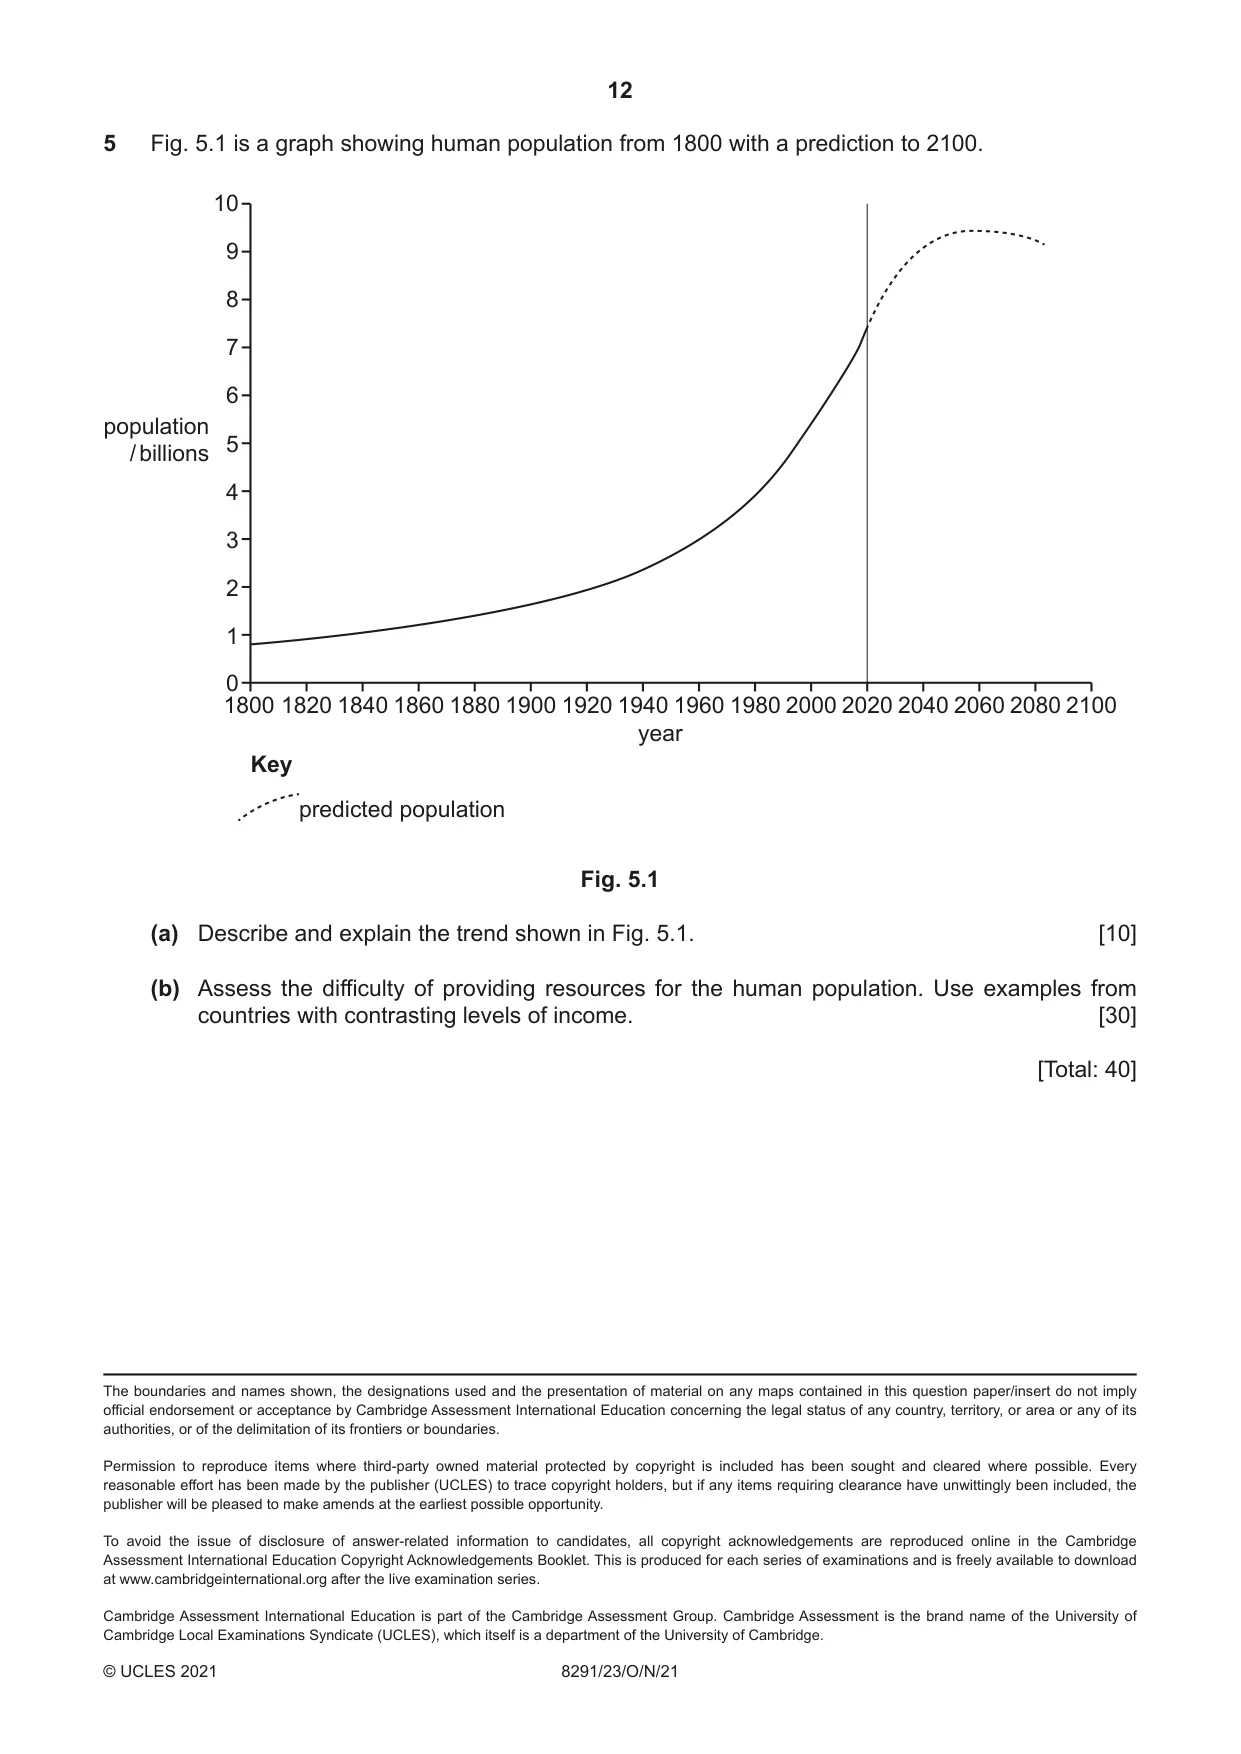
5 Fig. 5.1 is a graph showing human population from 1800 with a prediction to 2100. 10 9 8 7 6 population 5 / billions 4 3 2 1 0 1800 1820 1840 1860 1880 1900 1920 1940 1960 1980 2000 2020 2040 2060 2080 2100 year Key predicted population Fig. 5.1 (a) Describe and explain the trend shown in Fig. 5.1. [10] (b) Assess the difficulty of providing resources for the human population. Use examples from countries with contrasting levels of income. [30] [Total: 40] The boundaries and names shown, the designations used and the presentation of material on any maps contained in this question paper/insert do not imply official endorsement or acceptance by Cambridge Assessment International Education concerning the legal status of any country, territory, or area or any of its authorities, or of the delimitation of its frontiers or boundaries.
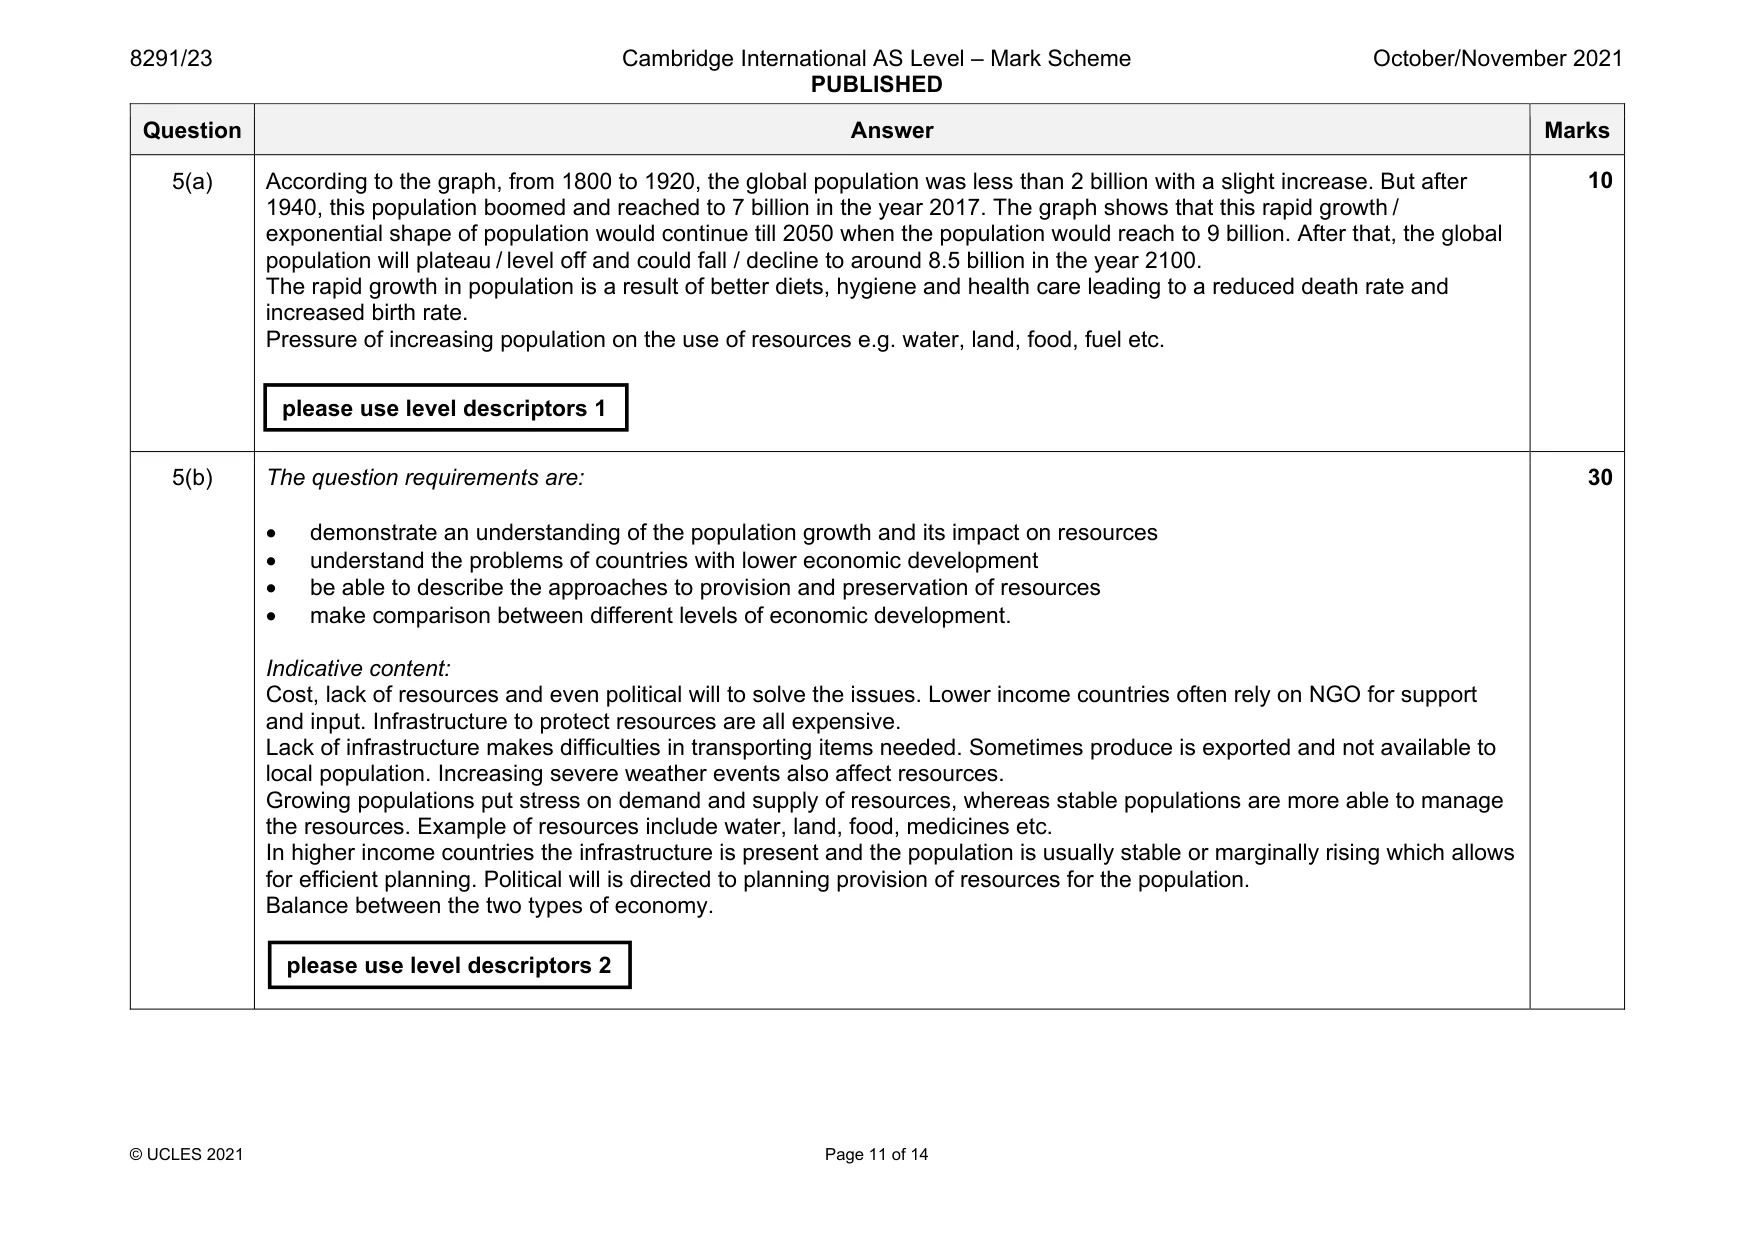
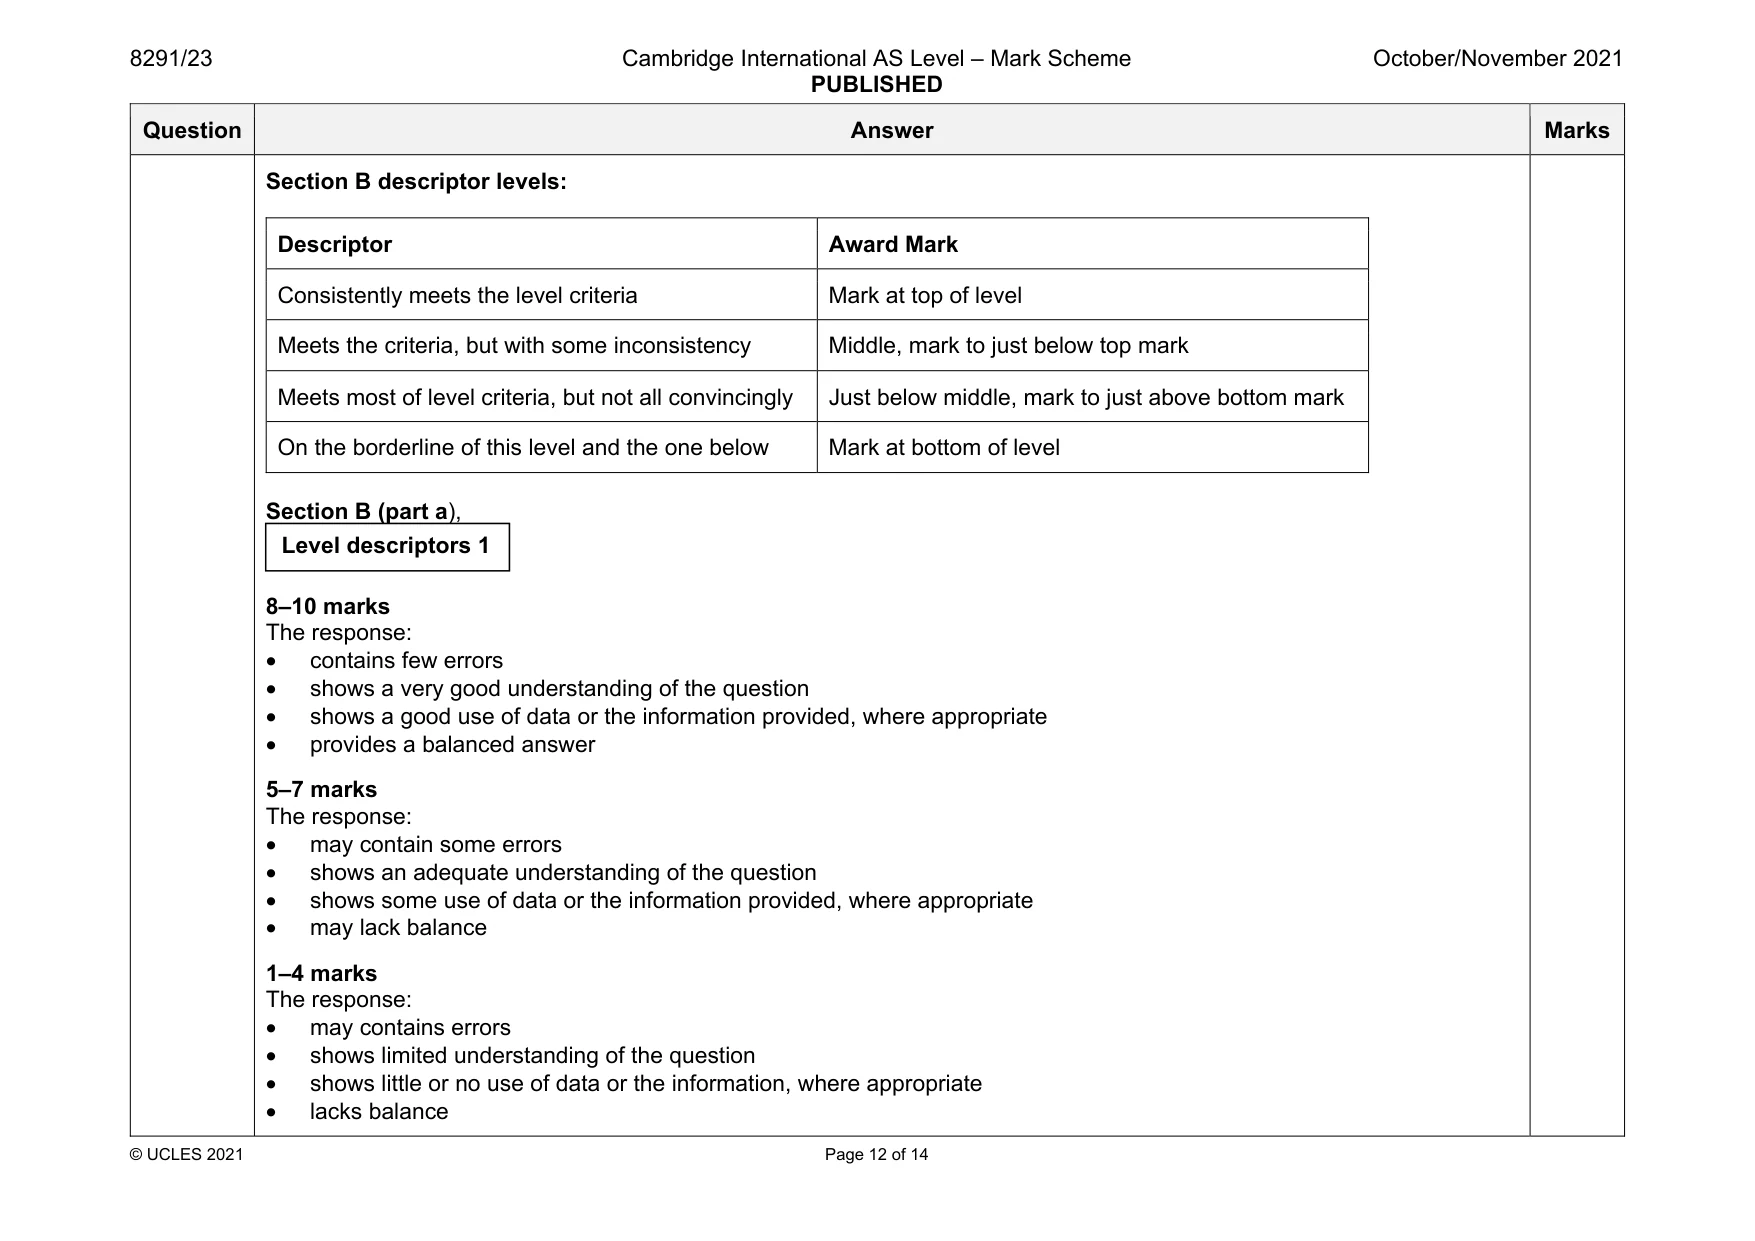
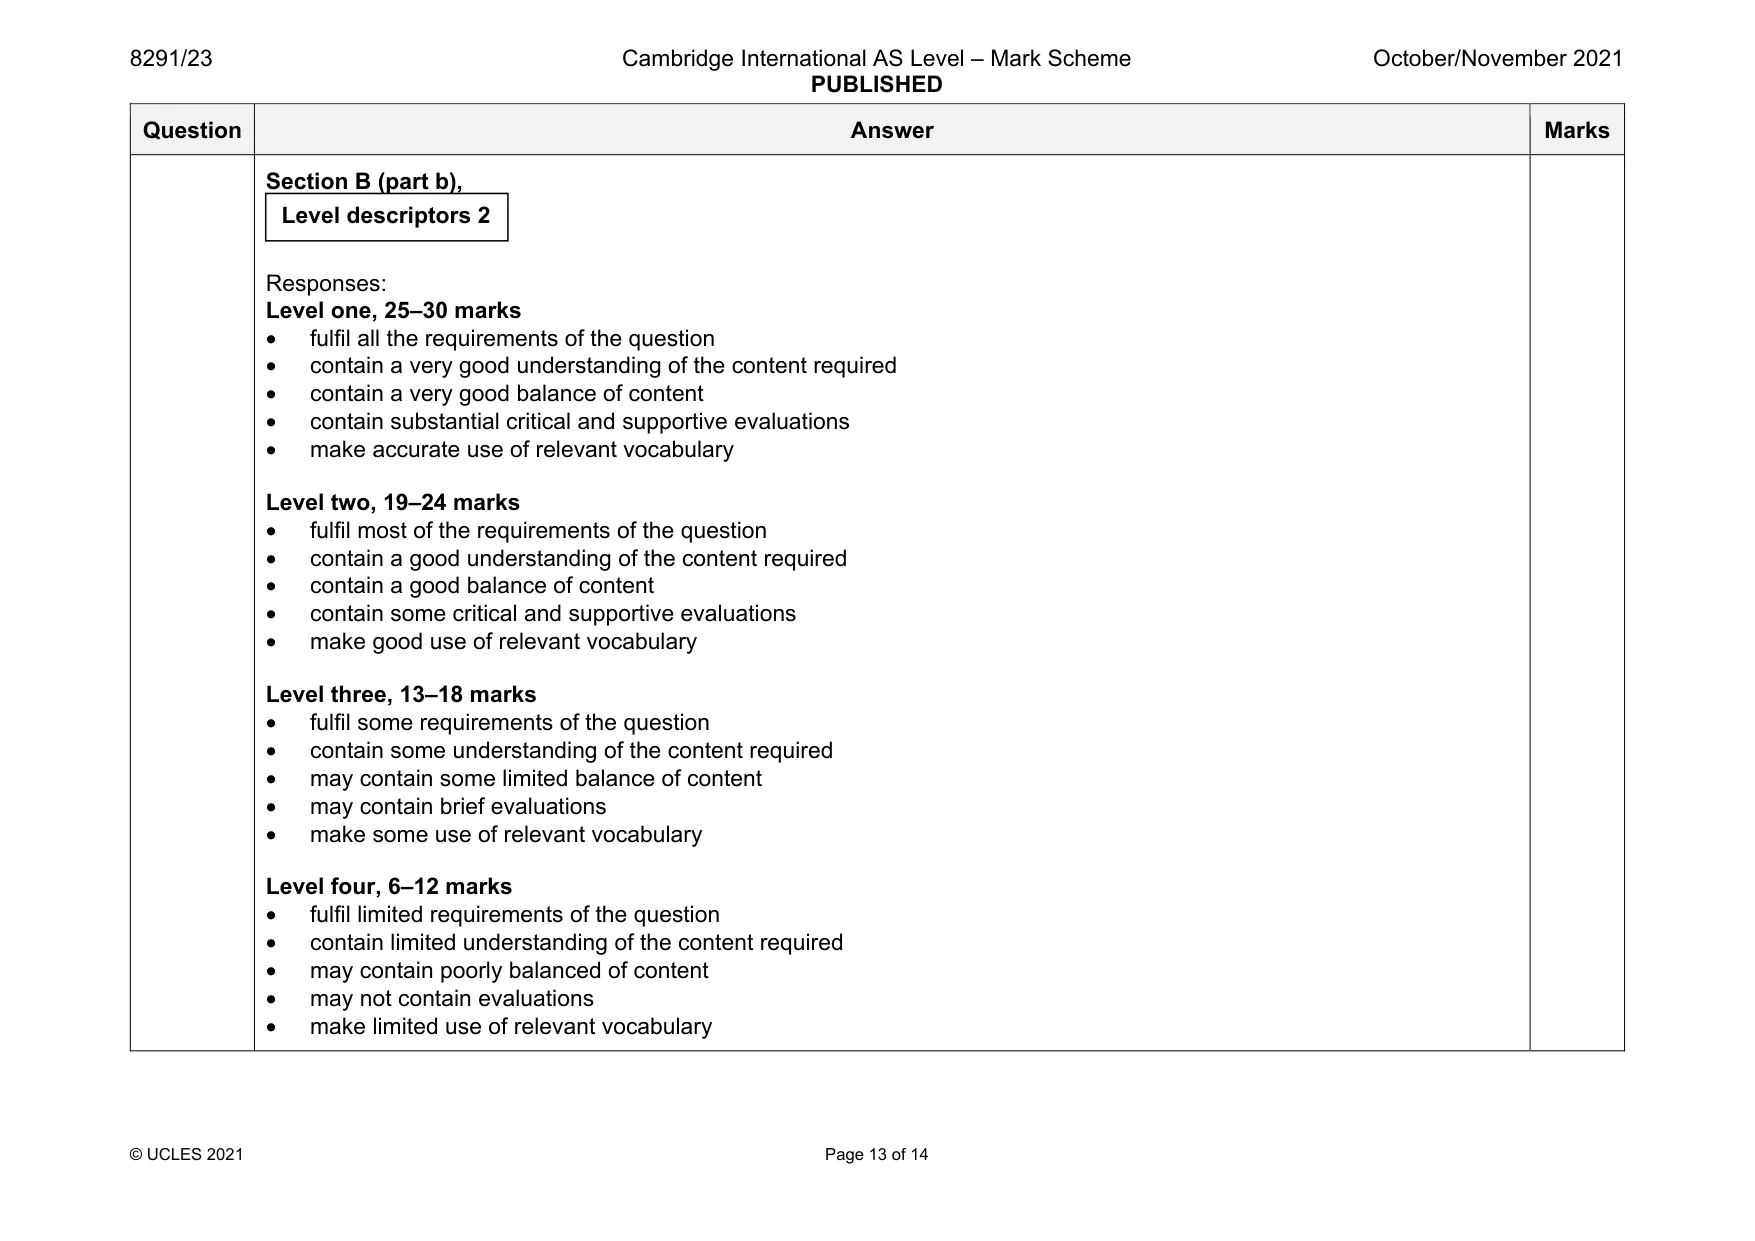
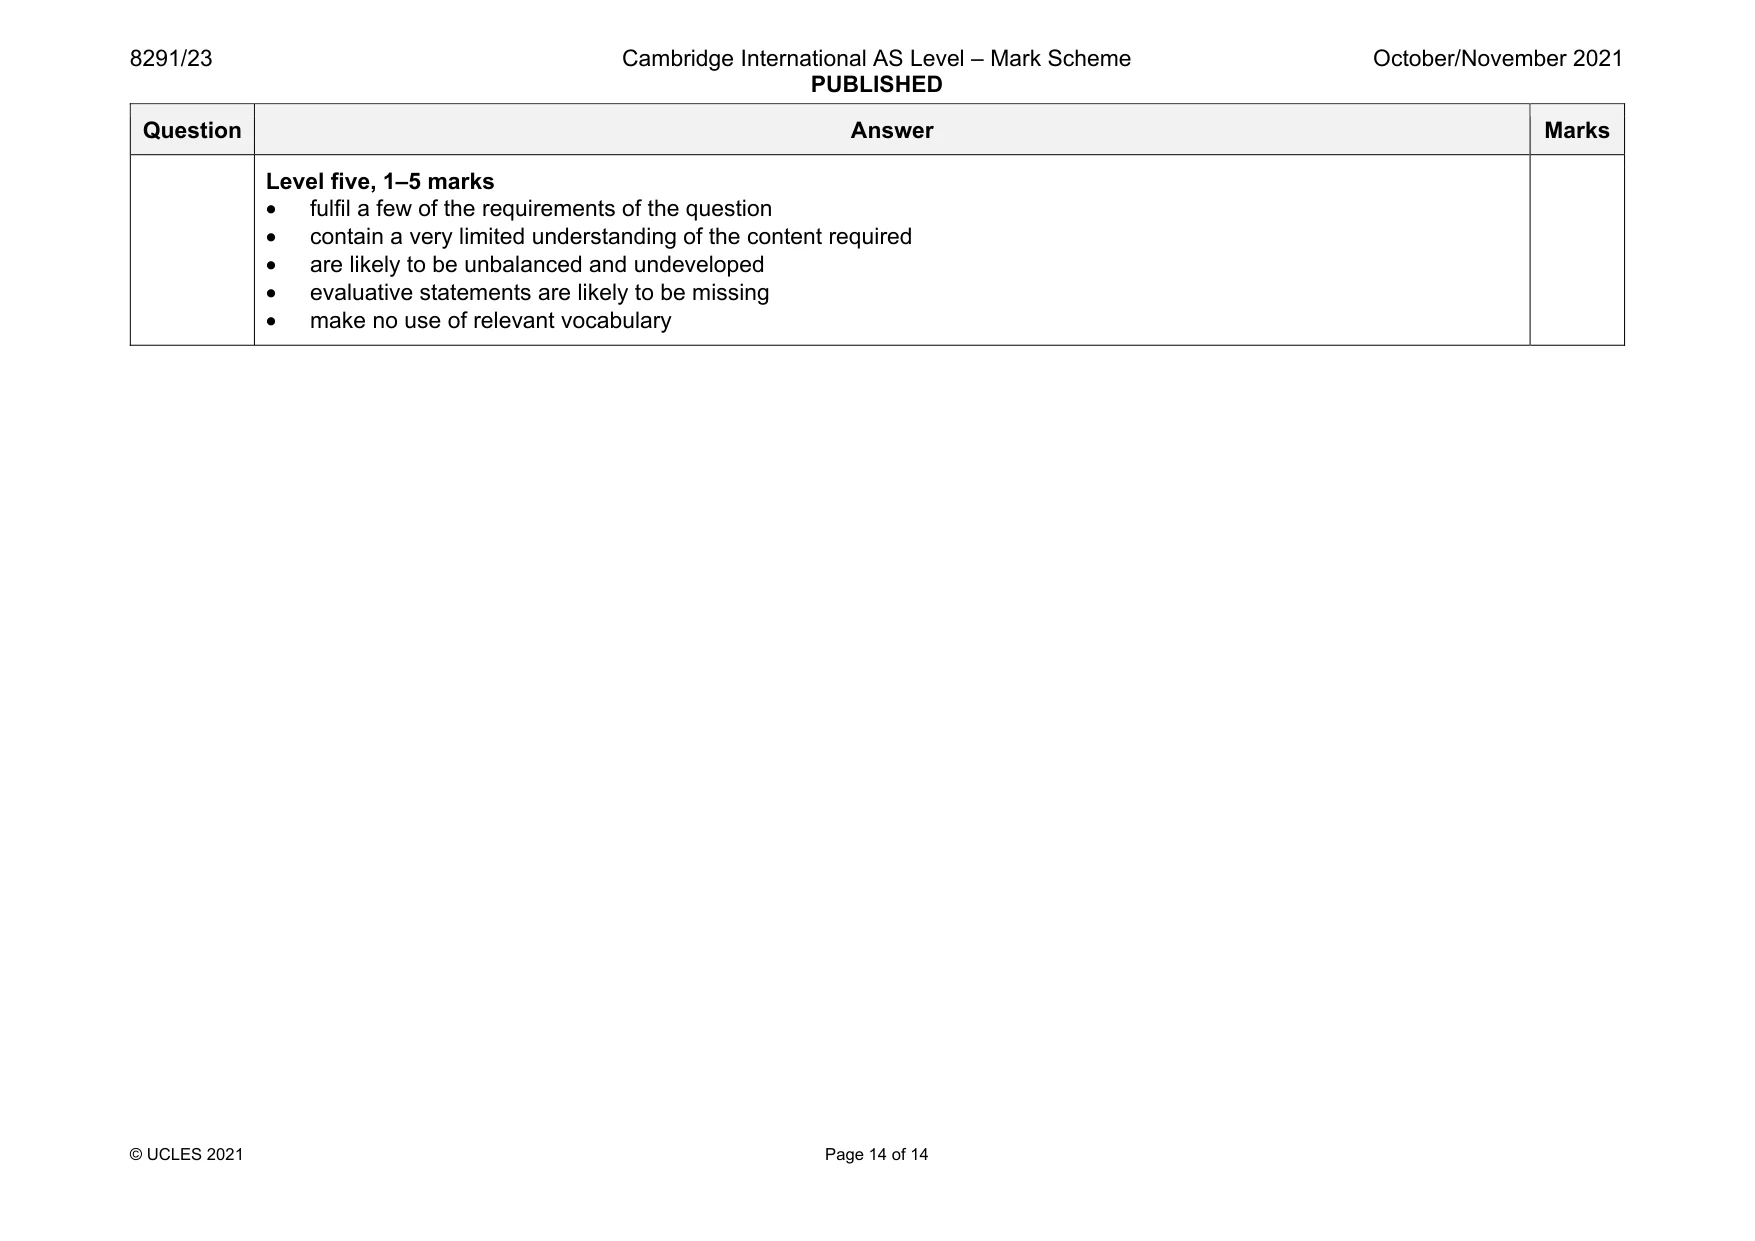
Mark scheme: 5(a) According to the graph, from 1800 to 1920, the global population was less than 2 billion with a slight increase. But after 1940, this population boomed and reached to 7 billion in the year 2017. The graph shows that this rapid growth / exponential shape of population would continue till 2050 when the population would reach to 9 billion. After that, the global population will plateau / level off and could fall / decline to around 8.5 billion in the year 2100. The rapid growth in population is a result of better diets, hygiene and health care leading to a reduced death rate and increased birth rate. Pressure of increasing population on the use of resources e.g. water, land, food, fuel etc. 5(b) The question requirements are: • demonstrate an understanding of the population growth and its impact on resources • understand the problems of countries with lower economic development • be able to describe the approaches to provision and preservation of resources • make comparison between different levels of economic development. Indicative content: Cost, lack of resources and even political will to solve the issues. Lower income countries often rely on NGO for support and input. Infrastructure to protect resources are all expensive. Lack of infrastructure makes difficulties in transporting items needed. Sometimes produce is exported and not available to local population. Increasing severe weather events also affect resources. Growing populations put stress on demand and supply of resources, whereas stable populations are more able to manage the resources. Example of resources include water, land, food, medicines etc. In higher income countries the infrastructure is present and the population is usually stable or marginally rising which allows for efficient planning. Political will is directed to planning provision of resources for the population. Balance between the two types of economy. 30 please use level descriptors 2 please use level descriptors 1 Question Answer Marks Section B descriptor levels: Descriptor Award Mark Consistently meets the level criteria Mark at top of level Meets the criteria, but with some inconsistency Middle, mark to just below top mark Meets most of level criteria, but not all convincingly Just below middle, mark to just above bottom mark On the borderline of this level and the one below Mark at bottom of level Section B (part a), 8–10 marks The response: • contains few errors • shows a very good understanding of the question • shows a good use of data or the information provided, where appropriate • provides a balanced answer 5–7 marks The response: • may contain some errors • shows an adequate understanding of the question • shows some use of data or the information provided, where appropriate • may lack balance 1–4 marks The response: • may contains errors • shows limited understanding of the question • shows little or no use of data or the information, where appropriate • lacks balance Level descriptors 1 Question Answer Marks Section B (part b), Responses: Level one, 25–30 marks • fulfil all the requirements of the question • contain a very good understanding of the content required • contain a very good balance of content • contain substantial critical and supportive evaluations • make accurate use of relevant vocabulary Level two, 19–24 marks • fulfil most of the requirements of the question • contain a good understanding of the content required • contain a good balance of content • contain some critical and supportive evaluations • make good use of relevant vocabulary Level three, 13–18 marks • fulfil some requirements of the question • contain some understanding of the content required • may contain some limited balance of content • may contain brief evaluations • make some use of relevant vocabulary Level four, 6–12 marks • fulfil limited requirements of the question • contain limited understanding of the content required • may contain poorly balanced of content • may not contain evaluations • make limited use of relevant vocabulary Level descriptors 2 Question Answer Marks Level five, 1–5 marks • fulfil a few of the requirements of the question • contain a very limited understanding of the content required • are likely to be unbalanced and undeveloped • evaluative statements are likely to be missing • make no use of relevant vocabulary
What was in this paper
The subtopics covered by these 5 questions, and how many questions each got. Open one in a new tab to see every Cambridge question on it.
What you needed in this session
Cambridge’s own grade thresholds for 2021 Oct/Nov, Paper 2 · Variant 3. A higher threshold means an easier paper — the bar moves with how the cohort did.