Cambridge A Level Environmental Management (AS only) 8291 — 2021 May/June Paper 2 · Variant 2
8291/22/M/J/21 · 5 questions · 80 marks · ≈90 min
The question paper and its mark scheme, free to read here and free to download. This is Cambridge’s own paper, exactly as it was sat.
Question paper16 pages



Mark scheme15 pages
Answers below. Sit the paper first if you are practising.
Questions as text
Q1 · The international border between the Caribbean countries Haiti and Dominican Republic
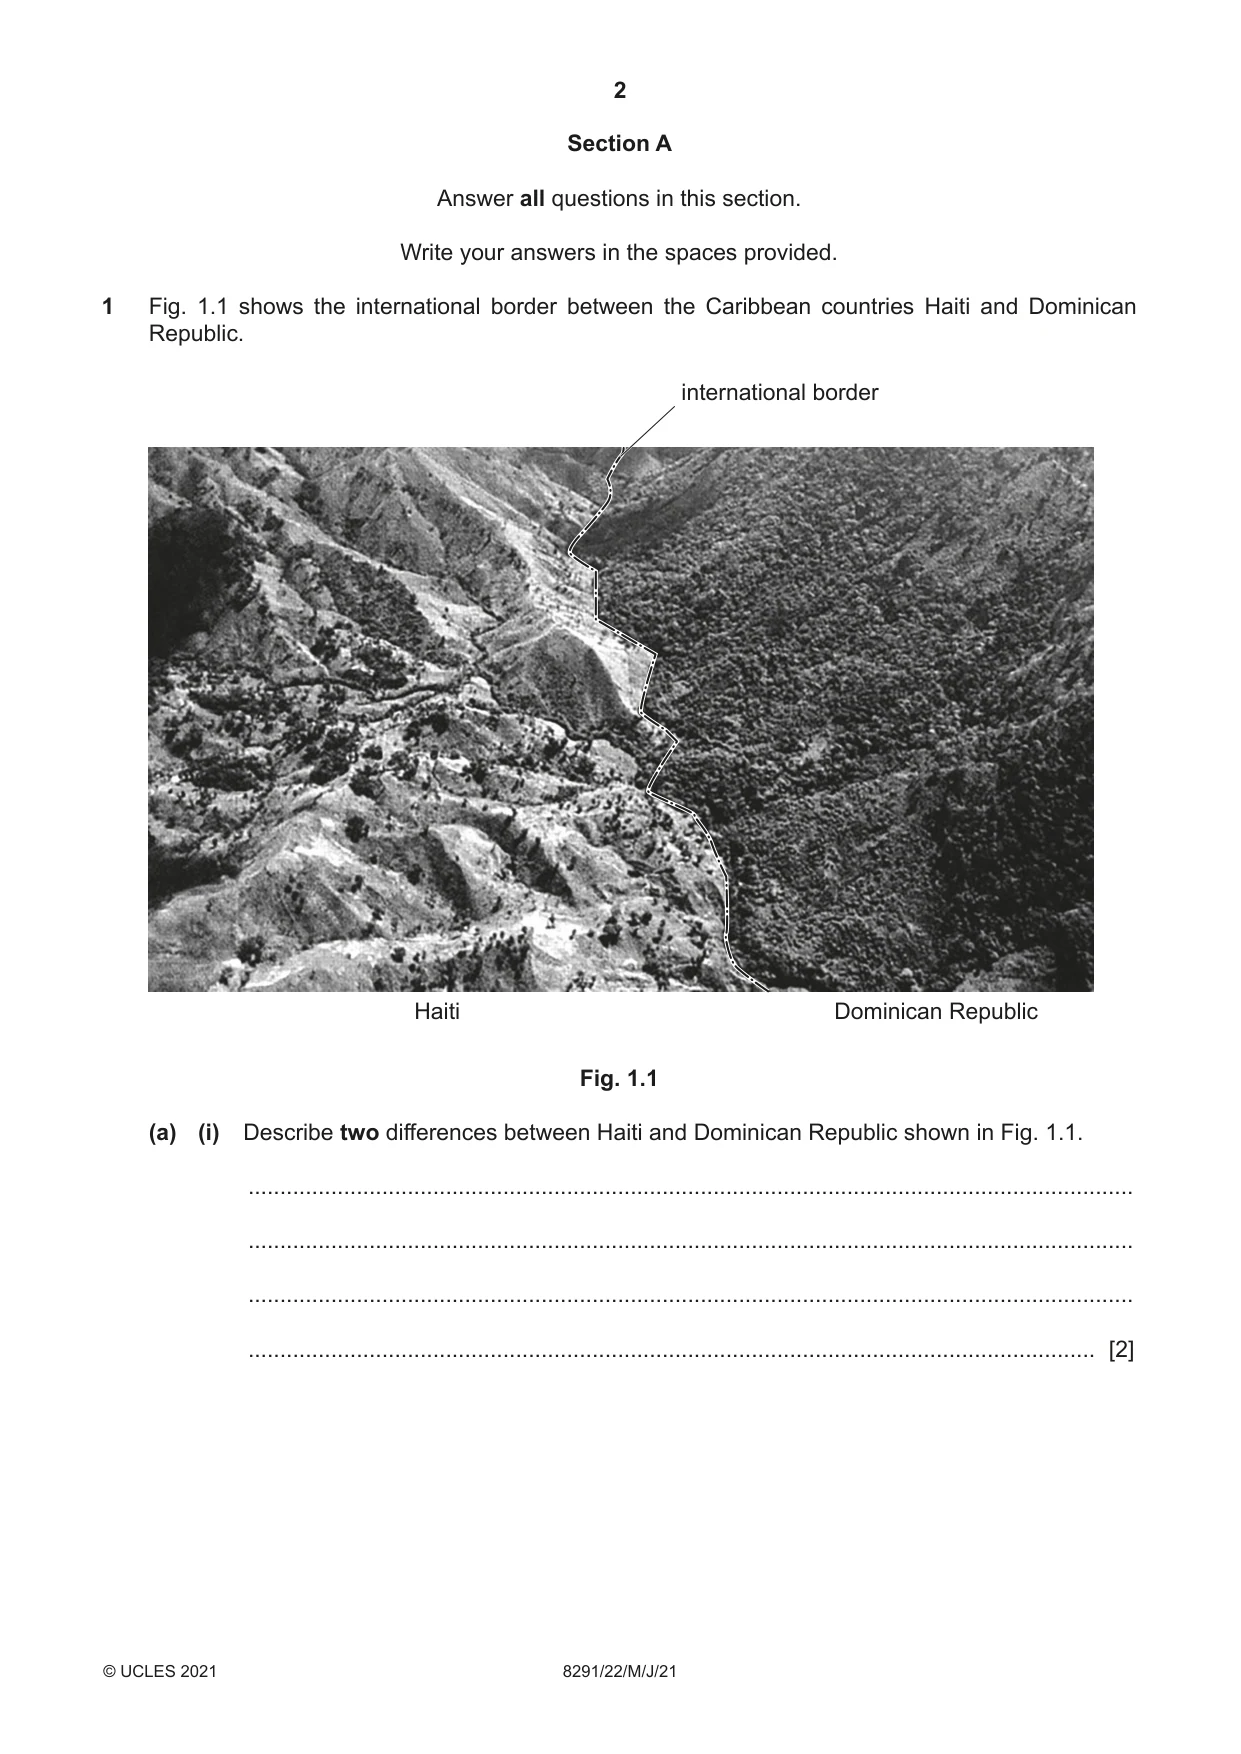
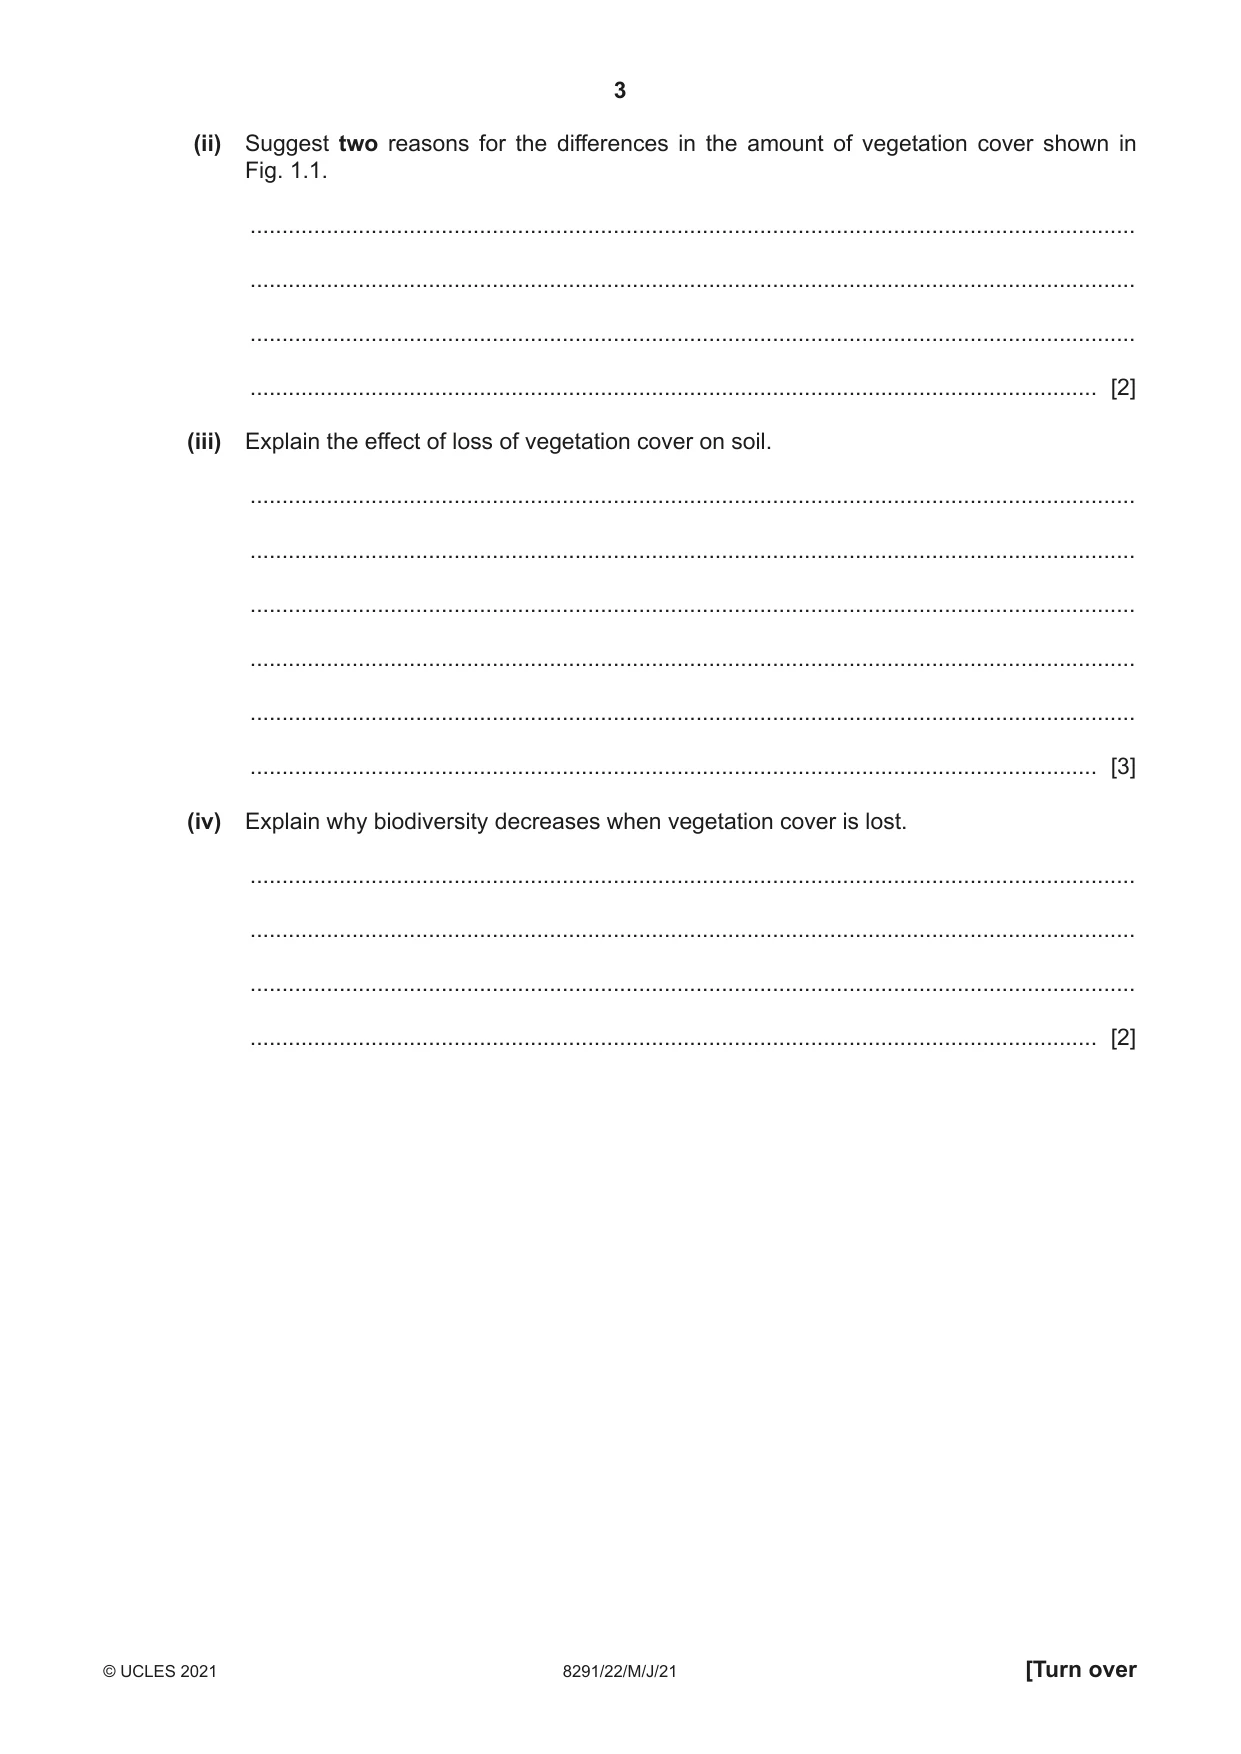
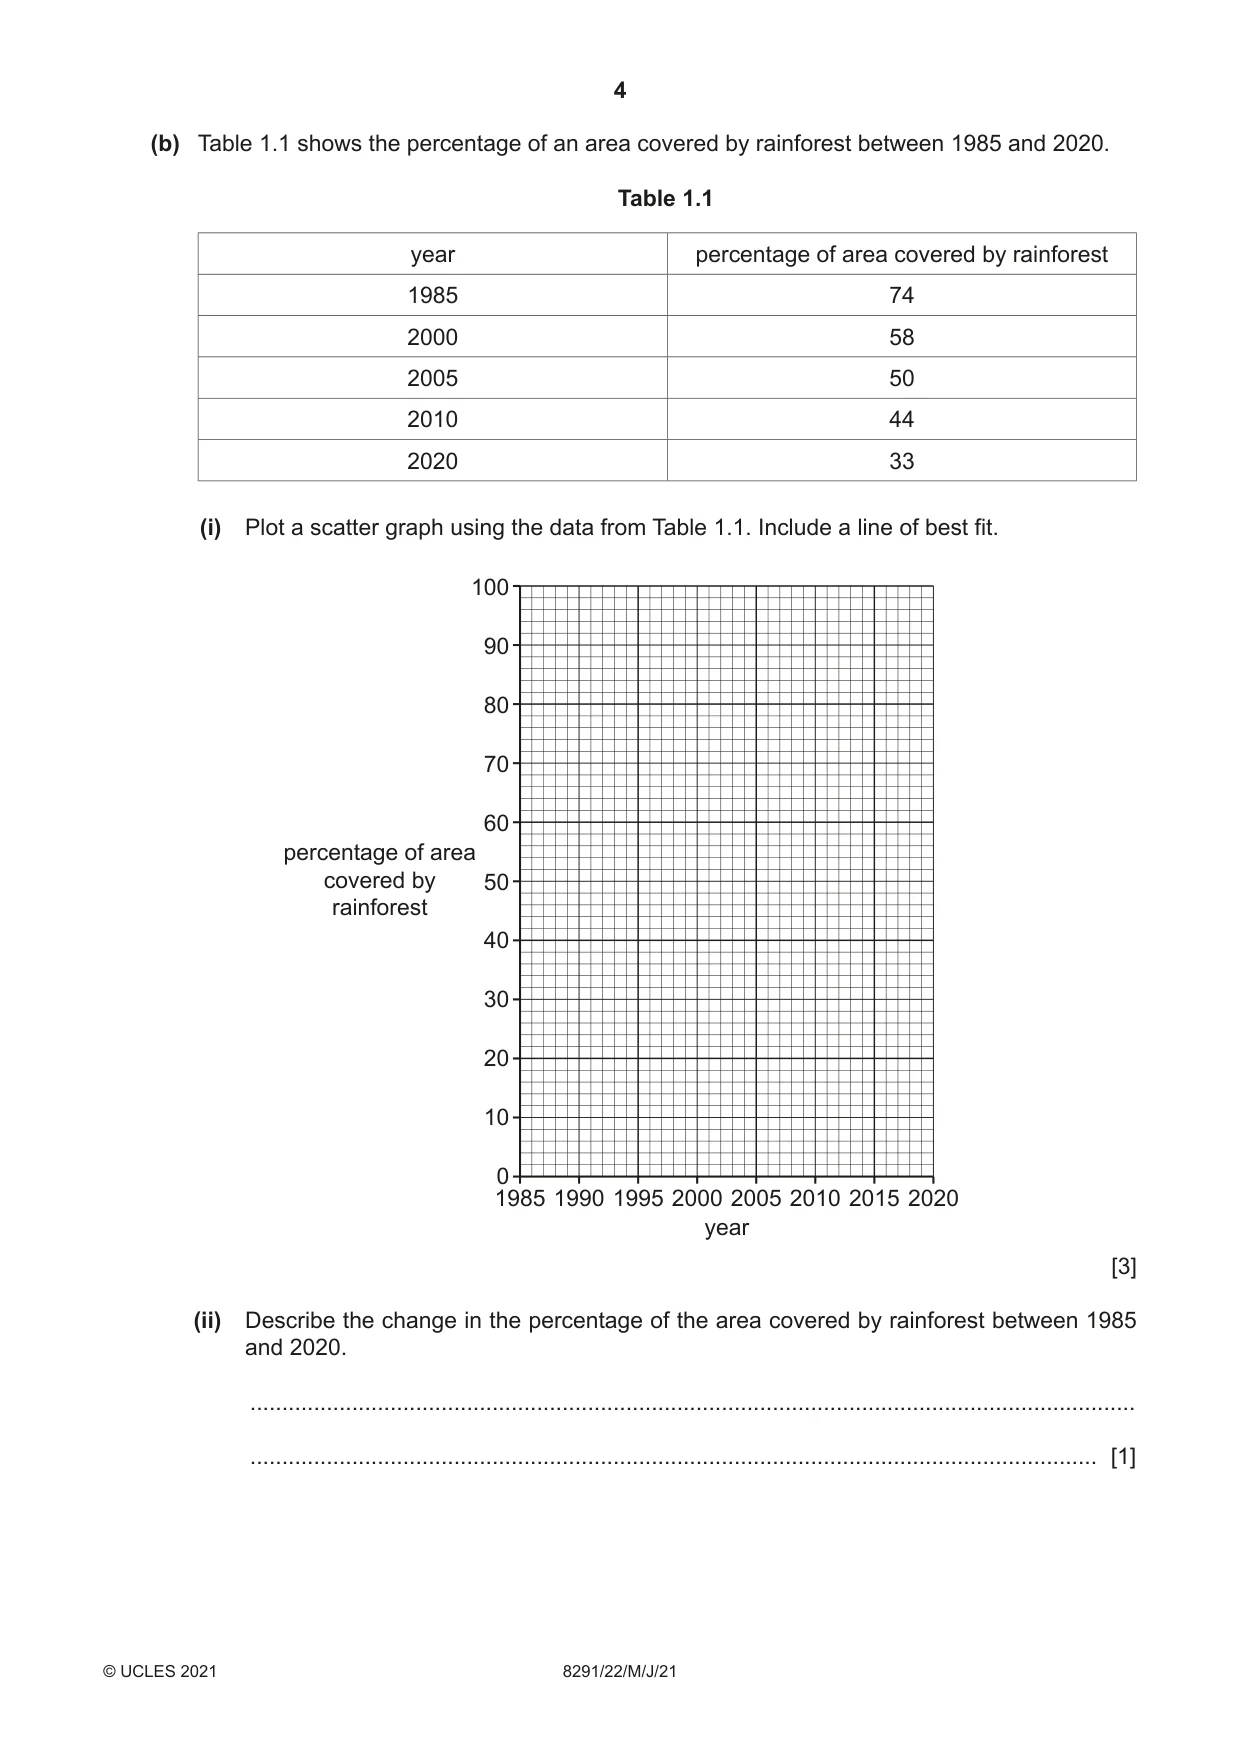
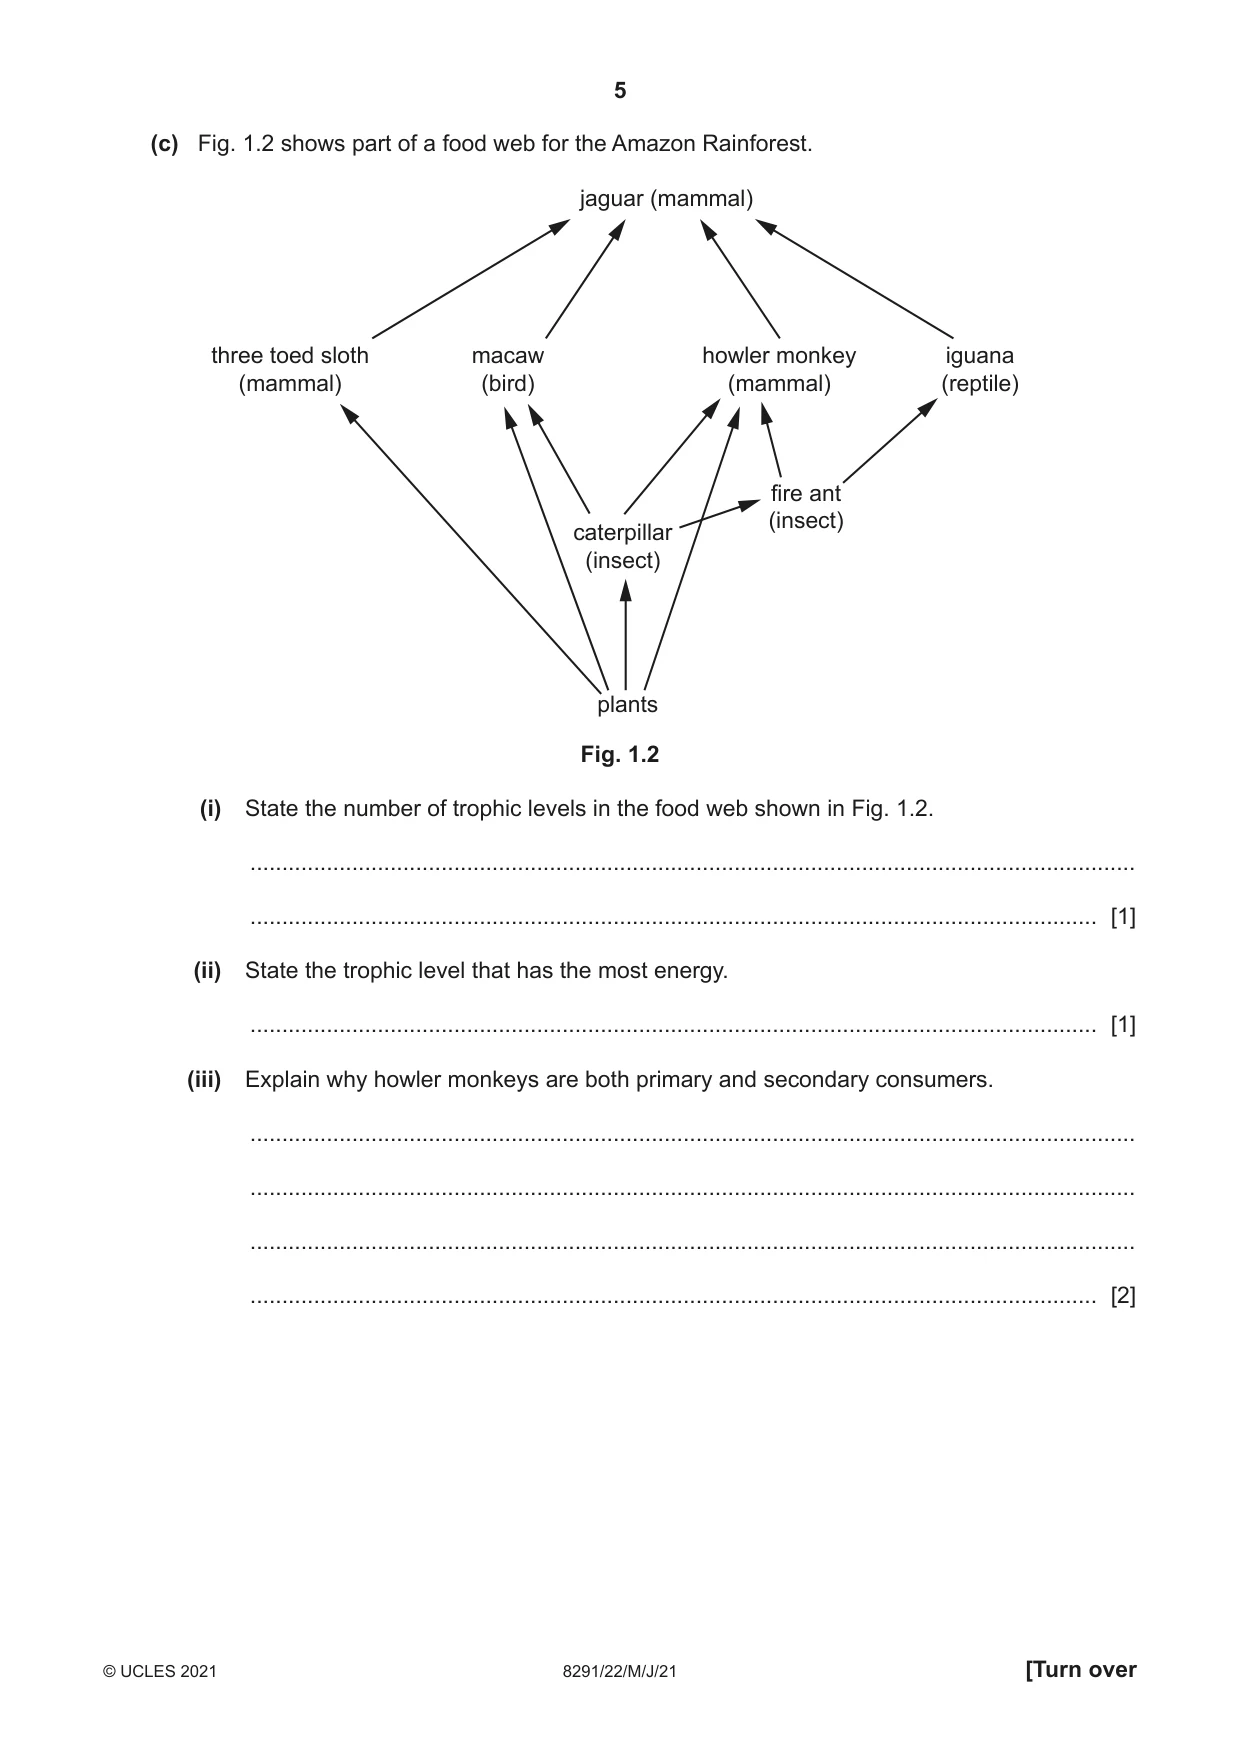
1 Fig. 1.1 shows the international border between the Caribbean countries Haiti and Dominican Republic. international border Haiti Dominican Republic Fig. 1.1 (a) (i) Describe two differences between Haiti and Dominican Republic shown in Fig. 1.1. ........................................................................................................................................... ........................................................................................................................................... ........................................................................................................................................... ..................................................................................................................................... [2] (ii) Suggest two reasons for the differences in the amount of vegetation cover shown in Fig. 1.1. ........................................................................................................................................... ........................................................................................................................................... ........................................................................................................................................... ..................................................................................................................................... [2] (iii) Explain the effect of loss of vegetation cover on soil. ........................................................................................................................................... ........................................................................................................................................... ........................................................................................................................................... ........................................................................................................................................... ........................................................................................................................................... ..................................................................................................................................... [3] (iv) Explain why biodiversity decreases when vegetation cover is lost. ........................................................................................................................................... ........................................................................................................................................... ........................................................................................................................................... ..................................................................................................................................... [2] (b) Table 1.1 shows the percentage of an area covered by rainforest between 1985 and 2020. Table 1.1 year percentage of area covered by rainforest 1985 74 2000 58 2005 50 2010 44 2020 33 (i) Plot a scatter graph using the data from Table 1.1. Include a line of best fit. 100 90 80 70 60 percentage of area covered by 50 rainforest 40 30 20 10 0 1985 1990 1995 2000 2005 2010 2015 2020 year [3] (ii) Describe the change in the percentage of the area covered by rainforest between 1985 and 2020. ........................................................................................................................................... ..................................................................................................................................... [1] (c) Fig. 1.2 shows part of a food web for the Amazon Rainforest. jaguar (mammal) three toed sloth macaw howler monkey iguana (mammal) (bird) (mammal) (reptile) fire ant (insect) caterpillar (insect) plants Fig. 1.2 (i) State the number of trophic levels in the food web shown in Fig. 1.2. ........................................................................................................................................... ..................................................................................................................................... [1] (ii) State the trophic level that has the most energy. ..................................................................................................................................... [1] (iii) Explain why howler monkeys are both primary and secondary consumers. ........................................................................................................................................... ........................................................................................................................................... ........................................................................................................................................... ..................................................................................................................................... [2] (d) Explain the influence of light intensity on plant productivity. ................................................................................................................................................... ................................................................................................................................................... ................................................................................................................................................... ................................................................................................................................................... ................................................................................................................................................... ............................................................................................................................................. [3] [Total: 20]
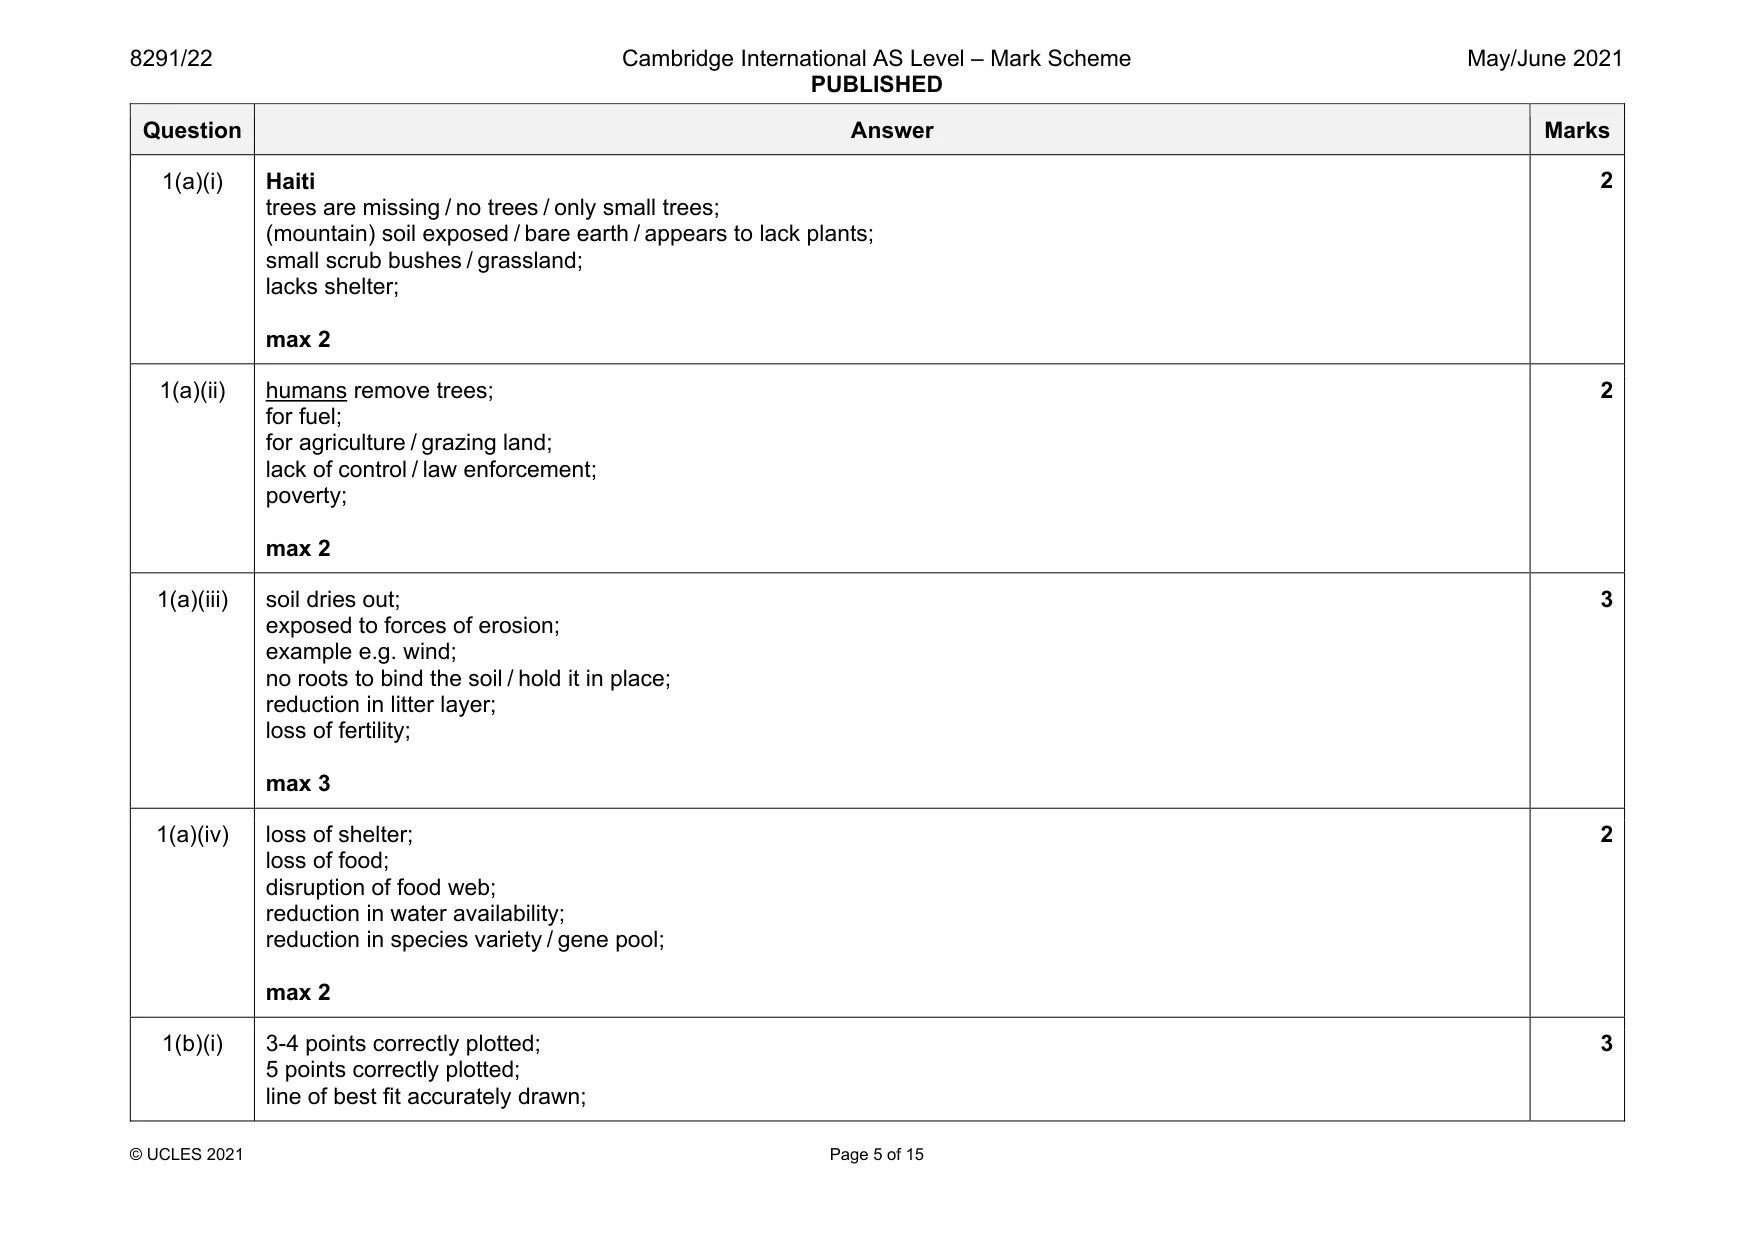
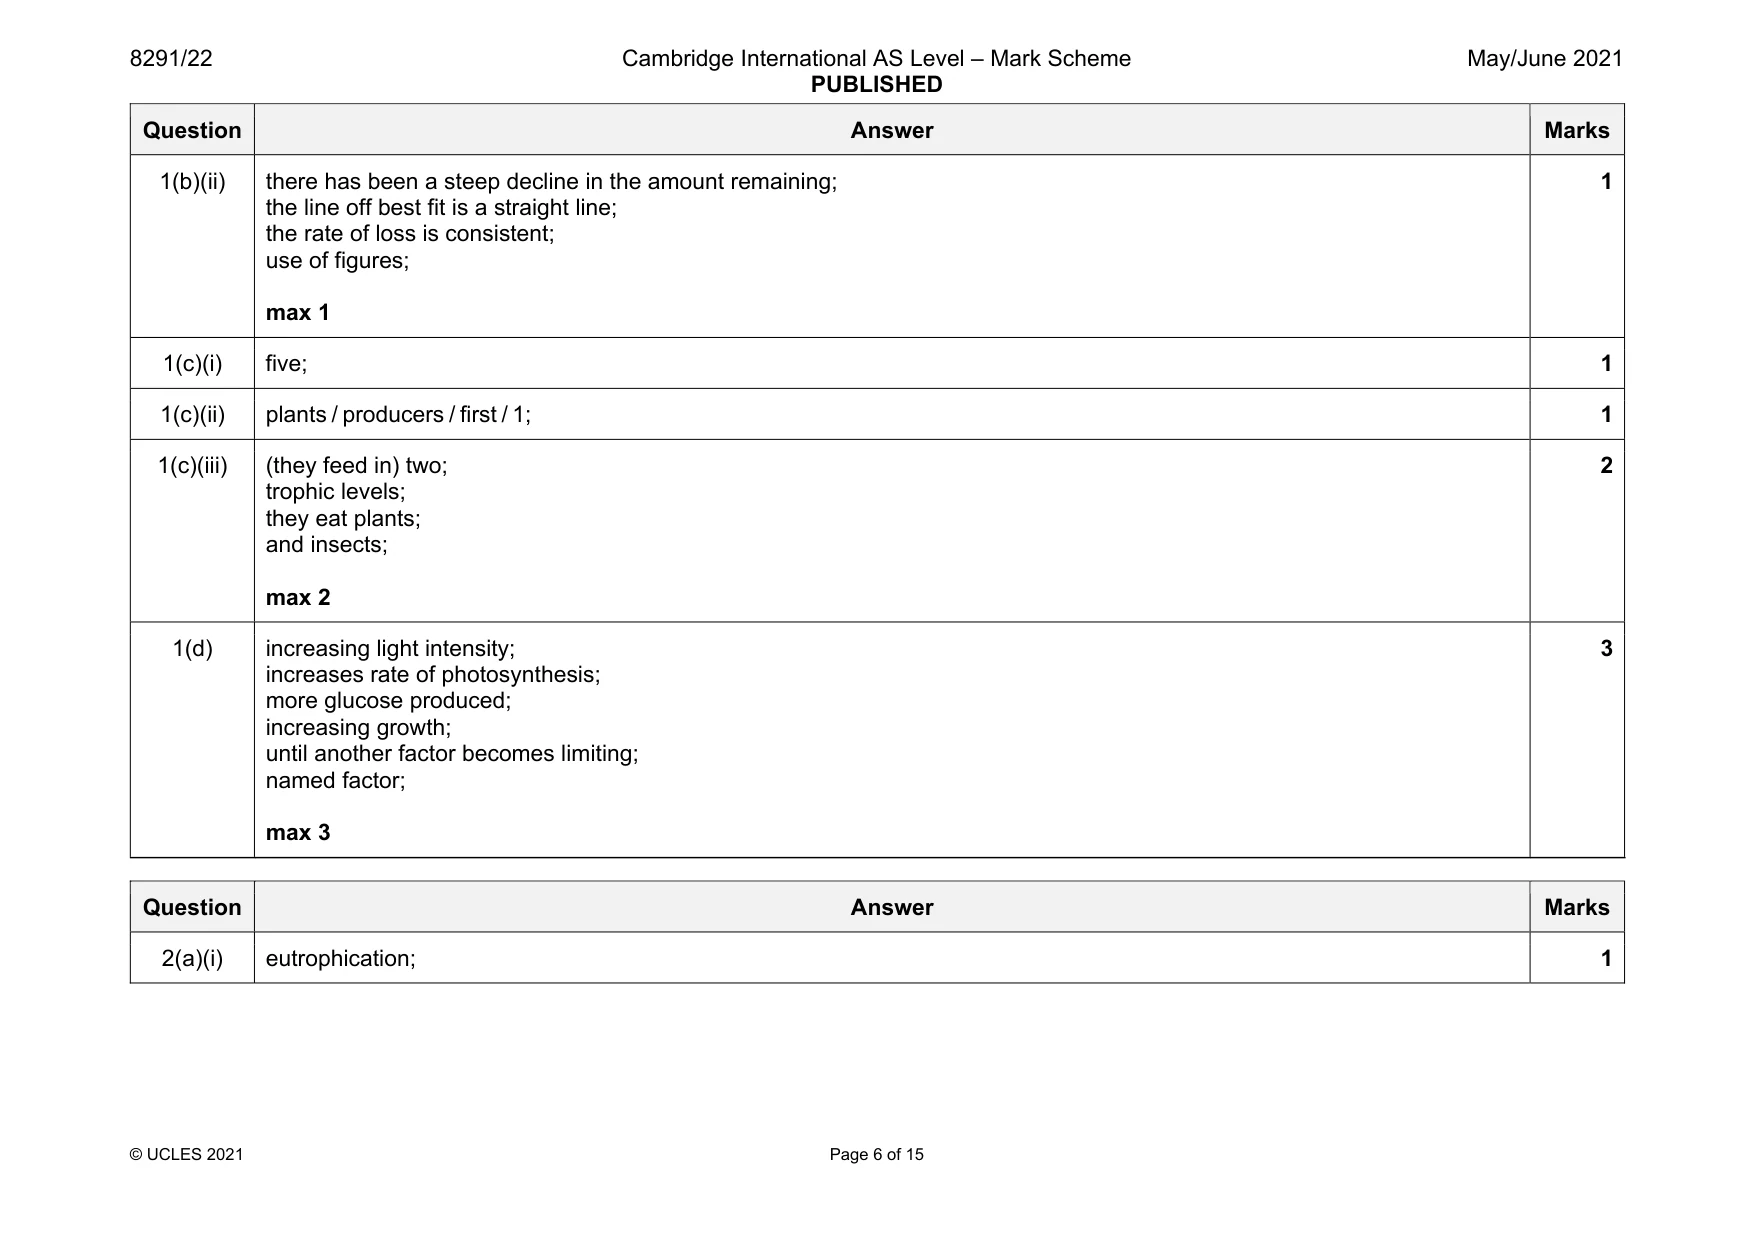
Mark scheme: 1(a)(i) Haiti trees are missing / no trees / only small trees; (mountain) soil exposed / bare earth / appears to lack plants; small scrub bushes / grassland; lacks shelter; max 2 1(a)(ii) humans remove trees; for fuel; for agriculture / grazing land; lack of control / law enforcement; poverty; max 2 2 1(a)(iii) soil dries out; exposed to forces of erosion; example e.g. wind; no roots to bind the soil / hold it in place; reduction in litter layer; loss of fertility; max 3 3 1(a)(iv) loss of shelter; loss of food; disruption of food web; reduction in water availability; reduction in species variety / gene pool; max 2 2 1(b)(i) 3-4 points correctly plotted; 5 points correctly plotted; line of best fit accurately drawn; 3 Question Answer Marks 1(b)(ii) there has been a steep decline in the amount remaining; the line off best fit is a straight line; the rate of loss is consistent; use of figures; max 1 1 1(c)(i) five; 1 1(c)(ii) plants / producers / first / 1; 1 1(c)(iii) (they feed in) two; trophic levels; they eat plants; and insects; max 2 2 1(d) increasing light intensity; increases rate of photosynthesis; more glucose produced; increasing growth; until another factor becomes limiting; named factor; max 3 3
Q2 · A diagram showing an effect of fertiliser pollution in water
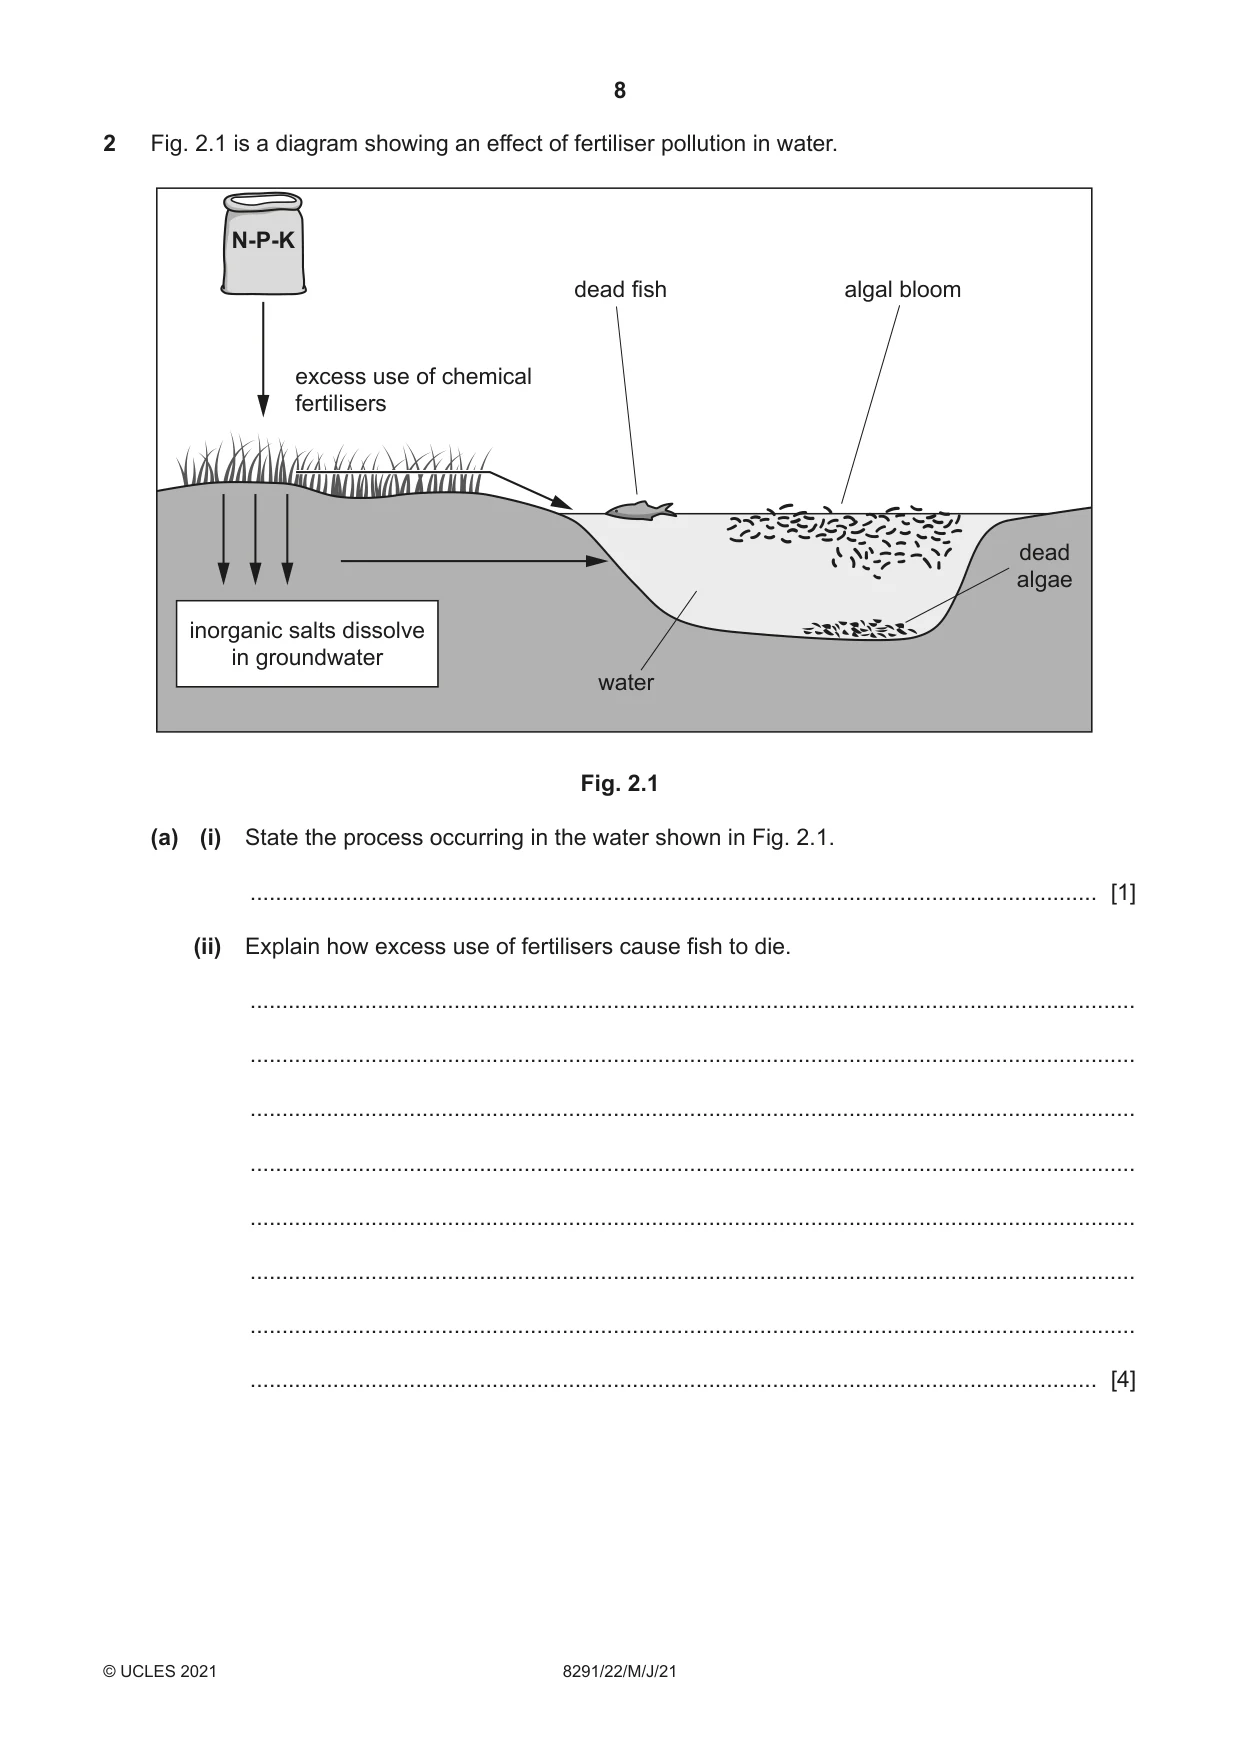
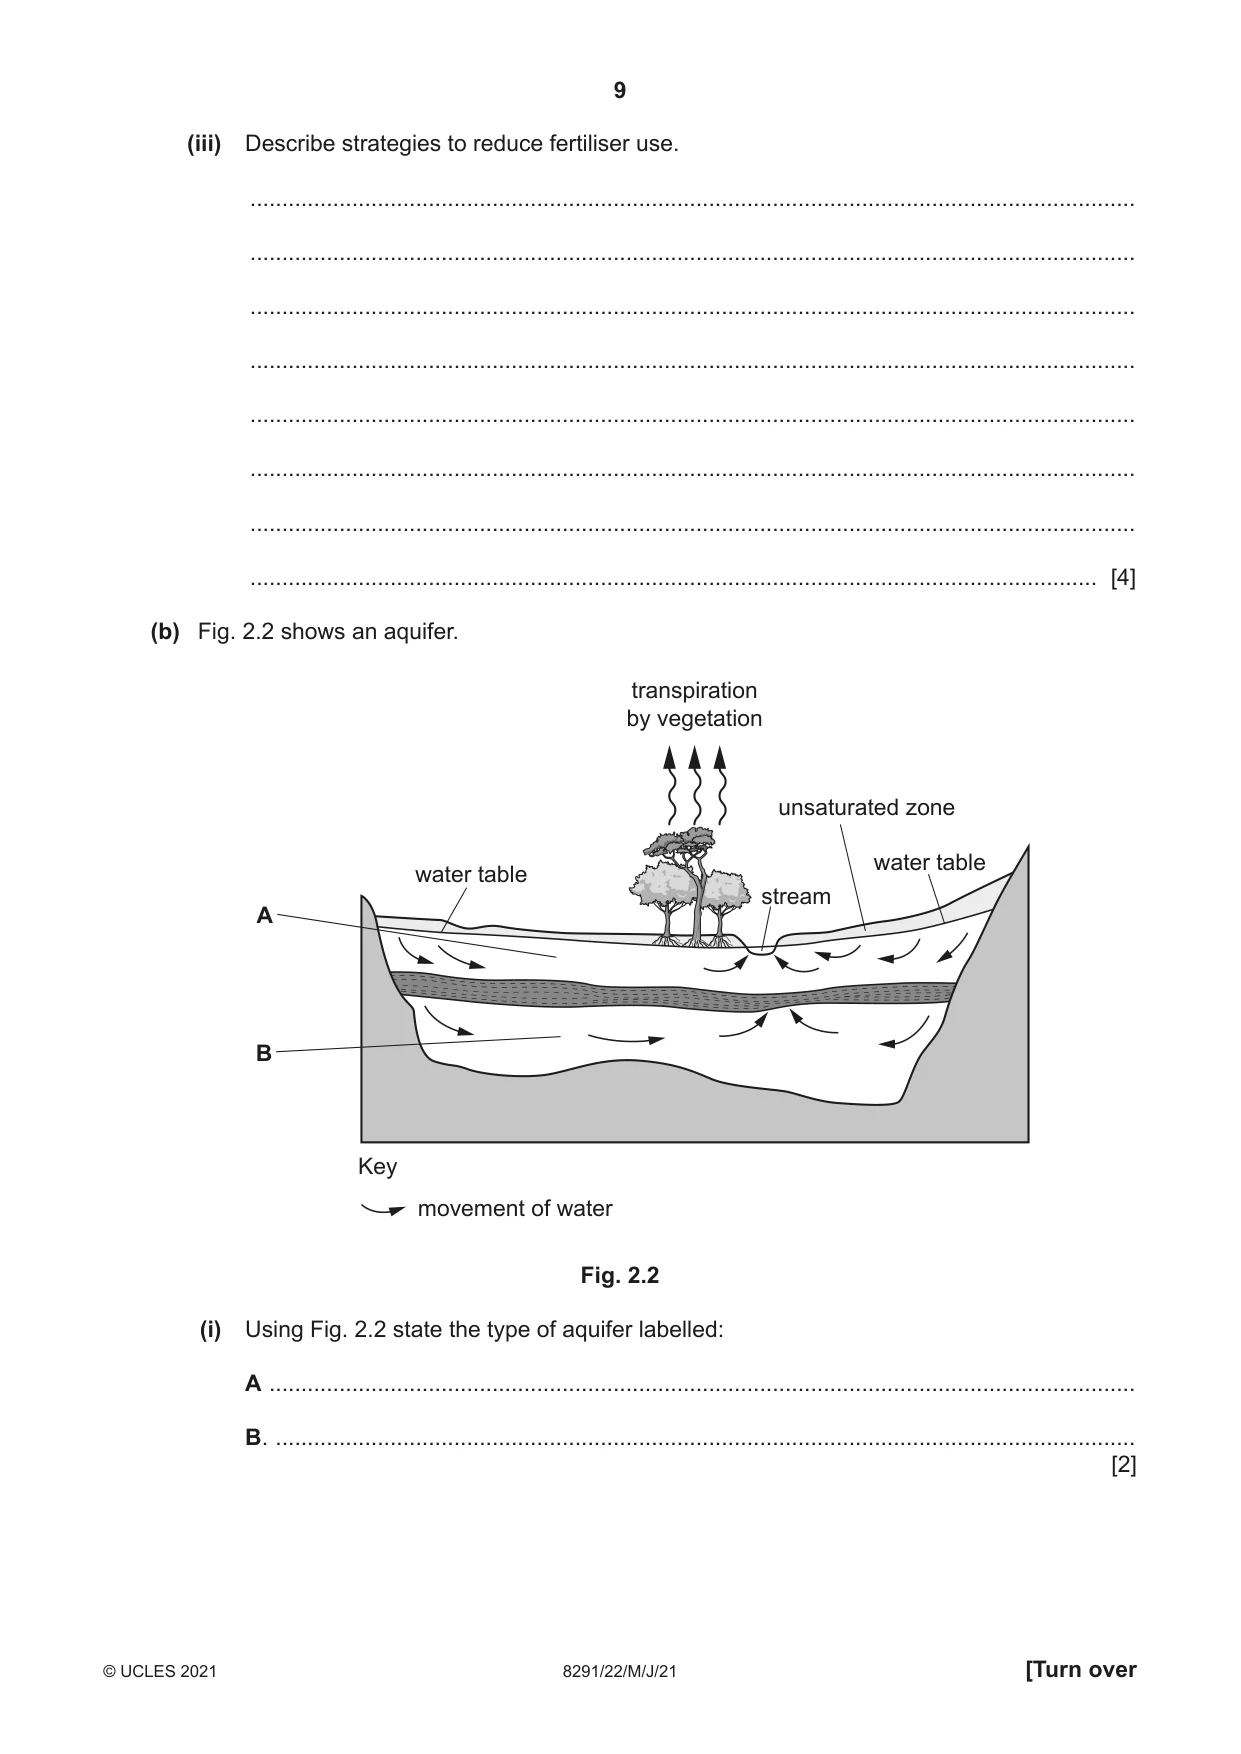
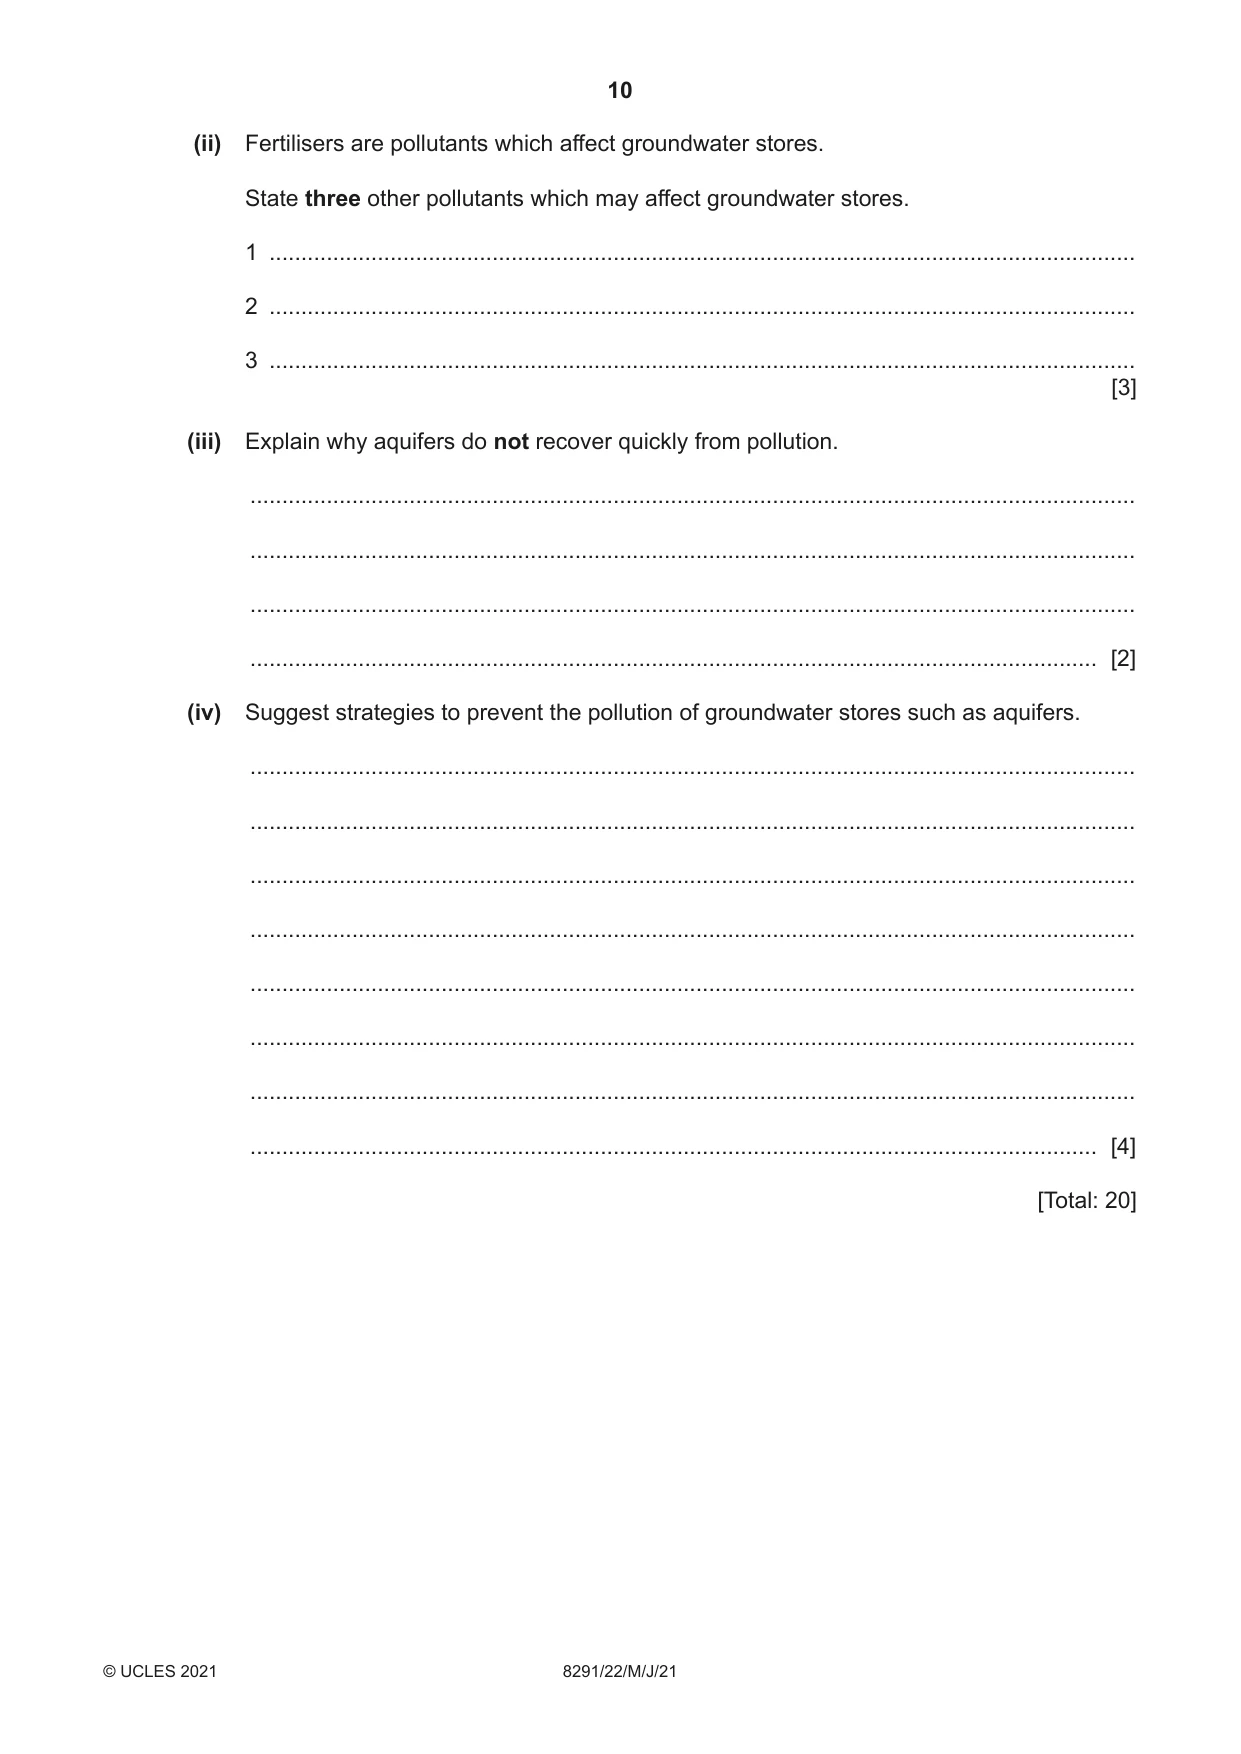
2 Fig. 2.1 is a diagram showing an effect of fertiliser pollution in water. N-P-K dead fish algal bloom excess use of chemical fertilisers dead algae inorganic salts dissolve in groundwater water Fig. 2.1 (a) (i) State the process occurring in the water shown in Fig. 2.1. ..................................................................................................................................... [1] (ii) Explain how excess use of fertilisers cause fish to die. ........................................................................................................................................... ........................................................................................................................................... ........................................................................................................................................... ........................................................................................................................................... ........................................................................................................................................... ........................................................................................................................................... ........................................................................................................................................... ..................................................................................................................................... [4] (iii) Describe strategies to reduce fertiliser use. ........................................................................................................................................... ........................................................................................................................................... ........................................................................................................................................... ........................................................................................................................................... ........................................................................................................................................... ........................................................................................................................................... ........................................................................................................................................... ..................................................................................................................................... [4] (b) Fig. 2.2 shows an aquifer. transpiration by vegetation unsaturated zone water table water table stream A B Key movement of water Fig. 2.2 (i) Using Fig. 2.2 state the type of aquifer labelled: A ........................................................................................................................................ B. ....................................................................................................................................... [2] (ii) Fertilisers are pollutants which affect groundwater stores. State three other pollutants which may affect groundwater stores. 1 ........................................................................................................................................ 2 ........................................................................................................................................ 3 ........................................................................................................................................ [3] (iii) Explain why aquifers do not recover quickly from pollution. ........................................................................................................................................... ........................................................................................................................................... ........................................................................................................................................... ..................................................................................................................................... [2] (iv) Suggest strategies to prevent the pollution of groundwater stores such as aquifers. ........................................................................................................................................... ........................................................................................................................................... ........................................................................................................................................... ........................................................................................................................................... ........................................................................................................................................... ........................................................................................................................................... ........................................................................................................................................... ..................................................................................................................................... [4] [Total: 20]
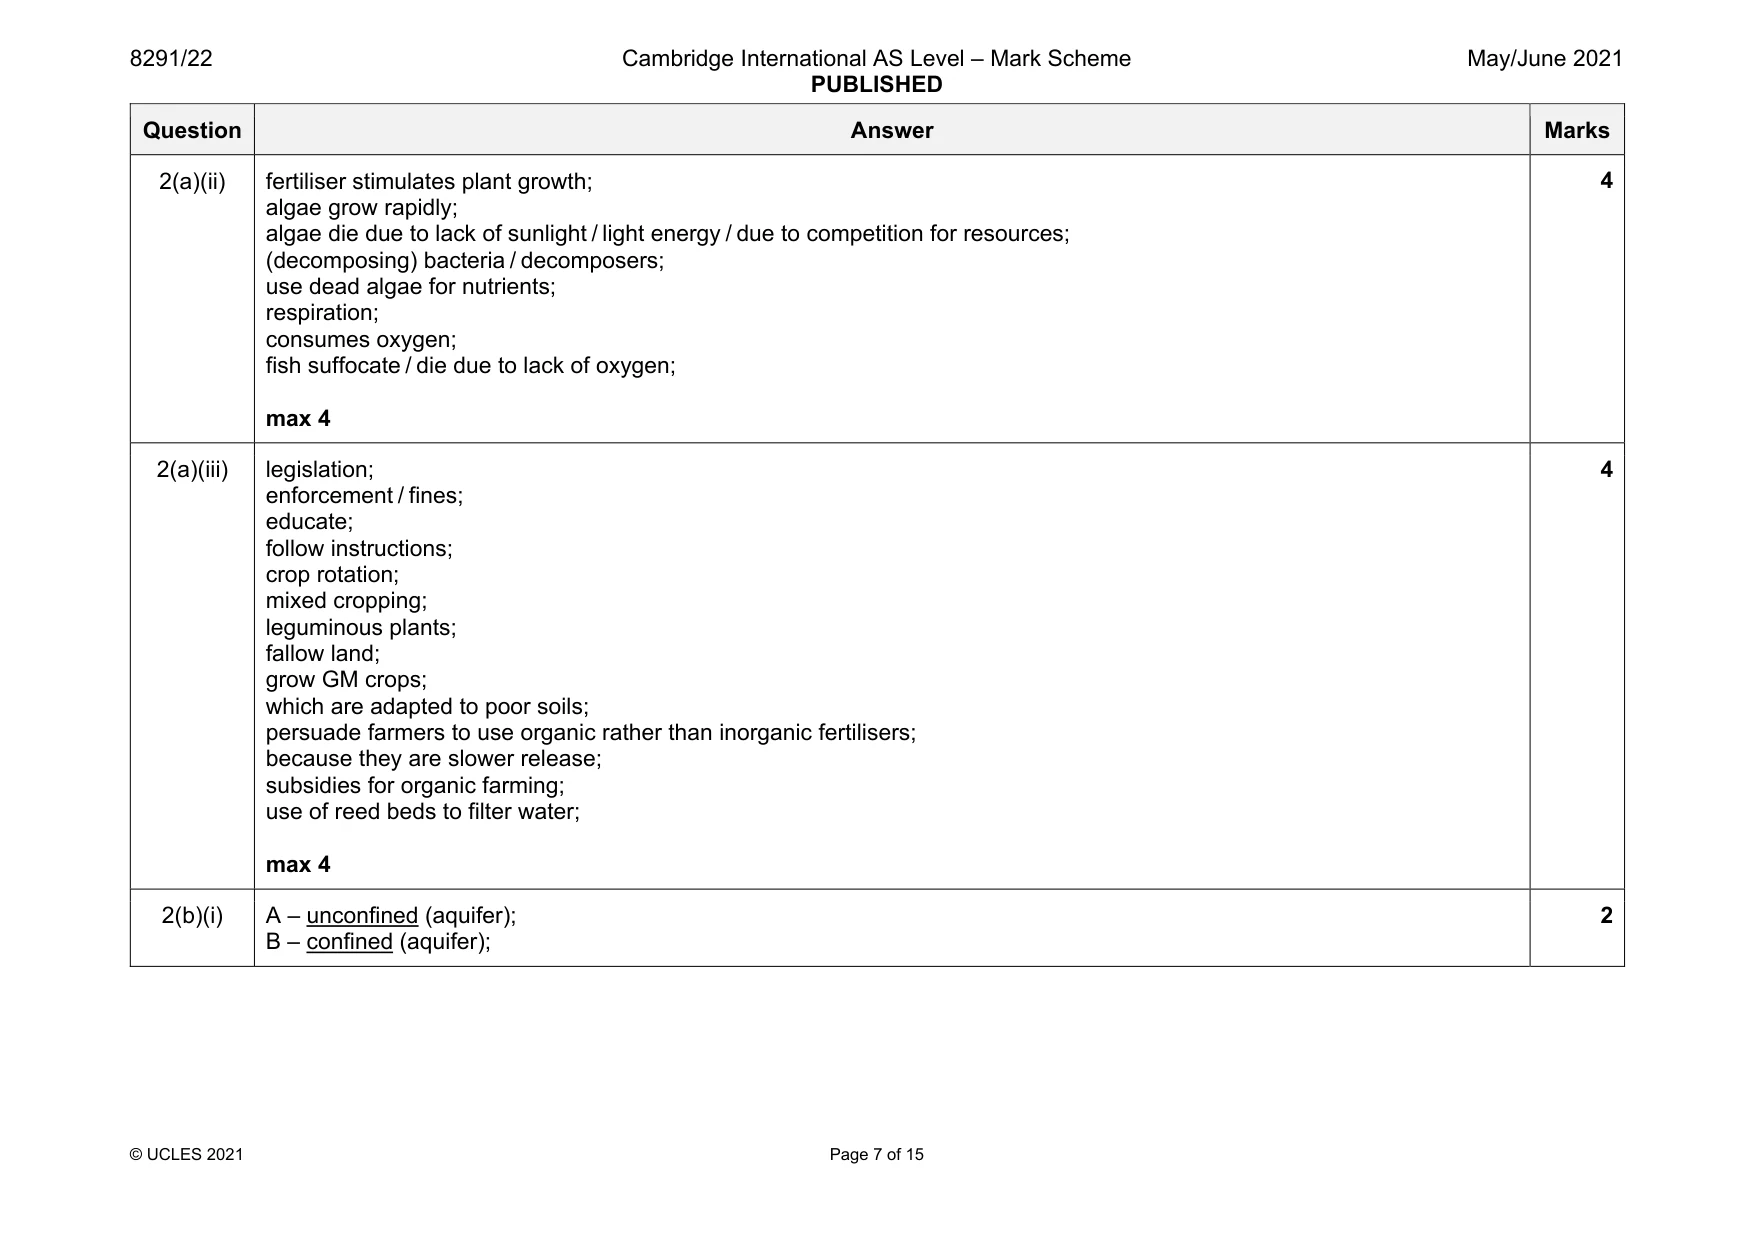
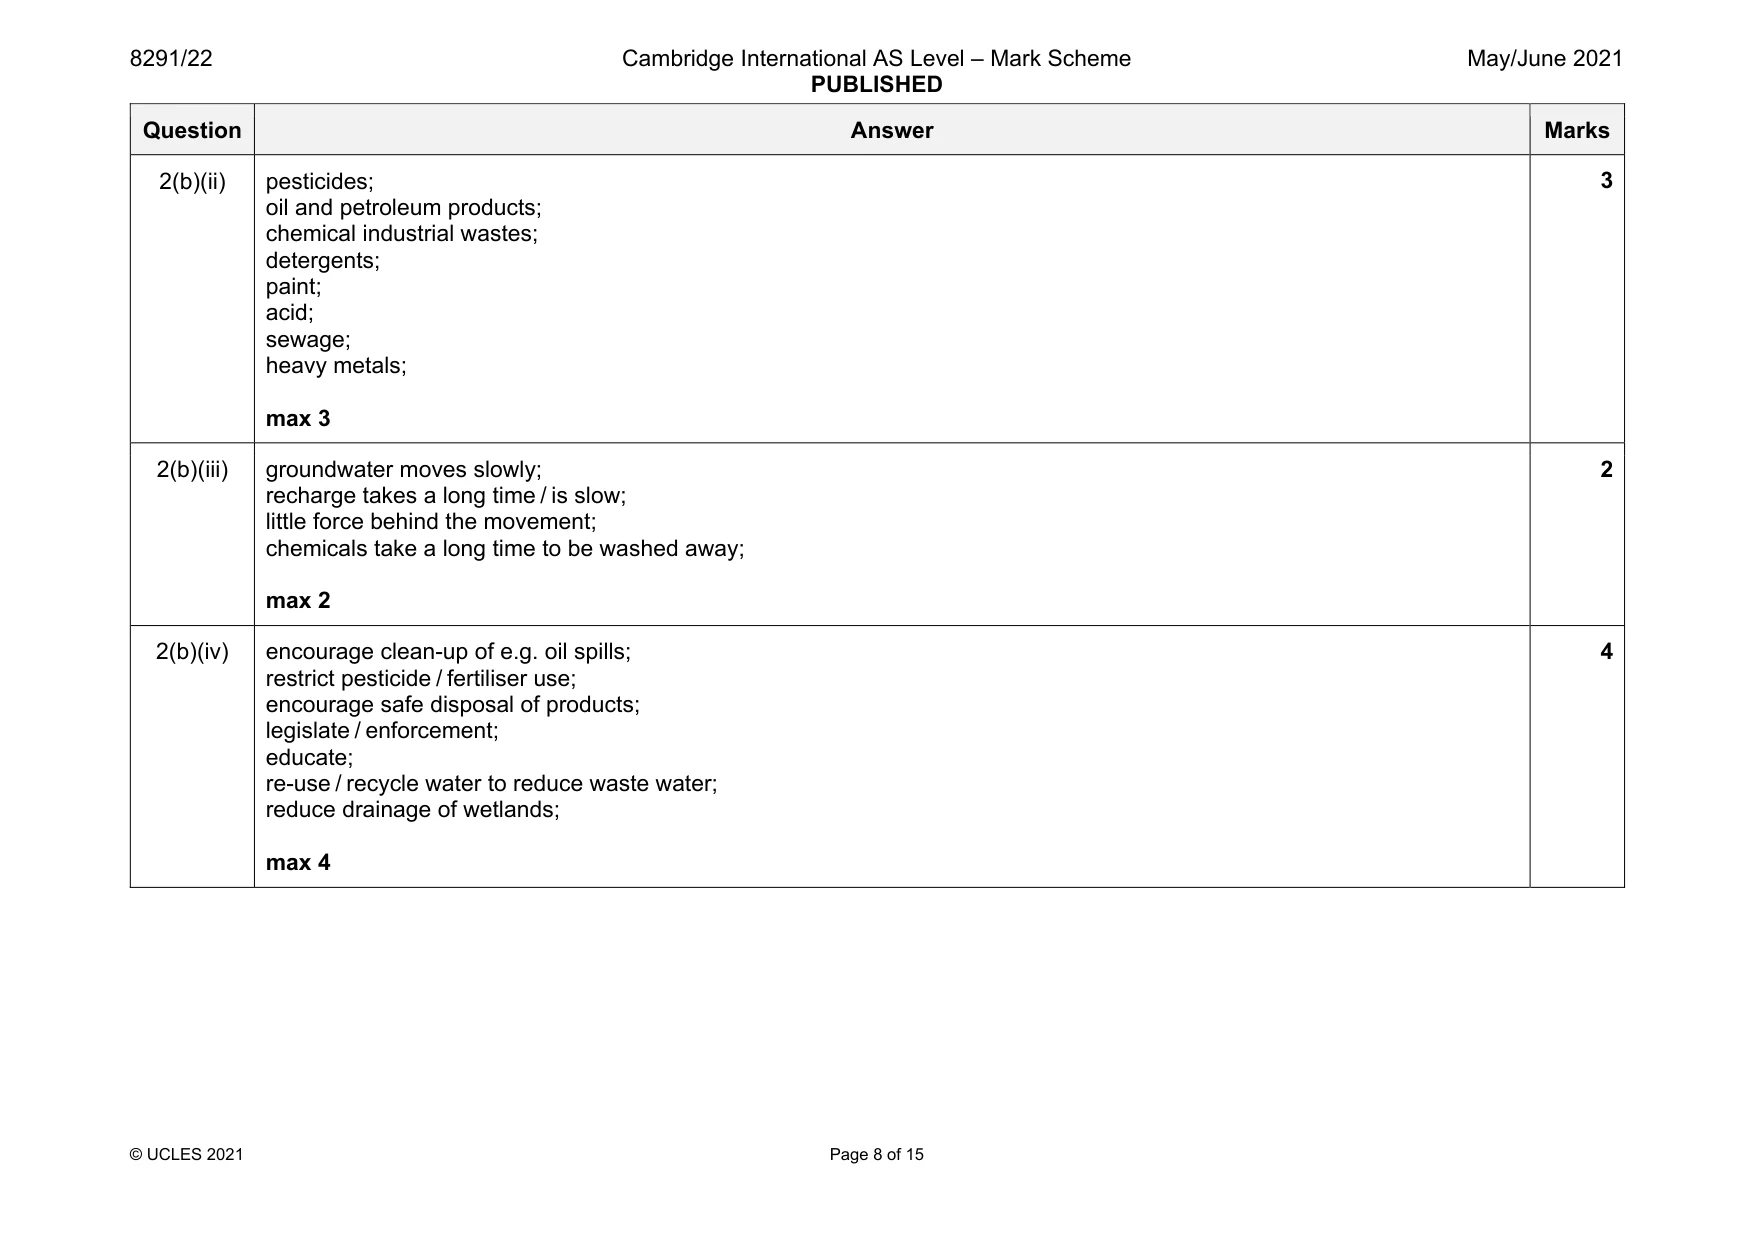
Mark scheme: 2(a)(i) eutrophication; 1 Question Answer Marks 2(a)(ii) fertiliser stimulates plant growth; algae grow rapidly; algae die due to lack of sunlight / light energy / due to competition for resources; (decomposing) bacteria / decomposers; use dead algae for nutrients; respiration; consumes oxygen; fish suffocate / die due to lack of oxygen; max 4 4 2(a)(iii) legislation; enforcement / fines; educate; follow instructions; crop rotation; mixed cropping; leguminous plants; fallow land; grow GM crops; which are adapted to poor soils; persuade farmers to use organic rather than inorganic fertilisers; because they are slower release; subsidies for organic farming; use of reed beds to filter water; max 4 4 2(b)(i) A – unconfined (aquifer); B – confined (aquifer); 2 Question Answer Marks 2(b)(ii) pesticides; oil and petroleum products; chemical industrial wastes; detergents; paint; acid; sewage; heavy metals; max 3 3 2(b)(iii) groundwater moves slowly; recharge takes a long time / is slow; little force behind the movement; chemicals take a long time to be washed away; max 2 2 2(b)(iv) encourage clean-up of e.g. oil spills; restrict pesticide / fertiliser use; encourage safe disposal of products; legislate / enforcement; educate; re-use / recycle water to reduce waste water; reduce drainage of wetlands; max 4 4
Q3 · A newspaper report about the construction of the Grand Ethiopian Renaissance Dam
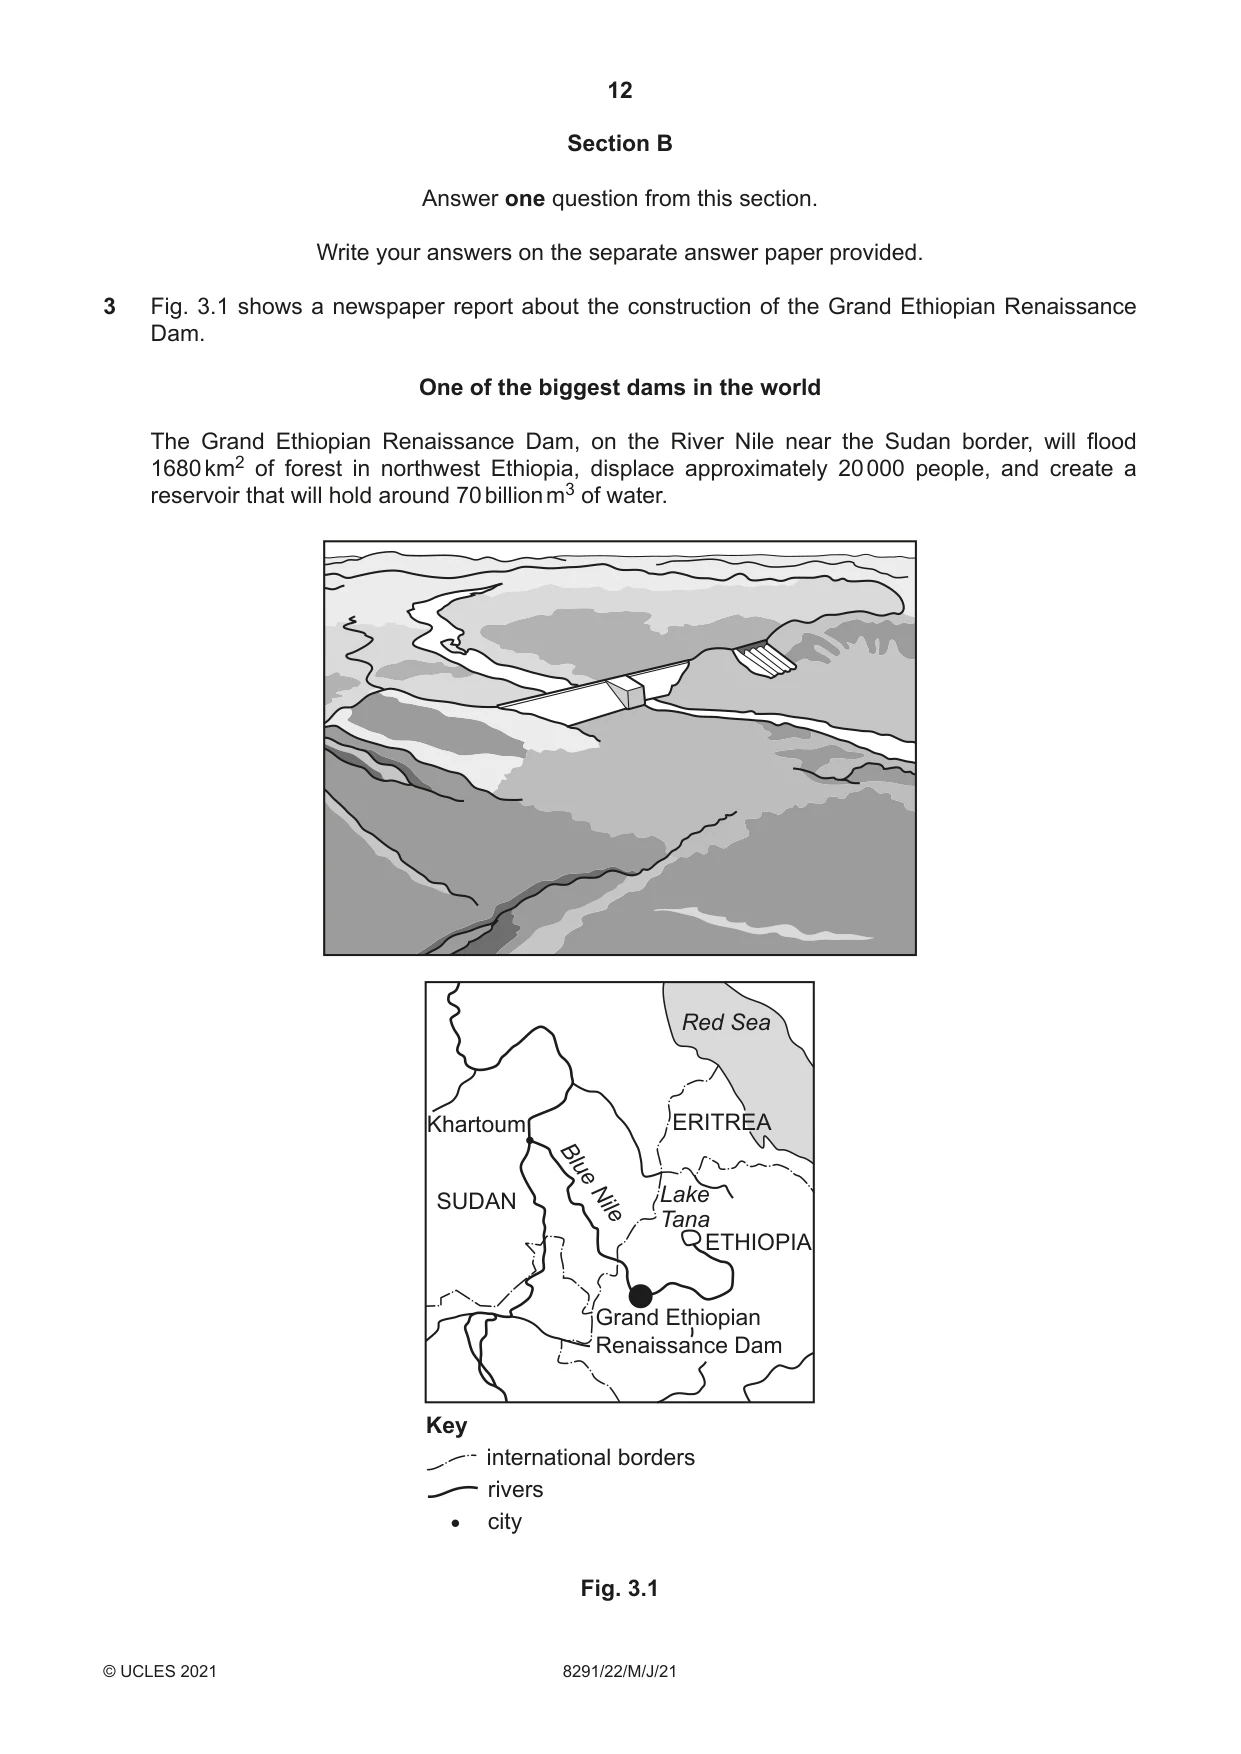
3 Fig. 3.1 shows a newspaper report about the construction of the Grand Ethiopian Renaissance Dam. One of the biggest dams in the world The Grand Ethiopian Renaissance Dam, on the River Nile near the Sudan border, will flood 1680 km2 of forest in northwest Ethiopia, displace approximately 20 000 people, and create a reservoir that will hold around 70 billion m3 of water. Red Sea Khartoum ERITREA Blue Lake SUDAN Nile Tana ETHIOPIA Grand Ethiopian Renaissance Dam Key international borders rivers city Fig. 3.1 (a) With reference to Fig. 3.1 describe the advantages and disadvantages of constructing large scale dams such as the Great Ethiopian Renaissance Dam. [10] (b) ‘Projects such as The Great Ethiopian Renaissance Dam could create conflicts over shared resources.’ Using examples, discuss the extent to which you agree with this statement. [30] [Total: 40]
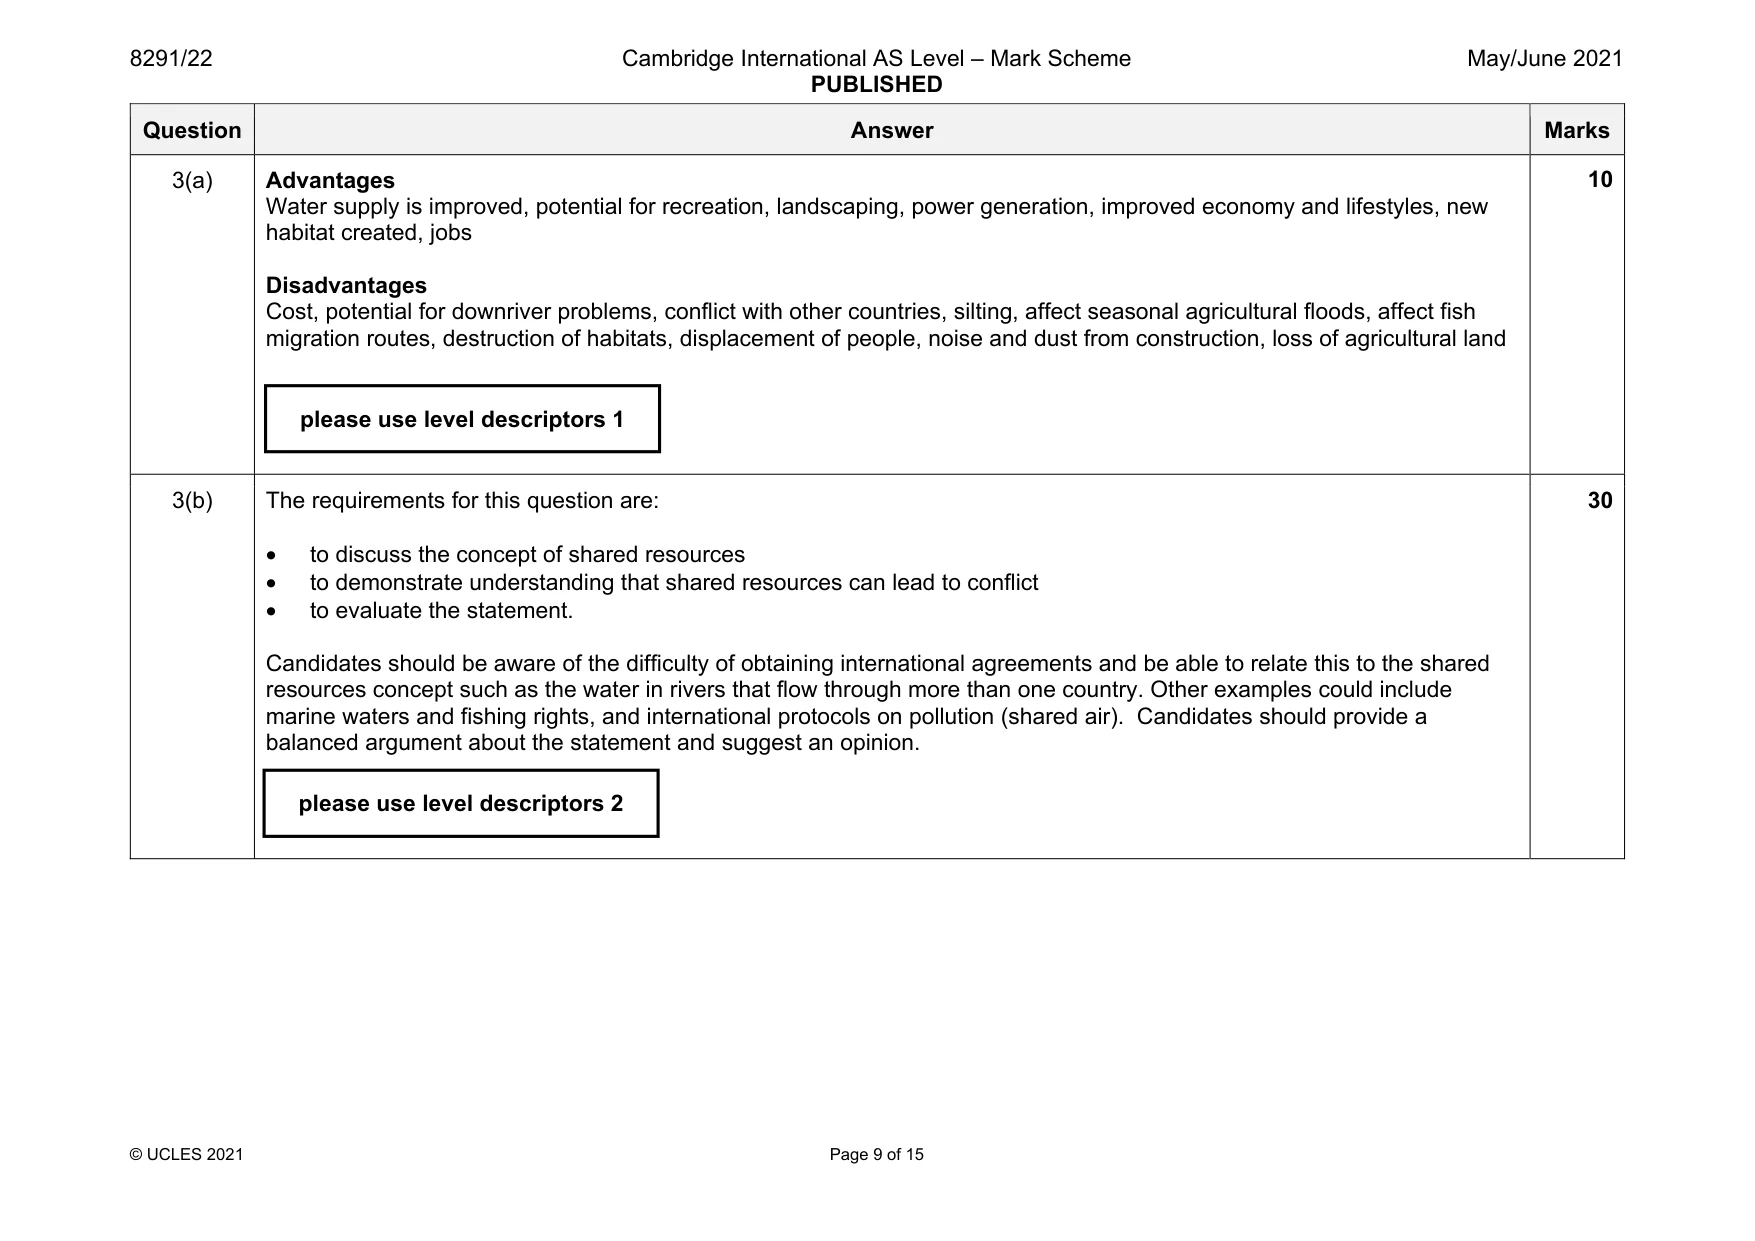
Mark scheme: 3(a) Advantages Water supply is improved, potential for recreation, landscaping, power generation, improved economy and lifestyles, new habitat created, jobs Disadvantages Cost, potential for downriver problems, conflict with other countries, silting, affect seasonal agricultural floods, affect fish migration routes, destruction of habitats, displacement of people, noise and dust from construction, loss of agricultural land 3(b) The requirements for this question are: • to discuss the concept of shared resources • to demonstrate understanding that shared resources can lead to conflict • to evaluate the statement. Candidates should be aware of the difficulty of obtaining international agreements and be able to relate this to the shared resources concept such as the water in rivers that flow through more than one country. Other examples could include marine waters and fishing rights, and international protocols on pollution (shared air). Candidates should provide a balanced argument about the statement and suggest an opinion. 30 please use level descriptors 1 please use level descriptors 2
Question 4
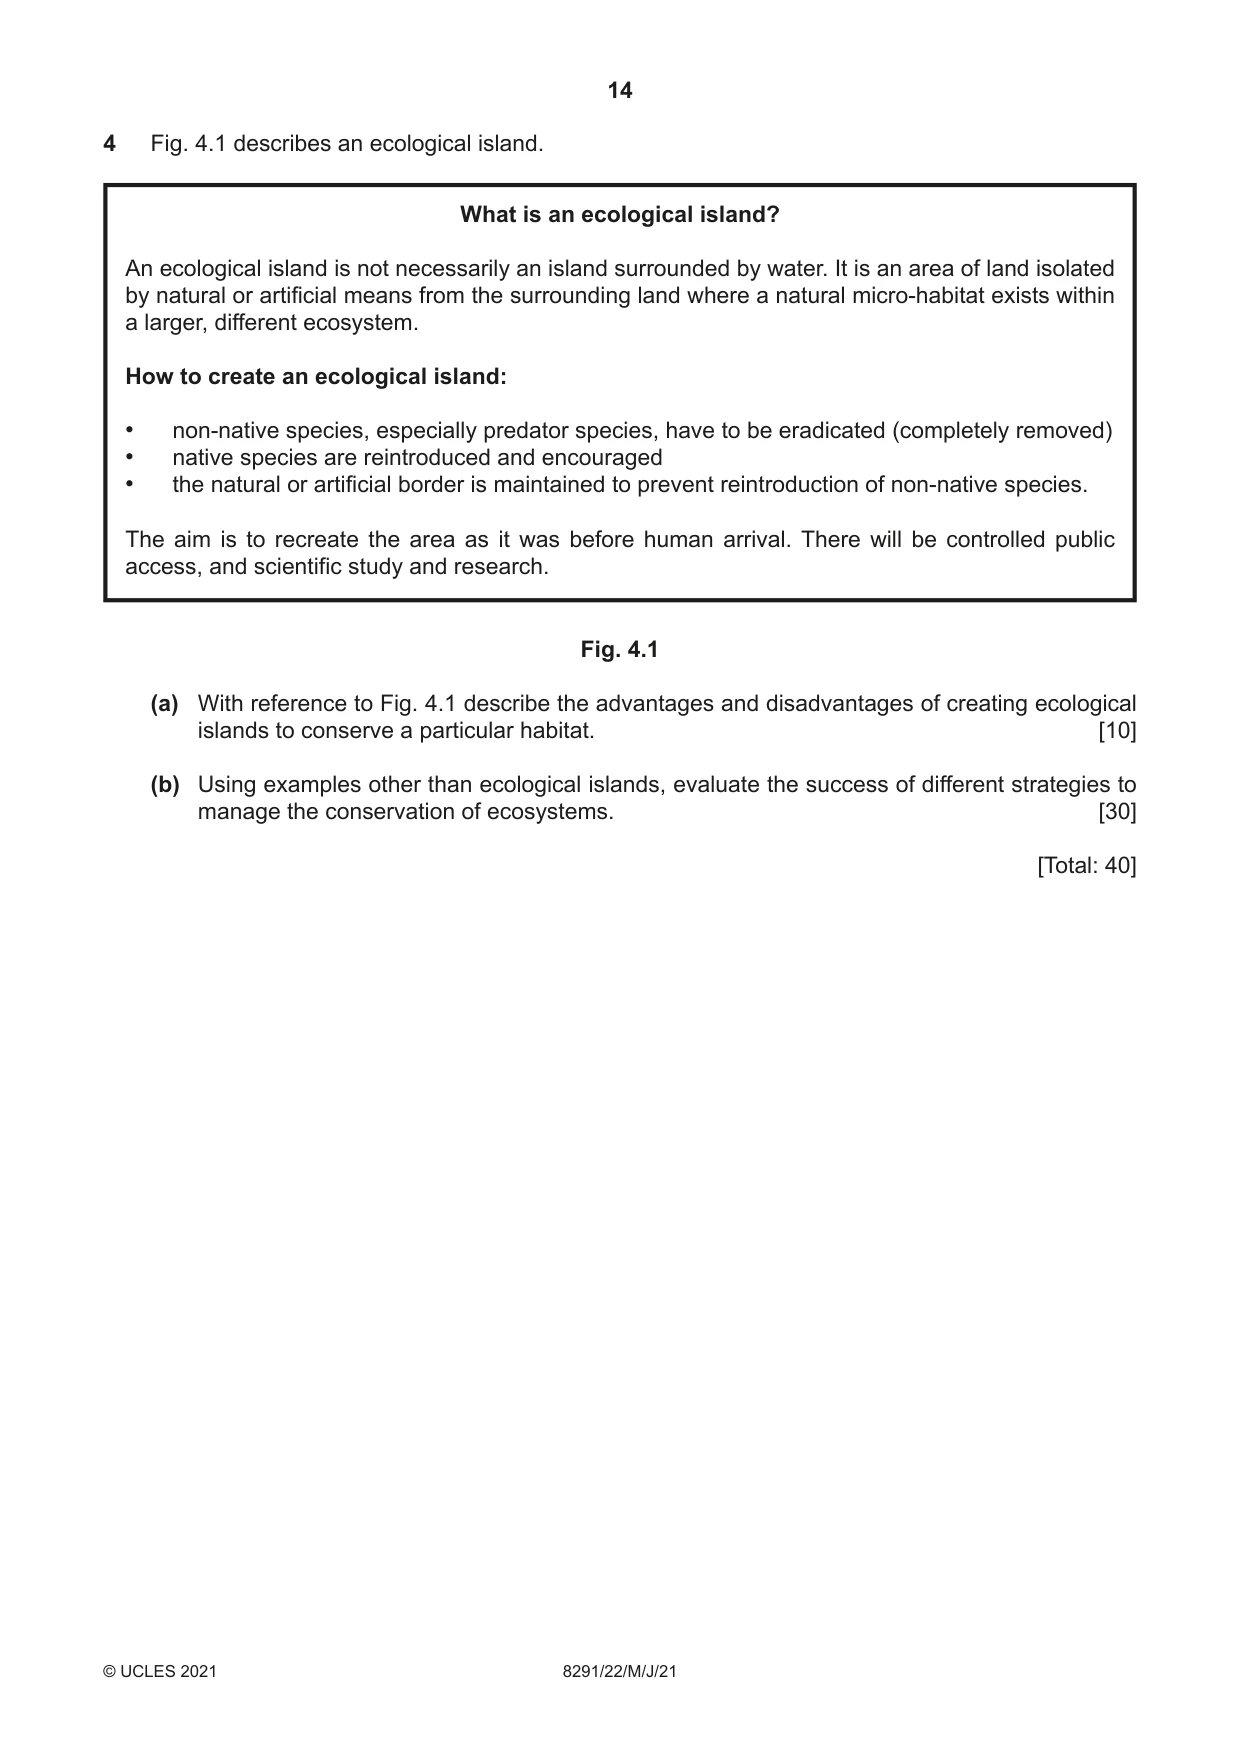
4 Fig. 4.1 describes an ecological island. What is an ecological island? An ecological island is not necessarily an island surrounded by water. It is an area of land isolated by natural or artificial means from the surrounding land where a natural micro-habitat exists within a larger, different ecosystem. How to create an ecological island: • non-native species, especially predator species, have to be eradicated (completely removed) • native species are reintroduced and encouraged • the natural or artificial border is maintained to prevent reintroduction of non-native species. The aim is to recreate the area as it was before human arrival. There will be controlled public access, and scientific study and research. Fig. 4.1 (a) With reference to Fig. 4.1 describe the advantages and disadvantages of creating ecological islands to conserve a particular habitat. [10] (b) Using examples other than ecological islands, evaluate the success of different strategies to manage the conservation of ecosystems. [30] [Total: 40]
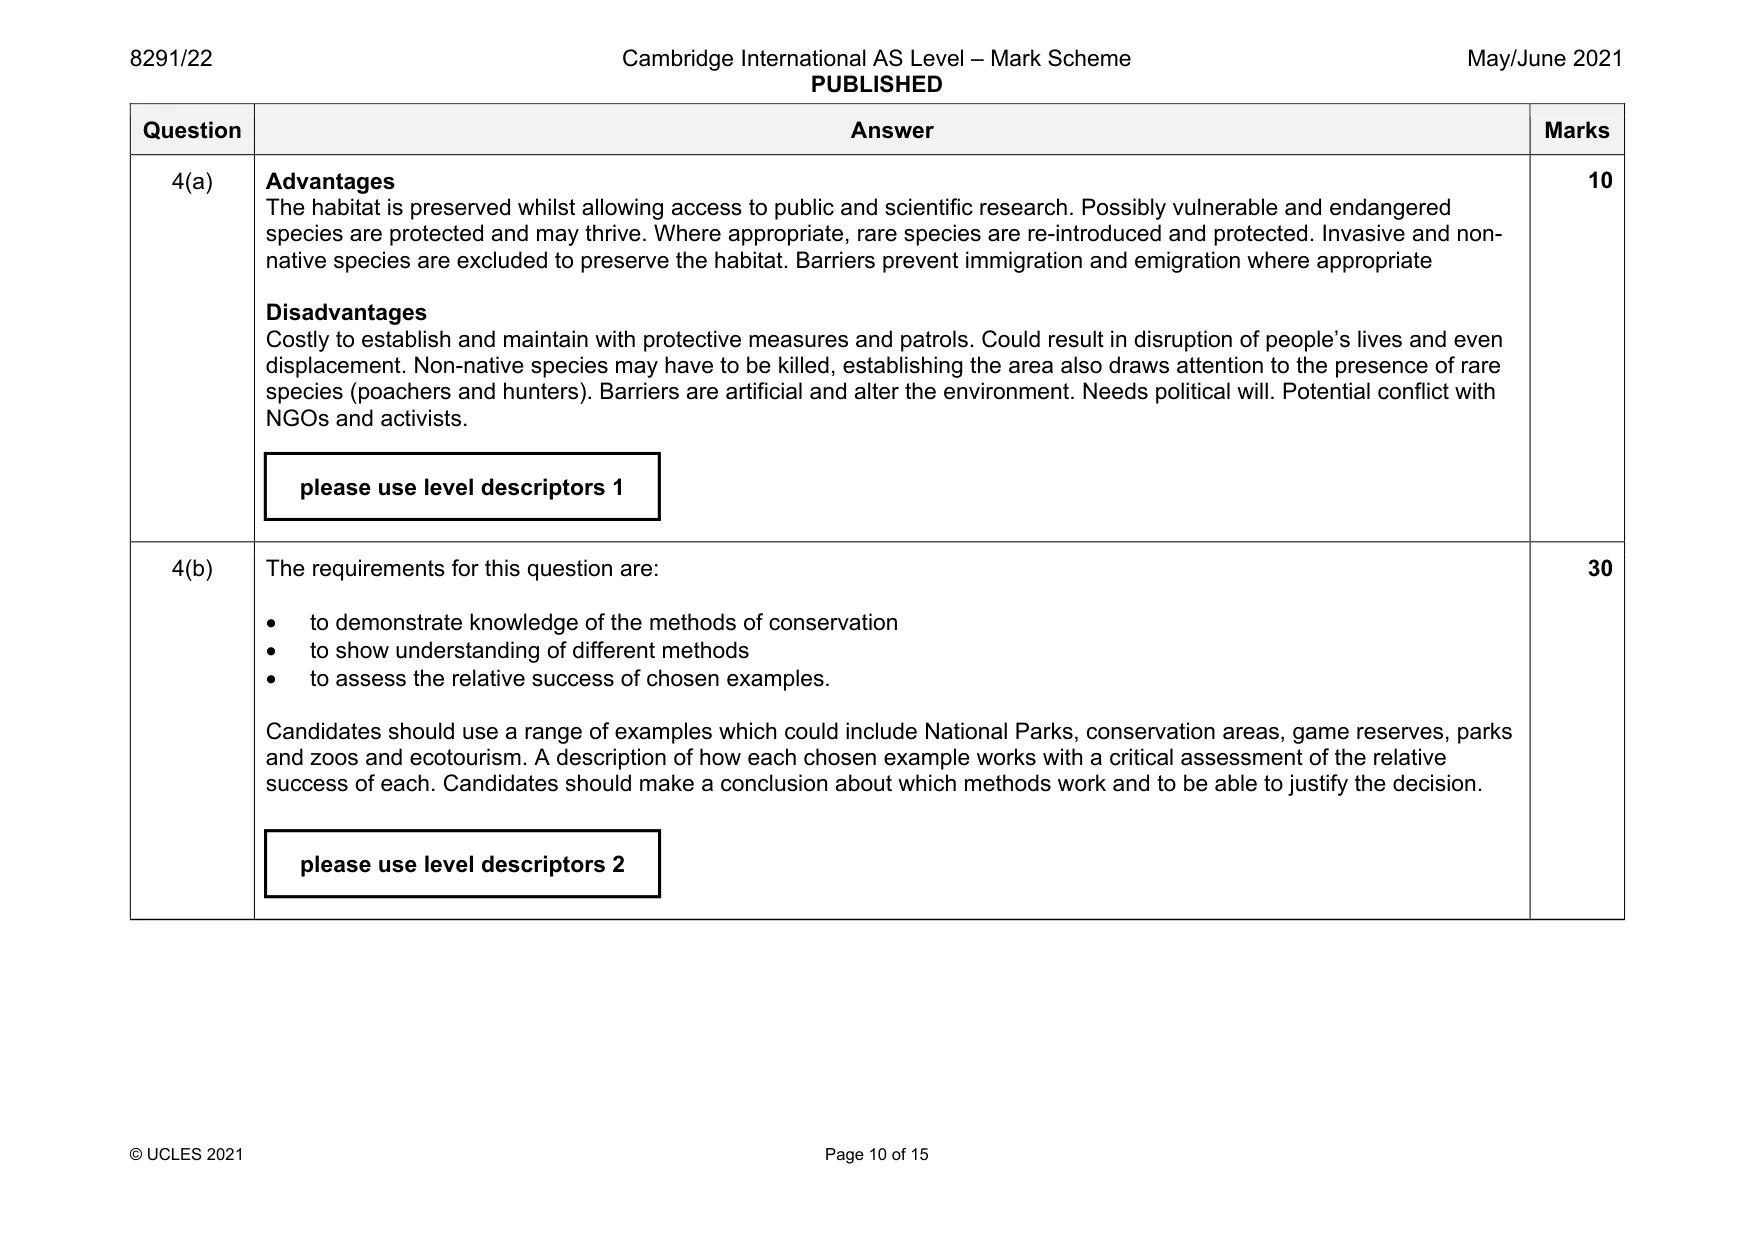
Mark scheme: 4(a) Advantages The habitat is preserved whilst allowing access to public and scientific research. Possibly vulnerable and endangered species are protected and may thrive. Where appropriate, rare species are re-introduced and protected. Invasive and non- native species are excluded to preserve the habitat. Barriers prevent immigration and emigration where appropriate Disadvantages Costly to establish and maintain with protective measures and patrols. Could result in disruption of people’s lives and even displacement. Non-native species may have to be killed, establishing the area also draws attention to the presence of rare species (poachers and hunters). Barriers are artificial and alter the environment. Needs political will. Potential conflict with NGOs and activists. 4(b) The requirements for this question are: • to demonstrate knowledge of the methods of conservation • to show understanding of different methods • to assess the relative success of chosen examples. Candidates should use a range of examples which could include National Parks, conservation areas, game reserves, parks and zoos and ecotourism. A description of how each chosen example works with a critical assessment of the relative success of each. Candidates should make a conclusion about which methods work and to be able to justify the decision. 30 please use level descriptors 1 please use level descriptors 2
Q5 · Water stress is when the demand for water exceeds supply
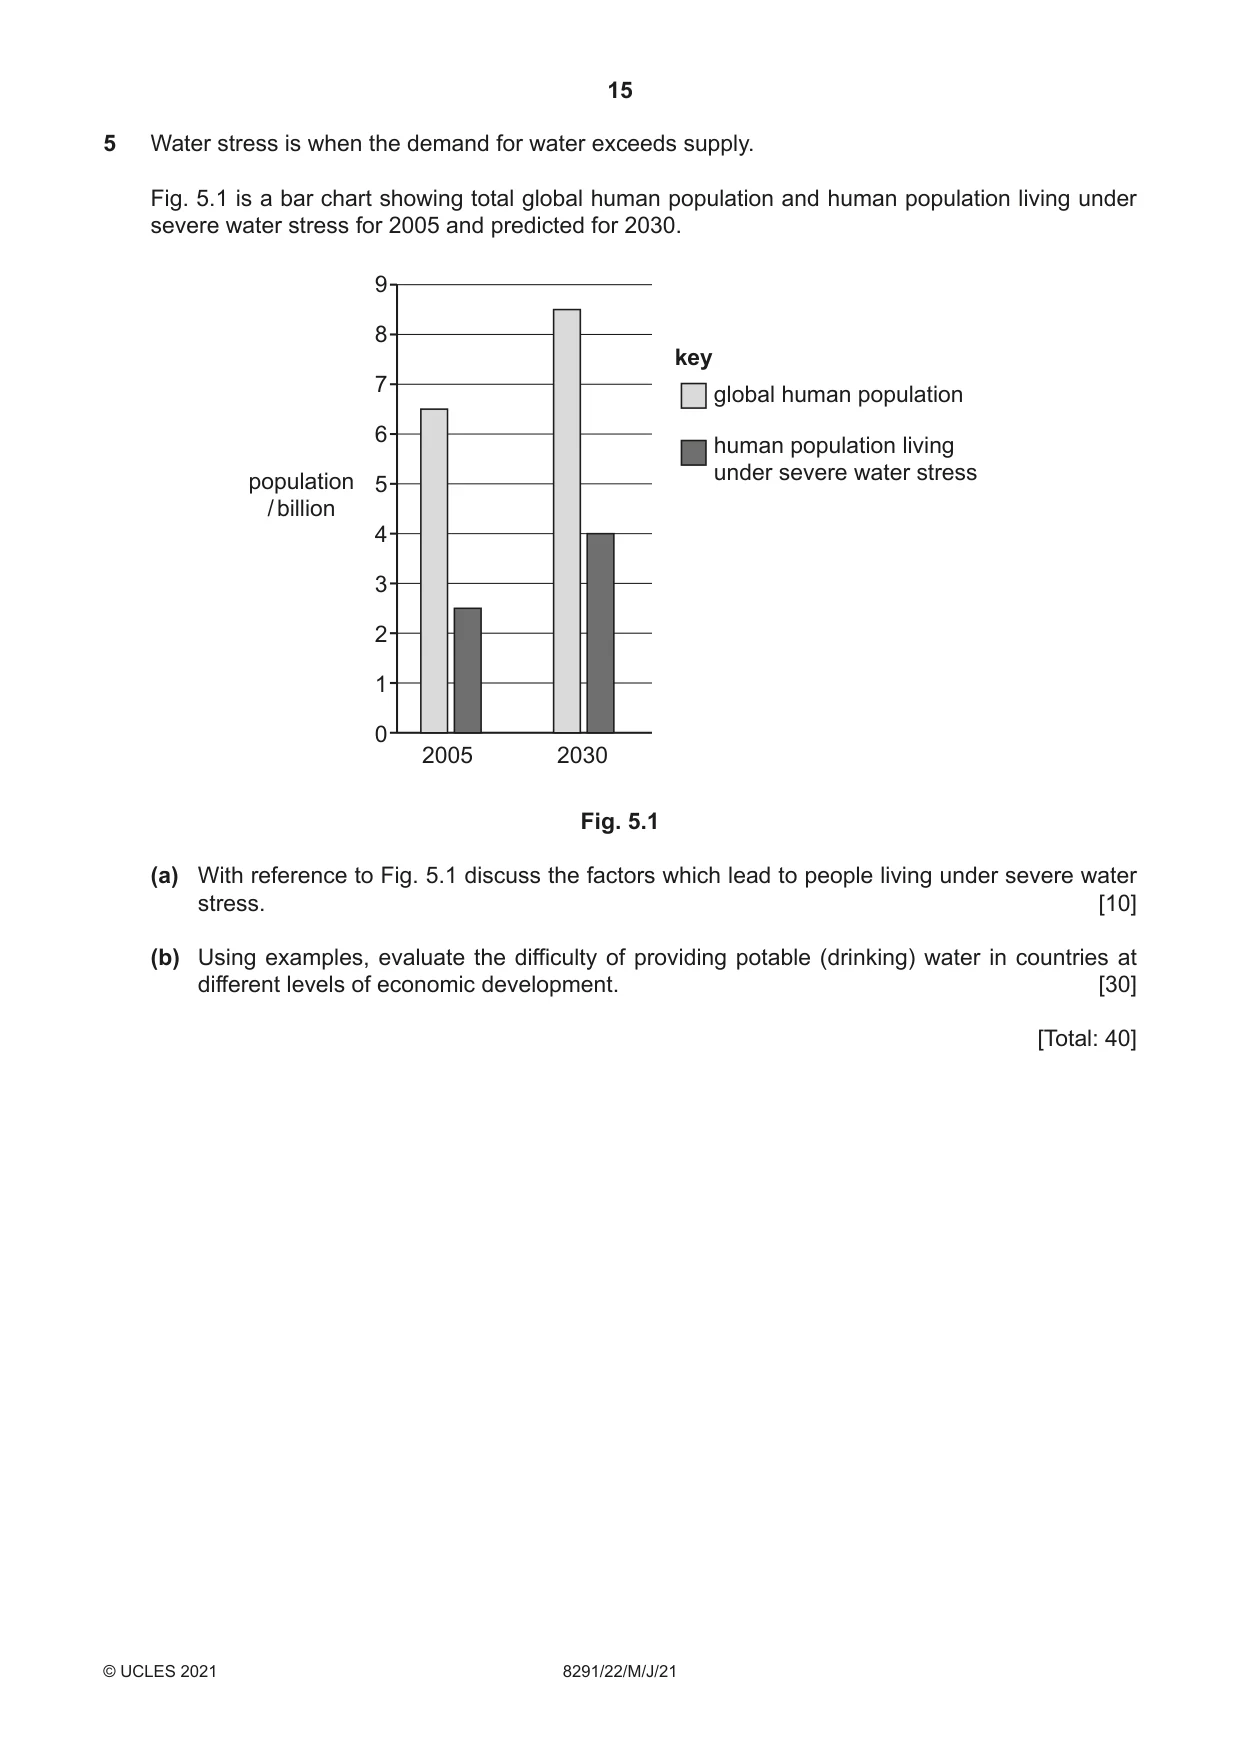
5 Water stress is when the demand for water exceeds supply. Fig. 5.1 is a bar chart showing total global human population and human population living under severe water stress for 2005 and predicted for 2030. 9 8 key 7 global human population 6 human population living under severe water stress population 5 / billion 4 3 2 1 0 2005 2030 Fig. 5.1 (a) With reference to Fig. 5.1 discuss the factors which lead to people living under severe water stress. [10] (b) Using examples, evaluate the difficulty of providing potable (drinking) water in countries at different levels of economic development. [30] [Total: 40]
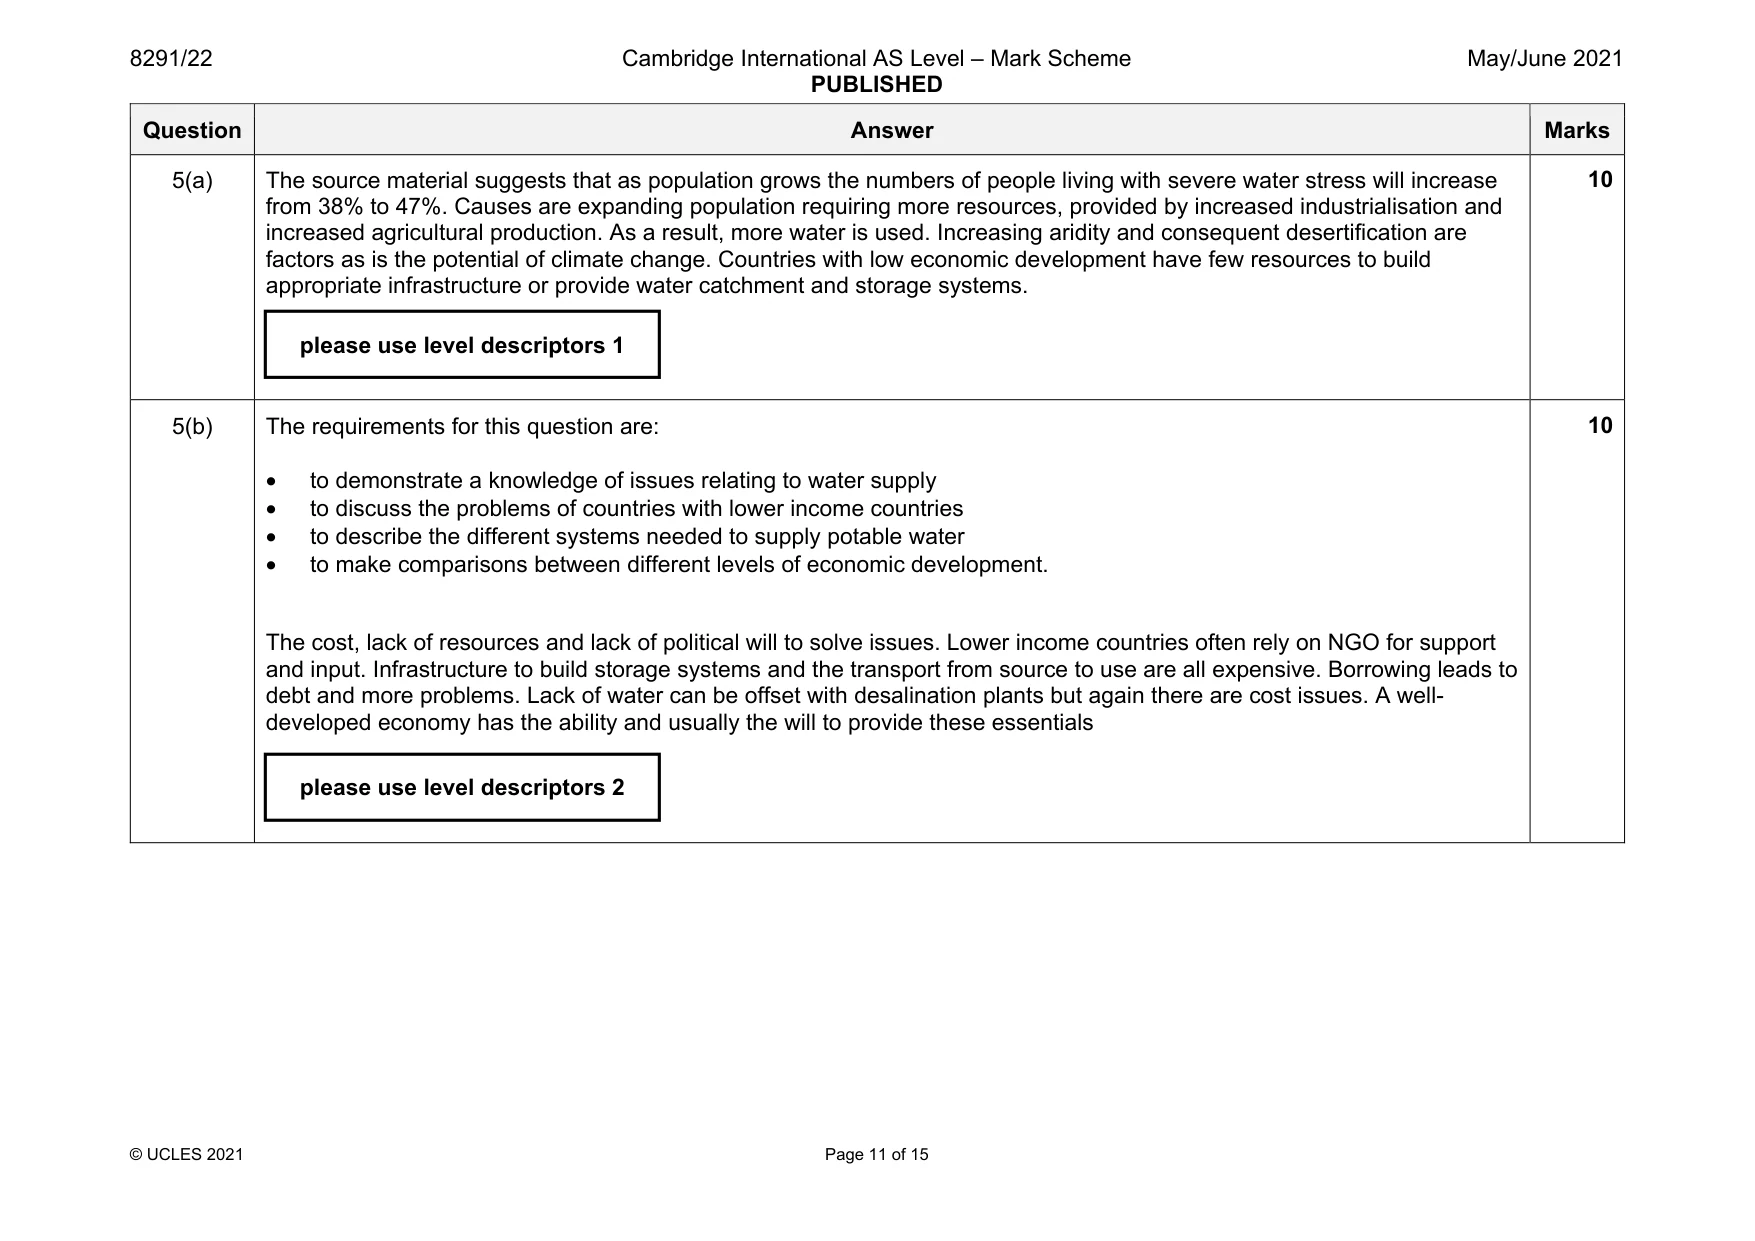
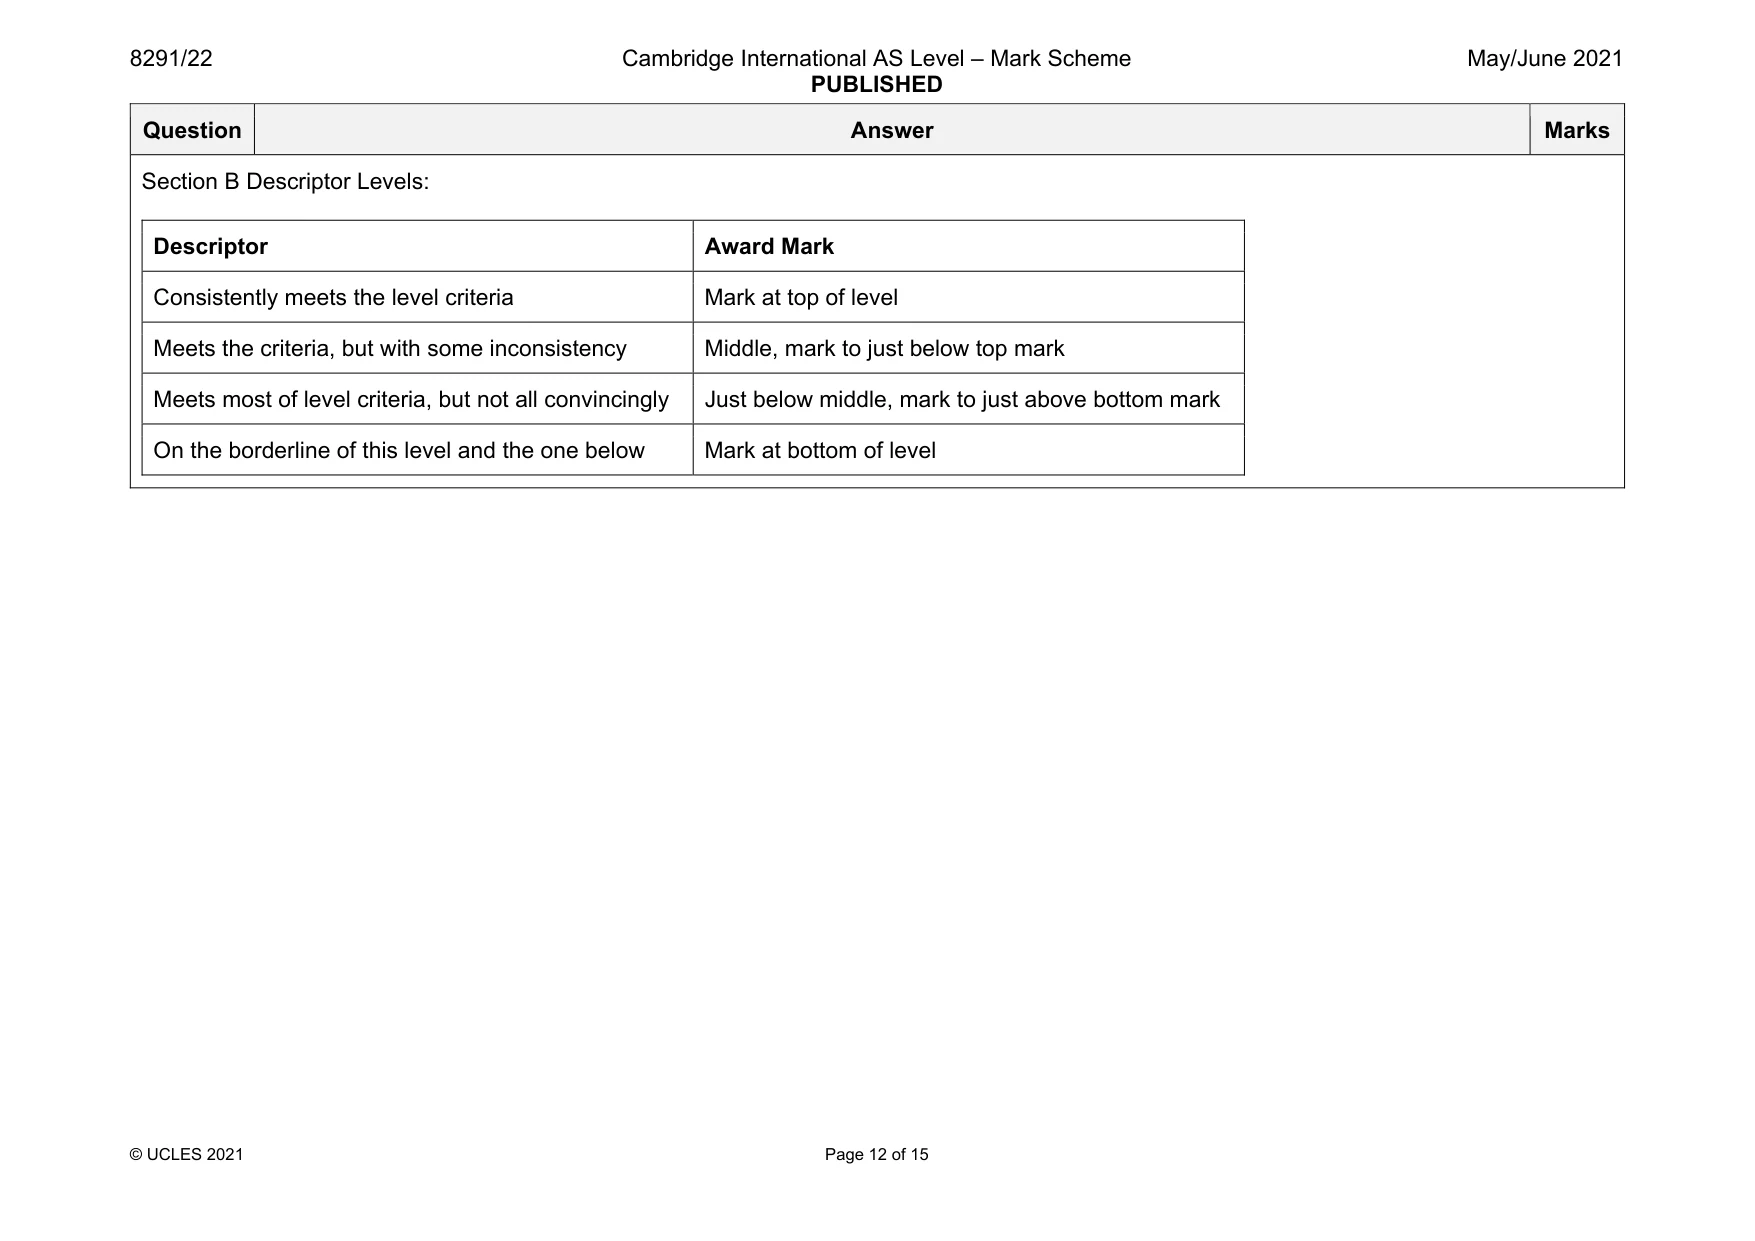
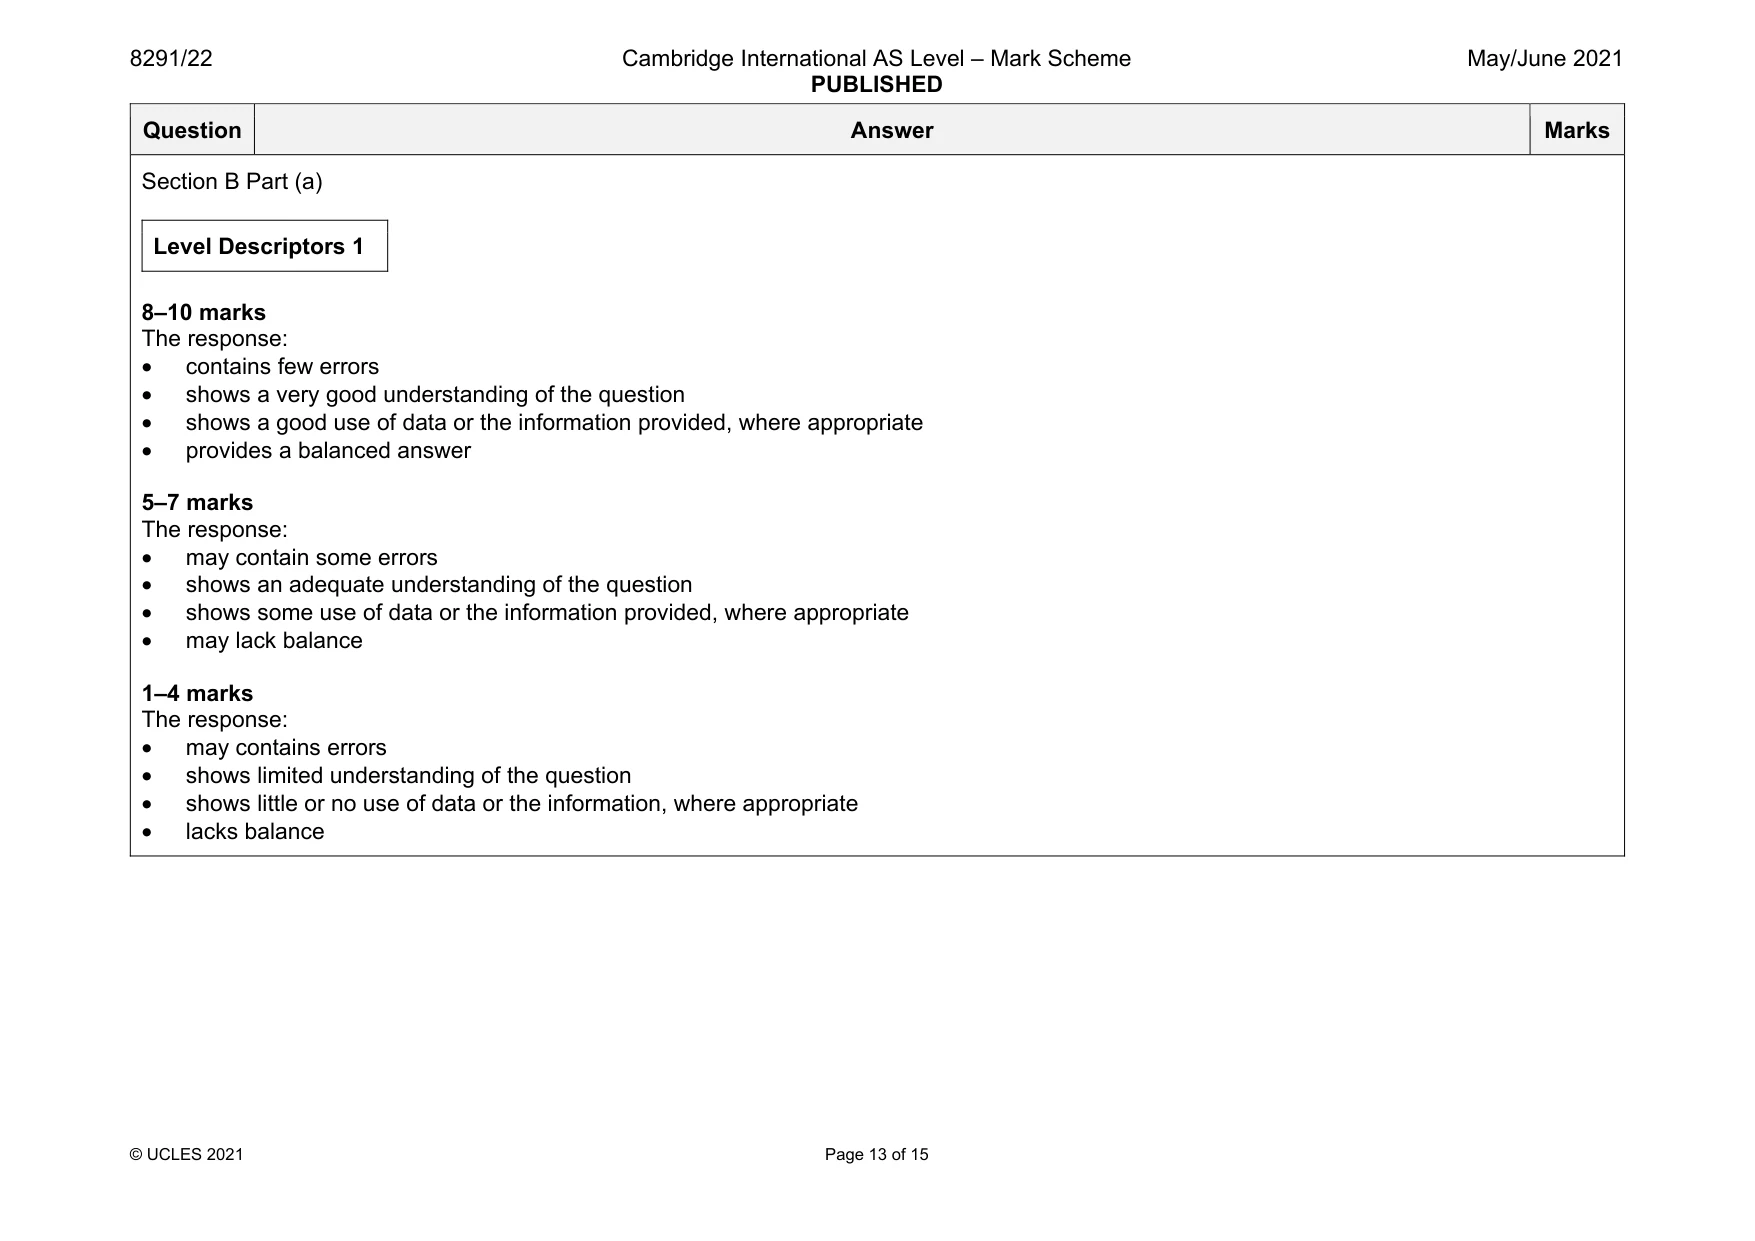
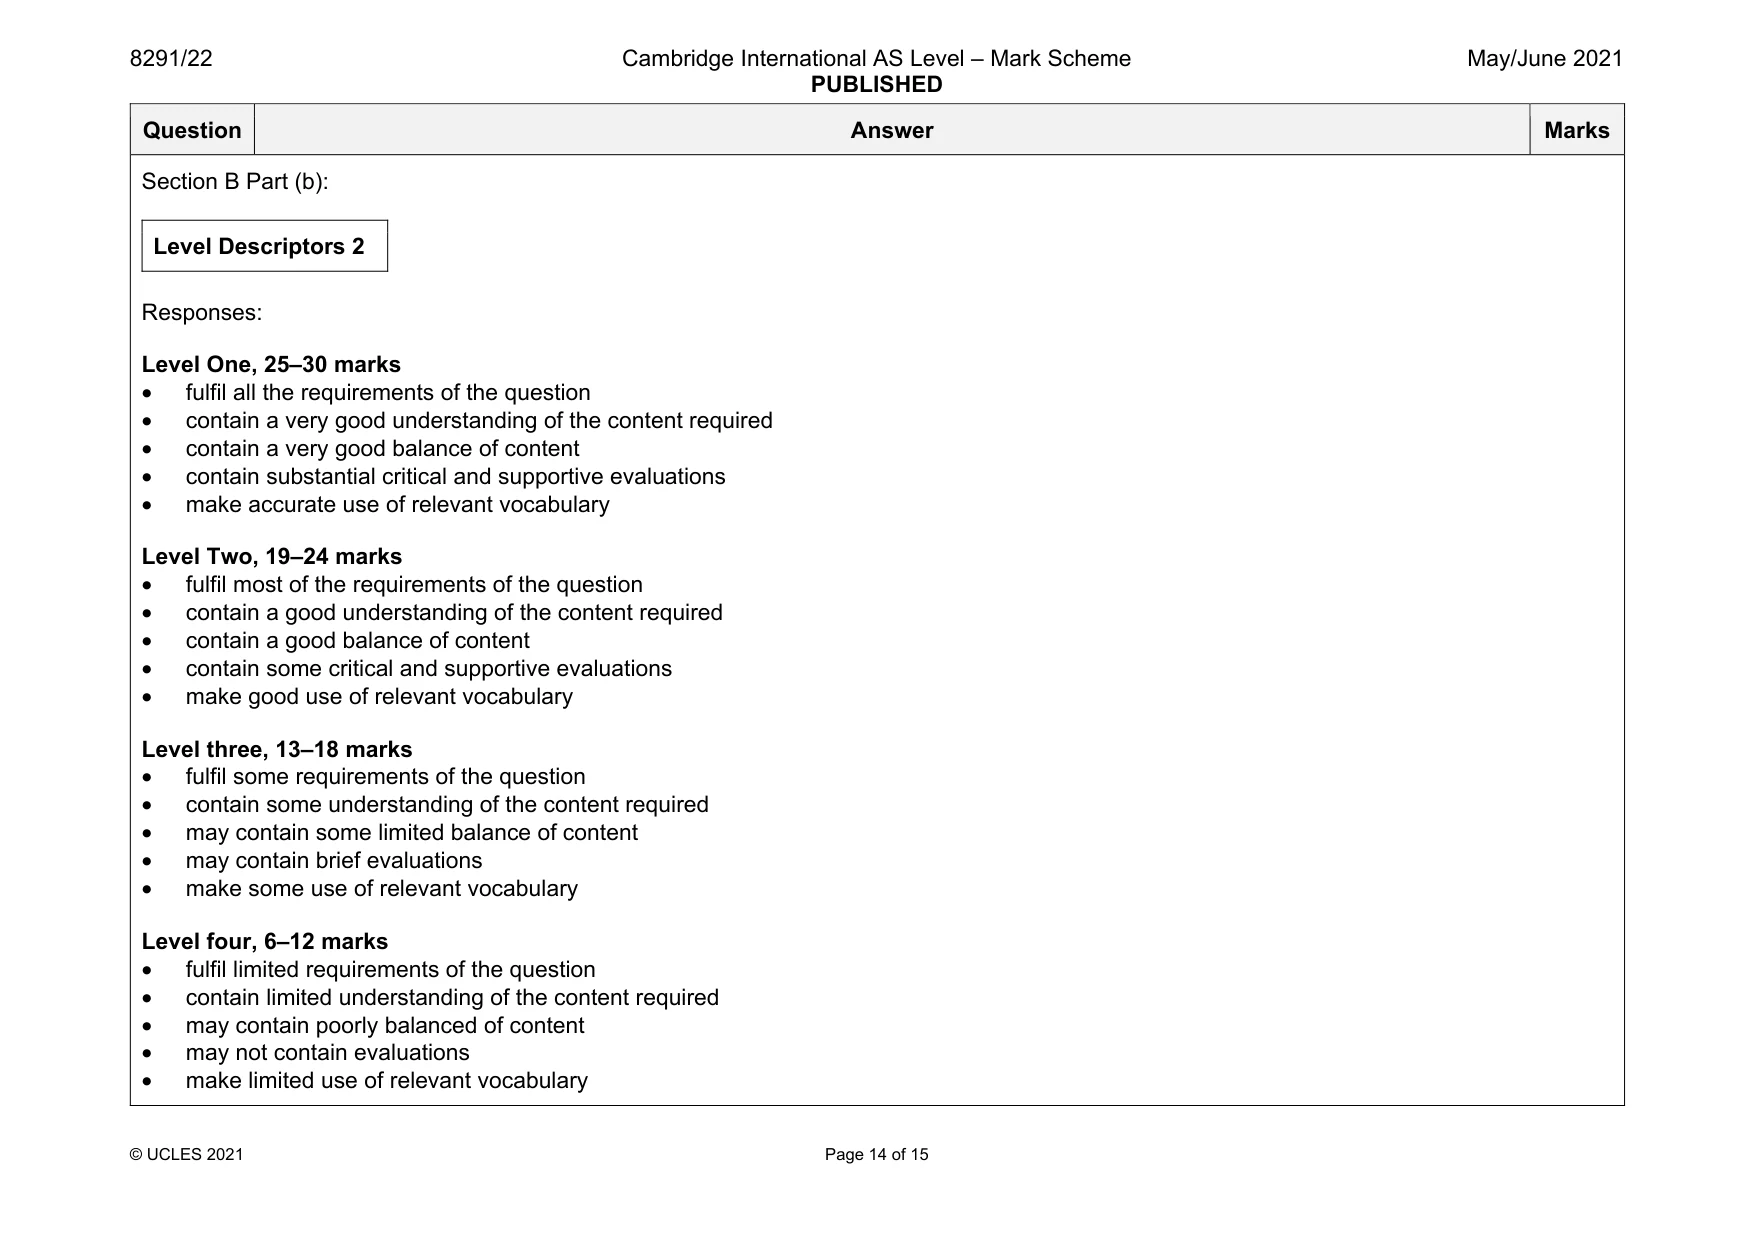
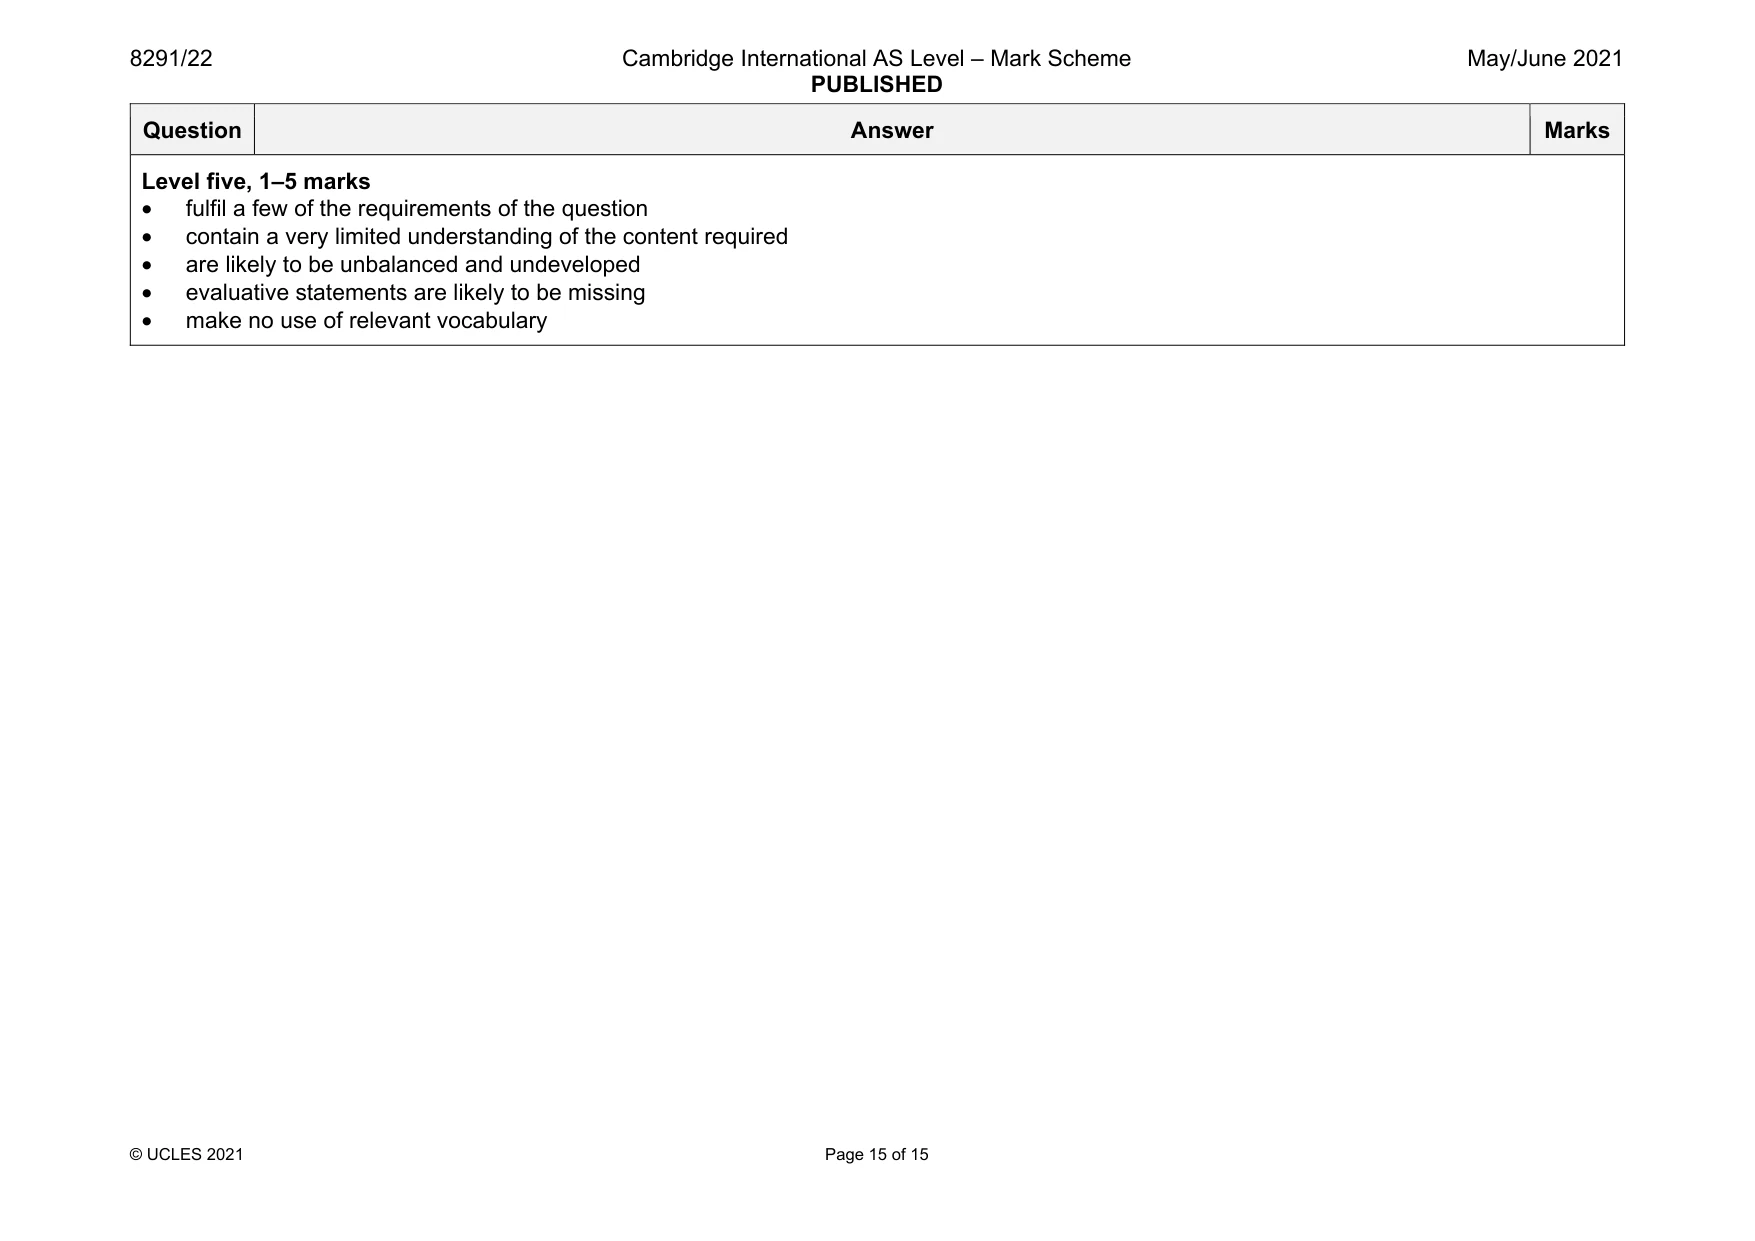
Mark scheme: 5(a) The source material suggests that as population grows the numbers of people living with severe water stress will increase from 38% to 47%. Causes are expanding population requiring more resources, provided by increased industrialisation and increased agricultural production. As a result, more water is used. Increasing aridity and consequent desertification are factors as is the potential of climate change. Countries with low economic development have few resources to build appropriate infrastructure or provide water catchment and storage systems. 5(b) The requirements for this question are: • to demonstrate a knowledge of issues relating to water supply • to discuss the problems of countries with lower income countries • to describe the different systems needed to supply potable water • to make comparisons between different levels of economic development. The cost, lack of resources and lack of political will to solve issues. Lower income countries often rely on NGO for support and input. Infrastructure to build storage systems and the transport from source to use are all expensive. Borrowing leads to debt and more problems. Lack of water can be offset with desalination plants but again there are cost issues. A well- developed economy has the ability and usually the will to provide these essentials 10 please use level descriptors 2 please use level descriptors 1 Question Answer Marks Section B Descriptor Levels: Descriptor Award Mark Consistently meets the level criteria Mark at top of level Meets the criteria, but with some inconsistency Middle, mark to just below top mark Meets most of level criteria, but not all convincingly Just below middle, mark to just above bottom mark On the borderline of this level and the one below Mark at bottom of level Question Answer Marks Section B Part (a) Level Descriptors 1 8–10 marks The response: • contains few errors • shows a very good understanding of the question • shows a good use of data or the information provided, where appropriate • provides a balanced answer 5–7 marks The response: • may contain some errors • shows an adequate understanding of the question • shows some use of data or the information provided, where appropriate • may lack balance 1–4 marks The response: • may contains errors • shows limited understanding of the question • shows little or no use of data or the information, where appropriate • lacks balance Question Answer Marks Section B Part (b): Level Descriptors 2 Responses: Level One, 25–30 marks • fulfil all the requirements of the question • contain a very good understanding of the content required • contain a very good balance of content • contain substantial critical and supportive evaluations • make accurate use of relevant vocabulary Level Two, 19–24 marks • fulfil most of the requirements of the question • contain a good understanding of the content required • contain a good balance of content • contain some critical and supportive evaluations • make good use of relevant vocabulary Level three, 13–18 marks • fulfil some requirements of the question • contain some understanding of the content required • may contain some limited balance of content • may contain brief evaluations • make some use of relevant vocabulary Level four, 6–12 marks • fulfil limited requirements of the question • contain limited understanding of the content required • may contain poorly balanced of content • may not contain evaluations • make limited use of relevant vocabulary Question Answer Marks Level five, 1–5 marks • fulfil a few of the requirements of the question • contain a very limited understanding of the content required • are likely to be unbalanced and undeveloped • evaluative statements are likely to be missing • make no use of relevant vocabulary
What was in this paper
The subtopics covered by these 5 questions, and how many questions each got. Open one in a new tab to see every Cambridge question on it.
What you needed in this session
Cambridge’s own grade thresholds for 2021 May/June, Paper 2 · Variant 2. A higher threshold means an easier paper — the bar moves with how the cohort did.