Cambridge A Level Environmental Management (AS only) 8291 — 2021 May/June Paper 2 · Variant 1
8291/21/M/J/21 · 5 questions · 80 marks · ≈90 min
The question paper and its mark scheme, free to read here and free to download. This is Cambridge’s own paper, exactly as it was sat.
Question paper12 pages

Mark scheme17 pages
Answers below. Sit the paper first if you are practising.
Questions as text
Q1 · Water withdrawal is the total volume of water removed from a water source
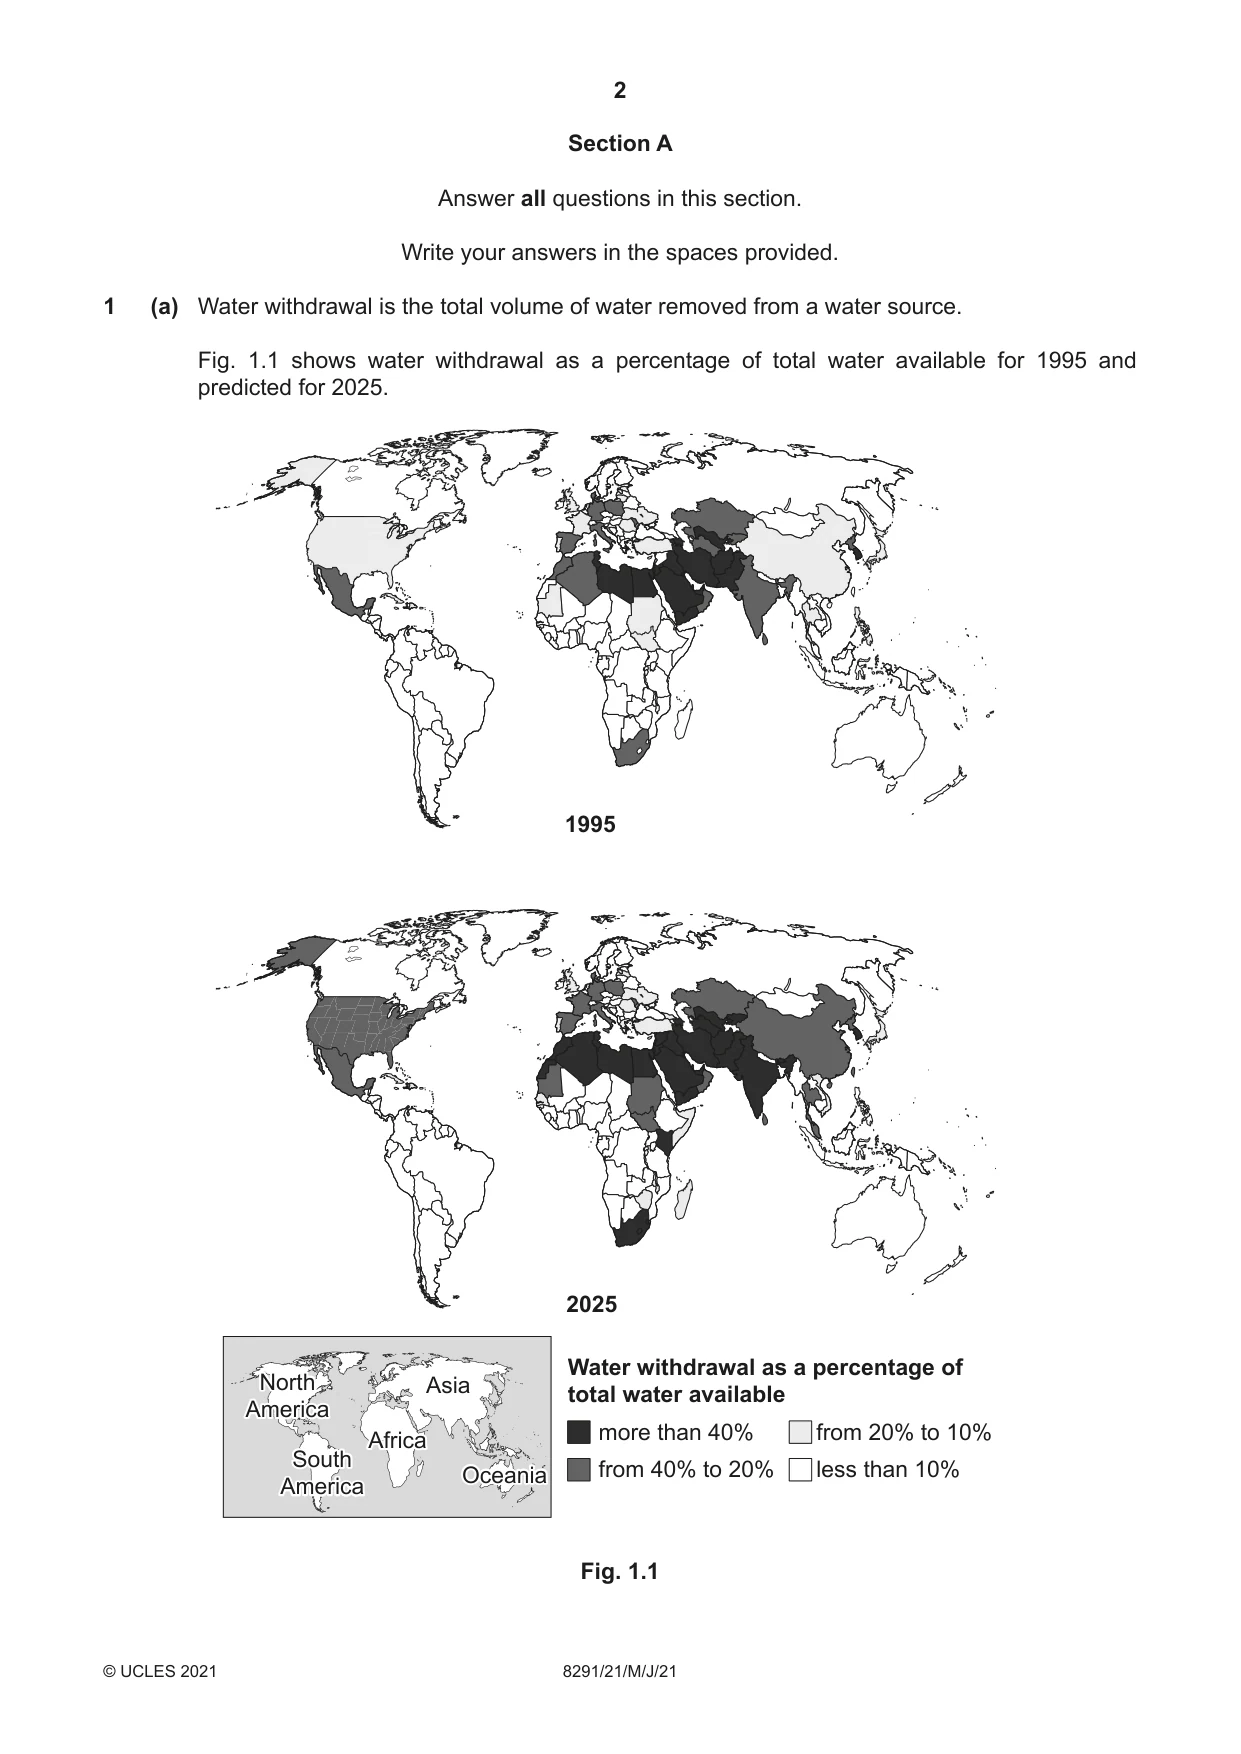
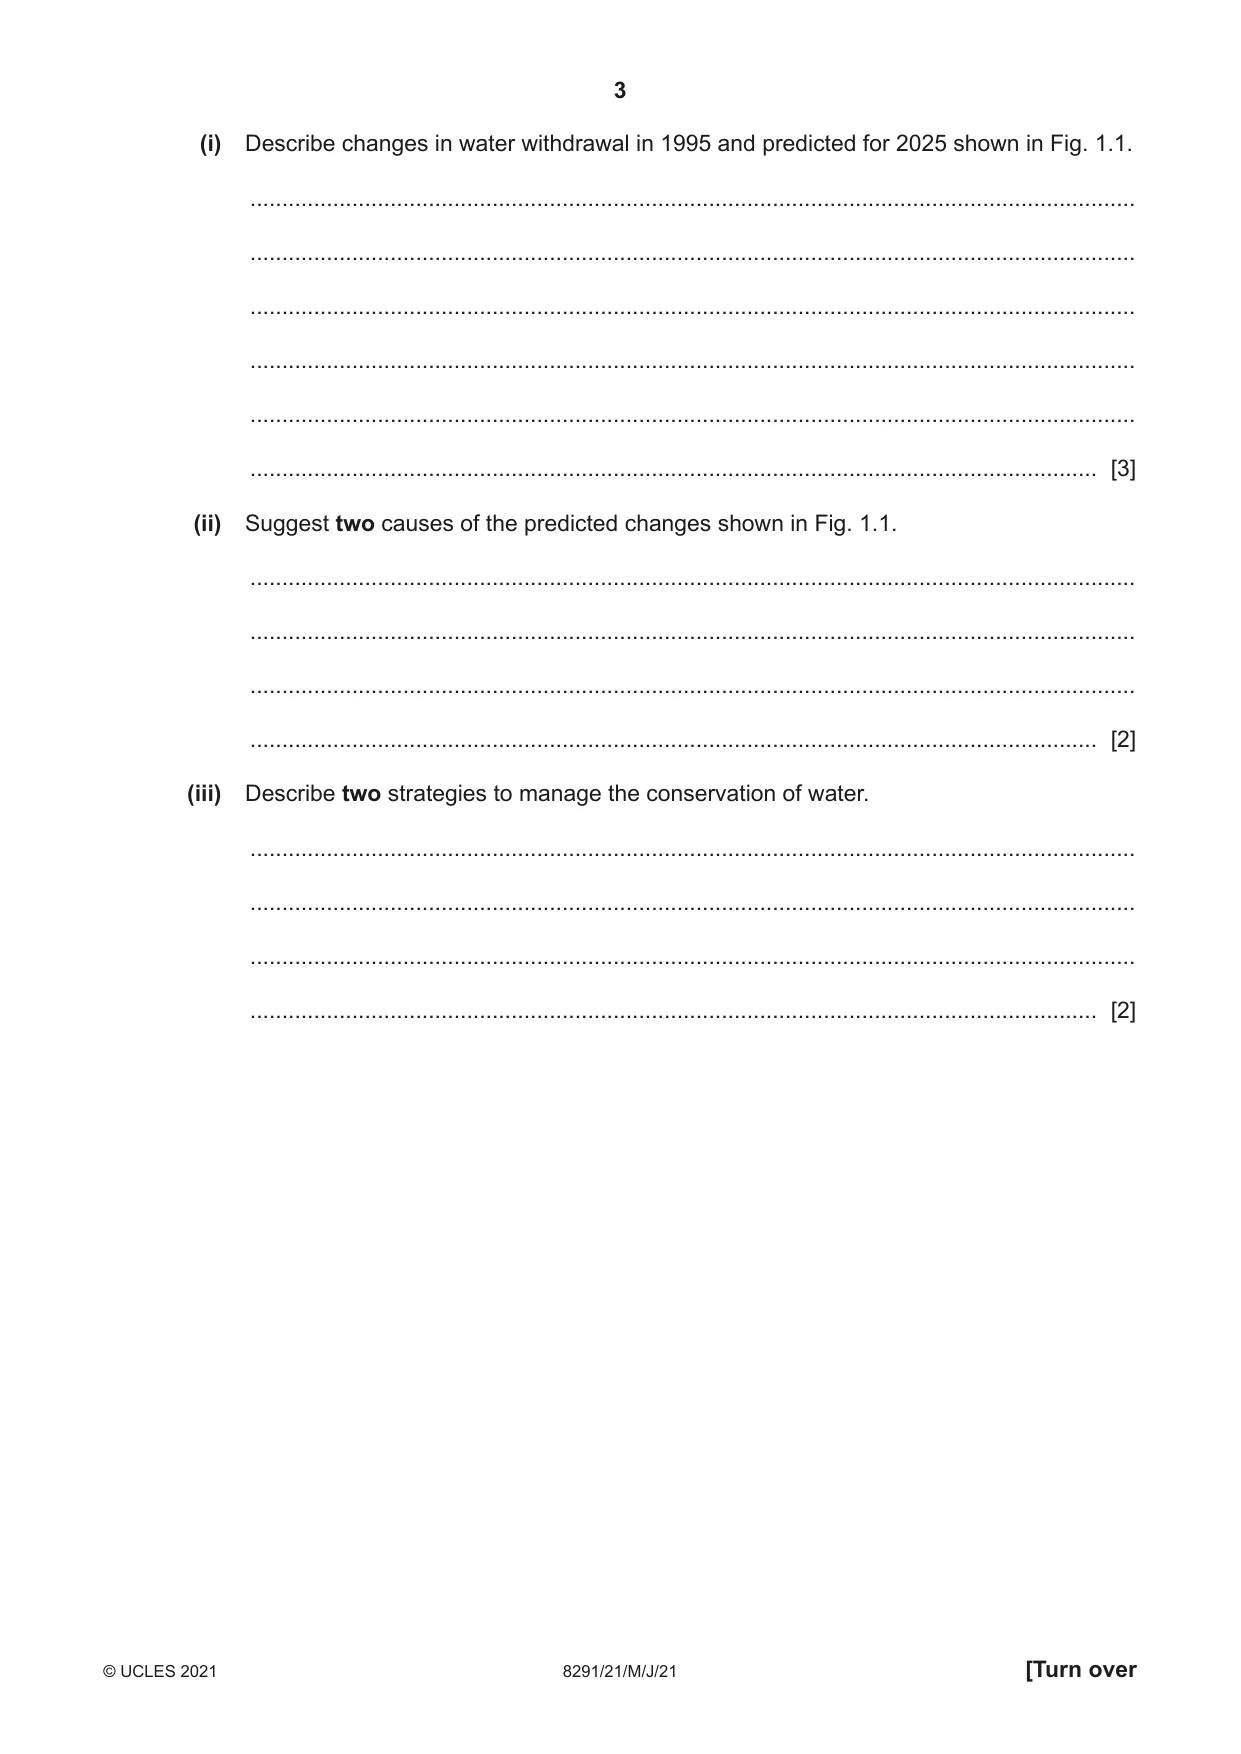
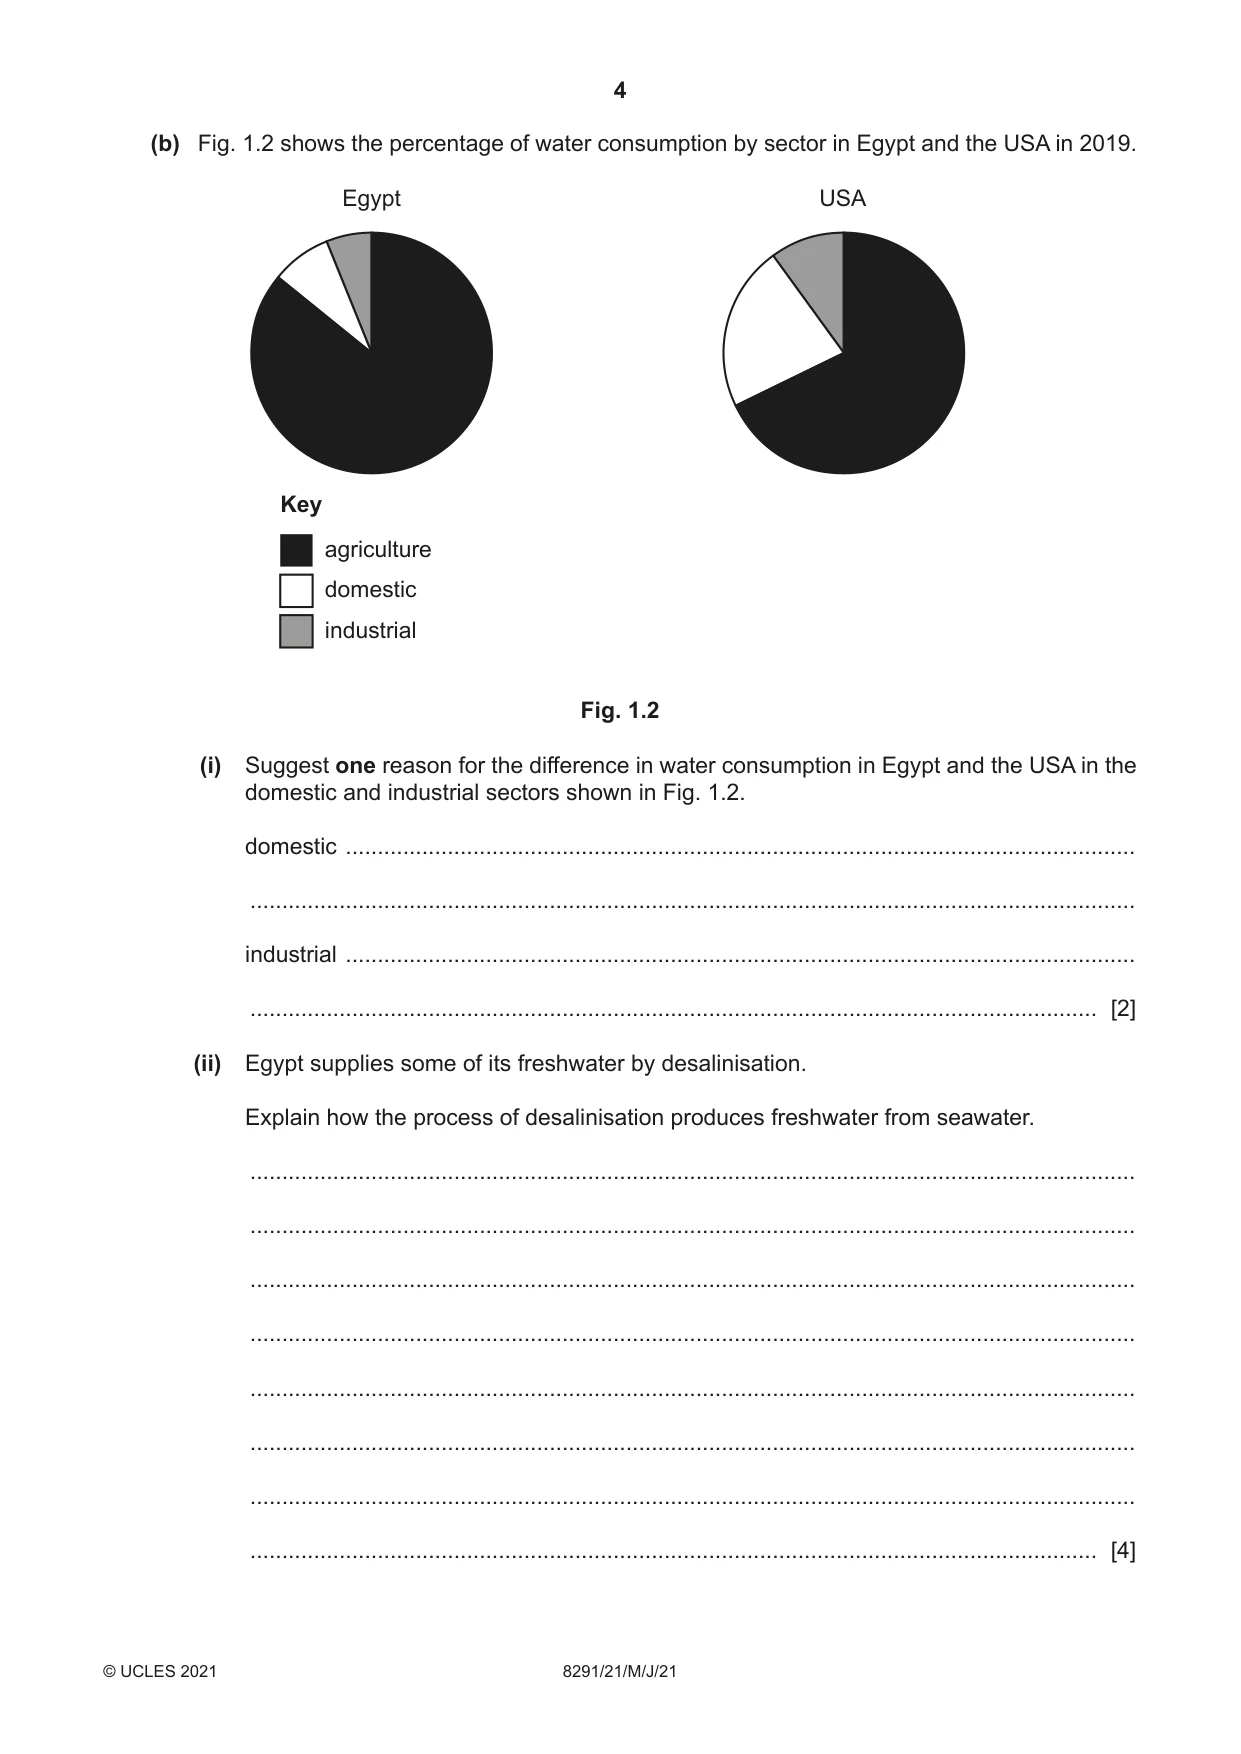
1 (a) Water withdrawal is the total volume of water removed from a water source. Fig. 1.1 shows water withdrawal as a percentage of total water available for 1995 and predicted for 2025. 1995 2025 Water withdrawal as a percentage of NorthNorth Asia total water available AmericaAmerica more than 40% from 20% to 10% AfricaAfrica SouthSouth OceaniaOceania from 40% to 20% less than 10% AmericaAmerica Fig. 1.1 (i) Describe changes in water withdrawal in 1995 and predicted for 2025 shown in Fig. 1.1. ........................................................................................................................................... ........................................................................................................................................... ........................................................................................................................................... ........................................................................................................................................... ........................................................................................................................................... ..................................................................................................................................... [3] (ii) Suggest two causes of the predicted changes shown in Fig. 1.1. ........................................................................................................................................... ........................................................................................................................................... ........................................................................................................................................... ..................................................................................................................................... [2] (iii) Describe two strategies to manage the conservation of water. ........................................................................................................................................... ........................................................................................................................................... ........................................................................................................................................... ..................................................................................................................................... [2] (b) Fig. 1.2 shows the percentage of water consumption by sector in Egypt and the USA in 2019. Egypt USA Key agriculture domestic industrial Fig. 1.2 (i) Suggest one reason for the difference in water consumption in Egypt and the USA in the domestic and industrial sectors shown in Fig. 1.2. domestic ............................................................................................................................ ........................................................................................................................................... industrial ............................................................................................................................ ..................................................................................................................................... [2] (ii) Egypt supplies some of its freshwater by desalinisation. Explain how the process of desalinisation produces freshwater from seawater. ........................................................................................................................................... ........................................................................................................................................... ........................................................................................................................................... ........................................................................................................................................... ........................................................................................................................................... ........................................................................................................................................... ........................................................................................................................................... ..................................................................................................................................... [4] (iii) Describe advantages and disadvantages of using desalinisation to supply freshwater. advantages ........................................................................................................................ ........................................................................................................................................... ........................................................................................................................................... ........................................................................................................................................... disadvantages ................................................................................................................... ........................................................................................................................................... ........................................................................................................................................... ..................................................................................................................................... [4] (c) Approximately 2% of the world’s water is freshwater. Explain how climate change impacts the availability of freshwater. ................................................................................................................................................... ................................................................................................................................................... ................................................................................................................................................... ................................................................................................................................................... ................................................................................................................................................... ............................................................................................................................................. [3] [Total: 20]
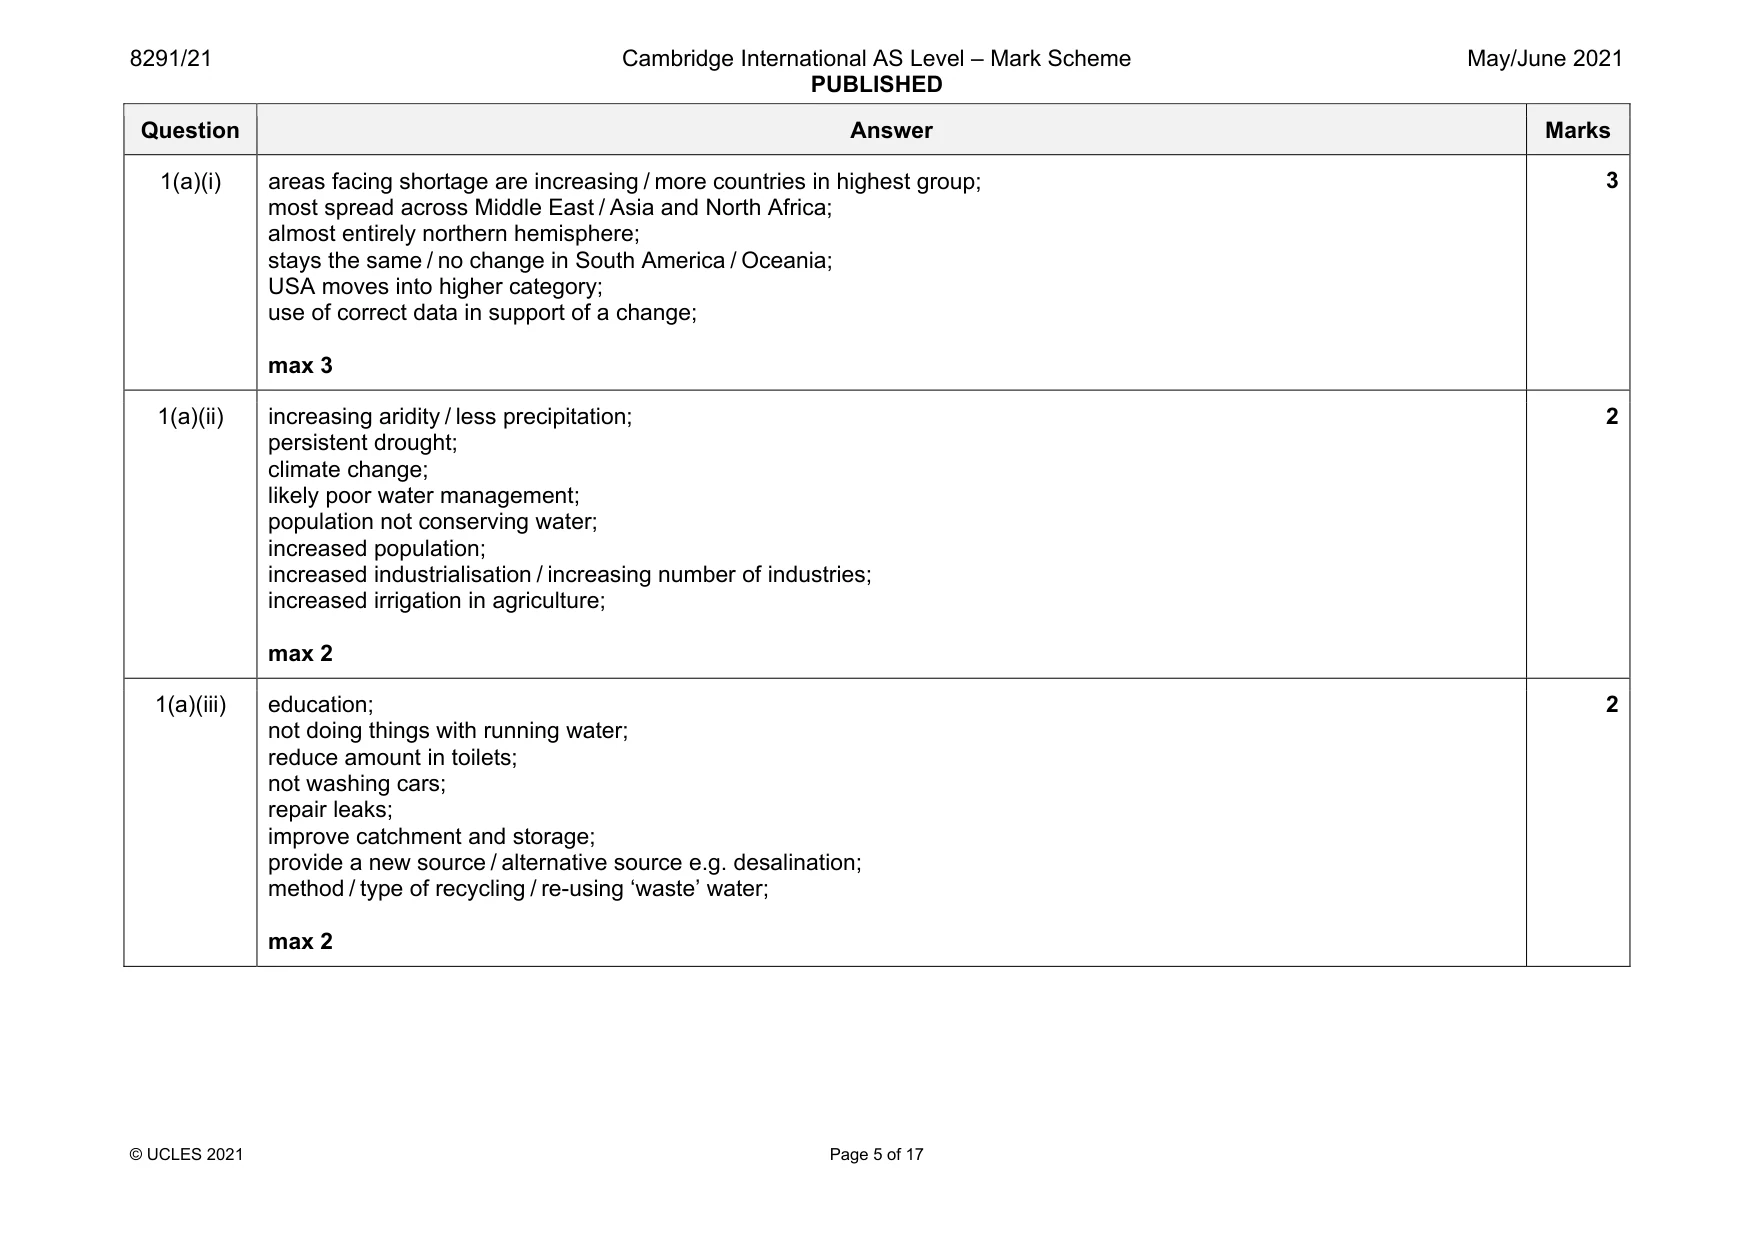
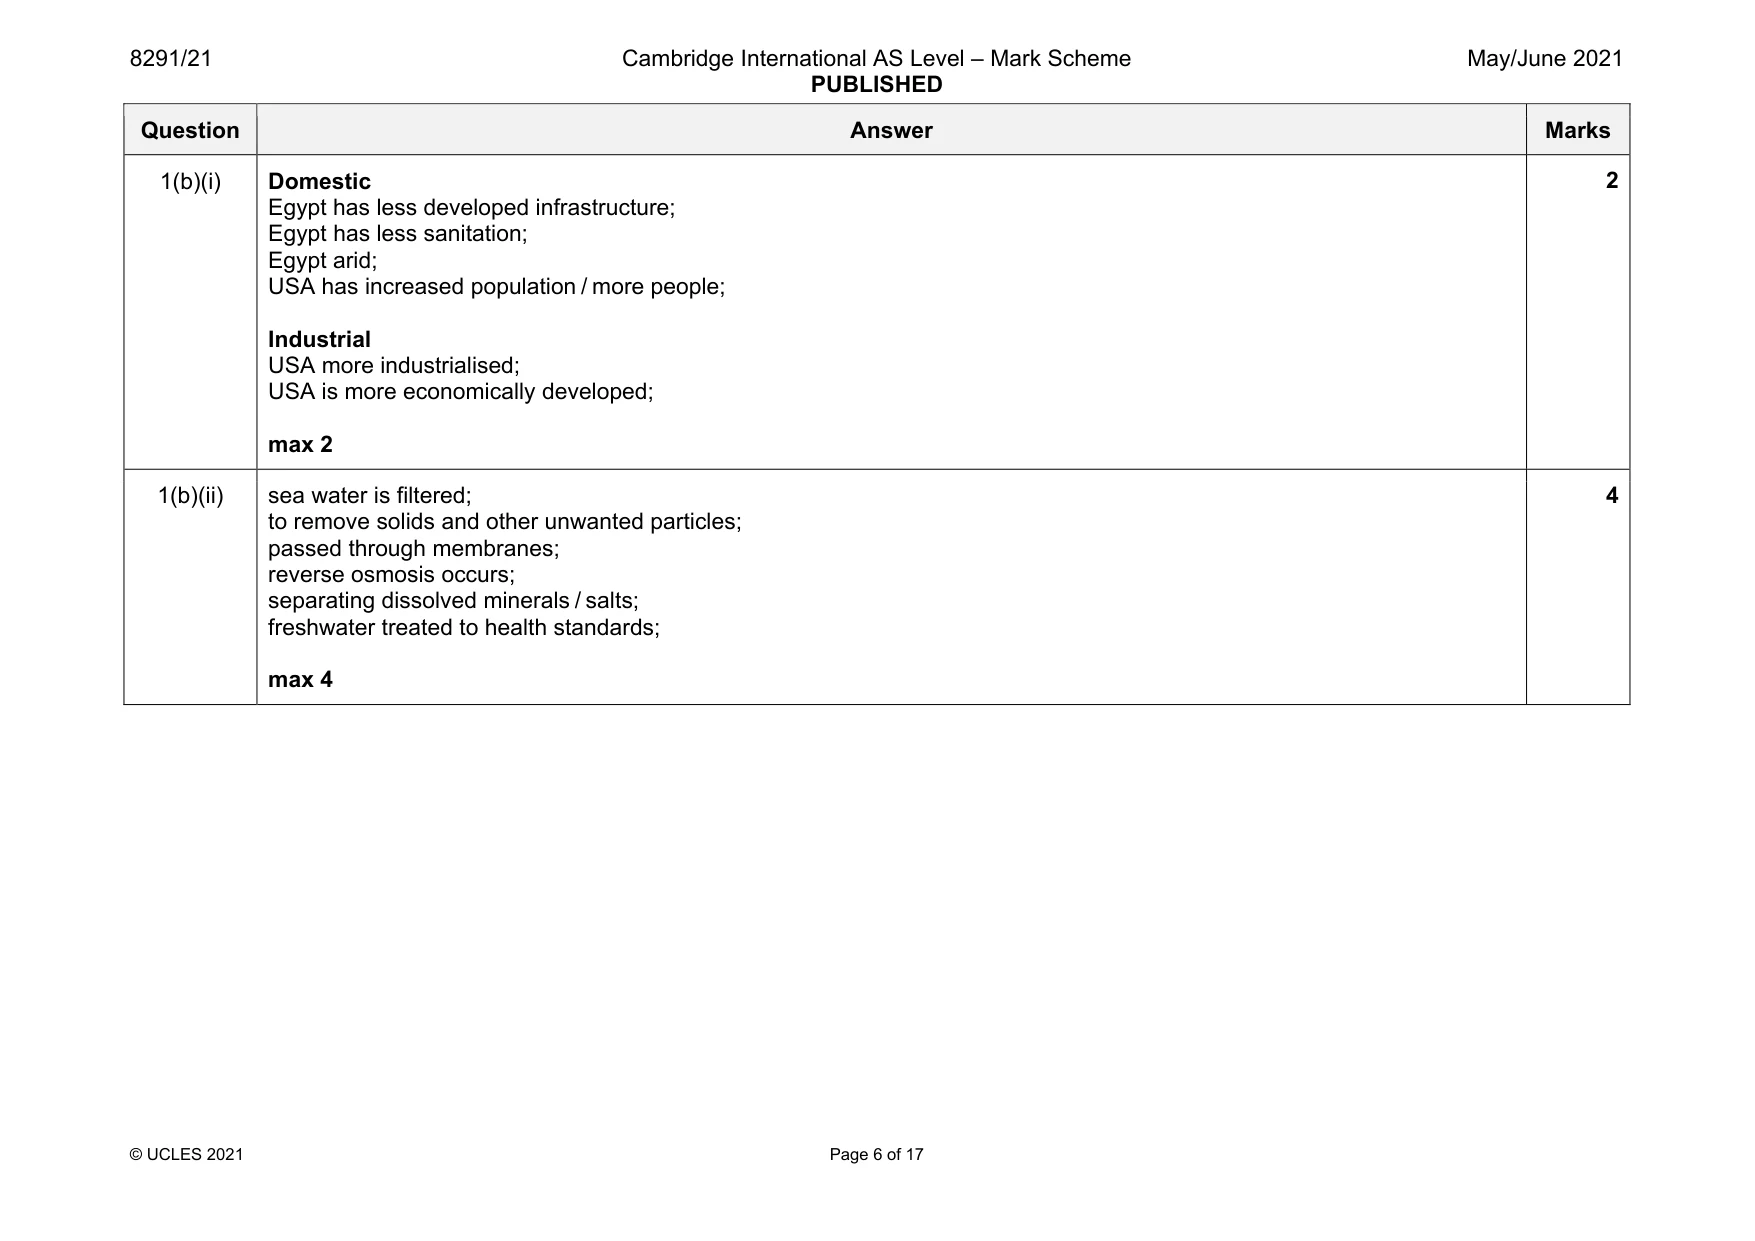
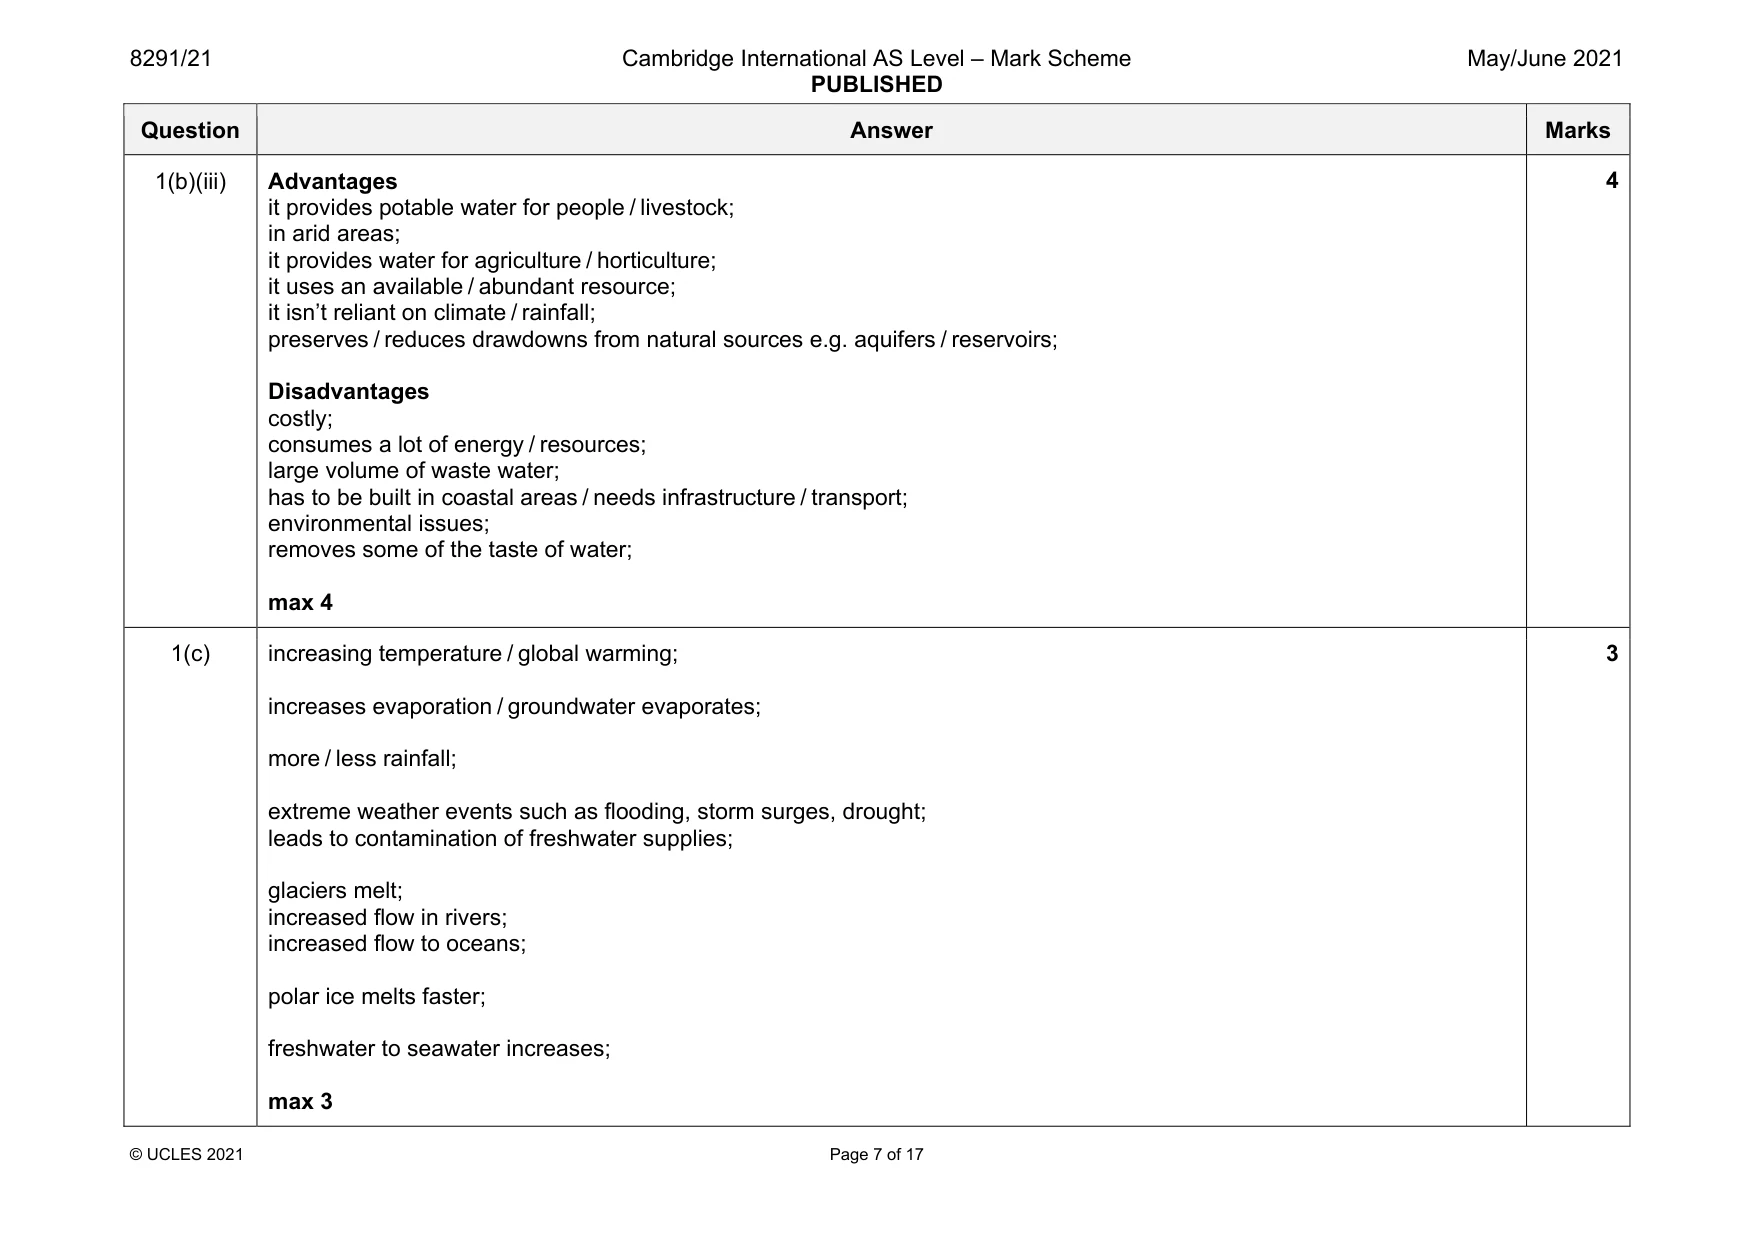
Mark scheme: 1(a)(i) areas facing shortage are increasing / more countries in highest group; most spread across Middle East / Asia and North Africa; almost entirely northern hemisphere; stays the same / no change in South America / Oceania; USA moves into higher category; use of correct data in support of a change; max 3 1(a)(ii) increasing aridity / less precipitation; persistent drought; climate change; likely poor water management; population not conserving water; increased population; increased industrialisation / increasing number of industries; increased irrigation in agriculture; max 2 2 1(a)(iii) education; not doing things with running water; reduce amount in toilets; not washing cars; repair leaks; improve catchment and storage; provide a new source / alternative source e.g. desalination; method / type of recycling / re-using ‘waste’ water; max 2 2 Question Answer Marks 1(b)(i) Domestic Egypt has less developed infrastructure; Egypt has less sanitation; Egypt arid; USA has increased population / more people; Industrial USA more industrialised; USA is more economically developed; max 2 2 1(b)(ii) sea water is filtered; to remove solids and other unwanted particles; passed through membranes; reverse osmosis occurs; separating dissolved minerals / salts; freshwater treated to health standards; max 4 4 Question Answer Marks 1(b)(iii) Advantages it provides potable water for people / livestock; in arid areas; it provides water for agriculture / horticulture; it uses an available / abundant resource; it isn’t reliant on climate / rainfall; preserves / reduces drawdowns from natural sources e.g. aquifers / reservoirs; Disadvantages costly; consumes a lot of energy / resources; large volume of waste water; has to be built in coastal areas / needs infrastructure / transport; environmental issues; removes some of the taste of water; max 4 4 1(c) increasing temperature / global warming; increases evaporation / groundwater evaporates; more / less rainfall; extreme weather events such as flooding, storm surges, drought; leads to contamination of freshwater supplies; glaciers melt; increased flow in rivers; increased flow to oceans; polar ice melts faster; freshwater to seawater increases; max 3 3
Q2 · The word equation for the process of photosynthesis in green plants
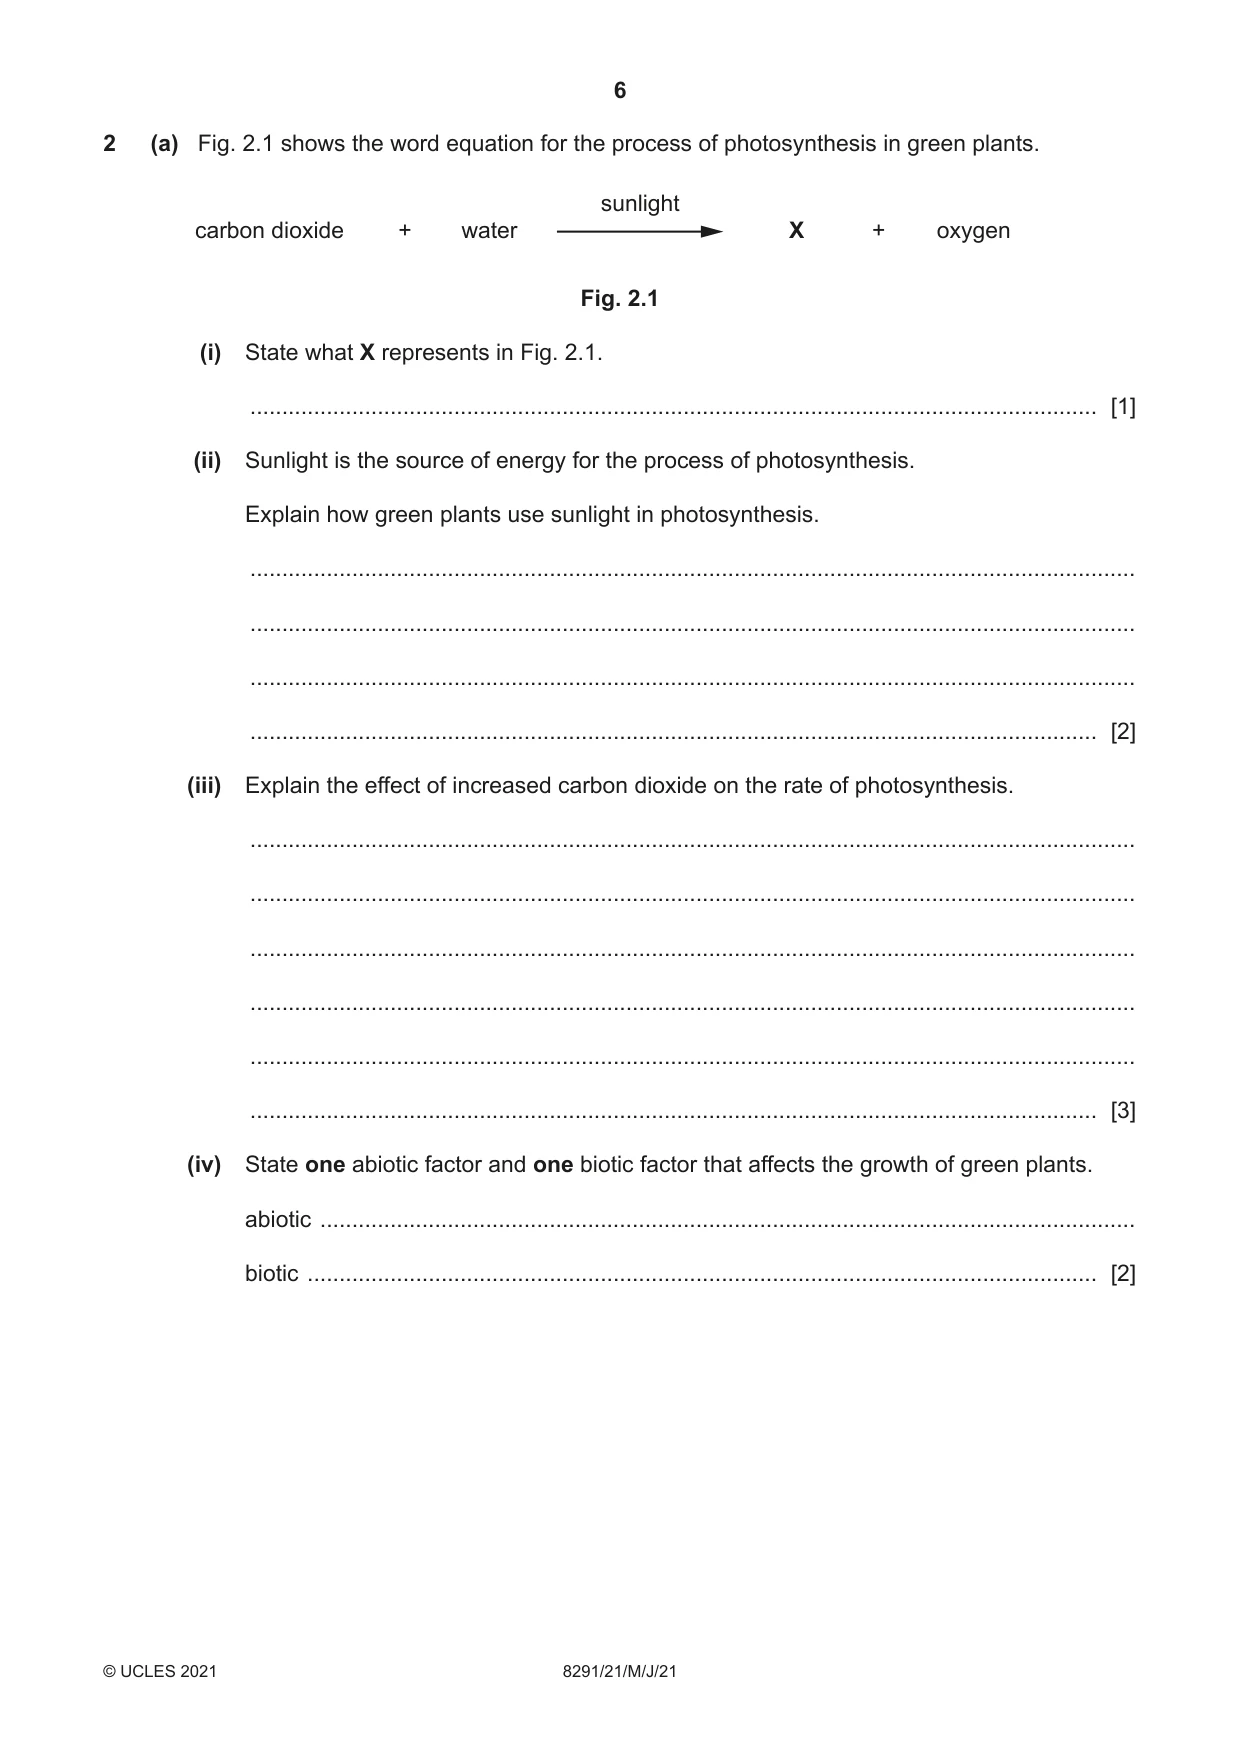
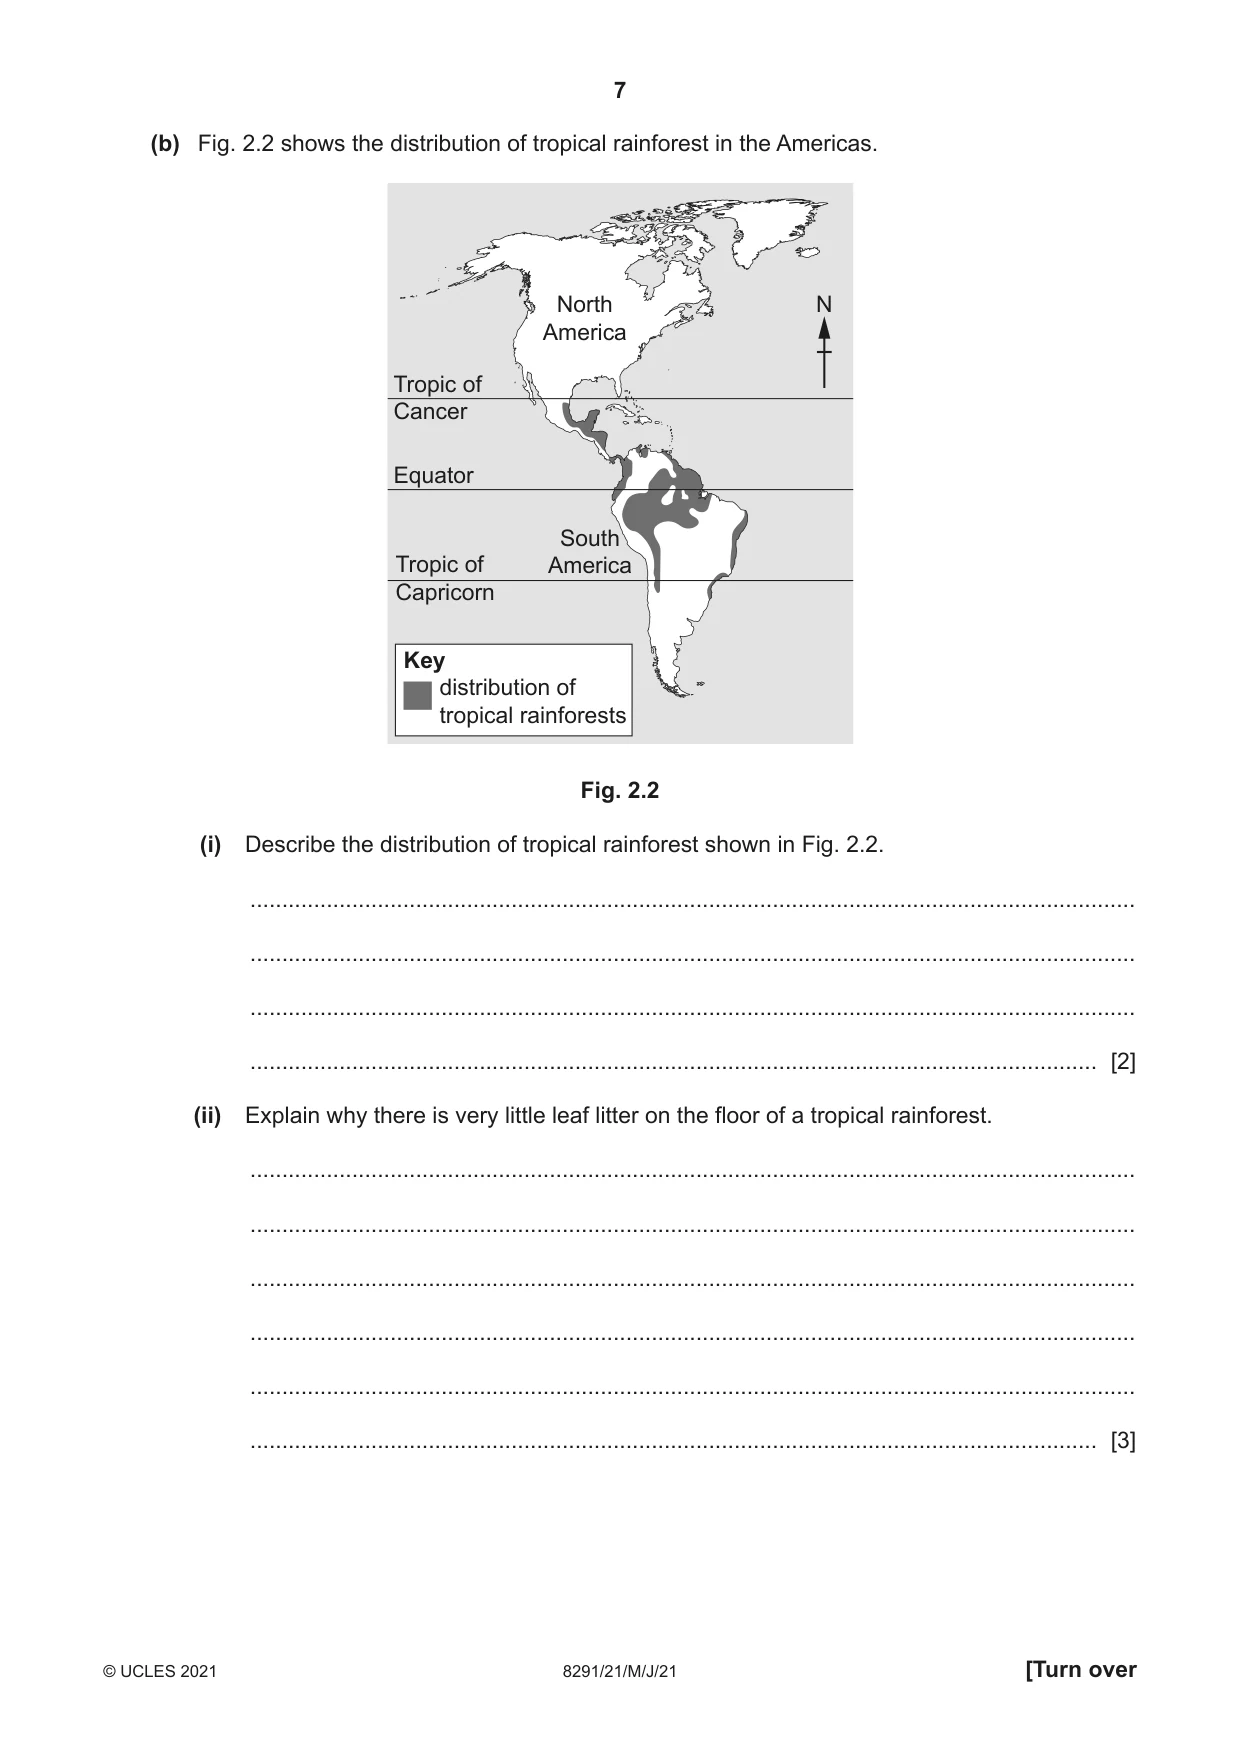
2 (a) Fig. 2.1 shows the word equation for the process of photosynthesis in green plants. sunlight carbon dioxide + water X + oxygen Fig. 2.1 (i) State what X represents in Fig. 2.1. ..................................................................................................................................... [1] (ii) Sunlight is the source of energy for the process of photosynthesis. Explain how green plants use sunlight in photosynthesis. ........................................................................................................................................... ........................................................................................................................................... ........................................................................................................................................... ..................................................................................................................................... [2] (iii) Explain the effect of increased carbon dioxide on the rate of photosynthesis. ........................................................................................................................................... ........................................................................................................................................... ........................................................................................................................................... ........................................................................................................................................... ........................................................................................................................................... ..................................................................................................................................... [3] (iv) State one abiotic factor and one biotic factor that affects the growth of green plants. abiotic ................................................................................................................................ biotic ............................................................................................................................ [2] (b) Fig. 2.2 shows the distribution of tropical rainforest in the Americas. North N America Tropic of Cancer Equator South Tropic of America Capricorn Key distribution of tropical rainforests Fig. 2.2 (i) Describe the distribution of tropical rainforest shown in Fig. 2.2. ........................................................................................................................................... ........................................................................................................................................... ........................................................................................................................................... ..................................................................................................................................... [2] (ii) Explain why there is very little leaf litter on the floor of a tropical rainforest. ........................................................................................................................................... ........................................................................................................................................... ........................................................................................................................................... ........................................................................................................................................... ........................................................................................................................................... ..................................................................................................................................... [3] (iii) Explain why there is a large amount of biodiversity in a tropical rainforest. ........................................................................................................................................... ........................................................................................................................................... ........................................................................................................................................... ........................................................................................................................................... ........................................................................................................................................... ..................................................................................................................................... [3] (iv) Explain the effects of land clearance in an area of tropical rainforest, other than on biodiversity. ........................................................................................................................................... ........................................................................................................................................... ........................................................................................................................................... ........................................................................................................................................... ........................................................................................................................................... ........................................................................................................................................... ........................................................................................................................................... ..................................................................................................................................... [4] [Total: 20]
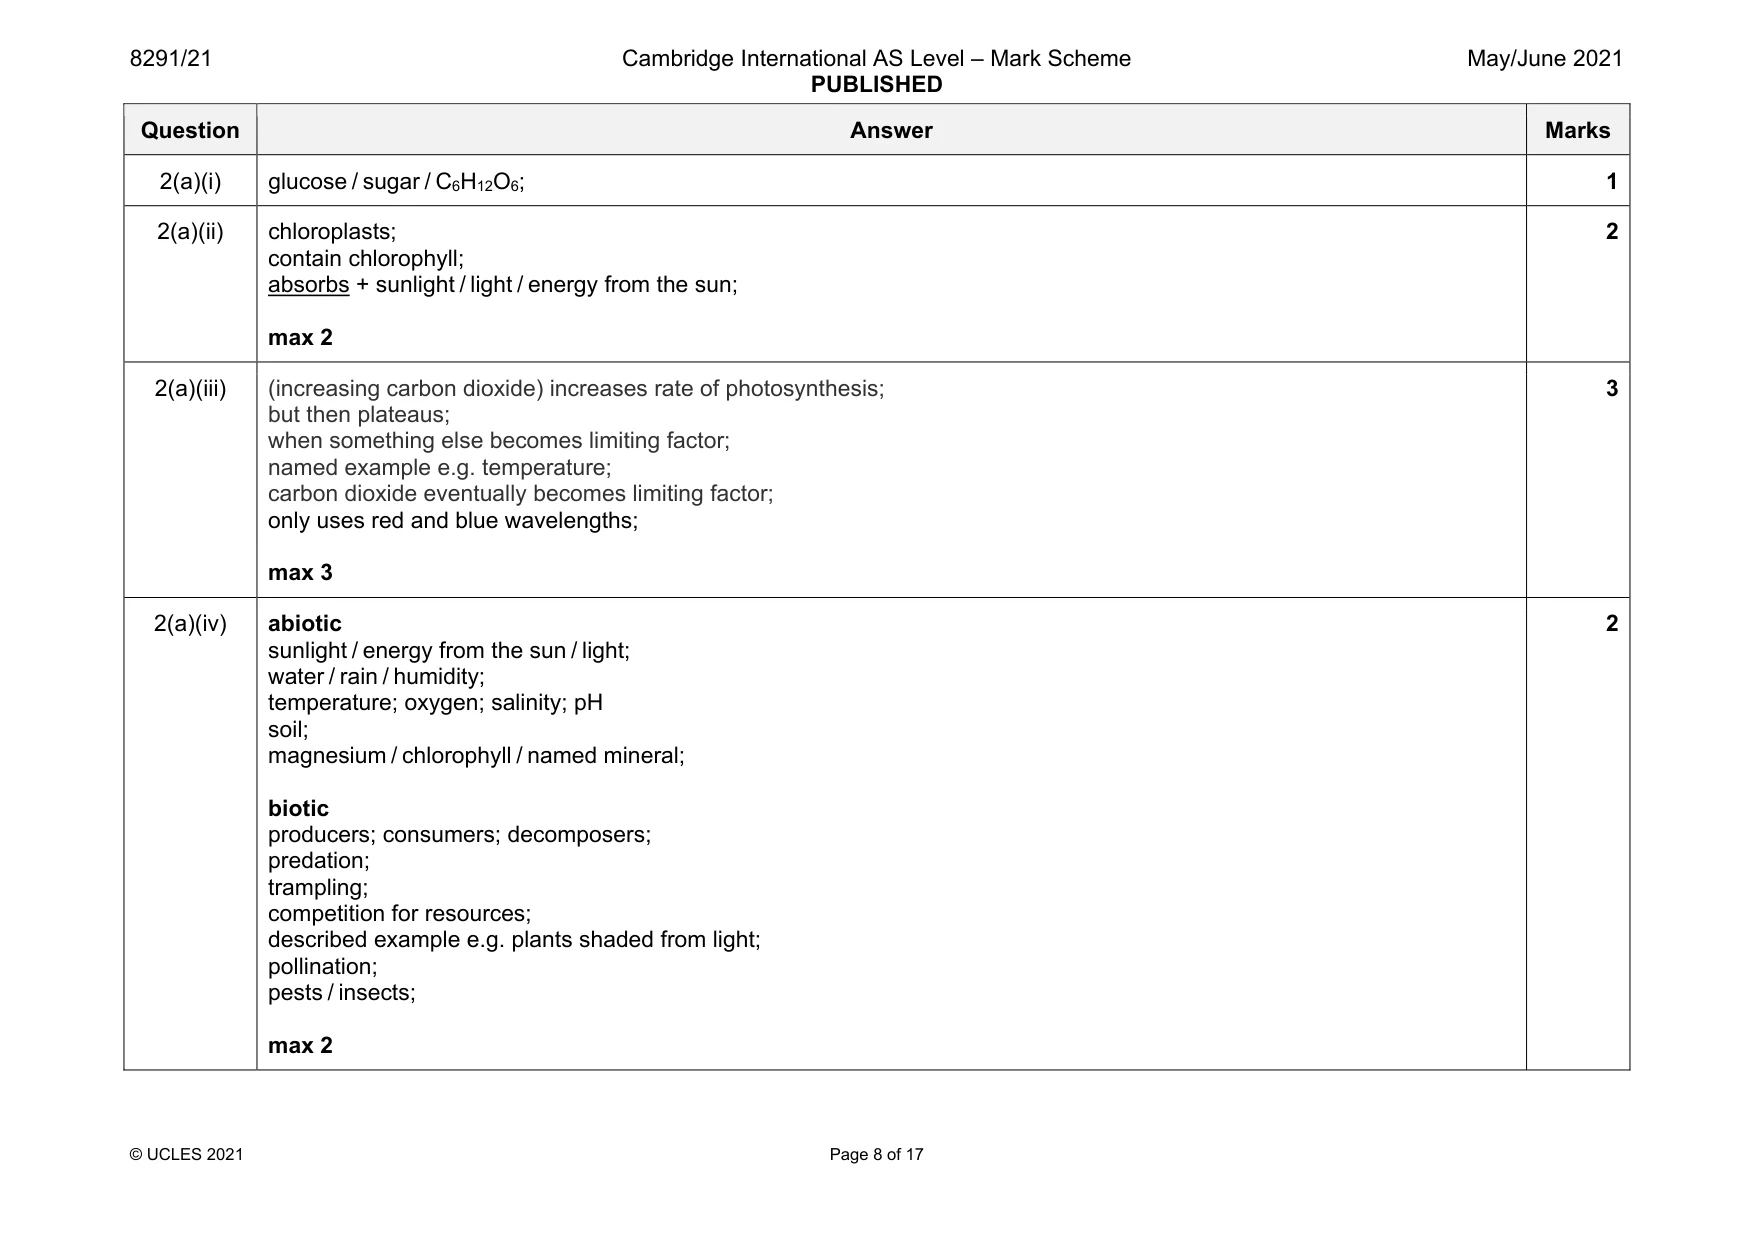
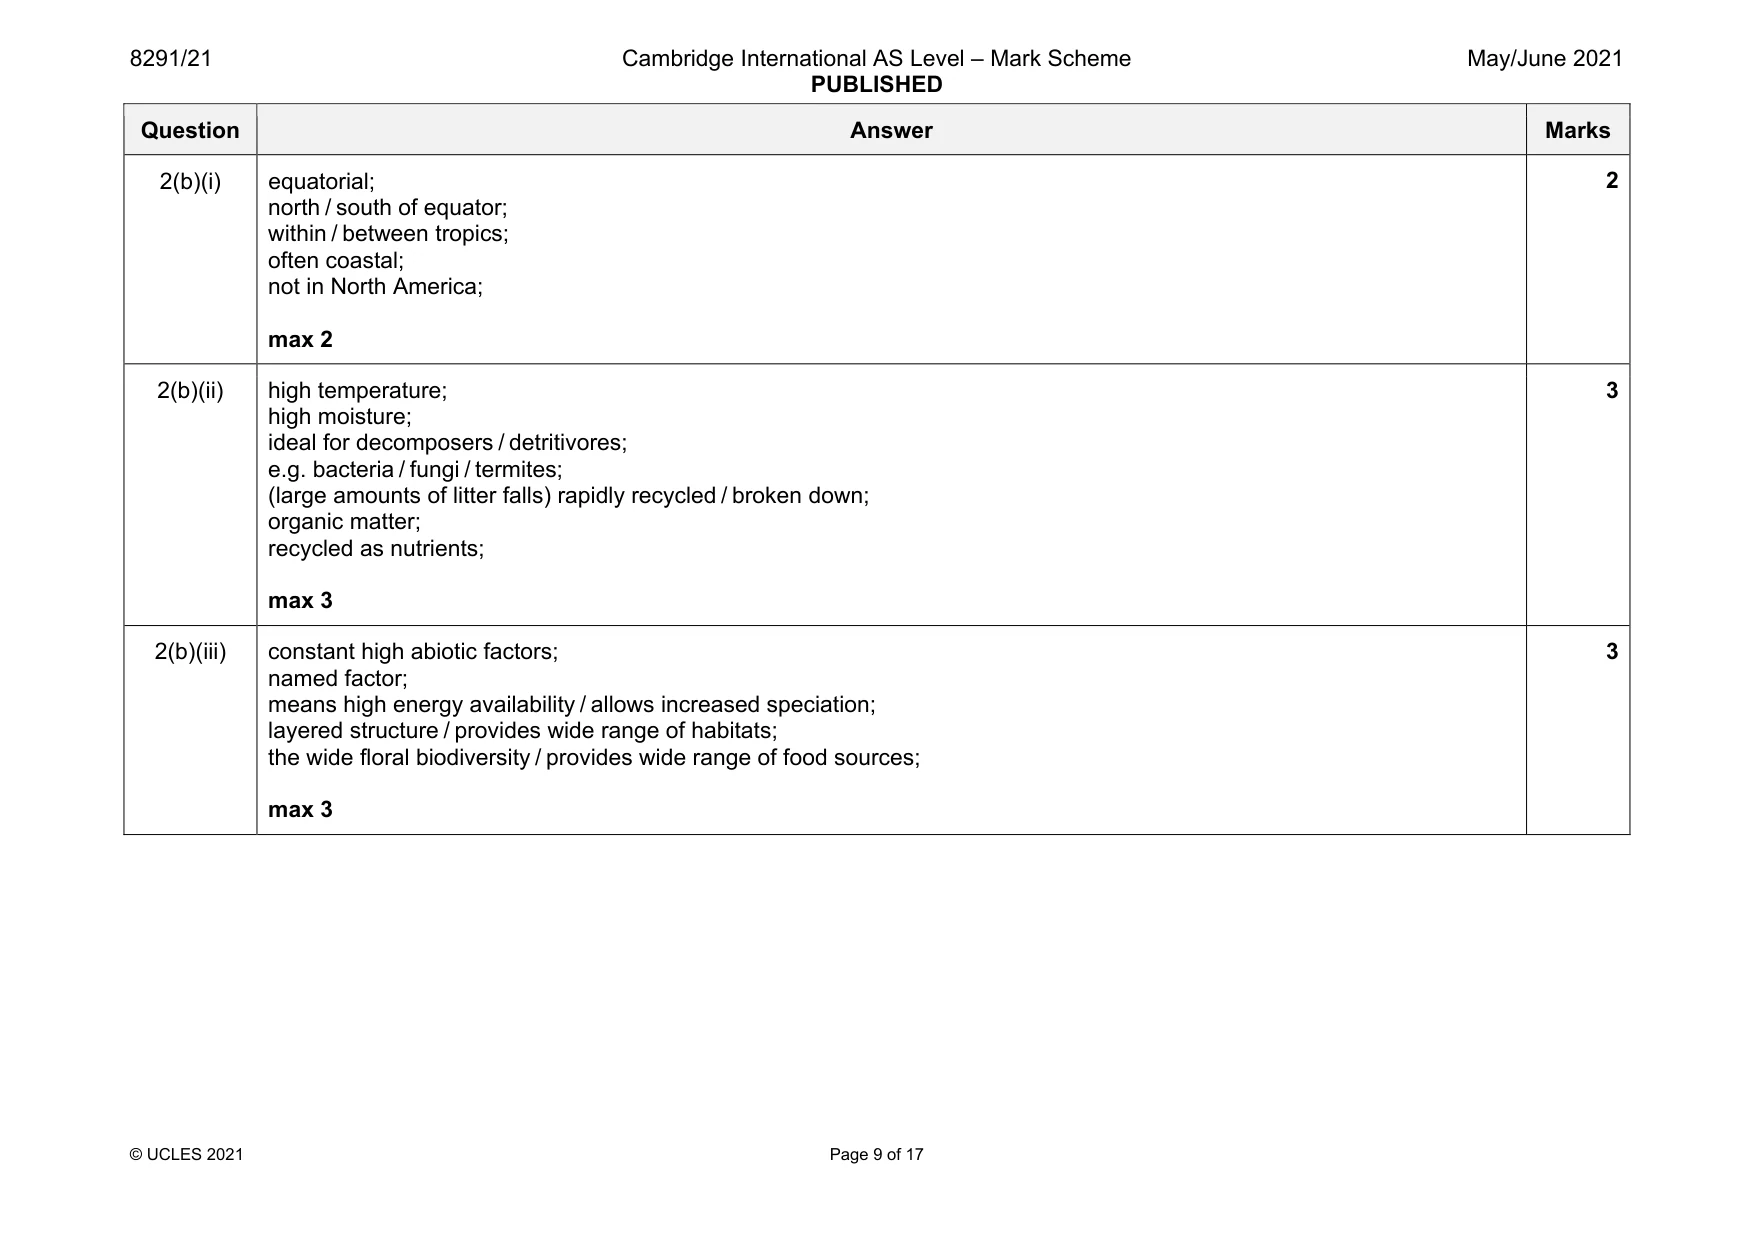
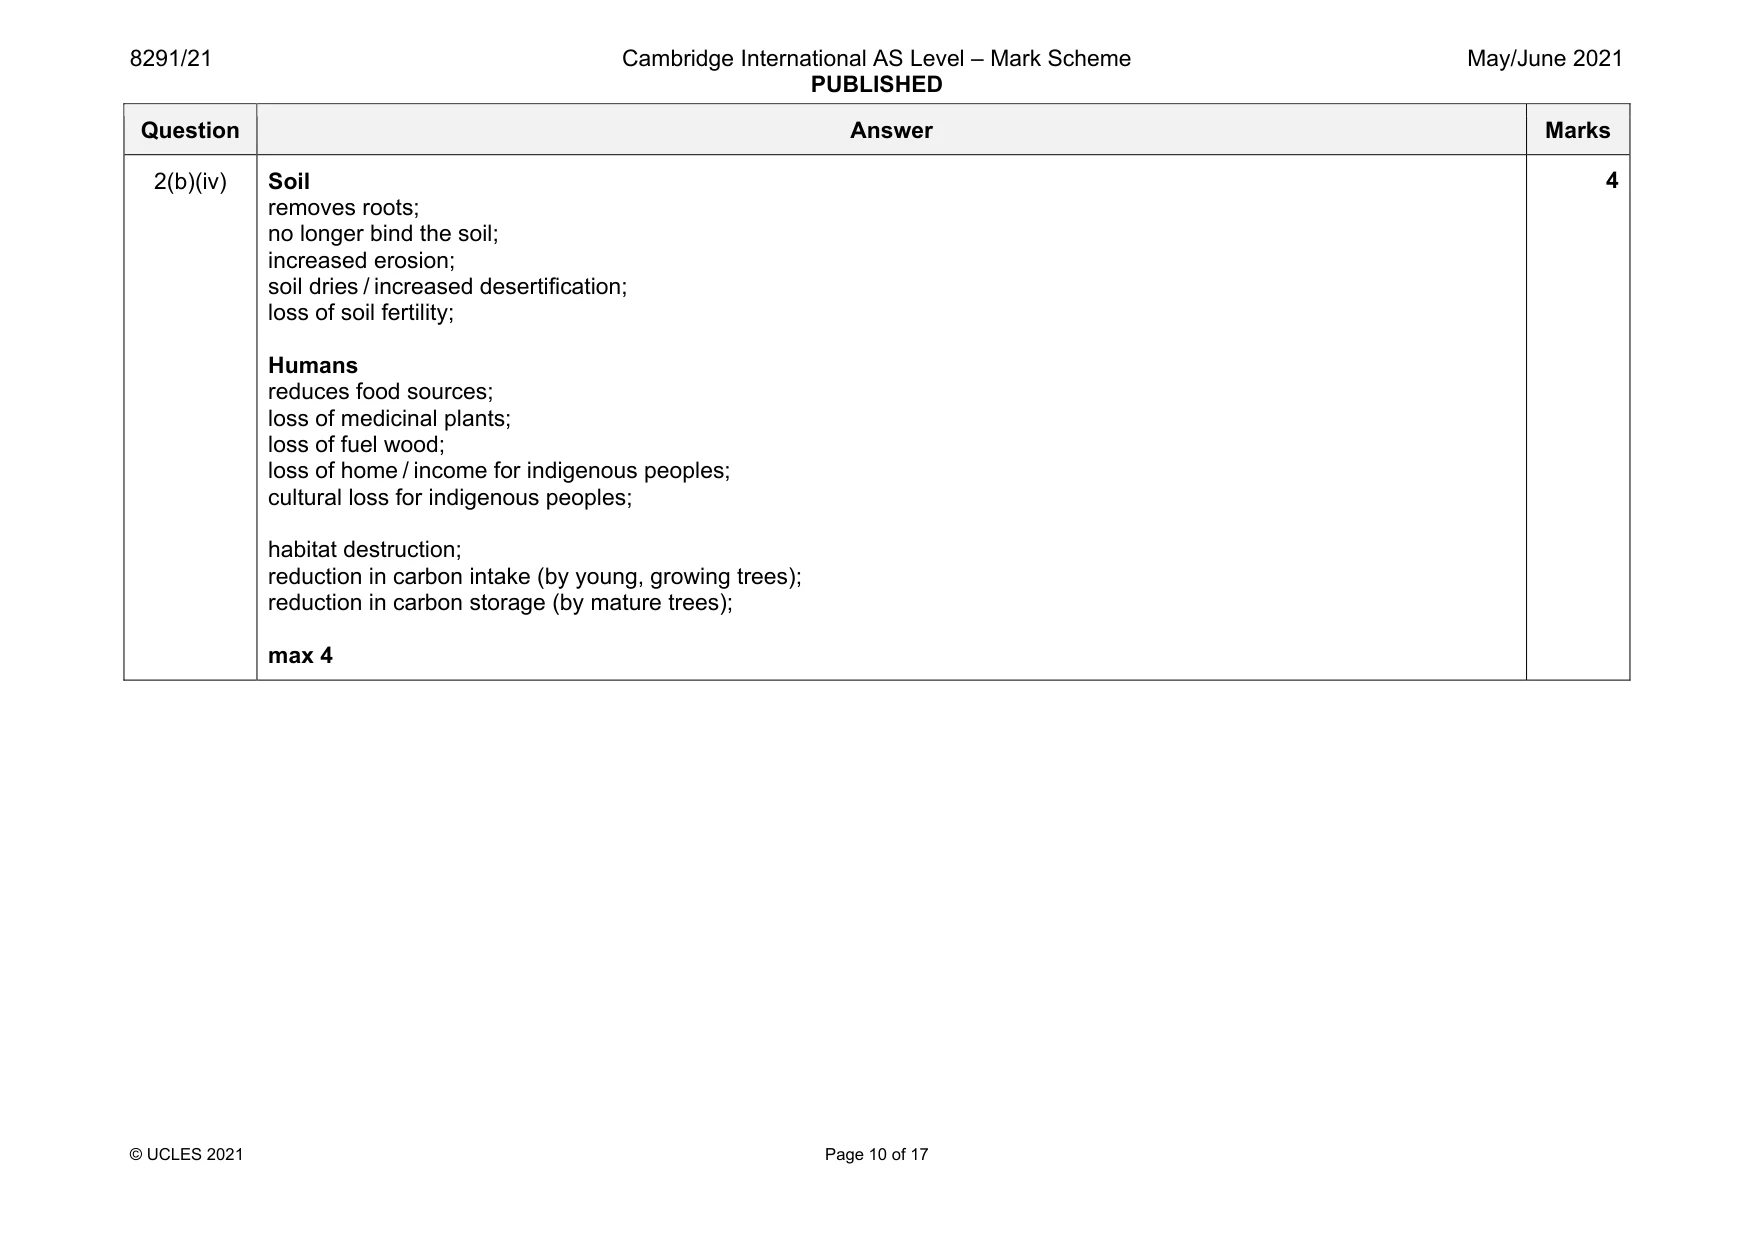
Mark scheme: 2(a)(i) glucose / sugar / C6H12O6; 1 2(a)(ii) chloroplasts; contain chlorophyll; absorbs + sunlight / light / energy from the sun; max 2 2 2(a)(iii) (increasing carbon dioxide) increases rate of photosynthesis; but then plateaus; when something else becomes limiting factor; named example e.g. temperature; carbon dioxide eventually becomes limiting factor; only uses red and blue wavelengths; max 3 3 2(a)(iv) abiotic sunlight / energy from the sun / light; water / rain / humidity; temperature; oxygen; salinity; pH soil; magnesium / chlorophyll / named mineral; biotic producers; consumers; decomposers; predation; trampling; competition for resources; described example e.g. plants shaded from light; pollination; pests / insects; max 2 2 Question Answer Marks 2(b)(i) equatorial; north / south of equator; within / between tropics; often coastal; not in North America; max 2 2 2(b)(ii) high temperature; high moisture; ideal for decomposers / detritivores; e.g. bacteria / fungi / termites; (large amounts of litter falls) rapidly recycled / broken down; organic matter; recycled as nutrients; max 3 3 2(b)(iii) constant high abiotic factors; named factor; means high energy availability / allows increased speciation; layered structure / provides wide range of habitats; the wide floral biodiversity / provides wide range of food sources; max 3 3 Question Answer Marks 2(b)(iv) Soil removes roots; no longer bind the soil; increased erosion; soil dries / increased desertification; loss of soil fertility; Humans reduces food sources; loss of medicinal plants; loss of fuel wood; loss of home / income for indigenous peoples; cultural loss for indigenous peoples; habitat destruction; reduction in carbon intake (by young, growing trees); reduction in carbon storage (by mature trees); max 4 4
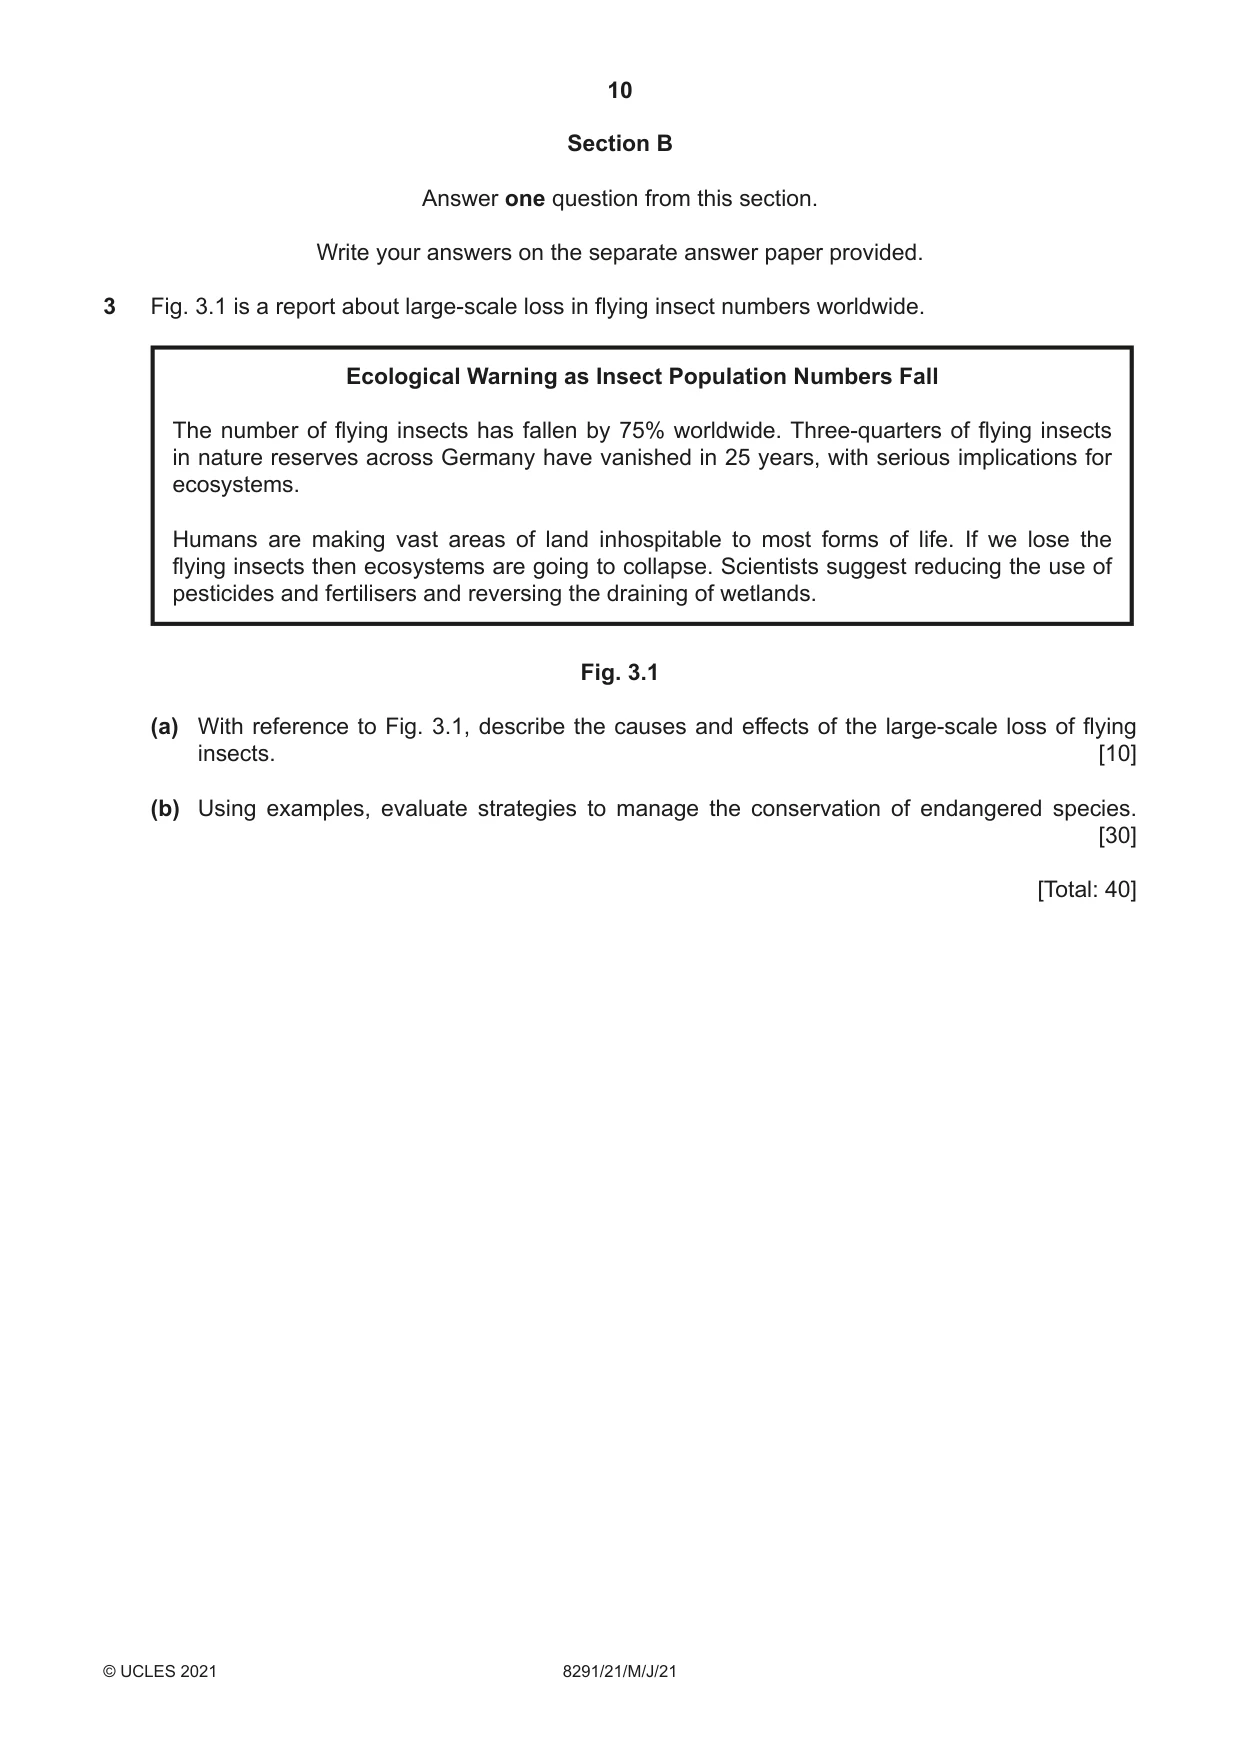
Q3 · A report about large-scale loss in flying insect numbers worldwide
3 Fig. 3.1 is a report about large-scale loss in flying insect numbers worldwide. Ecological Warning as Insect Population Numbers Fall The number of flying insects has fallen by 75% worldwide. Three-quarters of flying insects in nature reserves across Germany have vanished in 25 years, with serious implications for ecosystems. Humans are making vast areas of land inhospitable to most forms of life. If we lose the flying insects then ecosystems are going to collapse. Scientists suggest reducing the use of pesticides and fertilisers and reversing the draining of wetlands. Fig. 3.1 (a) With reference to Fig. 3.1, describe the causes and effects of the large-scale loss of flying insects. [10] (b) Using examples, evaluate strategies to manage the conservation of endangered species. [30] [Total: 40]
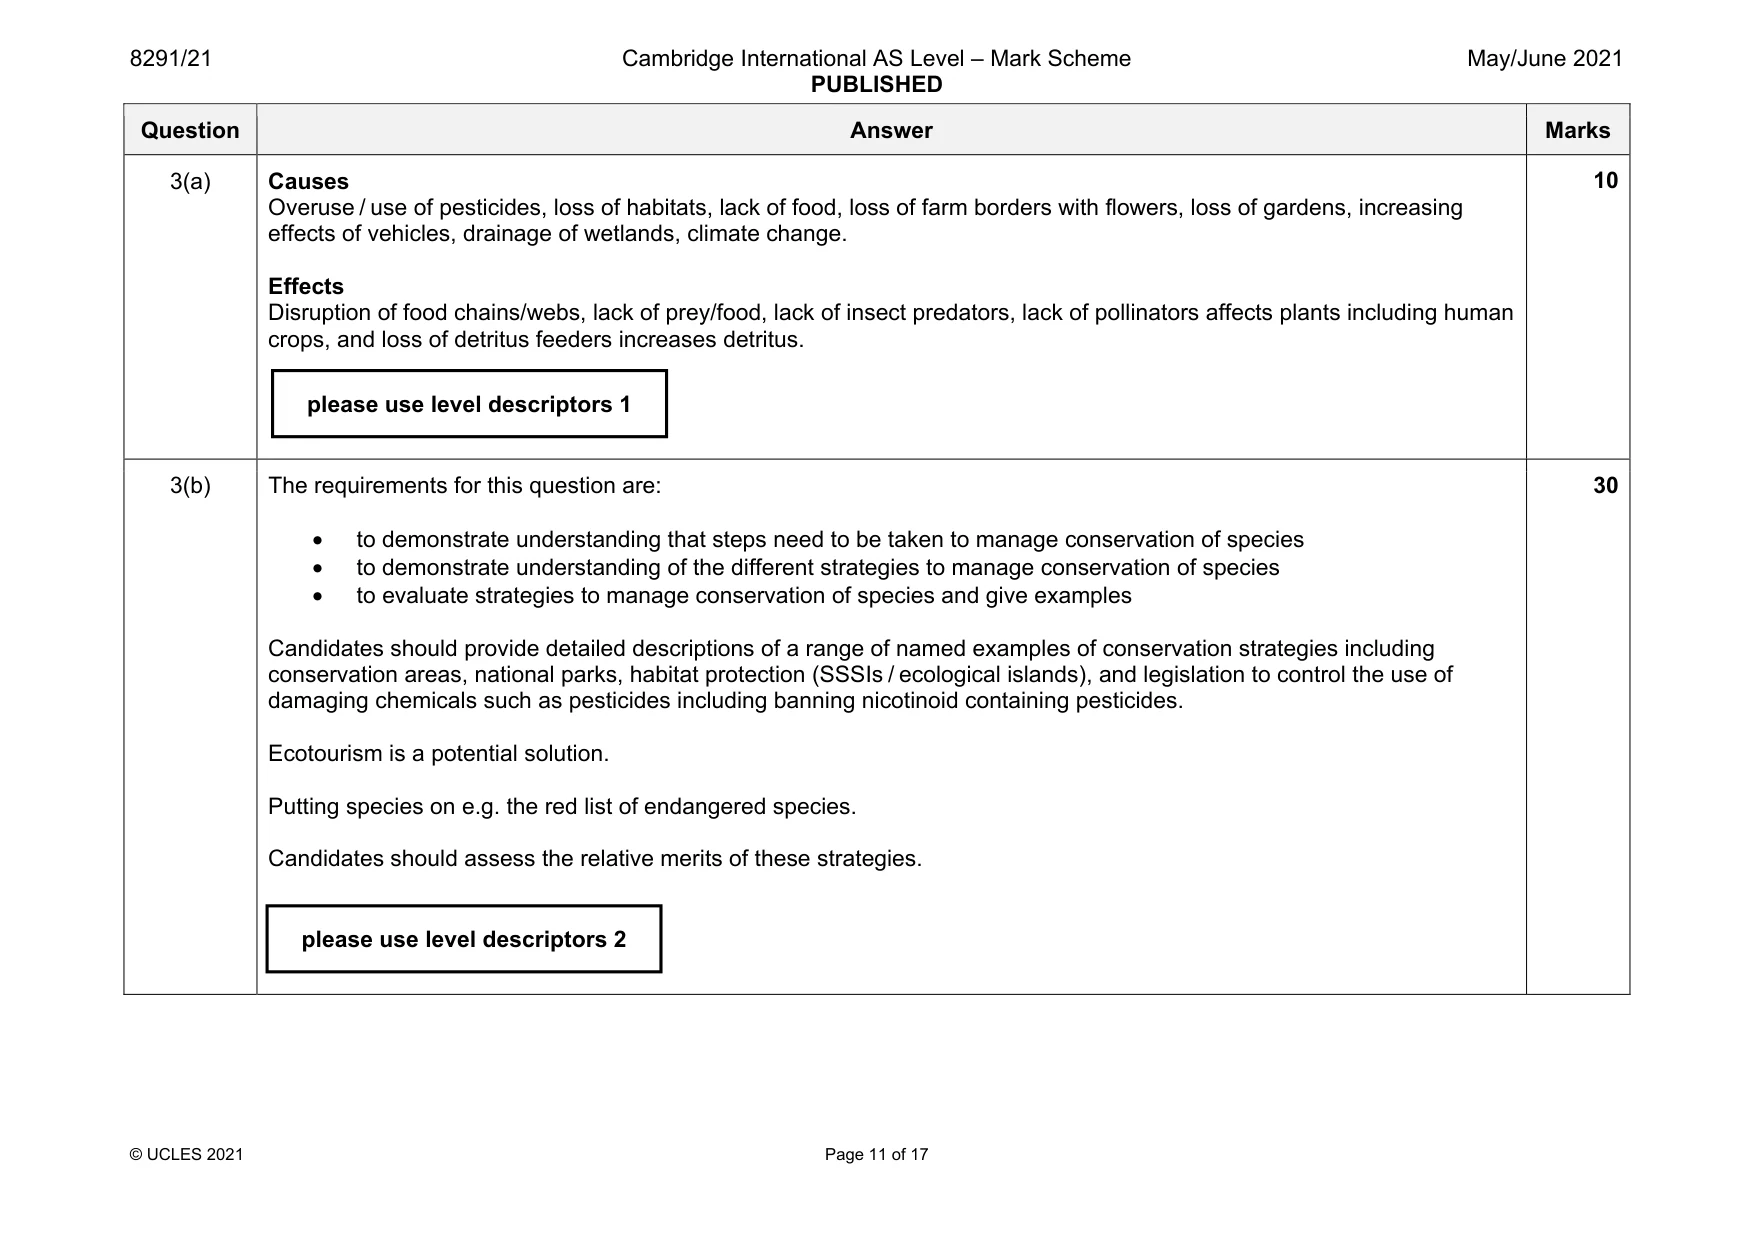
Mark scheme: 3(a) Causes Overuse / use of pesticides, loss of habitats, lack of food, loss of farm borders with flowers, loss of gardens, increasing effects of vehicles, drainage of wetlands, climate change. Effects Disruption of food chains/webs, lack of prey/food, lack of insect predators, lack of pollinators affects plants including human crops, and loss of detritus feeders increases detritus. 3(b) The requirements for this question are: • to demonstrate understanding that steps need to be taken to manage conservation of species • to demonstrate understanding of the different strategies to manage conservation of species • to evaluate strategies to manage conservation of species and give examples Candidates should provide detailed descriptions of a range of named examples of conservation strategies including conservation areas, national parks, habitat protection (SSSIs / ecological islands), and legislation to control the use of damaging chemicals such as pesticides including banning nicotinoid containing pesticides. Ecotourism is a potential solution. Putting species on e.g. the red list of endangered species. Candidates should assess the relative merits of these strategies. 30 please use level descriptors 1 please use level descriptors 2
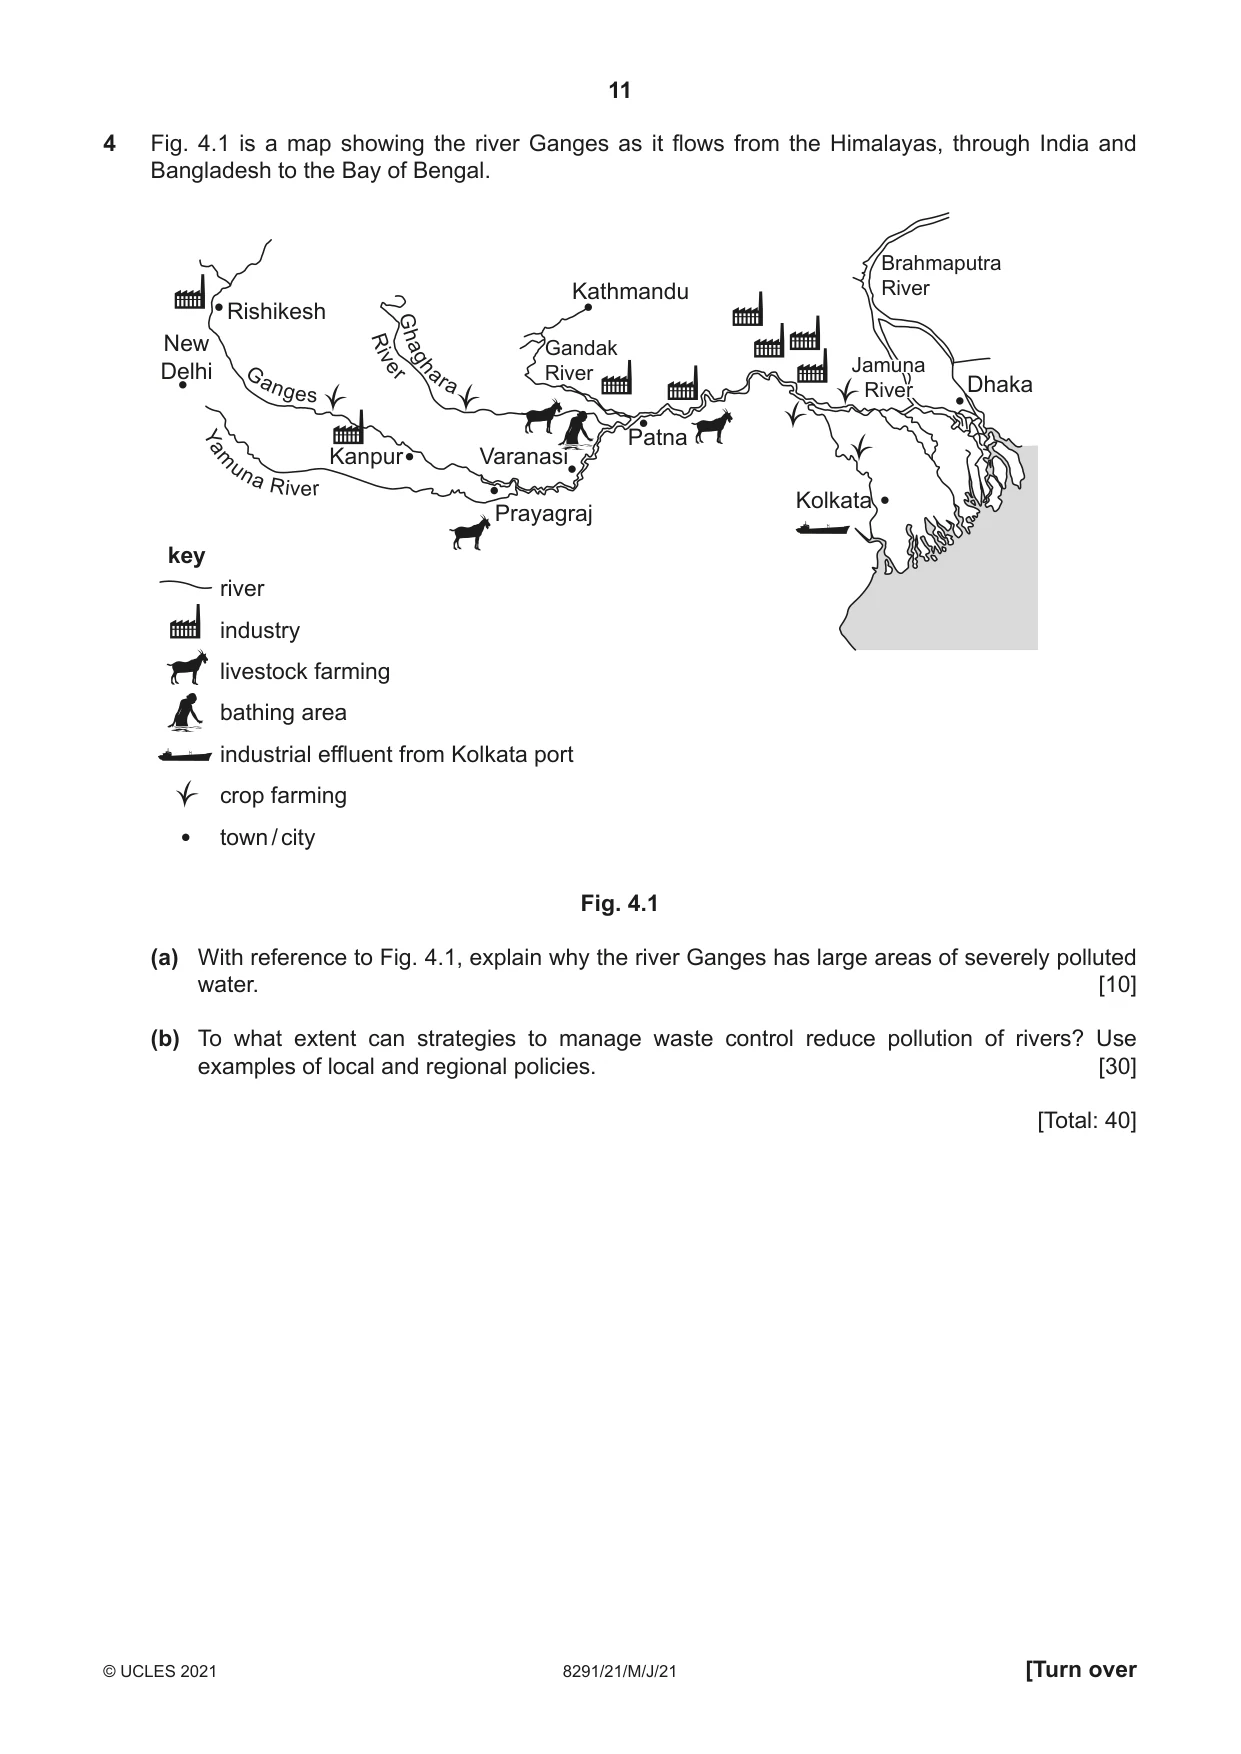
Q4 · A map showing the river Ganges as it flows from the Himalayas, through India and…
4 Fig. 4.1 is a map showing the river Ganges as it flows from the Himalayas, through India and Bangladesh to the Bay of Bengal. Brahmaputra Kathmandu River Rishikesh G New Riha Gandak v g Jamuna h e r River Delhi G ar a River Dhaka anges Y Patna a m Kanpur Varanasi unaRiver Kolkata Prayagraj key river industry livestock farming bathing area industrial effluent from Kolkata port crop farming town / city Fig. 4.1 (a) With reference to Fig. 4.1, explain why the river Ganges has large areas of severely polluted water. [10] (b) To what extent can strategies to manage waste control reduce pollution of rivers? Use examples of local and regional policies. [30] [Total: 40]
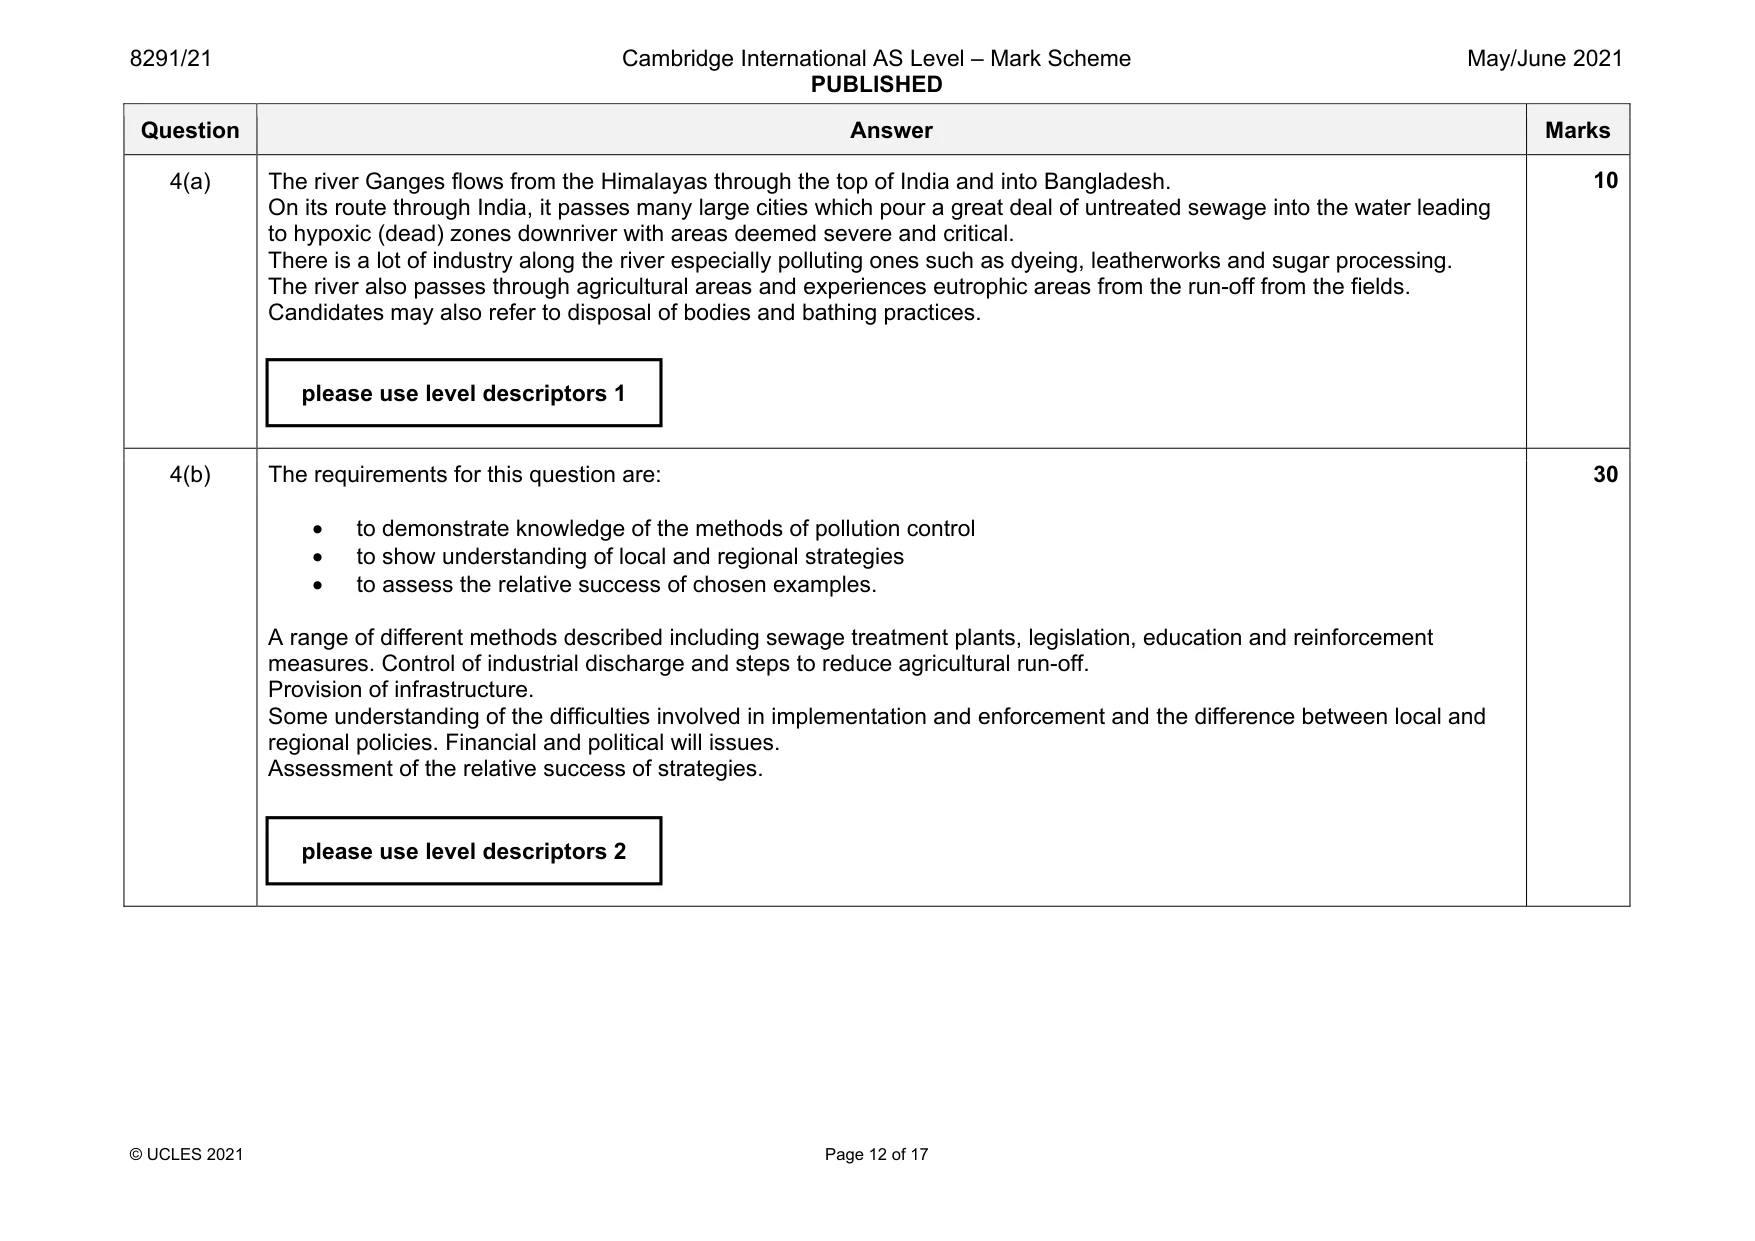
Mark scheme: 4(a) The river Ganges flows from the Himalayas through the top of India and into Bangladesh. On its route through India, it passes many large cities which pour a great deal of untreated sewage into the water leading to hypoxic (dead) zones downriver with areas deemed severe and critical. There is a lot of industry along the river especially polluting ones such as dyeing, leatherworks and sugar processing. The river also passes through agricultural areas and experiences eutrophic areas from the run-off from the fields. Candidates may also refer to disposal of bodies and bathing practices. 4(b) The requirements for this question are: • to demonstrate knowledge of the methods of pollution control • to show understanding of local and regional strategies • to assess the relative success of chosen examples. A range of different methods described including sewage treatment plants, legislation, education and reinforcement measures. Control of industrial discharge and steps to reduce agricultural run-off. Provision of infrastructure. Some understanding of the difficulties involved in implementation and enforcement and the difference between local and regional policies. Financial and political will issues. Assessment of the relative success of strategies. 30 please use level descriptors 1 please use level descriptors 2
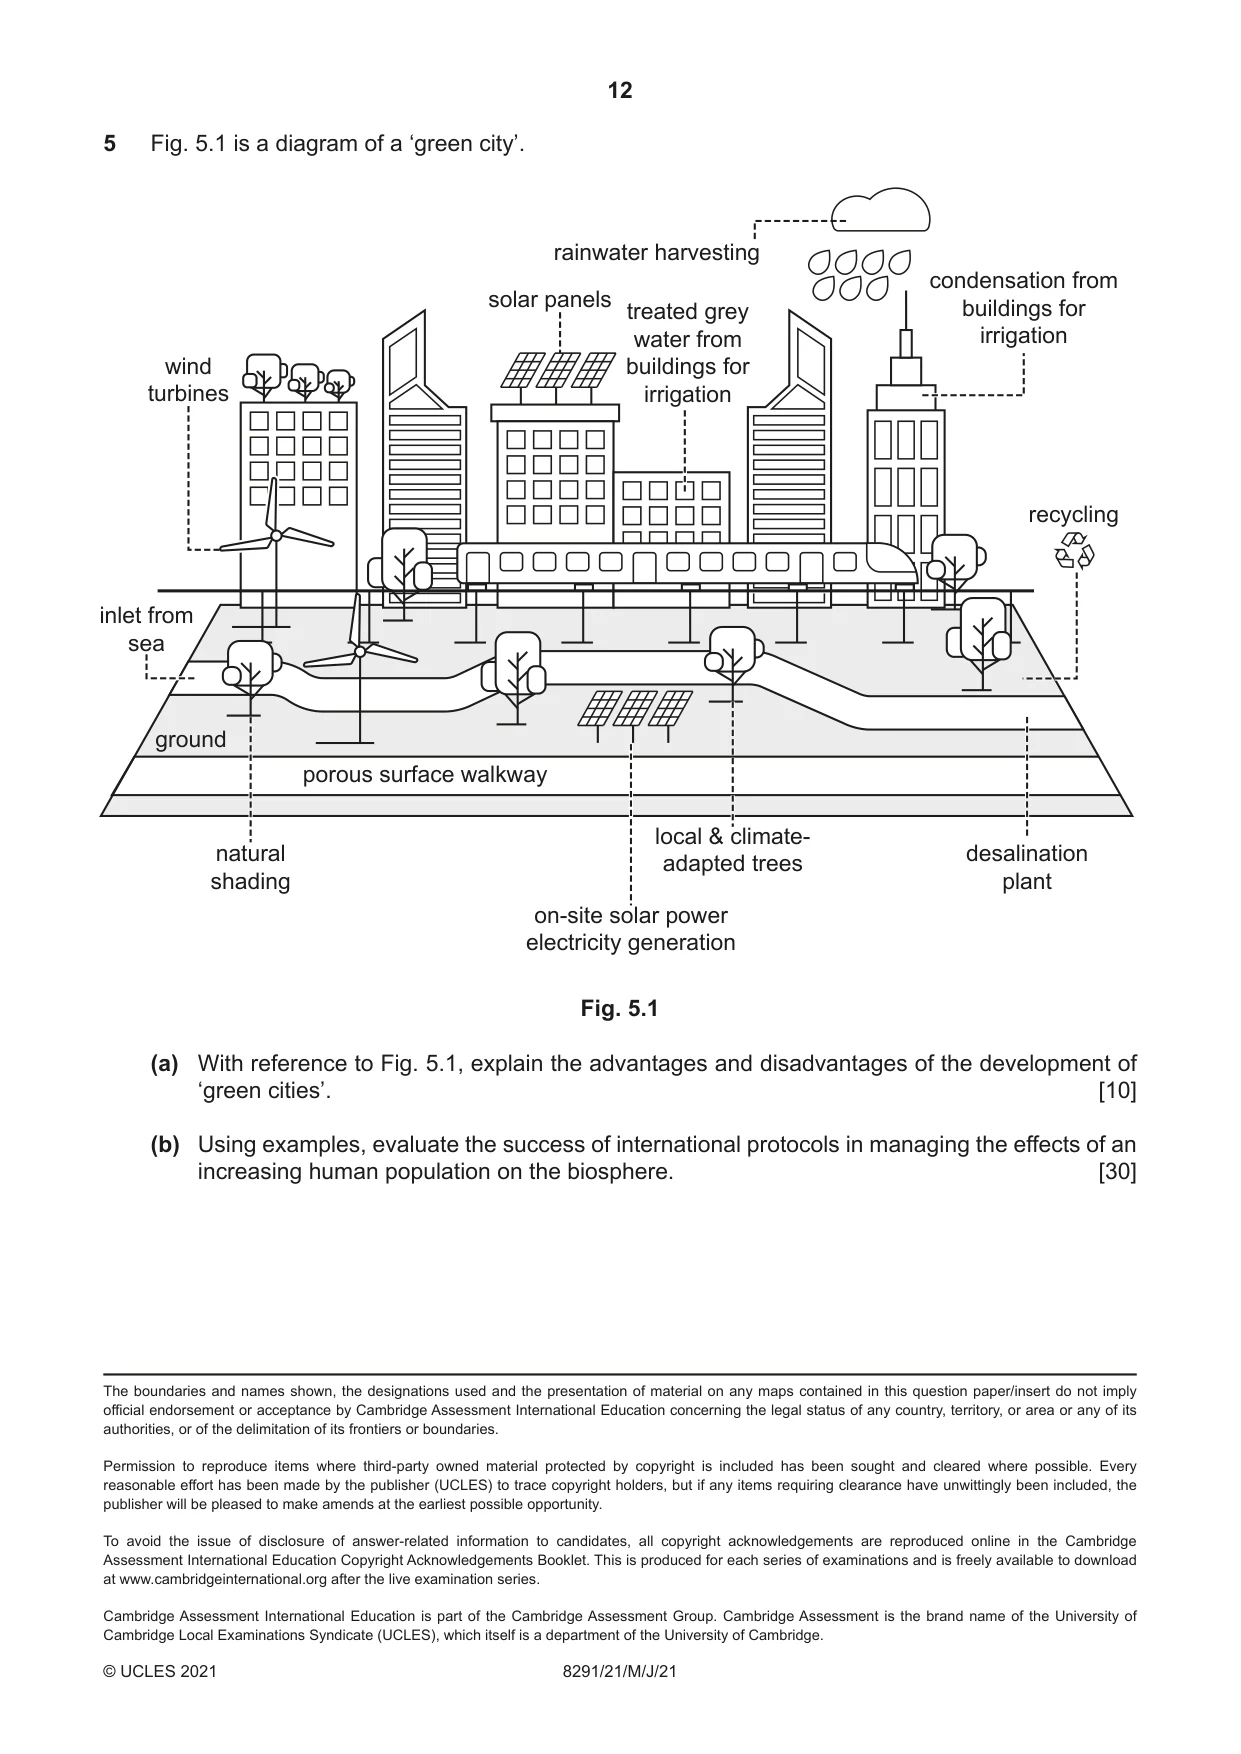
Q5 · A diagram of a ‘green city’
5 Fig. 5.1 is a diagram of a ‘green city’. rainwater harvesting condensation from solar panels treated grey buildings for water from irrigation wind buildings for turbines irrigation recycling inlet from sea ground porous surface walkway local & climate- natural desalination adapted trees shading plant on-site solar power electricity generation Fig. 5.1 (a) With reference to Fig. 5.1, explain the advantages and disadvantages of the development of ‘green cities’. [10] (b) Using examples, evaluate the success of international protocols in managing the effects of an increasing human population on the biosphere. [30] The boundaries and names shown, the designations used and the presentation of material on any maps contained in this question paper/insert do not imply official endorsement or acceptance by Cambridge Assessment International Education concerning the legal status of any country, territory, or area or any of its authorities, or of the delimitation of its frontiers or boundaries.
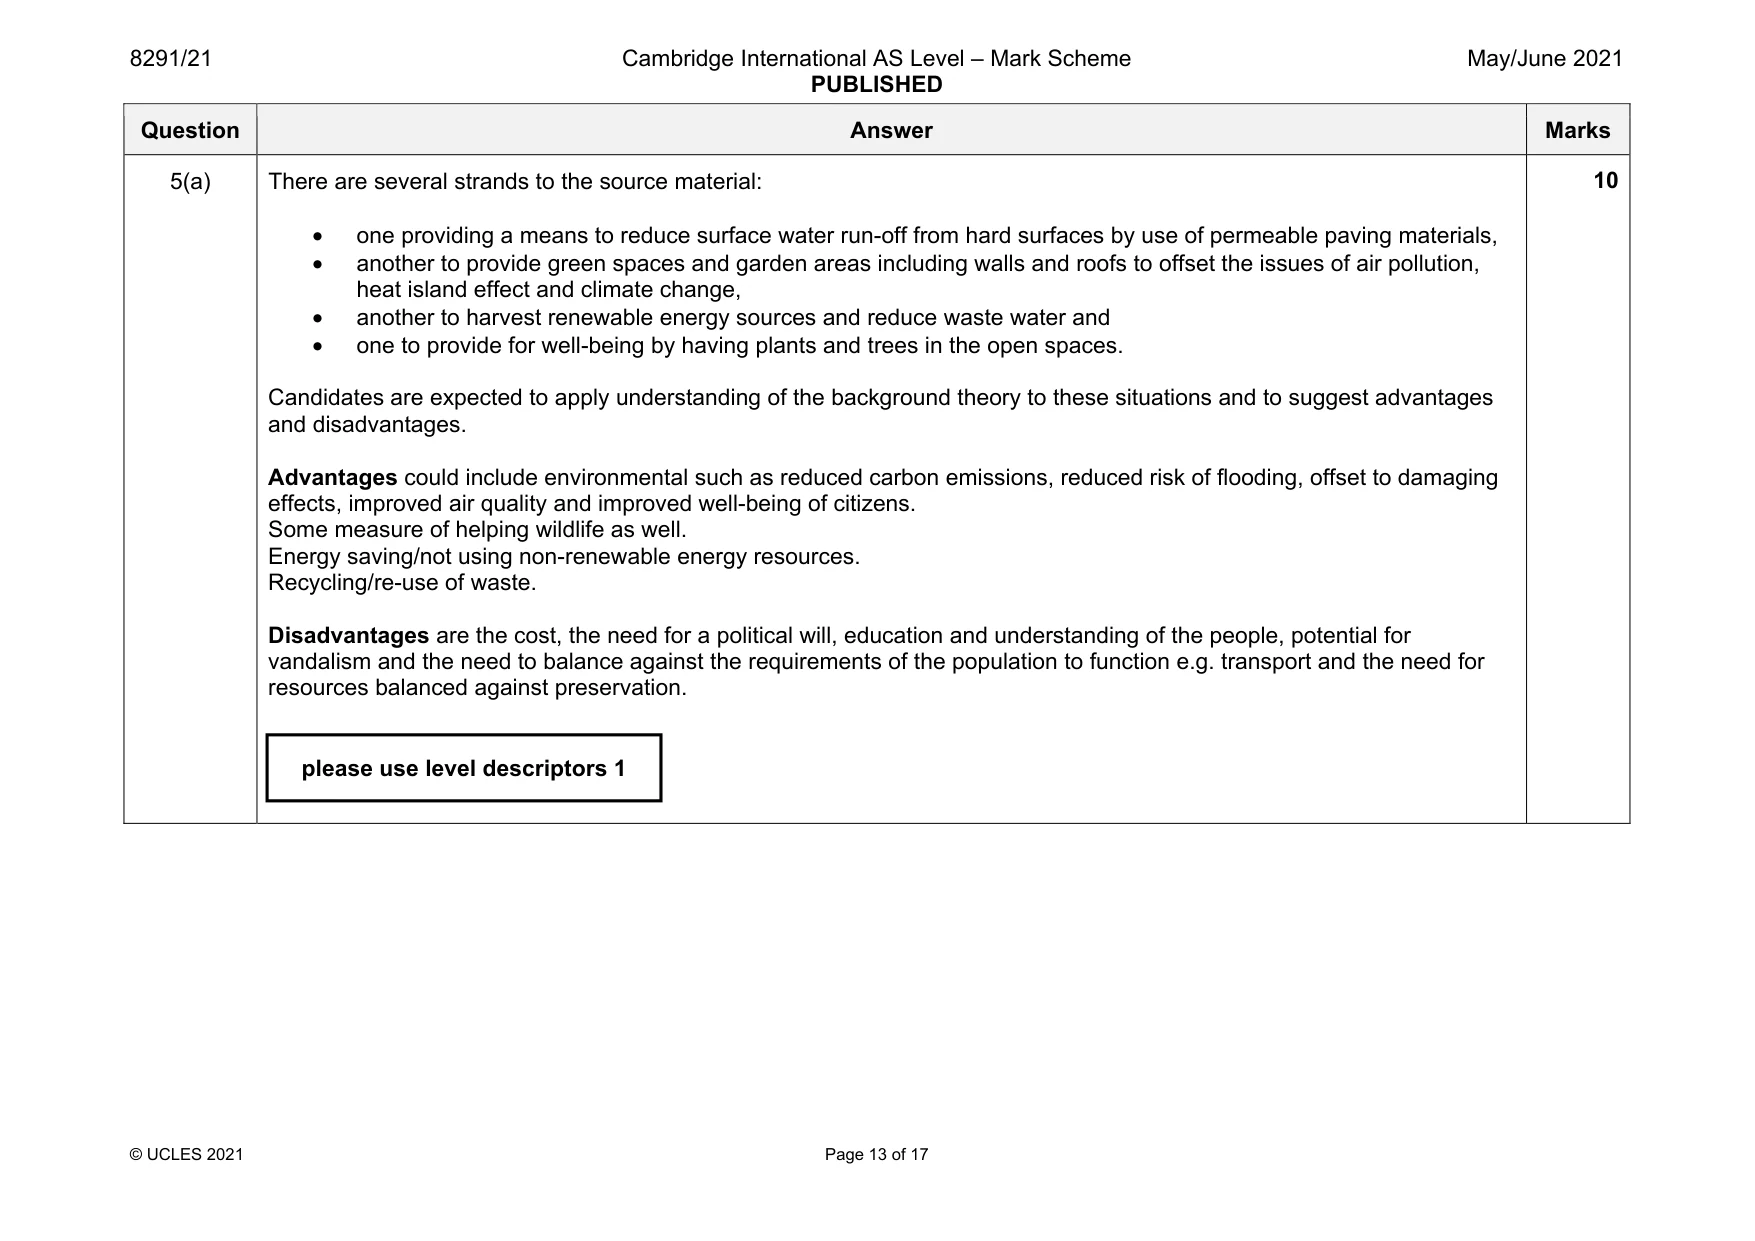
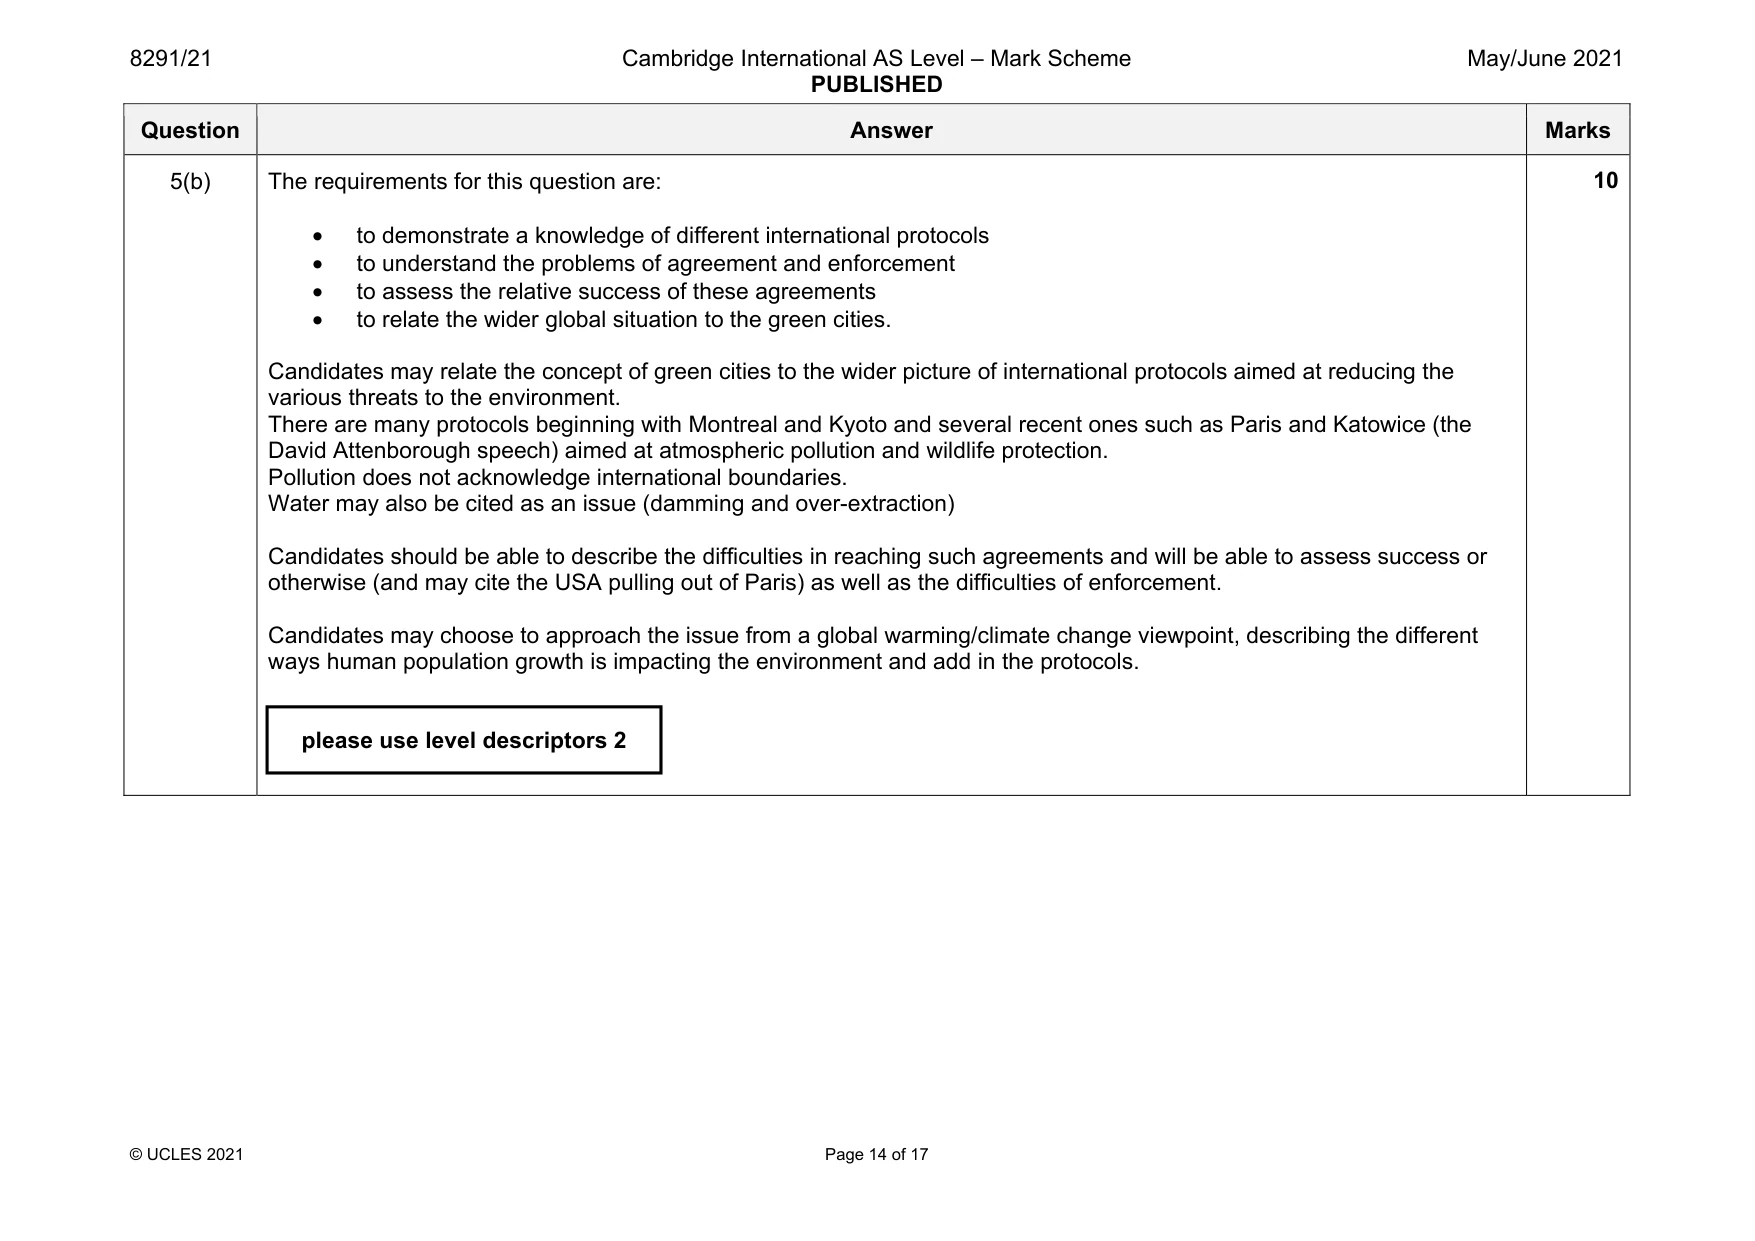
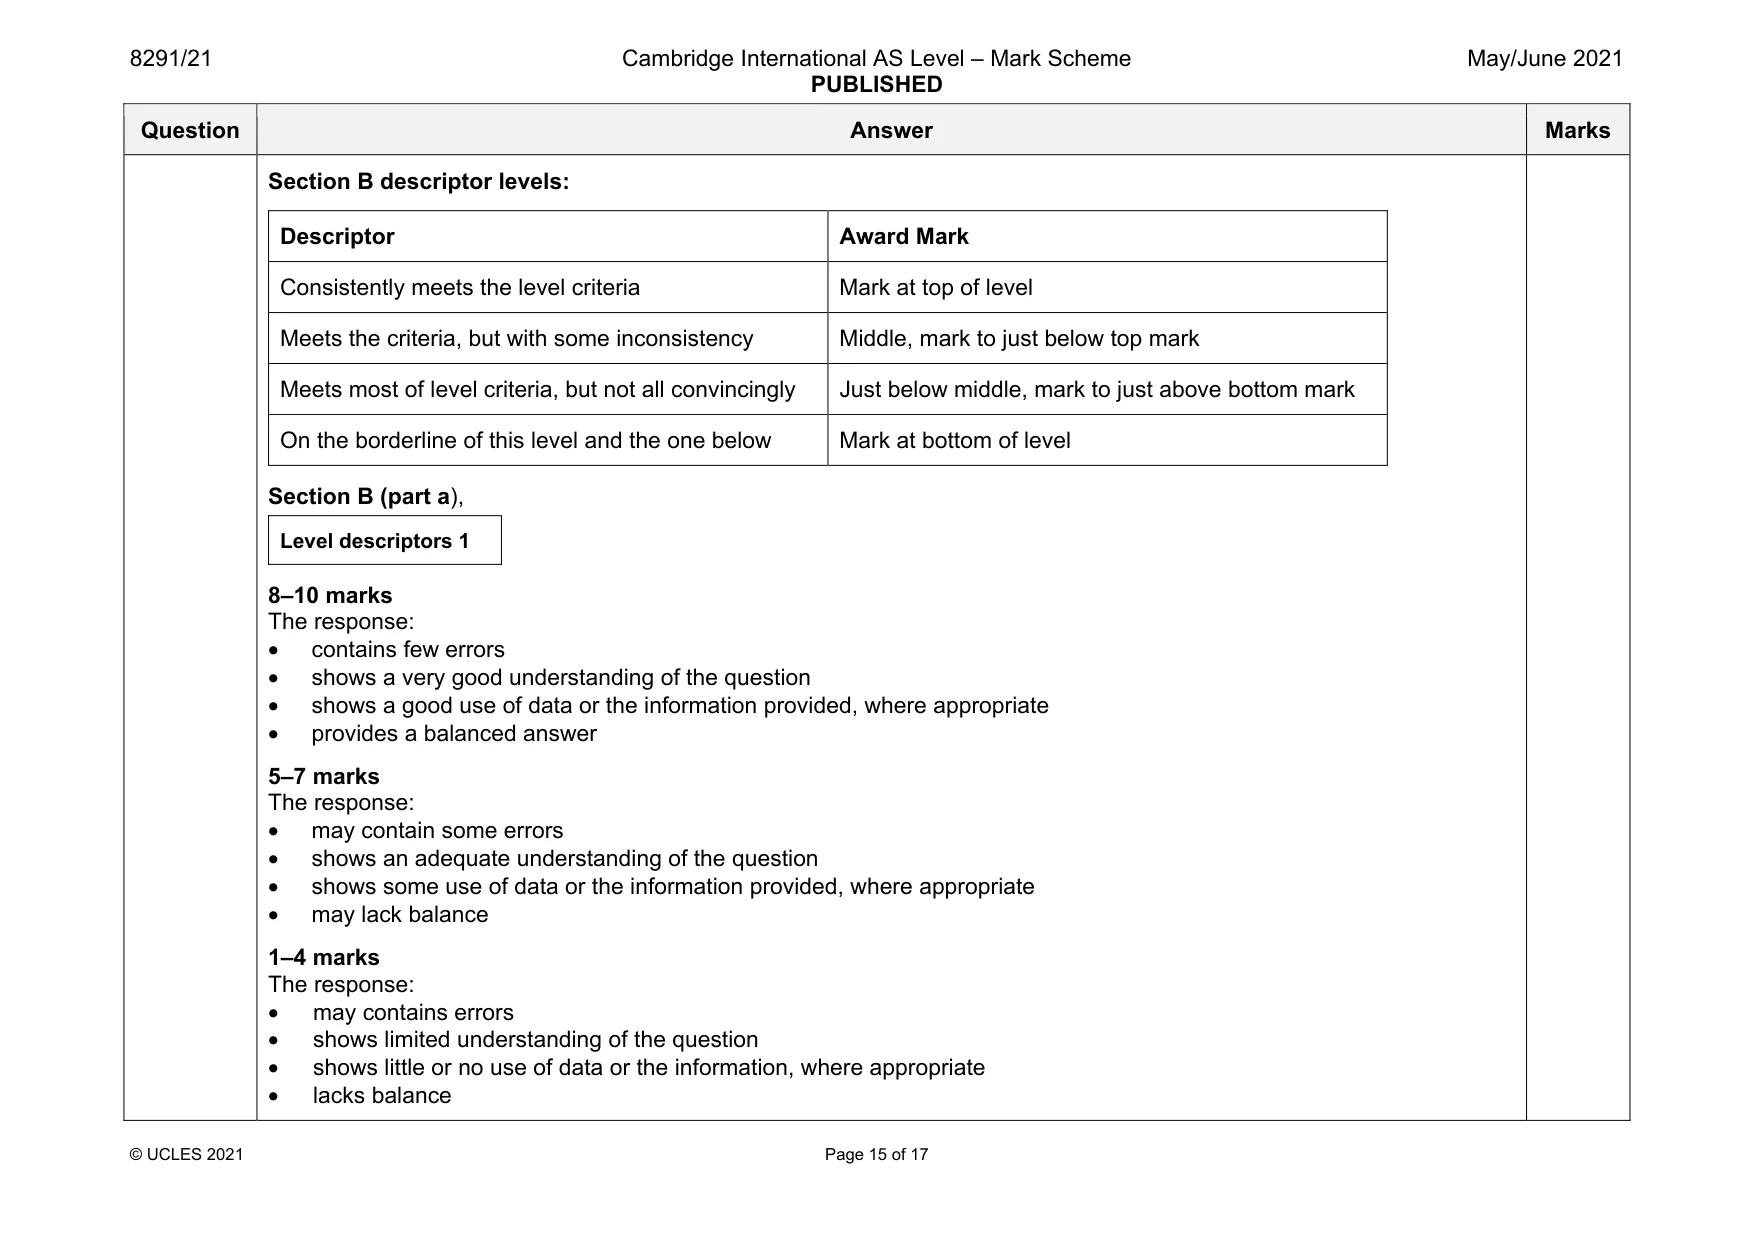
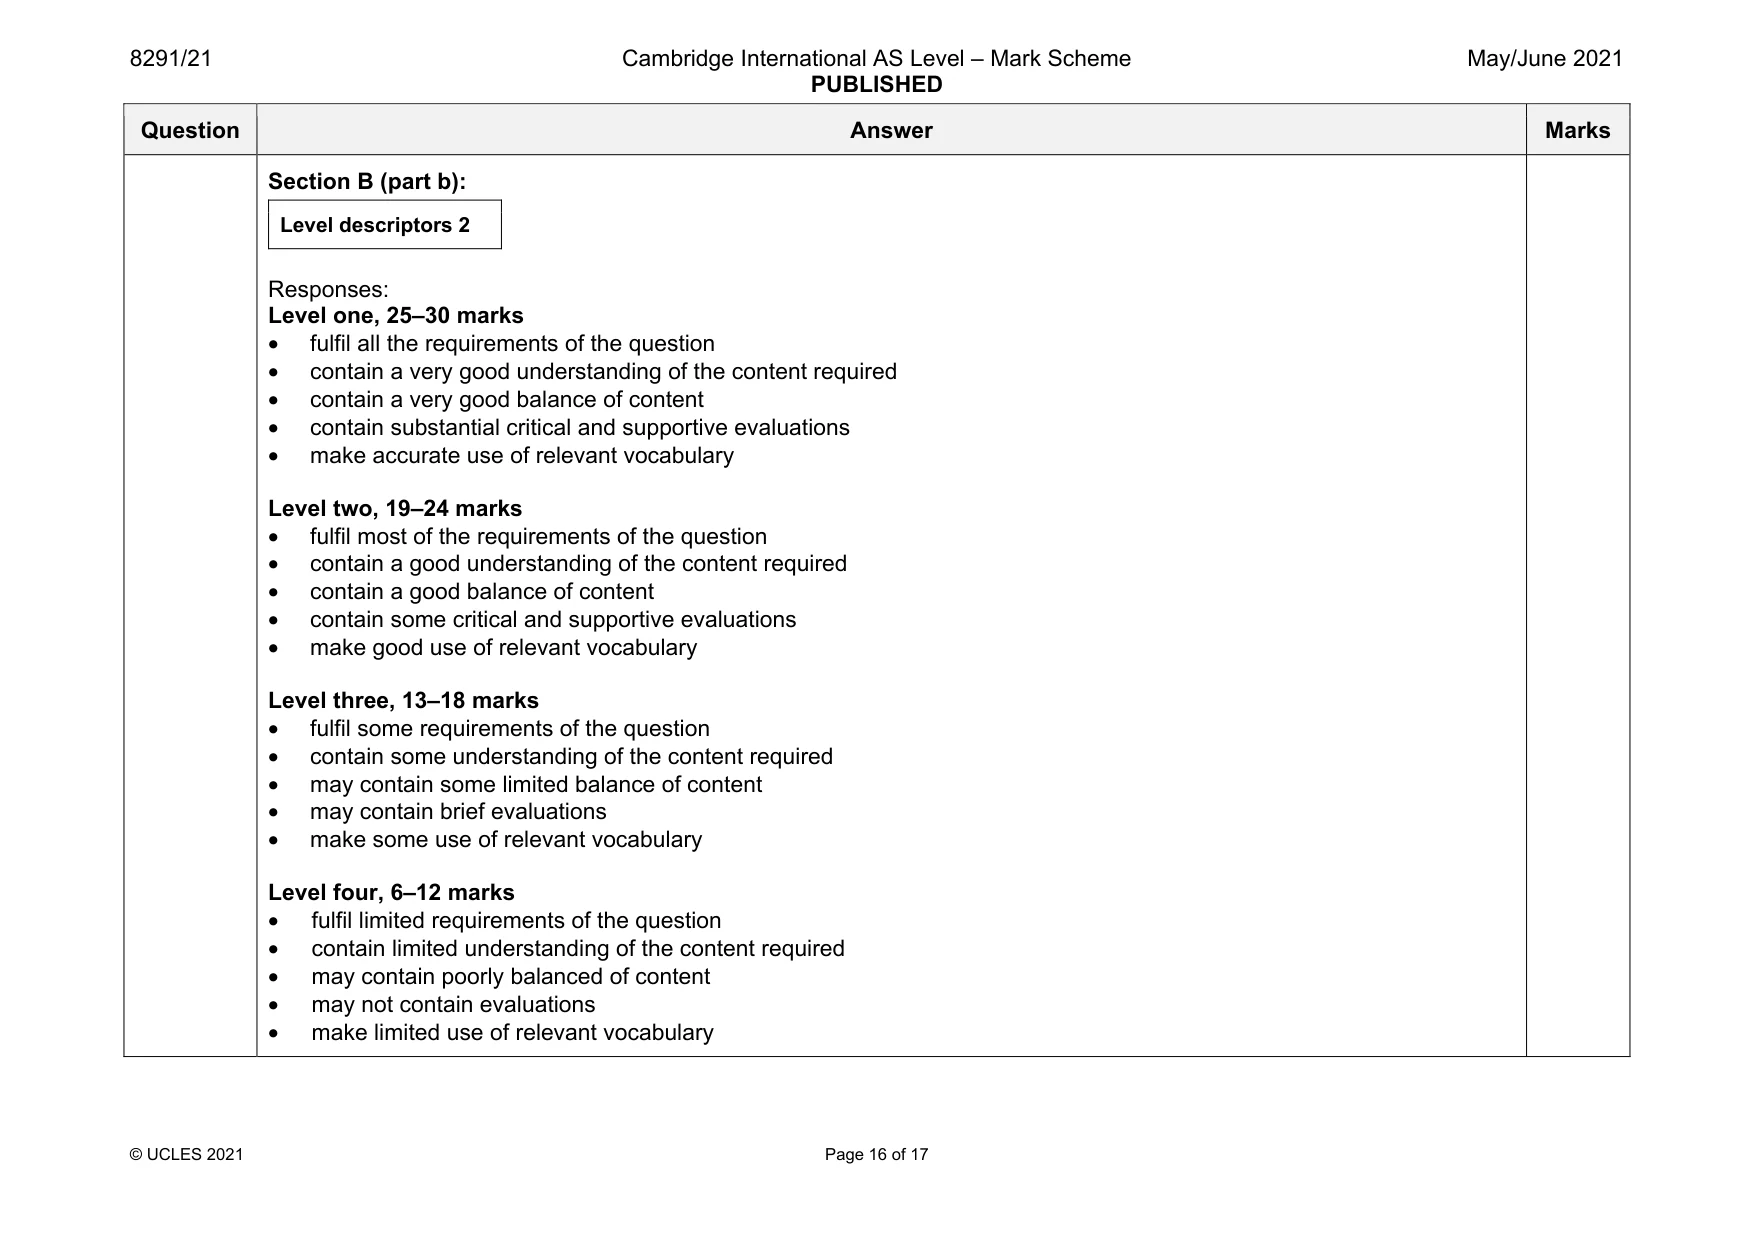
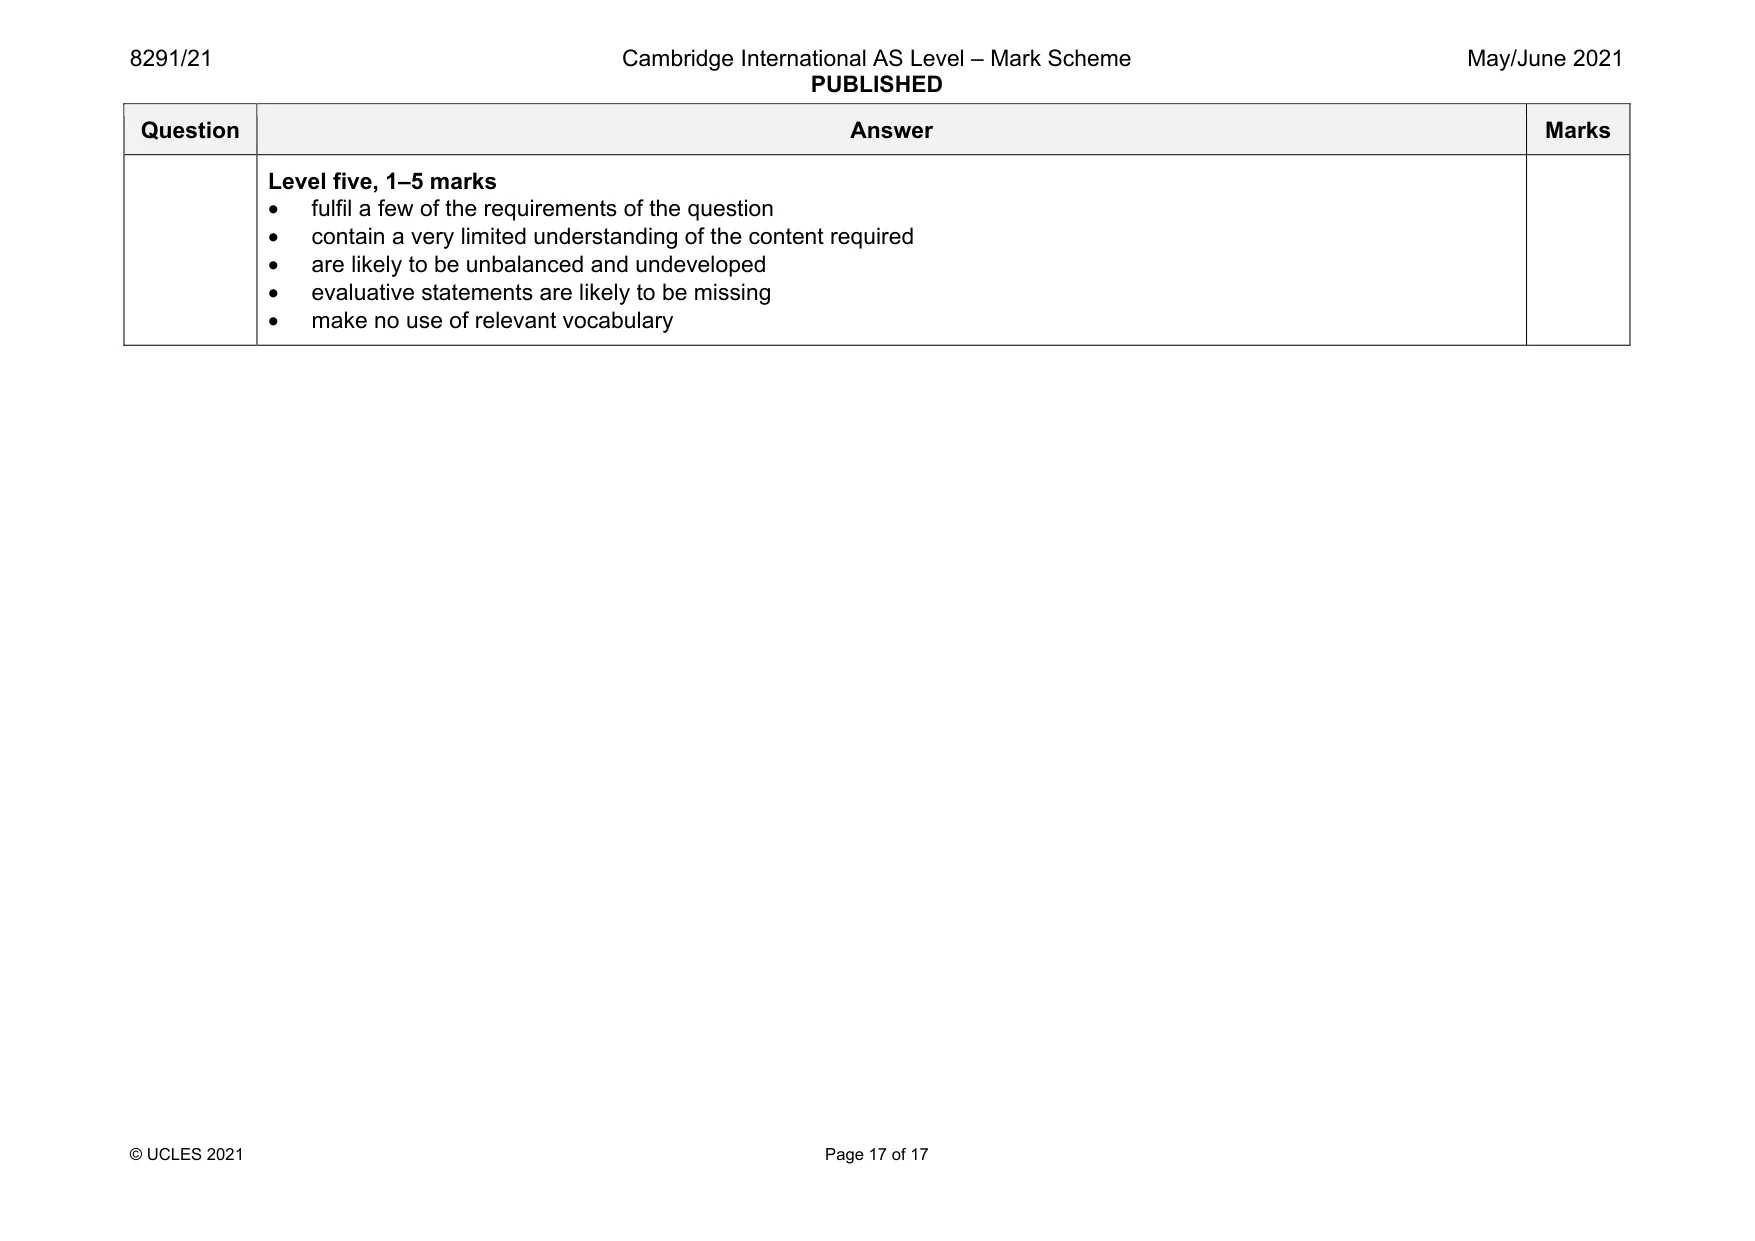
Mark scheme: 5(a) There are several strands to the source material: • one providing a means to reduce surface water run-off from hard surfaces by use of permeable paving materials, • another to provide green spaces and garden areas including walls and roofs to offset the issues of air pollution, heat island effect and climate change, • another to harvest renewable energy sources and reduce waste water and • one to provide for well-being by having plants and trees in the open spaces. Candidates are expected to apply understanding of the background theory to these situations and to suggest advantages and disadvantages. Advantages could include environmental such as reduced carbon emissions, reduced risk of flooding, offset to damaging effects, improved air quality and improved well-being of citizens. Some measure of helping wildlife as well. Energy saving/not using non-renewable energy resources. Recycling/re-use of waste. Disadvantages are the cost, the need for a political will, education and understanding of the people, potential for vandalism and the need to balance against the requirements of the population to function e.g. transport and the need for resources balanced against preservation. please use level descriptors 1 Question Answer Marks 5(b) The requirements for this question are: • to demonstrate a knowledge of different international protocols • to understand the problems of agreement and enforcement • to assess the relative success of these agreements • to relate the wider global situation to the green cities. Candidates may relate the concept of green cities to the wider picture of international protocols aimed at reducing the various threats to the environment. There are many protocols beginning with Montreal and Kyoto and several recent ones such as Paris and Katowice (the David Attenborough speech) aimed at atmospheric pollution and wildlife protection. Pollution does not acknowledge international boundaries. Water may also be cited as an issue (damming and over-extraction) Candidates should be able to describe the difficulties in reaching such agreements and will be able to assess success or otherwise (and may cite the USA pulling out of Paris) as well as the difficulties of enforcement. Candidates may choose to approach the issue from a global warming/climate change viewpoint, describing the different ways human population growth is impacting the environment and add in the protocols. 10 please use level descriptors 2 Question Answer Marks Section B descriptor levels: Descriptor Award Mark Consistently meets the level criteria Mark at top of level Meets the criteria, but with some inconsistency Middle, mark to just below top mark Meets most of level criteria, but not all convincingly Just below middle, mark to just above bottom mark On the borderline of this level and the one below Mark at bottom of level Section B (part a), Level descriptors 1 8–10 marks The response: • contains few errors • shows a very good understanding of the question • shows a good use of data or the information provided, where appropriate • provides a balanced answer 5–7 marks The response: • may contain some errors • shows an adequate understanding of the question • shows some use of data or the information provided, where appropriate • may lack balance 1–4 marks The response: • may contains errors • shows limited understanding of the question • shows little or no use of data or the information, where appropriate • lacks balance Question Answer Marks Section B (part b): Level descriptors 2 Responses: Level one, 25–30 marks • fulfil all the requirements of the question • contain a very good understanding of the content required • contain a very good balance of content • contain substantial critical and supportive evaluations • make accurate use of relevant vocabulary Level two, 19–24 marks • fulfil most of the requirements of the question • contain a good understanding of the content required • contain a good balance of content • contain some critical and supportive evaluations • make good use of relevant vocabulary Level three, 13–18 marks • fulfil some requirements of the question • contain some understanding of the content required • may contain some limited balance of content • may contain brief evaluations • make some use of relevant vocabulary Level four, 6–12 marks • fulfil limited requirements of the question • contain limited understanding of the content required • may contain poorly balanced of content • may not contain evaluations • make limited use of relevant vocabulary Question Answer Marks Level five, 1–5 marks • fulfil a few of the requirements of the question • contain a very limited understanding of the content required • are likely to be unbalanced and undeveloped • evaluative statements are likely to be missing • make no use of relevant vocabulary
What was in this paper
The subtopics covered by these 5 questions, and how many questions each got. Open one in a new tab to see every Cambridge question on it.
What you needed in this session
Cambridge’s own grade thresholds for 2021 May/June, Paper 2 · Variant 1. A higher threshold means an easier paper — the bar moves with how the cohort did.