Cambridge A Level Environmental Management (AS only) 8291 — 2020 Oct/Nov Paper 2 · Variant 2
8291/22/O/N/20 · 5 questions · 80 marks · ≈90 min
The question paper and its mark scheme, free to read here and free to download. This is Cambridge’s own paper, exactly as it was sat.
Question paper16 pages


Mark scheme17 pages
Answers below. Sit the paper first if you are practising.
Questions as text
Q1 · The various stores of water found in the hydrosphere
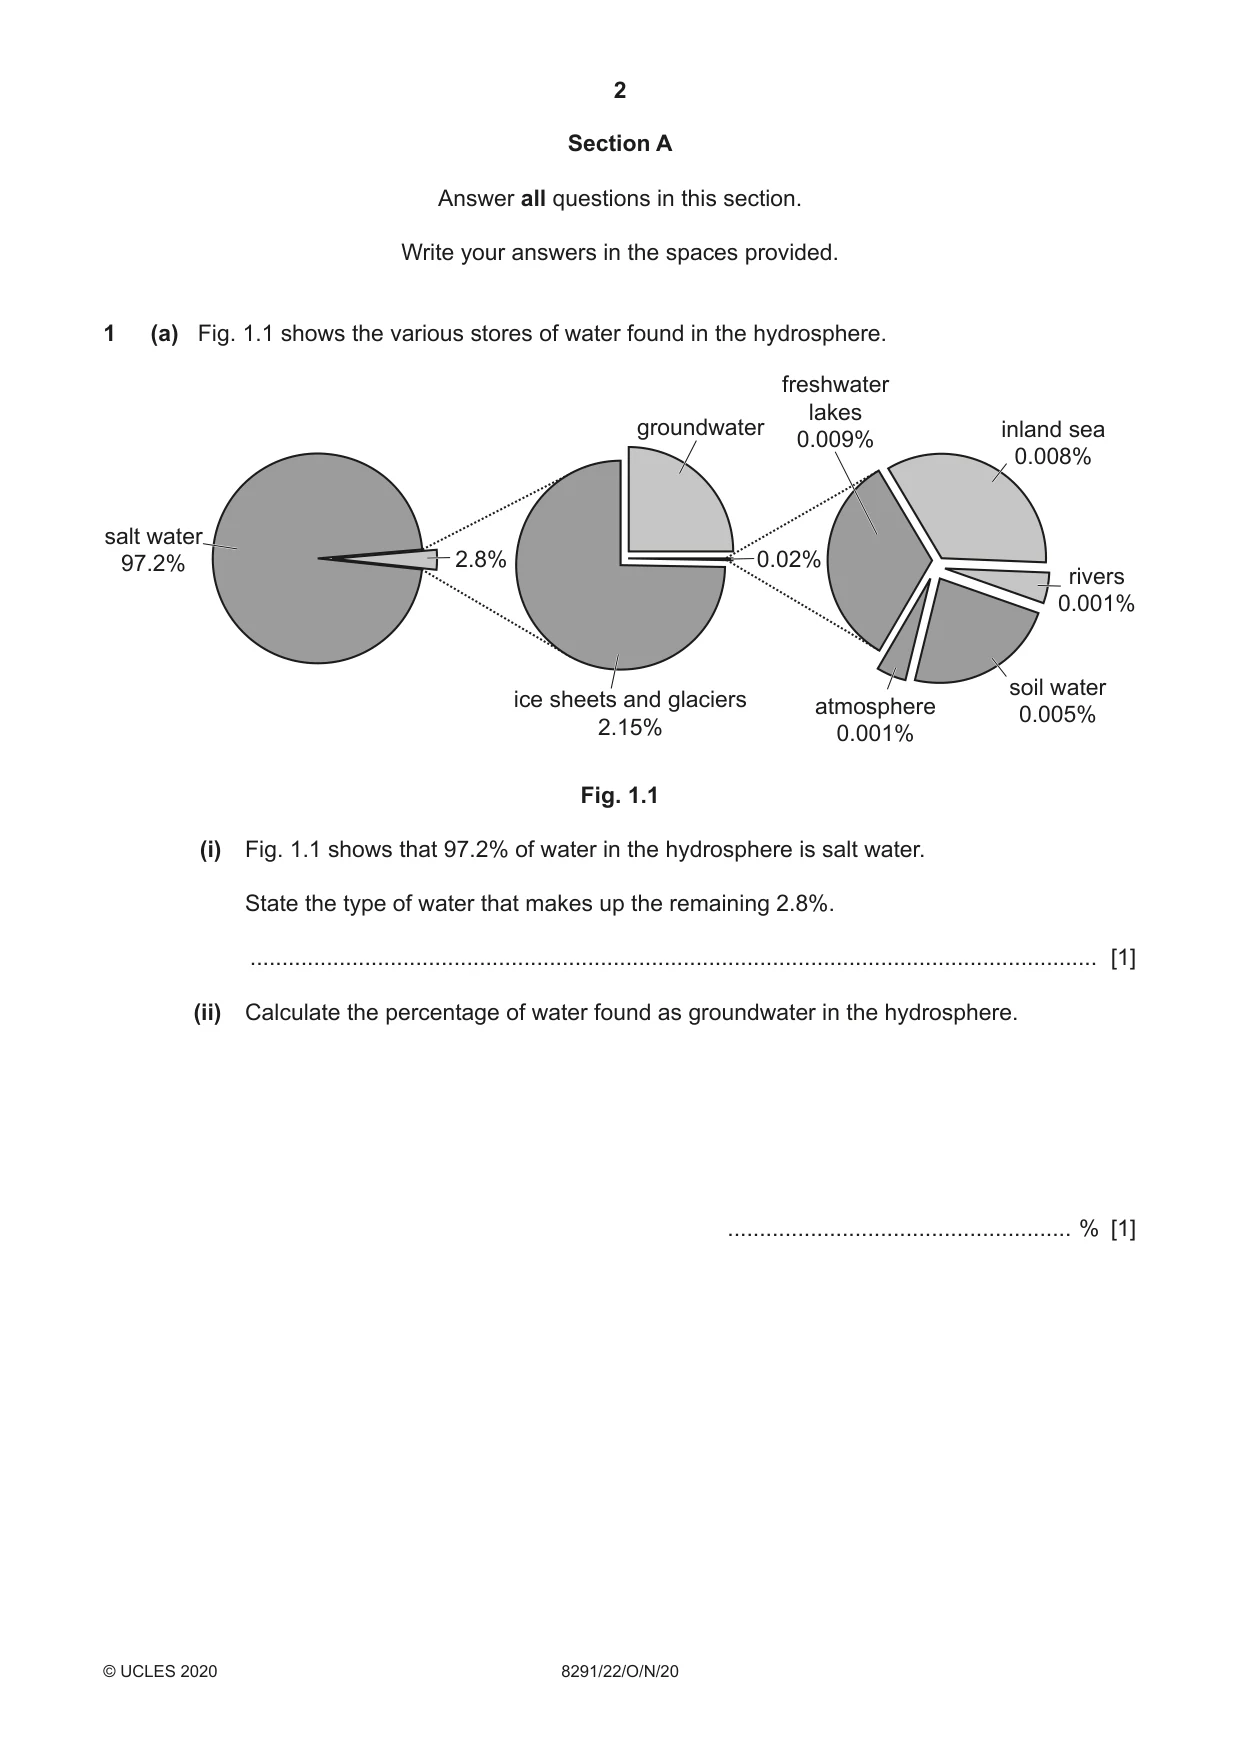
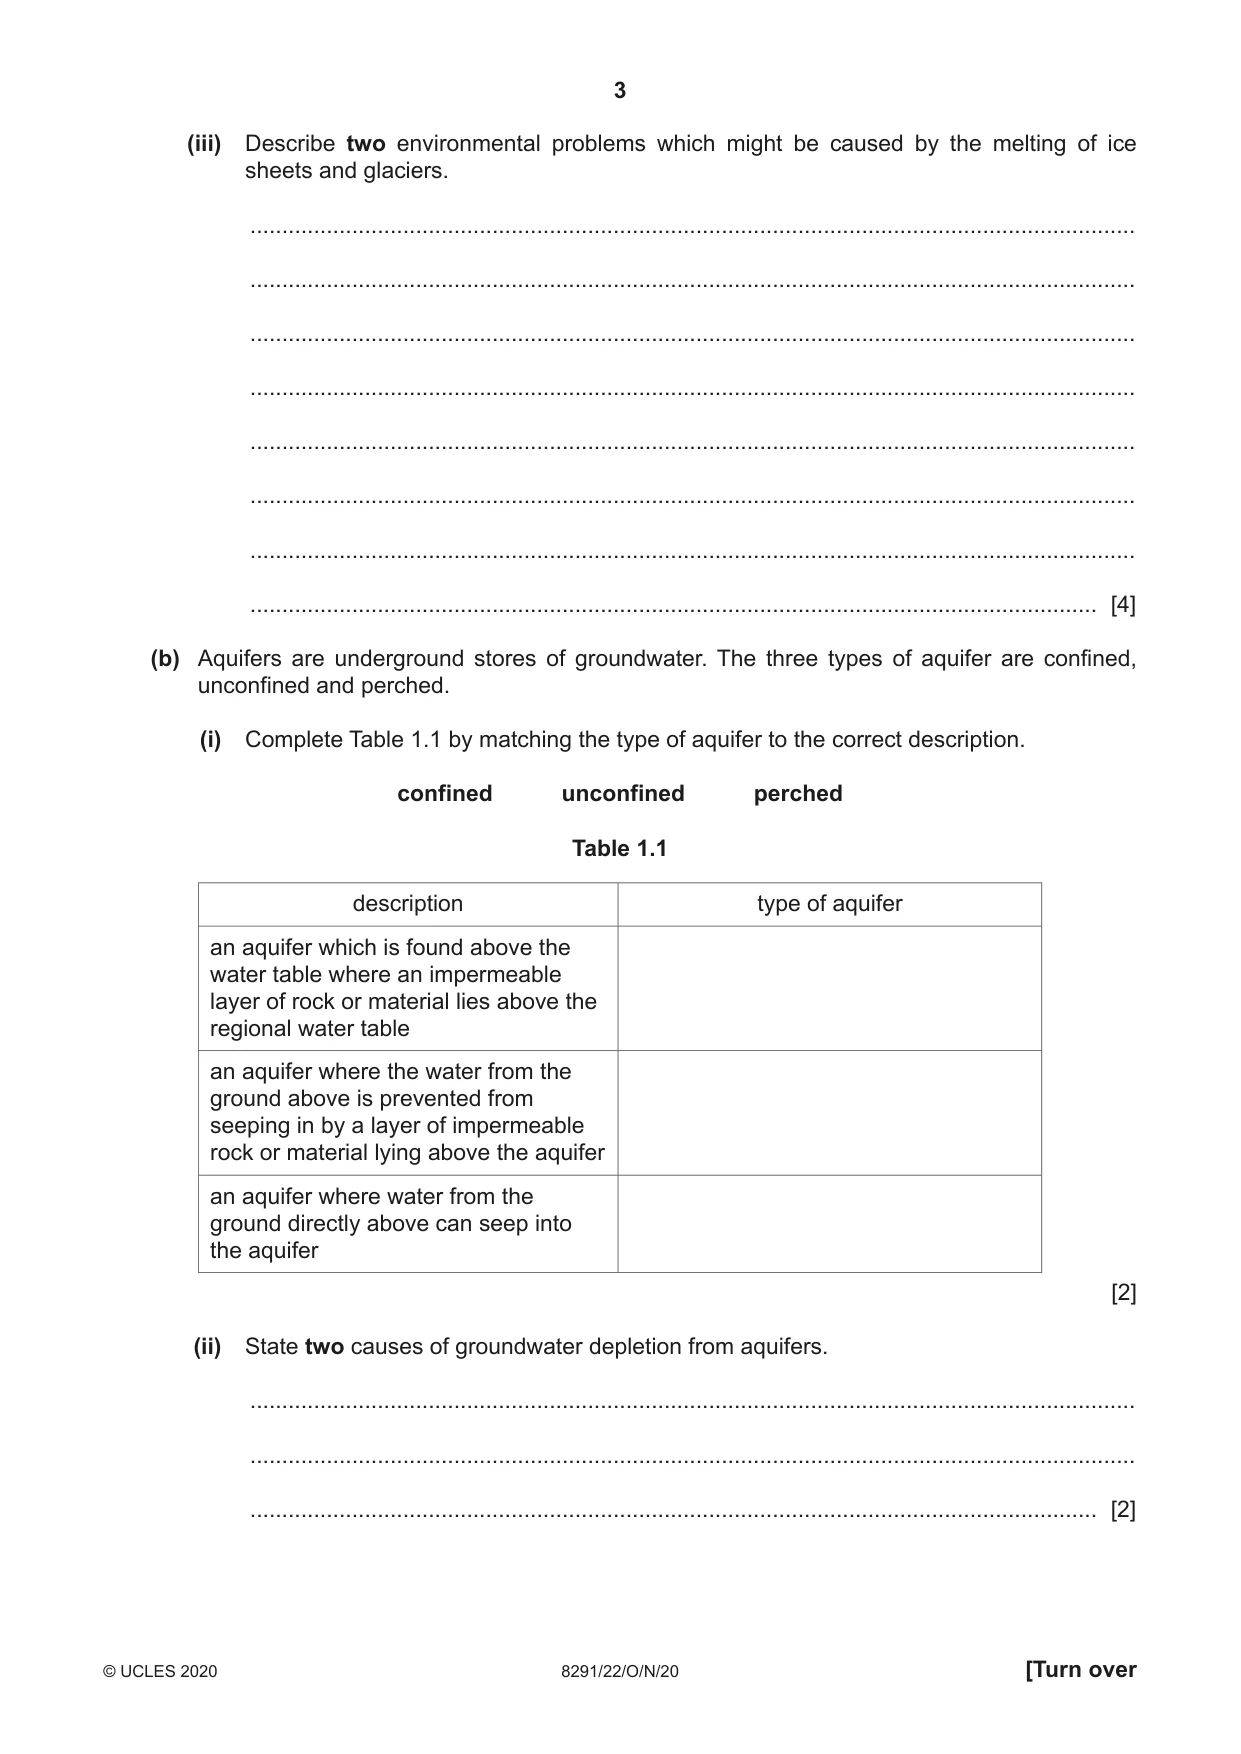
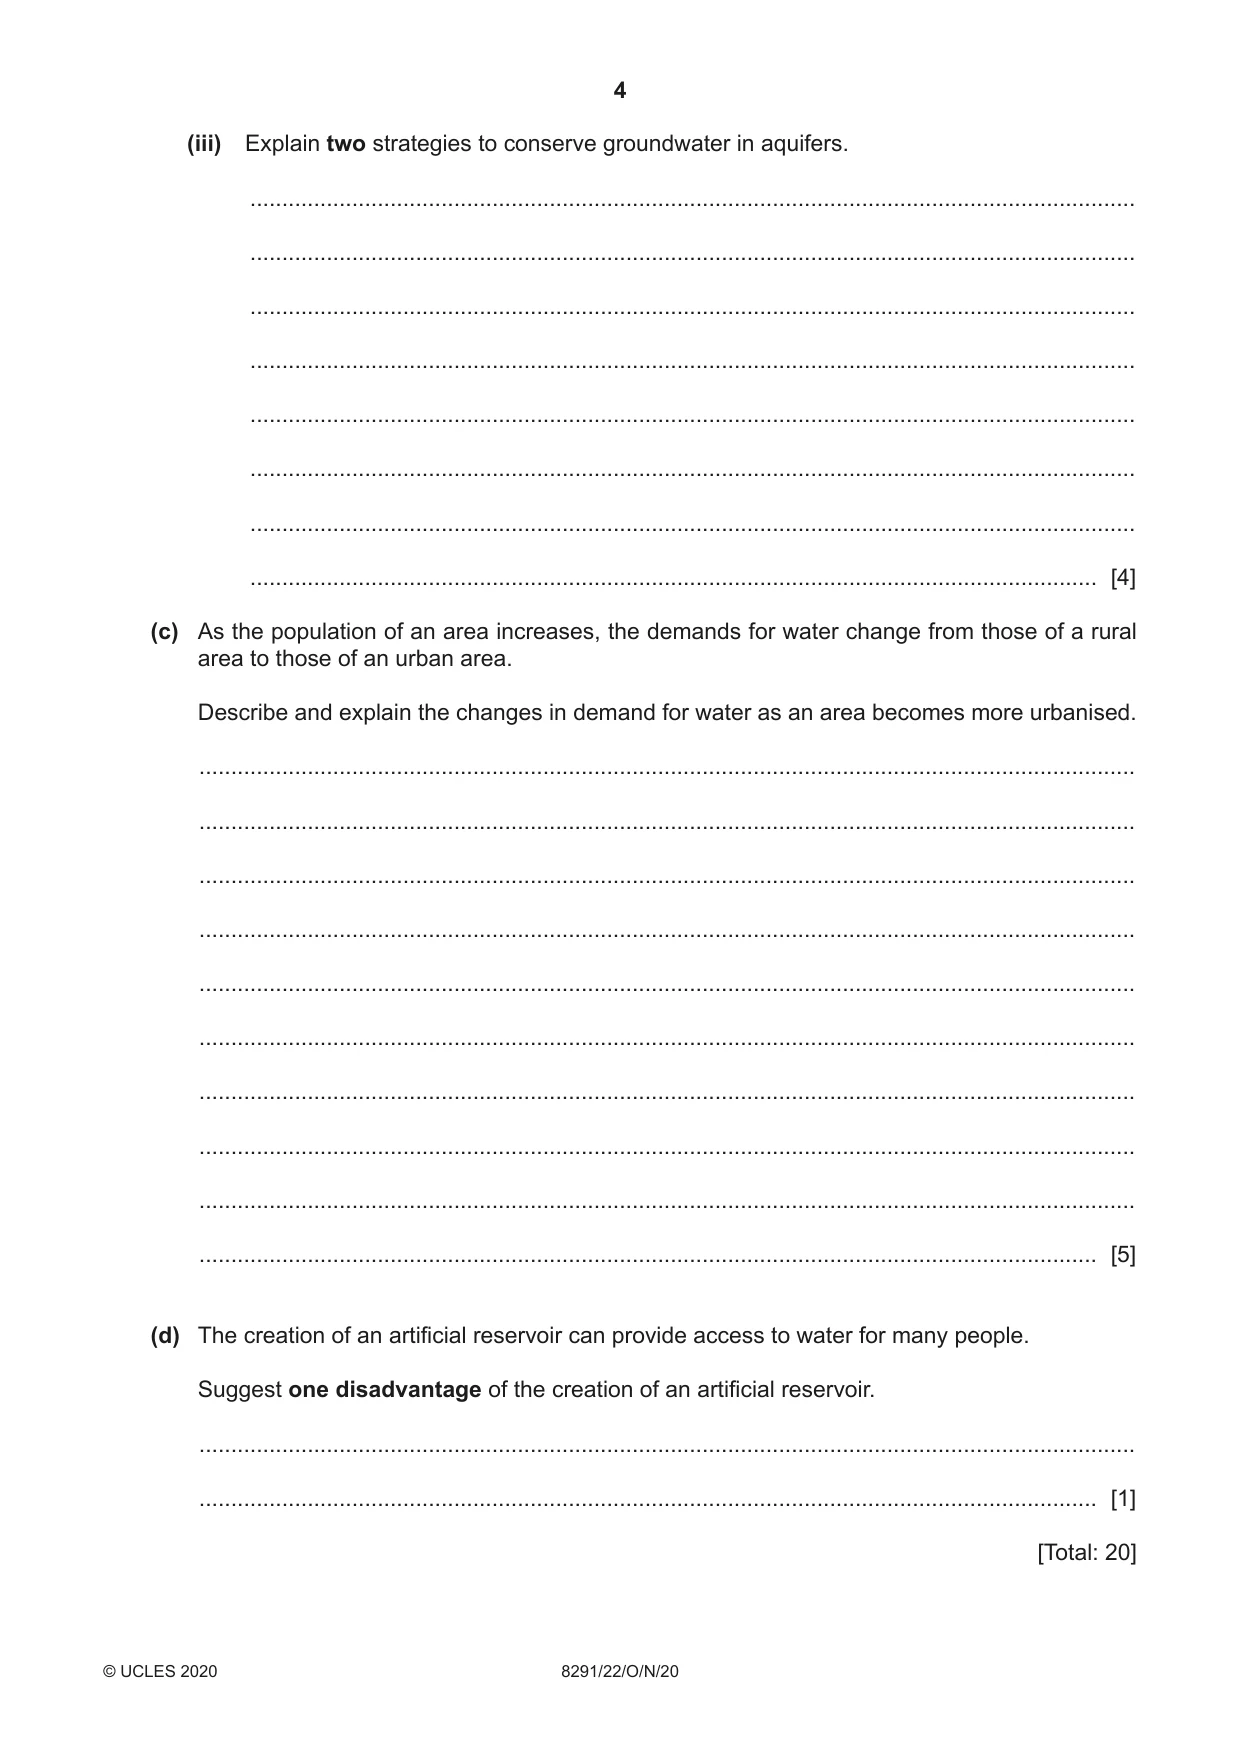
1 (a) Fig. 1.1 shows the various stores of water found in the hydrosphere. freshwater lakes groundwater inland sea 0.009% 0.008% salt water 97.2% 2.8% 0.02% rivers 0.001% soil water ice sheets and glaciers atmosphere 0.005% 2.15% 0.001% Fig. 1.1 (i) Fig. 1.1 shows that 97.2% of water in the hydrosphere is salt water. State the type of water that makes up the remaining 2.8%. ..................................................................................................................................... [1] (ii) Calculate the percentage of water found as groundwater in the hydrosphere. ...................................................... % [1] (iii) Describe two environmental problems which might be caused by the melting of ice sheets and glaciers. ........................................................................................................................................... ........................................................................................................................................... ........................................................................................................................................... ........................................................................................................................................... ........................................................................................................................................... ........................................................................................................................................... ........................................................................................................................................... ..................................................................................................................................... [4] (b) Aquifers are underground stores of groundwater. The three types of aquifer are confined, unconfined and perched. (i) Complete Table 1.1 by matching the type of aquifer to the correct description. confined unconfined perched Table 1.1 description type of aquifer an aquifer which is found above the water table where an impermeable layer of rock or material lies above the regional water table an aquifer where the water from the ground above is prevented from seeping in by a layer of impermeable rock or material lying above the aquifer an aquifer where water from the ground directly above can seep into the aquifer [2] (ii) State two causes of groundwater depletion from aquifers. ........................................................................................................................................... ........................................................................................................................................... ..................................................................................................................................... [2] (iii) Explain two strategies to conserve groundwater in aquifers. ........................................................................................................................................... ........................................................................................................................................... ........................................................................................................................................... ........................................................................................................................................... ........................................................................................................................................... ........................................................................................................................................... ........................................................................................................................................... ..................................................................................................................................... [4] (c) As the population of an area increases, the demands for water change from those of a rural area to those of an urban area. Describe and explain the changes in demand for water as an area becomes more urbanised. ................................................................................................................................................... ................................................................................................................................................... ................................................................................................................................................... ................................................................................................................................................... ................................................................................................................................................... ................................................................................................................................................... ................................................................................................................................................... ................................................................................................................................................... ................................................................................................................................................... ............................................................................................................................................. [5] (d) The creation of an artificial reservoir can provide access to water for many people. Suggest one disadvantage of the creation of an artificial reservoir. ................................................................................................................................................... ............................................................................................................................................. [1] [Total: 20]
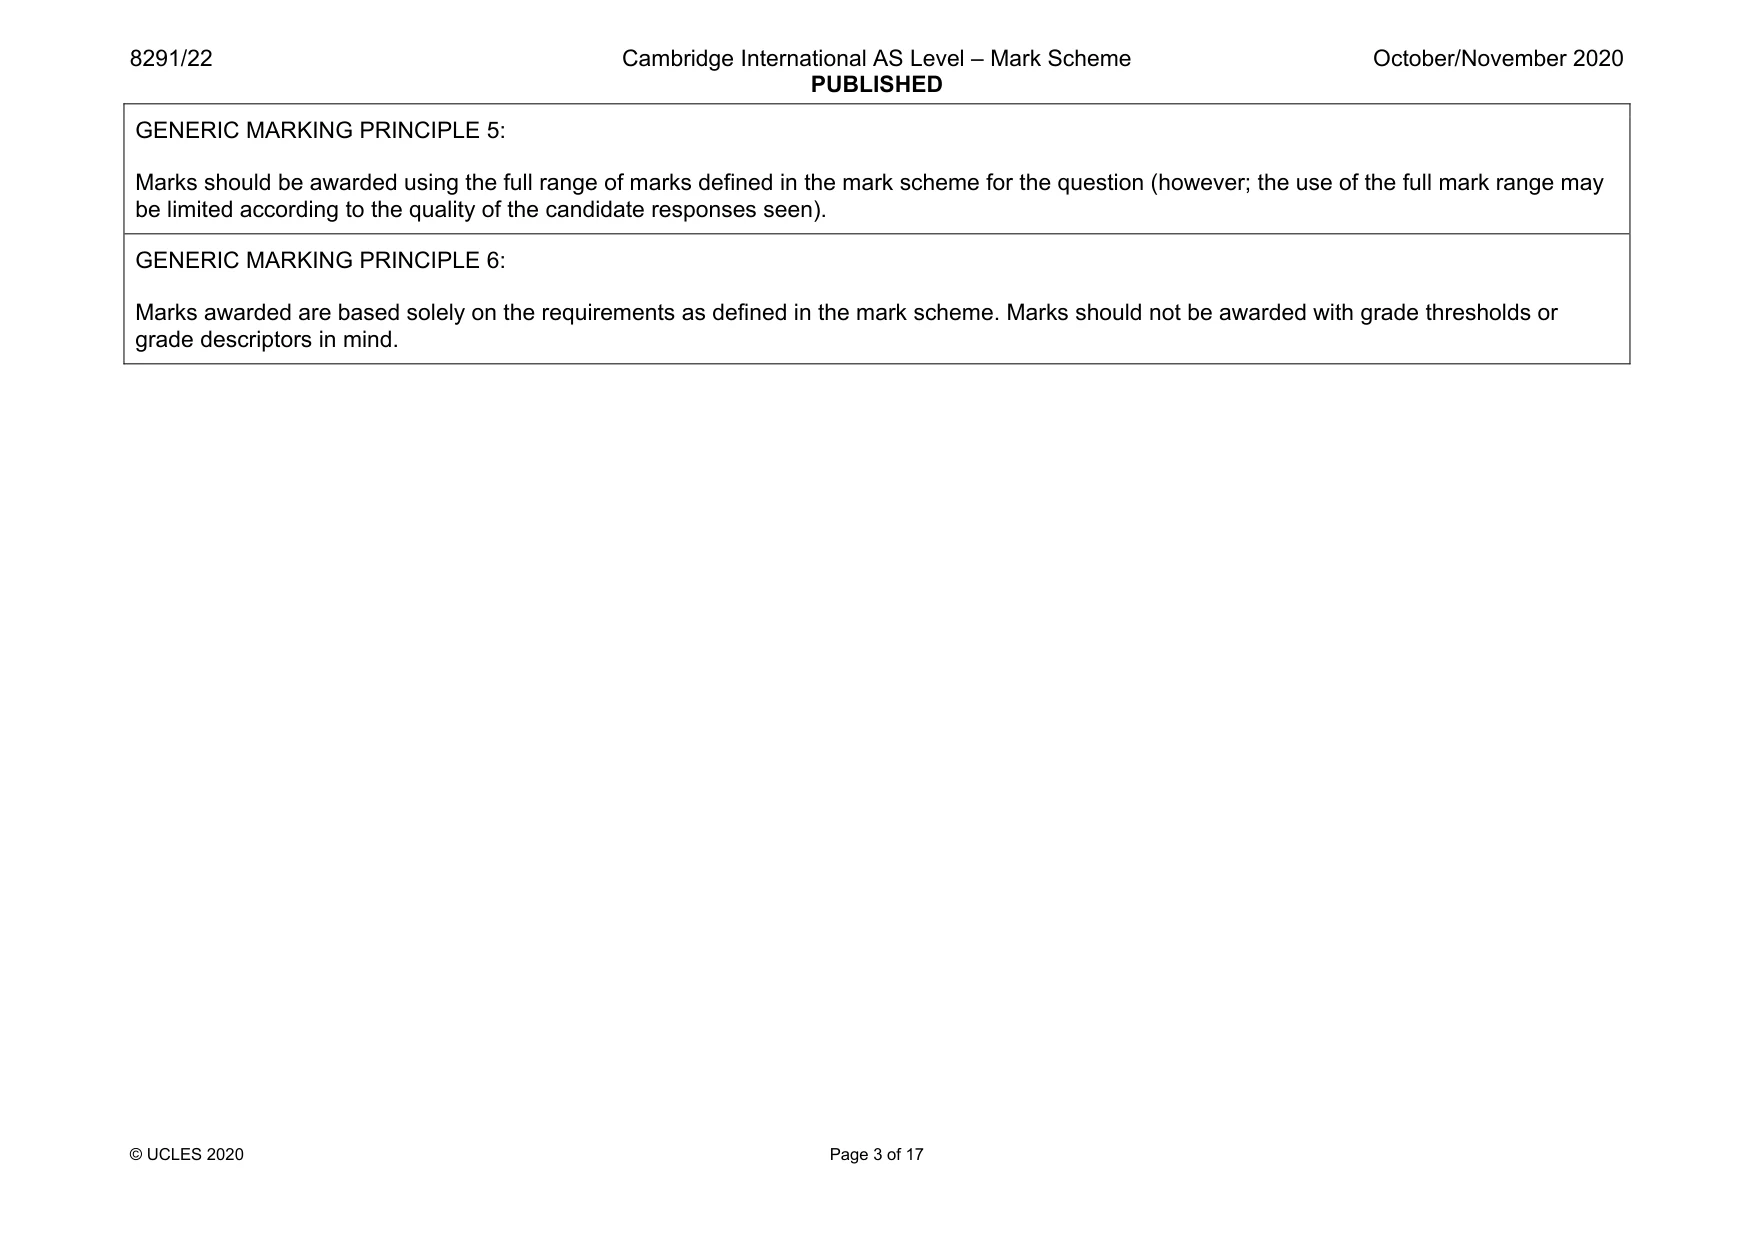
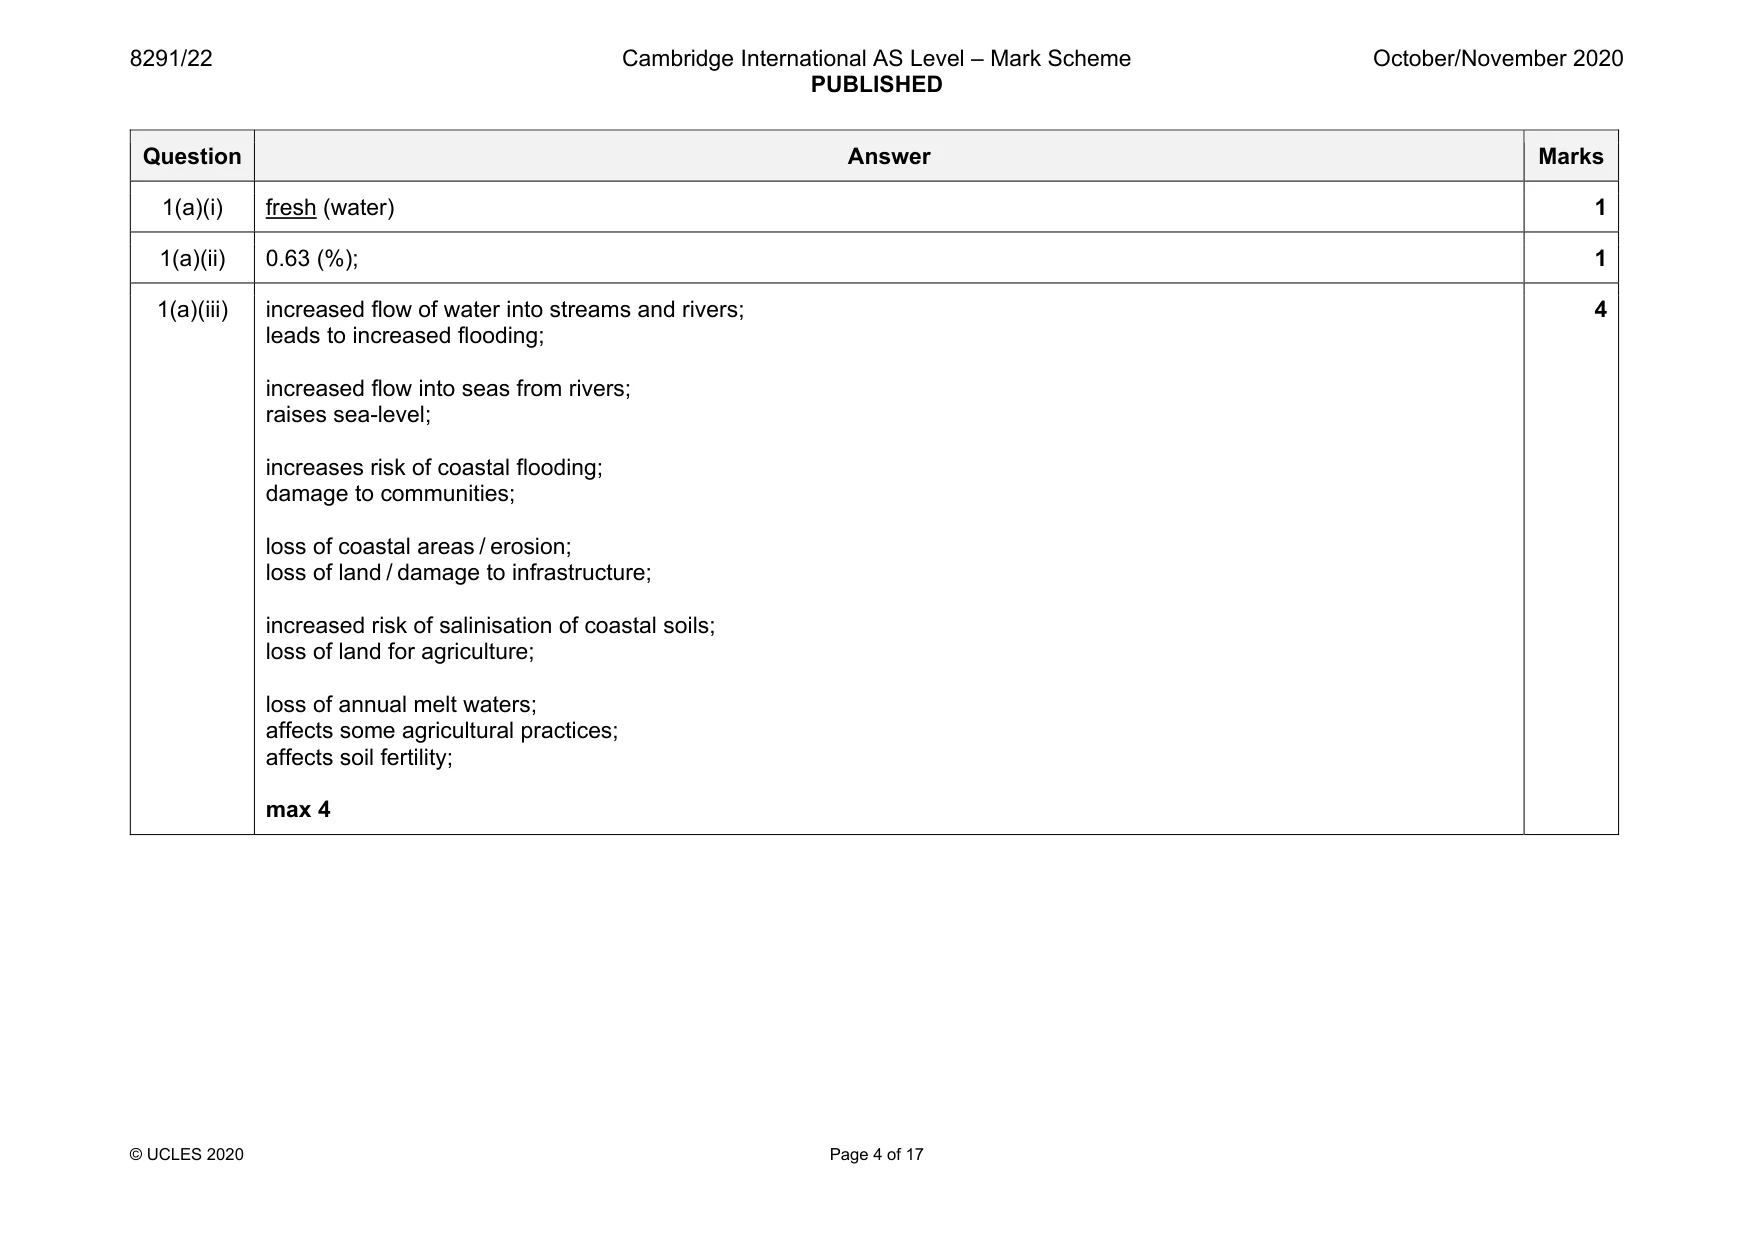
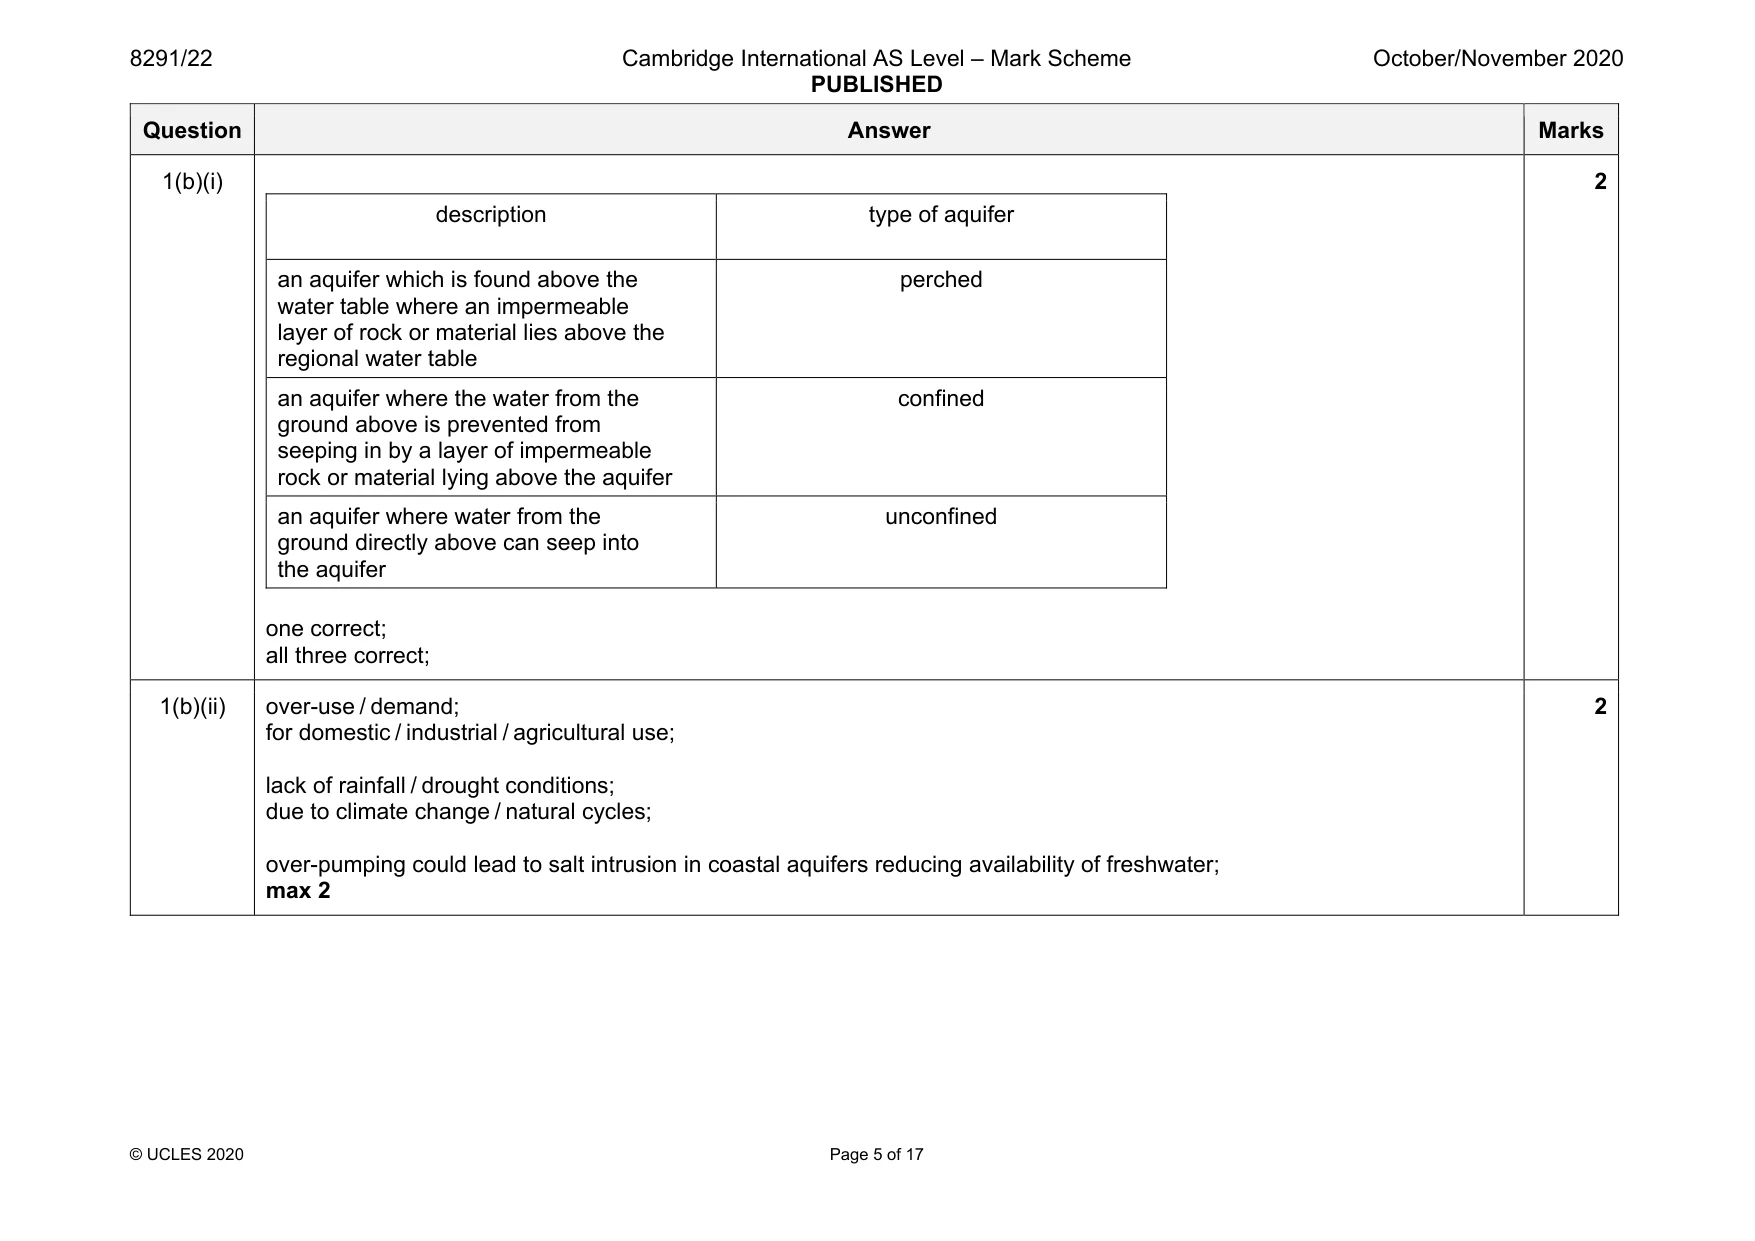
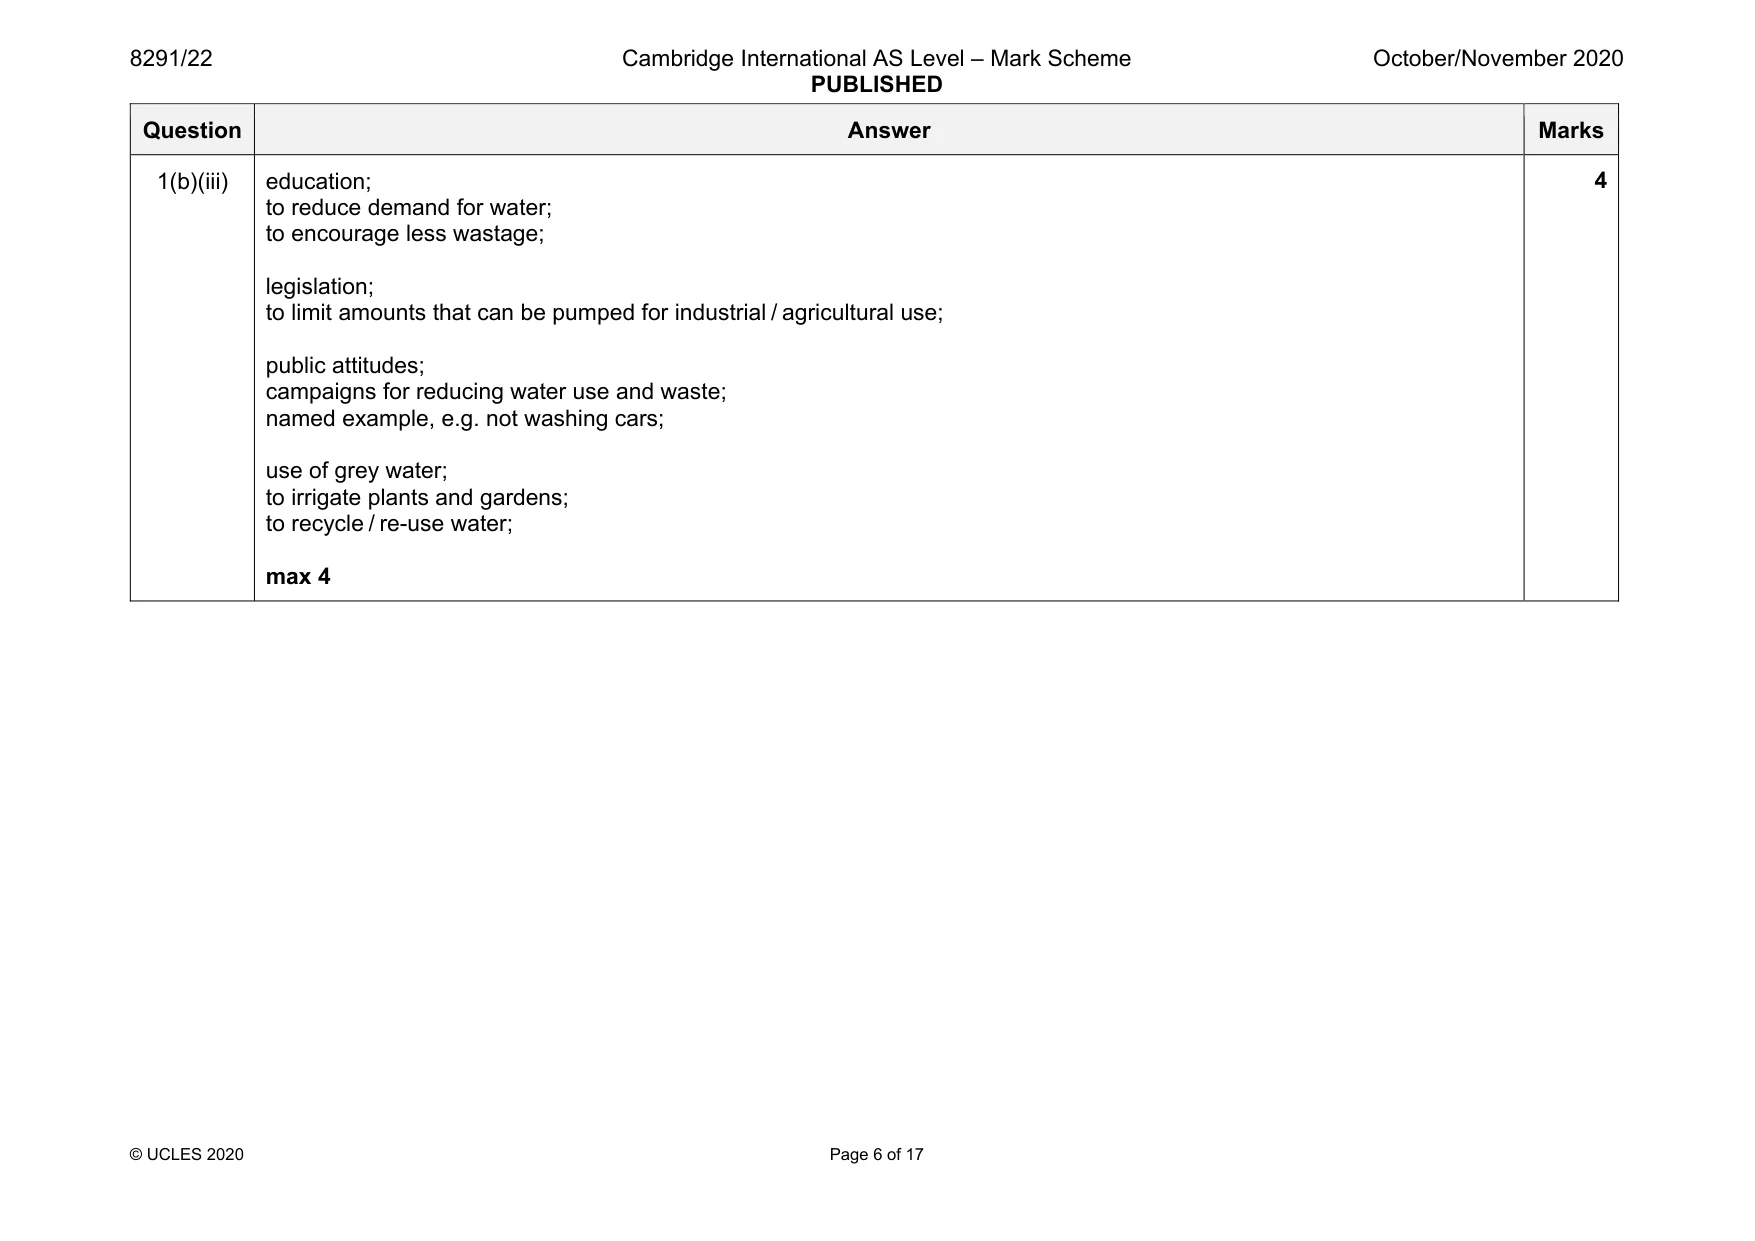
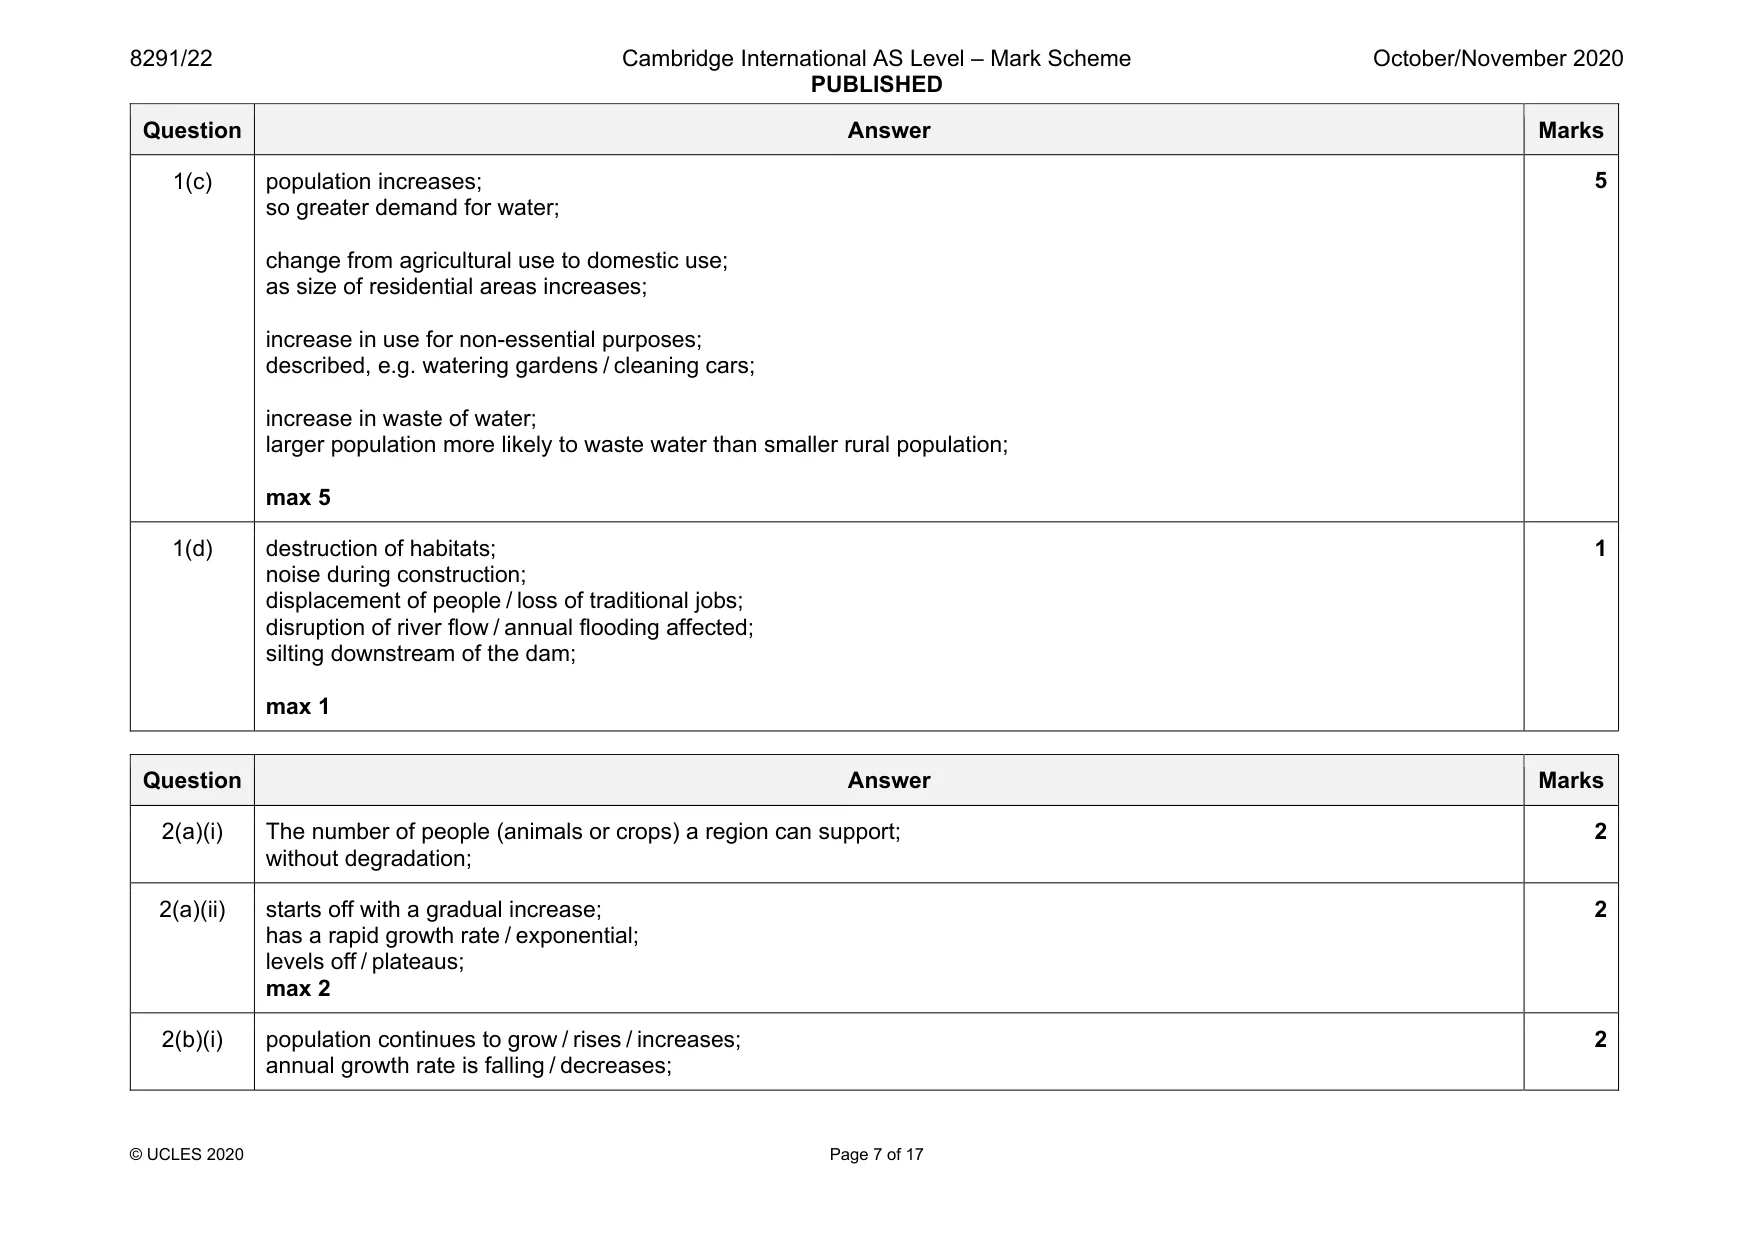
Mark scheme: 1(a)(i) fresh (water) 1 1(a)(ii) 0.63 (%); 1 1(a)(iii) increased flow of water into streams and rivers; leads to increased flooding; increased flow into seas from rivers; raises sea-level; increases risk of coastal flooding; damage to communities; loss of coastal areas / erosion; loss of land / damage to infrastructure; increased risk of salinisation of coastal soils; loss of land for agriculture; loss of annual melt waters; affects some agricultural practices; affects soil fertility; max 4 4 Question Answer Marks 1(b)(i) description type of aquifer an aquifer which is found above the water table where an impermeable layer of rock or material lies above the regional water table perched an aquifer where the water from the ground above is prevented from seeping in by a layer of impermeable rock or material lying above the aquifer confined an aquifer where water from the ground directly above can seep into the aquifer unconfined one correct; all three correct; 2 1(b)(ii) over-use / demand; for domestic / industrial / agricultural use; lack of rainfall / drought conditions; due to climate change / natural cycles; over-pumping could lead to salt intrusion in coastal aquifers reducing availability of freshwater; max 2 2 Question Answer Marks 1(b)(iii) education; to reduce demand for water; to encourage less wastage; legislation; to limit amounts that can be pumped for industrial / agricultural use; public attitudes; campaigns for reducing water use and waste; named example, e.g. not washing cars; use of grey water; to irrigate plants and gardens; to recycle / re-use water; max 4 4 Question Answer Marks 1(c) population increases; so greater demand for water; change from agricultural use to domestic use; as size of residential areas increases; increase in use for non-essential purposes; described, e.g. watering gardens / cleaning cars; increase in waste of water; larger population more likely to waste water than smaller rural population; max 5 5 1(d) destruction of habitats; noise during construction; displacement of people / loss of traditional jobs; disruption of river flow / annual flooding affected; silting downstream of the dam; max 1 1
Q2 · A theoretical graph of population growth
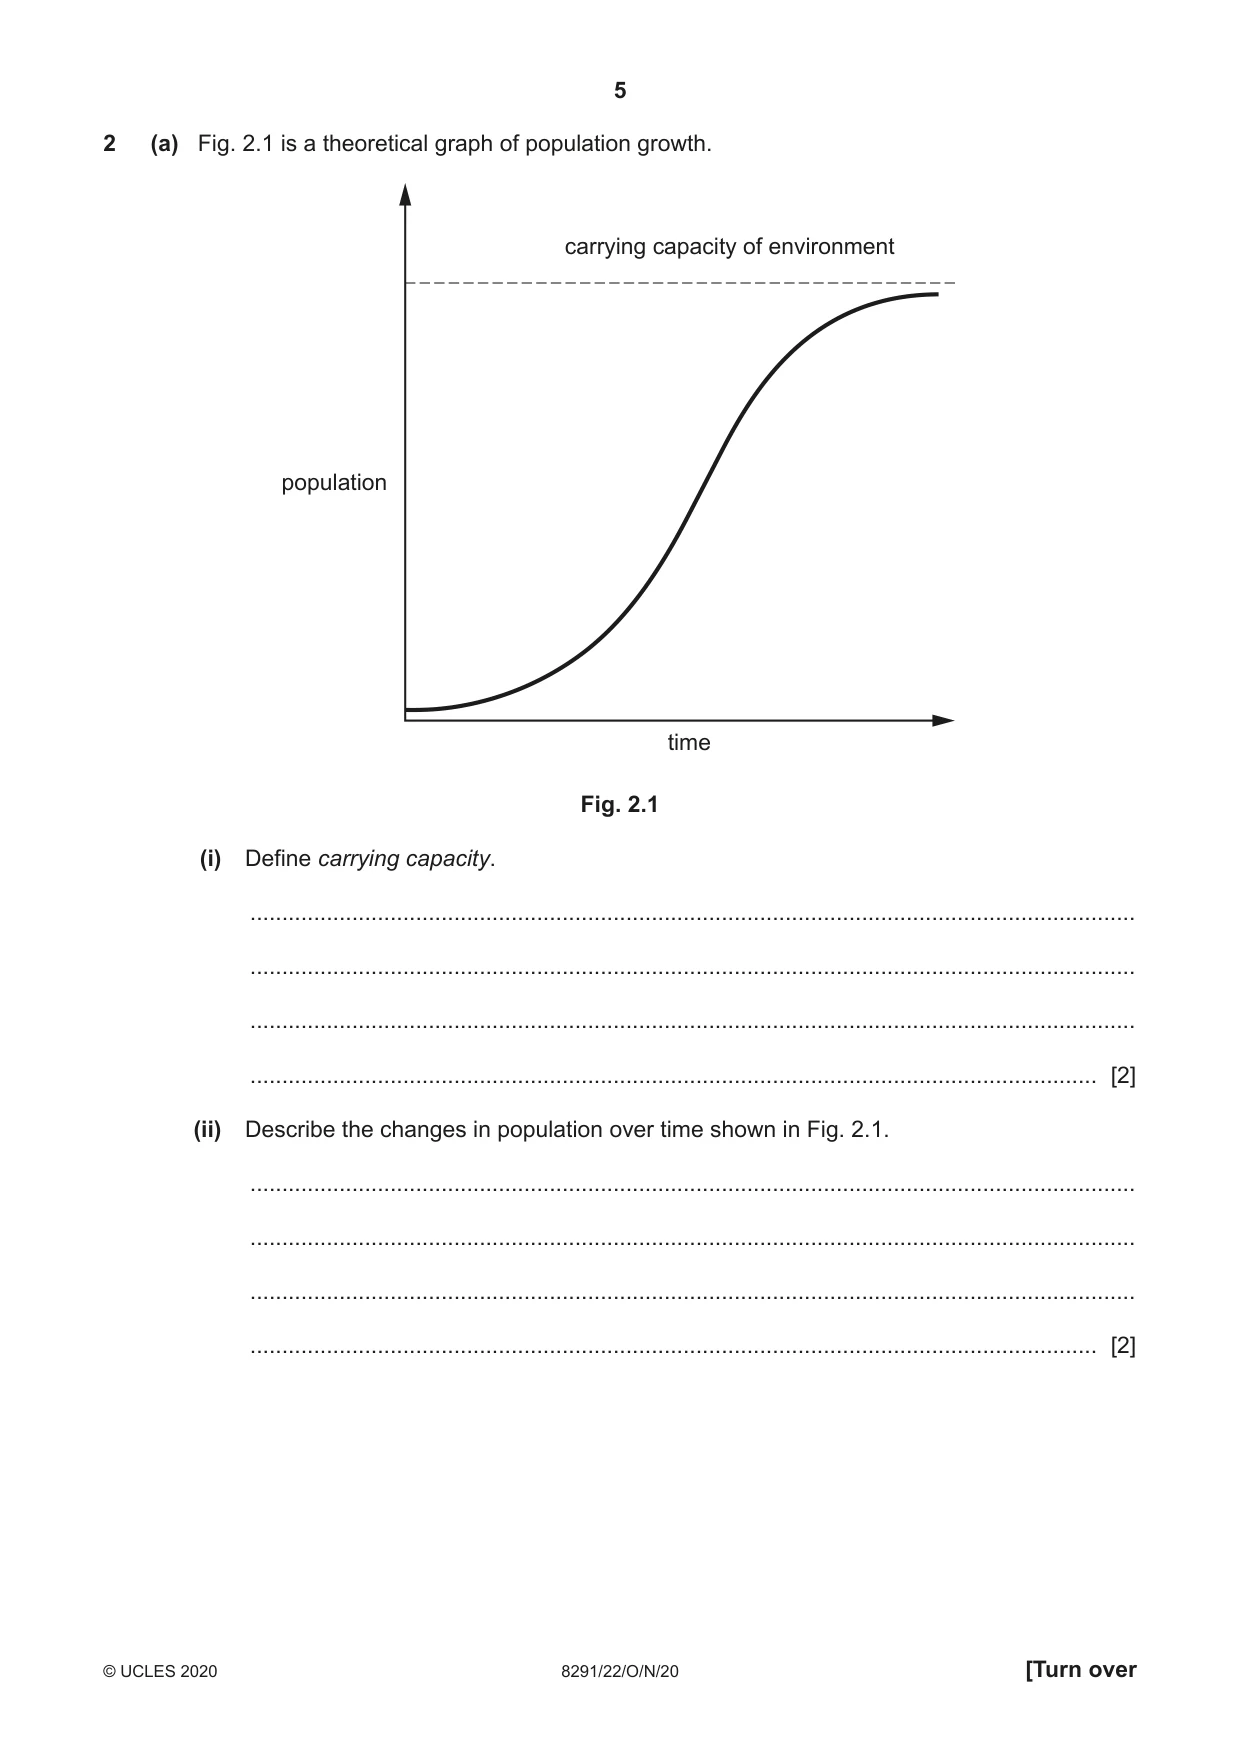
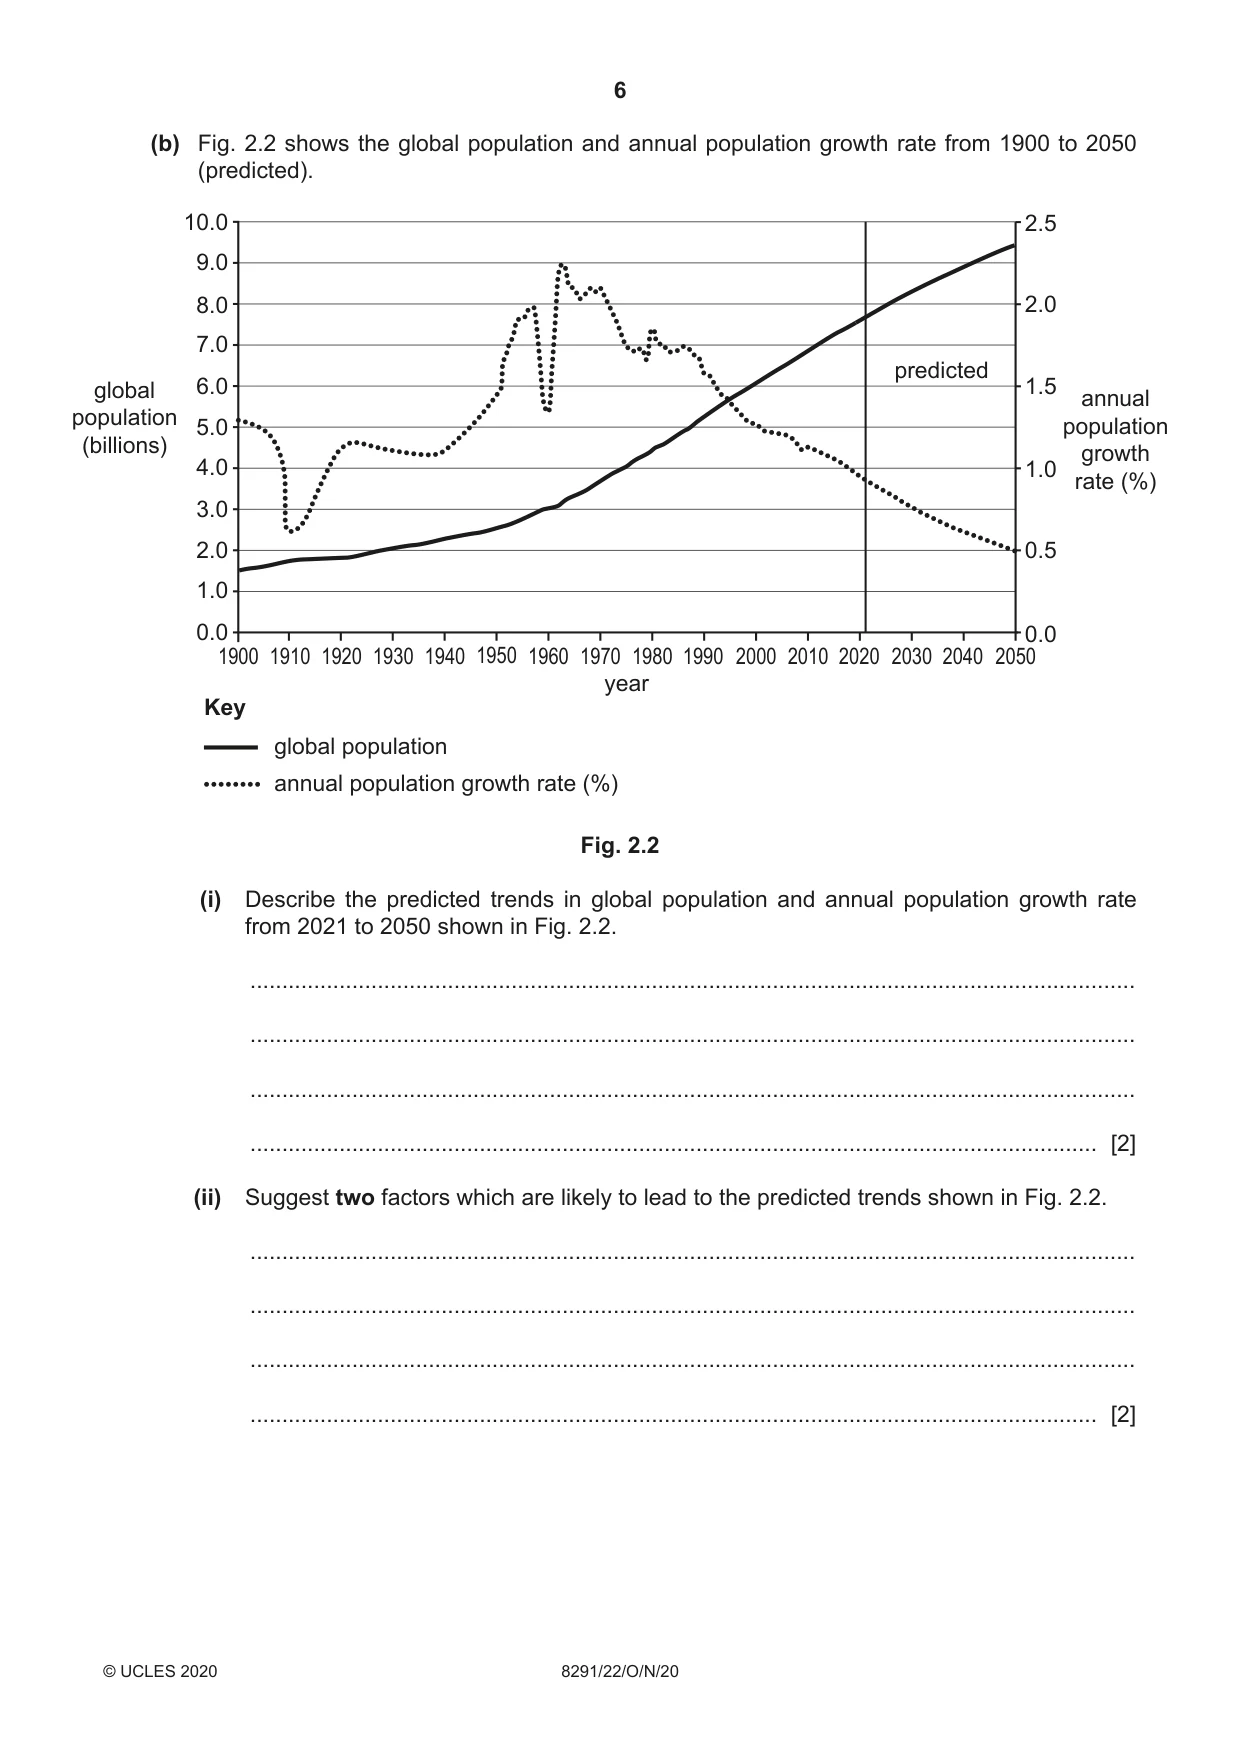
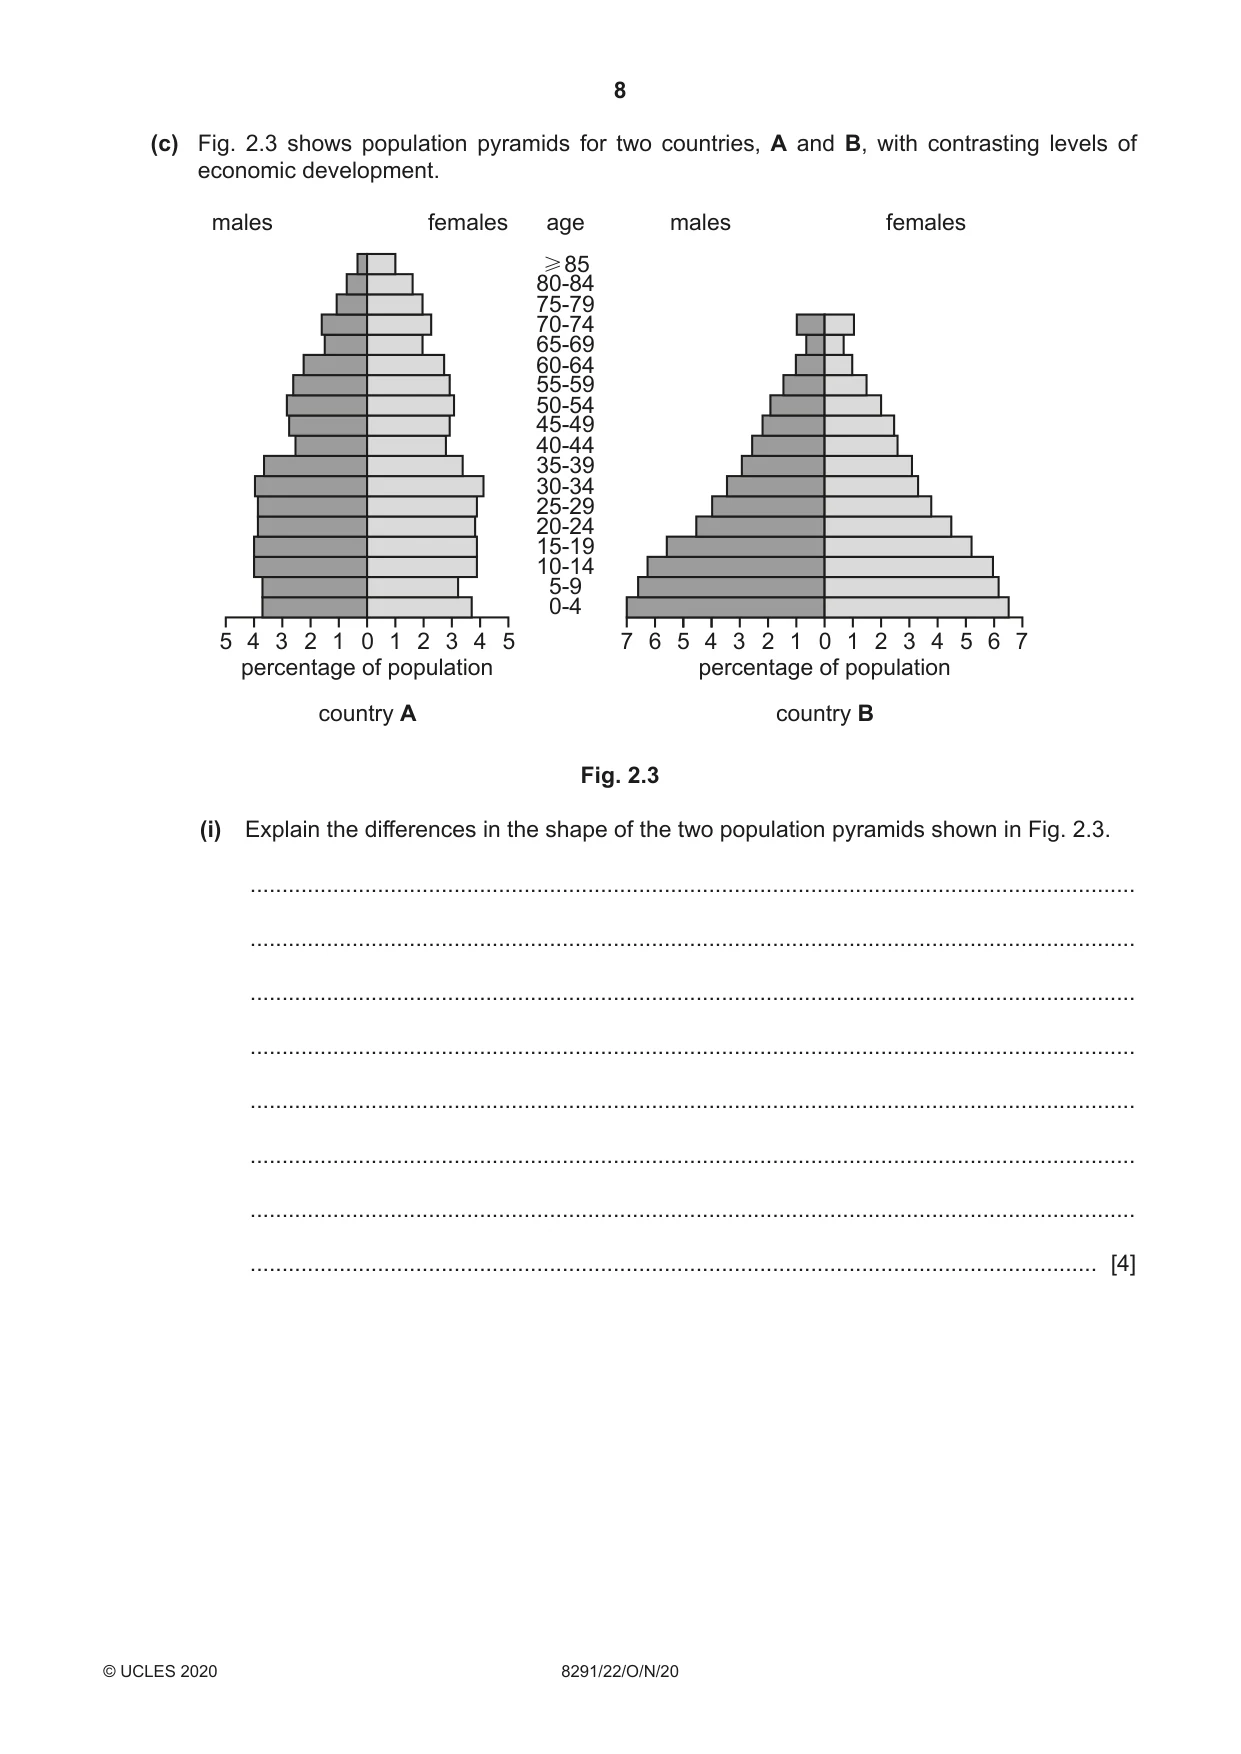
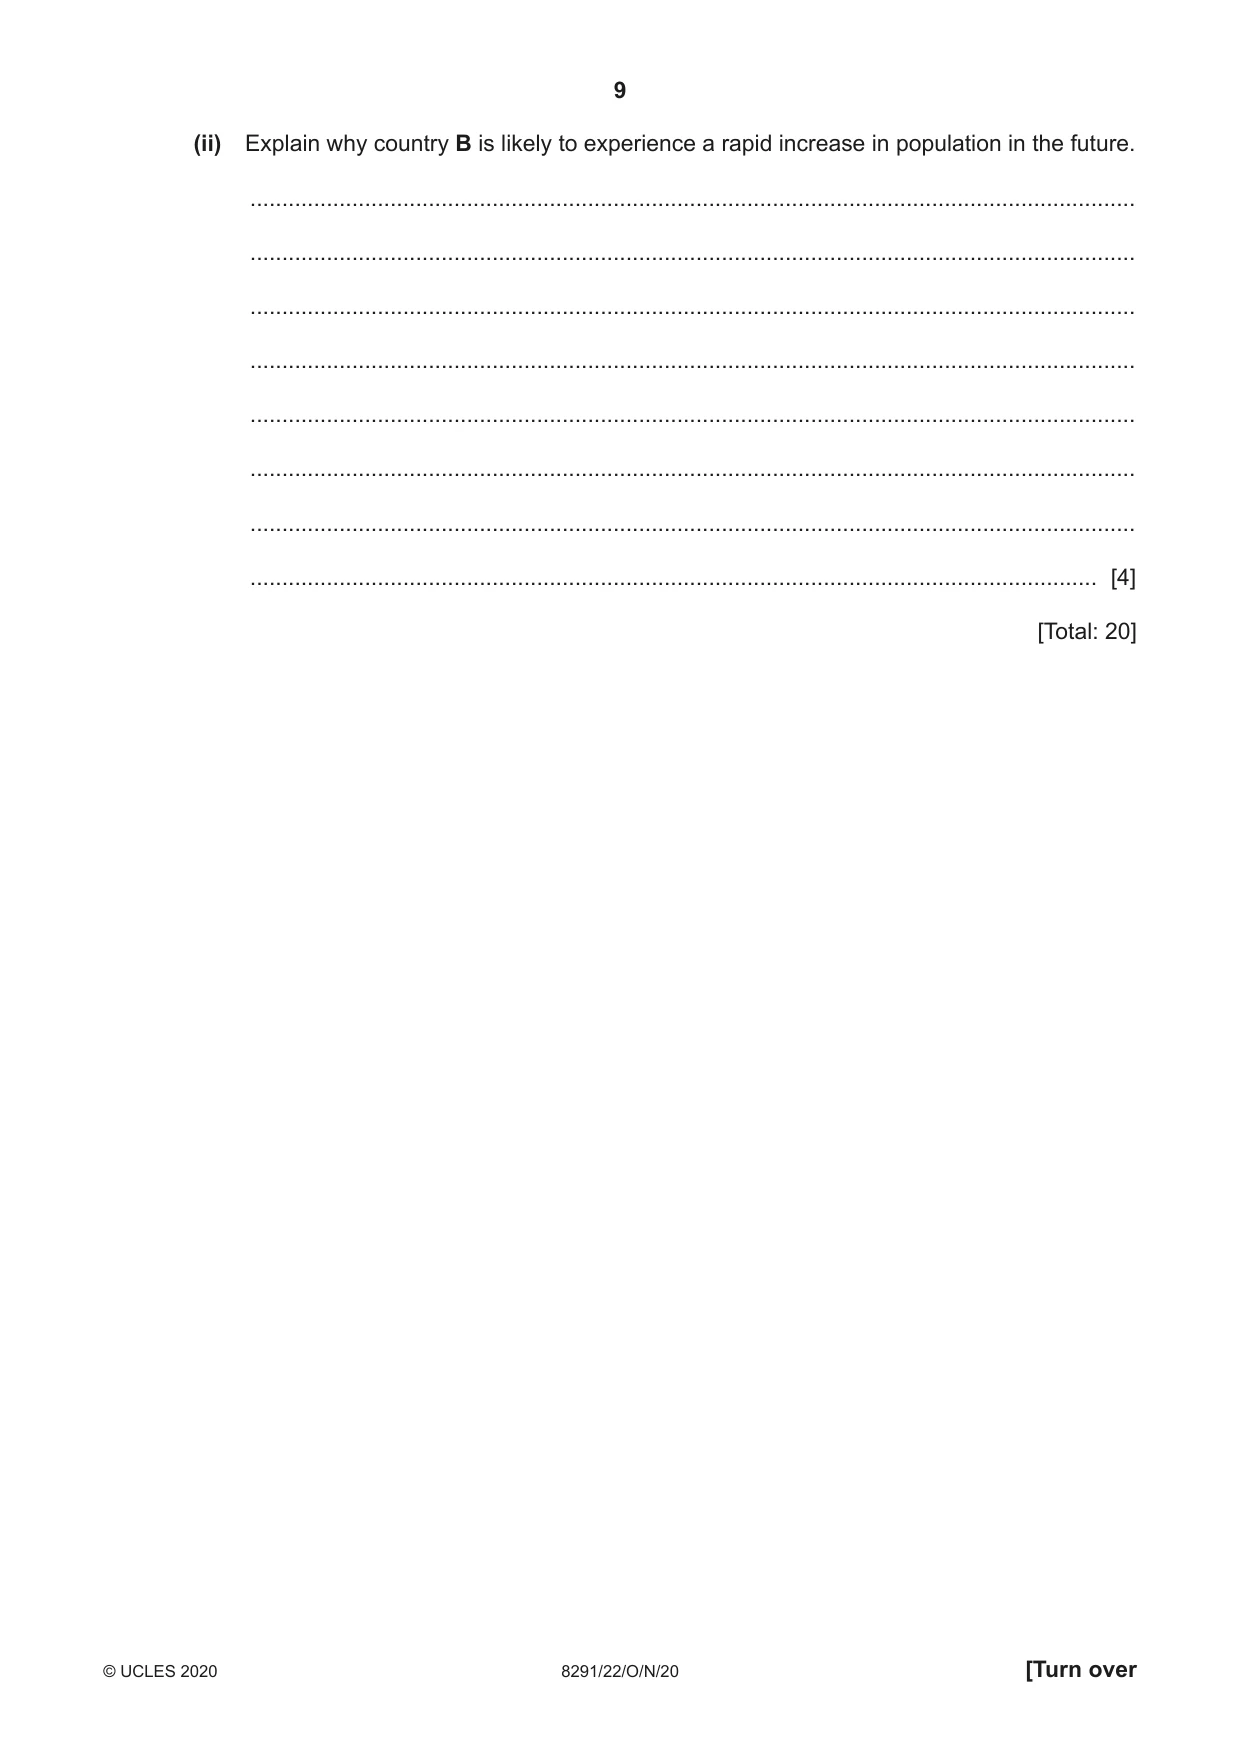
2 (a) Fig. 2.1 is a theoretical graph of population growth. carrying capacity of environment population time Fig. 2.1 (i) Define carrying capacity. ........................................................................................................................................... ........................................................................................................................................... ........................................................................................................................................... ..................................................................................................................................... [2] (ii) Describe the changes in population over time shown in Fig. 2.1. ........................................................................................................................................... ........................................................................................................................................... ........................................................................................................................................... ..................................................................................................................................... [2] (b) Fig. 2.2 shows the global population and annual population growth rate from 1900 to 2050 (predicted). 10.0 2.5 9.0 8.0 2.0 7.0 predicted global 6.0 1.5 annual population 5.0 population (billions) growth 4.0 1.0 rate (%) 3.0 2.0 0.5 1.0 0.0 0.0 1900 1910 1920 1930 1940 1950 1960 1970 1980 1990 2000 2010 2020 2030 2040 2050 year Key global population annual population growth rate (%) Fig. 2.2 (i) Describe the predicted trends in global population and annual population growth rate from 2021 to 2050 shown in Fig. 2.2. ........................................................................................................................................... ........................................................................................................................................... ........................................................................................................................................... ..................................................................................................................................... [2] (ii) Suggest two factors which are likely to lead to the predicted trends shown in Fig. 2.2. ........................................................................................................................................... ........................................................................................................................................... ........................................................................................................................................... ..................................................................................................................................... [2] (iii) Malthus predicted a limit to human population growth. Suggest reasons why this has not happened. ........................................................................................................................................... ........................................................................................................................................... ........................................................................................................................................... ........................................................................................................................................... ........................................................................................................................................... ........................................................................................................................................... ........................................................................................................................................... ..................................................................................................................................... [4] (c) Fig. 2.3 shows population pyramids for two countries, A and B, with contrasting levels of economic development. males females age males females H85 80-84 75-79 70-74 65-69 60-64 55-59 50-54 45-49 40-44 35-39 30-34 25-29 20-24 15-19 10-14 5-9 0-4 5 4 3 2 1 0 1 2 3 4 5 7 6 5 4 3 2 1 0 1 2 3 4 5 6 7 percentage of population percentage of population country A country B Fig. 2.3 (i) Explain the differences in the shape of the two population pyramids shown in Fig. 2.3. ........................................................................................................................................... ........................................................................................................................................... ........................................................................................................................................... ........................................................................................................................................... ........................................................................................................................................... ........................................................................................................................................... ........................................................................................................................................... ..................................................................................................................................... [4] (ii) Explain why country B is likely to experience a rapid increase in population in the future. ........................................................................................................................................... ........................................................................................................................................... ........................................................................................................................................... ........................................................................................................................................... ........................................................................................................................................... ........................................................................................................................................... ........................................................................................................................................... ..................................................................................................................................... [4] [Total: 20]
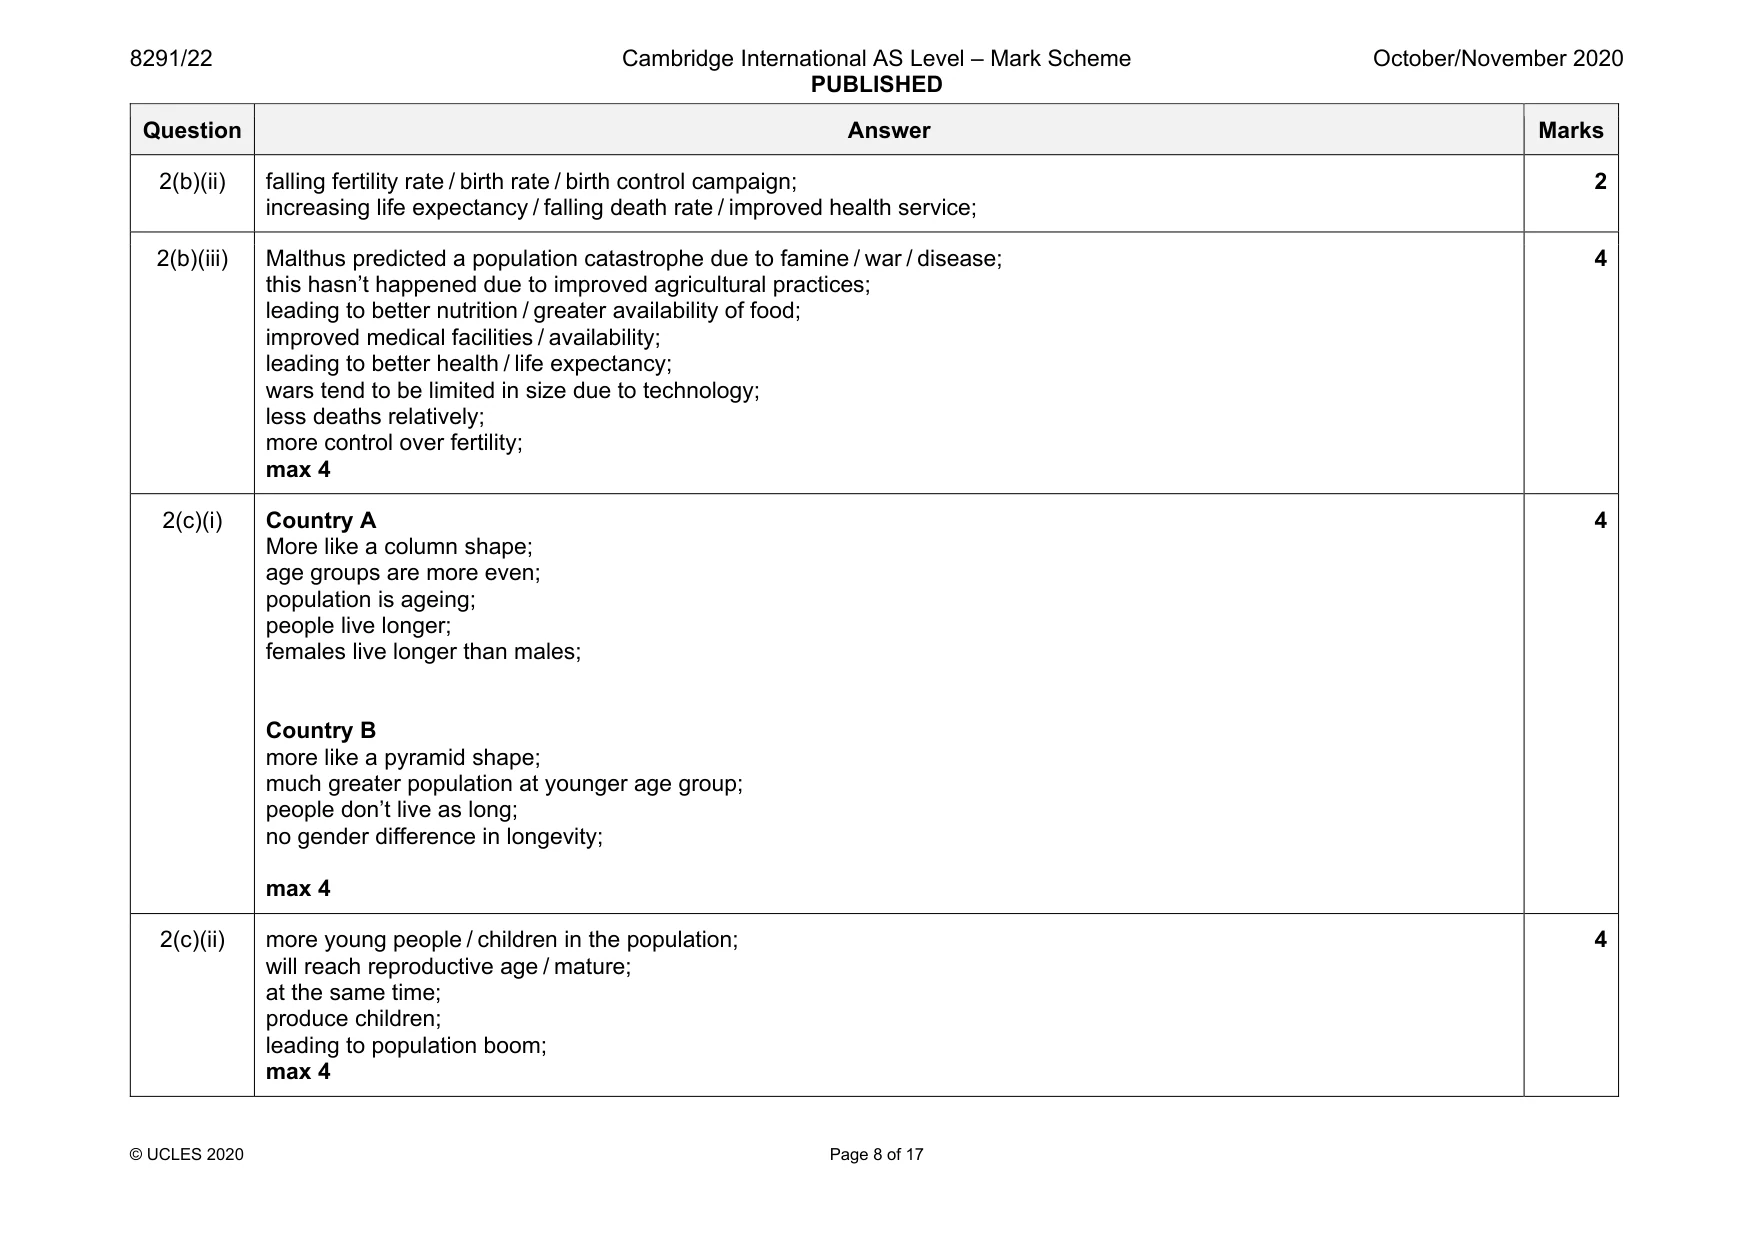
Mark scheme: 2(a)(i) The number of people (animals or crops) a region can support; without degradation; 2 2(a)(ii) starts off with a gradual increase; has a rapid growth rate / exponential; levels off / plateaus; max 2 2 2(b)(i) population continues to grow / rises / increases; annual growth rate is falling / decreases; 2 Question Answer Marks 2(b)(ii) falling fertility rate / birth rate / birth control campaign; increasing life expectancy / falling death rate / improved health service; 2 2(b)(iii) Malthus predicted a population catastrophe due to famine / war / disease; this hasn’t happened due to improved agricultural practices; leading to better nutrition / greater availability of food; improved medical facilities / availability; leading to better health / life expectancy; wars tend to be limited in size due to technology; less deaths relatively; more control over fertility; max 4 4 2(c)(i) Country A More like a column shape; age groups are more even; population is ageing; people live longer; females live longer than males; Country B more like a pyramid shape; much greater population at younger age group; people don’t live as long; no gender difference in longevity; max 4 4 2(c)(ii) more young people / children in the population; will reach reproductive age / mature; at the same time; produce children; leading to population boom; max 4 4
Q3 · The distribution of eutrophic and hypoxic (dead zone) areas of coastal waters of Europe
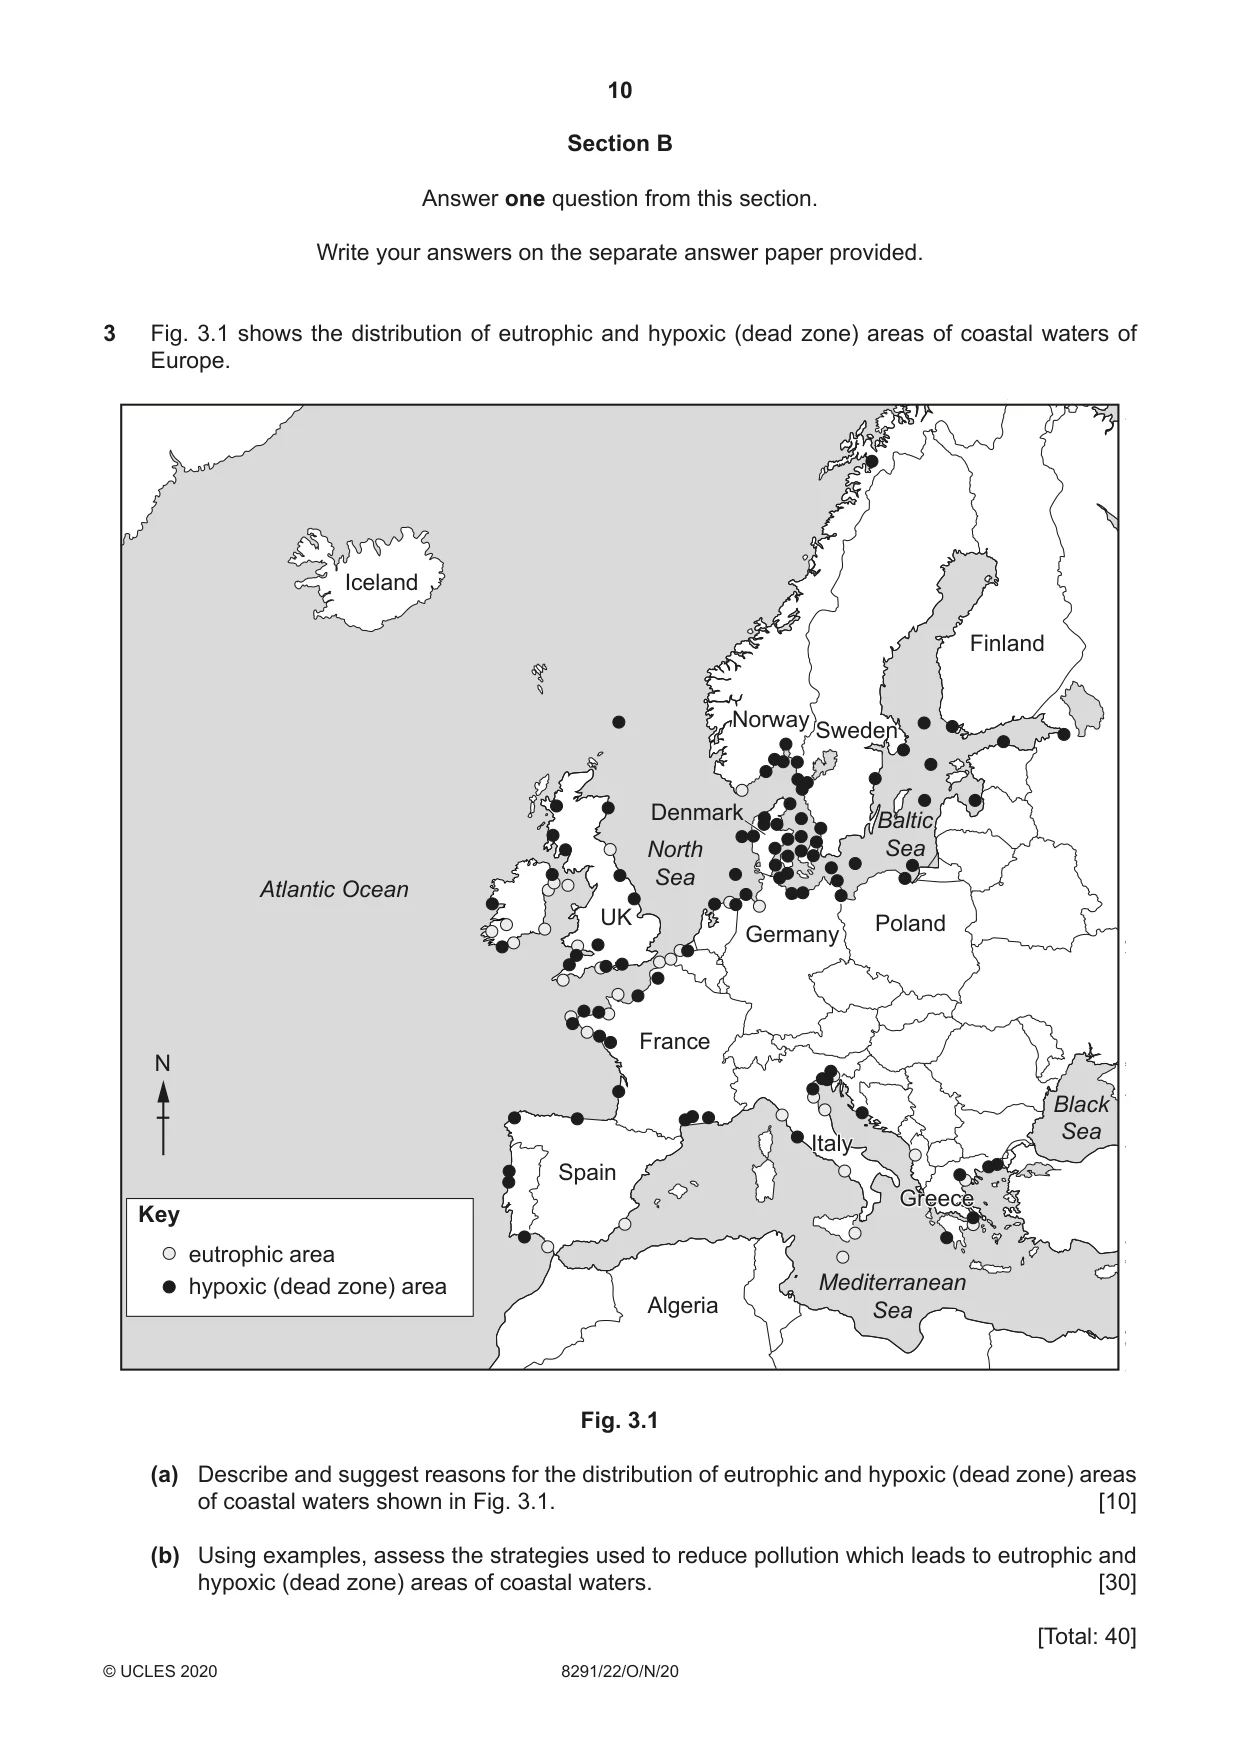
3 Fig. 3.1 shows the distribution of eutrophic and hypoxic (dead zone) areas of coastal waters of Europe. Iceland Finland Norway Sweden Denmark Baltic North Sea Sea Atlantic Ocean UK Poland Germany France N Black Sea ItalyItaly Spain GreeceGreece Key eutrophic area hypoxic (dead zone) area Mediterranean Algeria Sea Fig. 3.1 (a) Describe and suggest reasons for the distribution of eutrophic and hypoxic (dead zone) areas of coastal waters shown in Fig. 3.1. [10] (b) Using examples, assess the strategies used to reduce pollution which leads to eutrophic and hypoxic (dead zone) areas of coastal waters. [30] [Total: 40]
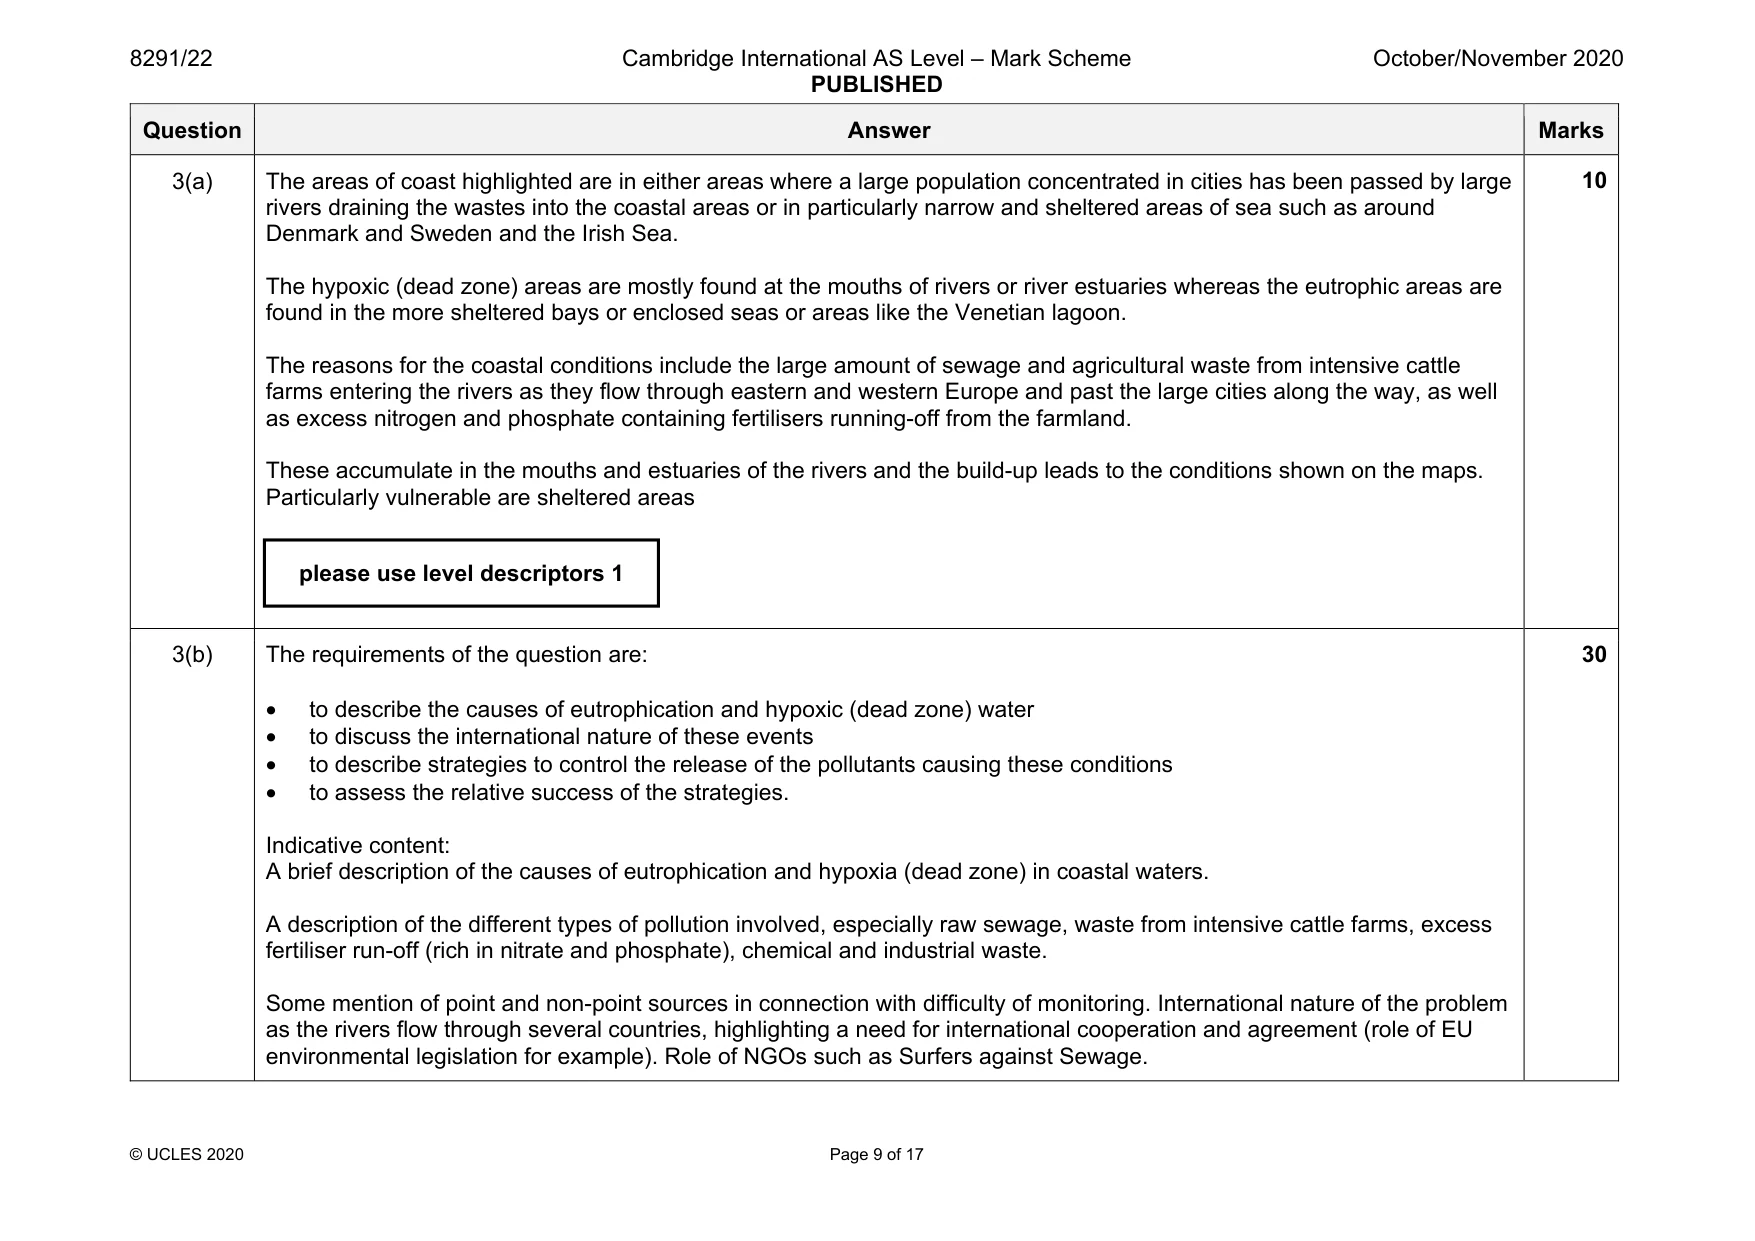
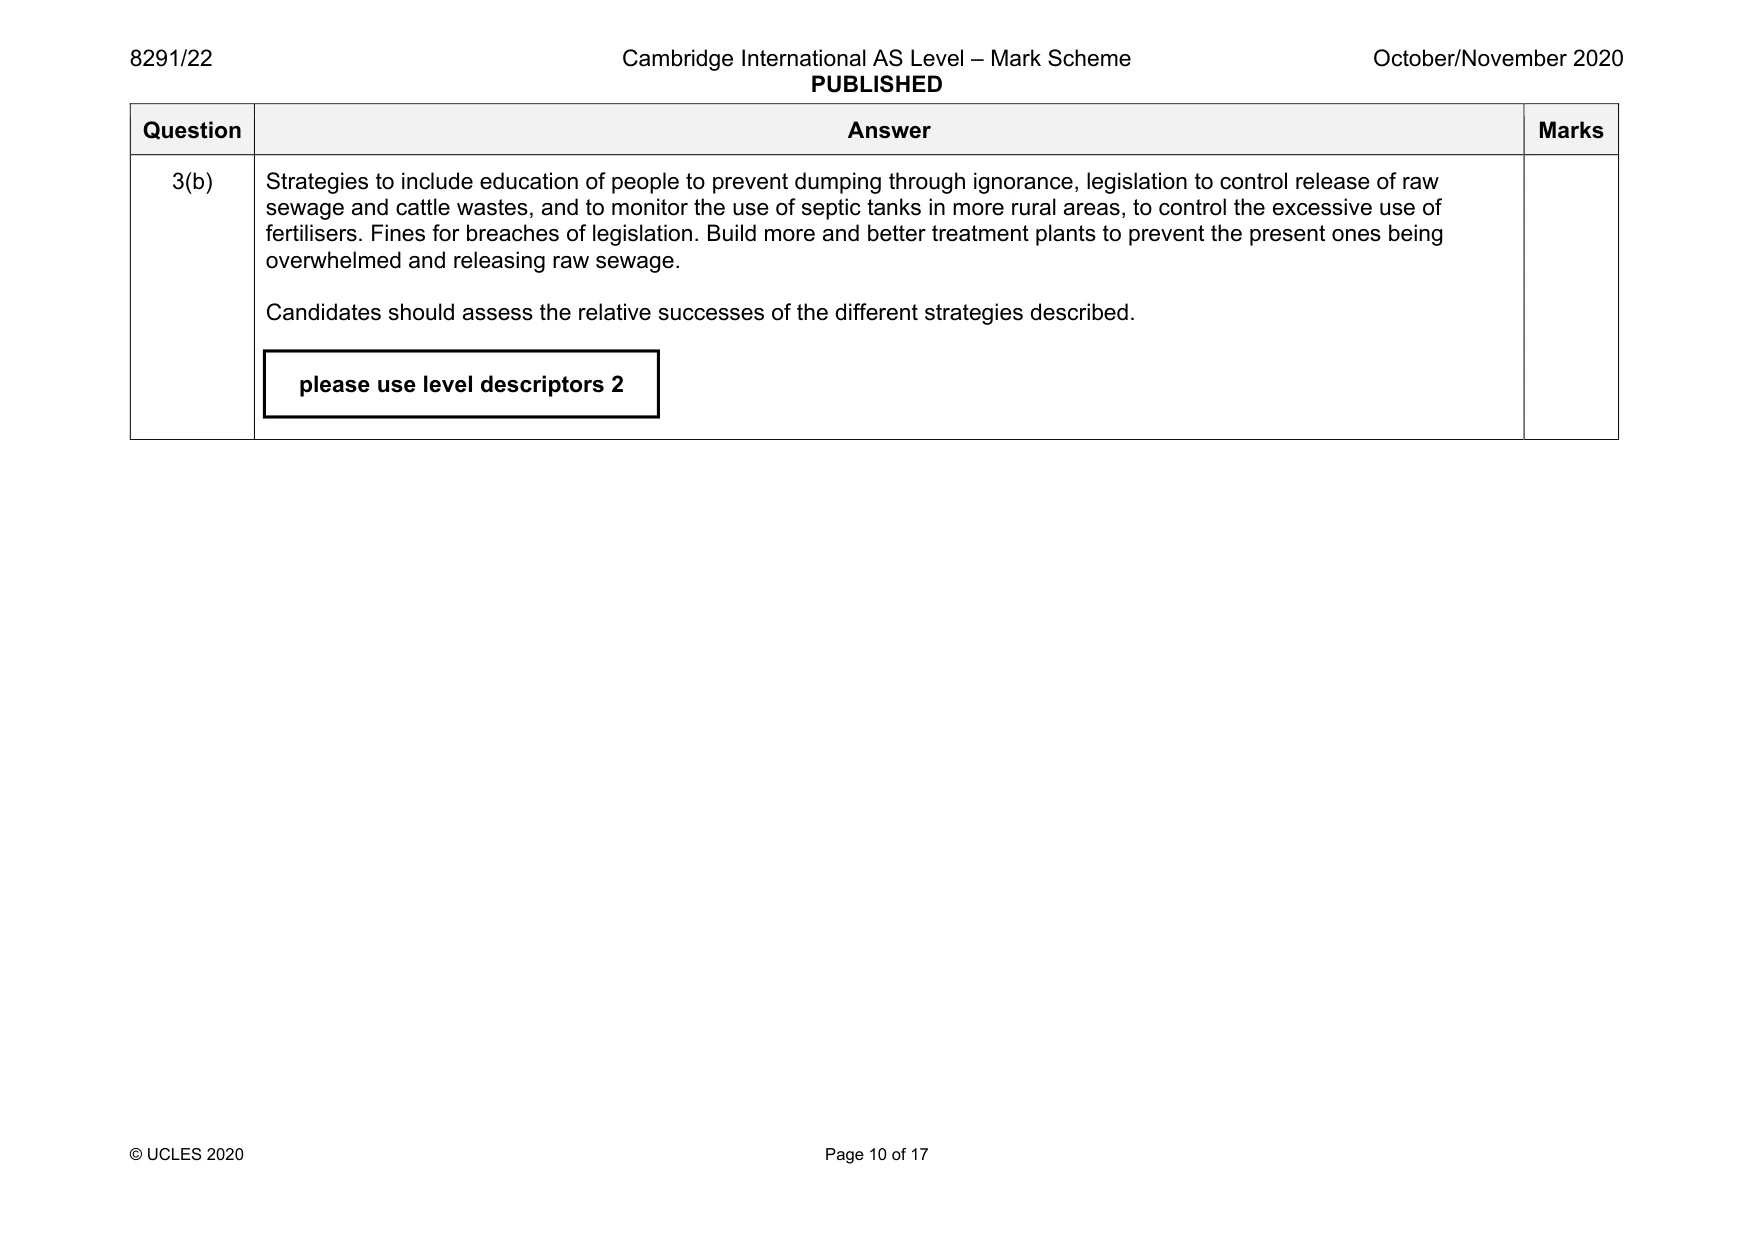
Mark scheme: 3(a) The areas of coast highlighted are in either areas where a large population concentrated in cities has been passed by large rivers draining the wastes into the coastal areas or in particularly narrow and sheltered areas of sea such as around Denmark and Sweden and the Irish Sea. The hypoxic (dead zone) areas are mostly found at the mouths of rivers or river estuaries whereas the eutrophic areas are found in the more sheltered bays or enclosed seas or areas like the Venetian lagoon. The reasons for the coastal conditions include the large amount of sewage and agricultural waste from intensive cattle farms entering the rivers as they flow through eastern and western Europe and past the large cities along the way, as well as excess nitrogen and phosphate containing fertilisers running-off from the farmland. These accumulate in the mouths and estuaries of the rivers and the build-up leads to the conditions shown on the maps. Particularly vulnerable are sheltered areas 3(b) The requirements of the question are: • to describe the causes of eutrophication and hypoxic (dead zone) water • to discuss the international nature of these events • to describe strategies to control the release of the pollutants causing these conditions • to assess the relative success of the strategies. Indicative content: A brief description of the causes of eutrophication and hypoxia (dead zone) in coastal waters. A description of the different types of pollution involved, especially raw sewage, waste from intensive cattle farms, excess fertiliser run-off (rich in nitrate and phosphate), chemical and industrial waste. Some mention of point and non-point sources in connection with difficulty of monitoring. International nature of the problem as the rivers flow through several countries, highlighting a need for international cooperation and agreement (role of EU environmental legislation for example). Role of NGOs such as Surfers against Sewage. 30 please use level descriptors 1 Question Answer Marks 3(b) Strategies to include education of people to prevent dumping through ignorance, legislation to control release of raw sewage and cattle wastes, and to monitor the use of septic tanks in more rural areas, to control the excessive use of fertilisers. Fines for breaches of legislation. Build more and better treatment plants to prevent the present ones being overwhelmed and releasing raw sewage. Candidates should assess the relative successes of the different strategies described. please use level descriptors 2
Q4 · A series of maps showing the extent of the tropical rainforest in Borneo from 1950 to…
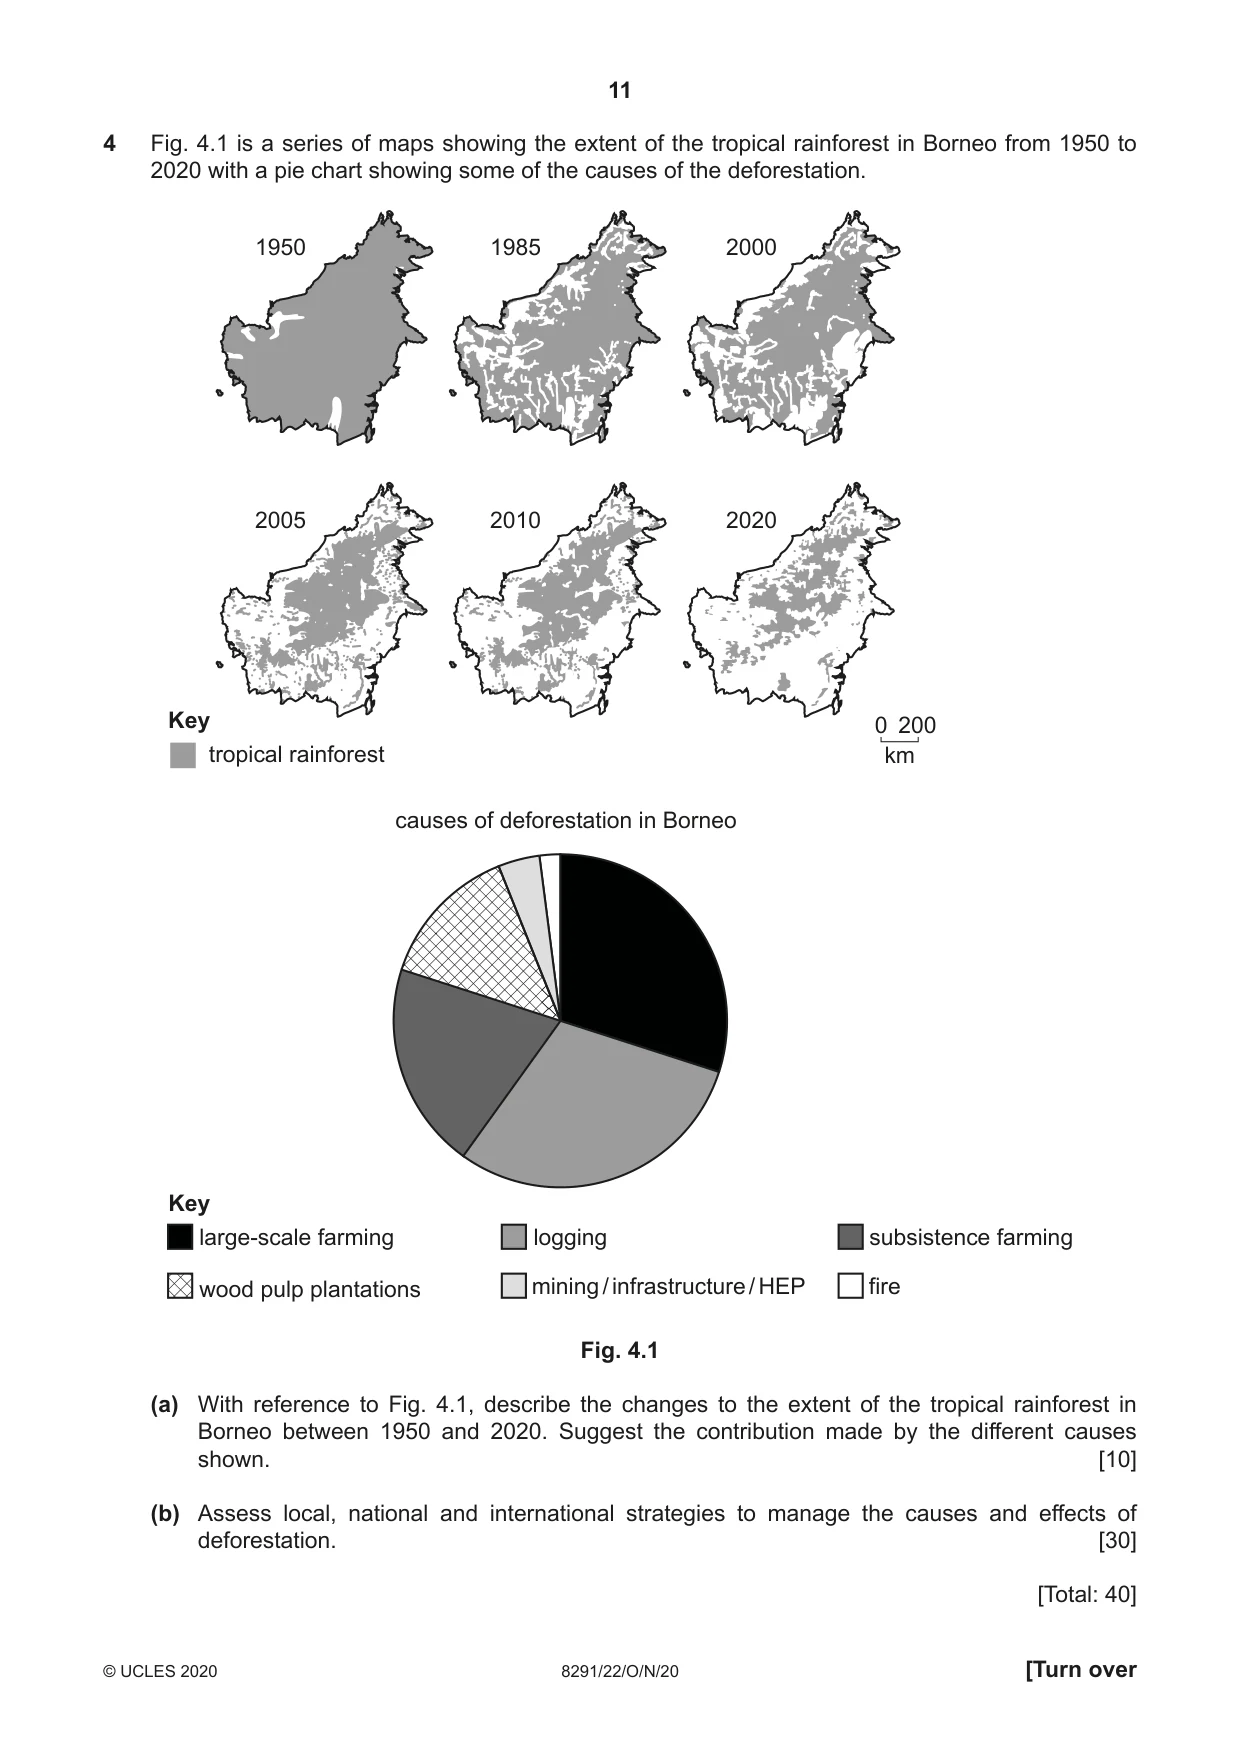
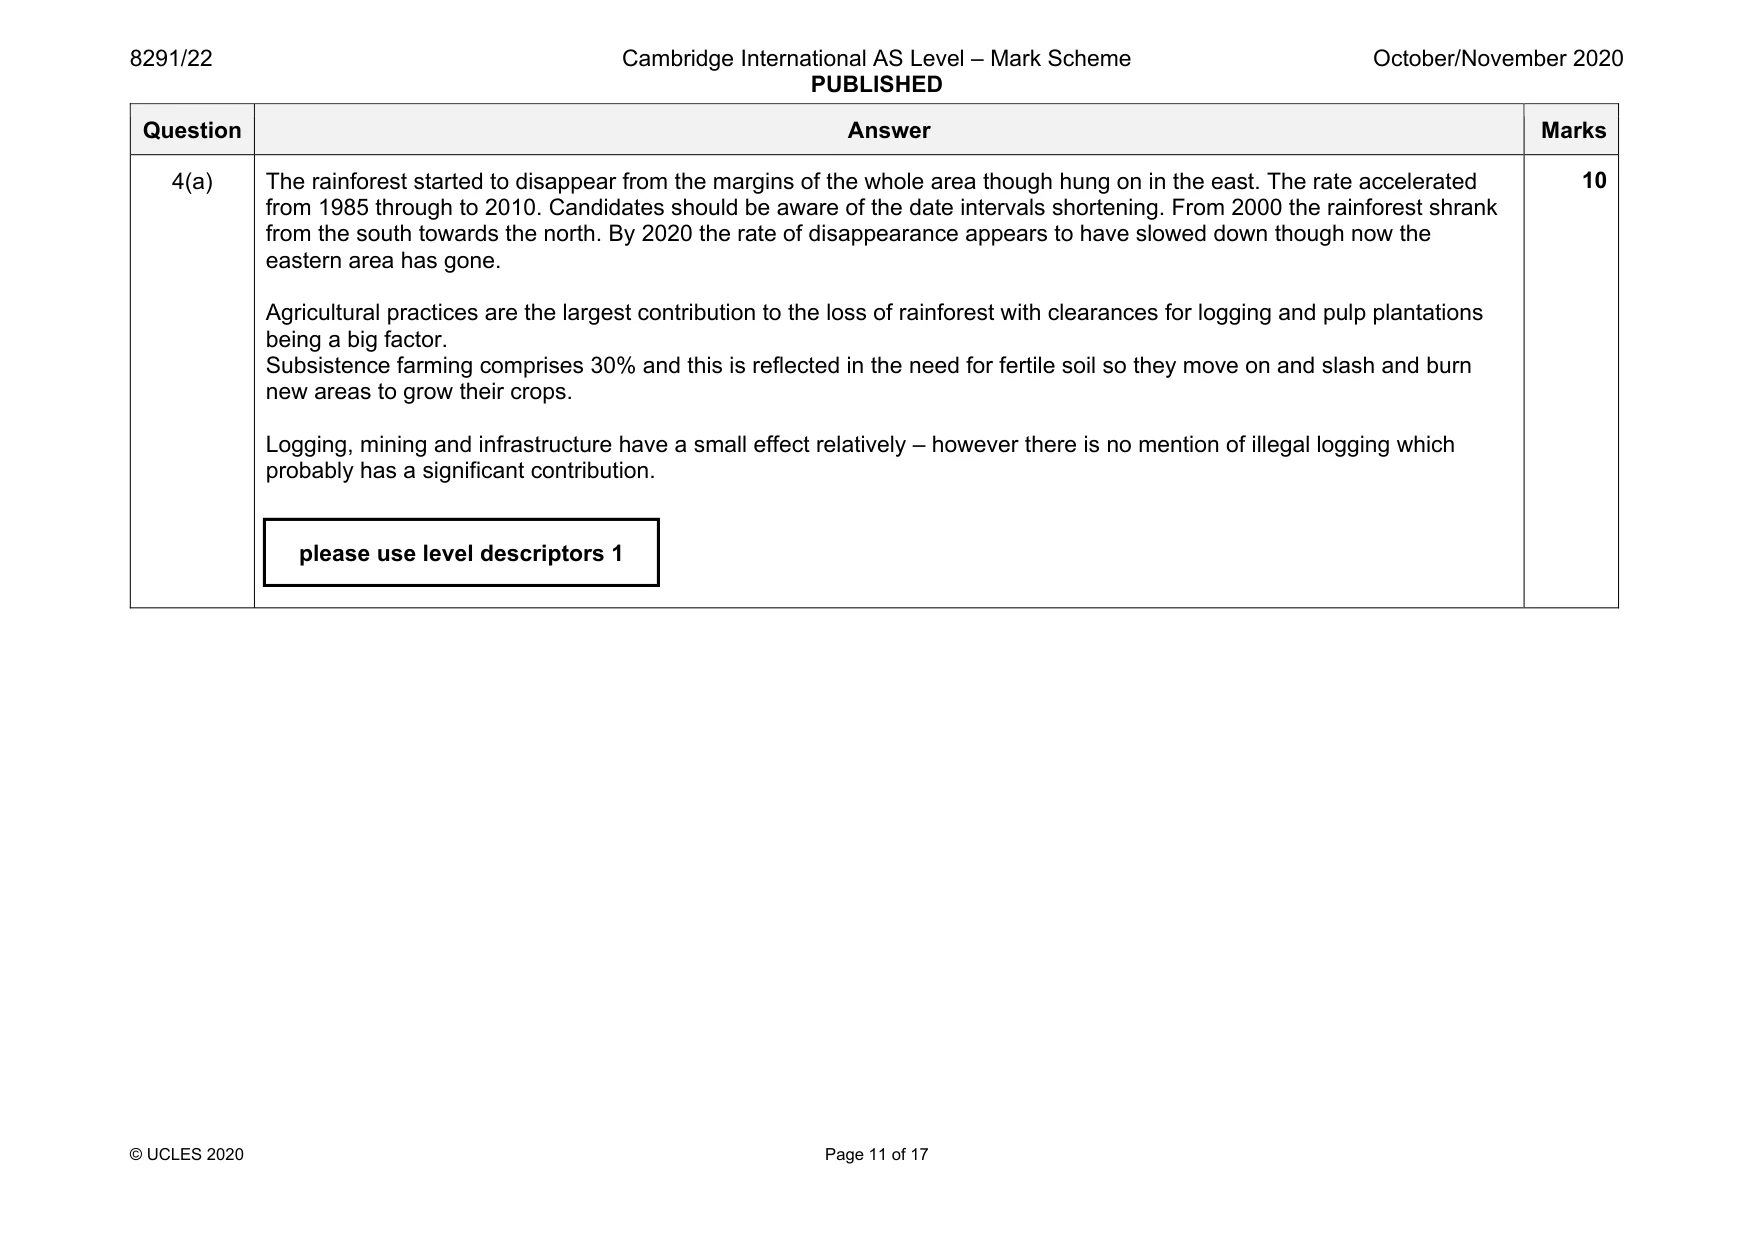
4 Fig. 4.1 is a series of maps showing the extent of the tropical rainforest in Borneo from 1950 to 2020 with a pie chart showing some of the causes of the deforestation. 1950 1985 2000 2005 2010 2020 Key 0 200 tropical rainforest km causes of deforestation in Borneo Key large-scale farming logging subsistence farming wood pulp plantations mining / infrastructure / HEP fire Fig. 4.1 (a) With reference to Fig. 4.1, describe the changes to the extent of the tropical rainforest in Borneo between 1950 and 2020. Suggest the contribution made by the different causes shown. [10] (b) Assess local, national and international strategies to manage the causes and effects of deforestation. [30] [Total: 40]
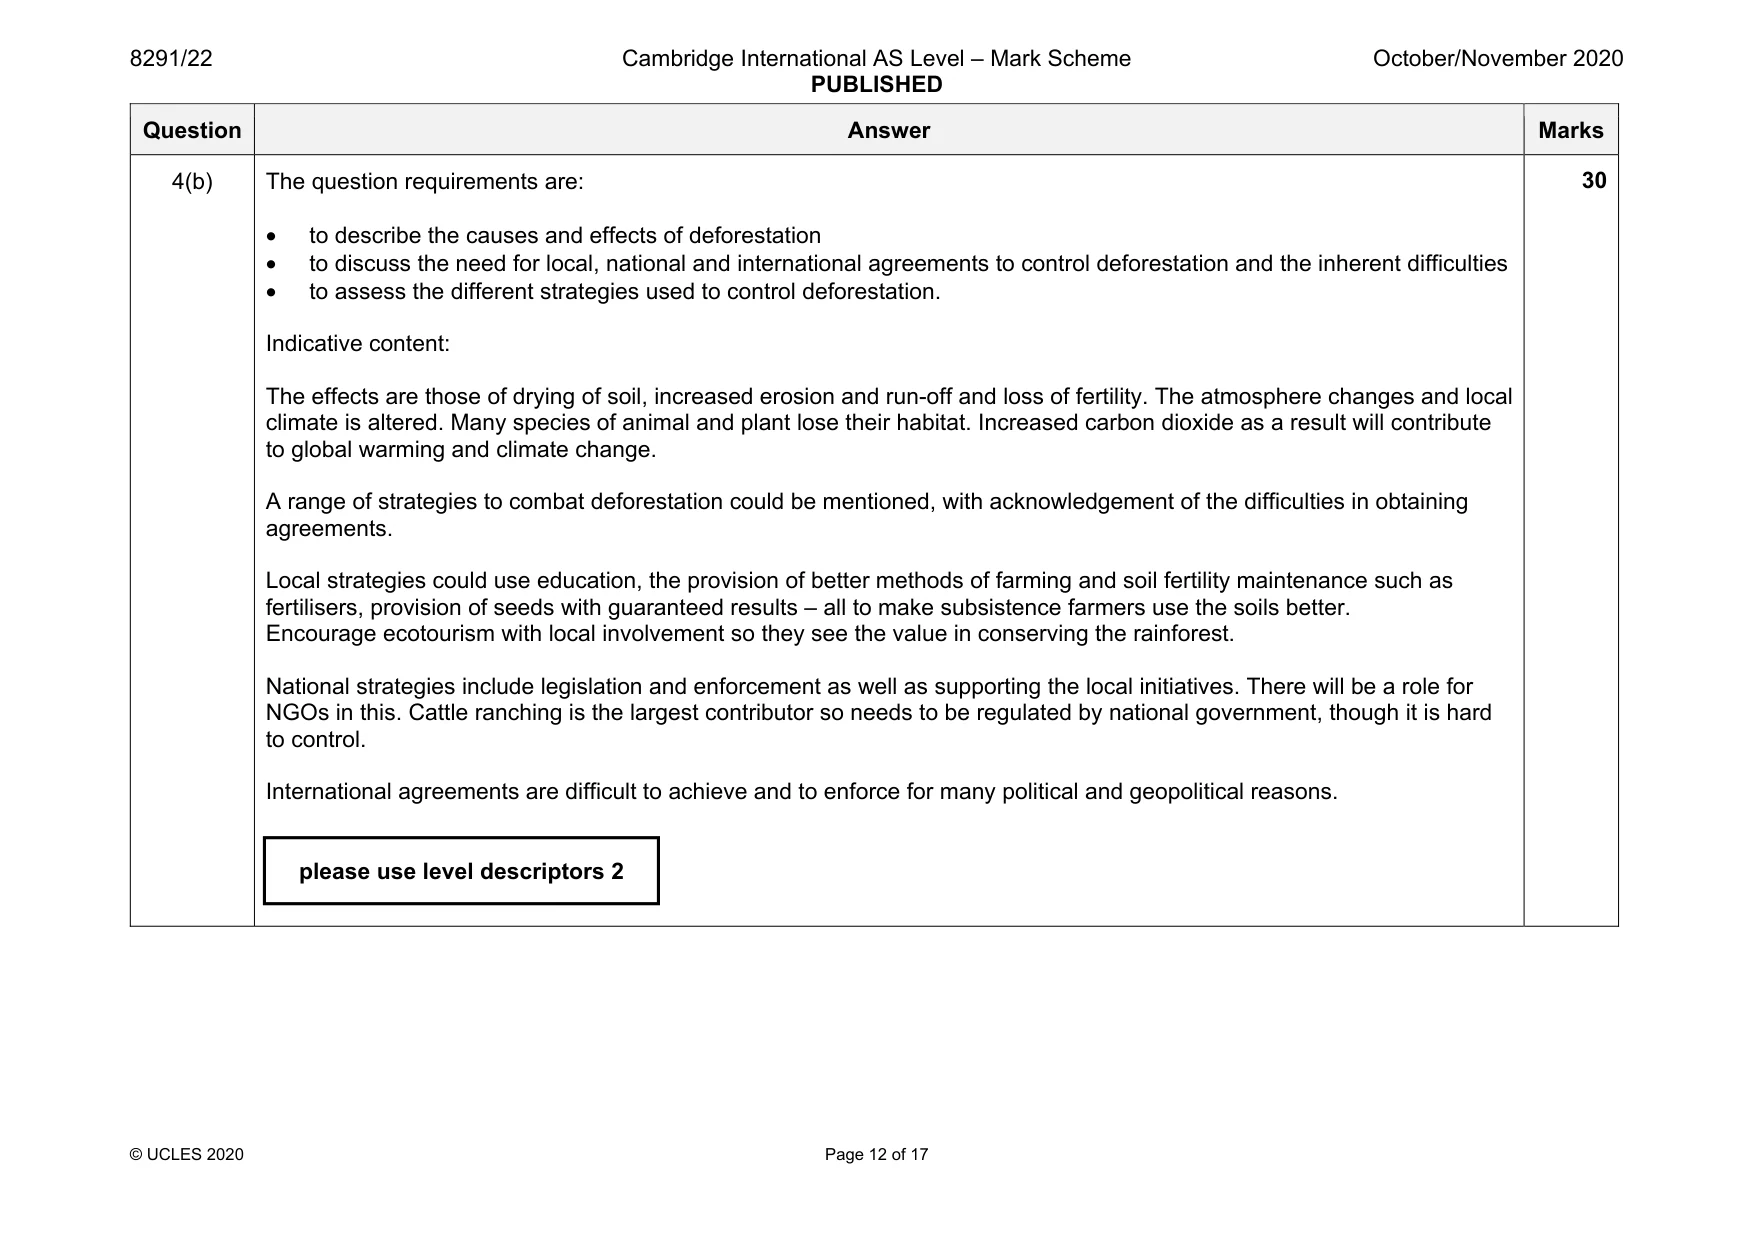
Mark scheme: 4(a) The rainforest started to disappear from the margins of the whole area though hung on in the east. The rate accelerated from 1985 through to 2010. Candidates should be aware of the date intervals shortening. From 2000 the rainforest shrank from the south towards the north. By 2020 the rate of disappearance appears to have slowed down though now the eastern area has gone. Agricultural practices are the largest contribution to the loss of rainforest with clearances for logging and pulp plantations being a big factor. Subsistence farming comprises 30% and this is reflected in the need for fertile soil so they move on and slash and burn new areas to grow their crops. Logging, mining and infrastructure have a small effect relatively – however there is no mention of illegal logging which probably has a significant contribution. please use level descriptors 1 Question Answer Marks 4(b) The question requirements are: • to describe the causes and effects of deforestation • to discuss the need for local, national and international agreements to control deforestation and the inherent difficulties • to assess the different strategies used to control deforestation. Indicative content: The effects are those of drying of soil, increased erosion and run-off and loss of fertility. The atmosphere changes and local climate is altered. Many species of animal and plant lose their habitat. Increased carbon dioxide as a result will contribute to global warming and climate change. A range of strategies to combat deforestation could be mentioned, with acknowledgement of the difficulties in obtaining agreements. Local strategies could use education, the provision of better methods of farming and soil fertility maintenance such as fertilisers, provision of seeds with guaranteed results – all to make subsistence farmers use the soils better. Encourage ecotourism with local involvement so they see the value in conserving the rainforest. National strategies include legislation and enforcement as well as supporting the local initiatives. There will be a role for NGOs in this. Cattle ranching is the largest contributor so needs to be regulated by national government, though it is hard to control. International agreements are difficult to achieve and to enforce for many political and geopolitical reasons. 30 please use level descriptors 2
Q5 · The location of Jordan in the Middle East, and a photograph of the Jordanian Southern…
5 Fig. 5.1 shows the location of Jordan in the Middle East, and a photograph of the Jordanian Southern Desert, an arid area. Jordan is almost totally landlocked having only 25 km of coast and a single port. Content removed due to copyright restrictions. Fig. 5.1 (a) Outline the problems faced by people living in arid countries such as Jordan in providing water for industrial, domestic and agricultural use. [10] (b) Assess the success of methods used to supply water for industrial, domestic and agricultural purposes in countries with contrasting levels of natural water supply. [30] [Total: 40]
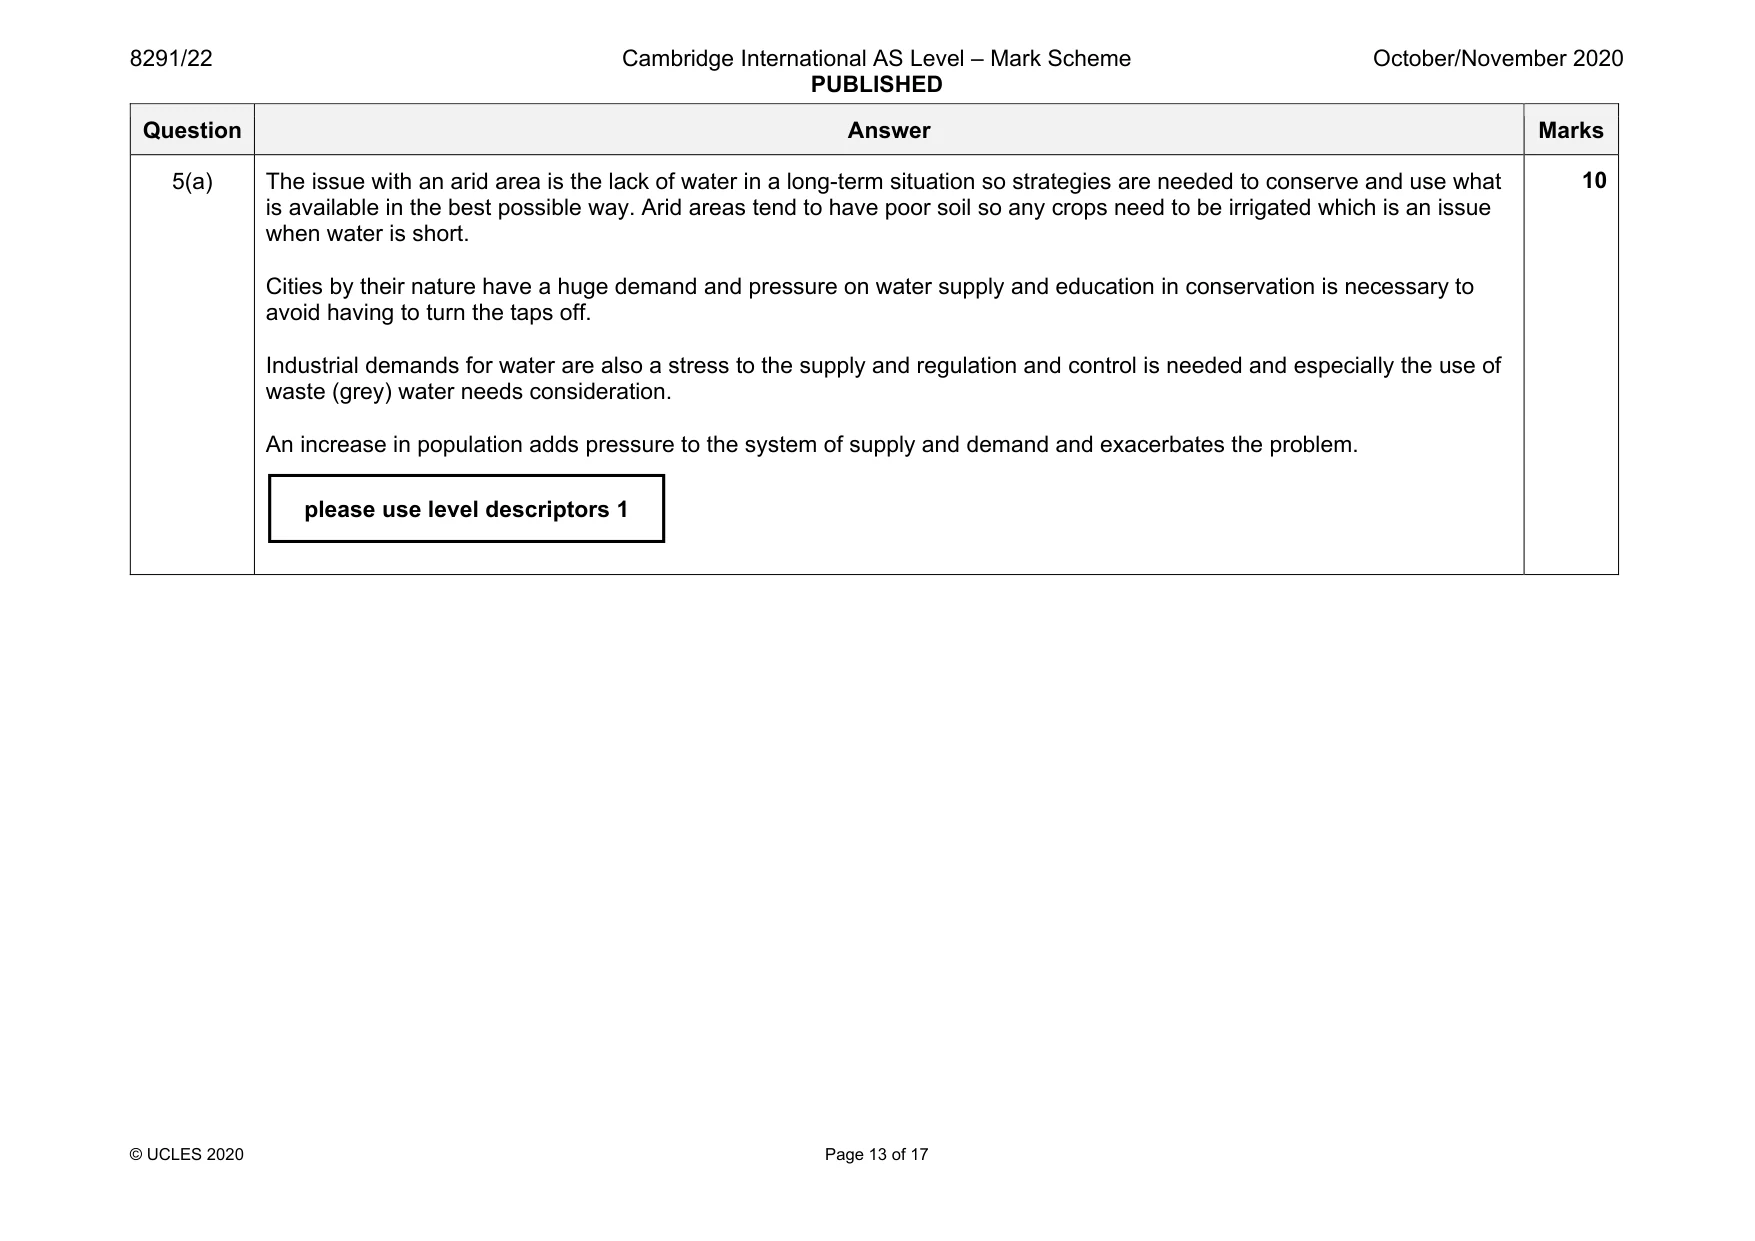
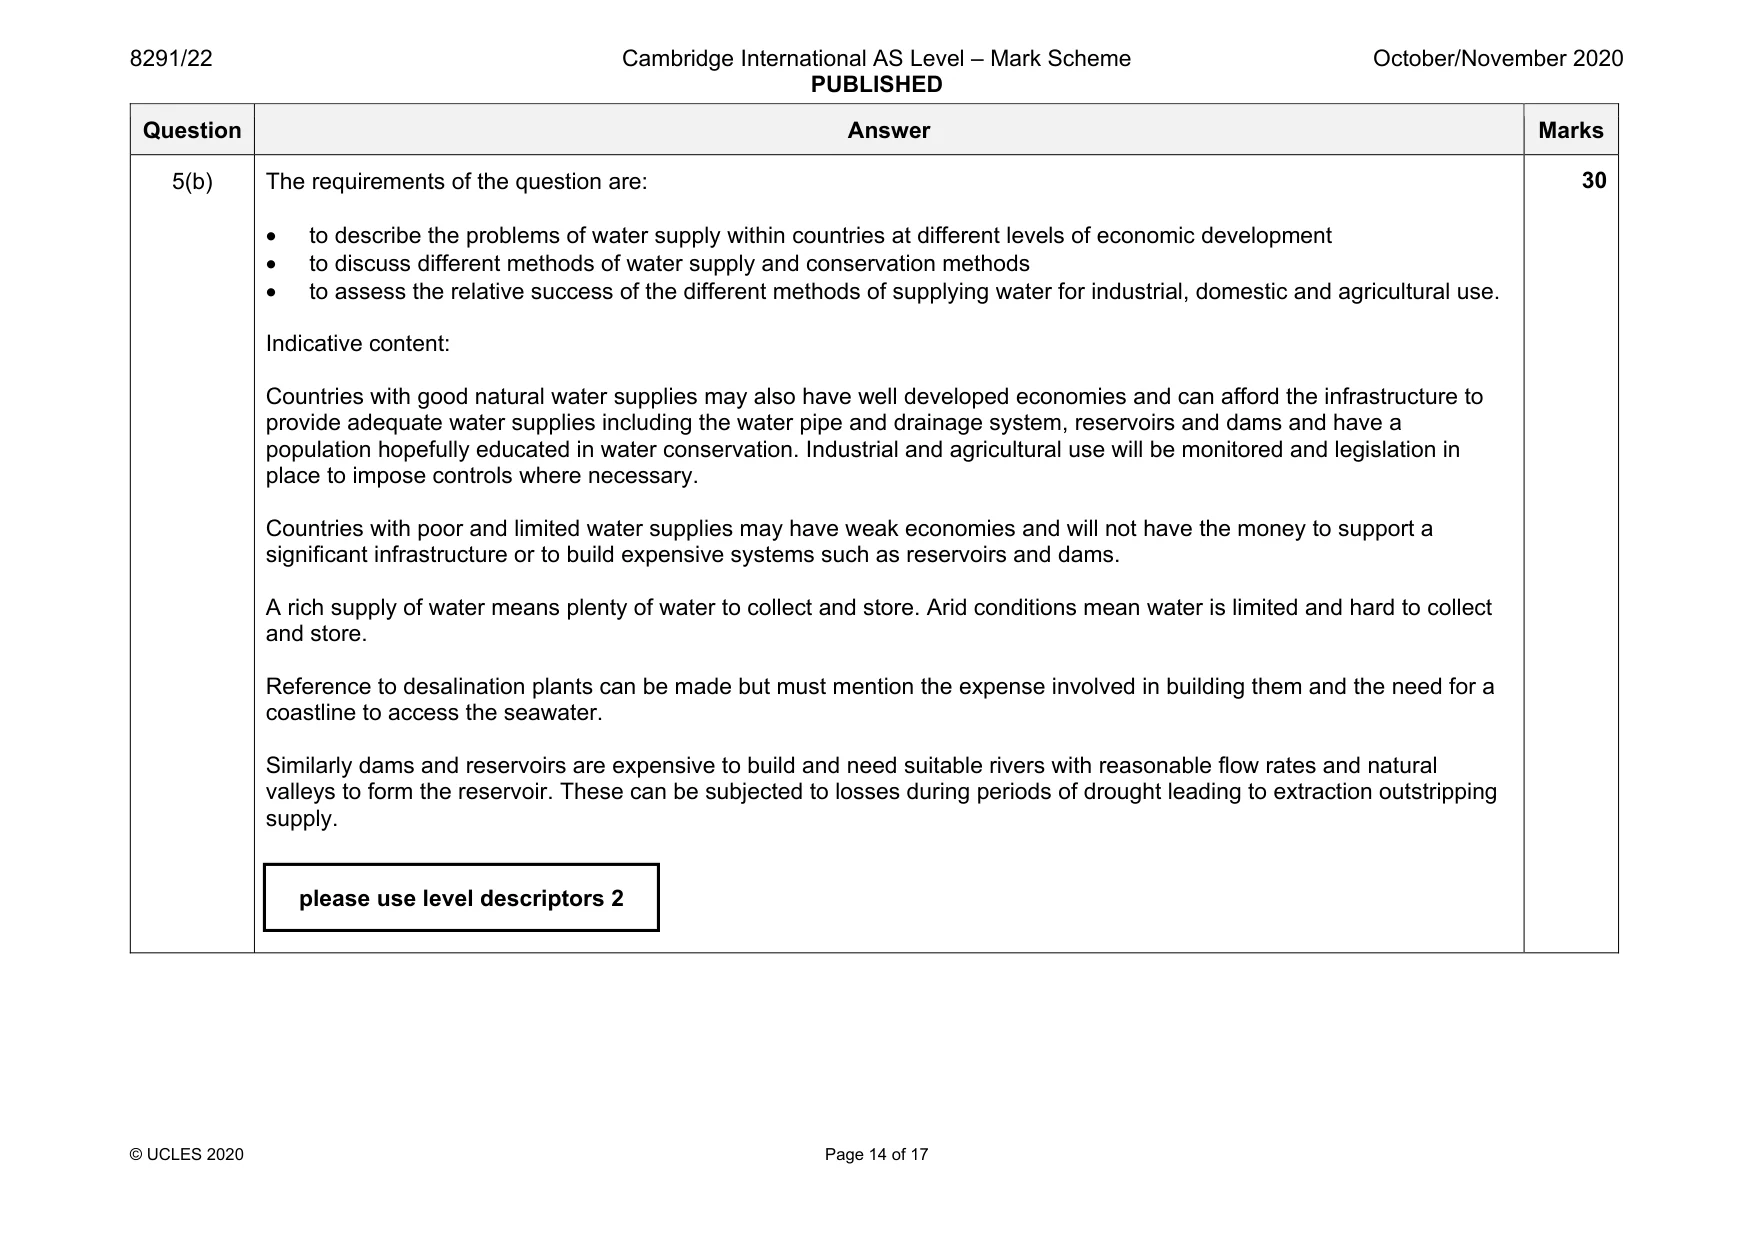
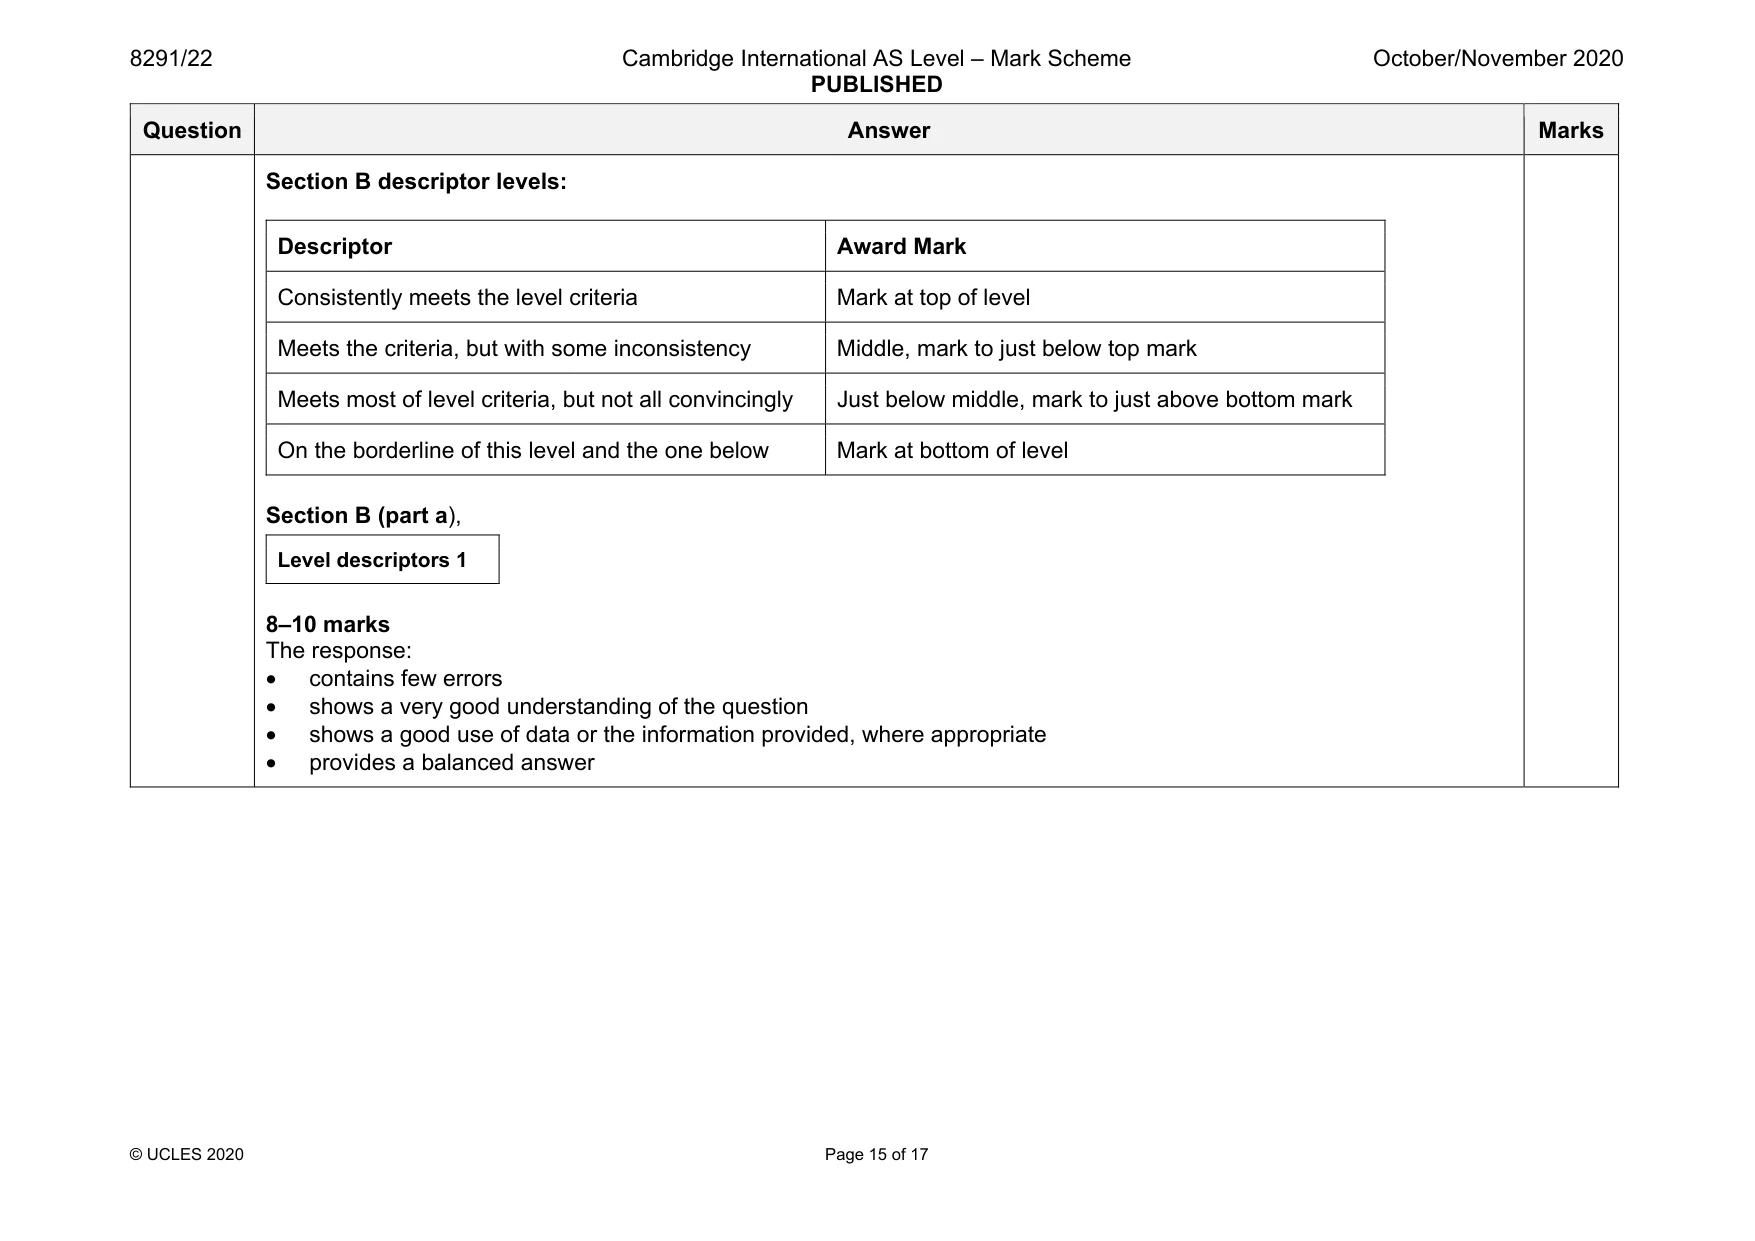
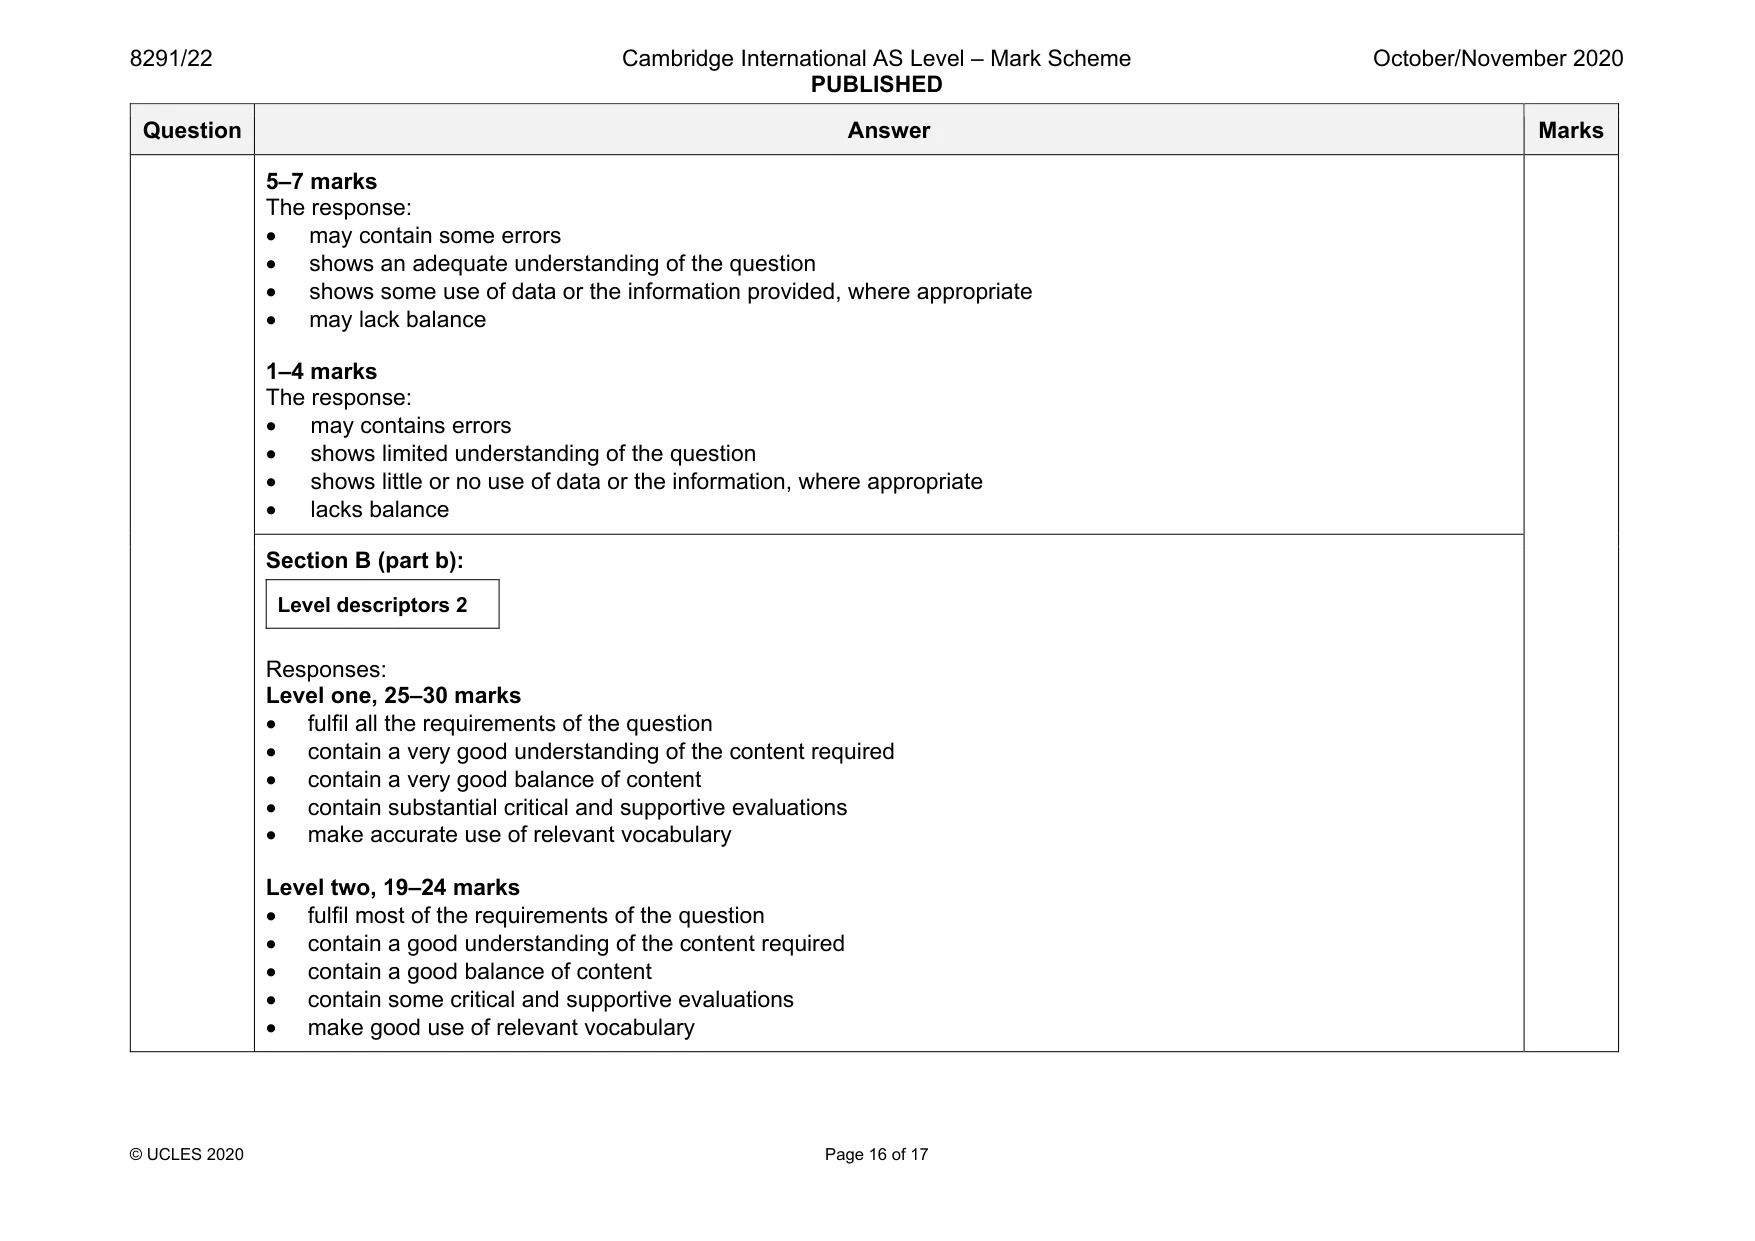
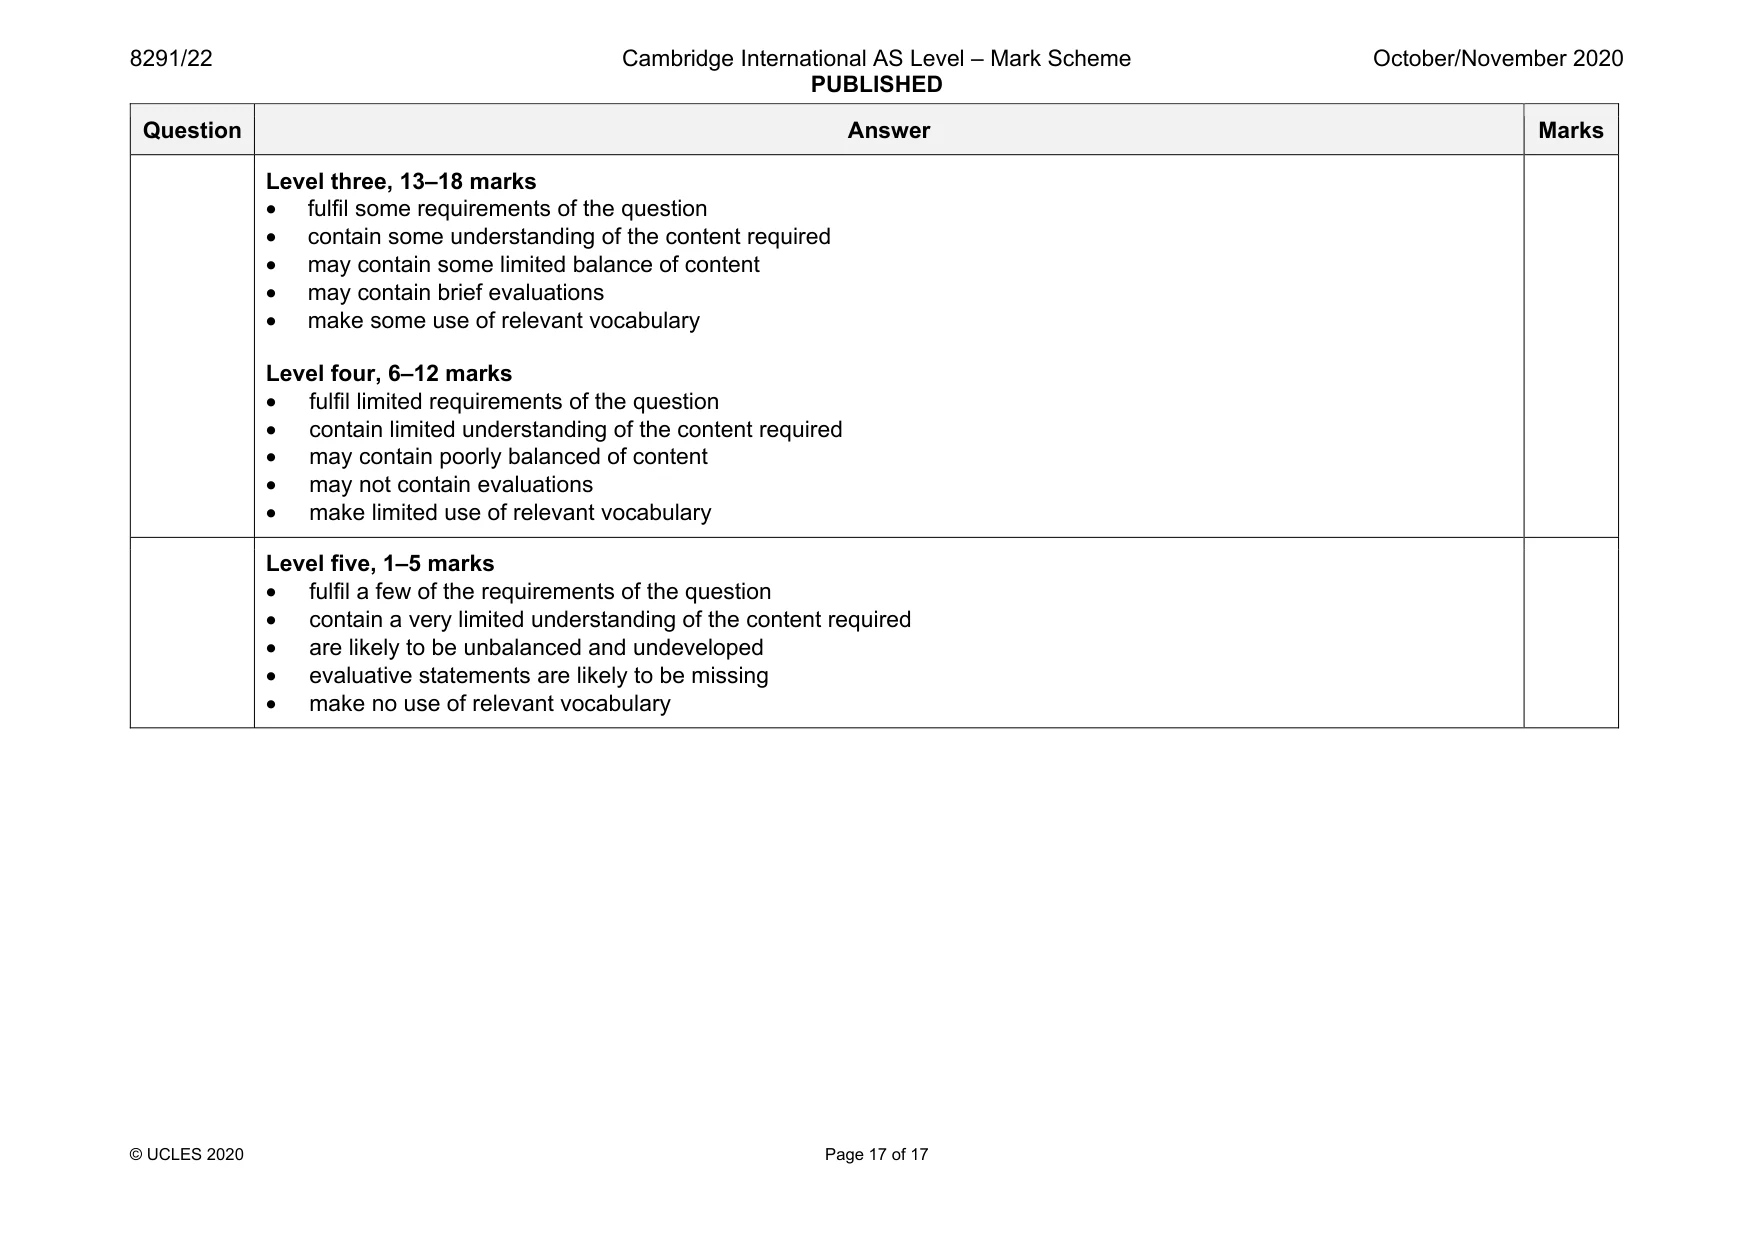
Mark scheme: 5(a) The issue with an arid area is the lack of water in a long-term situation so strategies are needed to conserve and use what is available in the best possible way. Arid areas tend to have poor soil so any crops need to be irrigated which is an issue when water is short. Cities by their nature have a huge demand and pressure on water supply and education in conservation is necessary to avoid having to turn the taps off. Industrial demands for water are also a stress to the supply and regulation and control is needed and especially the use of waste (grey) water needs consideration. An increase in population adds pressure to the system of supply and demand and exacerbates the problem. please use level descriptors 1 Question Answer Marks 5(b) The requirements of the question are: • to describe the problems of water supply within countries at different levels of economic development • to discuss different methods of water supply and conservation methods • to assess the relative success of the different methods of supplying water for industrial, domestic and agricultural use. Indicative content: Countries with good natural water supplies may also have well developed economies and can afford the infrastructure to provide adequate water supplies including the water pipe and drainage system, reservoirs and dams and have a population hopefully educated in water conservation. Industrial and agricultural use will be monitored and legislation in place to impose controls where necessary. Countries with poor and limited water supplies may have weak economies and will not have the money to support a significant infrastructure or to build expensive systems such as reservoirs and dams. A rich supply of water means plenty of water to collect and store. Arid conditions mean water is limited and hard to collect and store. Reference to desalination plants can be made but must mention the expense involved in building them and the need for a coastline to access the seawater. Similarly dams and reservoirs are expensive to build and need suitable rivers with reasonable flow rates and natural valleys to form the reservoir. These can be subjected to losses during periods of drought leading to extraction outstripping supply. 30 please use level descriptors 2 Question Answer Marks Section B descriptor levels: Descriptor Award Mark Consistently meets the level criteria Mark at top of level Meets the criteria, but with some inconsistency Middle, mark to just below top mark Meets most of level criteria, but not all convincingly Just below middle, mark to just above bottom mark On the borderline of this level and the one below Mark at bottom of level Section B (part a), Level descriptors 1 8–10 marks The response: • contains few errors • shows a very good understanding of the question • shows a good use of data or the information provided, where appropriate • provides a balanced answer Question Answer Marks 5–7 marks The response: • may contain some errors • shows an adequate understanding of the question • shows some use of data or the information provided, where appropriate • may lack balance 1–4 marks The response: • may contains errors • shows limited understanding of the question • shows little or no use of data or the information, where appropriate • lacks balance Section B (part b): Level descriptors 2 Responses: Level one, 25–30 marks • fulfil all the requirements of the question • contain a very good understanding of the content required • contain a very good balance of content • contain substantial critical and supportive evaluations • make accurate use of relevant vocabulary Level two, 19–24 marks • fulfil most of the requirements of the question • contain a good understanding of the content required • contain a good balance of content • contain some critical and supportive evaluations • make good use of relevant vocabulary Question Answer Marks Level three, 13–18 marks • fulfil some requirements of the question • contain some understanding of the content required • may contain some limited balance of content • may contain brief evaluations • make some use of relevant vocabulary Level four, 6–12 marks • fulfil limited requirements of the question • contain limited understanding of the content required • may contain poorly balanced of content • may not contain evaluations • make limited use of relevant vocabulary Level five, 1–5 marks • fulfil a few of the requirements of the question • contain a very limited understanding of the content required • are likely to be unbalanced and undeveloped • evaluative statements are likely to be missing • make no use of relevant vocabulary
What was in this paper
The subtopics covered by these 5 questions, and how many questions each got. Open one in a new tab to see every Cambridge question on it.
What you needed in this session
Cambridge’s own grade thresholds for 2020 Oct/Nov, Paper 2 · Variant 2. A higher threshold means an easier paper — the bar moves with how the cohort did.