Cambridge A Level Environmental Management (AS only) 8291 — 2019 Oct/Nov Paper 2 · Variant 2
8291/22/O/N/19 · 5 questions · 80 marks · ≈90 min
The question paper and its mark scheme, free to read here and free to download. This is Cambridge’s own paper, exactly as it was sat.
Question paper12 pages
Mark scheme15 pages
Answers below. Sit the paper first if you are practising.
Questions as text
Q1 · A diagram showing energy flow through an ecosystem
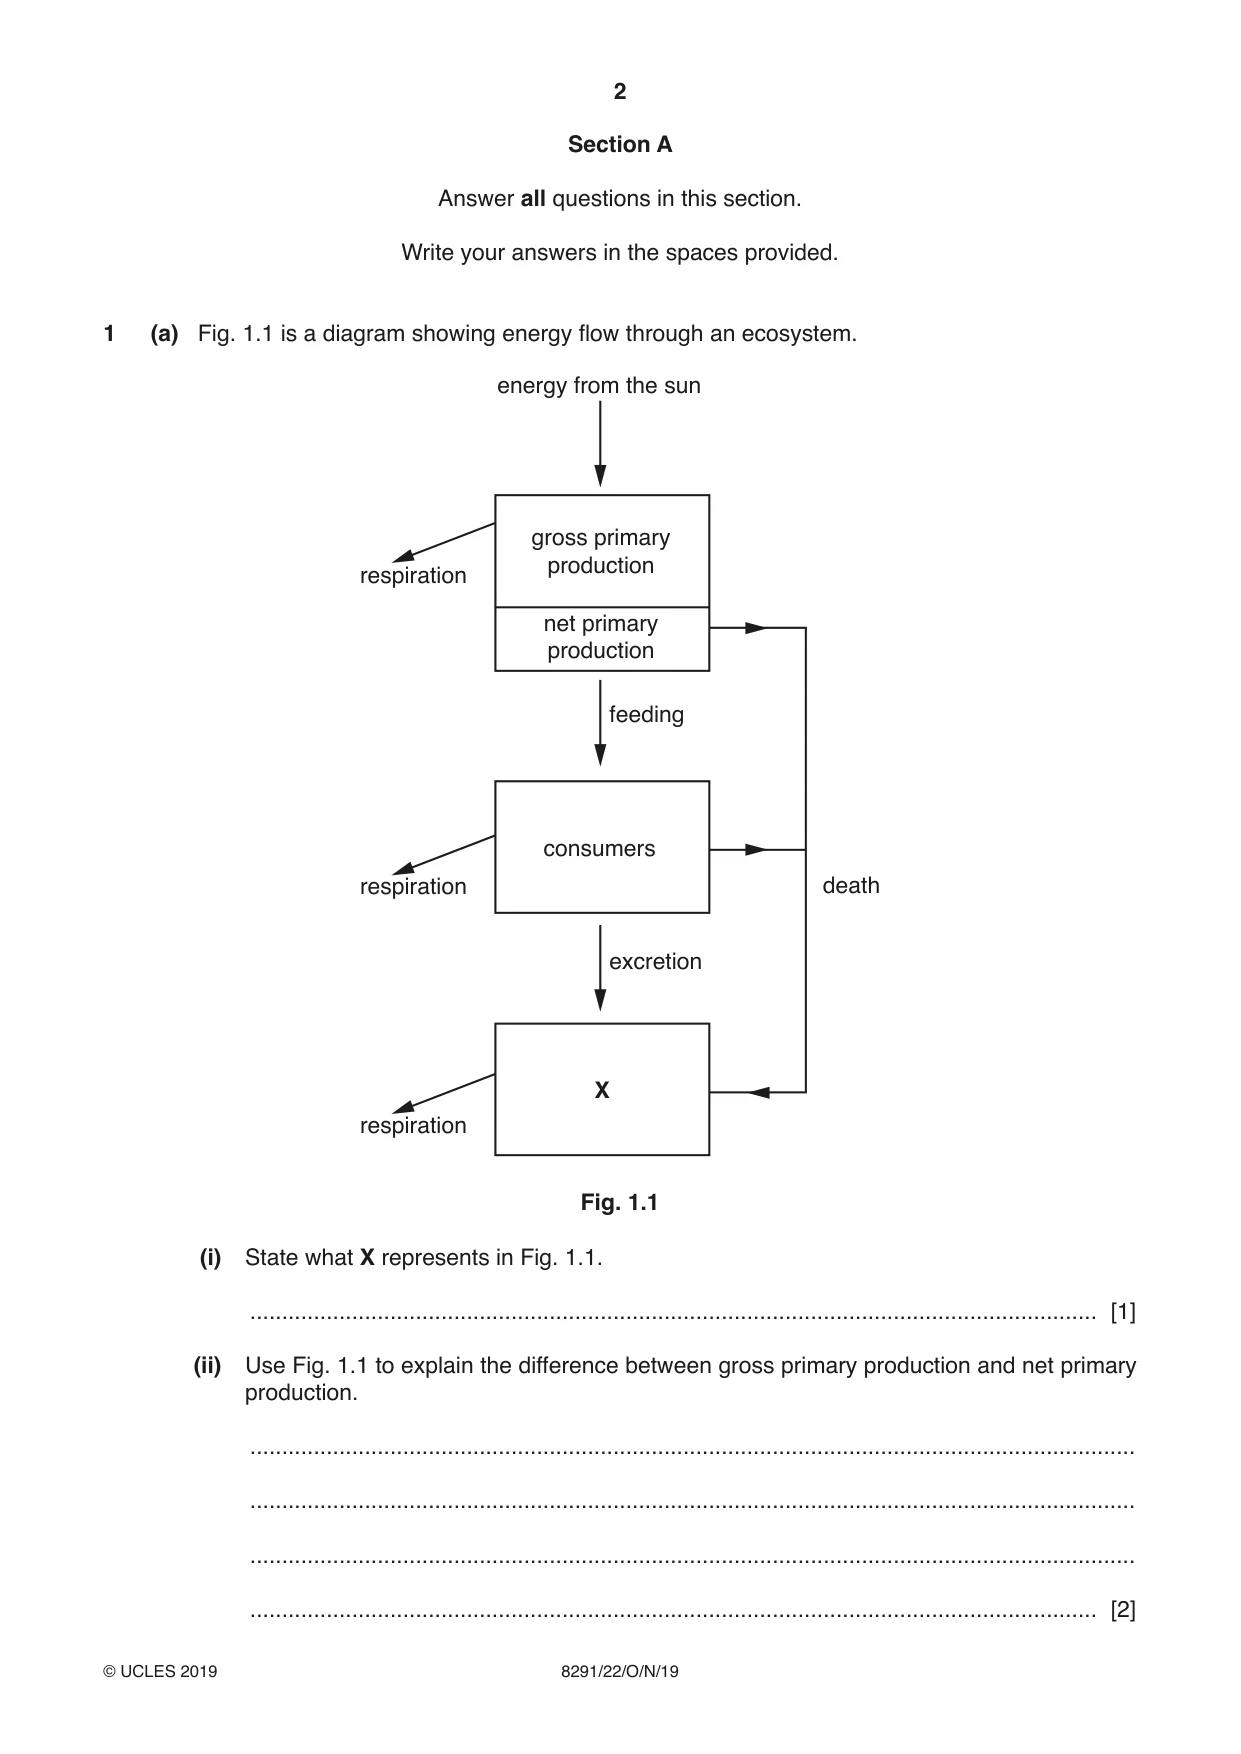
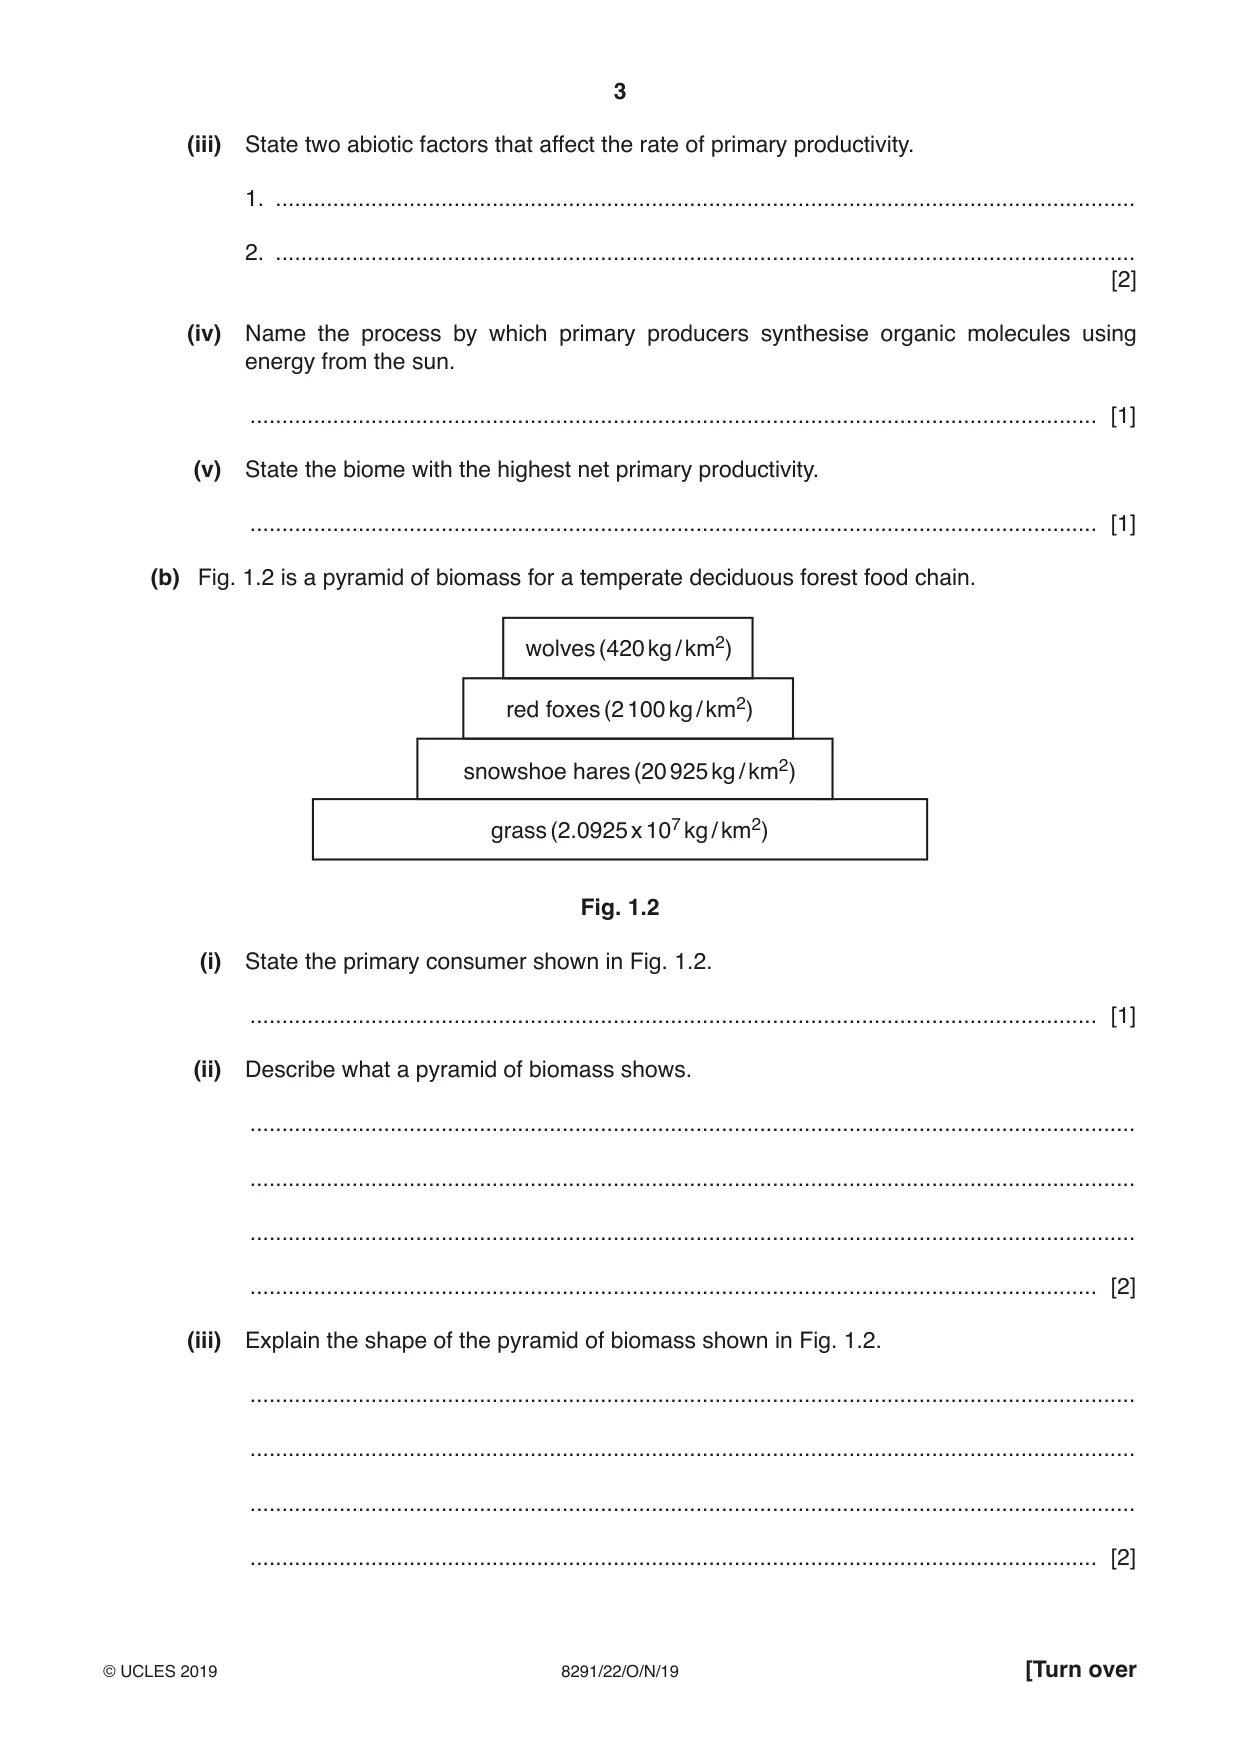
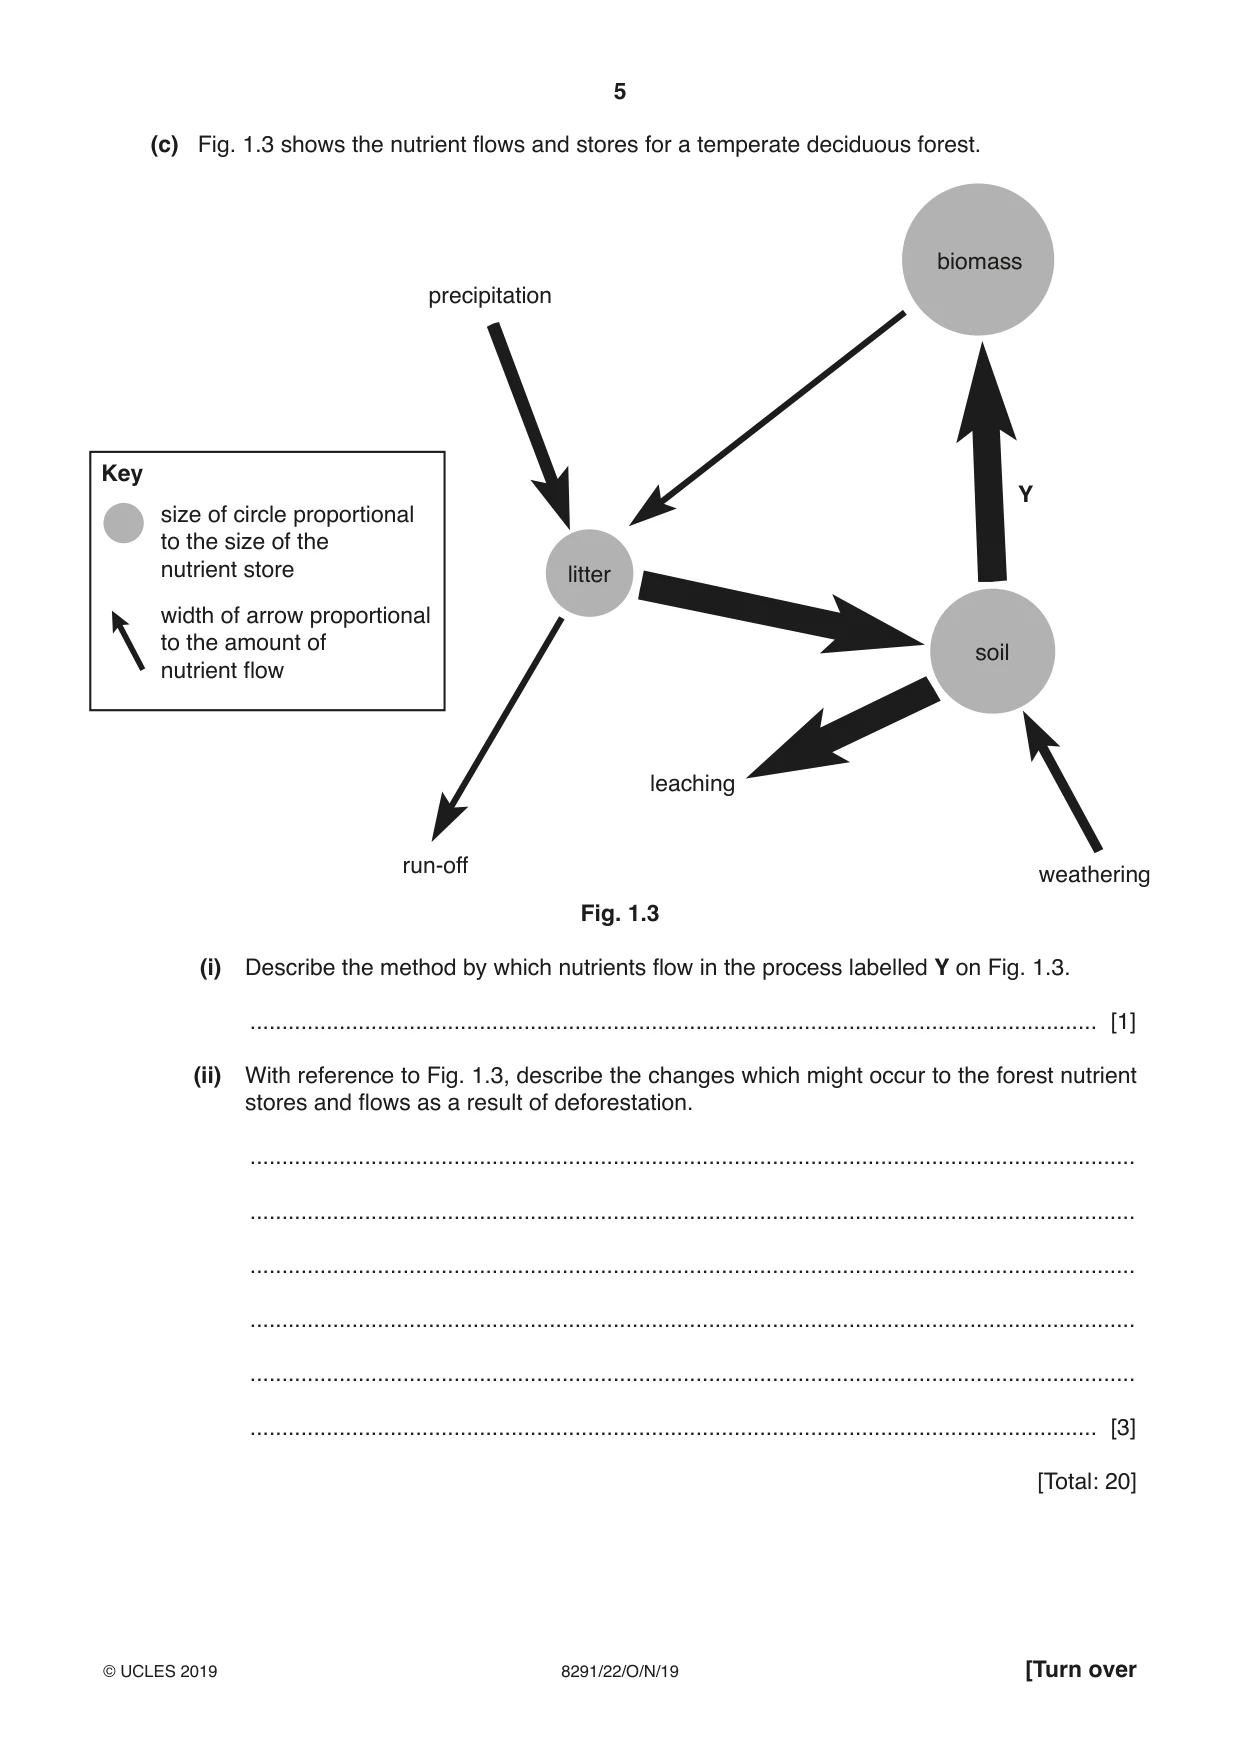
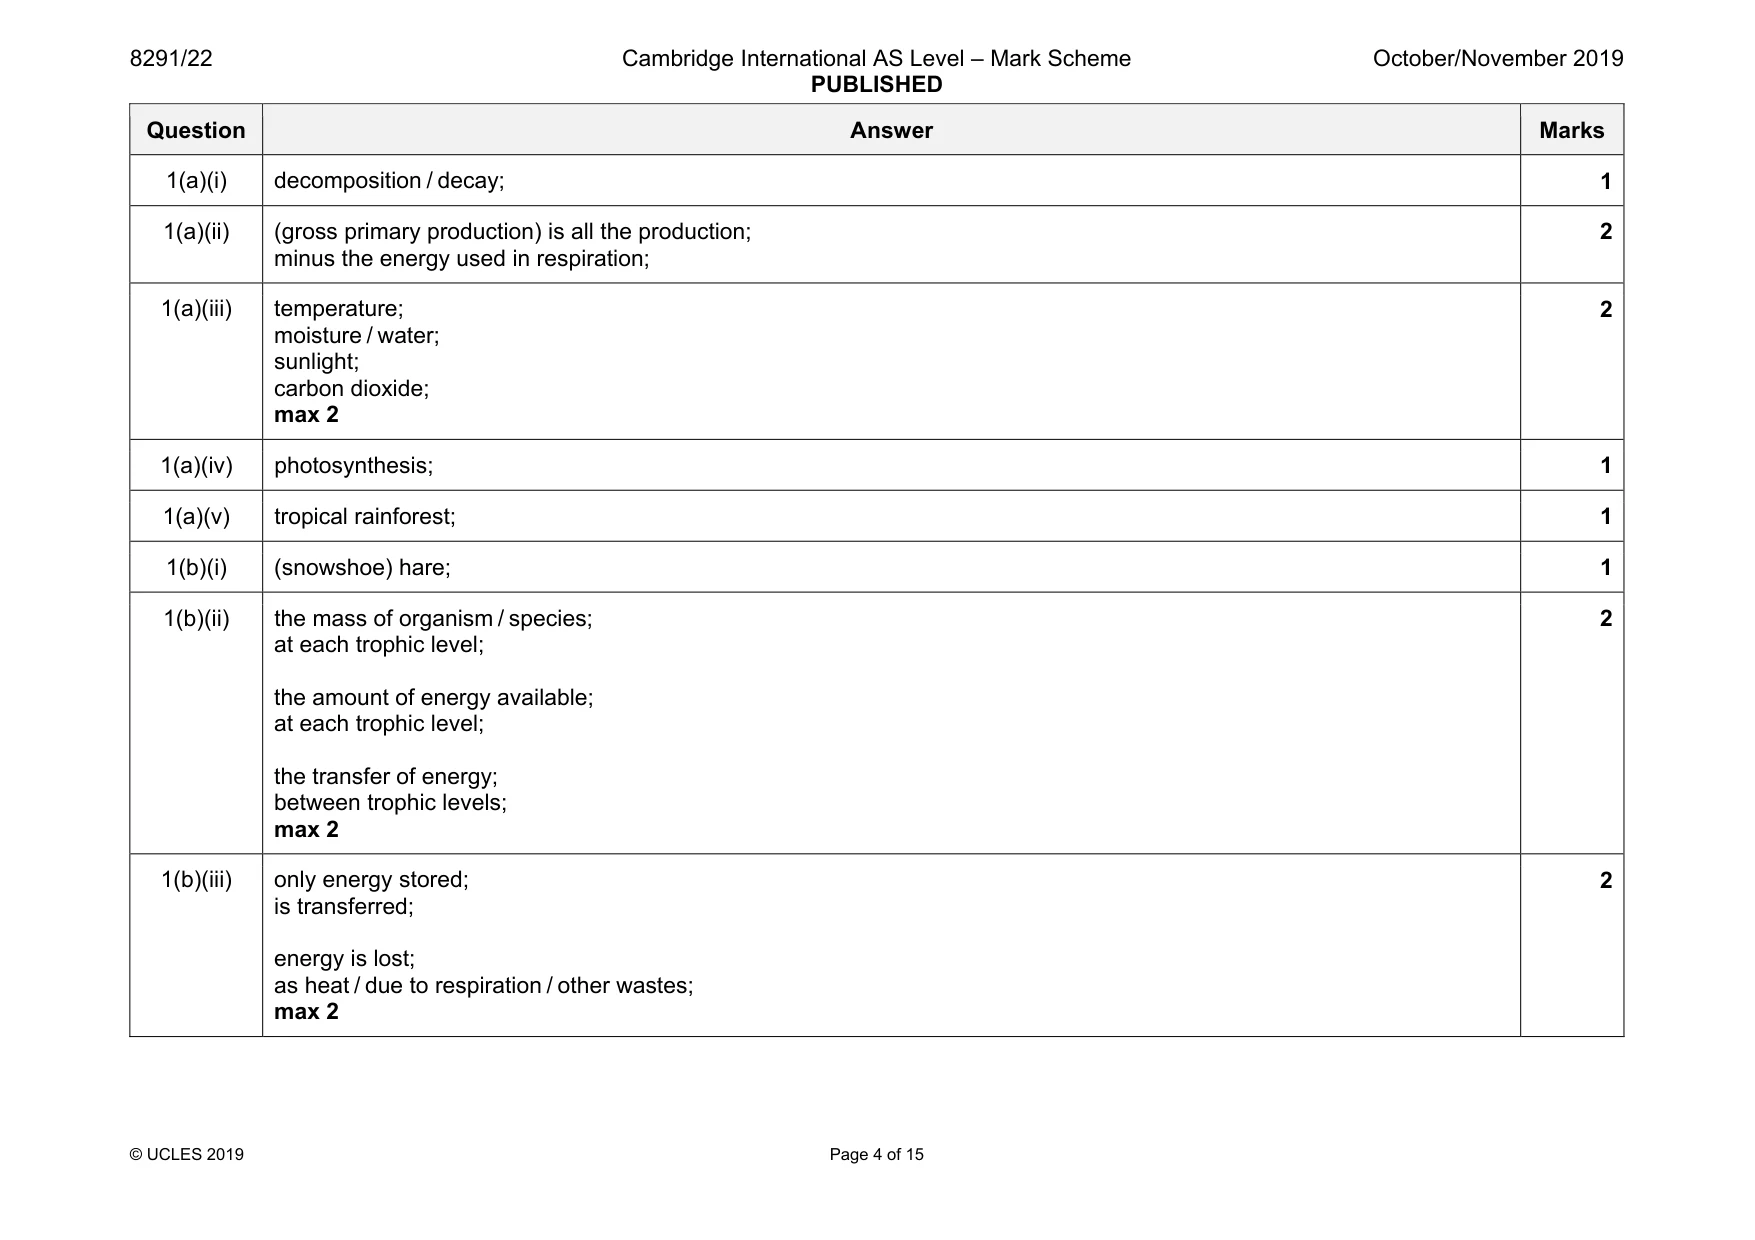
1 (a) Fig. 1.1 is a diagram showing energy flow through an ecosystem. energy from the sun gross primary production respiration net primary production feeding consumers respiration death excretion X respiration Fig. 1.1 (i) State what X represents in Fig. 1.1. ..................................................................................................................................... [1] (ii) Use Fig. 1.1 to explain the difference between gross primary production and net primary production. ........................................................................................................................................... ........................................................................................................................................... ........................................................................................................................................... ..................................................................................................................................... [2] (iii) State two abiotic factors that affect the rate of primary productivity. 1. ....................................................................................................................................... 2. ....................................................................................................................................... [2] (iv) Name the process by which primary producers synthesise organic molecules using energy from the sun. ..................................................................................................................................... [1] (v) State the biome with the highest net primary productivity. ..................................................................................................................................... [1] (b) Fig. 1.2 is a pyramid of biomass for a temperate deciduous forest food chain. wolves (420 kg / km2) red foxes (2 100 kg / km2) snowshoe hares (20 925 kg / km2) grass (2.0925 x 10⁷ kg / km2) Fig. 1.2 (i) State the primary consumer shown in Fig. 1.2. ..................................................................................................................................... [1] (ii) Describe what a pyramid of biomass shows. ........................................................................................................................................... ........................................................................................................................................... ........................................................................................................................................... ..................................................................................................................................... [2] (iii) Explain the shape of the pyramid of biomass shown in Fig. 1.2. ........................................................................................................................................... ........................................................................................................................................... ........................................................................................................................................... ..................................................................................................................................... [2] (iv) If the population of wolves decreased, state and explain two changes that could occur in the food chain shown in Fig. 1.2. ........................................................................................................................................... ........................................................................................................................................... ........................................................................................................................................... ........................................................................................................................................... ........................................................................................................................................... ........................................................................................................................................... ........................................................................................................................................... ..................................................................................................................................... [4] (c) Fig. 1.3 shows the nutrient flows and stores for a temperate deciduous forest. biomass precipitation Key Y size of circle proportional to the size of the nutrient store litter width of arrow proportional to the amount of soil nutrient flow leaching run-off weathering Fig. 1.3 (i) Describe the method by which nutrients flow in the process labelled Y on Fig. 1.3. ..................................................................................................................................... [1] (ii) With reference to Fig. 1.3, describe the changes which might occur to the forest nutrient stores and flows as a result of deforestation. ........................................................................................................................................... ........................................................................................................................................... ........................................................................................................................................... ........................................................................................................................................... ........................................................................................................................................... ..................................................................................................................................... [3] [Total: 20]
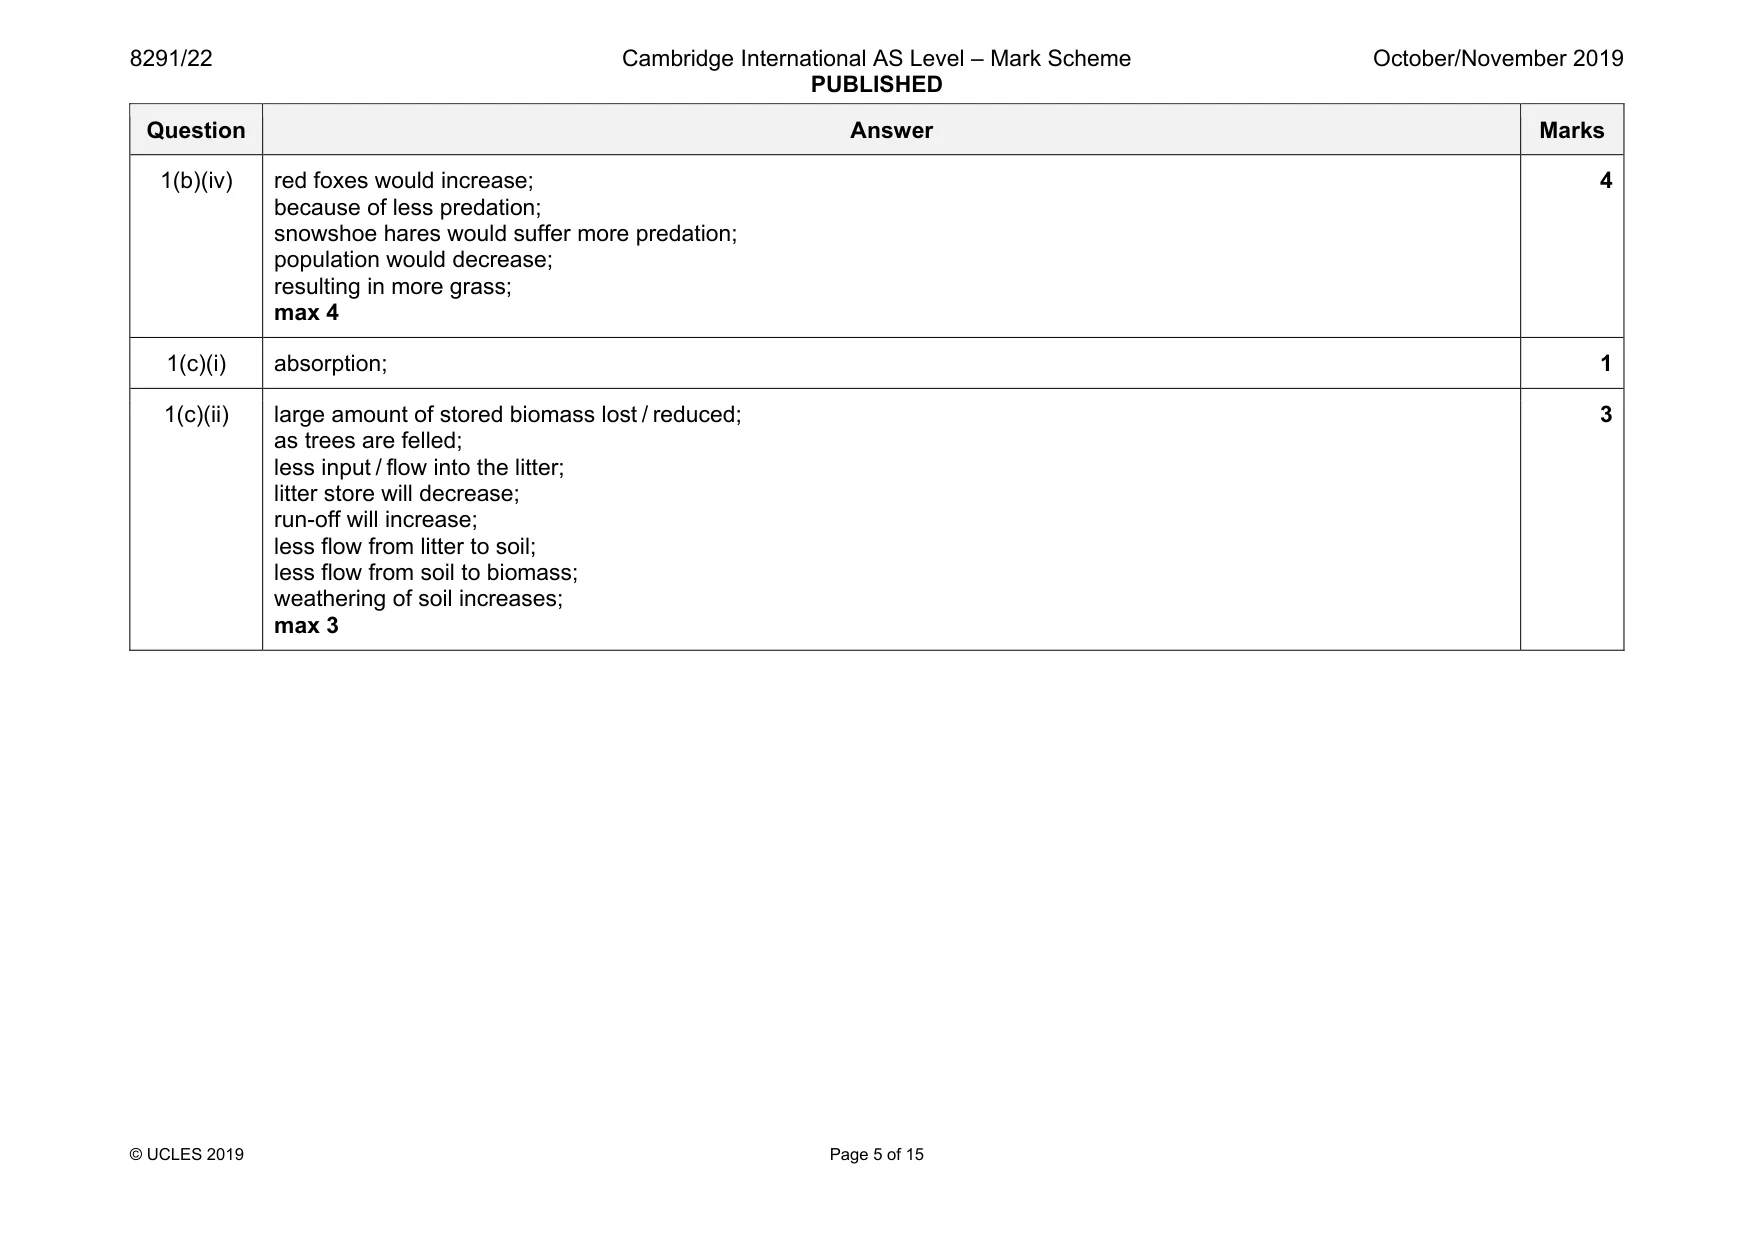
Mark scheme: 1(a)(i) decomposition / decay; 1 1(a)(ii) (gross primary production) is all the production; minus the energy used in respiration; 2 1(a)(iii) temperature; moisture / water; sunlight; carbon dioxide; max 2 2 1(a)(iv) photosynthesis; 1 1(a)(v) tropical rainforest; 1 1(b)(i) (snowshoe) hare; 1 1(b)(ii) the mass of organism / species; at each trophic level; the amount of energy available; at each trophic level; the transfer of energy; between trophic levels; max 2 2 1(b)(iii) only energy stored; is transferred; energy is lost; as heat / due to respiration / other wastes; max 2 2 Question Answer Marks 1(b)(iv) red foxes would increase; because of less predation; snowshoe hares would suffer more predation; population would decrease; resulting in more grass; max 4 4 1(c)(i) absorption; 1 1(c)(ii) large amount of stored biomass lost / reduced; as trees are felled; less input / flow into the litter; litter store will decrease; run-off will increase; less flow from litter to soil; less flow from soil to biomass; weathering of soil increases; max 3 3
Q2 · The flows and stores of water in the global hydrological cycle
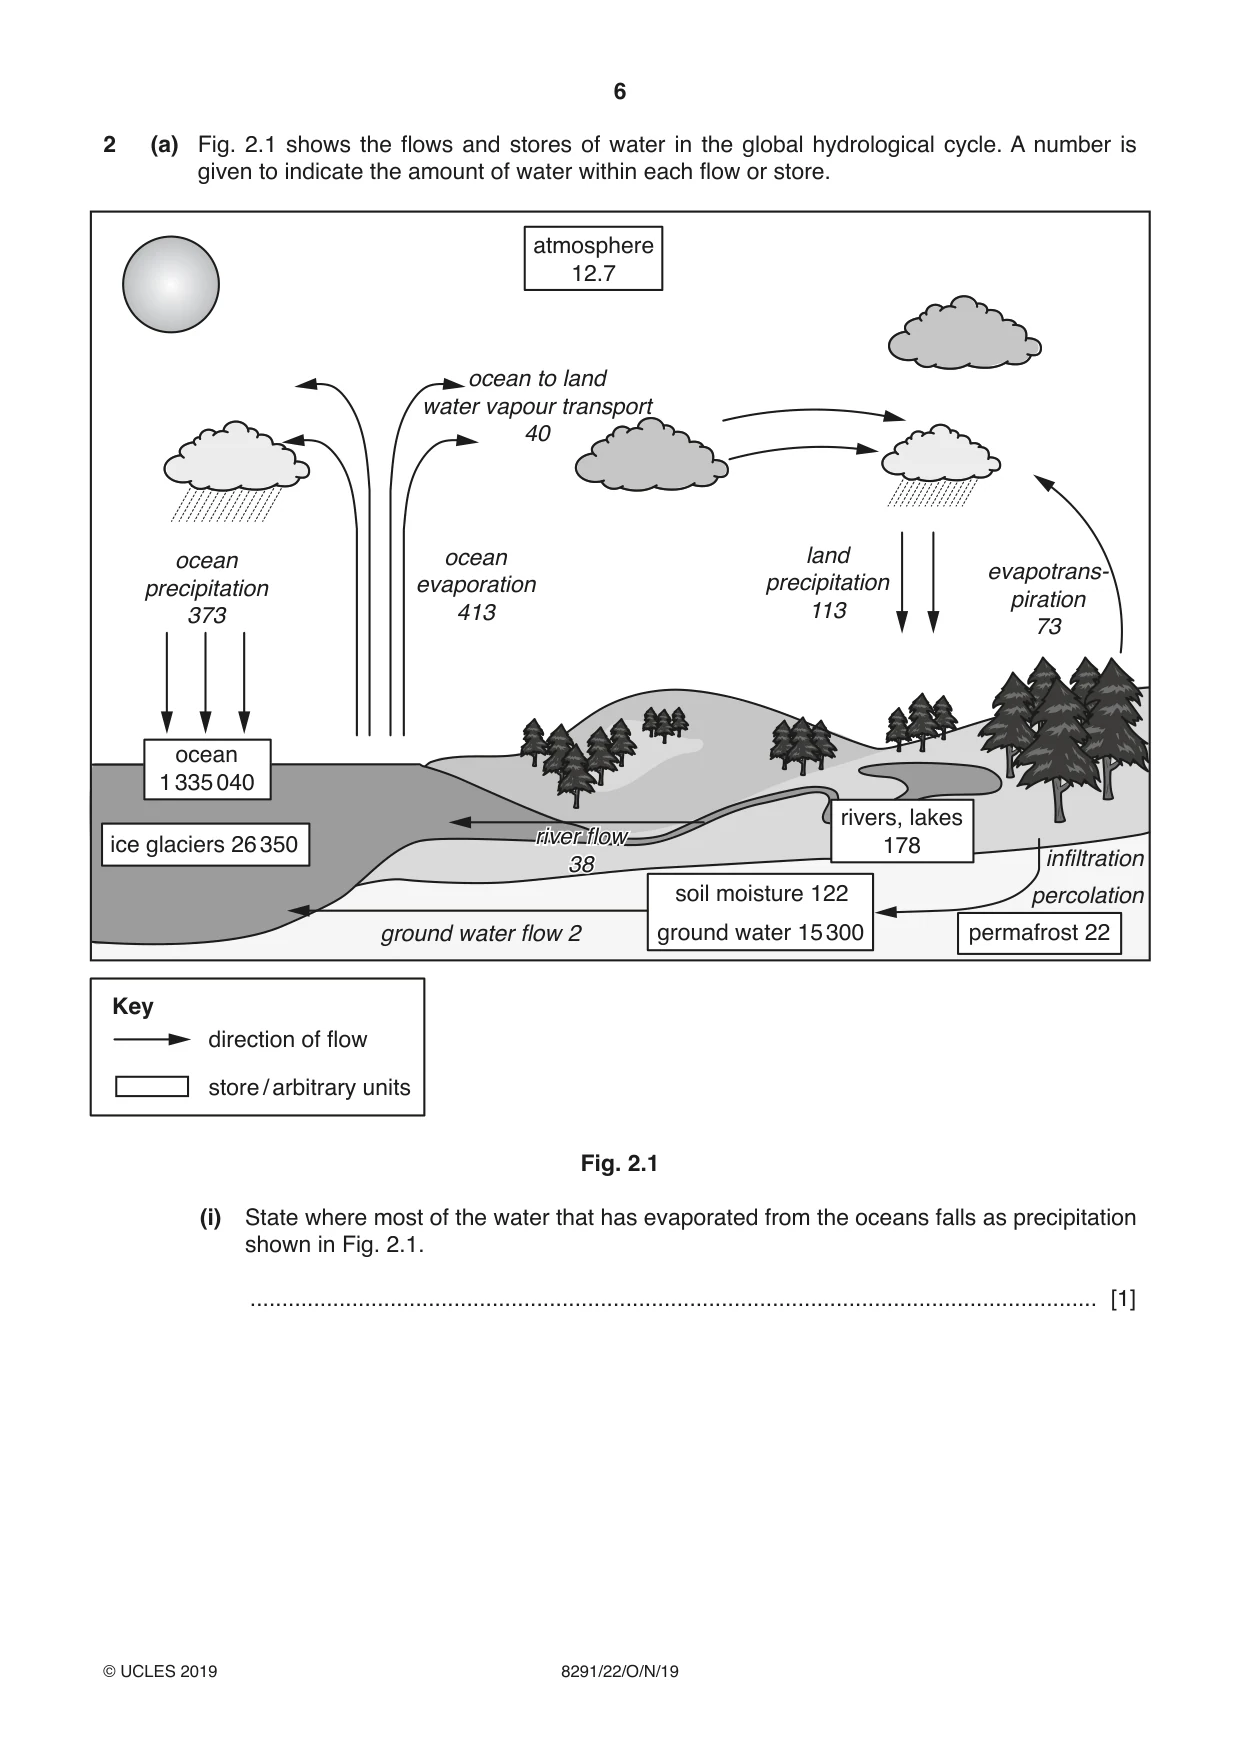
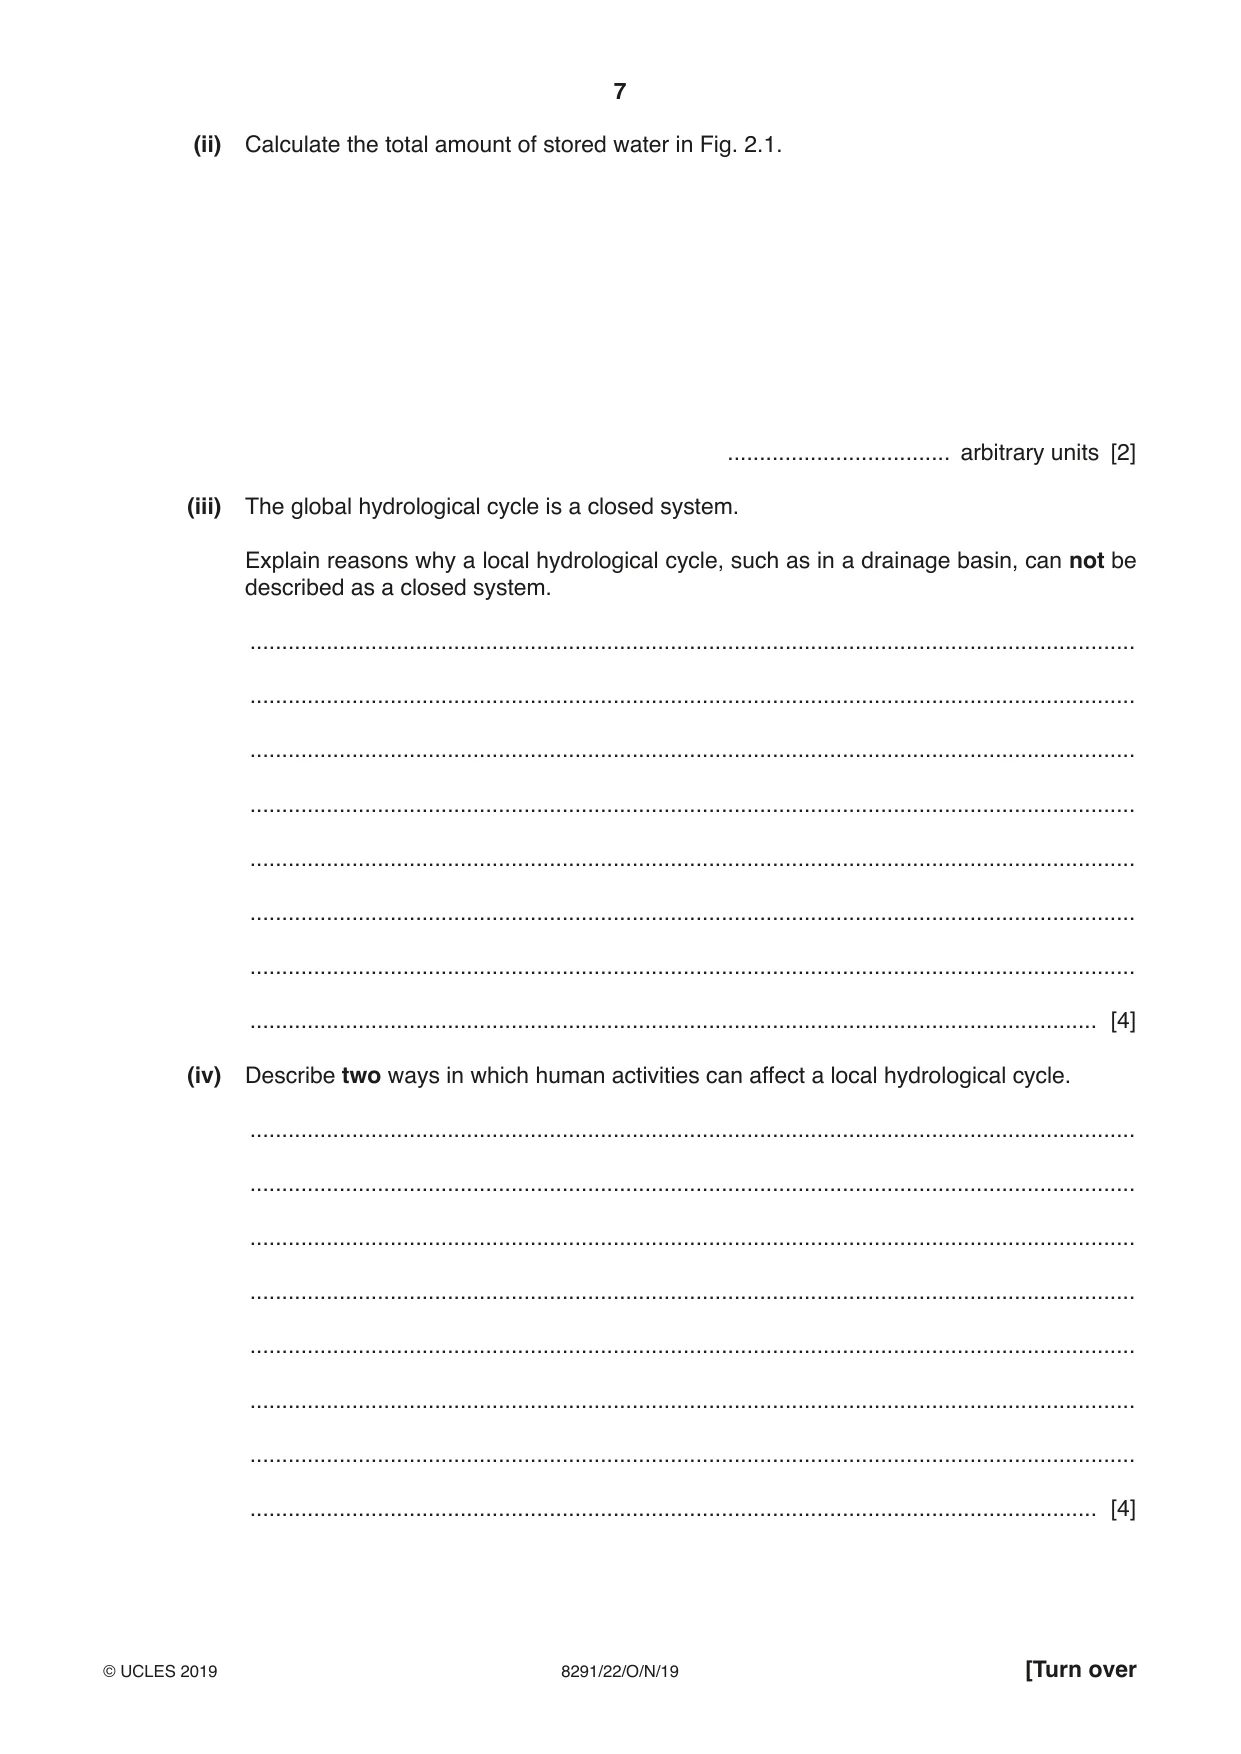
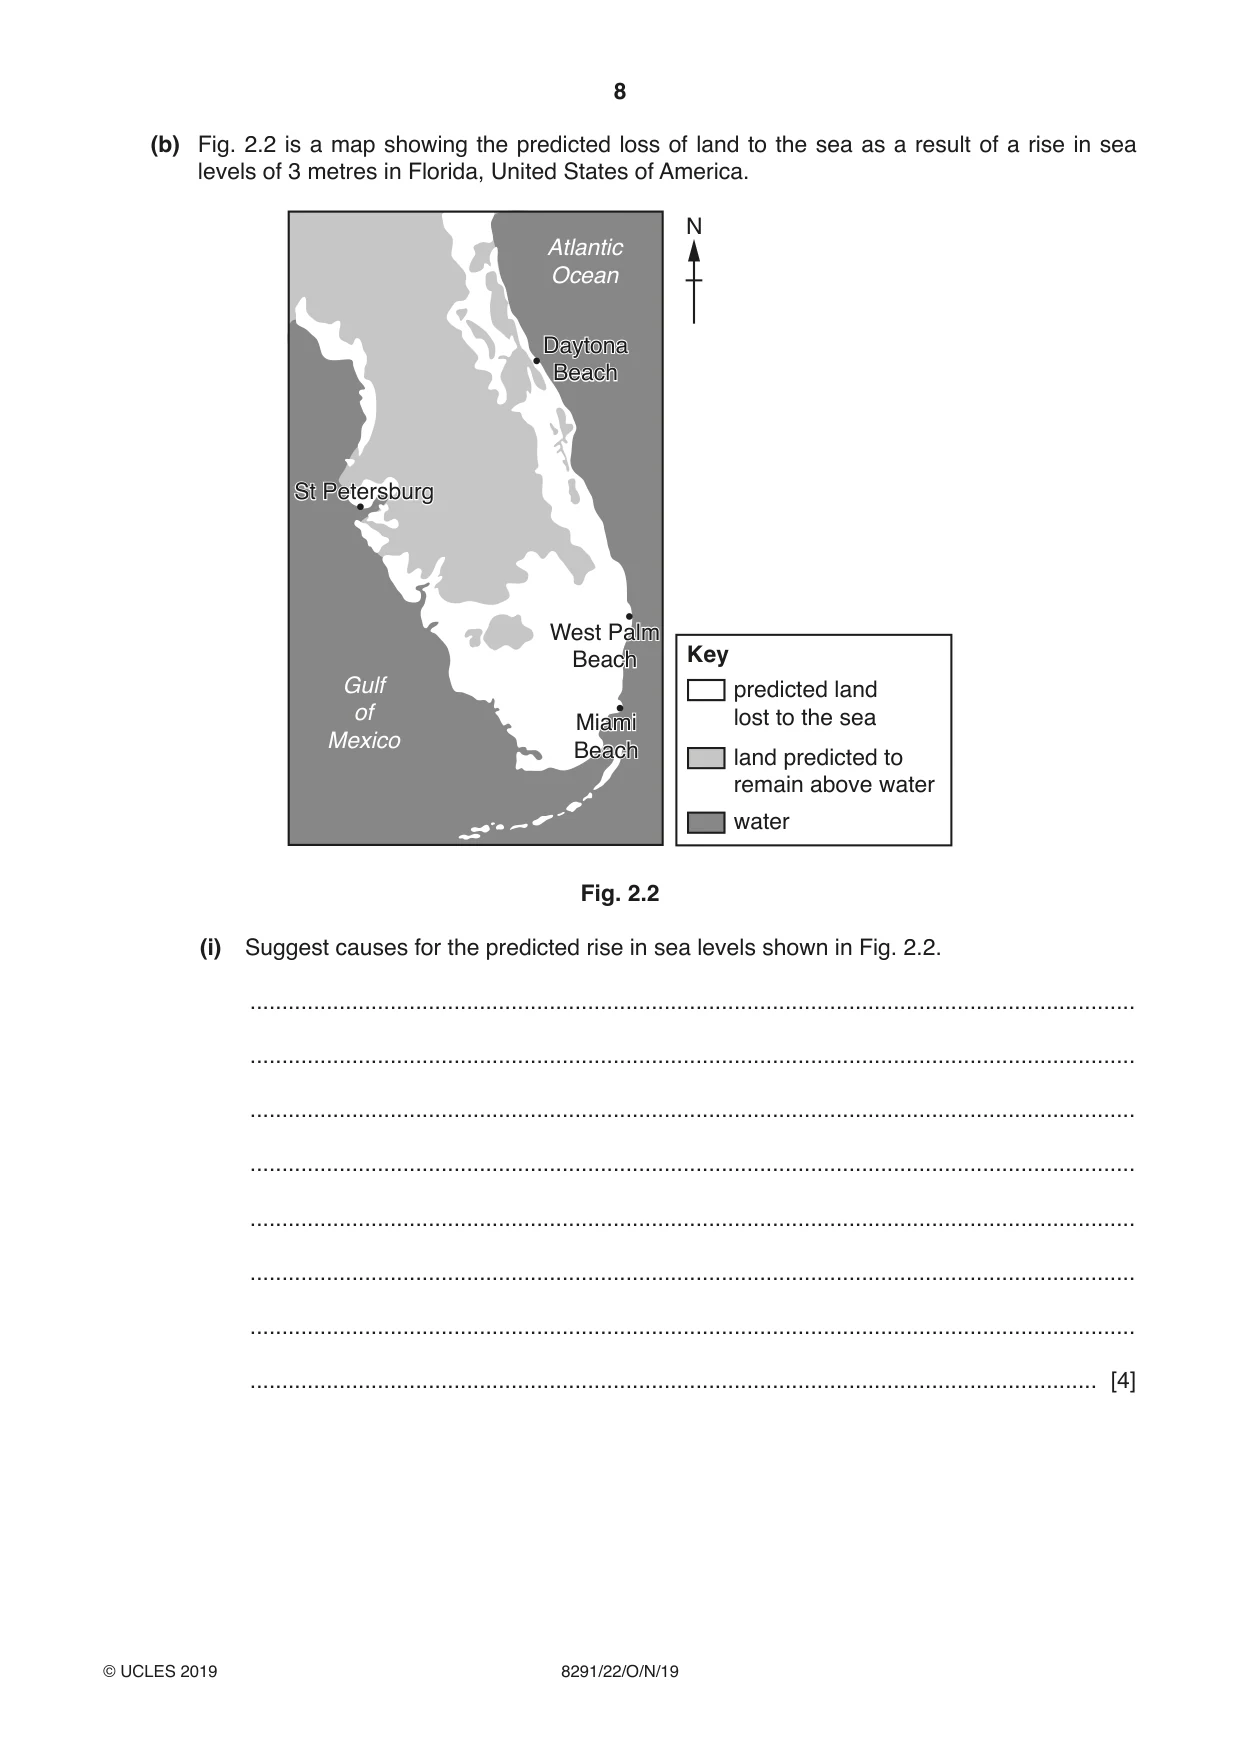
2 (a) Fig. 2.1 shows the flows and stores of water in the global hydrological cycle. A number is given to indicate the amount of water within each flow or store. atmosphere 12.7 ocean to land water vapour transport 40 ocean ocean land evapotrans- precipitation evaporation precipitation piration 373 413 113 73 ocean 1 335 040 rivers, lakes riverriver flowflow ice glaciers 26 350 178 3838 infiltration soil moisture 122 percolation ground water flow 2 ground water 15 300 permafrost 22 Key direction of flow store / arbitrary units Fig. 2.1 (i) State where most of the water that has evaporated from the oceans falls as precipitation shown in Fig. 2.1. ..................................................................................................................................... [1] (ii) Calculate the total amount of stored water in Fig. 2.1. ................................... arbitrary units [2] (iii) The global hydrological cycle is a closed system. Explain reasons why a local hydrological cycle, such as in a drainage basin, can not be described as a closed system. ........................................................................................................................................... ........................................................................................................................................... ........................................................................................................................................... ........................................................................................................................................... ........................................................................................................................................... ........................................................................................................................................... ........................................................................................................................................... ..................................................................................................................................... [4] (iv) Describe two ways in which human activities can affect a local hydrological cycle. ........................................................................................................................................... ........................................................................................................................................... ........................................................................................................................................... ........................................................................................................................................... ........................................................................................................................................... ........................................................................................................................................... ........................................................................................................................................... ..................................................................................................................................... [4] (b) Fig. 2.2 is a map showing the predicted loss of land to the sea as a result of a rise in sea levels of 3 metres in Florida, United States of America. N Atlantic Ocean DaytonaDaytona BeachBeach StSt PetersburgPetersburg WestWest PalmPalm BeachBeach Key Gulf predicted land of MiamiMiami lost to the sea Mexico BeachBeach land predicted to remain above water water Fig. 2.2 (i) Suggest causes for the predicted rise in sea levels shown in Fig. 2.2. ........................................................................................................................................... ........................................................................................................................................... ........................................................................................................................................... ........................................................................................................................................... ........................................................................................................................................... ........................................................................................................................................... ........................................................................................................................................... ..................................................................................................................................... [4] (ii) Describe strategies that could be used to manage the effects of coastal inundation caused by a rise in sea level of 3 metres, such as that shown in Fig. 2.2. ........................................................................................................................................... ........................................................................................................................................... ........................................................................................................................................... ........................................................................................................................................... ........................................................................................................................................... ........................................................................................................................................... ........................................................................................................................................... ........................................................................................................................................... ........................................................................................................................................... ..................................................................................................................................... [5] [Total: 20]
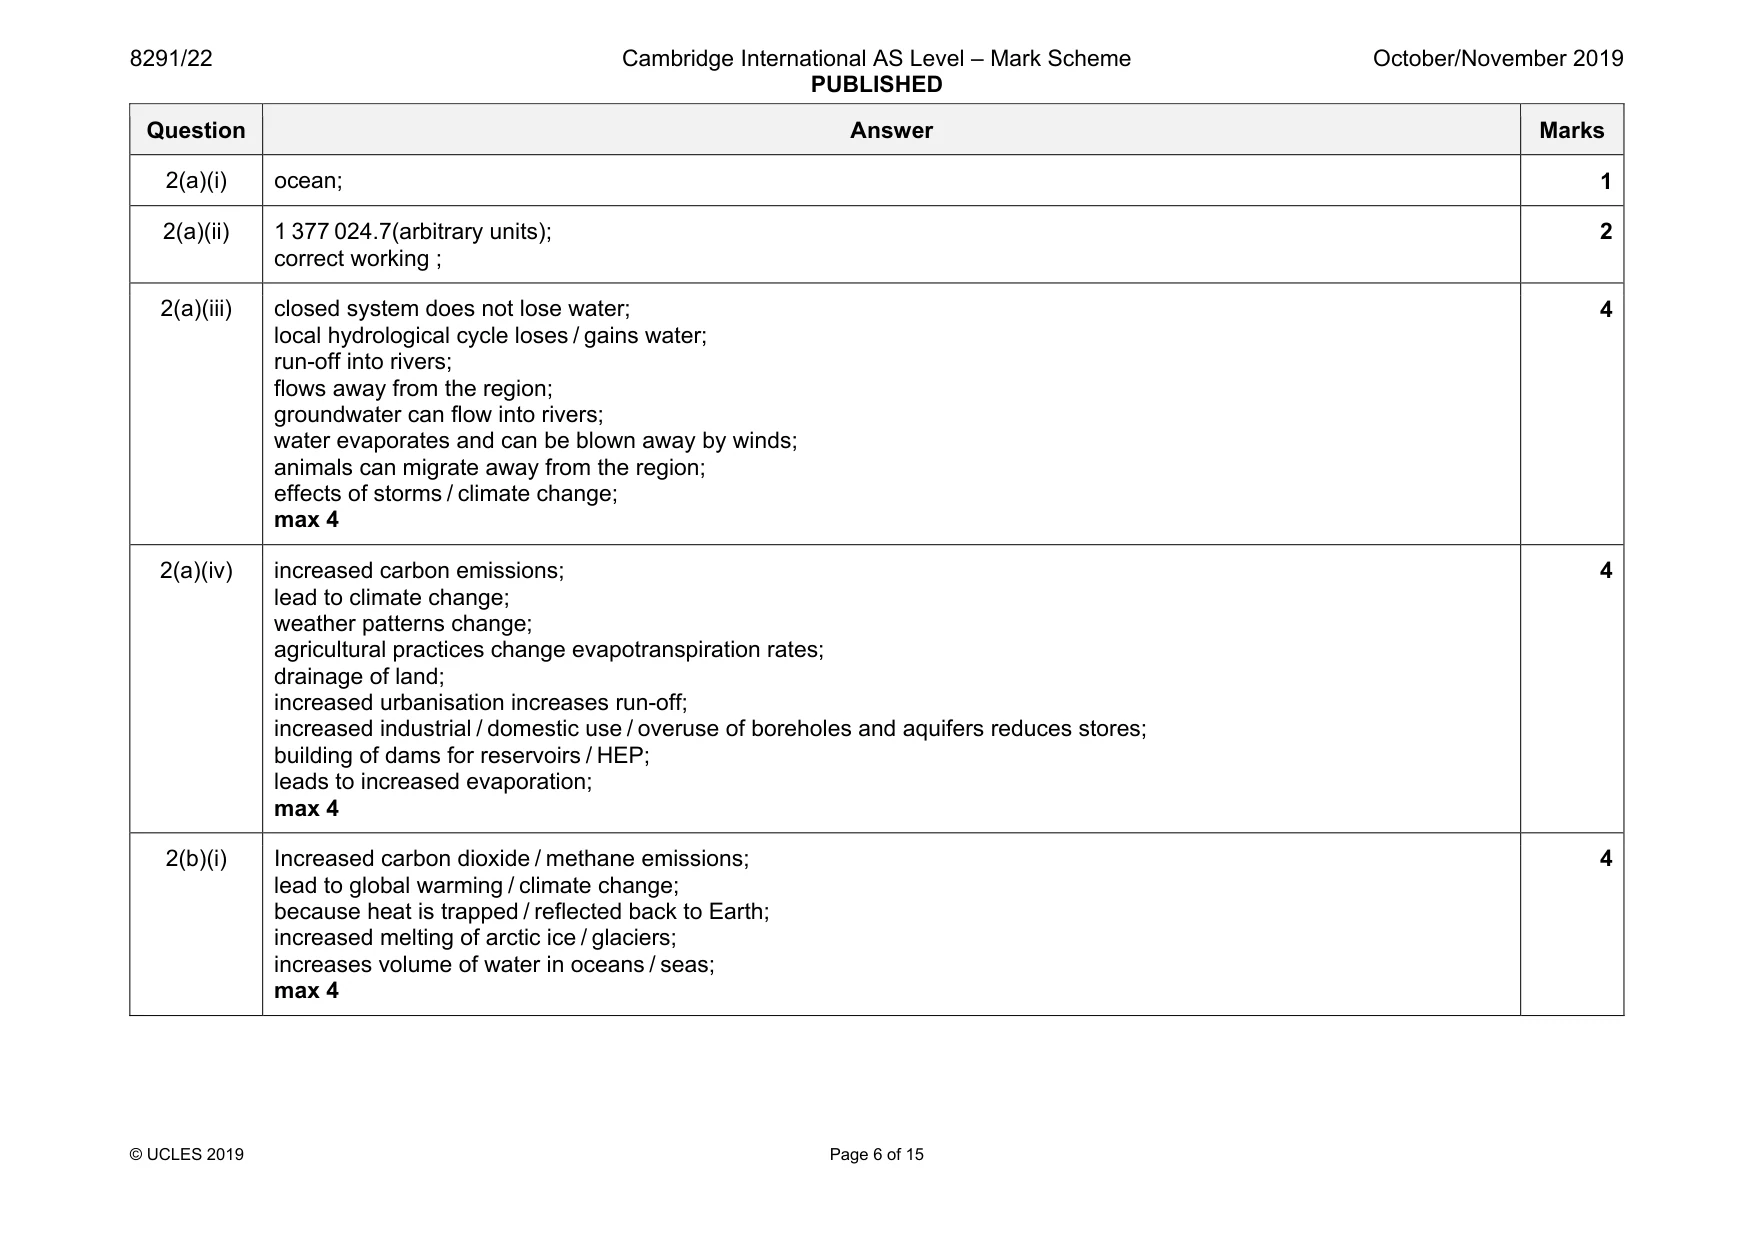
Mark scheme: 2(a)(i) ocean; 1 2(a)(ii) 1 377 024.7(arbitrary units); correct working ; 2 2(a)(iii) closed system does not lose water; local hydrological cycle loses / gains water; run-off into rivers; flows away from the region; groundwater can flow into rivers; water evaporates and can be blown away by winds; animals can migrate away from the region; effects of storms / climate change; max 4 4 2(a)(iv) increased carbon emissions; lead to climate change; weather patterns change; agricultural practices change evapotranspiration rates; drainage of land; increased urbanisation increases run-off; increased industrial / domestic use / overuse of boreholes and aquifers reduces stores; building of dams for reservoirs / HEP; leads to increased evaporation; max 4 4 2(b)(i) Increased carbon dioxide / methane emissions; lead to global warming / climate change; because heat is trapped / reflected back to Earth; increased melting of arctic ice / glaciers; increases volume of water in oceans / seas; max 4 4 Question Answer Marks 2(b)(ii) reduce emissions of carbon dioxide / methane; example e.g. factory scrubbers / catalytic converters / electric cars; move away from fossil fuels; increase reliance on renewable energy forms; named example; traffic management schemes / car pool / public transport; improve coastal defences; prepare / educate population; build levees / dykes; treat increased salinity of coastal soils to sustain agriculture; max 5 5
Q3 · Two photographs showing farming in countries at different levels of economic development
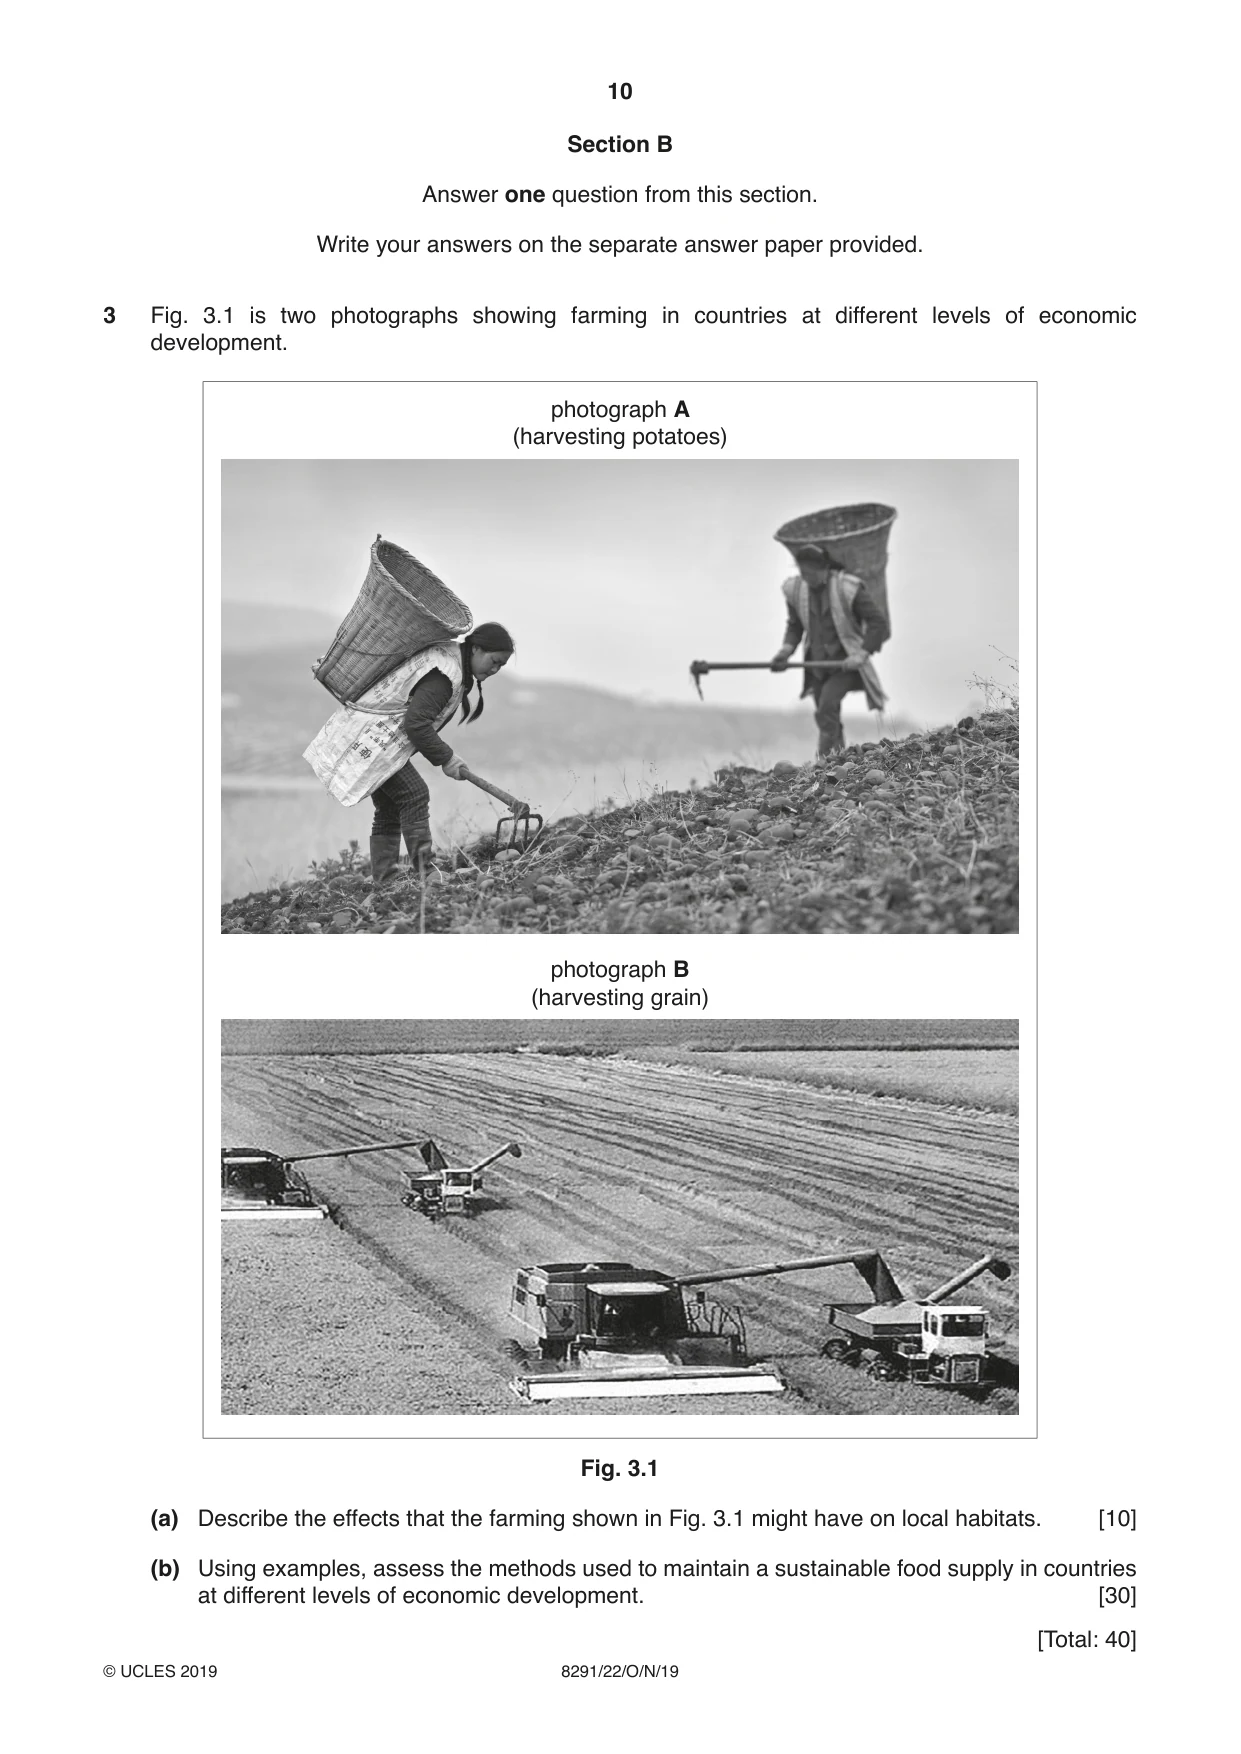
3 Fig. 3.1 is two photographs showing farming in countries at different levels of economic development. photograph A (harvesting potatoes) photograph B (harvesting grain) Fig. 3.1 (a) Describe the effects that the farming shown in Fig. 3.1 might have on local habitats. [10] (b) Using examples, assess the methods used to maintain a sustainable food supply in countries at different levels of economic development. [30] [Total: 40]
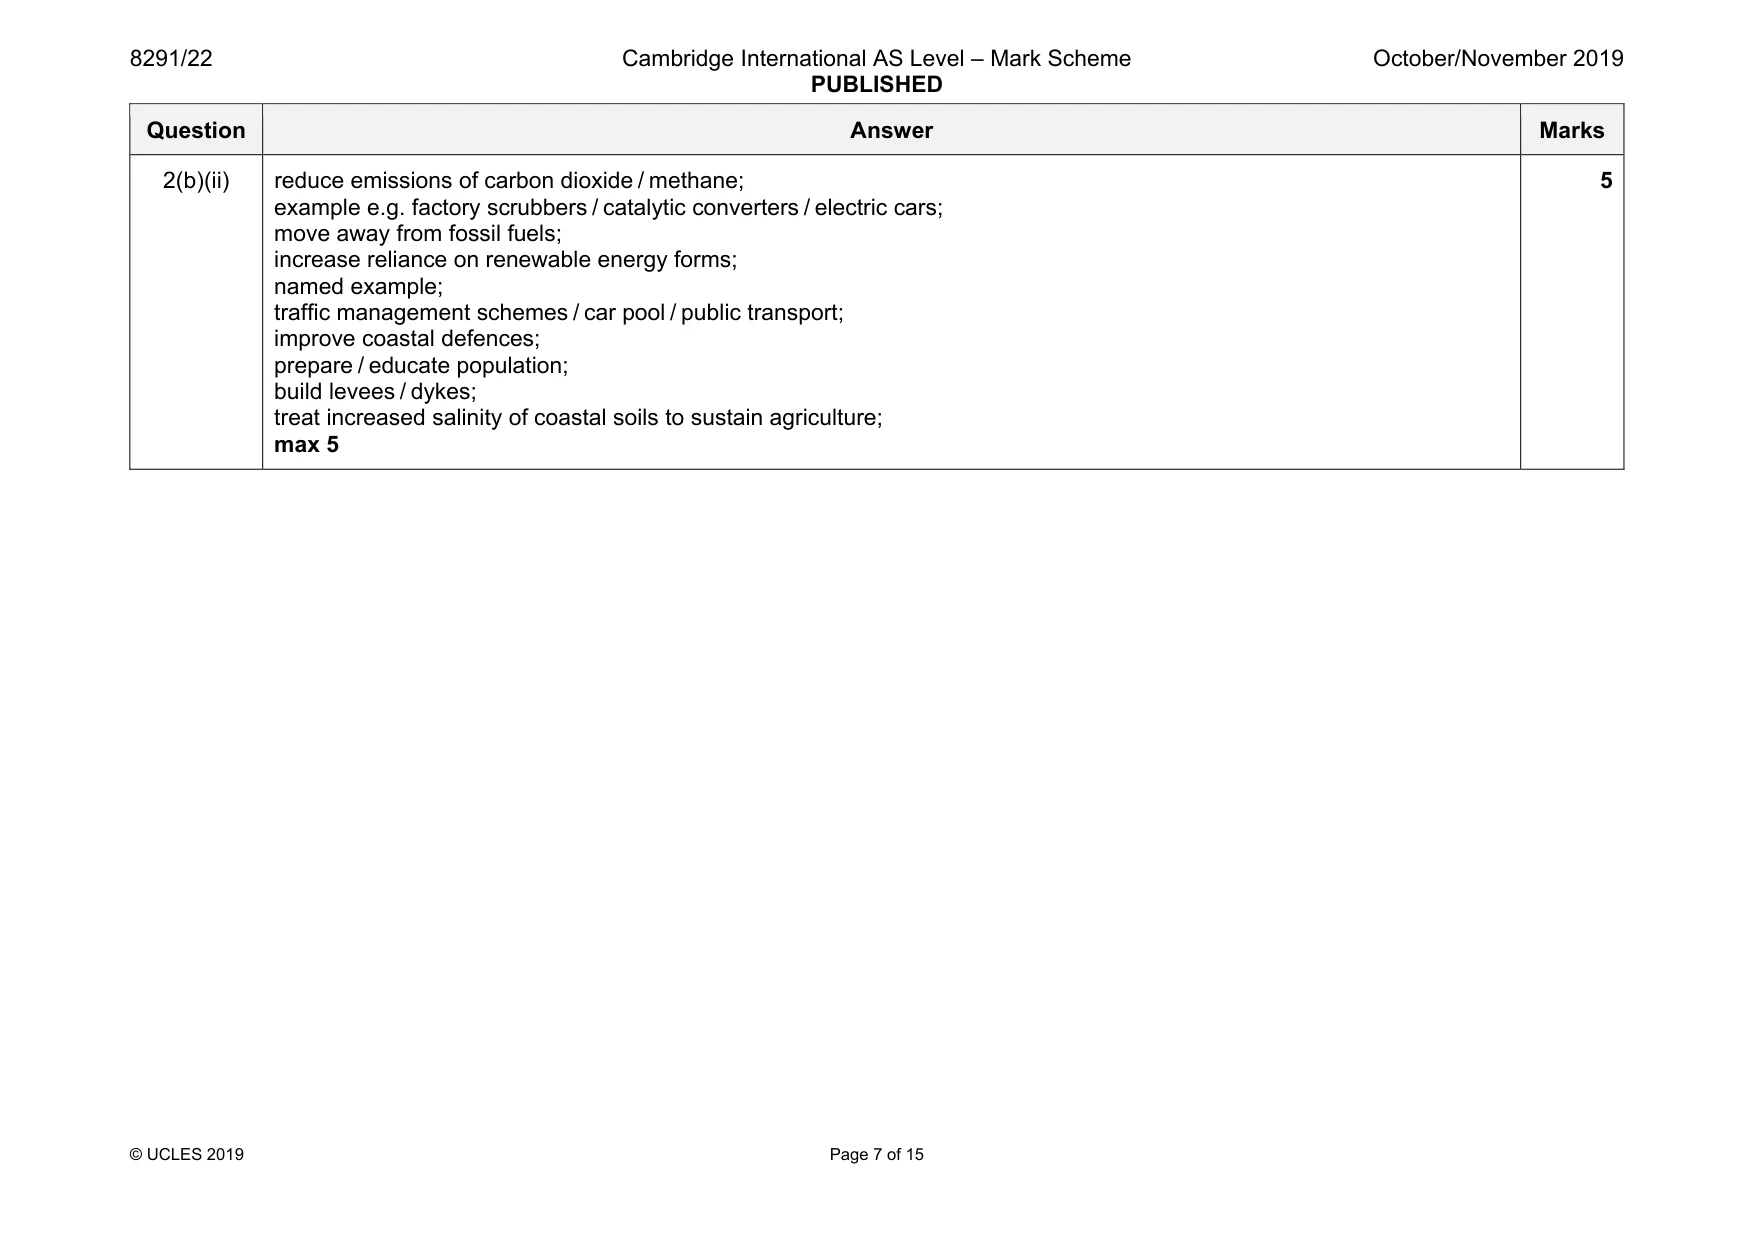
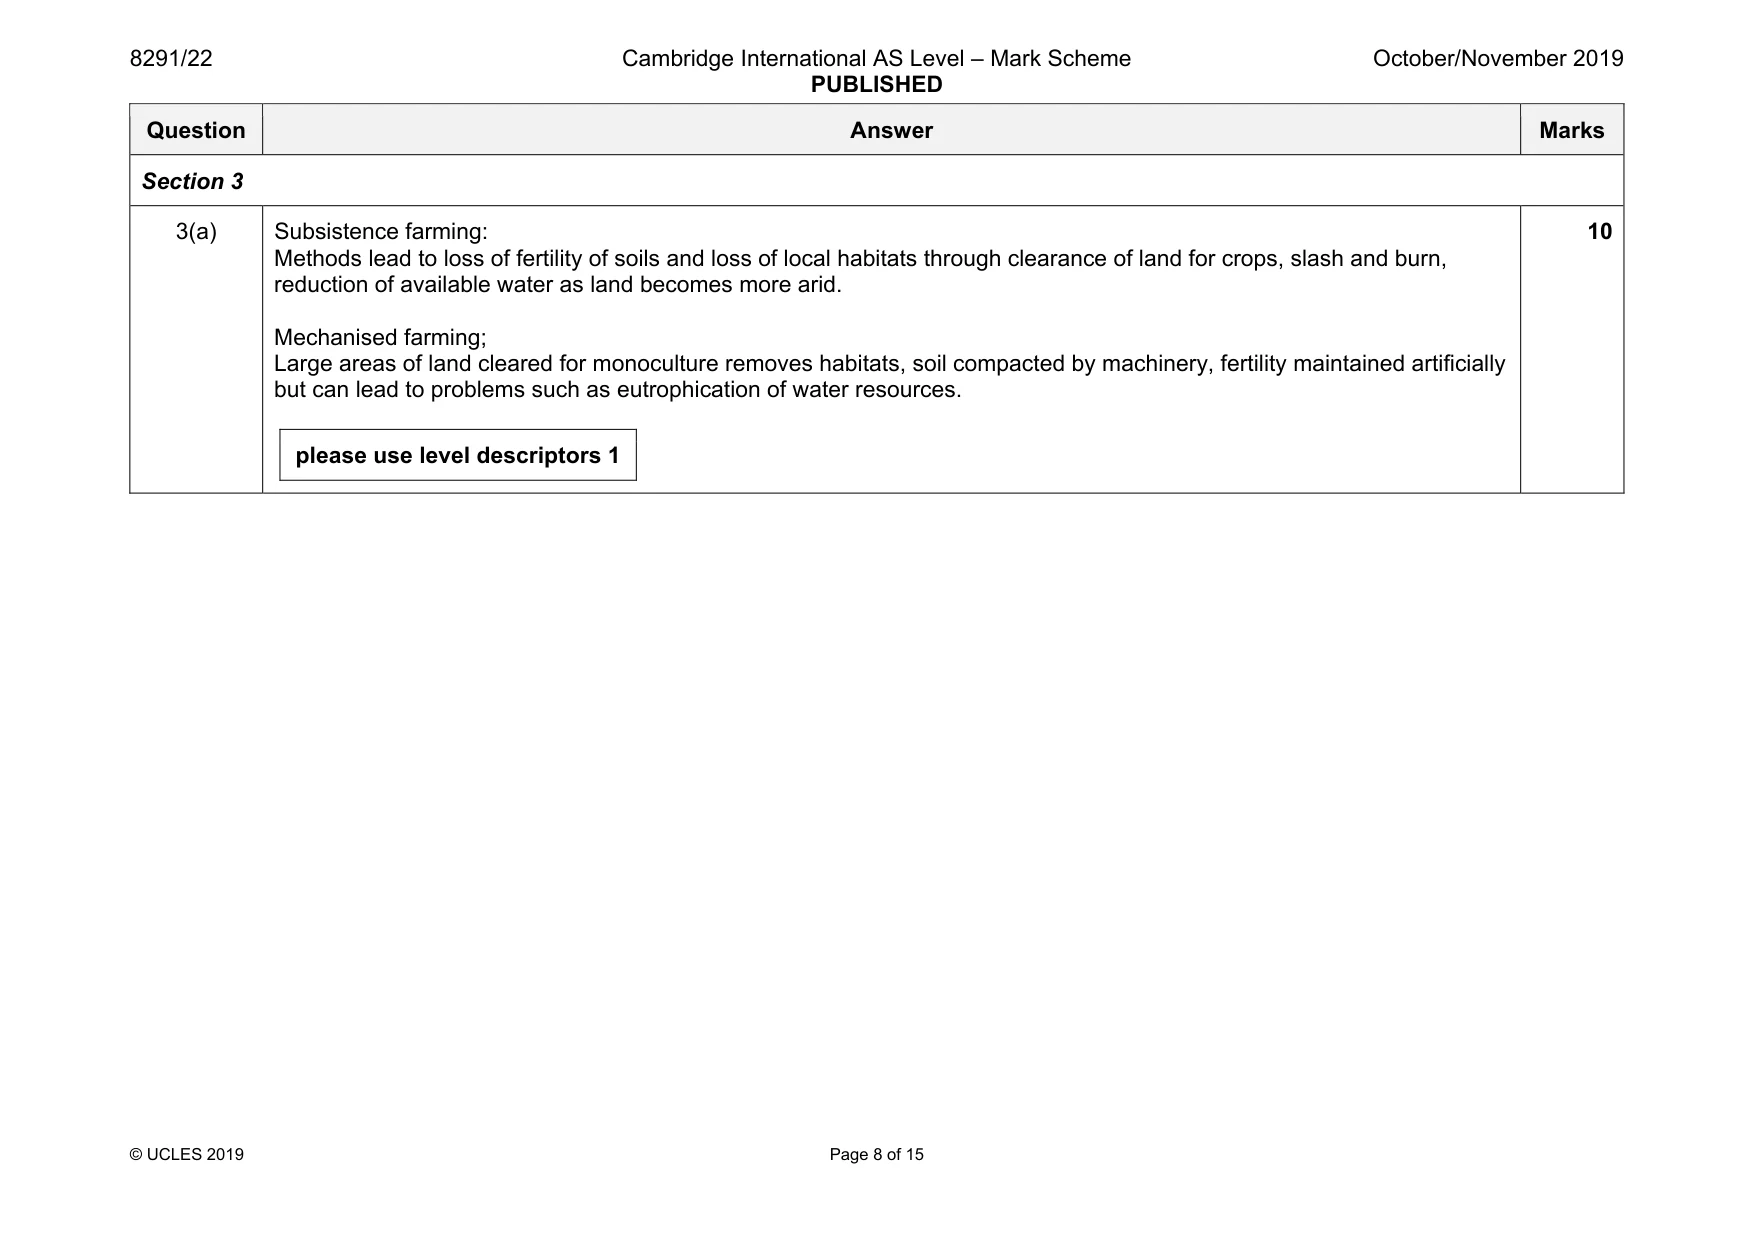
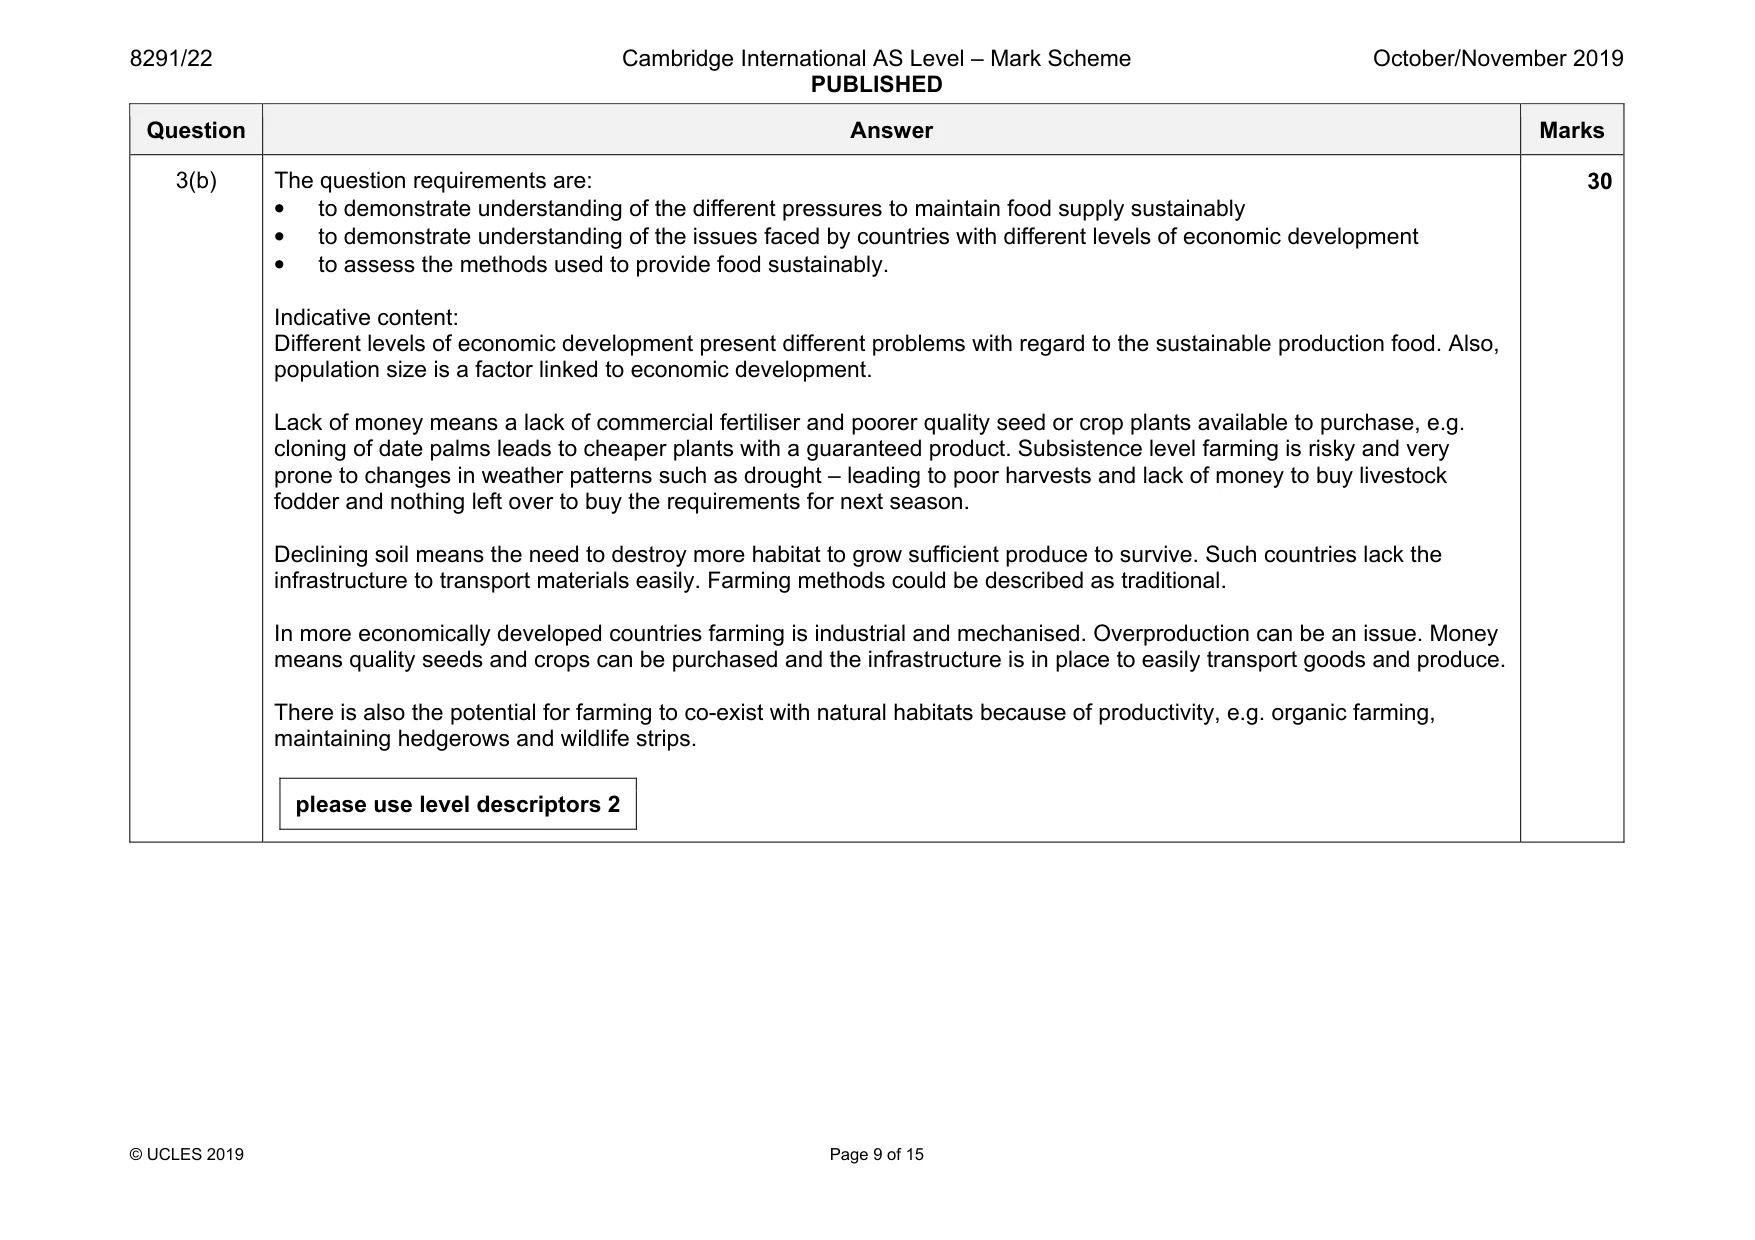
Mark scheme: 3(a) Subsistence farming: Methods lead to loss of fertility of soils and loss of local habitats through clearance of land for crops, slash and burn, reduction of available water as land becomes more arid. Mechanised farming; Large areas of land cleared for monoculture removes habitats, soil compacted by machinery, fertility maintained artificially but can lead to problems such as eutrophication of water resources. please use level descriptors 1 10 Question Answer Marks 3(b) The question requirements are: • to demonstrate understanding of the different pressures to maintain food supply sustainably • to demonstrate understanding of the issues faced by countries with different levels of economic development • to assess the methods used to provide food sustainably. Indicative content: Different levels of economic development present different problems with regard to the sustainable production food. Also, population size is a factor linked to economic development. Lack of money means a lack of commercial fertiliser and poorer quality seed or crop plants available to purchase, e.g. cloning of date palms leads to cheaper plants with a guaranteed product. Subsistence level farming is risky and very prone to changes in weather patterns such as drought – leading to poor harvests and lack of money to buy livestock fodder and nothing left over to buy the requirements for next season. Declining soil means the need to destroy more habitat to grow sufficient produce to survive. Such countries lack the infrastructure to transport materials easily. Farming methods could be described as traditional. In more economically developed countries farming is industrial and mechanised. Overproduction can be an issue. Money means quality seeds and crops can be purchased and the infrastructure is in place to easily transport goods and produce. There is also the potential for farming to co-exist with natural habitats because of productivity, e.g. organic farming, maintaining hedgerows and wildlife strips. please use level descriptors 2 30
Q4 · The percentage of the total human population that live on arid or semi-arid land for each…
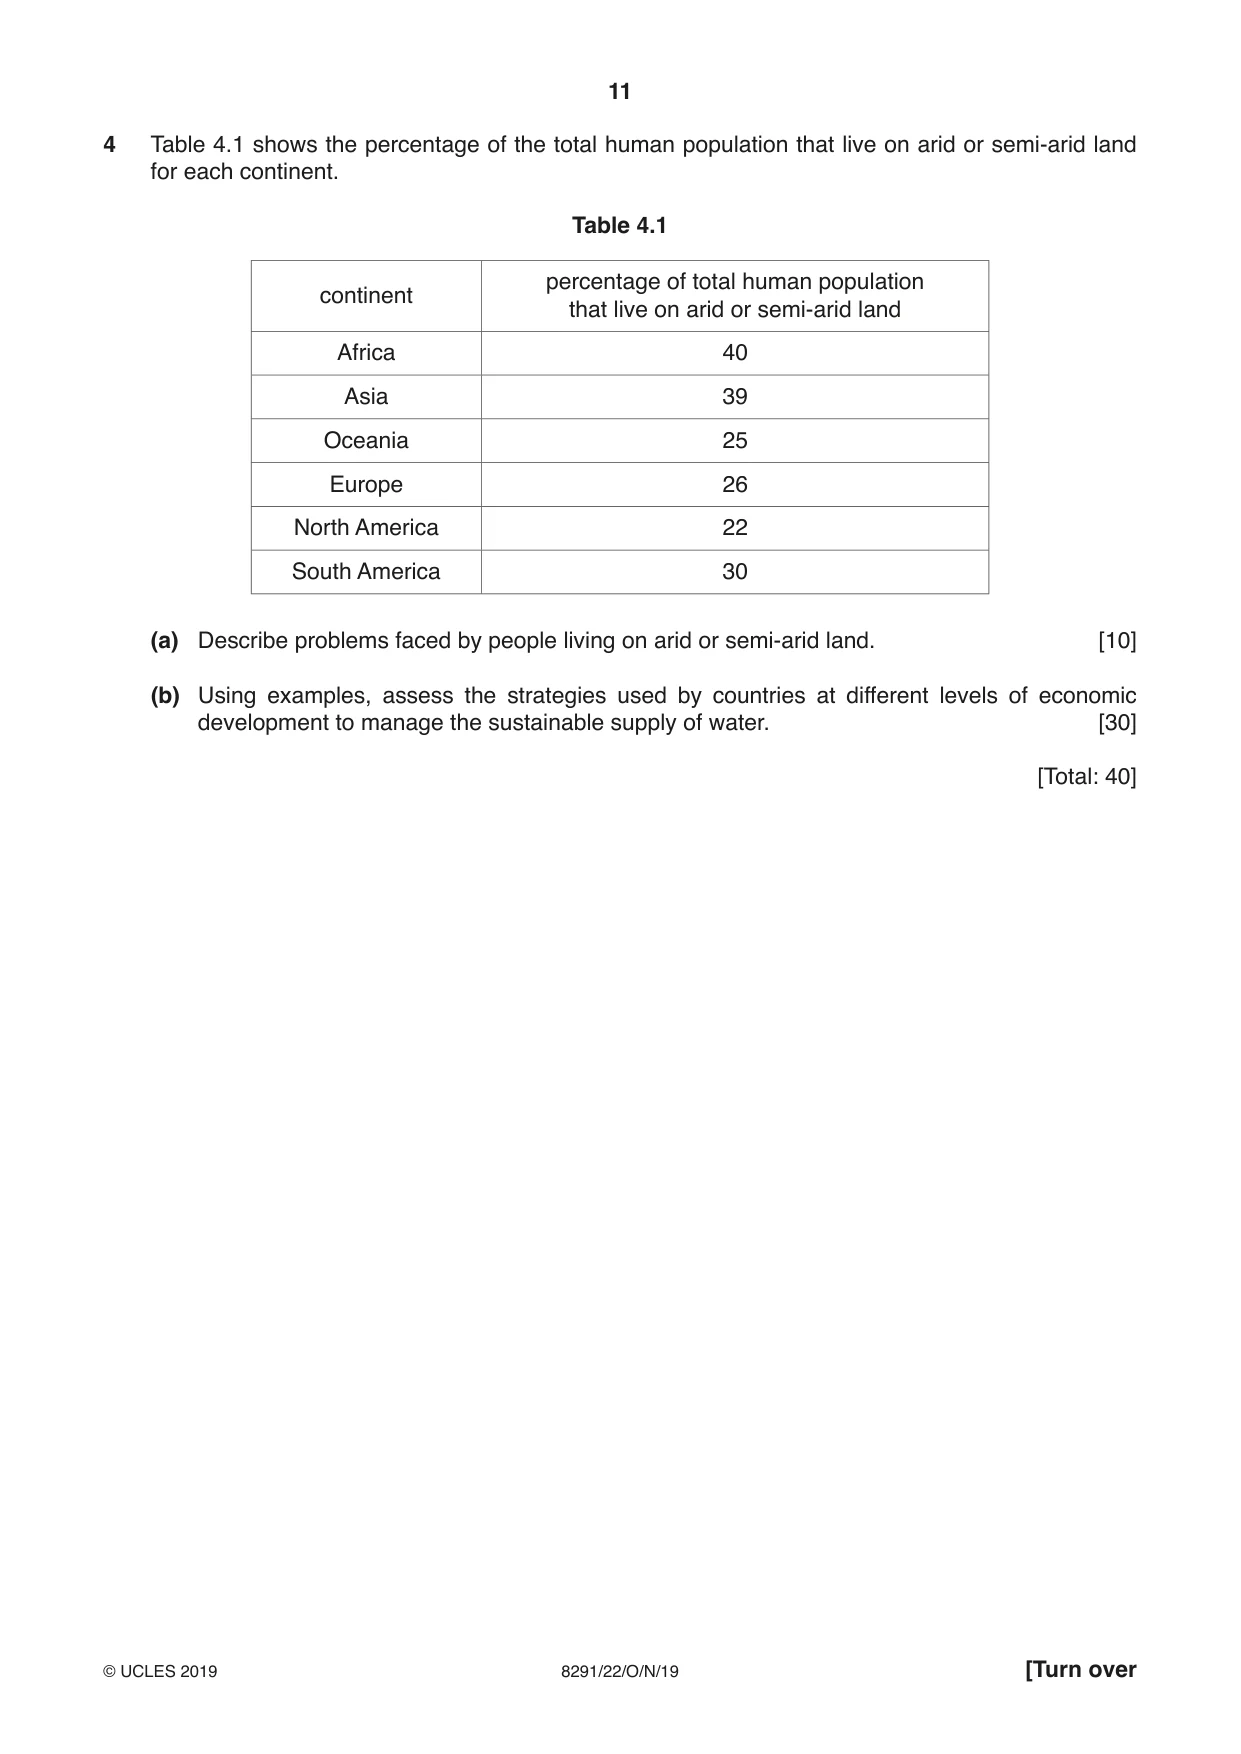
4 Table 4.1 shows the percentage of the total human population that live on arid or semi-arid land for each continent. Table 4.1 percentage of total human population continent that live on arid or semi-arid land Africa 40 Asia 39 Oceania 25 Europe 26 North America 22 South America 30 (a) Describe problems faced by people living on arid or semi-arid land. [10] (b) Using examples, assess the strategies used by countries at different levels of economic development to manage the sustainable supply of water. [30] [Total: 40]
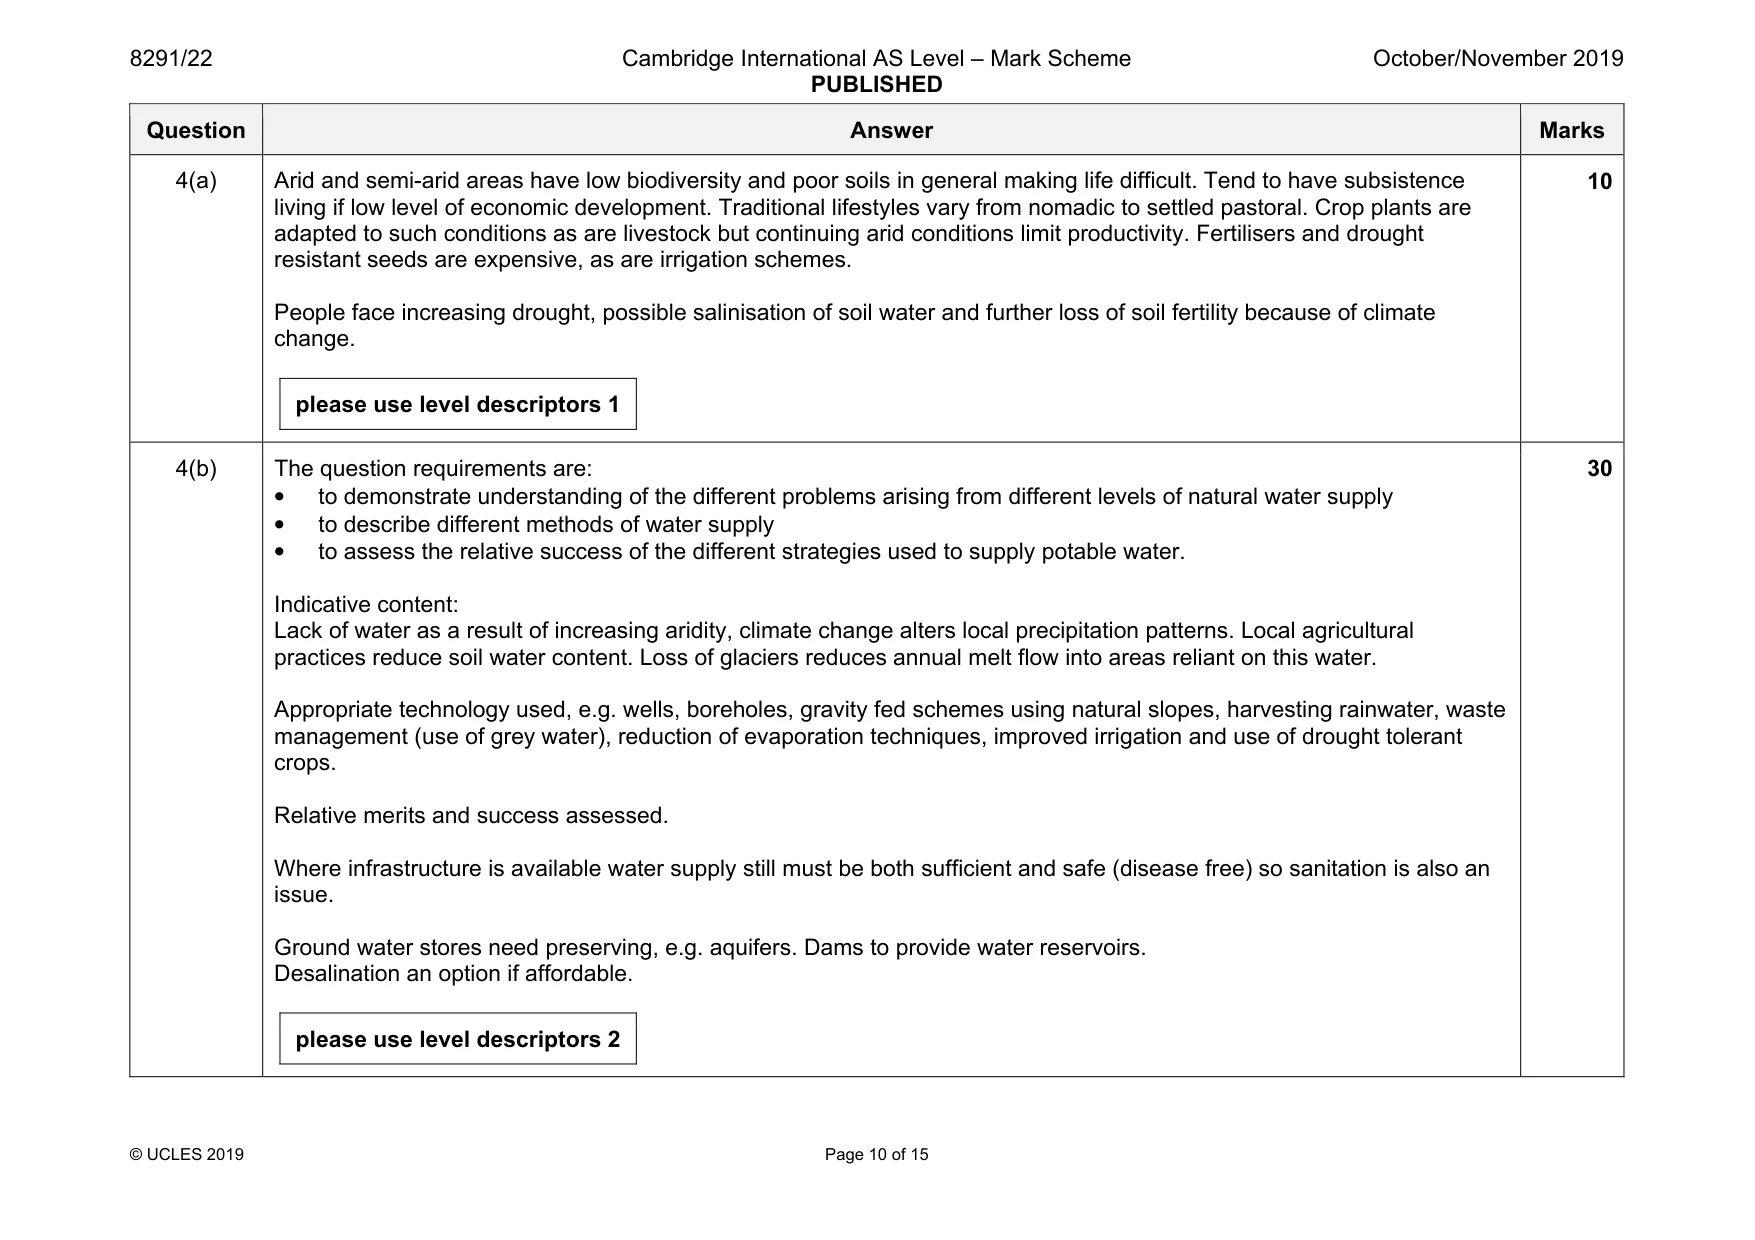
Mark scheme: 4(a) Arid and semi-arid areas have low biodiversity and poor soils in general making life difficult. Tend to have subsistence living if low level of economic development. Traditional lifestyles vary from nomadic to settled pastoral. Crop plants are adapted to such conditions as are livestock but continuing arid conditions limit productivity. Fertilisers and drought resistant seeds are expensive, as are irrigation schemes. People face increasing drought, possible salinisation of soil water and further loss of soil fertility because of climate change. please use level descriptors 1 10 4(b) The question requirements are: • to demonstrate understanding of the different problems arising from different levels of natural water supply • to describe different methods of water supply • to assess the relative success of the different strategies used to supply potable water. Indicative content: Lack of water as a result of increasing aridity, climate change alters local precipitation patterns. Local agricultural practices reduce soil water content. Loss of glaciers reduces annual melt flow into areas reliant on this water. Appropriate technology used, e.g. wells, boreholes, gravity fed schemes using natural slopes, harvesting rainwater, waste management (use of grey water), reduction of evaporation techniques, improved irrigation and use of drought tolerant crops. Relative merits and success assessed. Where infrastructure is available water supply still must be both sufficient and safe (disease free) so sanitation is also an issue. Ground water stores need preserving, e.g. aquifers. Dams to provide water reservoirs. Desalination an option if affordable. please use level descriptors 2 30
Q5 · The relationship between average annual precipitation and temperature for some major…
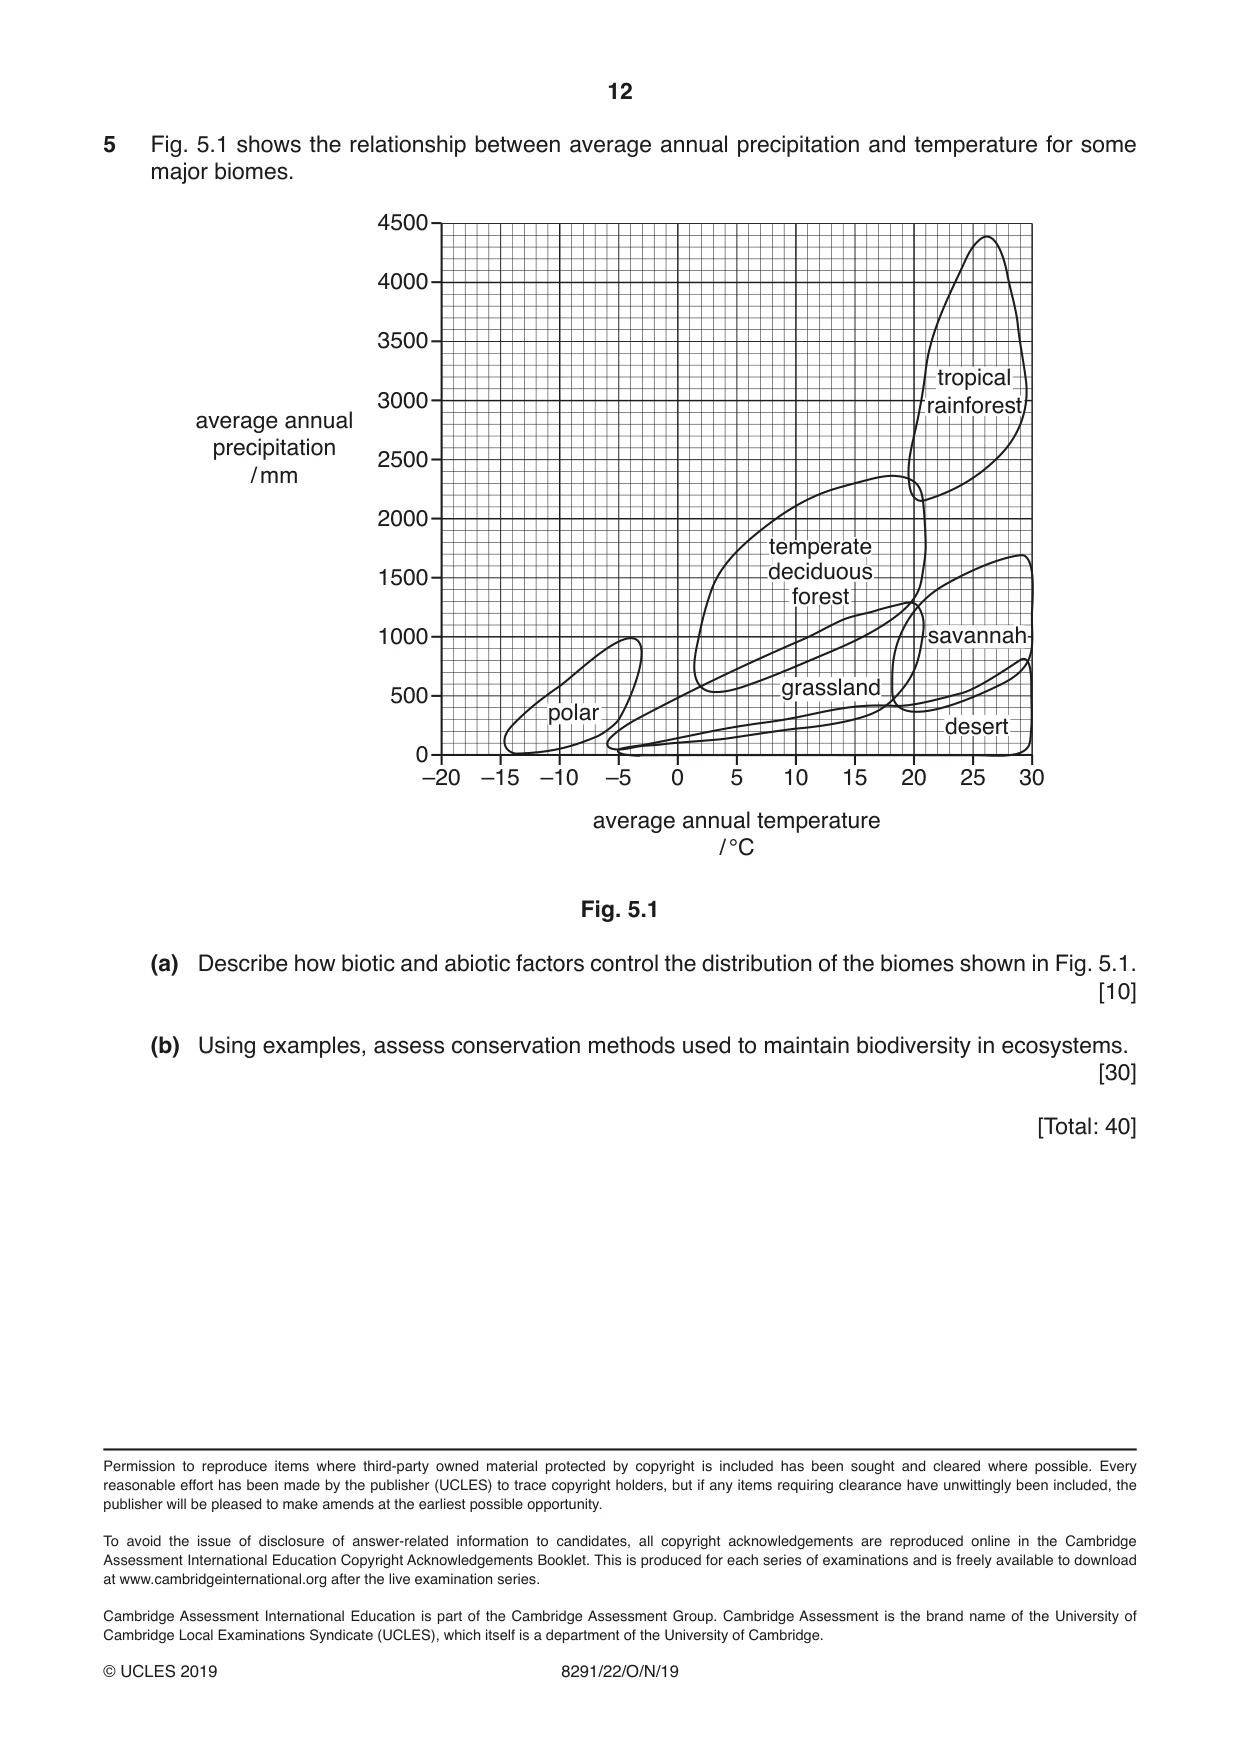
5 Fig. 5.1 shows the relationship between average annual precipitation and temperature for some major biomes. 4500 4000 3500 tropical 3000 rainforest average annual precipitation 2500 / mm 2000 temperatetemperate 1500 deciduousdeciduous forestforest 1000 savannahsavannah grassland 500 polarpolar desertdesert 0 –20 –15 –10 –5 0 5 10 15 20 25 30 average annual temperature / °C Fig. 5.1 (a) Describe how biotic and abiotic factors control the distribution of the biomes shown in Fig. 5.1. [10] (b) Using examples, assess conservation methods used to maintain biodiversity in ecosystems. [30] [Total: 40]
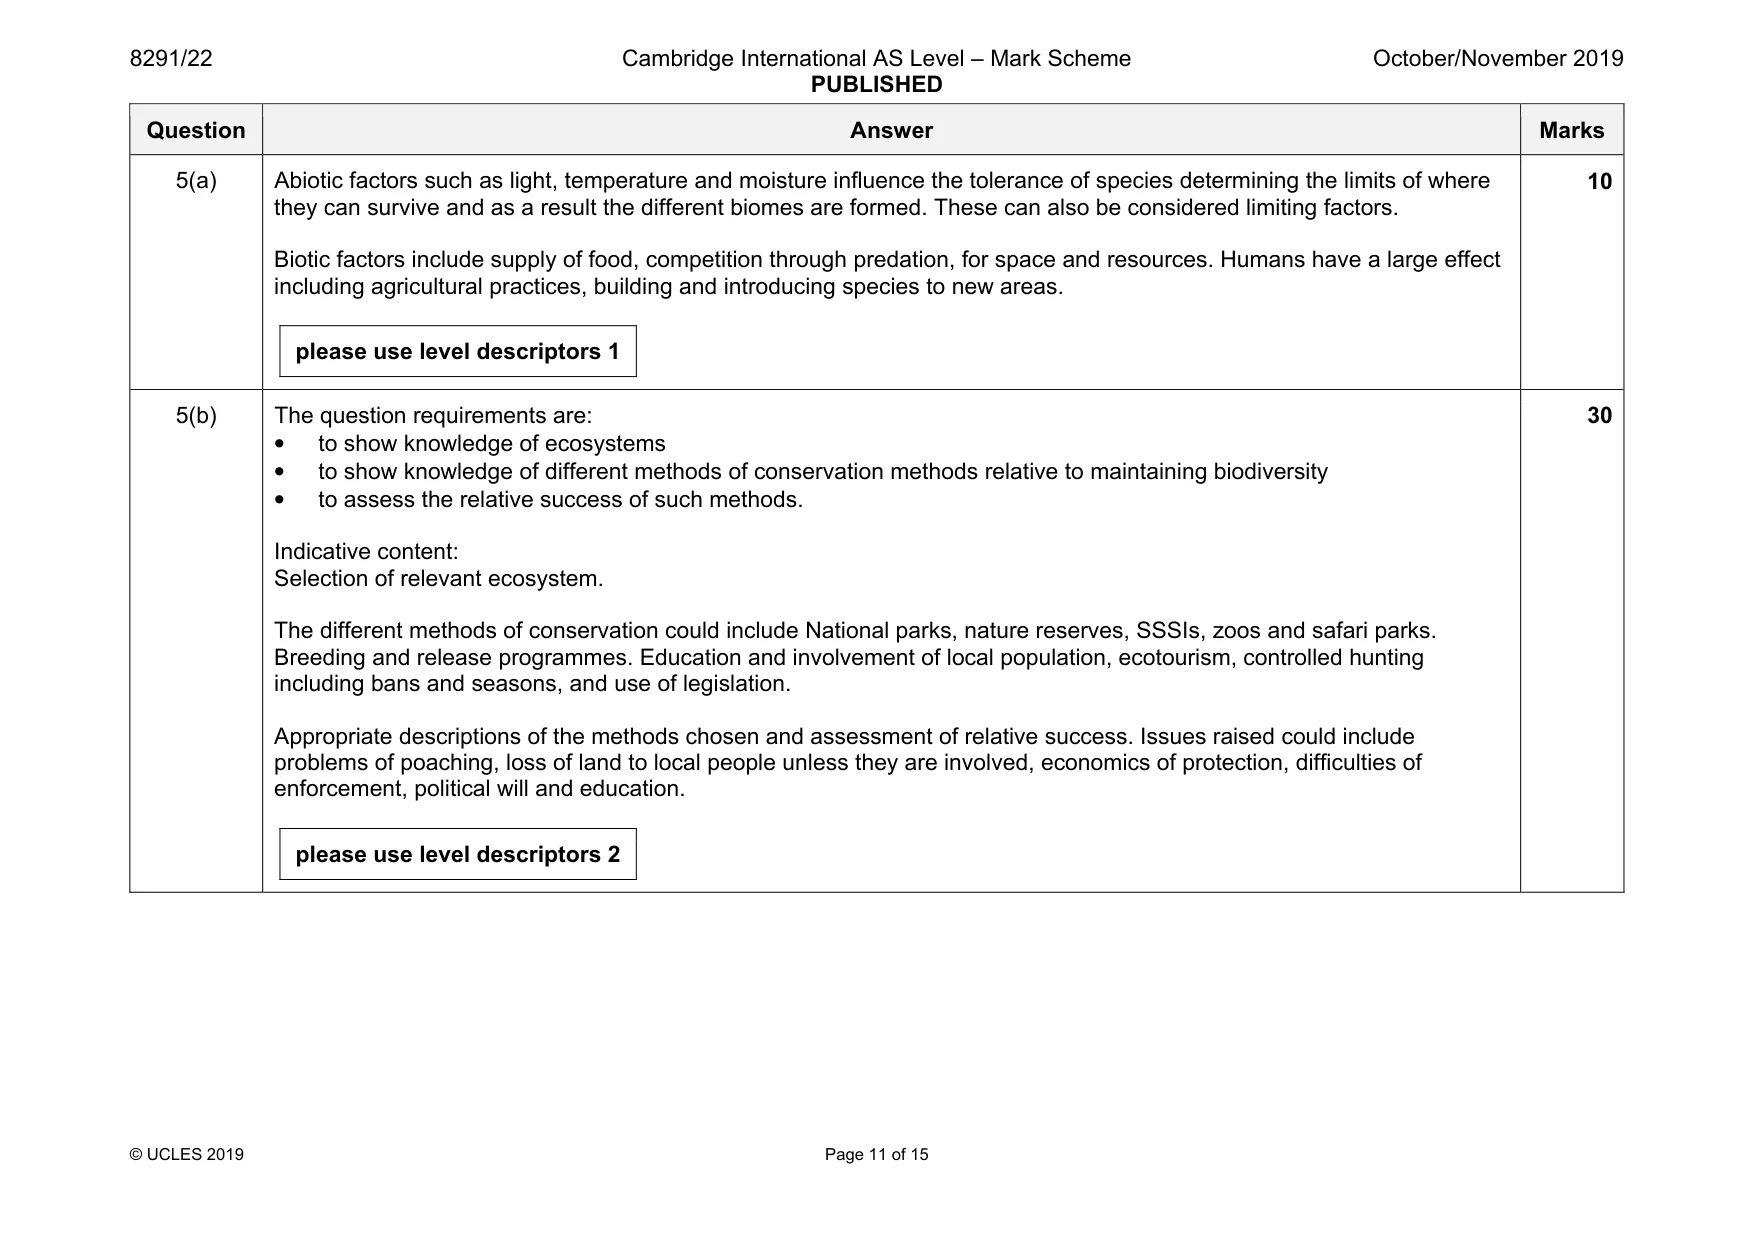
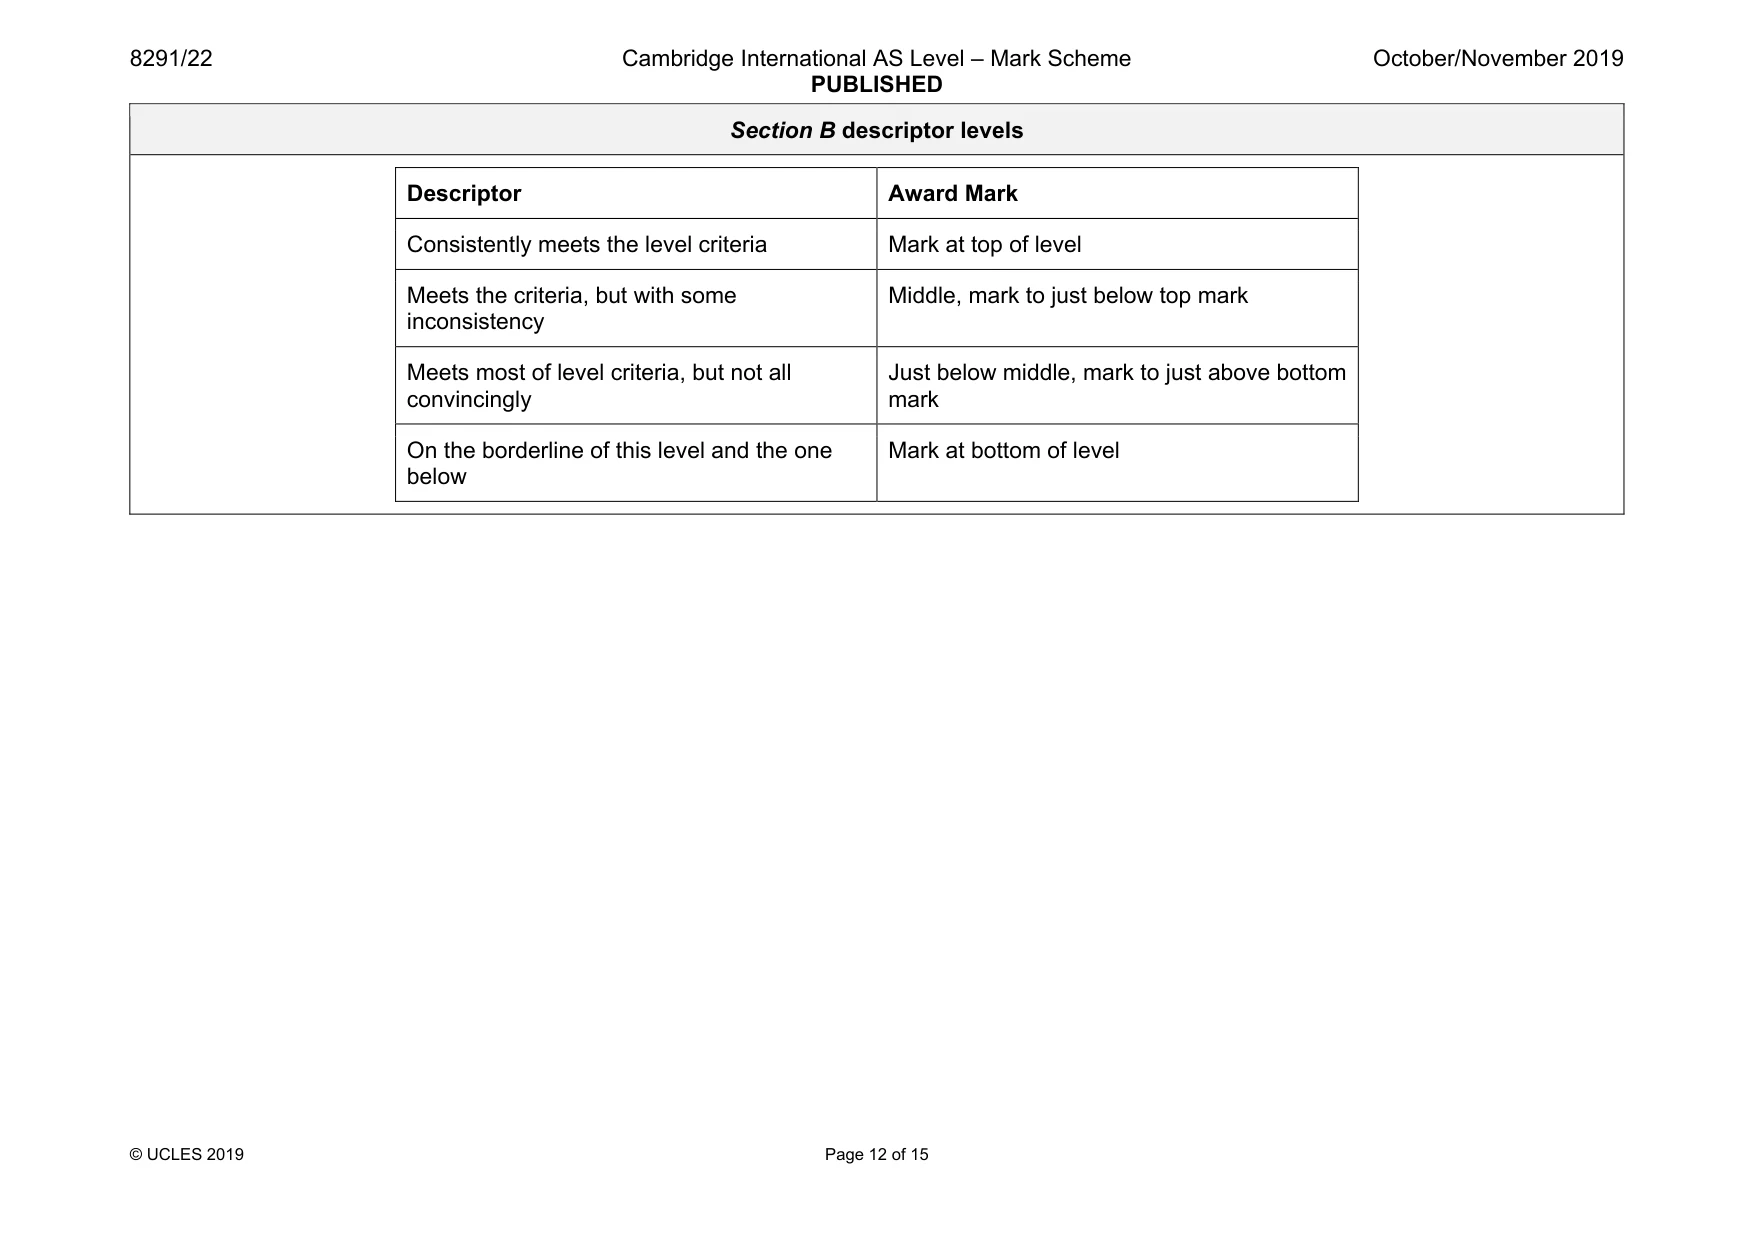
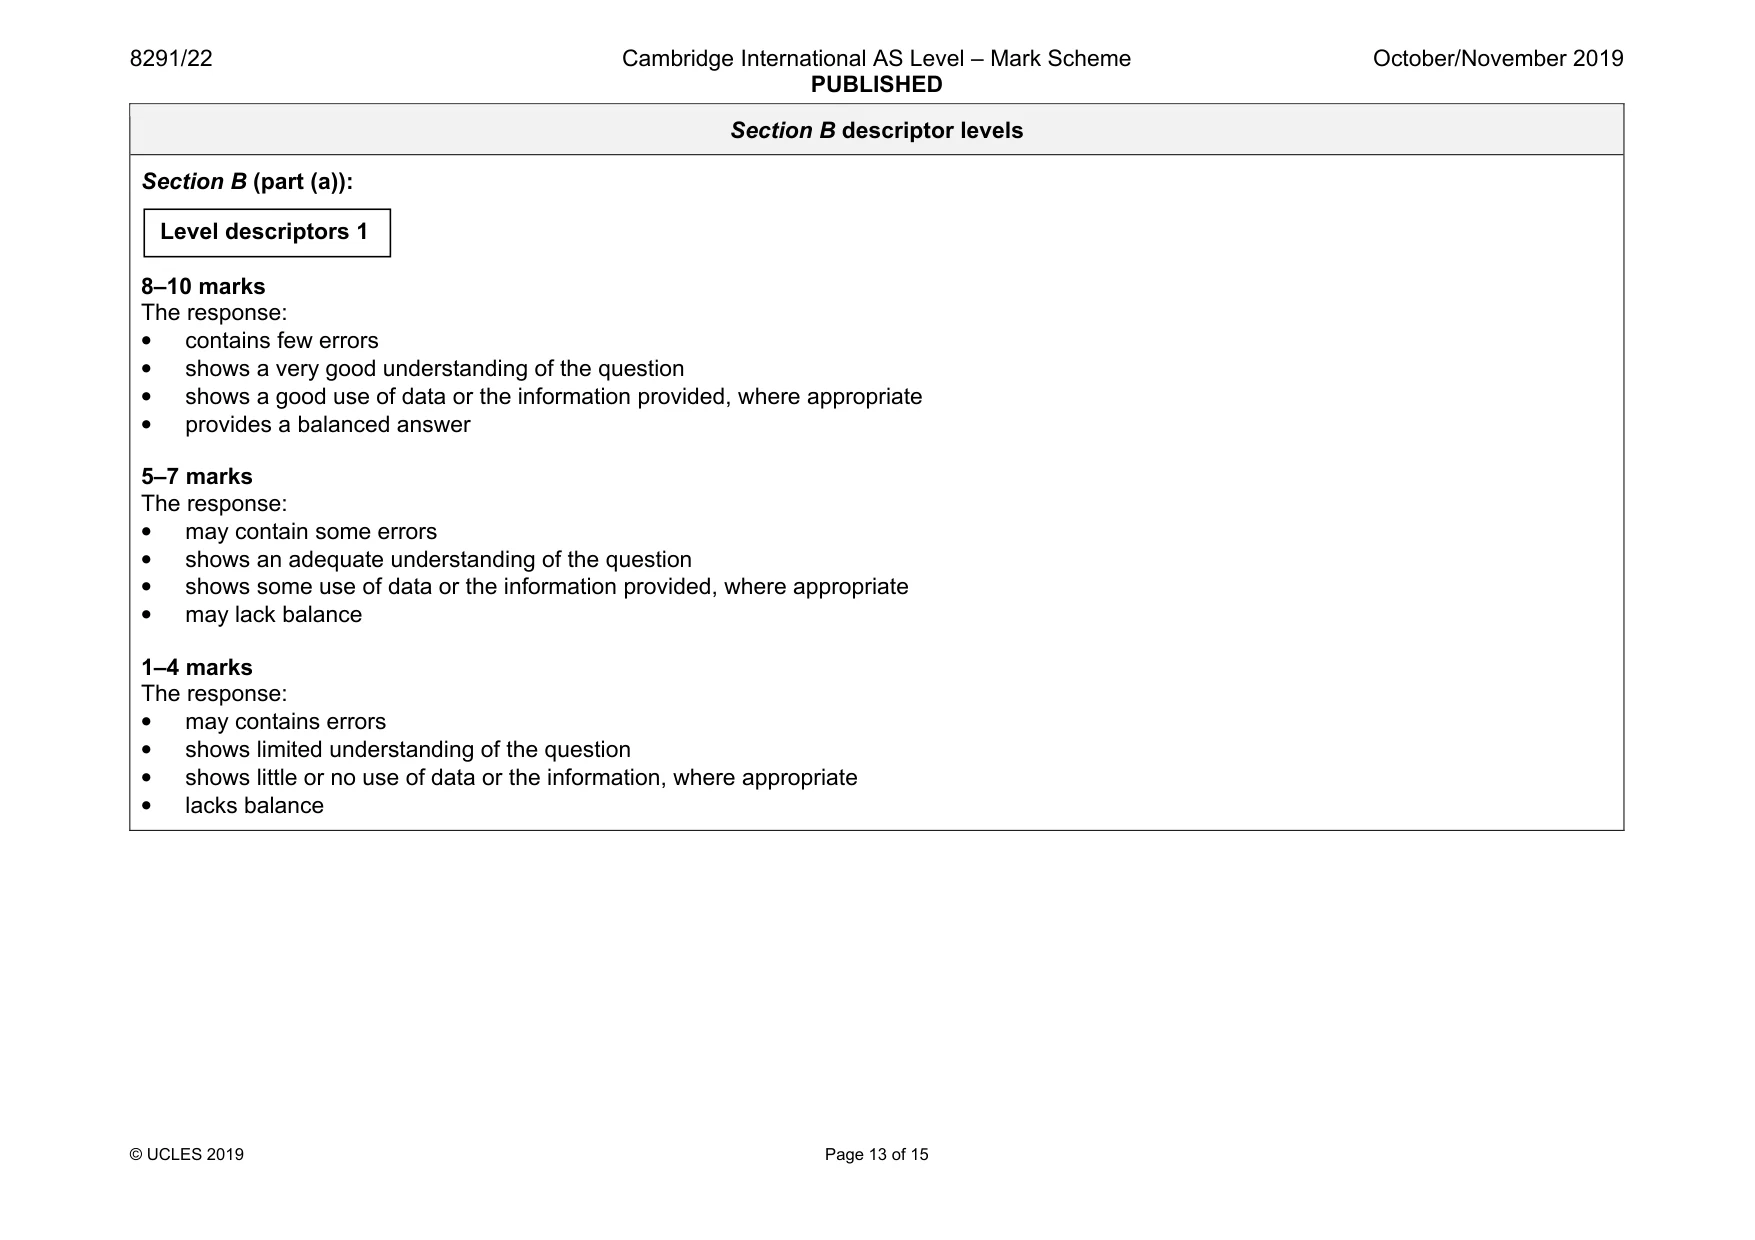
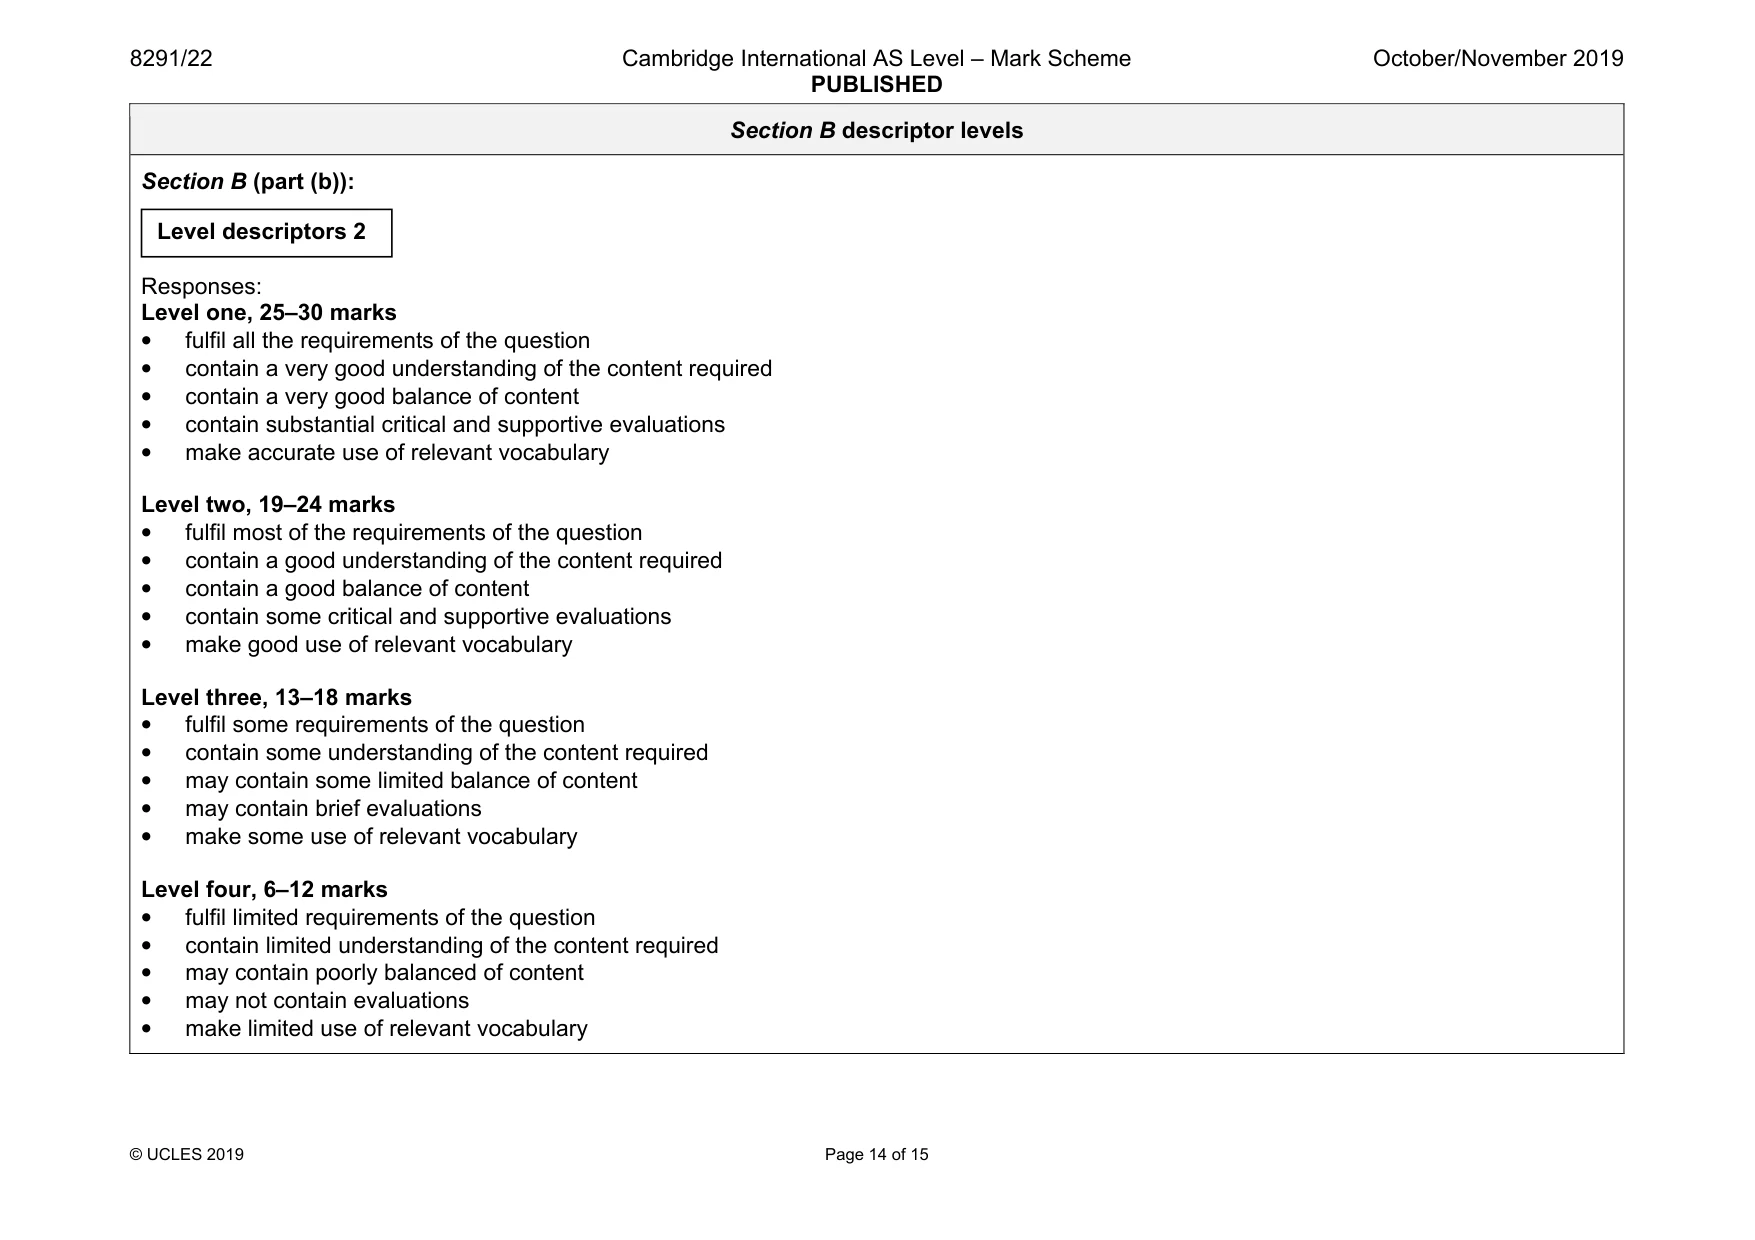
Mark scheme: 5(a) Abiotic factors such as light, temperature and moisture influence the tolerance of species determining the limits of where they can survive and as a result the different biomes are formed. These can also be considered limiting factors. Biotic factors include supply of food, competition through predation, for space and resources. Humans have a large effect including agricultural practices, building and introducing species to new areas. please use level descriptors 1 10 5(b) The question requirements are: • to show knowledge of ecosystems • to show knowledge of different methods of conservation methods relative to maintaining biodiversity • to assess the relative success of such methods. Indicative content: Selection of relevant ecosystem. The different methods of conservation could include National parks, nature reserves, SSSIs, zoos and safari parks. Breeding and release programmes. Education and involvement of local population, ecotourism, controlled hunting including bans and seasons, and use of legislation. Appropriate descriptions of the methods chosen and assessment of relative success. Issues raised could include problems of poaching, loss of land to local people unless they are involved, economics of protection, difficulties of enforcement, political will and education. please use level descriptors 2 30 Section B descriptor levels Descriptor Award Mark Consistently meets the level criteria Mark at top of level Meets the criteria, but with some inconsistency Middle, mark to just below top mark Meets most of level criteria, but not all convincingly Just below middle, mark to just above bottom mark On the borderline of this level and the one below Mark at bottom of level Section B descriptor levels Section B (part (a)): 8–10 marks The response: • contains few errors • shows a very good understanding of the question • shows a good use of data or the information provided, where appropriate • provides a balanced answer 5–7 marks The response: • may contain some errors • shows an adequate understanding of the question • shows some use of data or the information provided, where appropriate • may lack balance 1–4 marks The response: • may contains errors • shows limited understanding of the question • shows little or no use of data or the information, where appropriate • lacks balance Level descriptors 1 Section B descriptor levels Section B (part (b)): Responses: Level one, 25–30 marks • fulfil all the requirements of the question • contain a very good understanding of the content required • contain a very good balance of content • contain substantial critical and supportive evaluations • make accurate use of relevant vocabulary Level two, 19–24 marks • fulfil most of the requirements of the question • contain a good understanding of the content required • contain a good balance of content • contain some critical and supportive evaluations • make good use of relevant vocabulary Level three, 13–18 marks • fulfil some requirements of the question • contain some understanding of the content required • may contain some limited balance of content • may contain brief evaluations • make some use of relevant vocabulary Level four, 6–12 marks • fulfil limited requirements of the question • contain limited understanding of the content required • may contain poorly balanced of content • may not contain evaluations • make limited use of relevant vocabulary Level descriptors 2 Section B descriptor levels Level five, 1–5 marks • fulfil a few of the requirements of the question • contain a very limited understanding of the content required • are likely to be unbalanced and undeveloped • evaluative statements are likely to be missing • make no use of relevant vocabulary
What was in this paper
The subtopics covered by these 5 questions, and how many questions each got. Open one in a new tab to see every Cambridge question on it.
What you needed in this session
Cambridge’s own grade thresholds for 2019 Oct/Nov, Paper 2 · Variant 2. A higher threshold means an easier paper — the bar moves with how the cohort did.