Cambridge A Level Environmental Management (AS only) 8291 — 2019 Oct/Nov Paper 2 · Variant 1
8291/21/O/N/19 · 5 questions · 80 marks · ≈90 min
The question paper and its mark scheme, free to read here and free to download. This is Cambridge’s own paper, exactly as it was sat.
Question paper12 pages
Mark scheme15 pages
Answers below. Sit the paper first if you are practising.
Questions as text
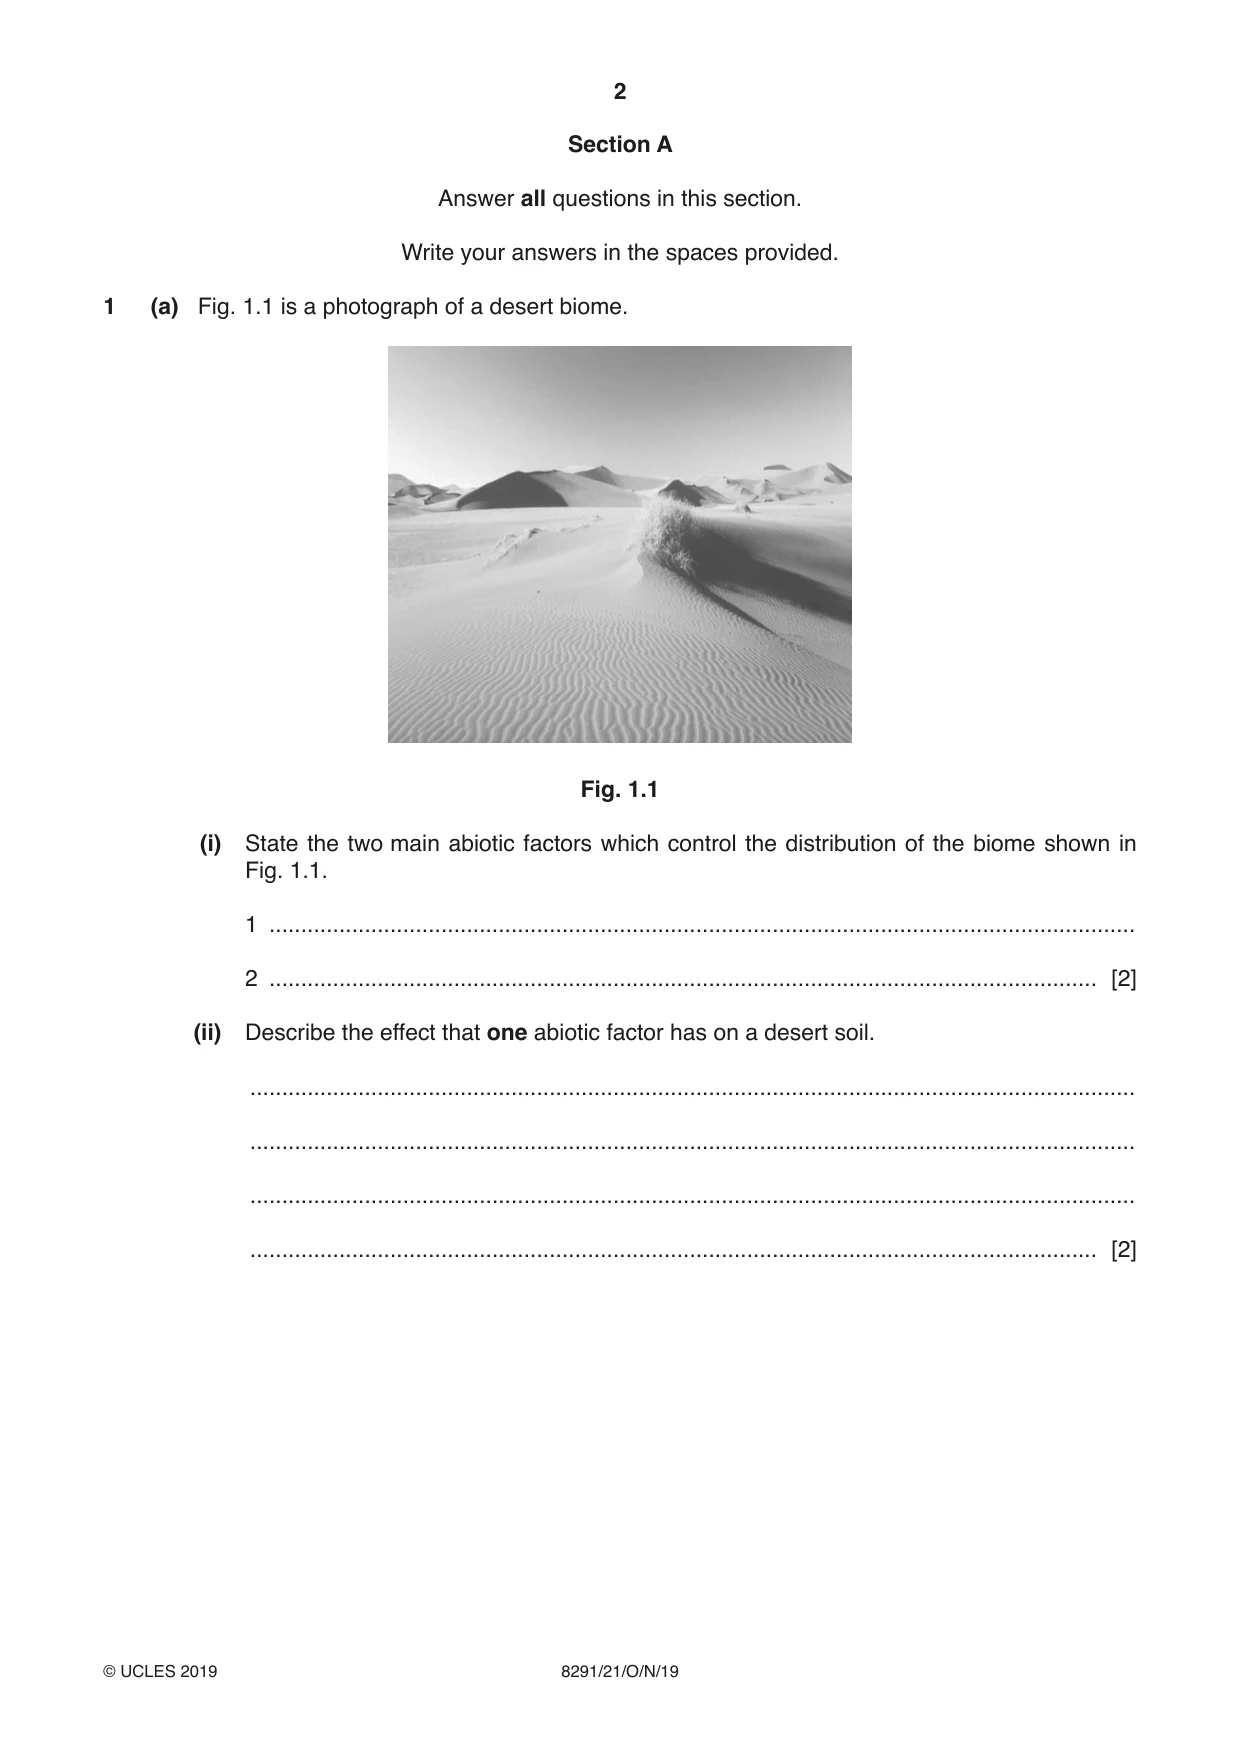
Q1 · A photograph of a desert biome
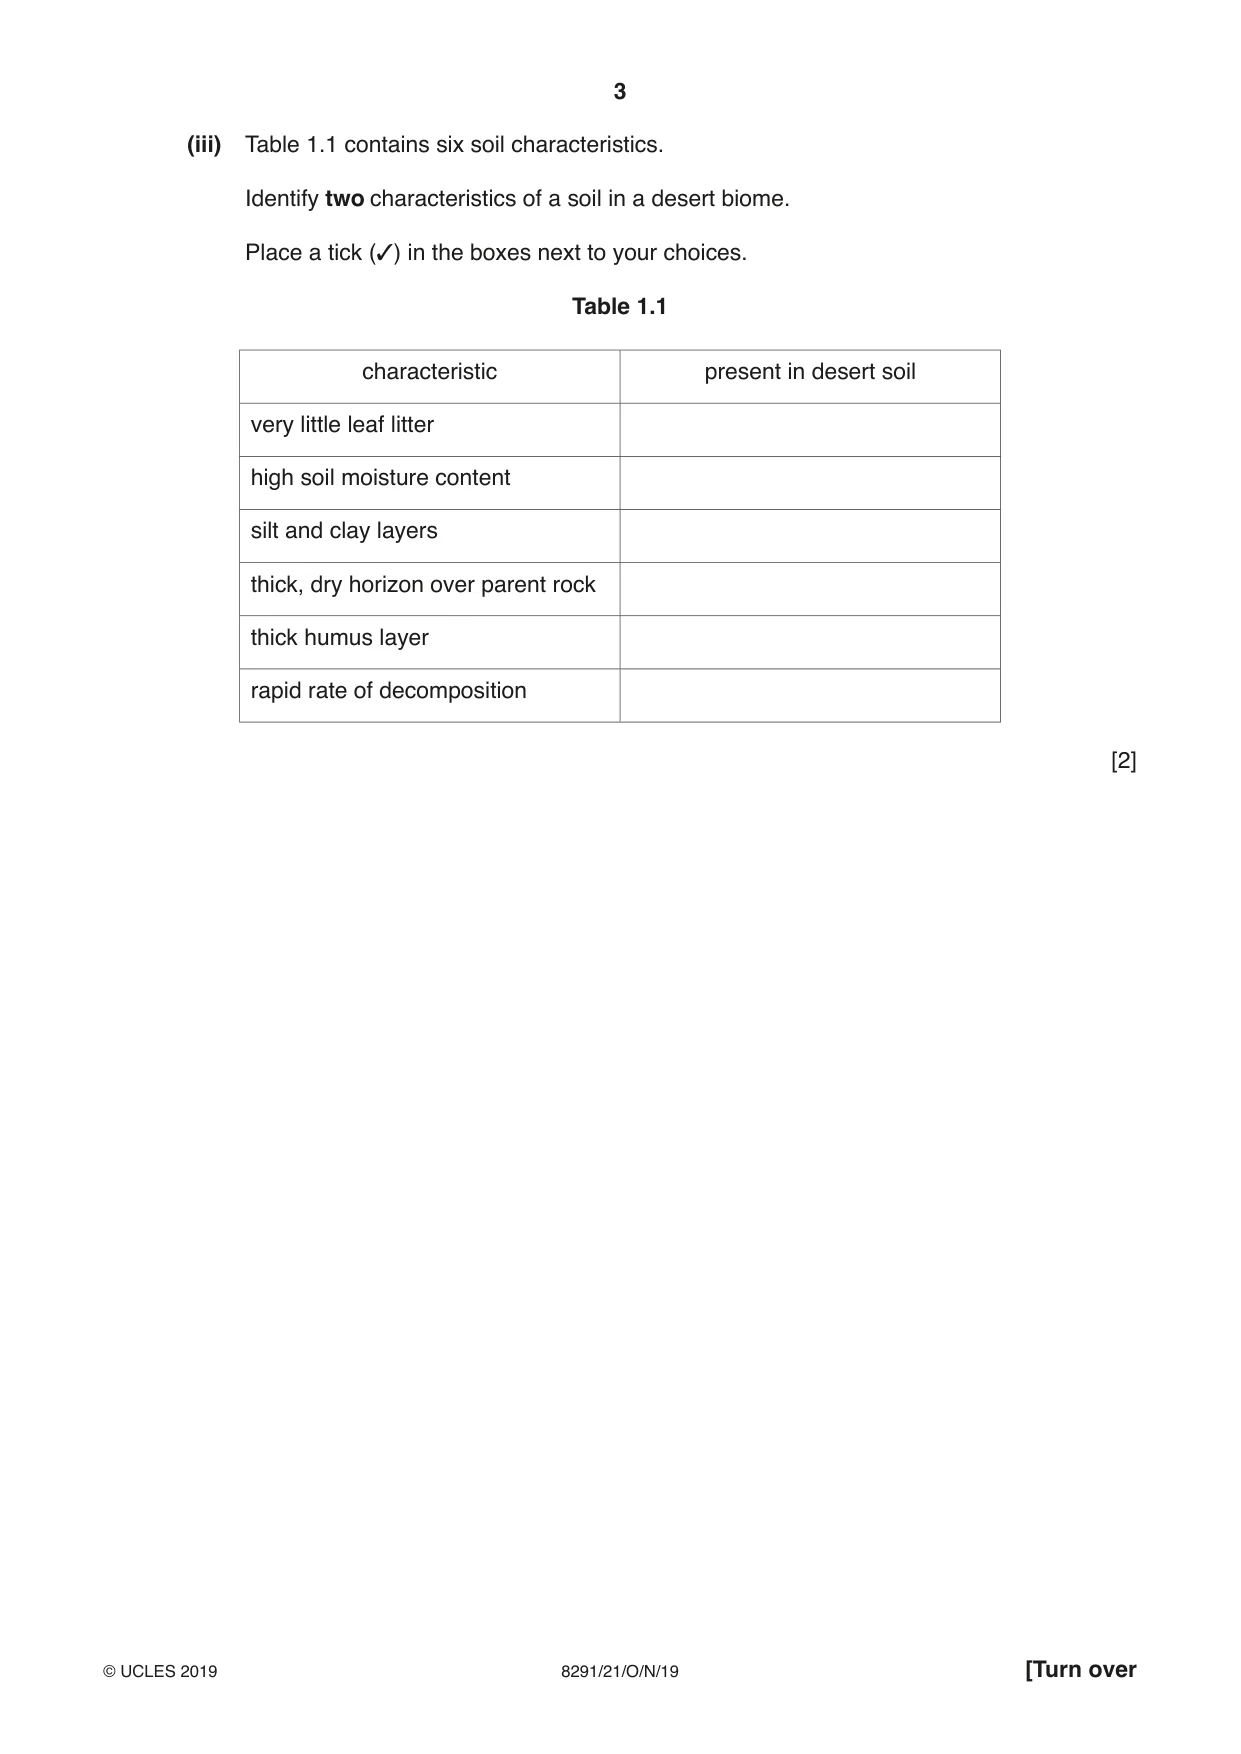
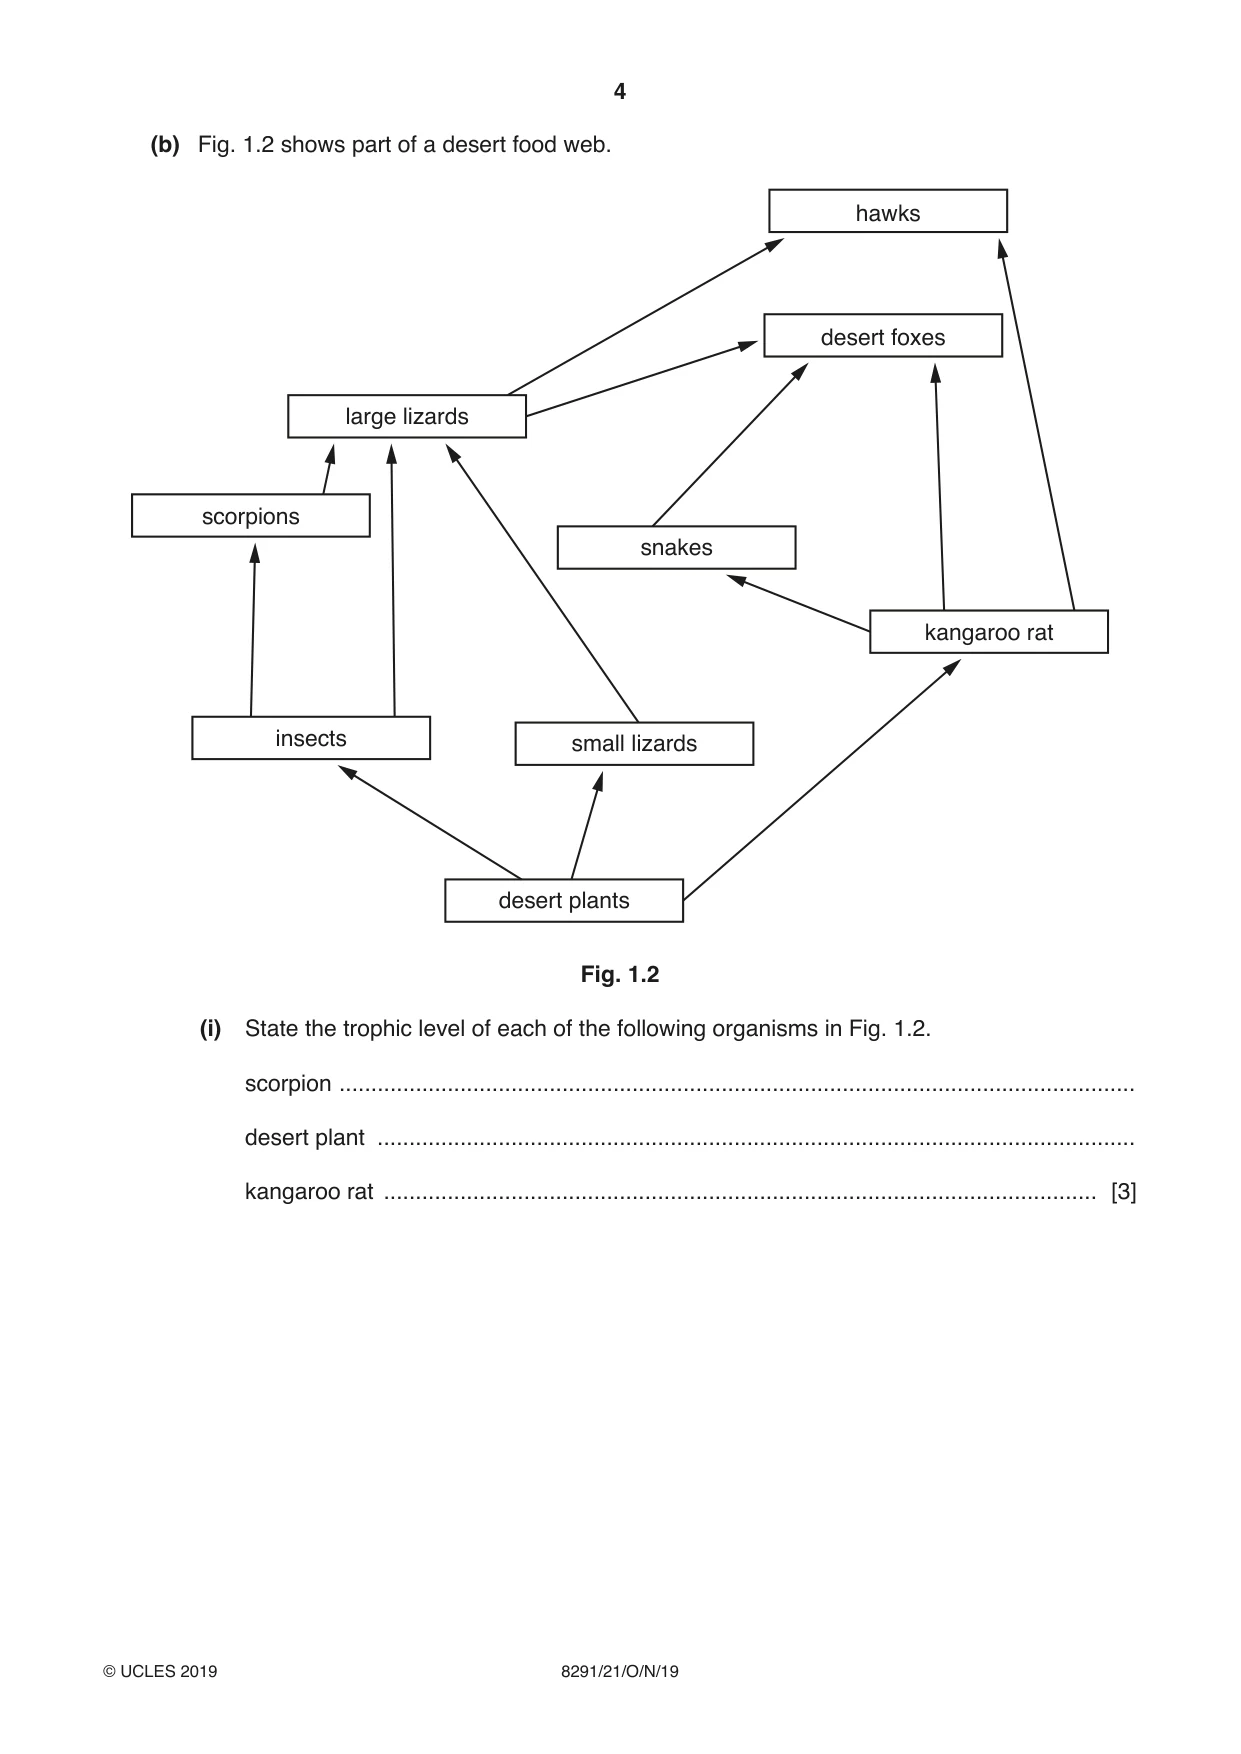
1 (a) Fig. 1.1 is a photograph of a desert biome. Fig. 1.1 (i) State the two main abiotic factors which control the distribution of the biome shown in Fig. 1.1. 1 ........................................................................................................................................ 2 .................................................................................................................................. [2] (ii) Describe the effect that one abiotic factor has on a desert soil. ........................................................................................................................................... ........................................................................................................................................... ........................................................................................................................................... ..................................................................................................................................... [2] (iii) Table 1.1 contains six soil characteristics. Identify two characteristics of a soil in a desert biome. Place a tick (3) in the boxes next to your choices. Table 1.1 characteristic present in desert soil very little leaf litter high soil moisture content silt and clay layers thick, dry horizon over parent rock thick humus layer rapid rate of decomposition [2] (b) Fig. 1.2 shows part of a desert food web. hawks desert foxes large lizards scorpions snakes kangaroo rat insects small lizards desert plants Fig. 1.2 (i) State the trophic level of each of the following organisms in Fig. 1.2. scorpion ............................................................................................................................. desert plant ....................................................................................................................... kangaroo rat ................................................................................................................ [3] (ii) Explain one possible effect of the loss of insects on the food web shown in Fig. 1.2. ........................................................................................................................................... ........................................................................................................................................... ........................................................................................................................................... ..................................................................................................................................... [2] (iii) State which trophic level has the least energy in a pyramid of energy. ..................................................................................................................................... [1] (iv) State which type of organism is essential for the breakdown of organic matter in an ecosystem. ..................................................................................................................................... [1] (v) Desertification is the process of desert biomes spreading into previously fertile areas. Describe two human activities responsible for desertification. ........................................................................................................................................... ........................................................................................................................................... ........................................................................................................................................... ........................................................................................................................................... ........................................................................................................................................... ........................................................................................................................................... ........................................................................................................................................... ..................................................................................................................................... [4] (vi) Suggest reasons why desertification is increasing. ........................................................................................................................................... ........................................................................................................................................... ........................................................................................................................................... ..................................................................................................................................... [3] [Total: 20]
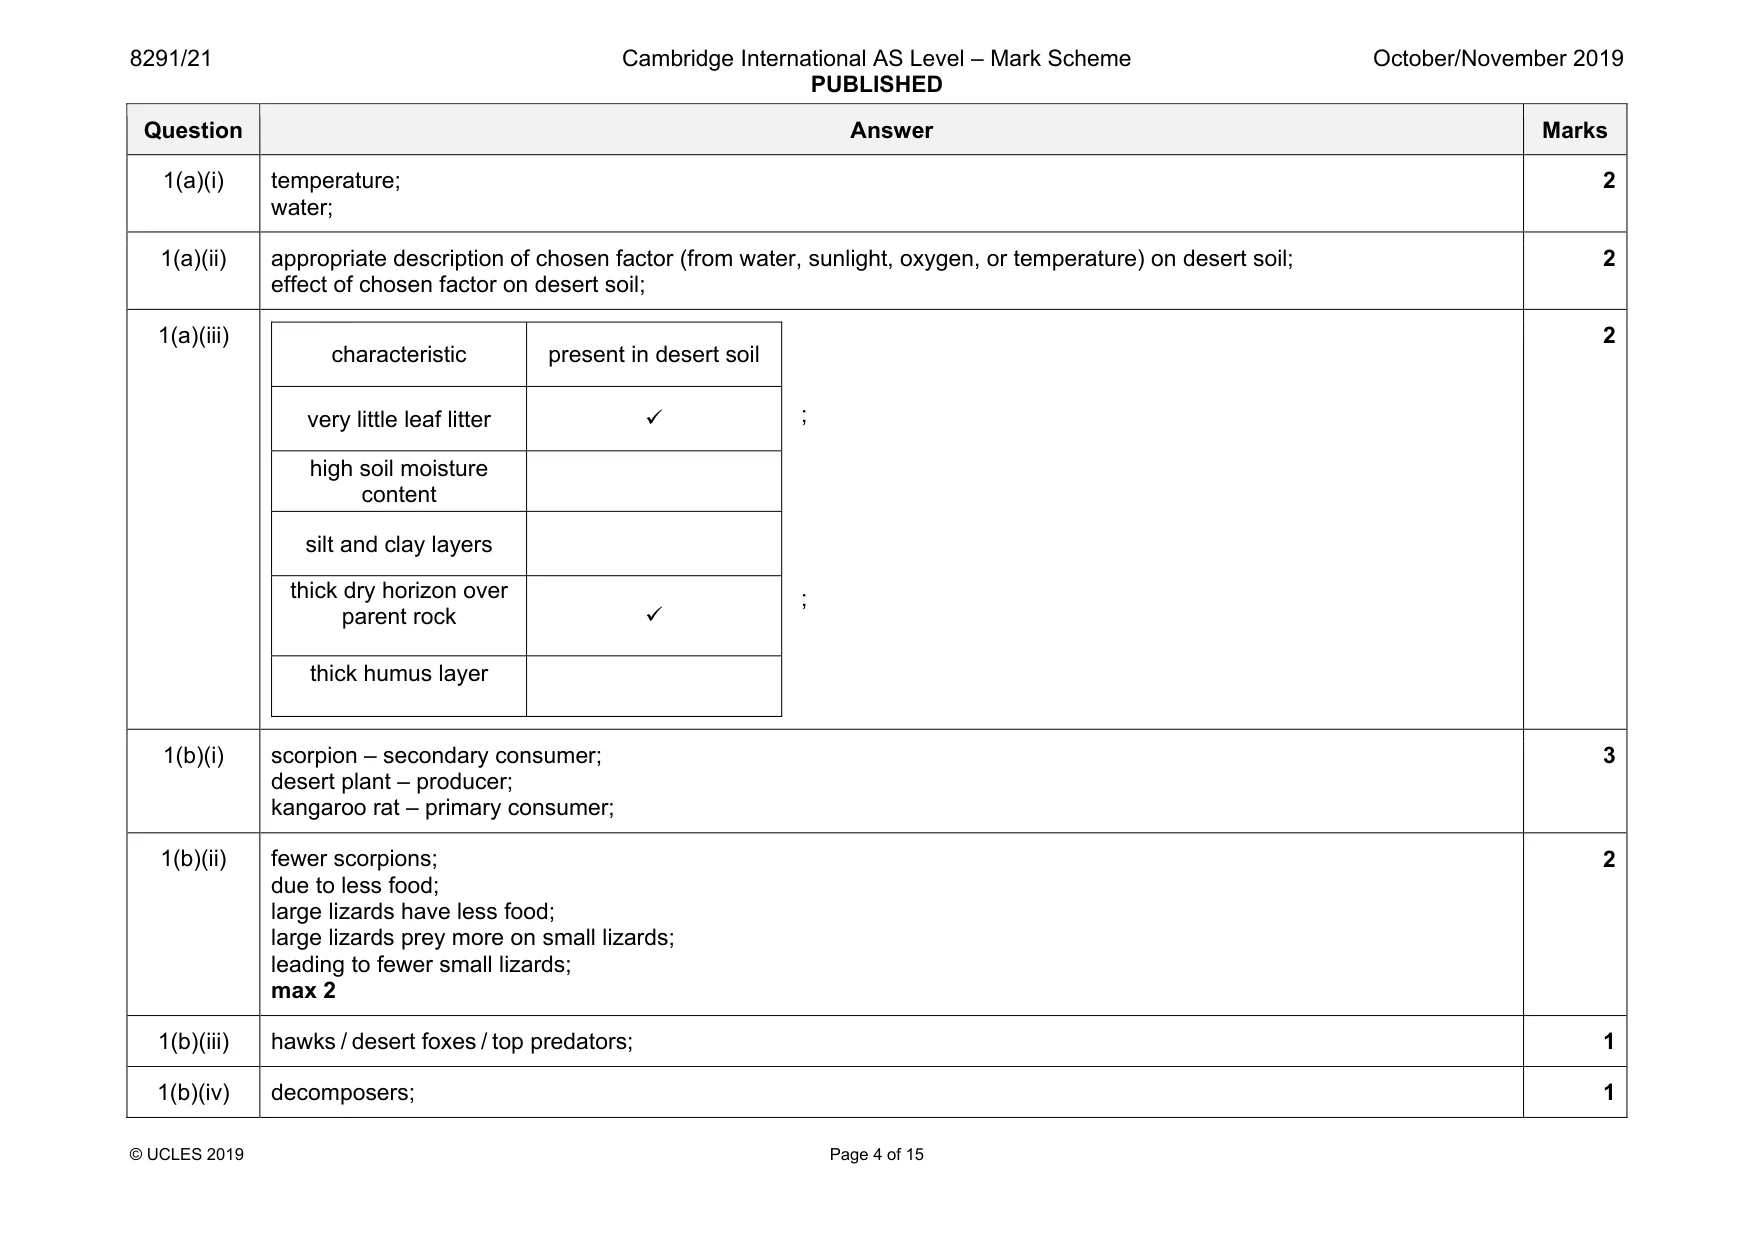
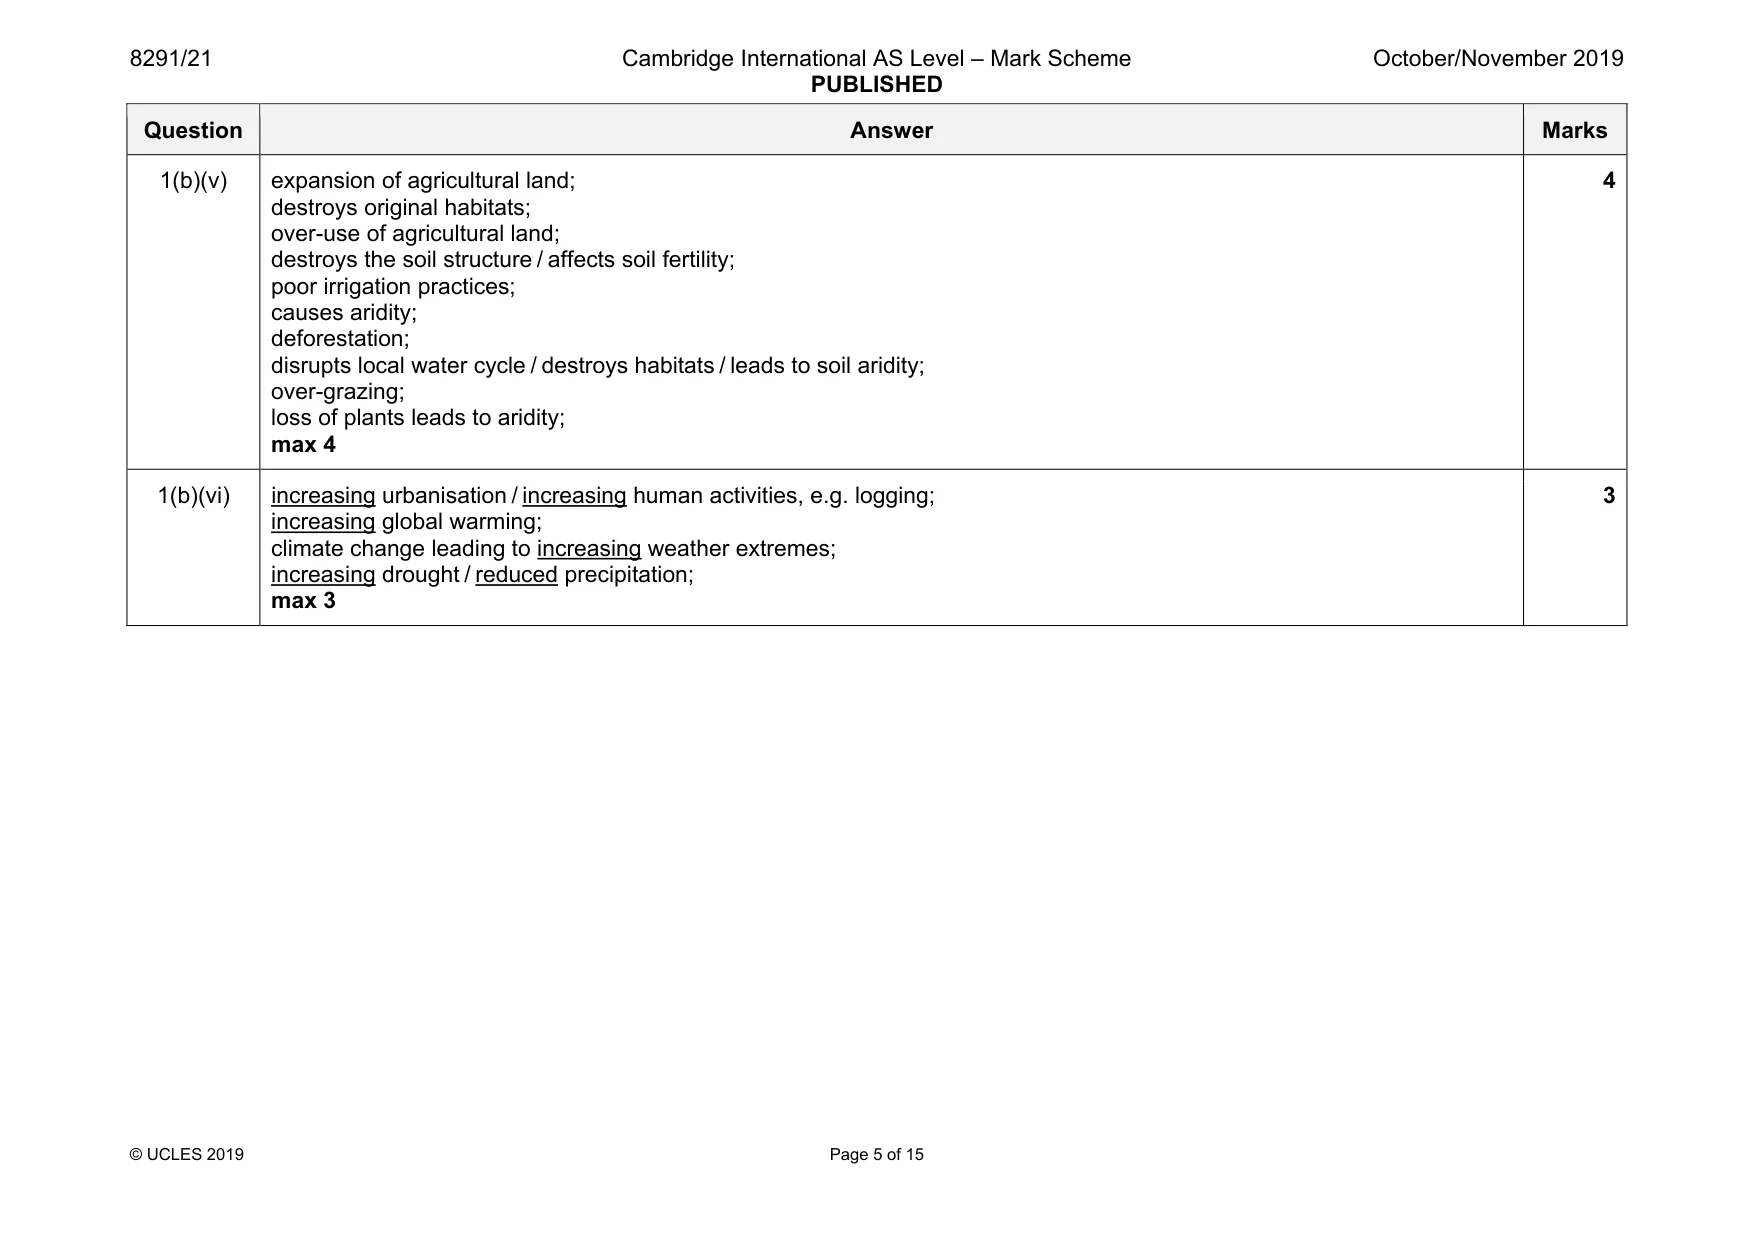
Mark scheme: 1(a)(i) temperature; water; 2 1(a)(ii) appropriate description of chosen factor (from water, sunlight, oxygen, or temperature) on desert soil; effect of chosen factor on desert soil; 2 1(a)(iii) ; ; characteristic present in desert soil very little leaf litter 9 high soil moisture content silt and clay layers thick dry horizon over parent rock 9 thick humus layer 2 1(b)(i) scorpion – secondary consumer; desert plant – producer; kangaroo rat – primary consumer; 3 1(b)(ii) fewer scorpions; due to less food; large lizards have less food; large lizards prey more on small lizards; leading to fewer small lizards; max 2 2 1(b)(iii) hawks / desert foxes / top predators; 1 1(b)(iv) decomposers; 1 Question Answer Marks 1(b)(v) expansion of agricultural land; destroys original habitats; over-use of agricultural land; destroys the soil structure / affects soil fertility; poor irrigation practices; causes aridity; deforestation; disrupts local water cycle / destroys habitats / leads to soil aridity; over-grazing; loss of plants leads to aridity; max 4 4 1(b)(vi) increasing urbanisation / increasing human activities, e.g. logging; increasing global warming; climate change leading to increasing weather extremes; increasing drought / reduced precipitation; max 3 3
Q2 · Water use by sector for countries with contrasting levels of economic development
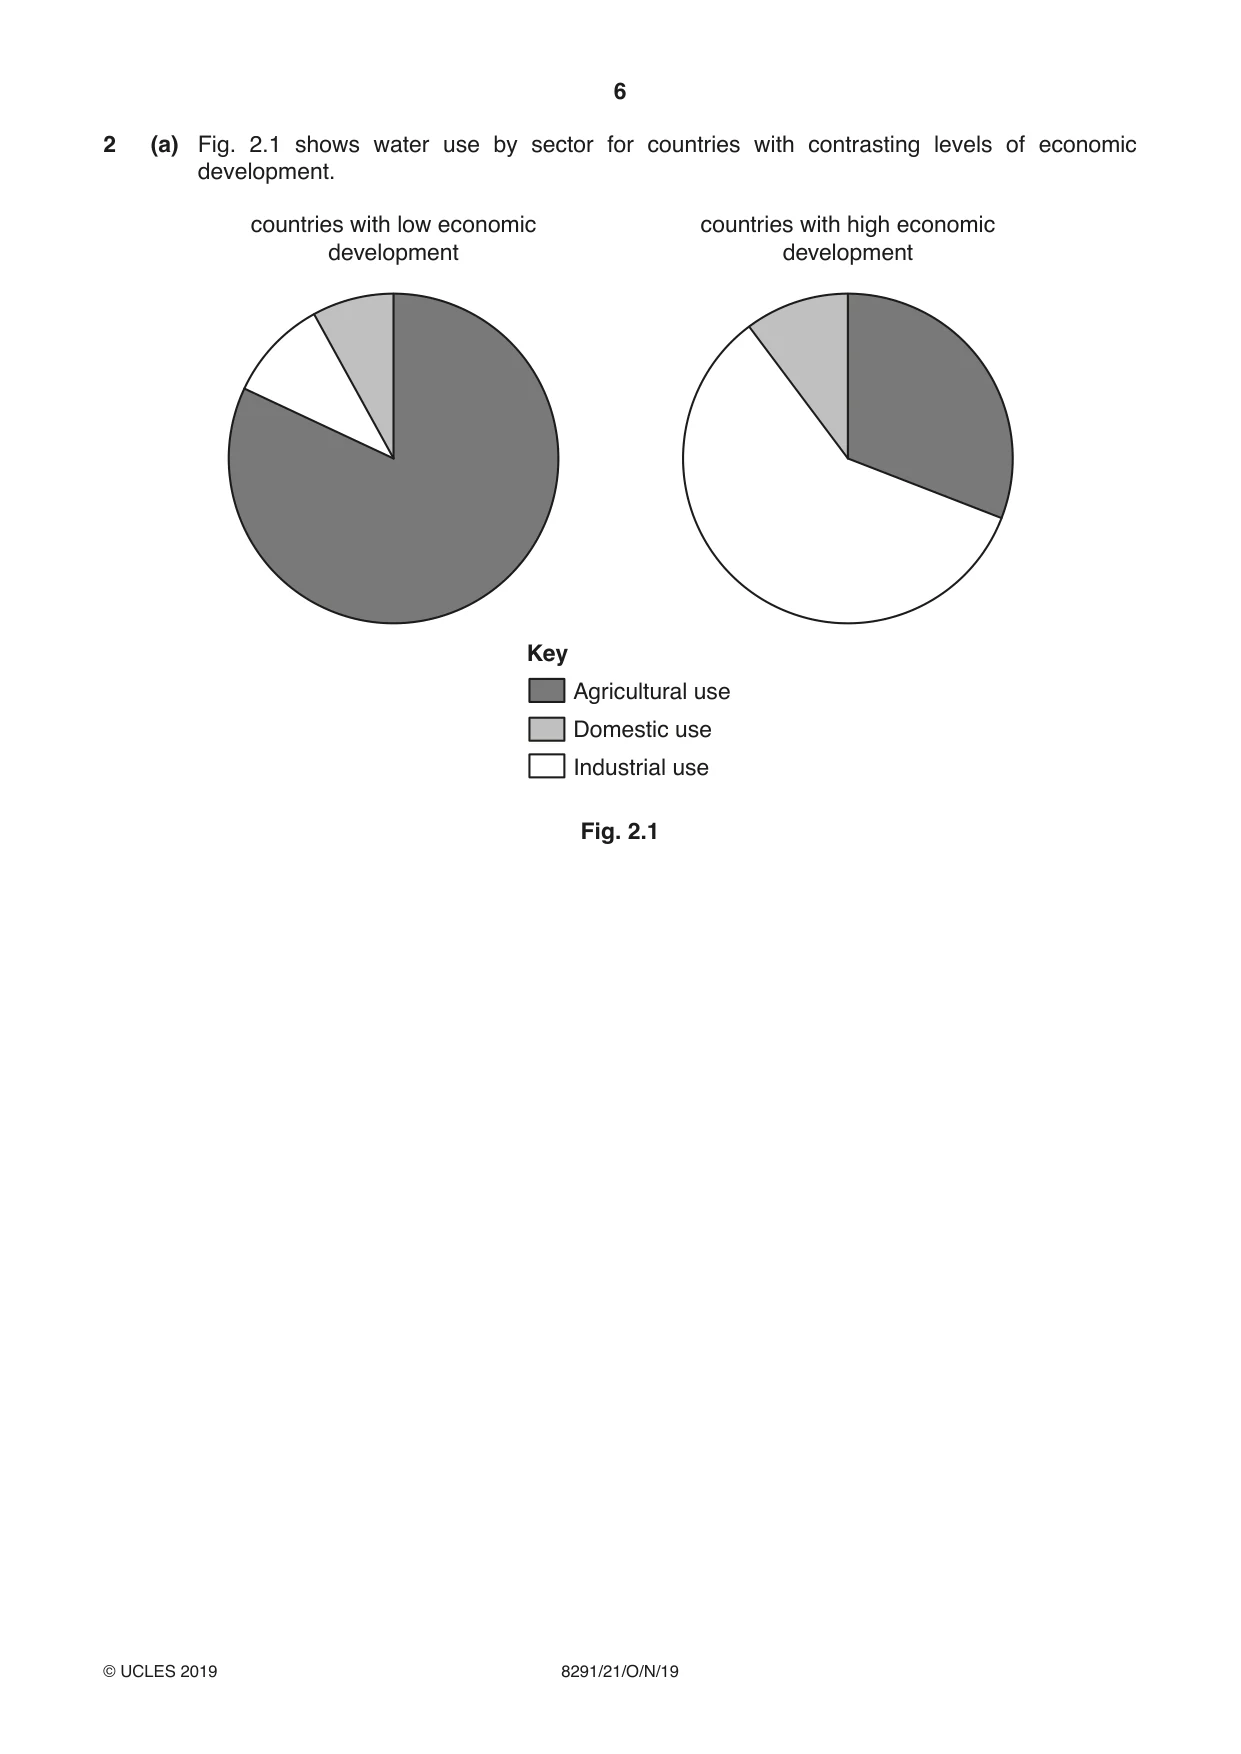
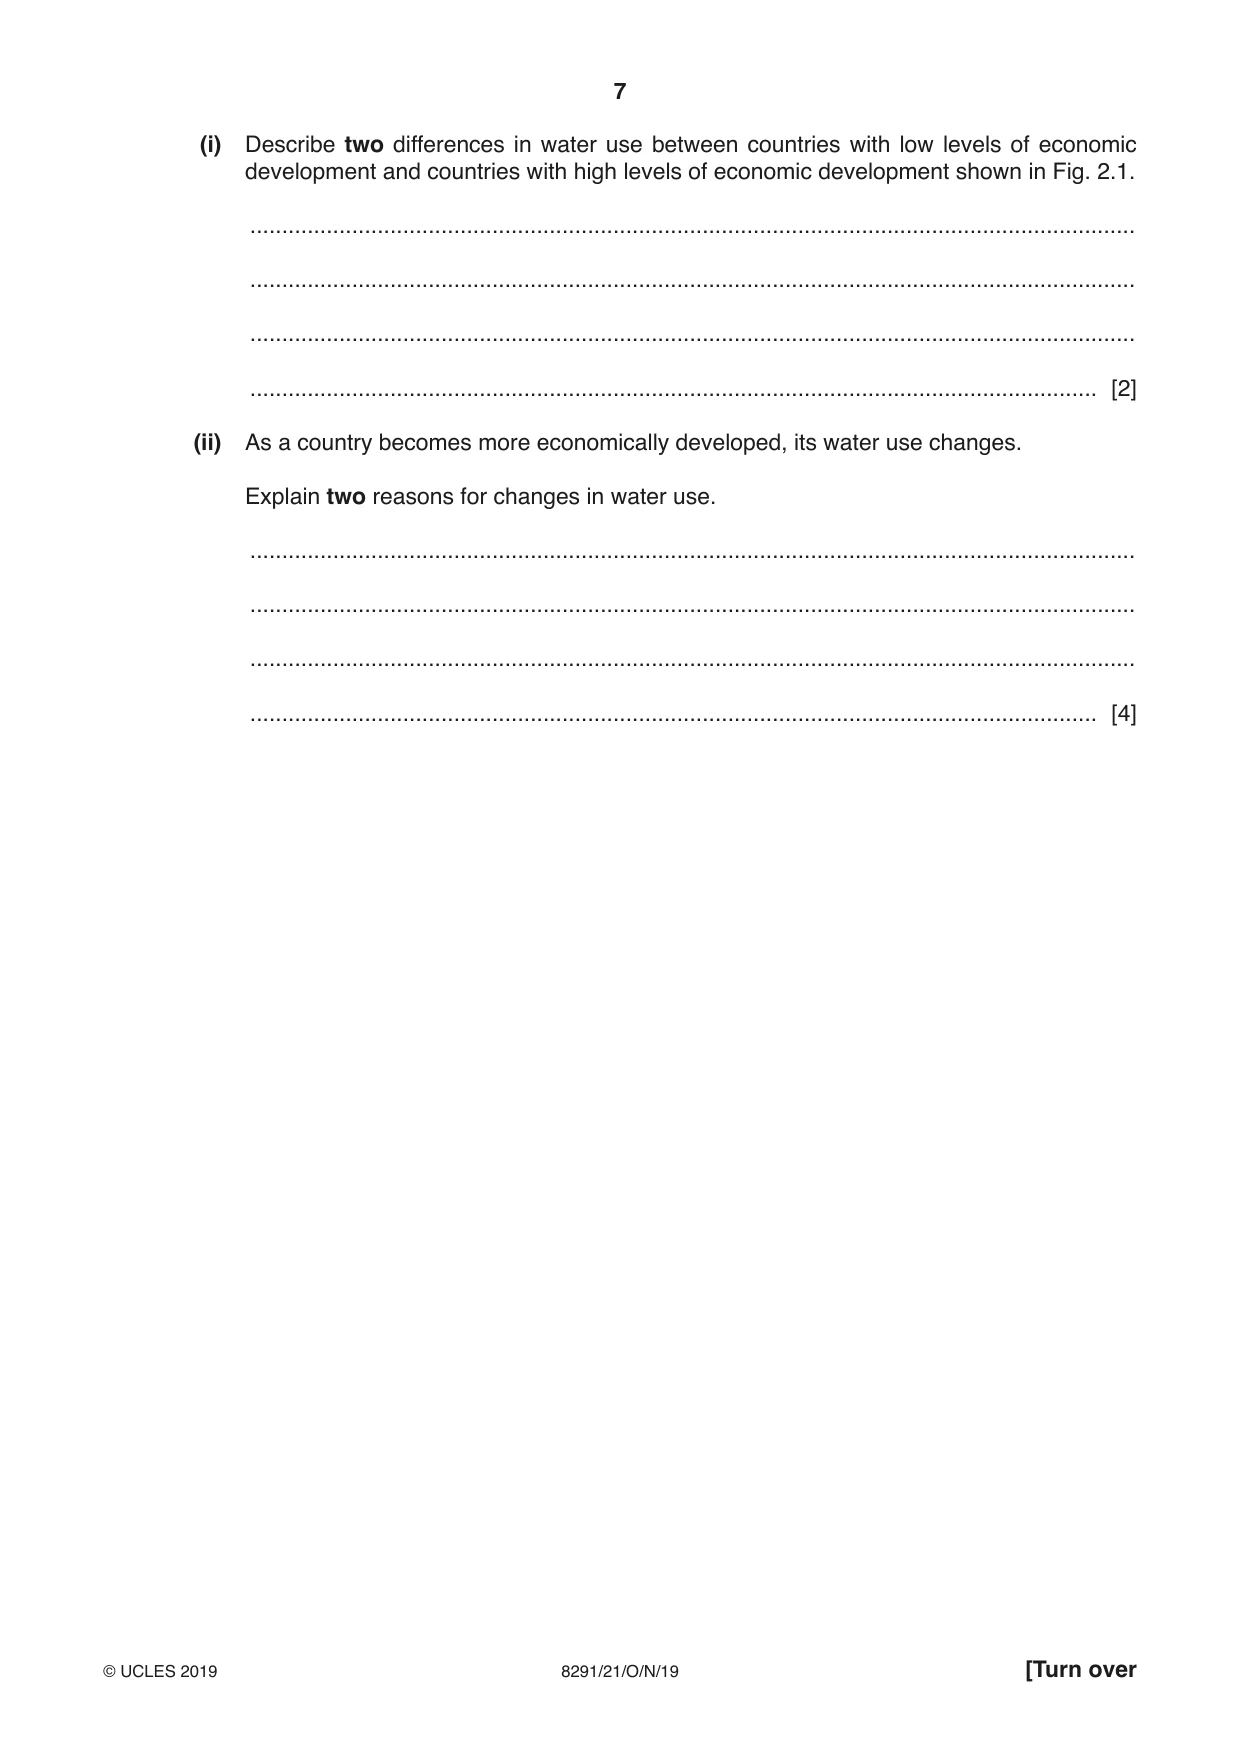
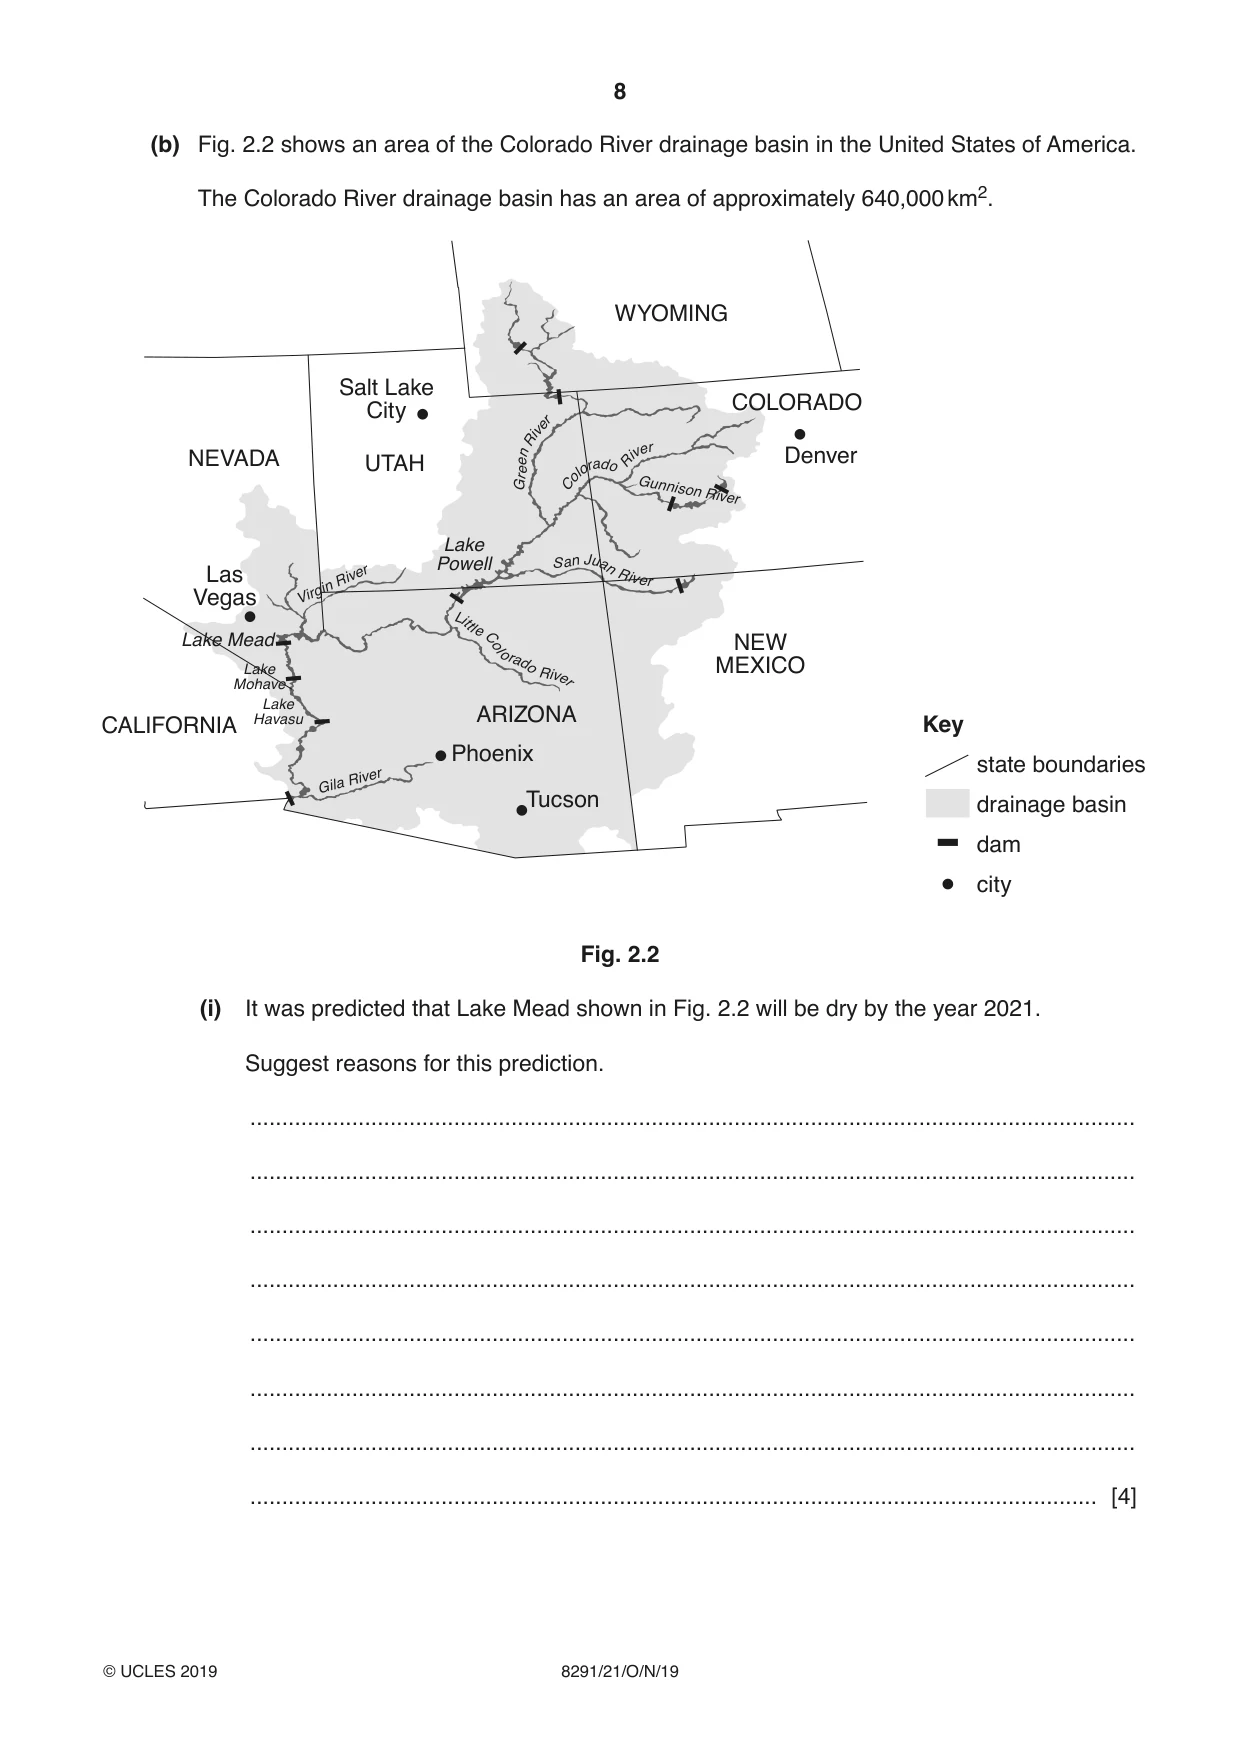
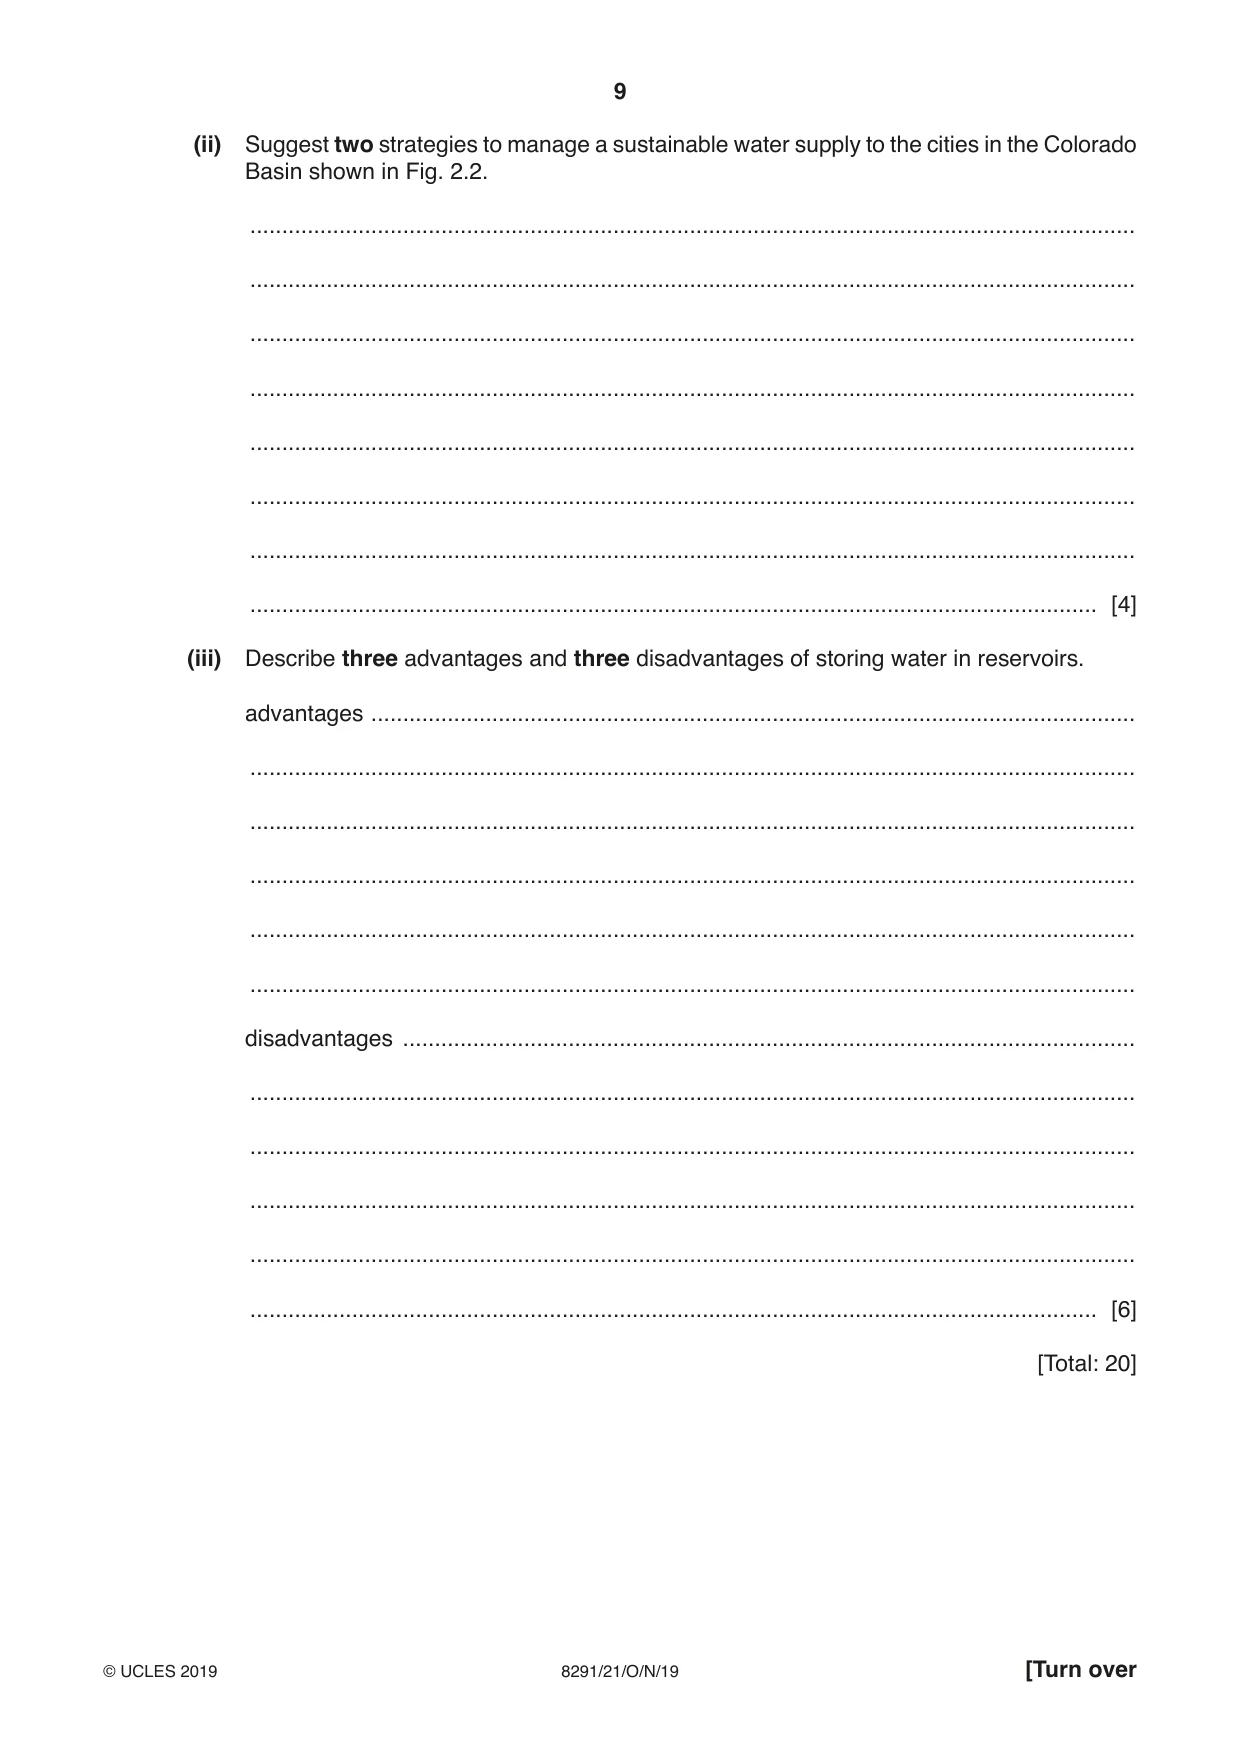
2 (a) Fig. 2.1 shows water use by sector for countries with contrasting levels of economic development. countries with low economic countries with high economic development development Key Agricultural use Domestic use Industrial use Fig. 2.1 (i) Describe two differences in water use between countries with low levels of economic development and countries with high levels of economic development shown in Fig. 2.1. ........................................................................................................................................... ........................................................................................................................................... ........................................................................................................................................... ..................................................................................................................................... [2] (ii) As a country becomes more economically developed, its water use changes. Explain two reasons for changes in water use. ........................................................................................................................................... ........................................................................................................................................... ........................................................................................................................................... ..................................................................................................................................... [4] (b) Fig. 2.2 shows an area of the Colorado River drainage basin in the United States of America. The Colorado River drainage basin has an area of approximately 640,000 km2. WYOMING Salt Lake COLORADO City iver R n Denver ee r NEVADA UTAH iver oloradoR G C Gunnison River Lake Powell San Juan Las River River Vegas Virgin Little C Lake Mead ol NEW orado Lake MEXICO River Mohave Lake Havasu ARIZONACALIFORNIA Key Phoenix state boundaries River Gila Tucson drainage basin dam city Fig. 2.2 (i) It was predicted that Lake Mead shown in Fig. 2.2 will be dry by the year 2021. Suggest reasons for this prediction. ........................................................................................................................................... ........................................................................................................................................... ........................................................................................................................................... ........................................................................................................................................... ........................................................................................................................................... ........................................................................................................................................... ........................................................................................................................................... ..................................................................................................................................... [4] (ii) Suggest two strategies to manage a sustainable water supply to the cities in the Colorado Basin shown in Fig. 2.2. ........................................................................................................................................... ........................................................................................................................................... ........................................................................................................................................... ........................................................................................................................................... ........................................................................................................................................... ........................................................................................................................................... ........................................................................................................................................... ..................................................................................................................................... [4] (iii) Describe three advantages and three disadvantages of storing water in reservoirs. advantages ........................................................................................................................ ........................................................................................................................................... ........................................................................................................................................... ........................................................................................................................................... ........................................................................................................................................... ........................................................................................................................................... disadvantages ................................................................................................................... ........................................................................................................................................... ........................................................................................................................................... ........................................................................................................................................... ........................................................................................................................................... ..................................................................................................................................... [6] [Total: 20]
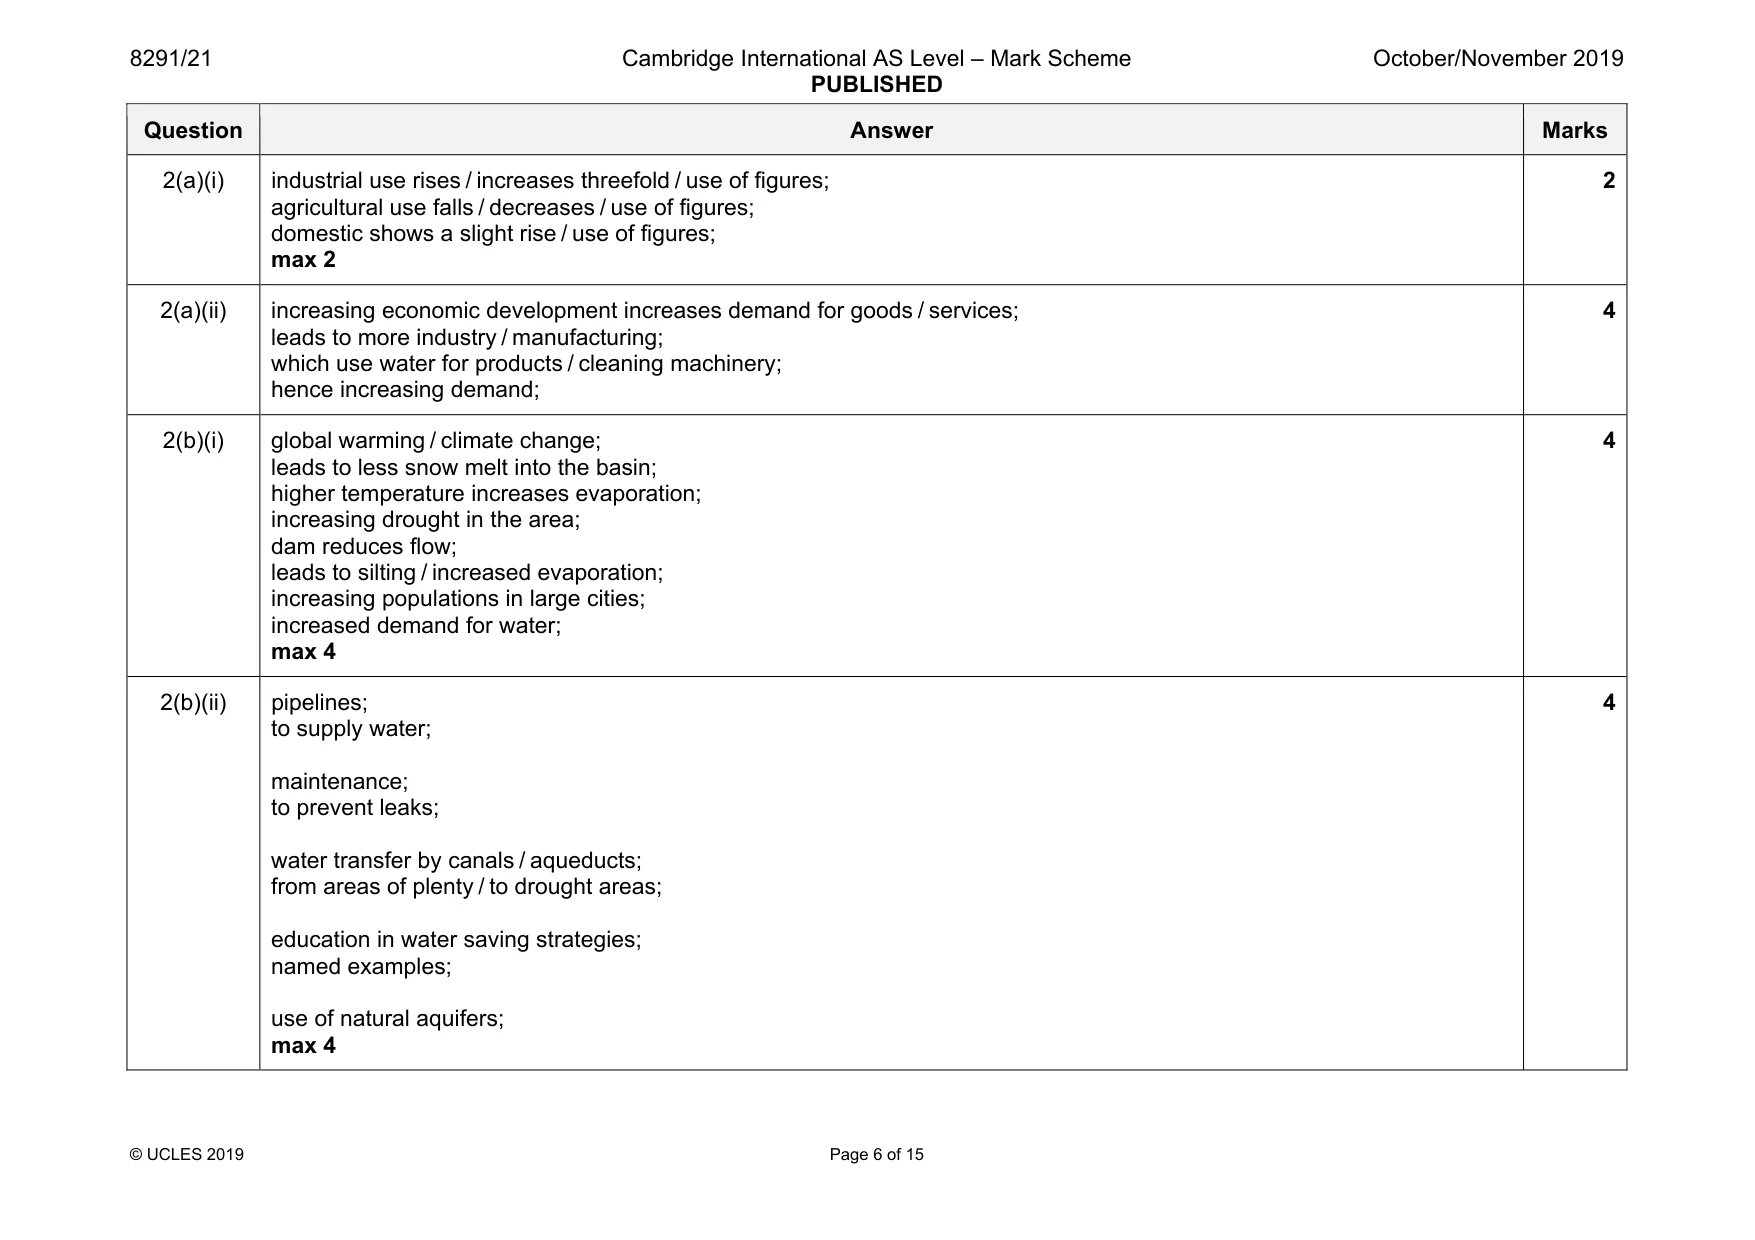
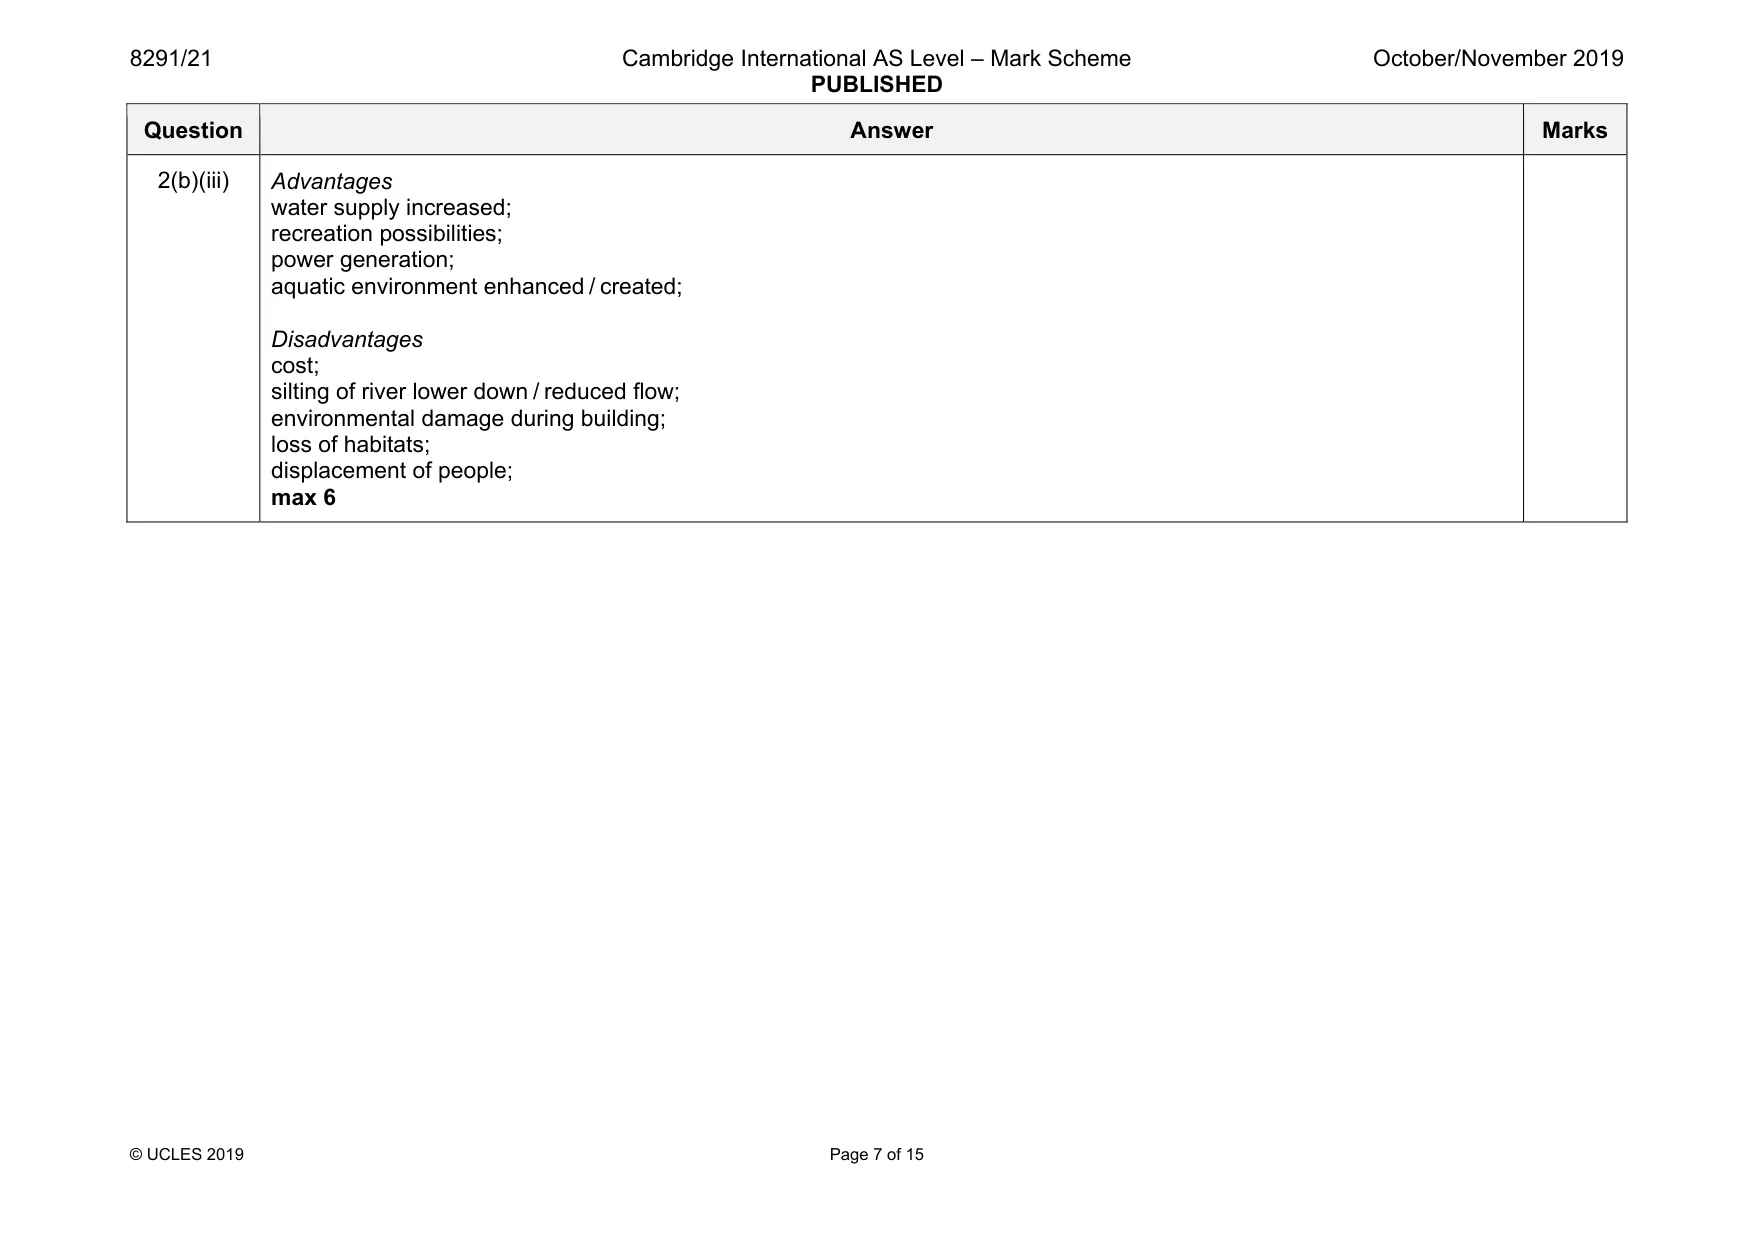
Mark scheme: 2(a)(i) industrial use rises / increases threefold / use of figures; agricultural use falls / decreases / use of figures; domestic shows a slight rise / use of figures; max 2 2 2(a)(ii) increasing economic development increases demand for goods / services; leads to more industry / manufacturing; which use water for products / cleaning machinery; hence increasing demand; 4 2(b)(i) global warming / climate change; leads to less snow melt into the basin; higher temperature increases evaporation; increasing drought in the area; dam reduces flow; leads to silting / increased evaporation; increasing populations in large cities; increased demand for water; max 4 4 2(b)(ii) pipelines; to supply water; maintenance; to prevent leaks; water transfer by canals / aqueducts; from areas of plenty / to drought areas; education in water saving strategies; named examples; use of natural aquifers; max 4 4 Question Answer Marks 2(b)(iii) Advantages water supply increased; recreation possibilities; power generation; aquatic environment enhanced / created; Disadvantages cost; silting of river lower down / reduced flow; environmental damage during building; loss of habitats; displacement of people; max 6
Q3 · An extract from an article
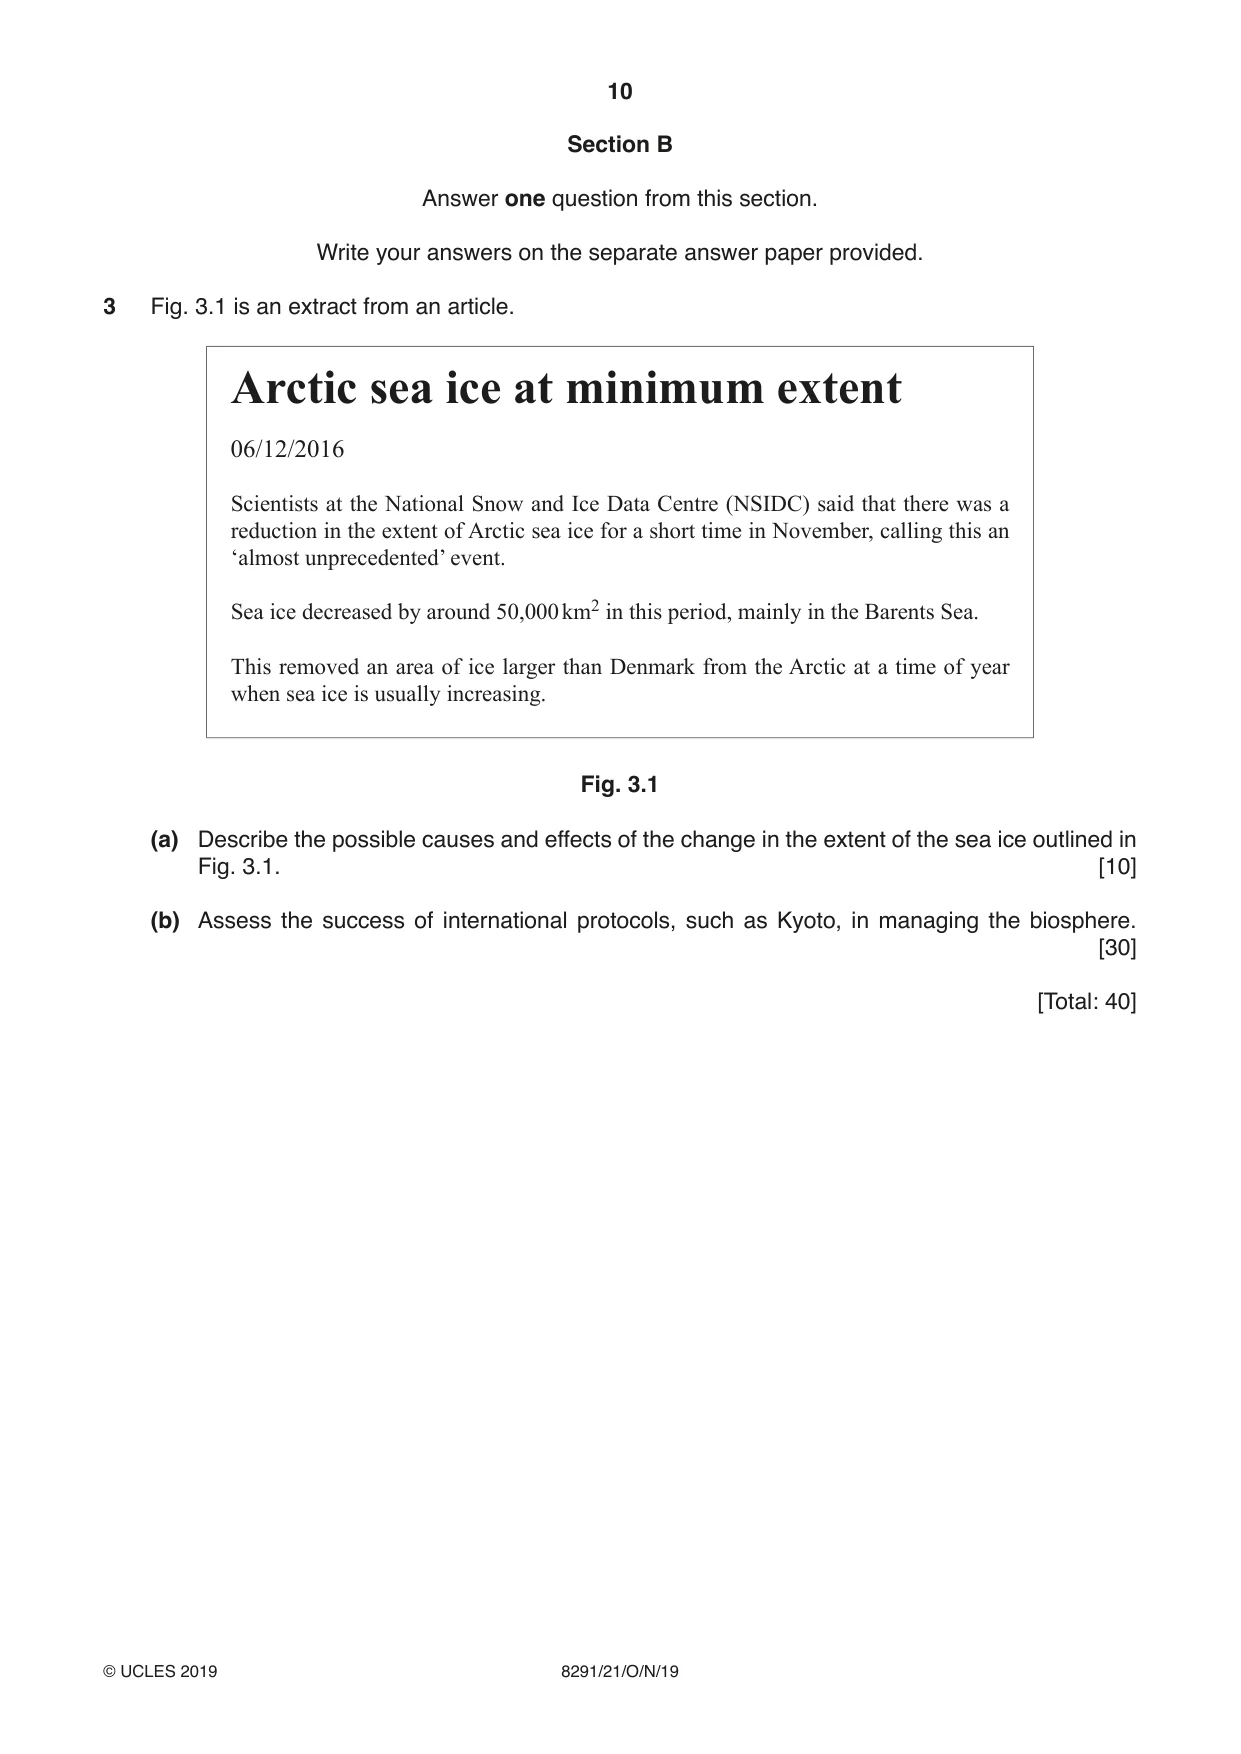
3 Fig. 3.1 is an extract from an article. Arctic sea ice at minimum extent 06/12/2016 Scientists at the National Snow and Ice Data Centre (NSIDC) said that there was a reduction in the extent of Arctic sea ice for a short time in November, calling this an ‘almost unprecedented’ event. Sea ice decreased by around 50,000 km2 in this period, mainly in the Barents Sea. This removed an area of ice larger than Denmark from the Arctic at a time of year when sea ice is usually increasing. Fig. 3.1 (a) Describe the possible causes and effects of the change in the extent of the sea ice outlined in Fig. 3.1. [10] (b) Assess the success of international protocols, such as Kyoto, in managing the biosphere. [30] [Total: 40]
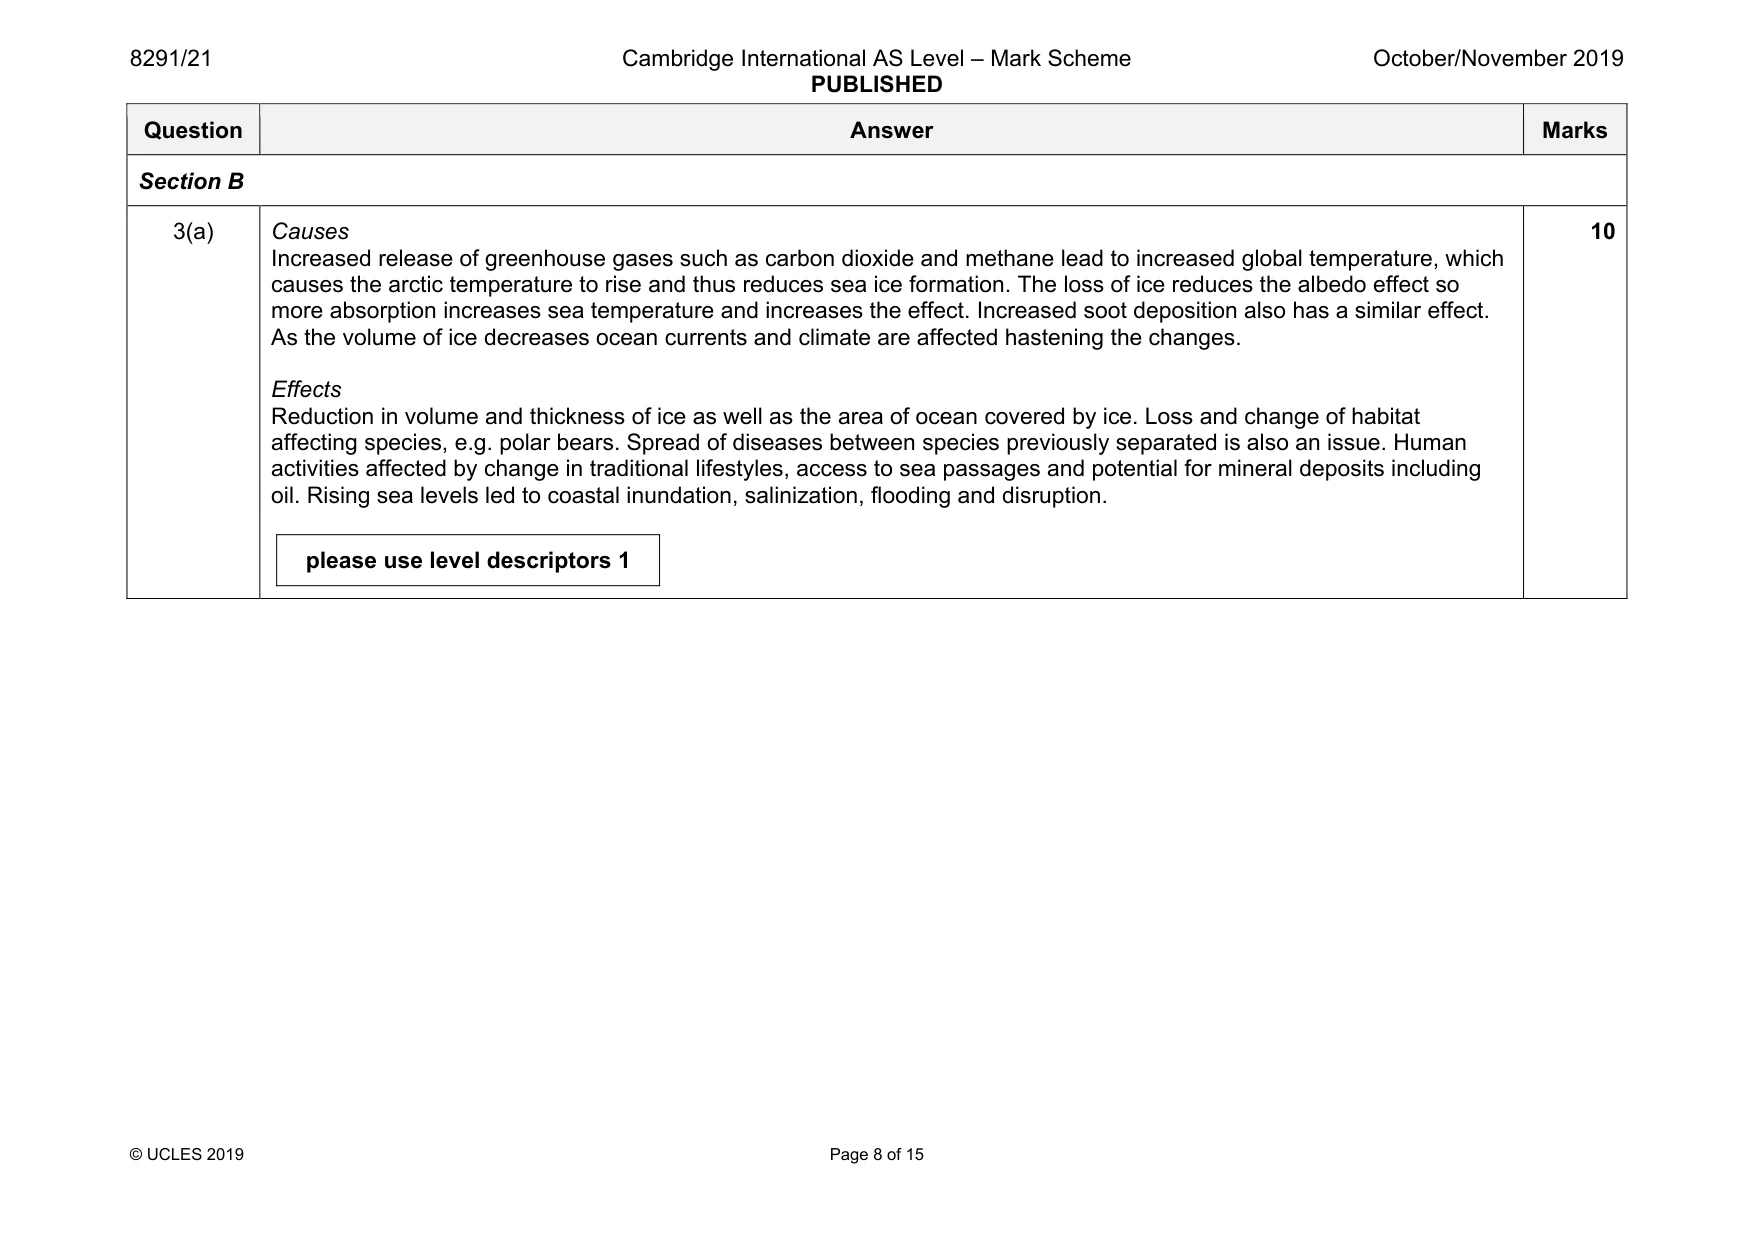
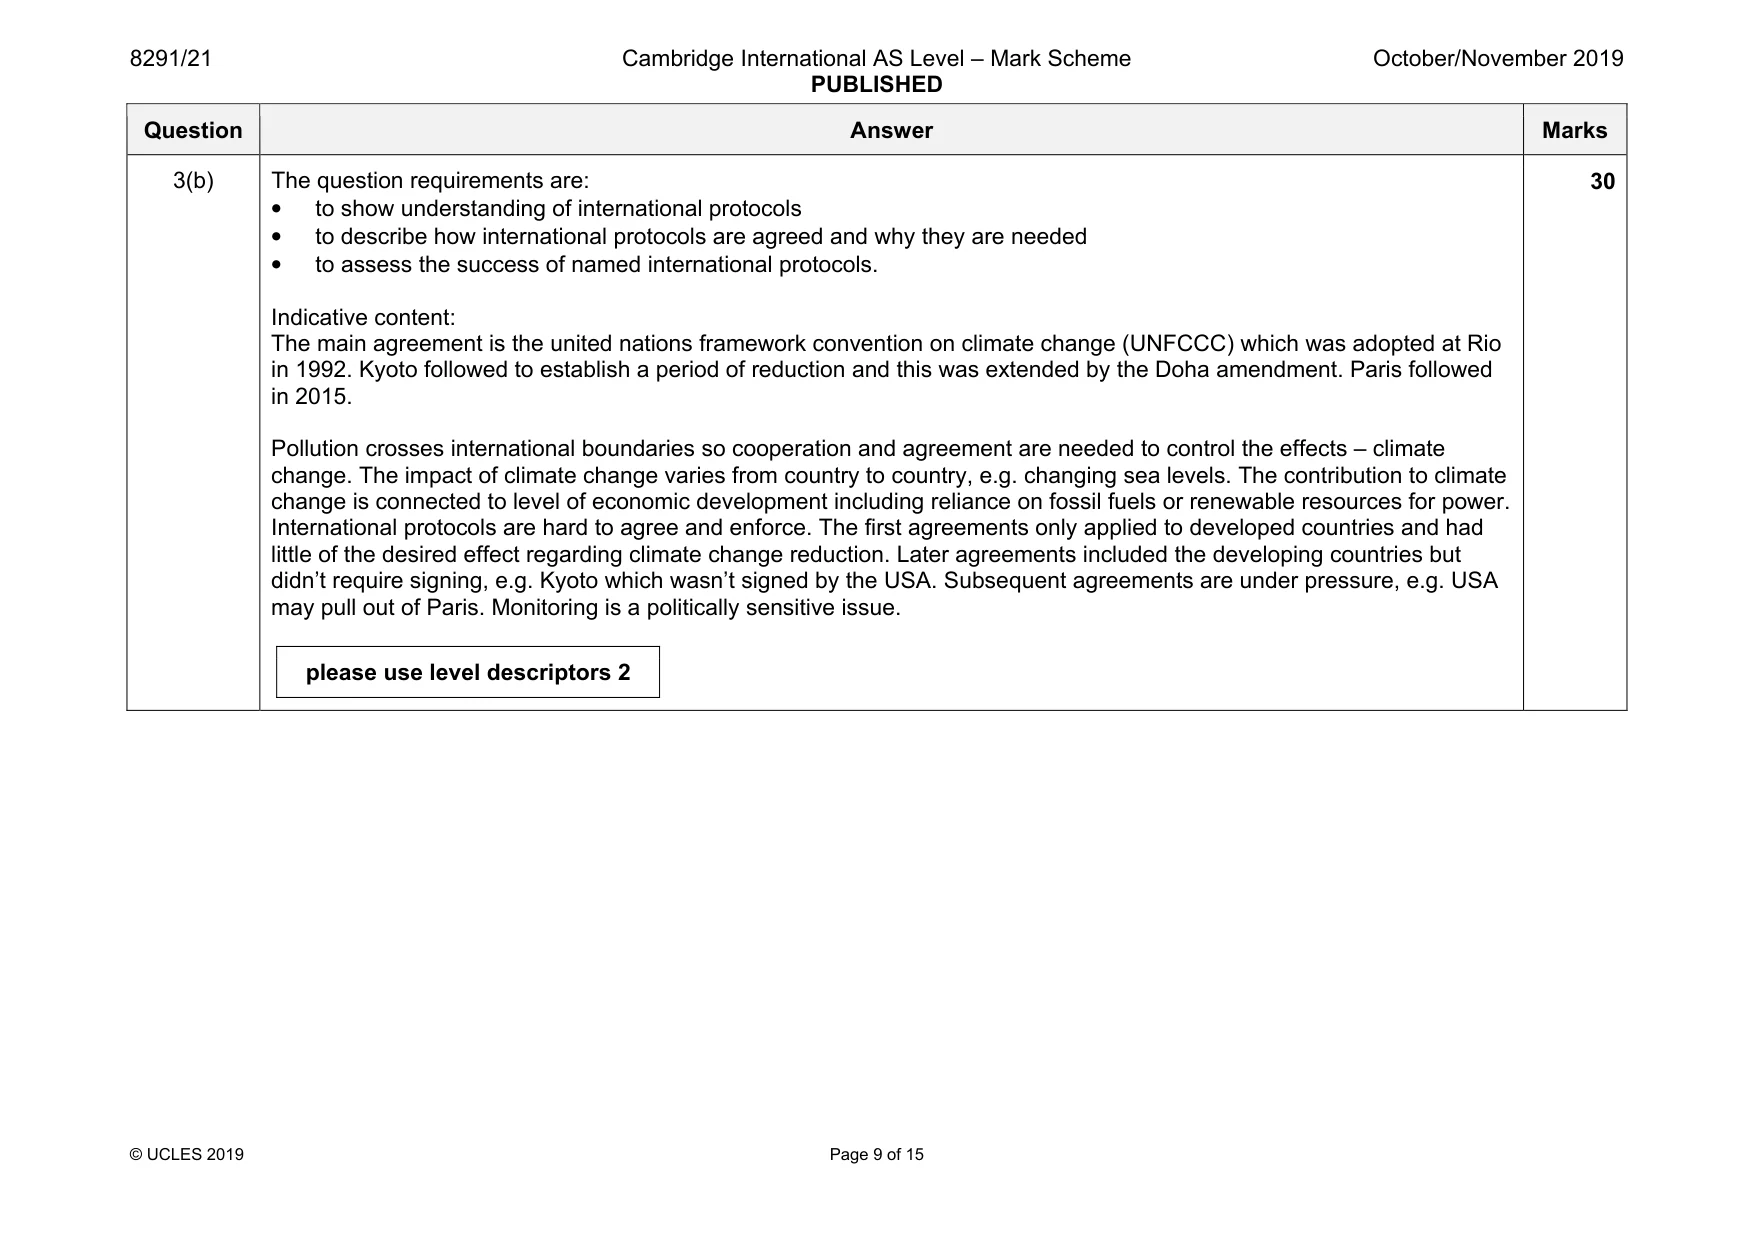
Mark scheme: 3(a) Causes Increased release of greenhouse gases such as carbon dioxide and methane lead to increased global temperature, which causes the arctic temperature to rise and thus reduces sea ice formation. The loss of ice reduces the albedo effect so more absorption increases sea temperature and increases the effect. Increased soot deposition also has a similar effect. As the volume of ice decreases ocean currents and climate are affected hastening the changes. Effects Reduction in volume and thickness of ice as well as the area of ocean covered by ice. Loss and change of habitat affecting species, e.g. polar bears. Spread of diseases between species previously separated is also an issue. Human activities affected by change in traditional lifestyles, access to sea passages and potential for mineral deposits including oil. Rising sea levels led to coastal inundation, salinization, flooding and disruption. please use level descriptors 1 10 Question Answer Marks 3(b) The question requirements are: • to show understanding of international protocols • to describe how international protocols are agreed and why they are needed • to assess the success of named international protocols. Indicative content: The main agreement is the united nations framework convention on climate change (UNFCCC) which was adopted at Rio in 1992. Kyoto followed to establish a period of reduction and this was extended by the Doha amendment. Paris followed in 2015. Pollution crosses international boundaries so cooperation and agreement are needed to control the effects – climate change. The impact of climate change varies from country to country, e.g. changing sea levels. The contribution to climate change is connected to level of economic development including reliance on fossil fuels or renewable resources for power. International protocols are hard to agree and enforce. The first agreements only applied to developed countries and had little of the desired effect regarding climate change reduction. Later agreements included the developing countries but didn’t require signing, e.g. Kyoto which wasn’t signed by the USA. Subsequent agreements are under pressure, e.g. USA may pull out of Paris. Monitoring is a politically sensitive issue. please use level descriptors 2 30
Q4 · A map of the South-to-North Water Transfer Project in China
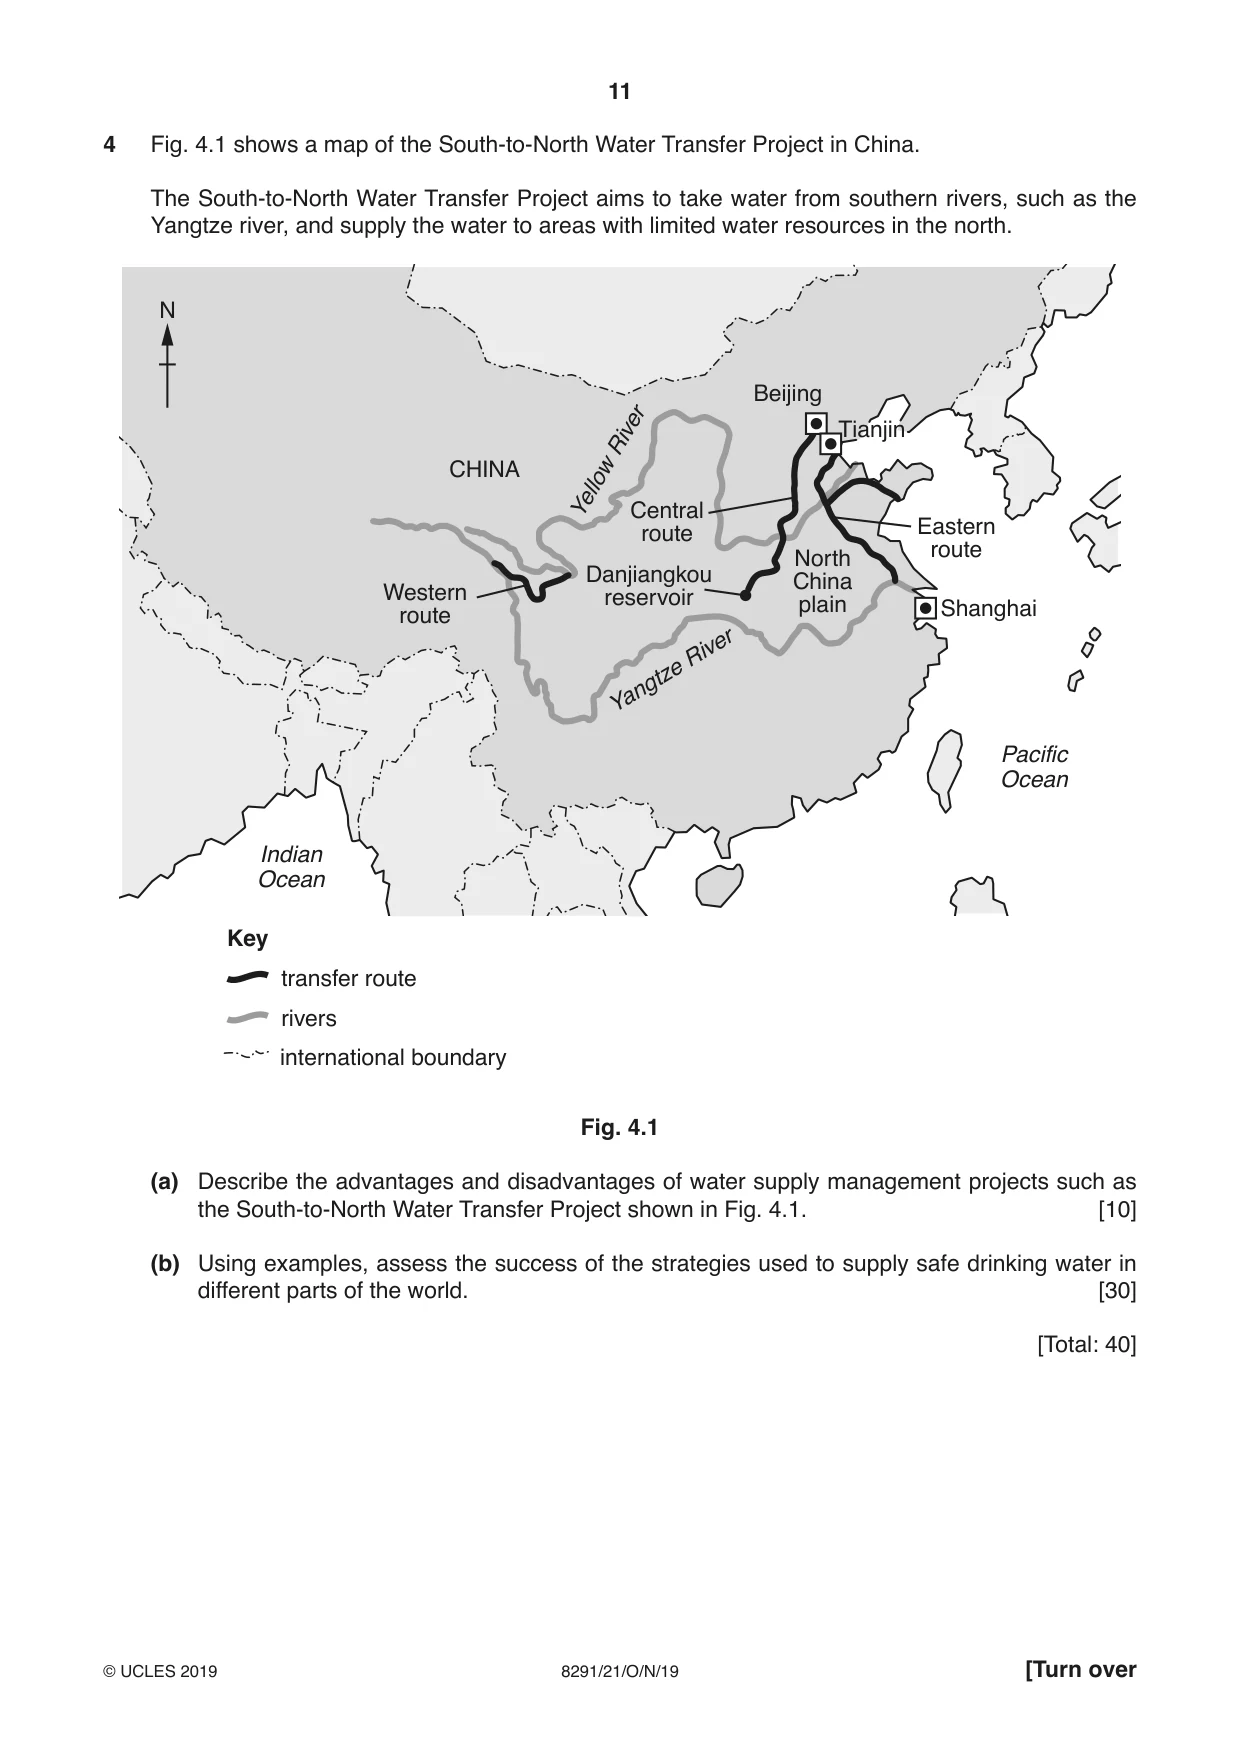
4 Fig. 4.1 shows a map of the South-to-North Water Transfer Project in China. The South-to-North Water Transfer Project aims to take water from southern rivers, such as the Yangtze river, and supply the water to areas with limited water resources in the north. N Beijing Tianjin River CHINA Yellow Central Eastern route route North Danjiangkou China Western reservoir plain Shanghai route River Yangtze Pacific Ocean Indian Ocean Key transfer route rivers international boundary Fig. 4.1 (a) Describe the advantages and disadvantages of water supply management projects such as the South-to-North Water Transfer Project shown in Fig. 4.1. [10] (b) Using examples, assess the success of the strategies used to supply safe drinking water in different parts of the world. [30] [Total: 40]
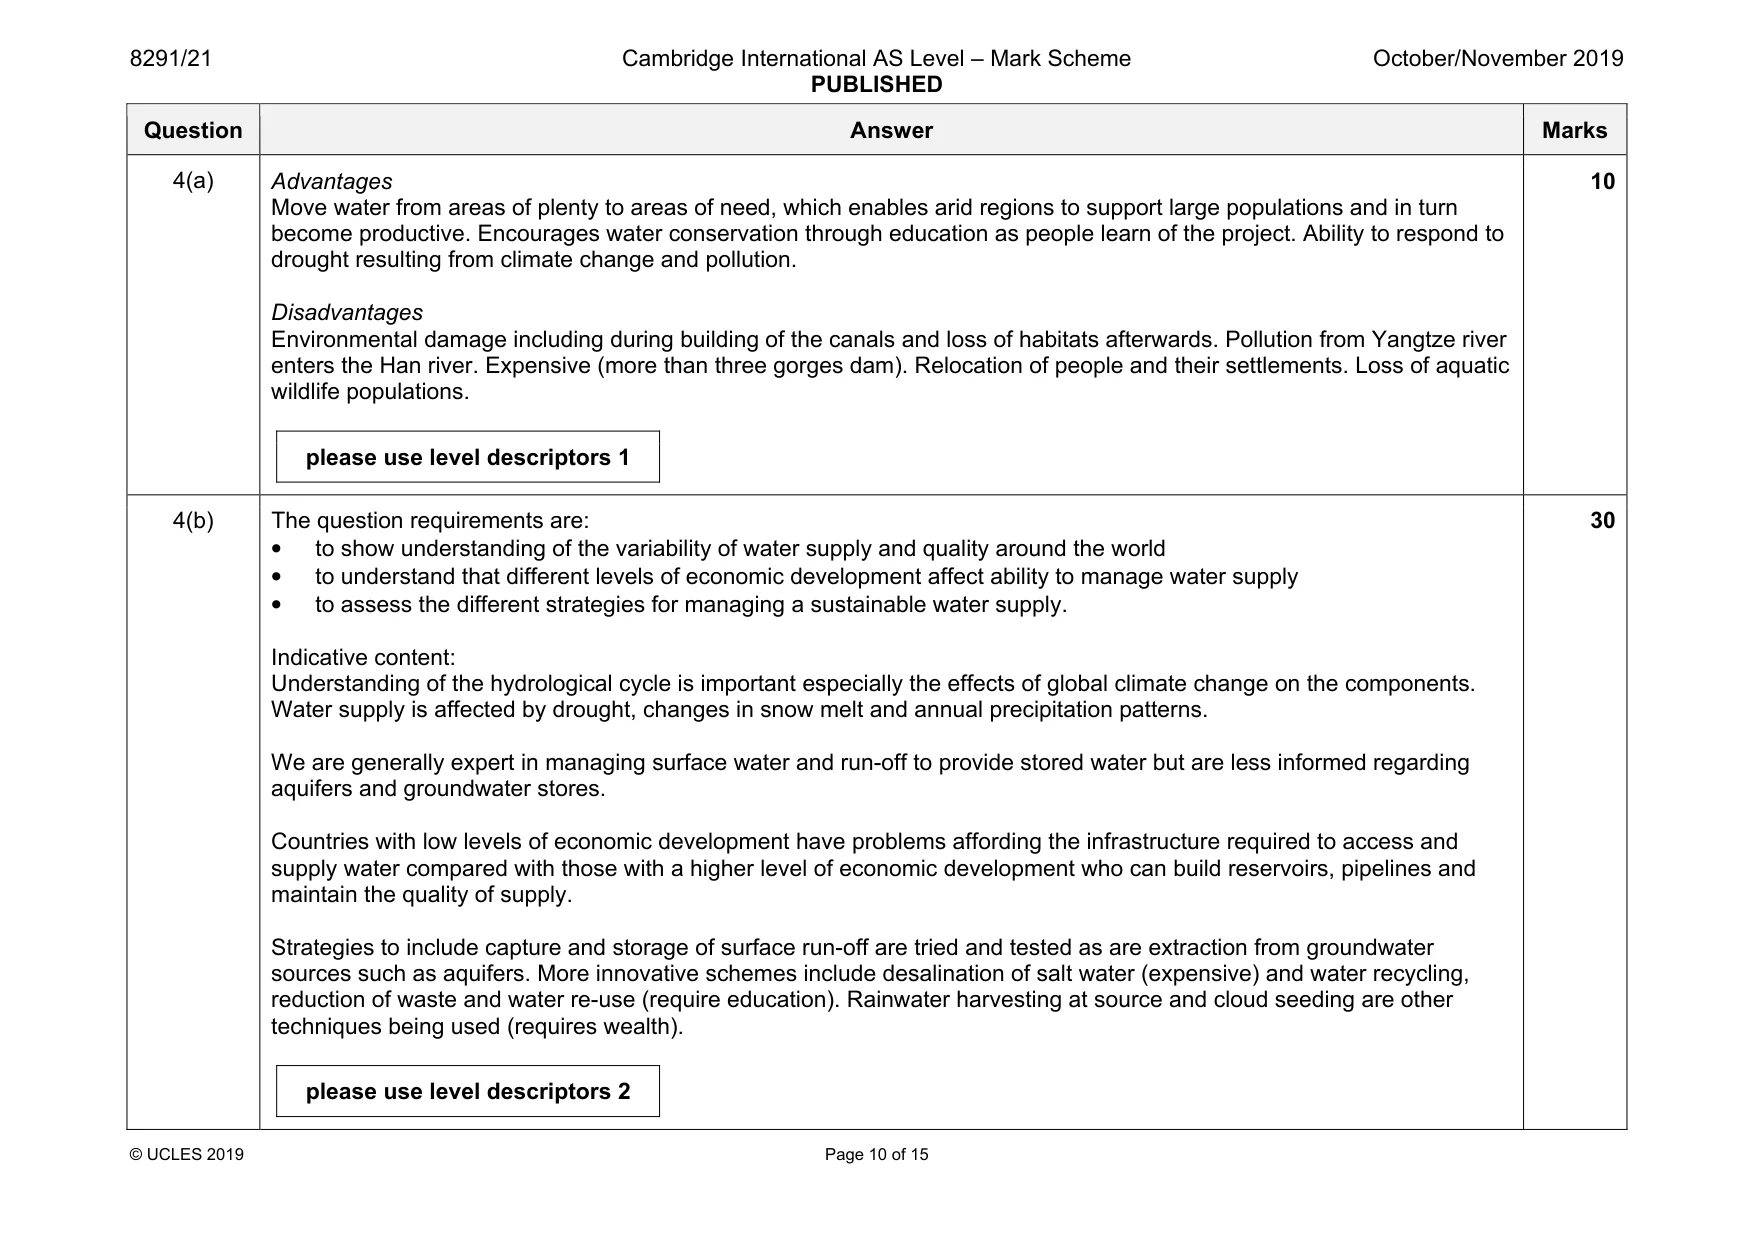
Mark scheme: 4(a) Advantages Move water from areas of plenty to areas of need, which enables arid regions to support large populations and in turn become productive. Encourages water conservation through education as people learn of the project. Ability to respond to drought resulting from climate change and pollution. Disadvantages Environmental damage including during building of the canals and loss of habitats afterwards. Pollution from Yangtze river enters the Han river. Expensive (more than three gorges dam). Relocation of people and their settlements. Loss of aquatic wildlife populations. please use level descriptors 1 10 4(b) The question requirements are: • to show understanding of the variability of water supply and quality around the world • to understand that different levels of economic development affect ability to manage water supply • to assess the different strategies for managing a sustainable water supply. Indicative content: Understanding of the hydrological cycle is important especially the effects of global climate change on the components. Water supply is affected by drought, changes in snow melt and annual precipitation patterns. We are generally expert in managing surface water and run-off to provide stored water but are less informed regarding aquifers and groundwater stores. Countries with low levels of economic development have problems affording the infrastructure required to access and supply water compared with those with a higher level of economic development who can build reservoirs, pipelines and maintain the quality of supply. Strategies to include capture and storage of surface run-off are tried and tested as are extraction from groundwater sources such as aquifers. More innovative schemes include desalination of salt water (expensive) and water recycling, reduction of waste and water re-use (require education). Rainwater harvesting at source and cloud seeding are other techniques being used (requires wealth). please use level descriptors 2 30
Q5 · A diagram that represents the stages in a succession
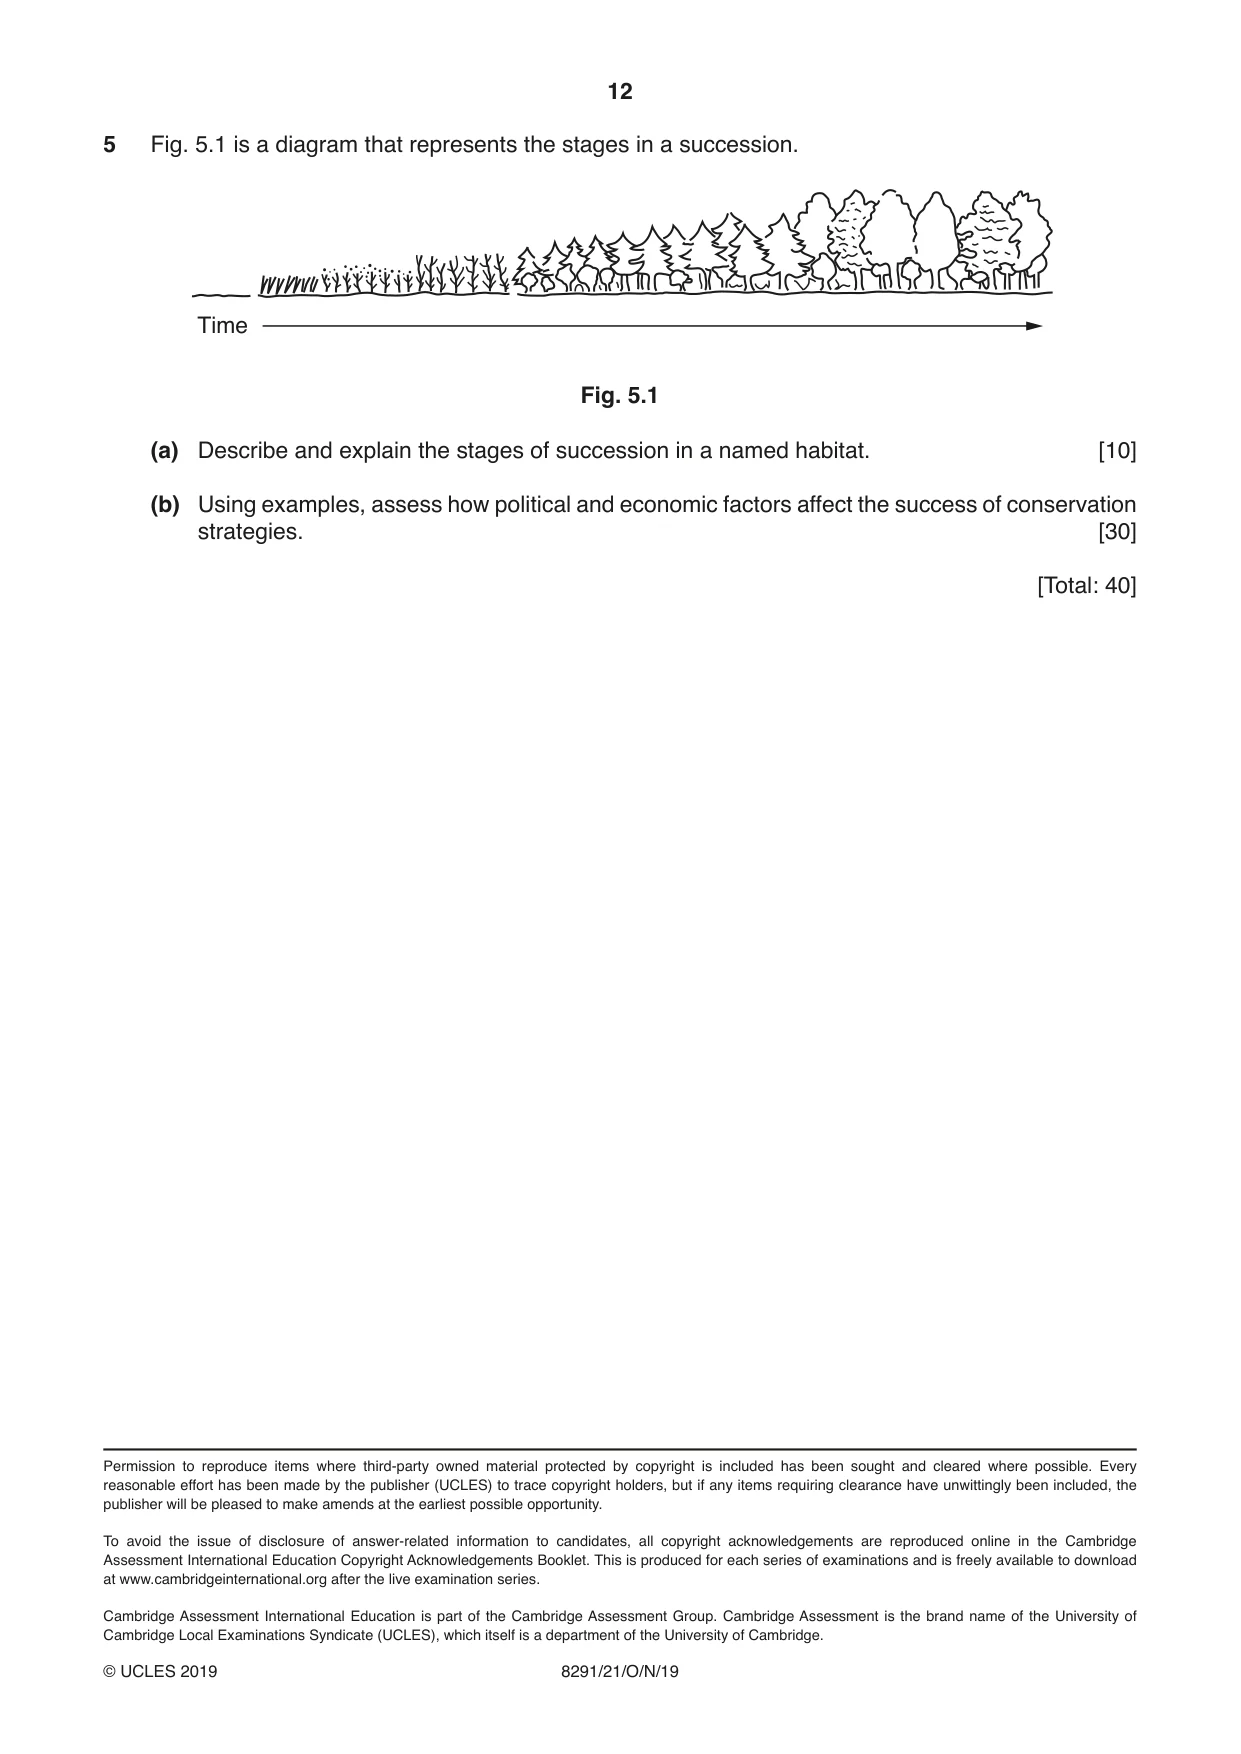
5 Fig. 5.1 is a diagram that represents the stages in a succession. Time Fig. 5.1 (a) Describe and explain the stages of succession in a named habitat. [10] (b) Using examples, assess how political and economic factors affect the success of conservation strategies. [30] [Total: 40]
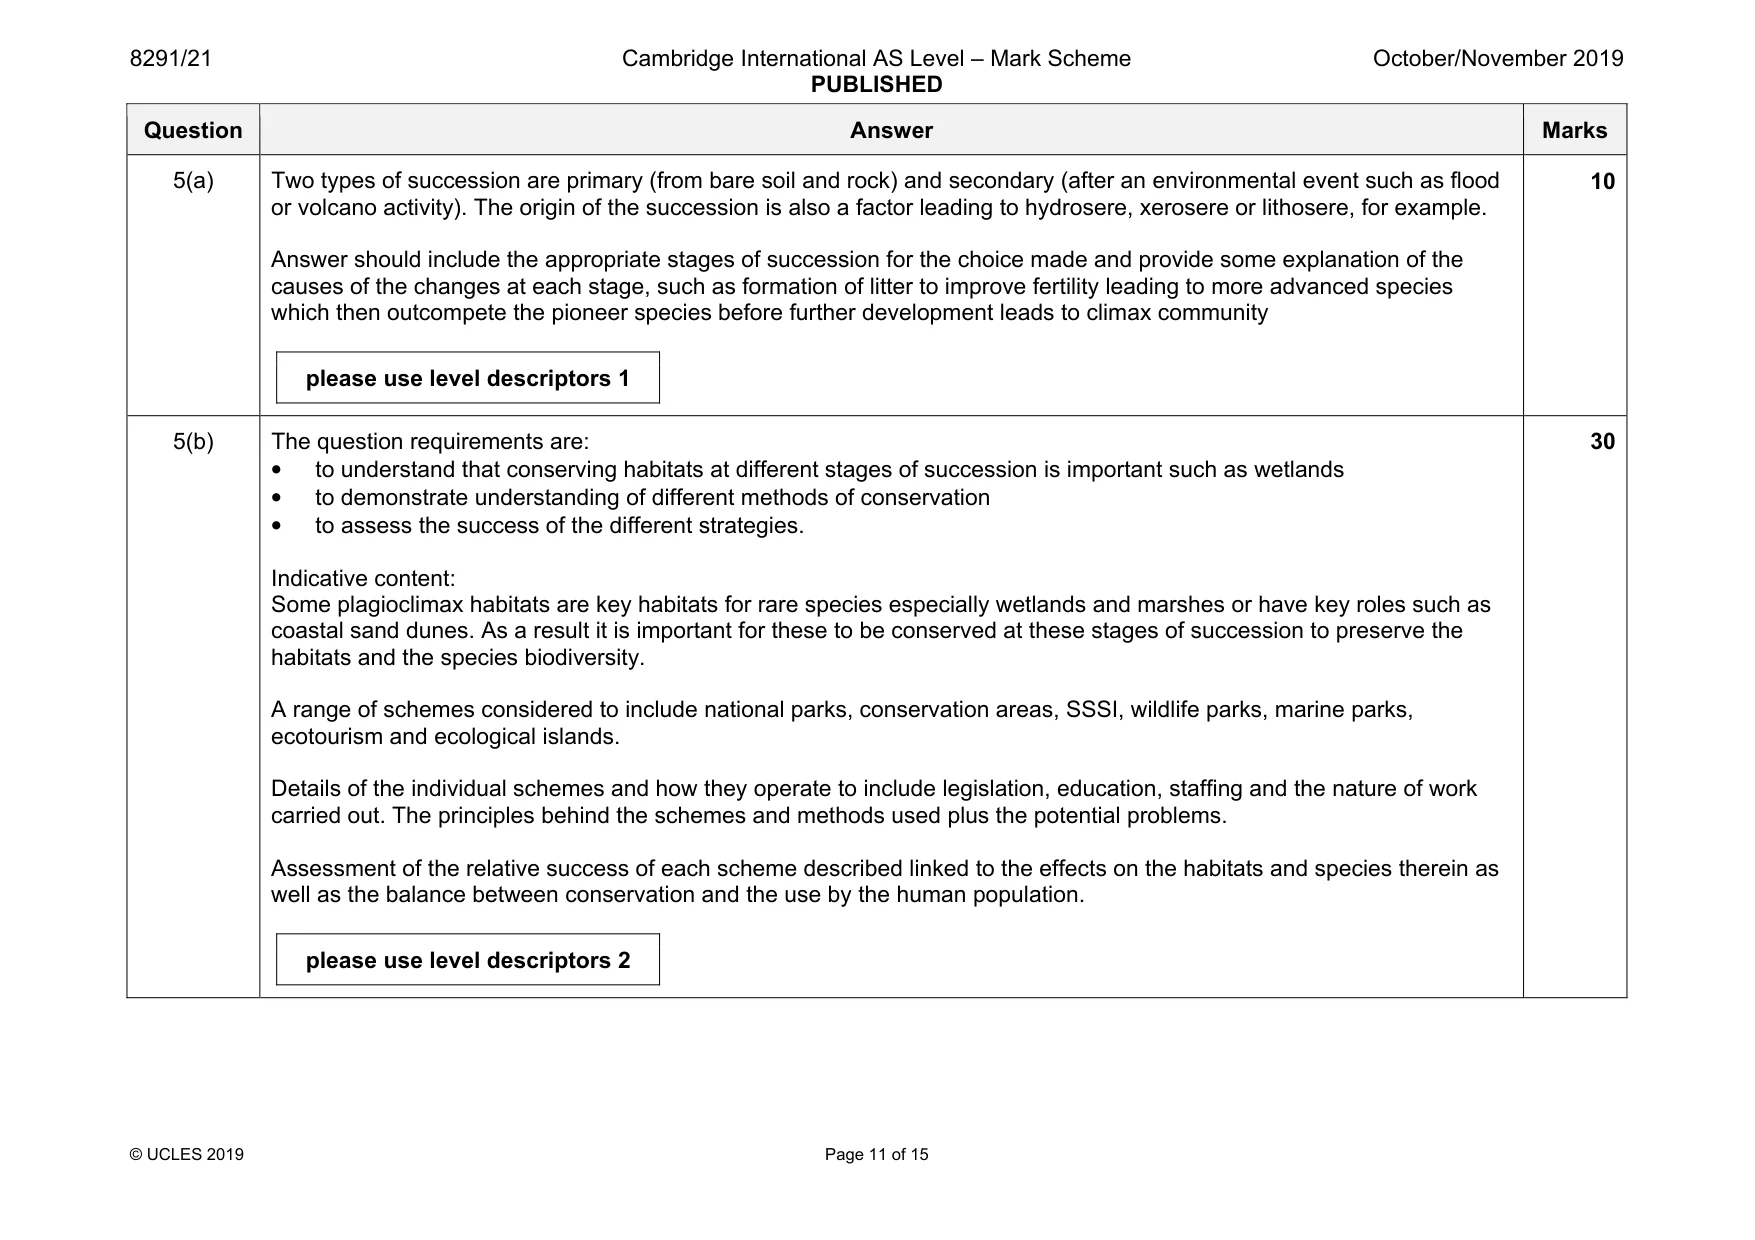
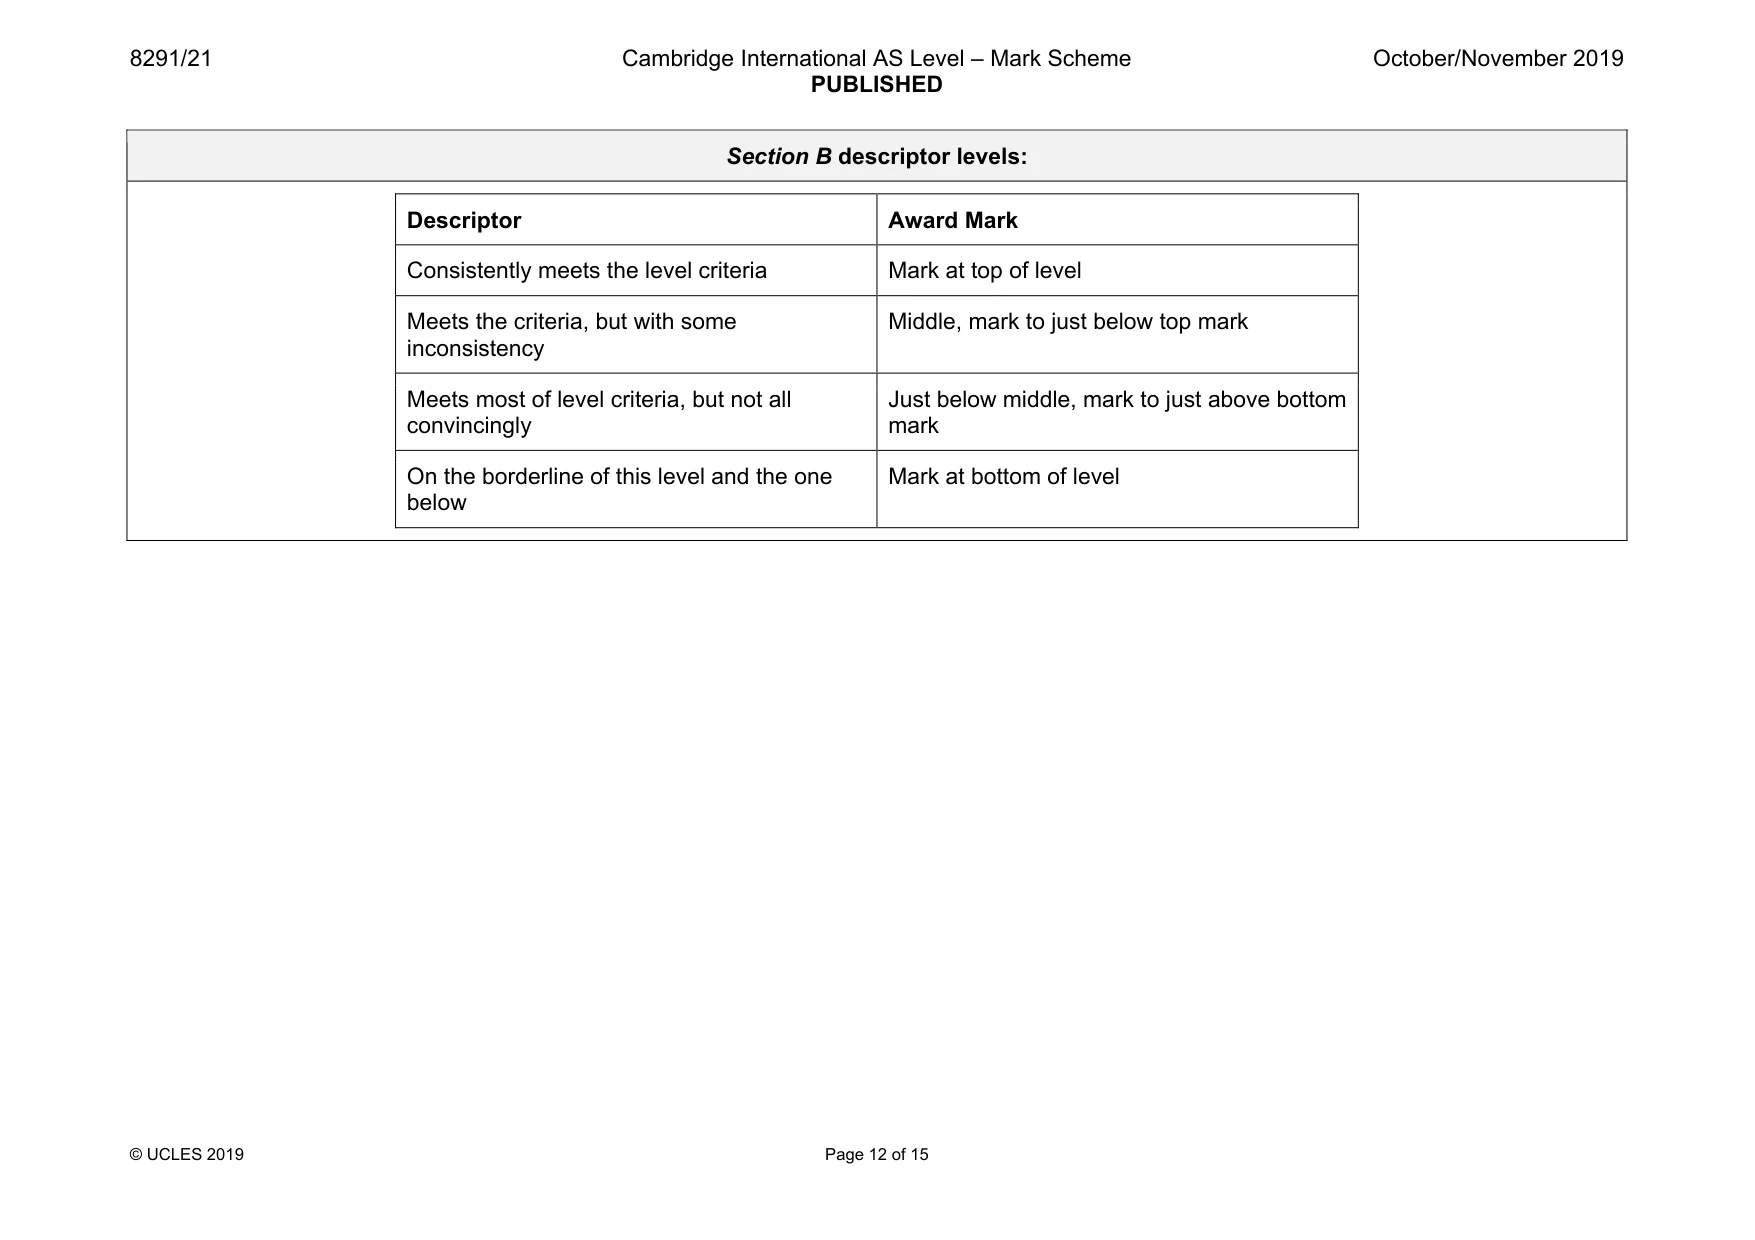
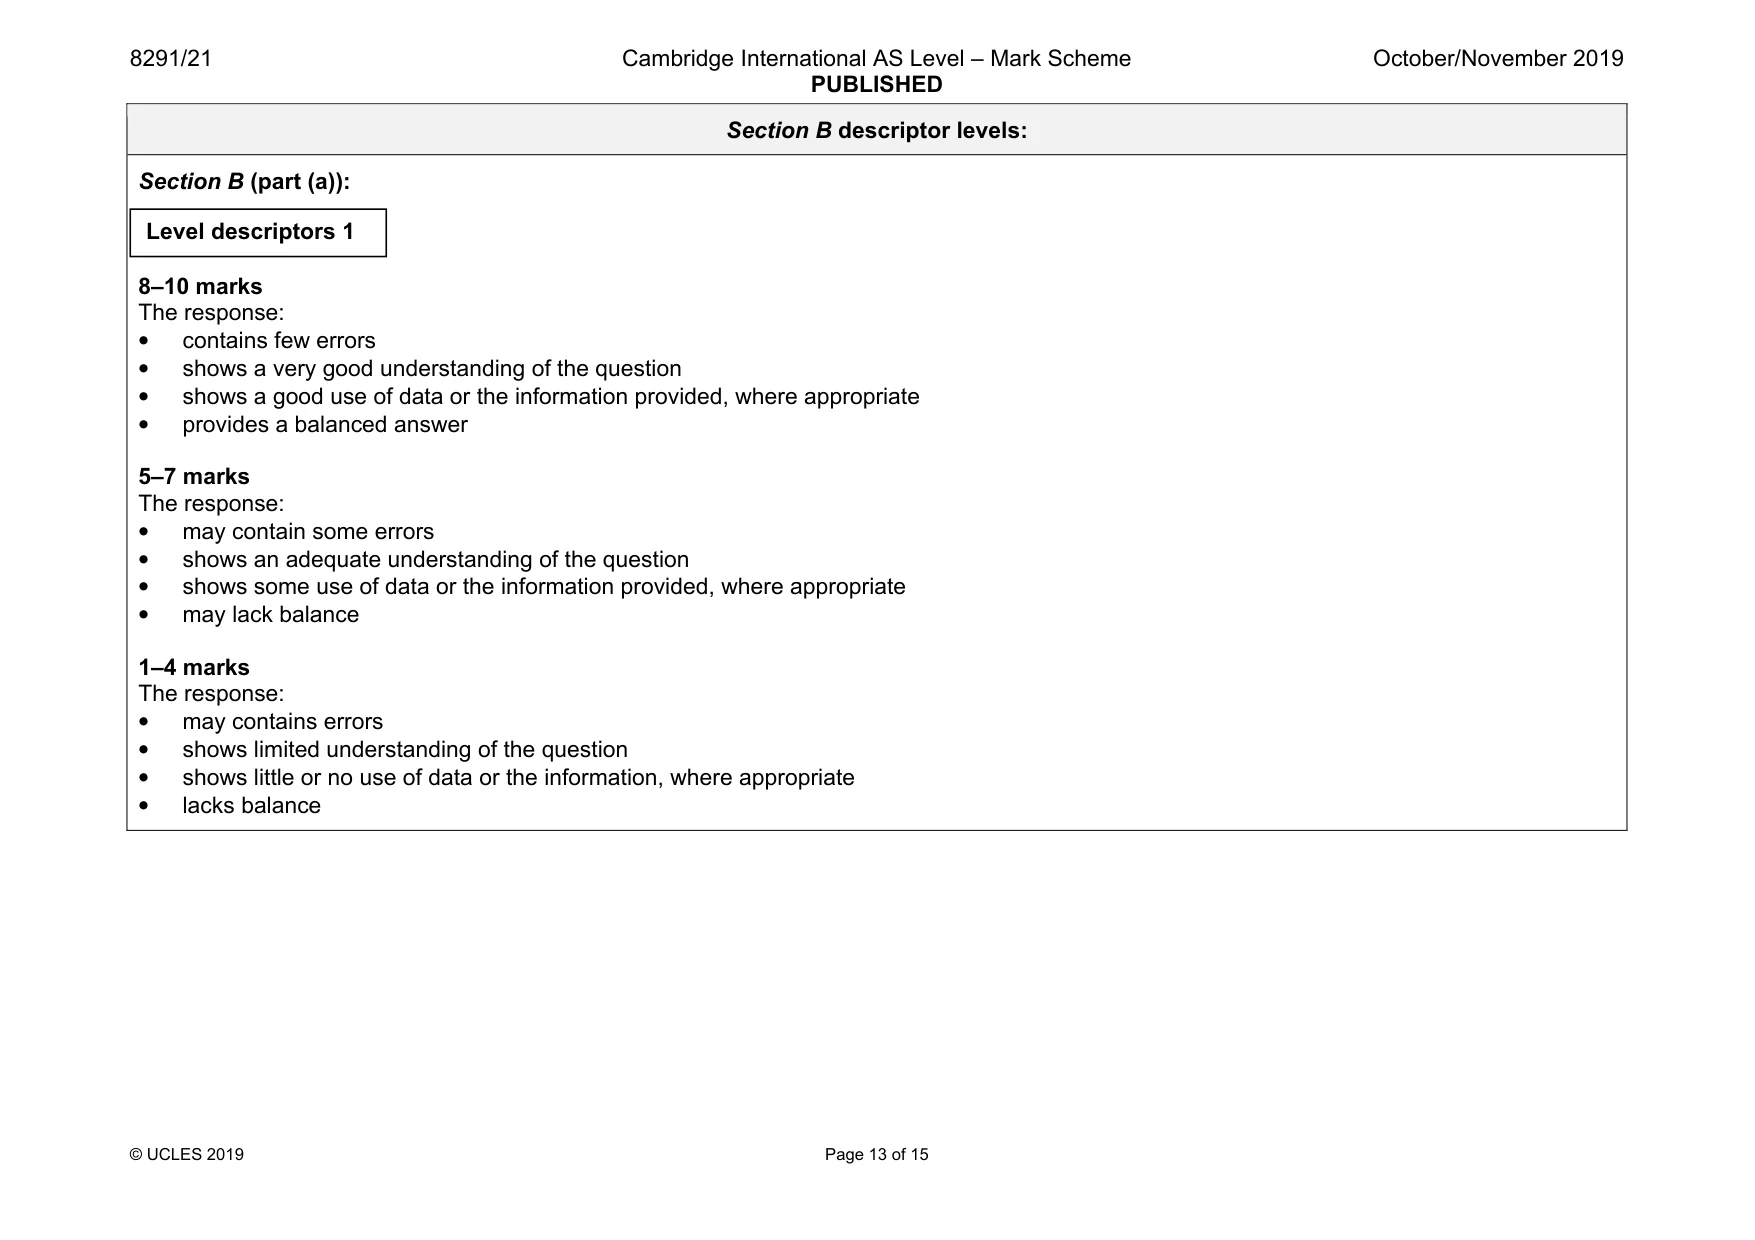
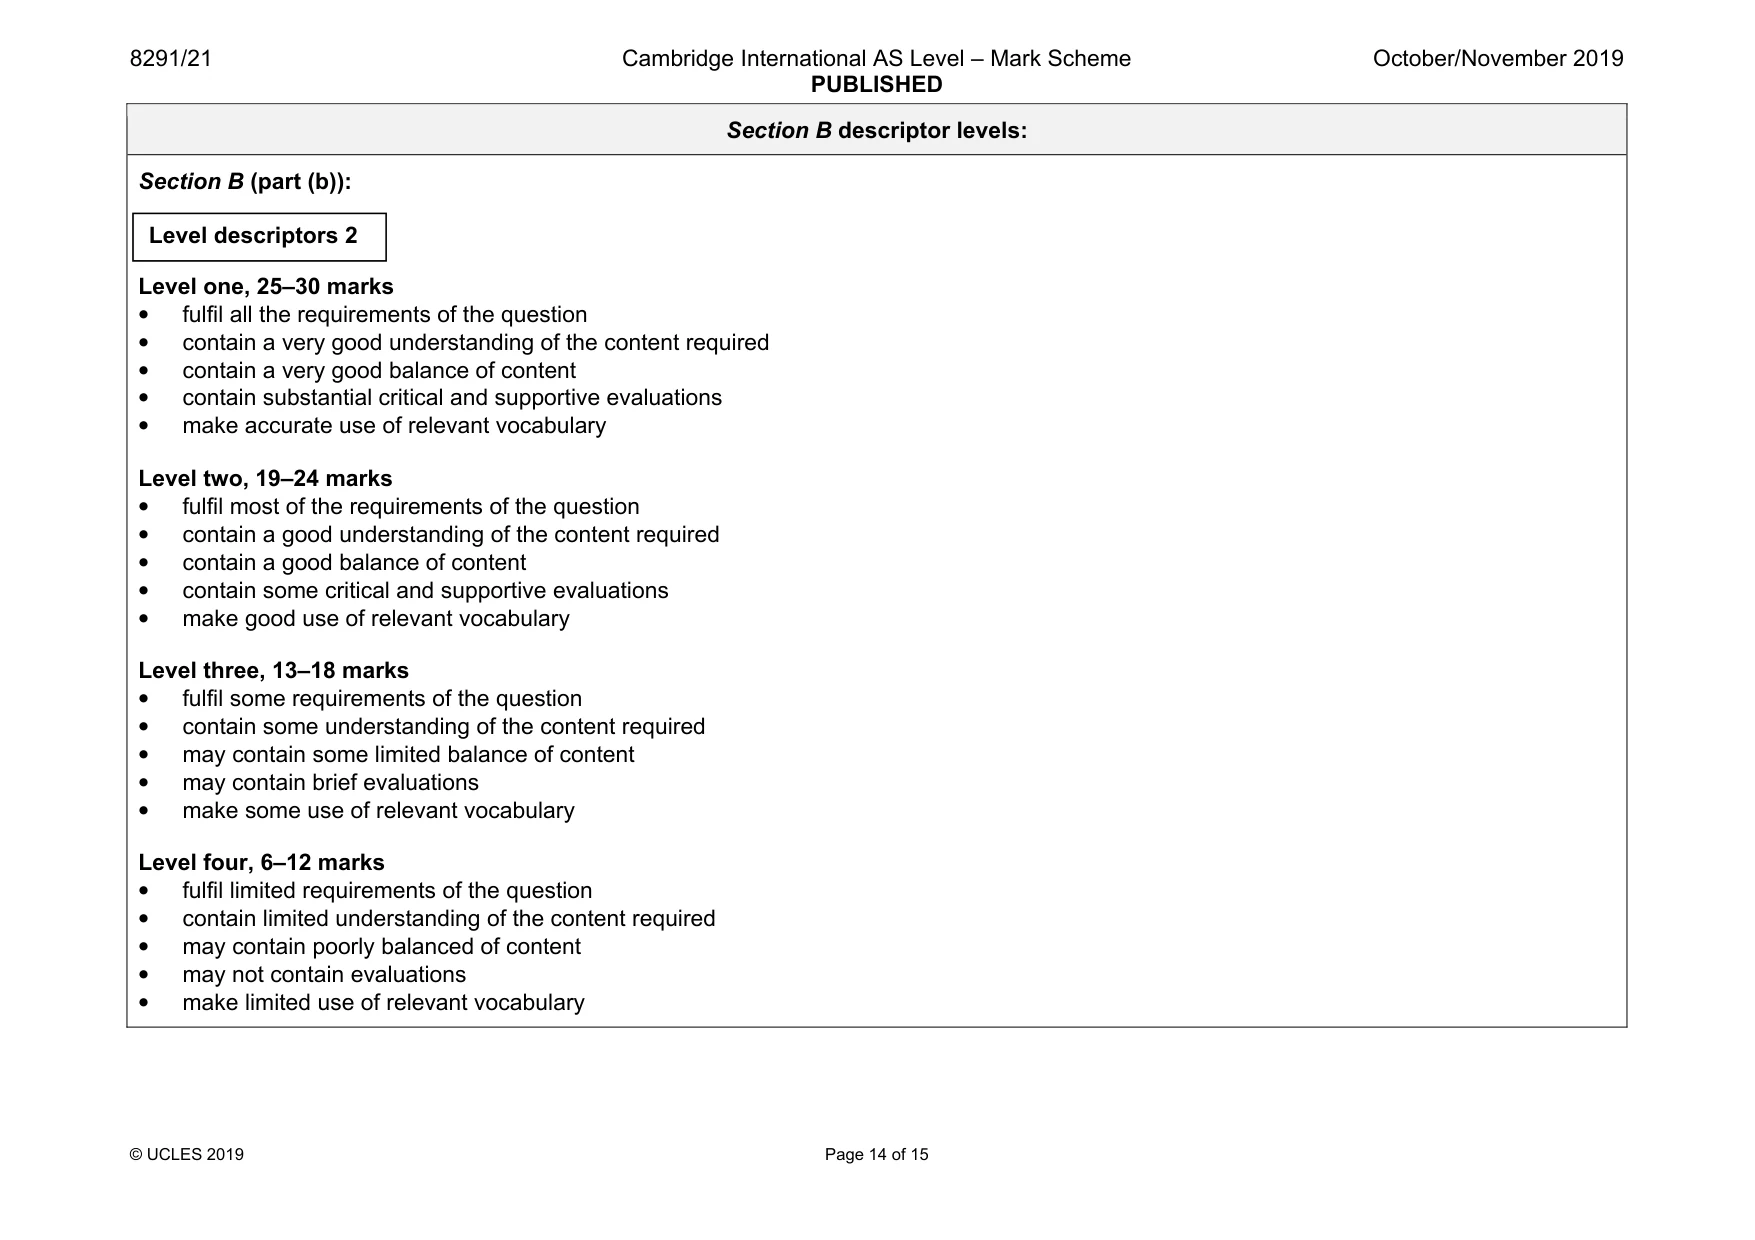
Mark scheme: 5(a) Two types of succession are primary (from bare soil and rock) and secondary (after an environmental event such as flood or volcano activity). The origin of the succession is also a factor leading to hydrosere, xerosere or lithosere, for example. Answer should include the appropriate stages of succession for the choice made and provide some explanation of the causes of the changes at each stage, such as formation of litter to improve fertility leading to more advanced species which then outcompete the pioneer species before further development leads to climax community please use level descriptors 1 10 5(b) The question requirements are: • to understand that conserving habitats at different stages of succession is important such as wetlands • to demonstrate understanding of different methods of conservation • to assess the success of the different strategies. Indicative content: Some plagioclimax habitats are key habitats for rare species especially wetlands and marshes or have key roles such as coastal sand dunes. As a result it is important for these to be conserved at these stages of succession to preserve the habitats and the species biodiversity. A range of schemes considered to include national parks, conservation areas, SSSI, wildlife parks, marine parks, ecotourism and ecological islands. Details of the individual schemes and how they operate to include legislation, education, staffing and the nature of work carried out. The principles behind the schemes and methods used plus the potential problems. Assessment of the relative success of each scheme described linked to the effects on the habitats and species therein as well as the balance between conservation and the use by the human population. please use level descriptors 2 30 Section B descriptor levels: Descriptor Award Mark Consistently meets the level criteria Mark at top of level Meets the criteria, but with some inconsistency Middle, mark to just below top mark Meets most of level criteria, but not all convincingly Just below middle, mark to just above bottom mark On the borderline of this level and the one below Mark at bottom of level Section B descriptor levels: Section B (part (a)): 8–10 marks The response: • contains few errors • shows a very good understanding of the question • shows a good use of data or the information provided, where appropriate • provides a balanced answer 5–7 marks The response: • may contain some errors • shows an adequate understanding of the question • shows some use of data or the information provided, where appropriate • may lack balance 1–4 marks The response: • may contains errors • shows limited understanding of the question • shows little or no use of data or the information, where appropriate • lacks balance Level descriptors 1 Section B descriptor levels: Section B (part (b)): Responses: Level one, 25–30 marks • fulfil all the requirements of the question • contain a very good understanding of the content required • contain a very good balance of content • contain substantial critical and supportive evaluations • make accurate use of relevant vocabulary Level two, 19–24 marks • fulfil most of the requirements of the question • contain a good understanding of the content required • contain a good balance of content • contain some critical and supportive evaluations • make good use of relevant vocabulary Level three, 13–18 marks • fulfil some requirements of the question • contain some understanding of the content required • may contain some limited balance of content • may contain brief evaluations • make some use of relevant vocabulary Level four, 6–12 marks • fulfil limited requirements of the question • contain limited understanding of the content required • may contain poorly balanced of content • may not contain evaluations • make limited use of relevant vocabulary Level descriptors 2 Section B descriptor levels: Level five, 1–5 marks • fulfil a few of the requirements of the question • contain a very limited understanding of the content required • are likely to be unbalanced and undeveloped • evaluative statements are likely to be missing • make no use of relevant vocabulary
What was in this paper
The subtopics covered by these 5 questions, and how many questions each got. Open one in a new tab to see every Cambridge question on it.
What you needed in this session
Cambridge’s own grade thresholds for 2019 Oct/Nov, Paper 2 · Variant 1. A higher threshold means an easier paper — the bar moves with how the cohort did.