Cambridge A Level Environmental Management (AS only) 8291 — 2016 May/June Paper 2 · Variant 2
8291/22/M/J/16 · 80 marks · ≈90 min
The question paper and its mark scheme, free to read here and free to download. This is Cambridge’s own paper, exactly as it was sat.
Question paper16 pages



Mark scheme17 pages
Answers below. Sit the paper first if you are practising.
Paper as text
Question paper, page 1
This document consists of 14 printed pages and 2 blank pages. DC (LK/FD) 114258/4 © UCLES 2016 [Turn over Cambridge International Examinations Cambridge International Advanced Subsidiary Level * 9 3 5 0 8 2 6 1 1 5 * ENVIRONMENTAL MANAGEMENT 8291/22 Paper 2 Hydrosphere and Biosphere May/June 2016 1 hour 30 minutes Additional Materials: Answer Booklet/Paper READ THESE INSTRUCTIONS FIRST Write your Centre number, candidate number and name on all the work you hand in. Write in dark blue or black pen. You may use an HB pencil for any diagrams or graphs. Do not use staples, paper clips, glue or correction fluid. DO NOT WRITE IN ANY BARCODES. Electronic calculators may be used. You may lose marks if you do not show your working or if you do not use appropriate units. Section A Answer all questions in this section. Write your answers in the spaces provided on the question paper. Section B Answer one question from this section. Answer the question on the separate answer paper provided. At the end of the examination, 1. fasten all separate answer paper securely to the question paper; 2. enter the question number from Section B in the grid opposite. For Examiner’s Use Section A 1 2 Section B Total
Question paper, page 2
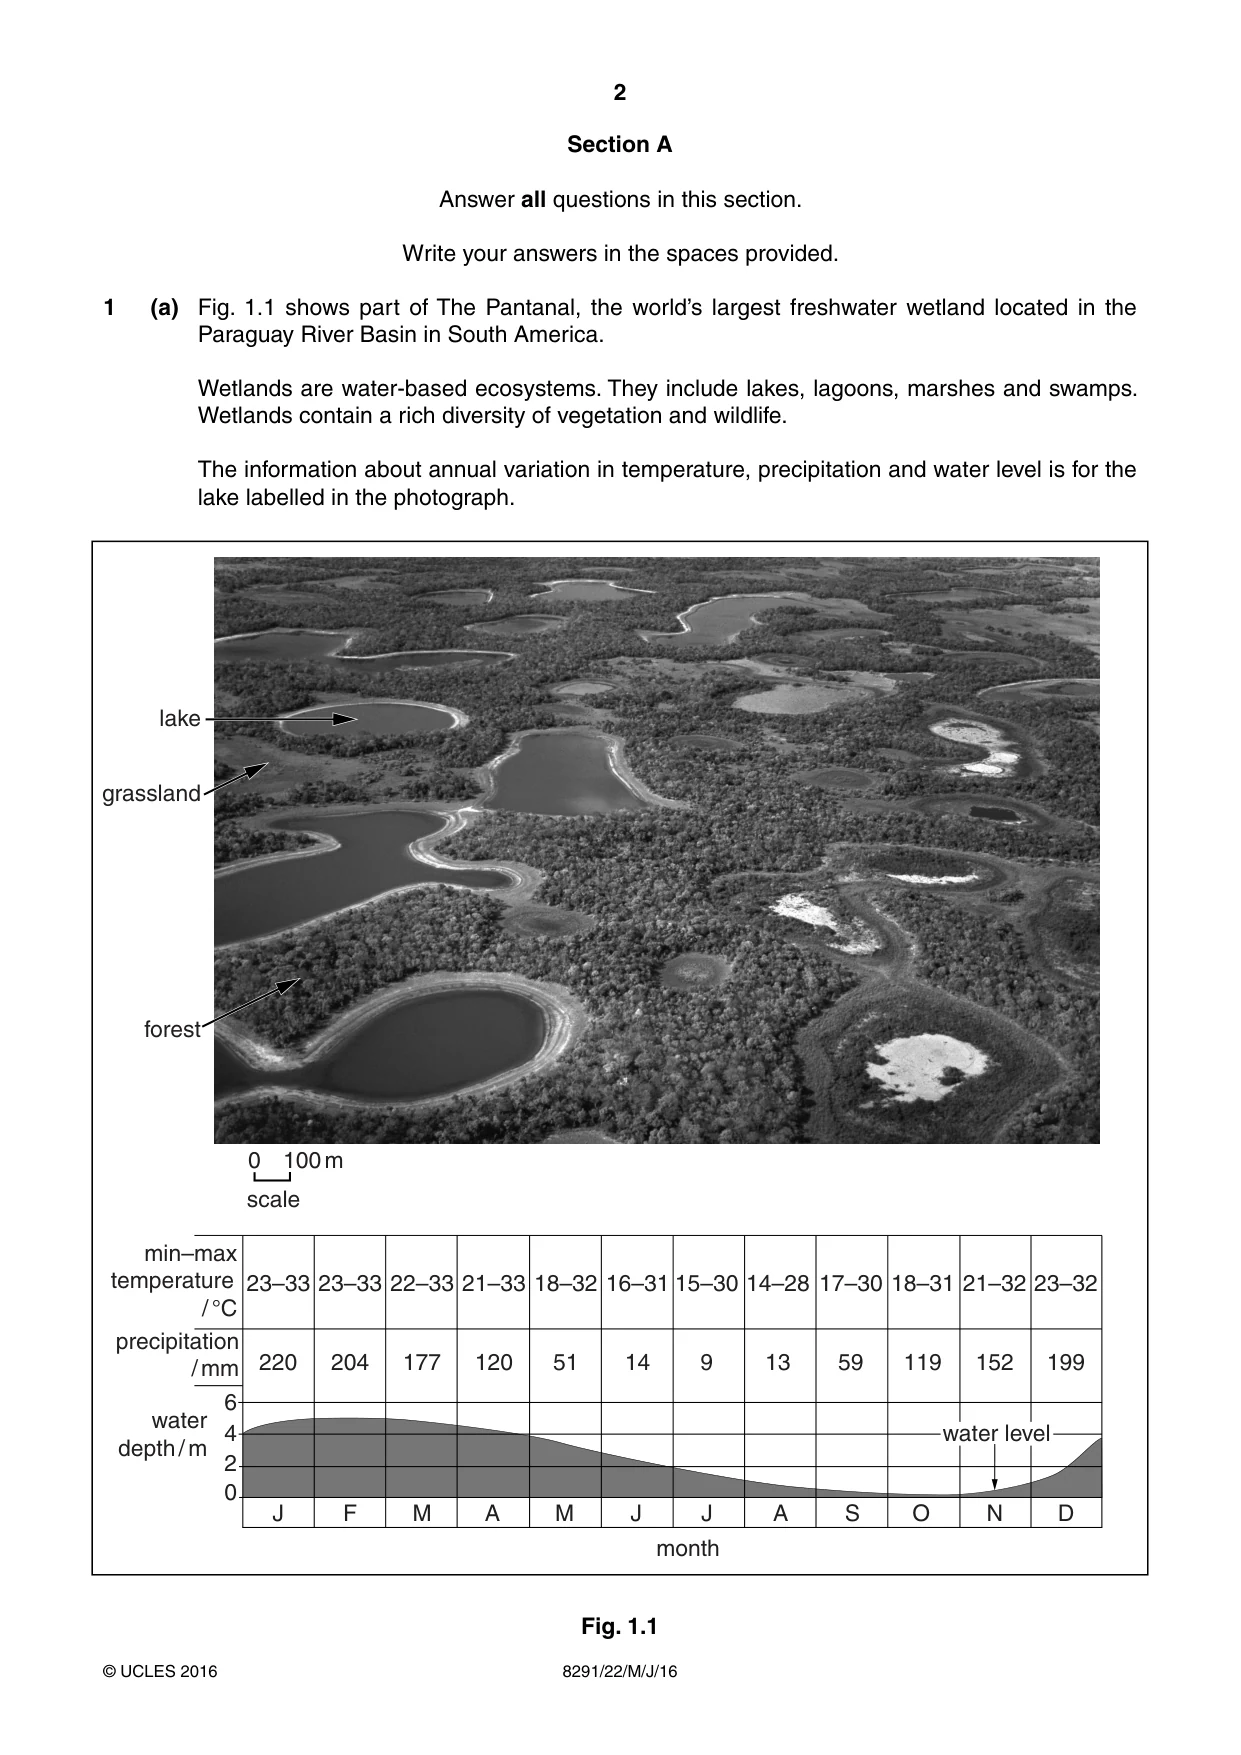
2 8291/22/M/J/16 © UCLES 2016 Section A Answer all questions in this section. Write your answers in the spaces provided. 1 (a) Fig. 1.1 shows part of The Pantanal, the world’s largest freshwater wetland located in the Paraguay River Basin in South America. Wetlands are water-based ecosystems. They include lakes, lagoons, marshes and swamps. Wetlands contain a rich diversity of vegetation and wildlife. The information about annual variation in temperature, precipitation and water level is for the lake labelled in the photograph. lake grassland forest J 23–33 23–33 22–33 21–33 18–32 16–31 15–30 14–28 17–30 18–31 21–32 23–32 220 204 177 120 51 14 9 13 59 119 152 199 min–max temperature / °C precipitation / mm water depth / m 2 0 4 6 F M A M J J A S water level O N D month 0 100 m scale water level Fig. 1.1
Question paper, page 3
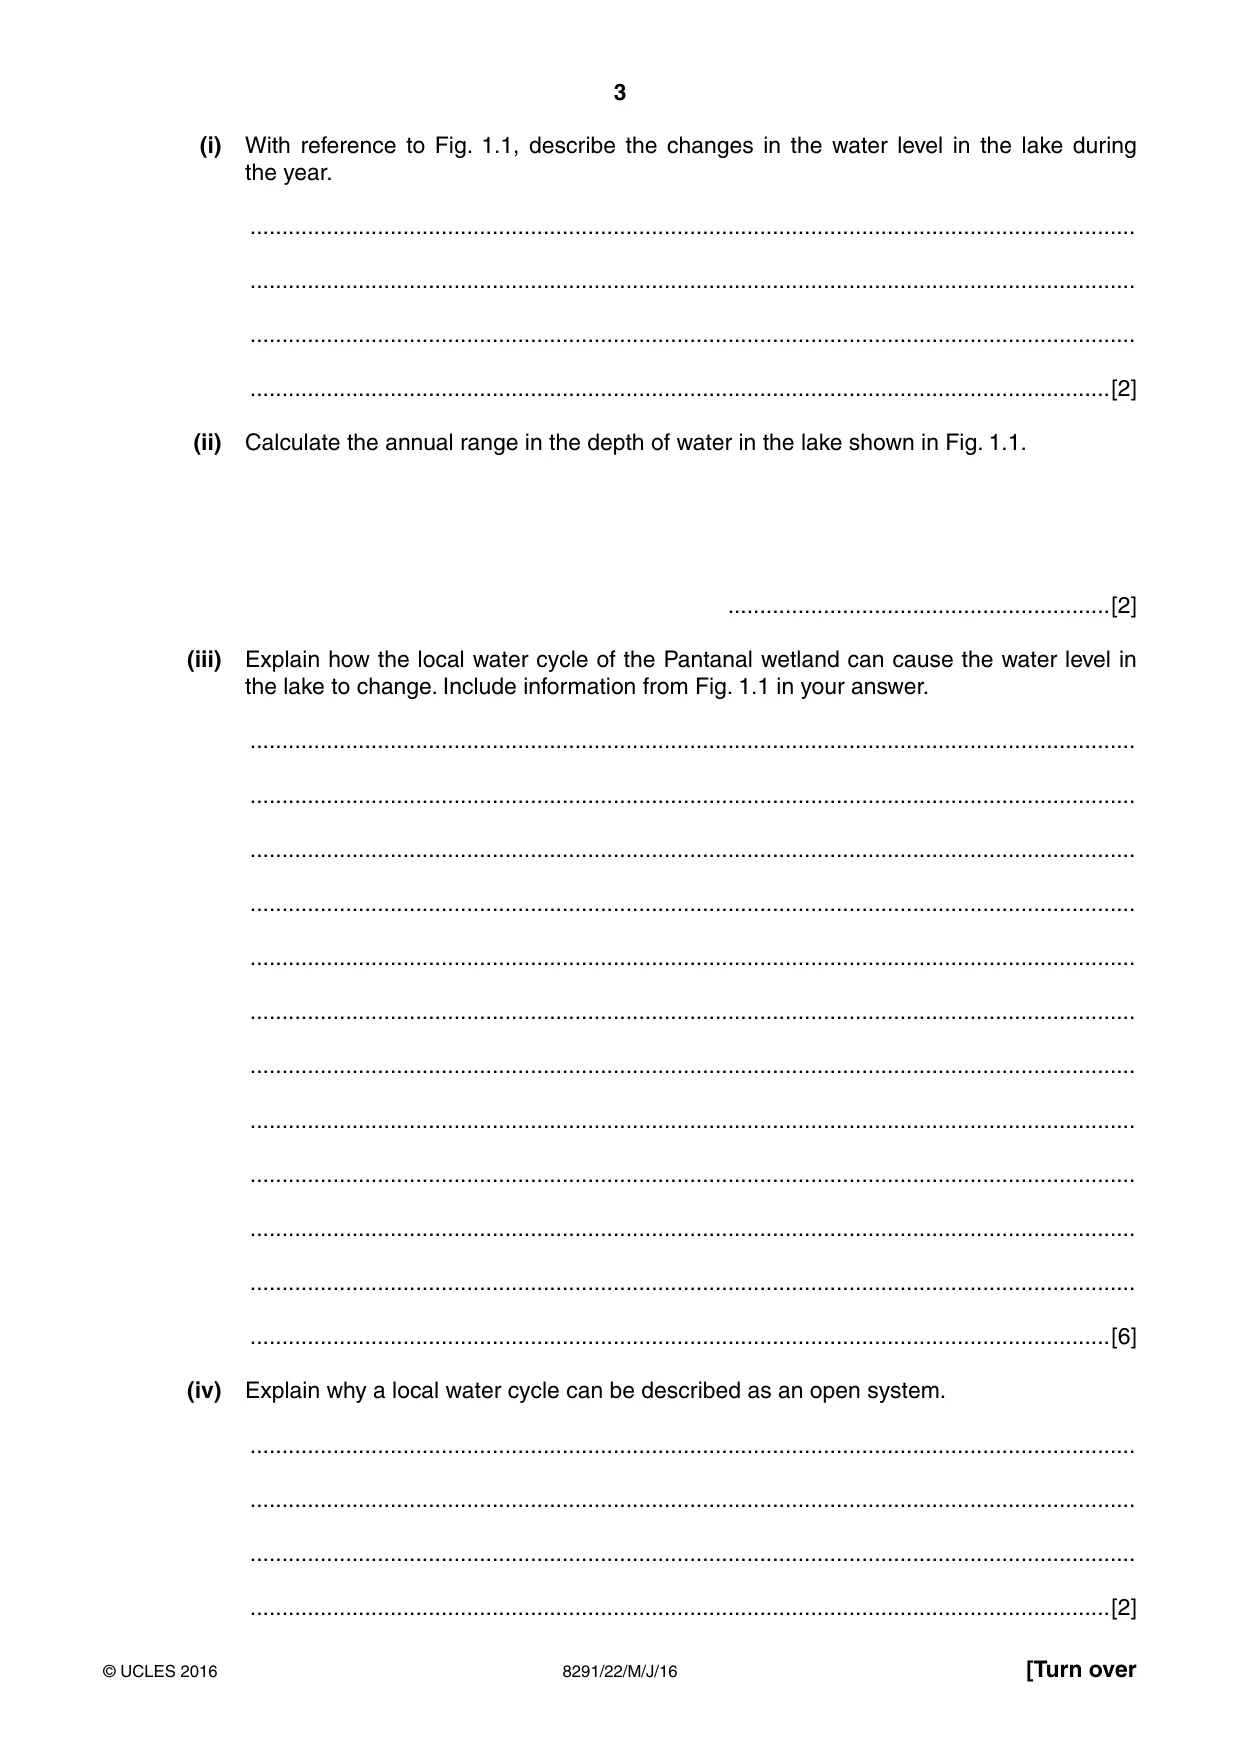
3 8291/22/M/J/16 © UCLES 2016 [Turn over (i) With reference to Fig. 1.1, describe the changes in the water level in the lake during the year. … … … …[2] (ii) Calculate the annual range in the depth of water in the lake shown in Fig. 1.1. …[2] (iii) Explain how the local water cycle of the Pantanal wetland can cause the water level in the lake to change. Include information from Fig. 1.1 in your answer. … … … … … … … … … … … …[6] (iv) Explain why a local water cycle can be described as an open system. … … … …[2]
Question paper, page 4
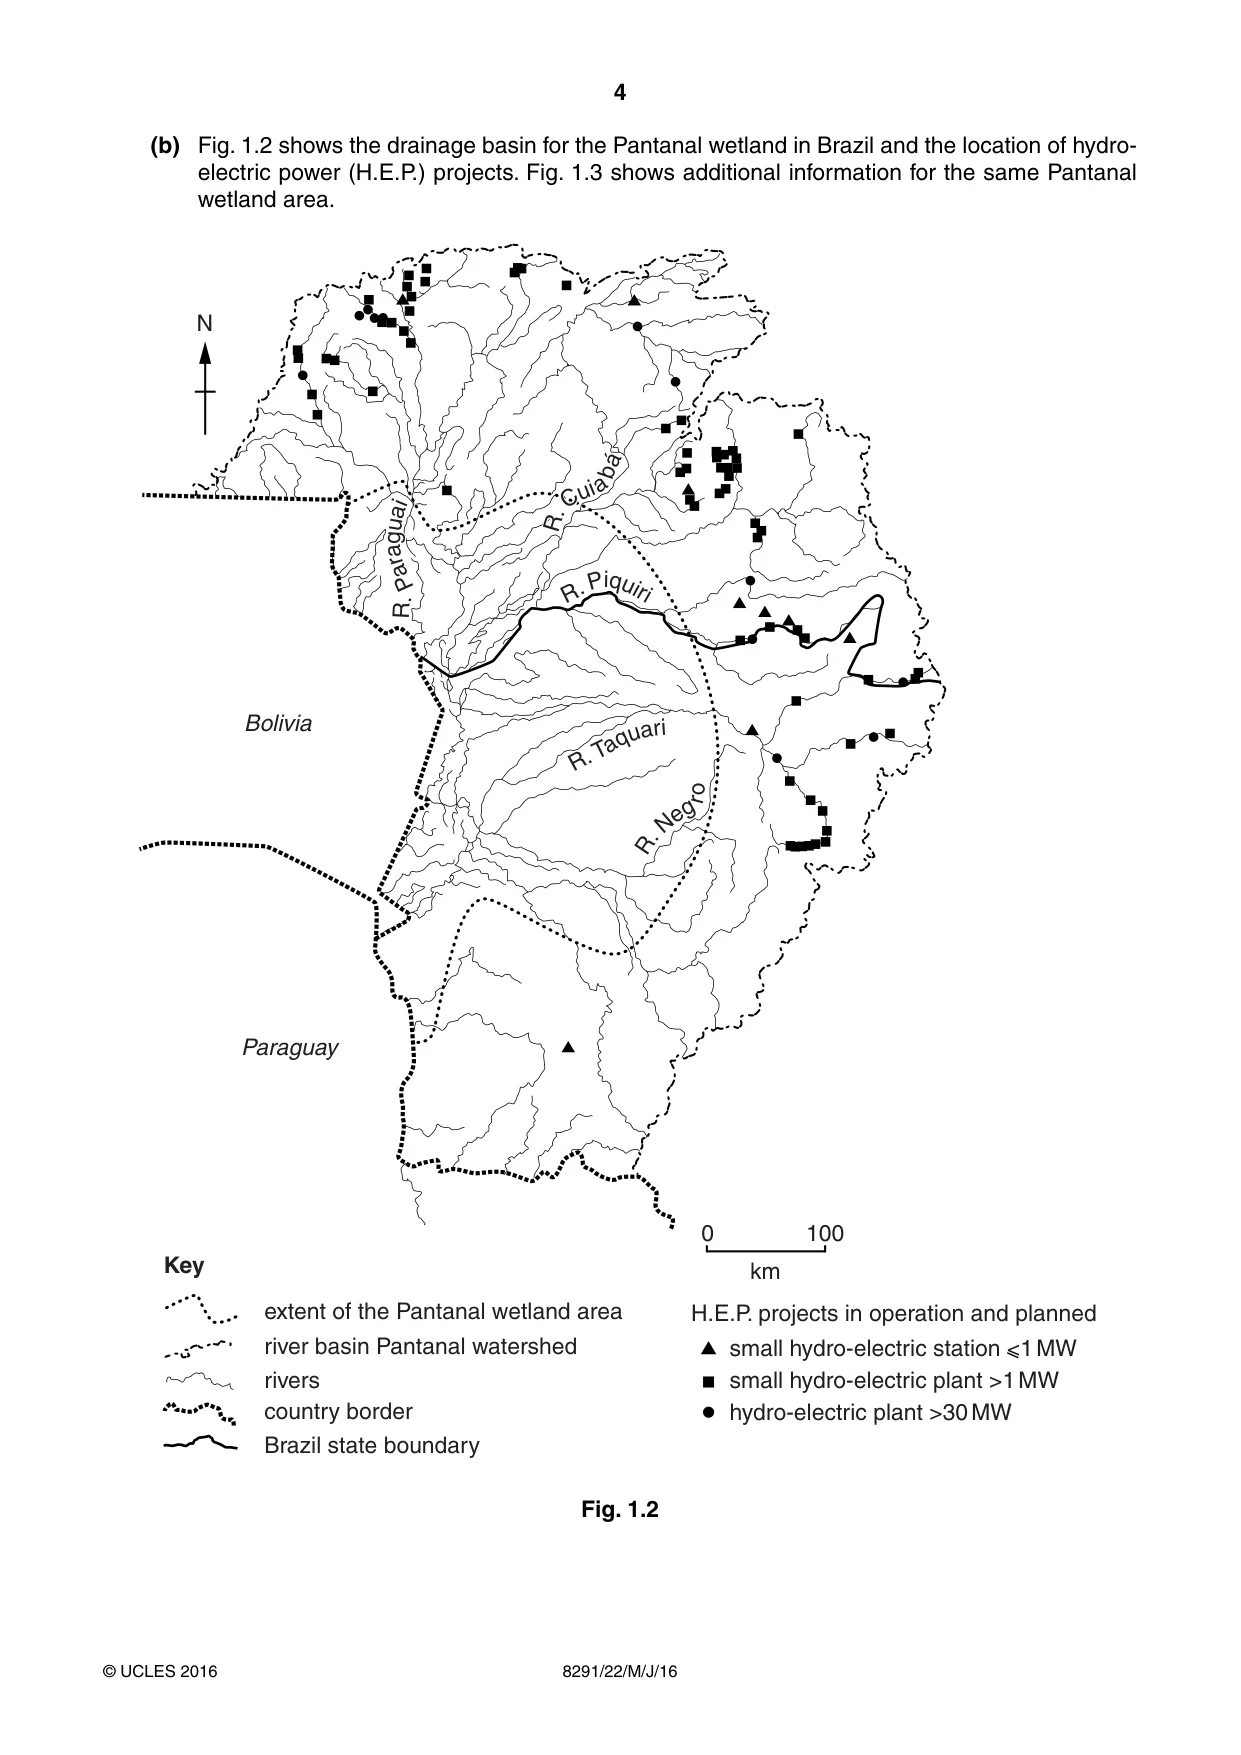
4 8291/22/M/J/16 © UCLES 2016 (b) Fig. 1.2 shows the drainage basin for the Pantanal wetland in Brazil and the location of hydro- electric power (H.E.P.) projects. Fig. 1.3 shows additional information for the same Pantanal wetland area. Key extent of the Pantanal wetland area H.E.P. projects in operation and planned small hydro-electric station <1 MW small hydro-electric plant >1 MW hydro-electric plant >30 MW river basin Pantanal watershed rivers country border Brazil state boundary 0 100 km N R . Pa r a g u a i R . Pa r a g u a i R . C ui a b á R . C ui a b á R. P i q u iri R. T a q u a ri R . N e g r o Bolivia Paraguay Fig. 1.2
Question paper, page 5
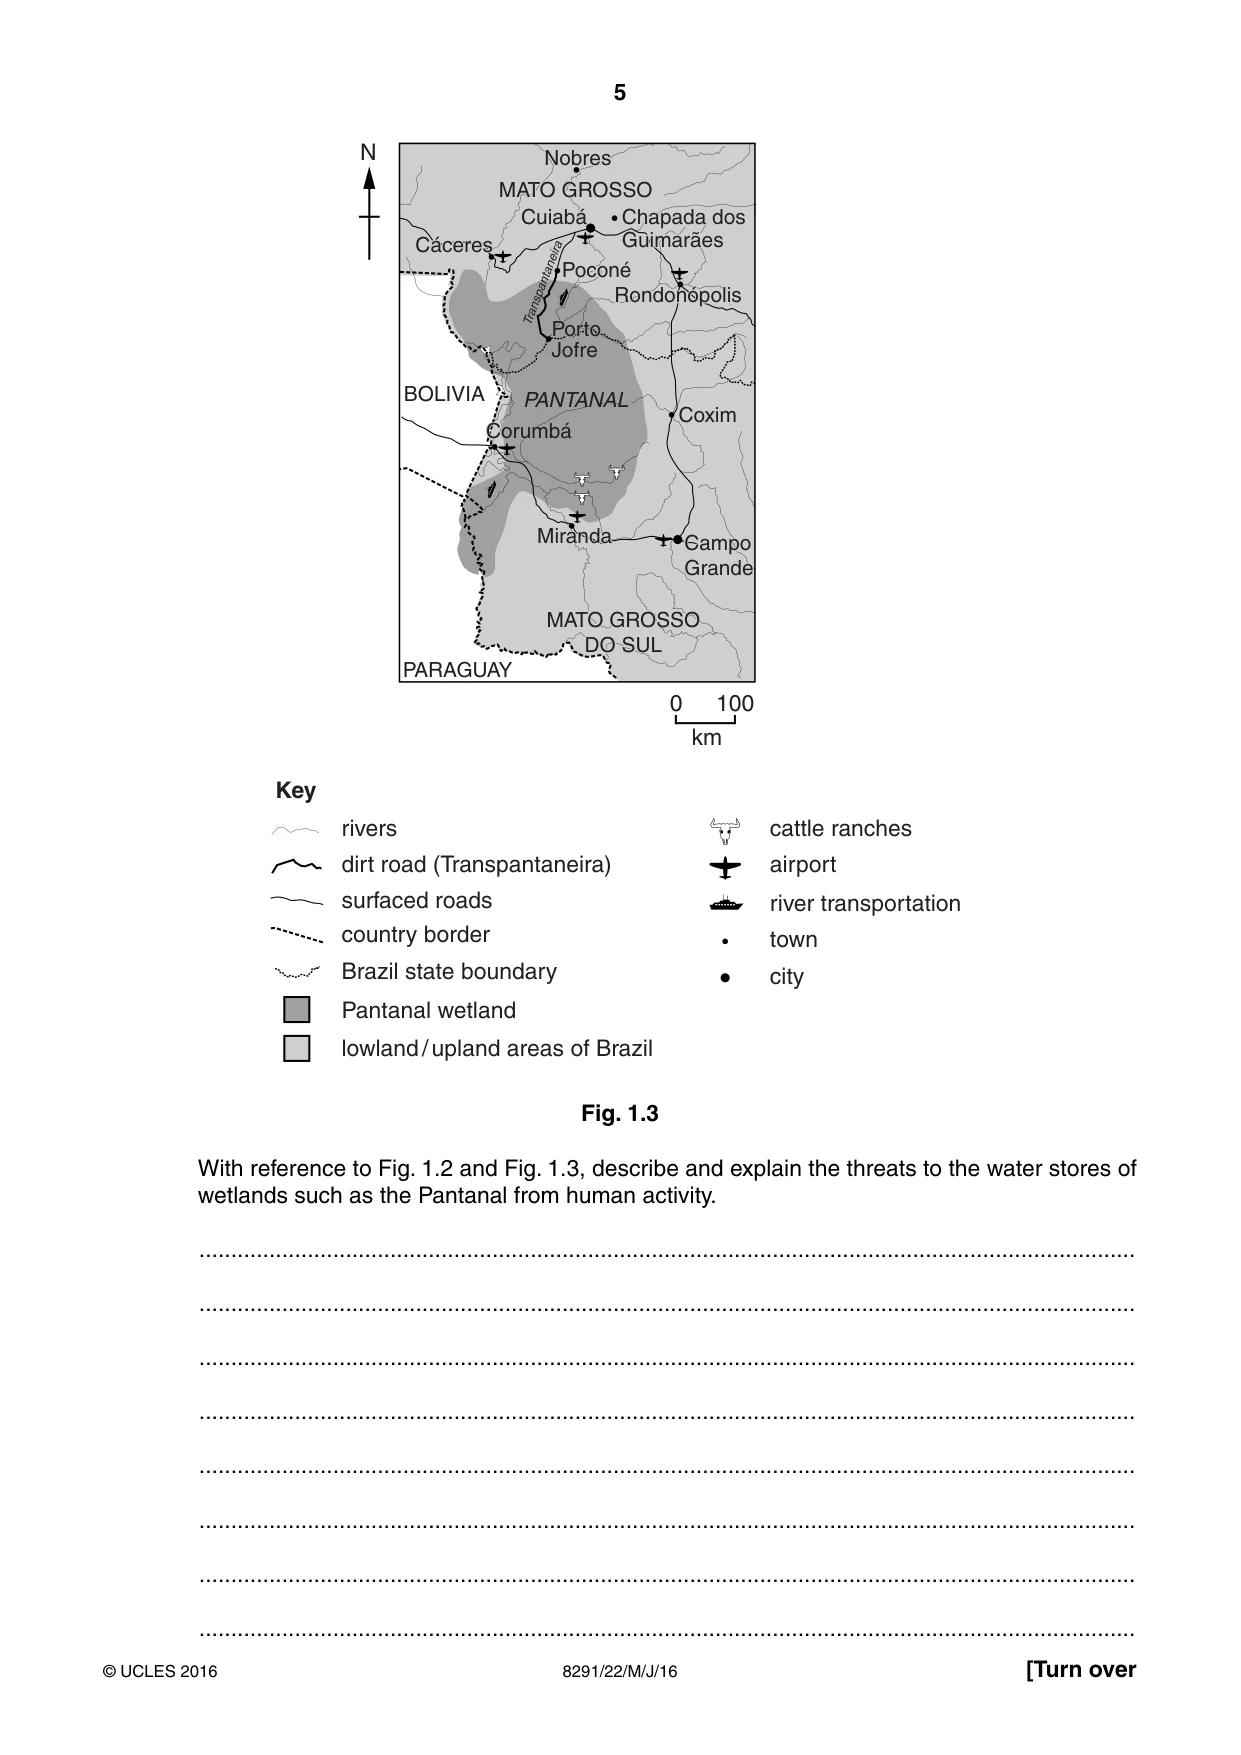
5 8291/22/M/J/16 © UCLES 2016 [Turn over dirt road (Transpantaneira) surfaced roads rivers Pantanal wetland country border Brazil state boundary lowland / upland areas of Brazil cattle ranches airport river transportation town city km 0 100 Key 0 100 Nobres Nobres Cáceres Cáceres Chapada dos Guimarães Chapada dos Guimarães Corumbá Corumbá Miranda Miranda Rondonópolis Rondonópolis Coxim BOLIVIA PANTANAL Transpantaneira PARAGUAY Cuiabá Cuiabá Poconé Poconé MATO GROSSO MATO GROSSO MATO GROSSO DO SUL MATO GROSSO DO SUL PANTANAL Campo Grande Campo Grande Porto Jofre Porto Jofre N Fig. 1.3 With reference to Fig. 1.2 and Fig. 1.3, describe and explain the threats to the water stores of wetlands such as the Pantanal from human activity. … … … … … … … …
Question paper, page 6
6 8291/22/M/J/16 © UCLES 2016 … … … … … … … …[8] [Total: 20]
Question paper, page 7
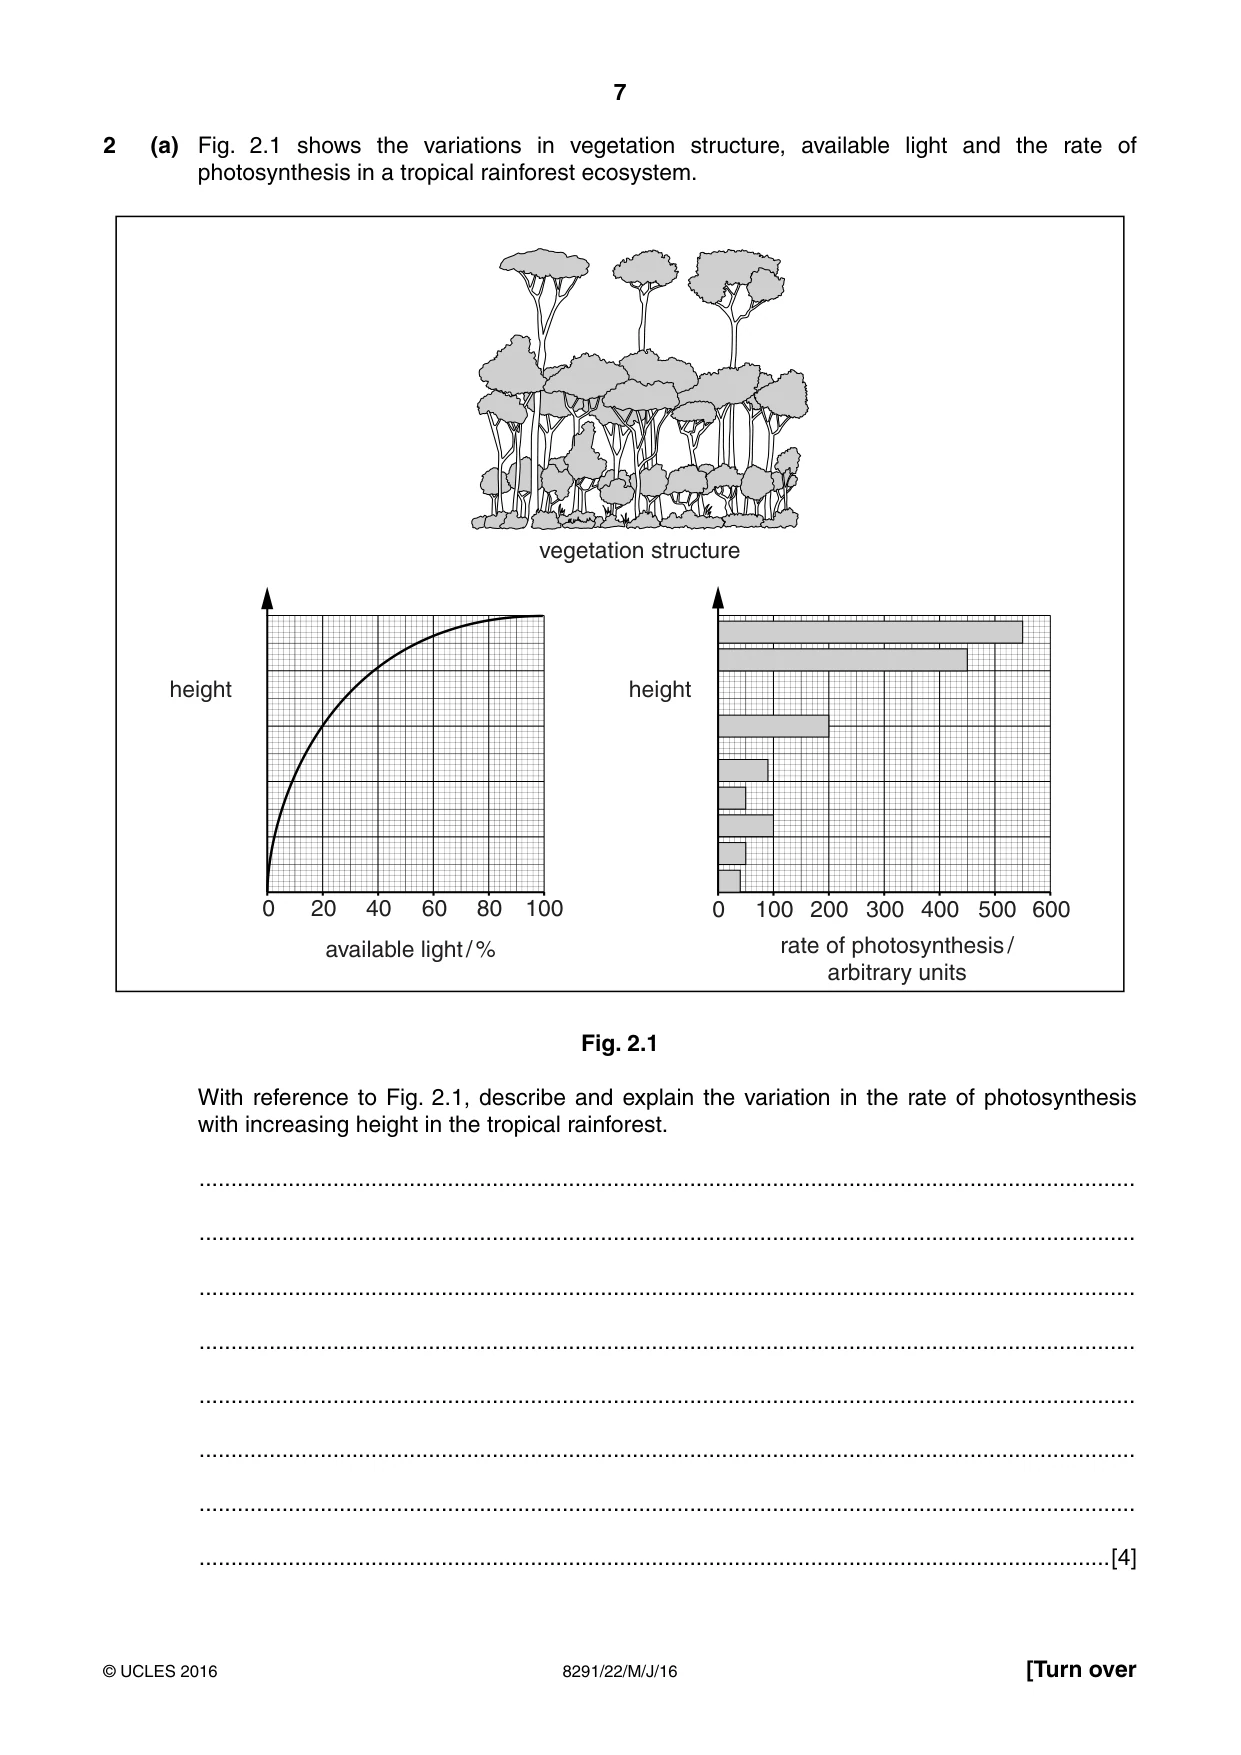
7 8291/22/M/J/16 © UCLES 2016 [Turn over 2 (a) Fig. 2.1 shows the variations in vegetation structure, available light and the rate of photosynthesis in a tropical rainforest ecosystem. 0 100 200 300 rate of photosynthesis / arbitrary units available light / % vegetation structure 400 20 40 60 80 500 600 0 100 height height Fig. 2.1 With reference to Fig. 2.1, describe and explain the variation in the rate of photosynthesis with increasing height in the tropical rainforest. … … … … … … … …[4]
Question paper, page 8
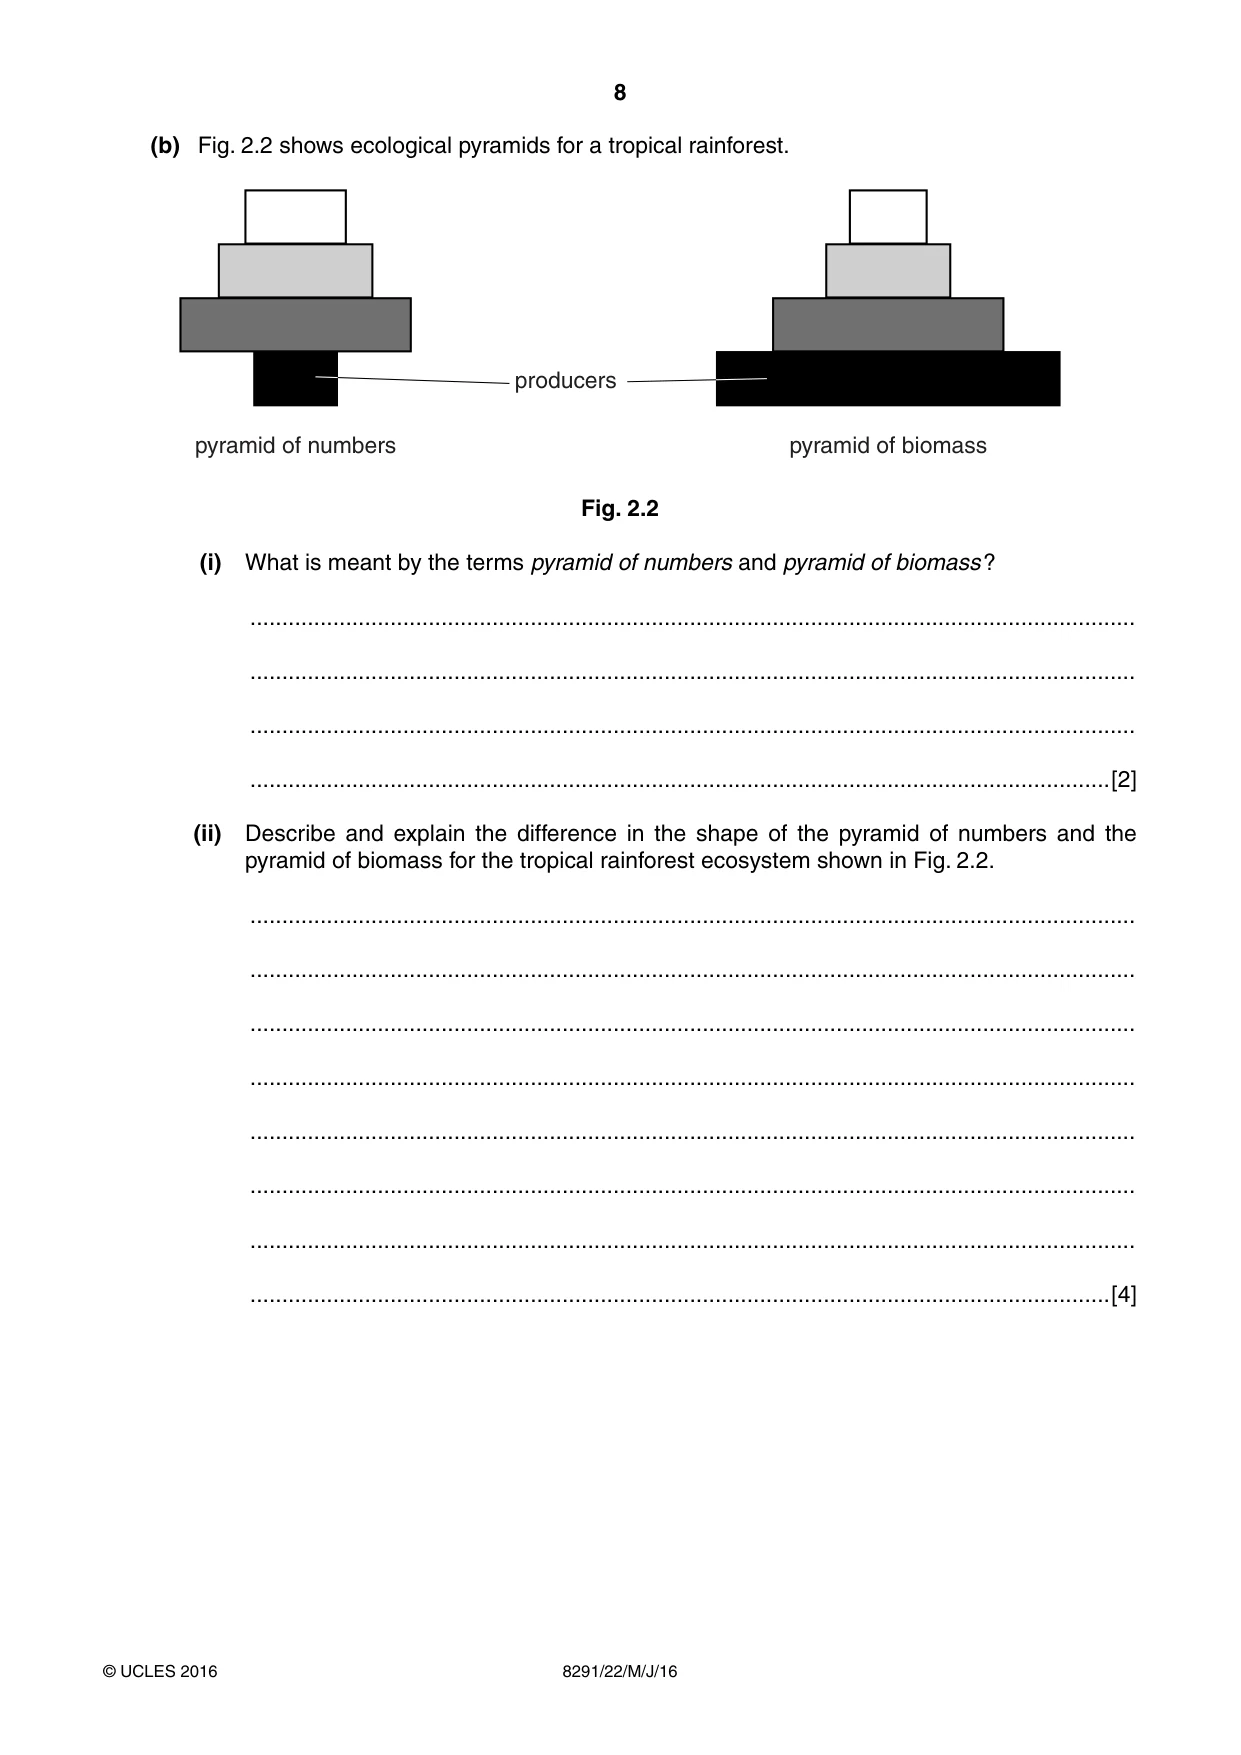
8 8291/22/M/J/16 © UCLES 2016 (b) Fig. 2.2 shows ecological pyramids for a tropical rainforest. producers pyramid of numbers pyramid of biomass Fig. 2.2 (i) What is meant by the terms pyramid of numbers and pyramid of biomass ? … … … …[2] (ii) Describe and explain the difference in the shape of the pyramid of numbers and the pyramid of biomass for the tropical rainforest ecosystem shown in Fig. 2.2. … … … … … … … …[4]
Question paper, page 9
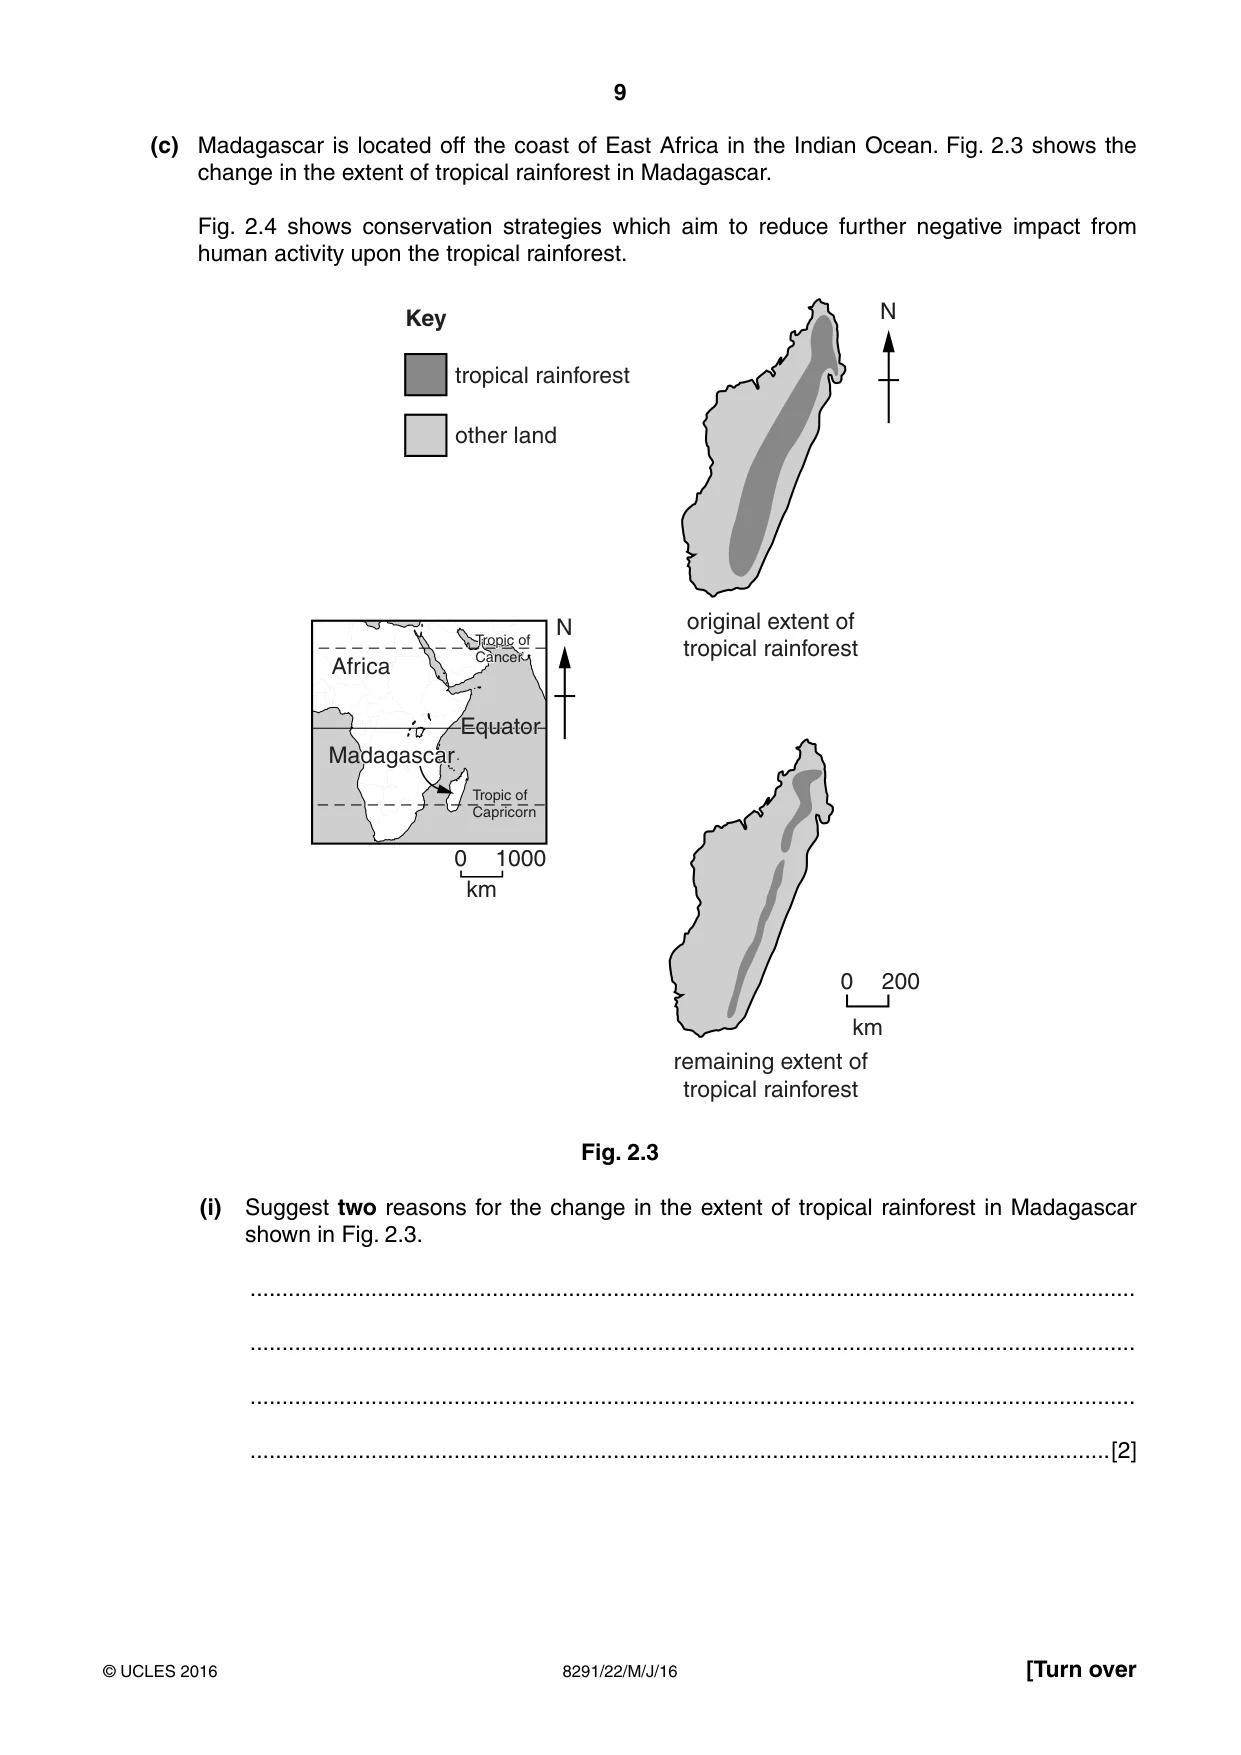
9 8291/22/M/J/16 © UCLES 2016 [Turn over (c) Madagascar is located off the coast of East Africa in the Indian Ocean. Fig. 2.3 shows the change in the extent of tropical rainforest in Madagascar. Fig. 2.4 shows conservation strategies which aim to reduce further negative impact from human activity upon the tropical rainforest. Equator Equator Madagascar Madagascar Africa Tropic of Capricorn Tropic of Cancer Tropic of Cancer original extent of tropical rainforest remaining extent of tropical rainforest N N 0 200 km Key tropical rainforest other land 0 1000 km Fig. 2.3 (i) Suggest two reasons for the change in the extent of tropical rainforest in Madagascar shown in Fig. 2.3. … … … …[2]
Question paper, page 10
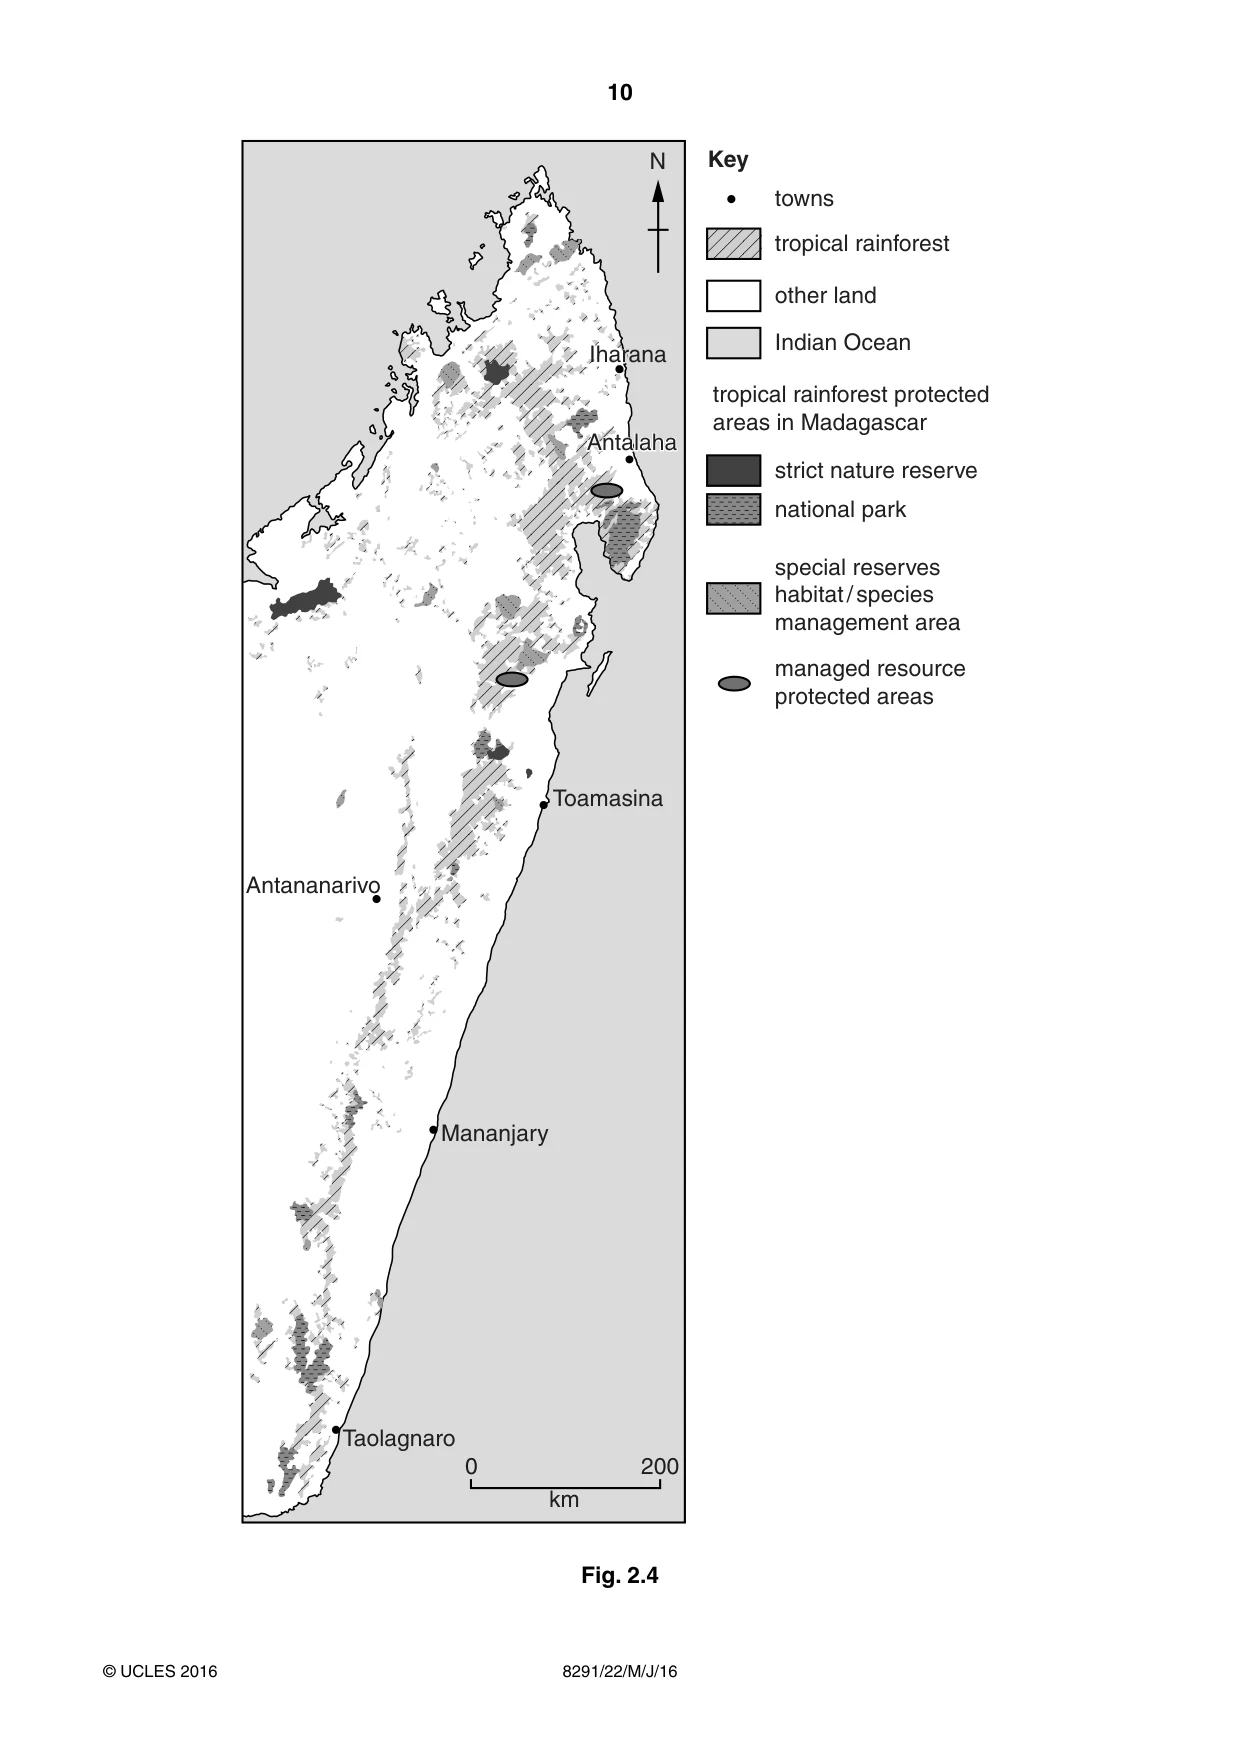
10 8291/22/M/J/16 © UCLES 2016 Key towns strict nature reserve national park special reserves habitat / species management area managed resource protected areas tropical rainforest other land Indian Ocean tropical rainforest protected areas in Madagascar n r Iharana Antalaha Antalaha Toamasina Antananarivo Mananjary Taolagnaro N 0 200 km Fig. 2.4
Question paper, page 11
11 8291/22/M/J/16 © UCLES 2016 [Turn over (ii) With reference to Fig. 2.4, suggest how conservation strategies reduce the human impact upon the remaining tropical rainforest ecosystems of Madagascar. … … … … … … … … … … … … … … … …[8] [Total: 20]
Question paper, page 12
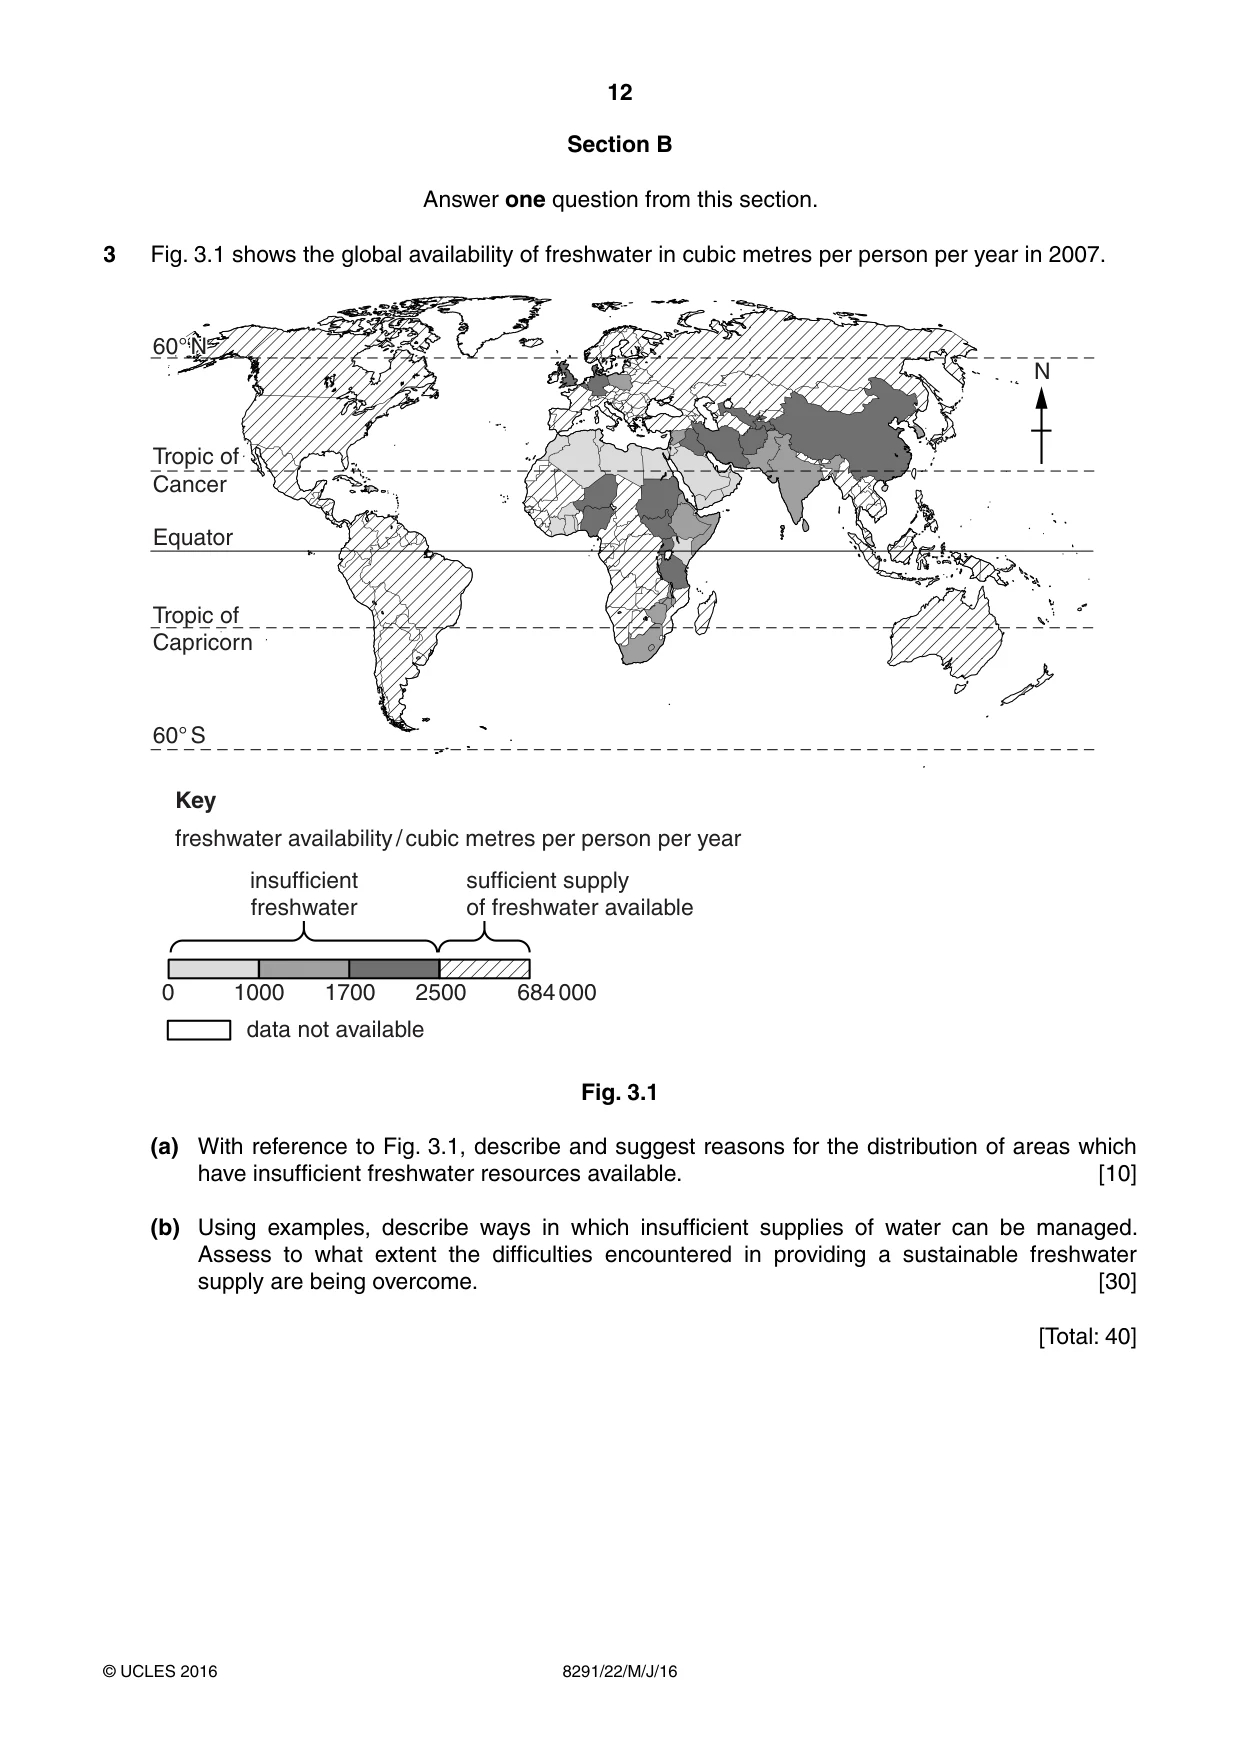
12 8291/22/M/J/16 © UCLES 2016 Section B Answer one question from this section. 3 Fig. 3.1 shows the global availability of freshwater in cubic metres per person per year in 2007. Equator Tropic of Capricorn insufficient freshwater freshwater availability / cubic metres per person per year data not available 0 1000 1700 2500 684 000 sufficient supply of freshwater available Tropic of Cancer 60° S 60° N 60° N N Key Fig. 3.1 (a) With reference to Fig. 3.1, describe and suggest reasons for the distribution of areas which have insufficient freshwater resources available. [10] (b) Using examples, describe ways in which insufficient supplies of water can be managed. Assess to what extent the difficulties encountered in providing a sustainable freshwater supply are being overcome. [30] [Total: 40]
Question paper, page 13
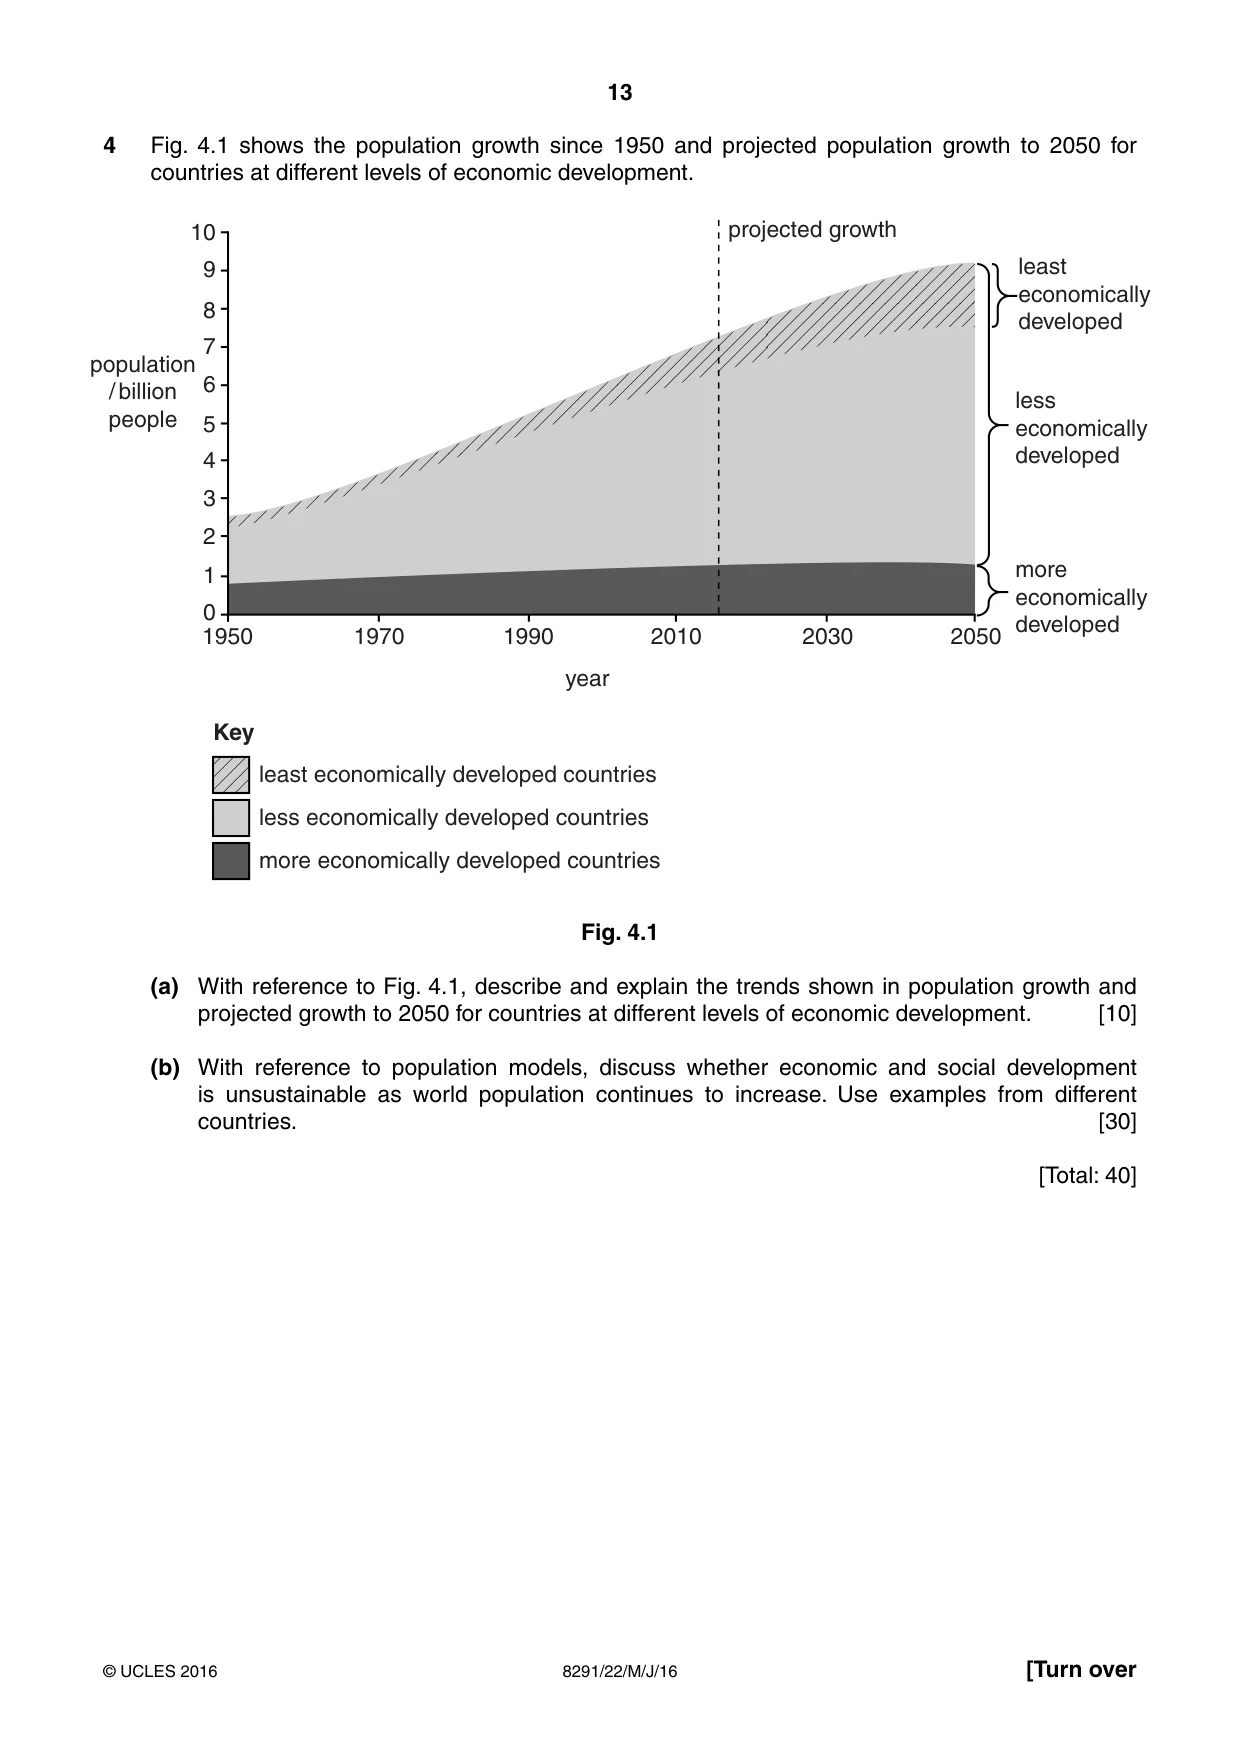
13 8291/22/M/J/16 © UCLES 2016 [Turn over 4 Fig. 4.1 shows the population growth since 1950 and projected population growth to 2050 for countries at different levels of economic development. 1950 0 1 2 3 4 5 6 7 8 9 10 population / billion people 1970 1990 year least economically developed less economically developed more economically developed 2010 2030 2050 projected growth Key least economically developed countries less economically developed countries more economically developed countries Fig. 4.1 (a) With reference to Fig. 4.1, describe and explain the trends shown in population growth and projected growth to 2050 for countries at different levels of economic development. [10] (b) With reference to population models, discuss whether economic and social development is unsustainable as world population continues to increase. Use examples from different countries. [30] [Total: 40]
Question paper, page 14
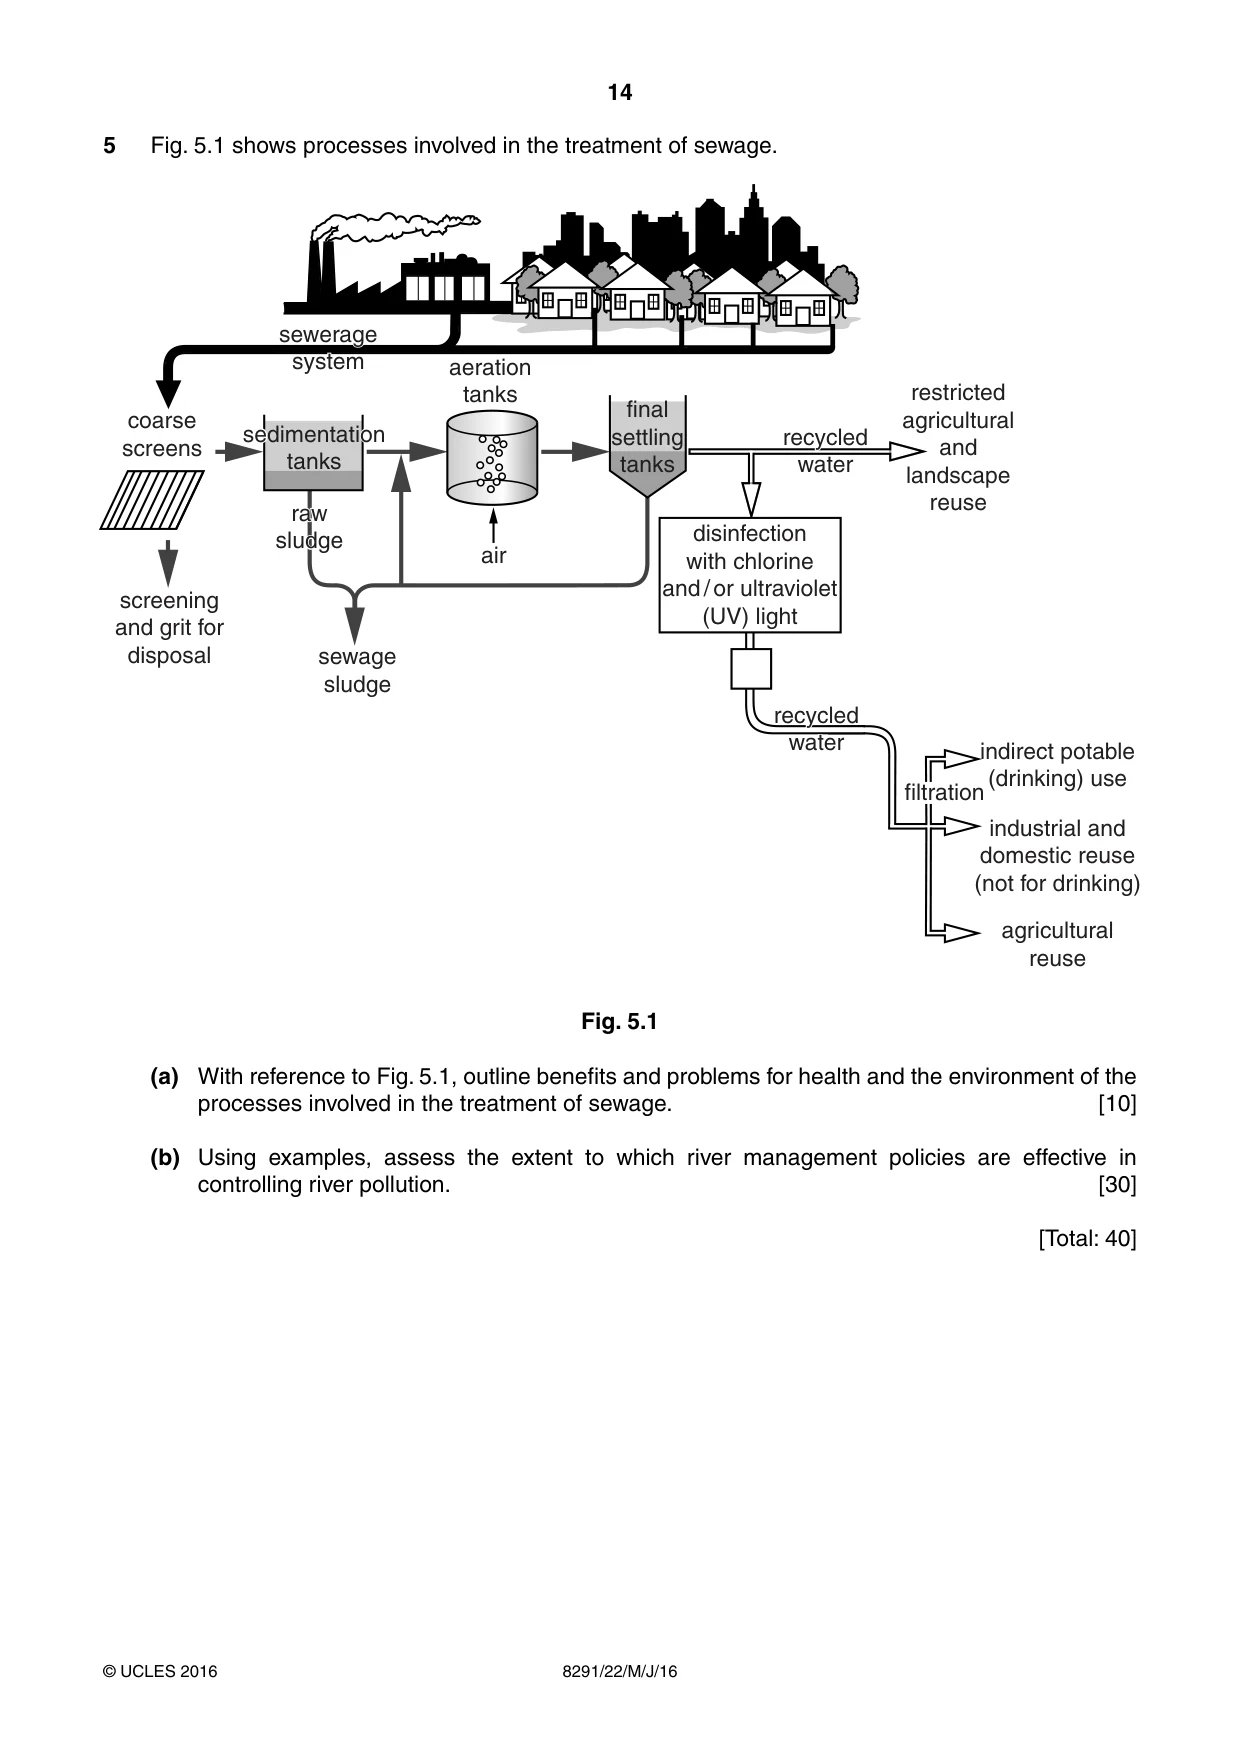
14 8291/22/M/J/16 © UCLES 2016 5 Fig. 5.1 shows processes involved in the treatment of sewage. sewerage system sewerage system primary sedimentation sedimentation tanks final settling tanks recycled water recycled water restricted agricultural and landscape reuse sewage sludge screening and grit for disposal raw sludge raw sludge air aeration tanks disinfection with chlorine and / or ultraviolet (UV) light recycled water recycled water indirect potable (drinking) use industrial and domestic reuse (not for drinking) agricultural reuse coarse screens filtration Fig. 5.1 (a) With reference to Fig. 5.1, outline benefits and problems for health and the environment of the processes involved in the treatment of sewage. [10] (b) Using examples, assess the extent to which river management policies are effective in controlling river pollution. [30] [Total: 40]
Question paper, page 15
15 8291/22/M/J/16 © UCLES 2016 BLANK PAGE
Question paper, page 16
16 8291/22/M/J/16 © UCLES 2016 BLANK PAGE Permission to reproduce items where third-party owned material protected by copyright is included has been sought and cleared where possible. Every reasonable effort has been made by the publisher (UCLES) to trace copyright holders, but if any items requiring clearance have unwittingly been included, the publisher will be pleased to make amends at the earliest possible opportunity. To avoid the issue of disclosure of answer-related information to candidates, all copyright acknowledgements are reproduced online in the Cambridge International Examinations Copyright Acknowledgements Booklet. This is produced for each series of examinations and is freely available to download at www.cie.org.uk after the live examination series. Cambridge International Examinations is part of the Cambridge Assessment Group. Cambridge Assessment is the brand name of University of Cambridge Local Examinations Syndicate (UCLES), which is itself a department of the University of Cambridge.
Mark scheme, page 1
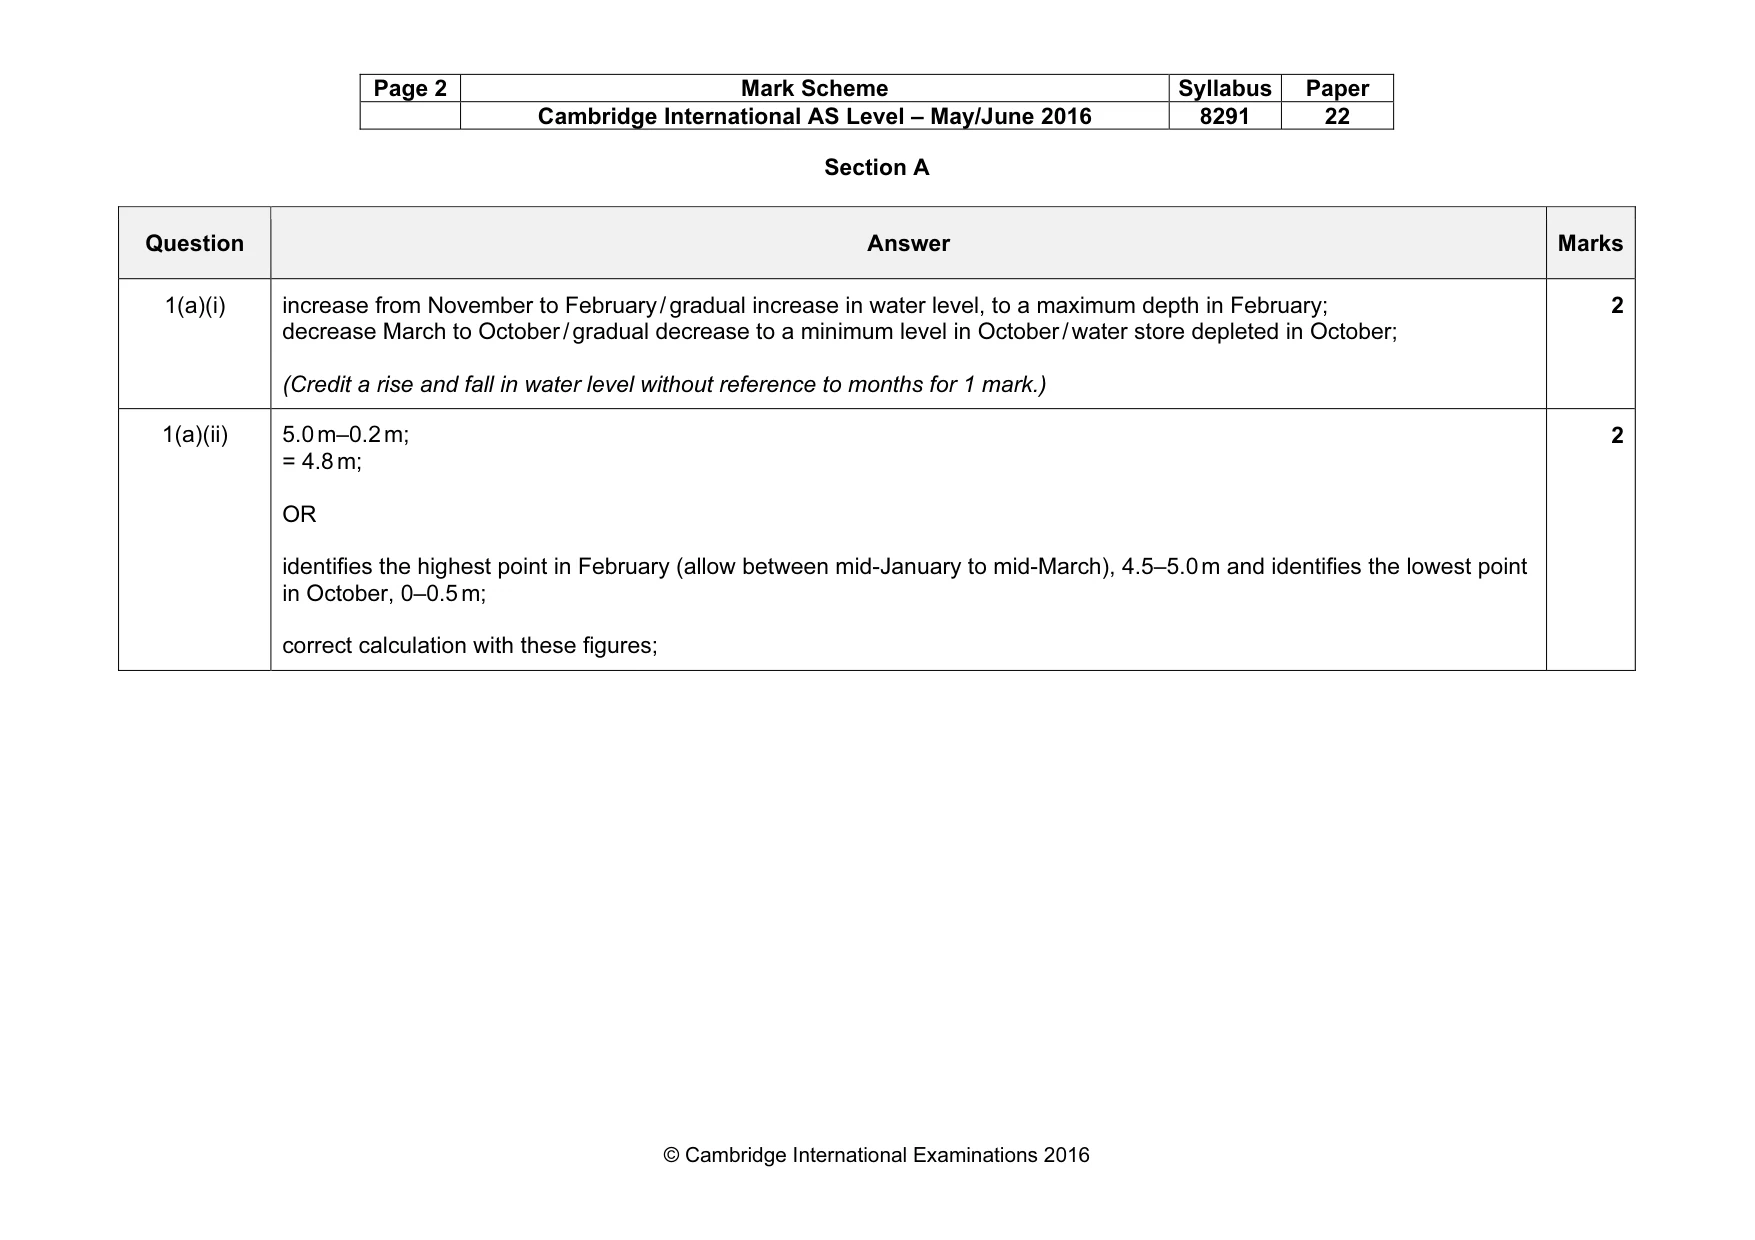
® IGCSE is the registered trademark of Cambridge International Examinations. This document consists of 17 printed pages. © UCLES 2016 [Turn over Cambridge International Examinations Cambridge International Advanced Subsidiary Level ENVIRONMENTAL MANAGEMENT 8291/22 Paper 2 May/June 2016 MARK SCHEME Maximum Mark: 80 Published This mark scheme is published as an aid to teachers and candidates, to indicate the requirements of the examination. It shows the basis on which Examiners were instructed to award marks. It does not indicate the details of the discussions that took place at an Examiners’ meeting before marking began, which would have considered the acceptability of alternative answers. Mark schemes should be read in conjunction with the question paper and the Principal Examiner Report for Teachers. Cambridge will not enter into discussions about these mark schemes. Cambridge is publishing the mark schemes for the May/June 2016 series for most Cambridge IGCSE®, Cambridge International A and AS Level components and some Cambridge O Level components.
Mark scheme, page 2
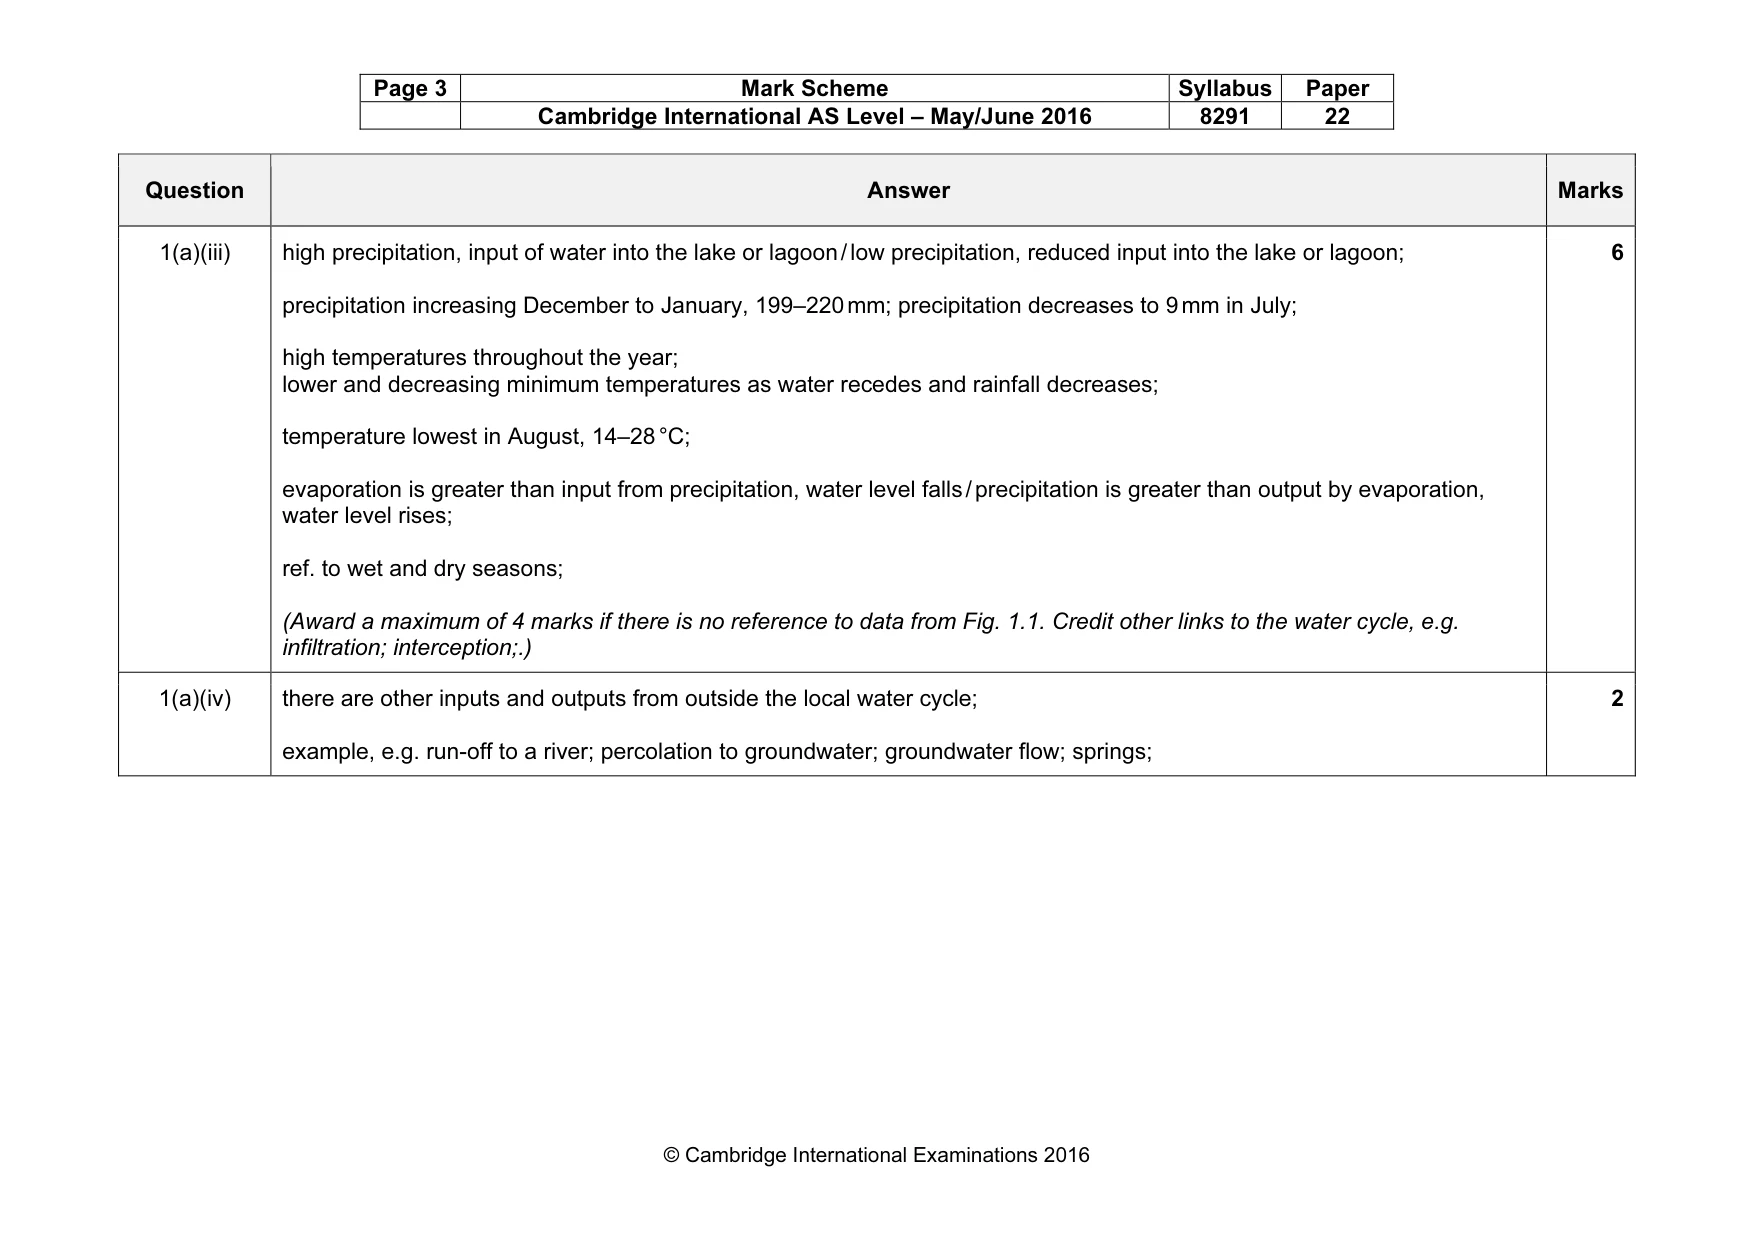
Page 2 Mark Scheme Syllabus Paper Cambridge International AS Level – May/June 2016 8291 22 © Cambridge International Examinations 2016 Section A Question Answer Marks 1(a)(i) increase from November to February / gradual increase in water level, to a maximum depth in February; decrease March to October / gradual decrease to a minimum level in October / water store depleted in October; (Credit a rise and fall in water level without reference to months for 1 mark.) 2 1(a)(ii) 5.0 m–0.2 m; = 4.8 m; OR identifies the highest point in February (allow between mid-January to mid-March), 4.5–5.0 m and identifies the lowest point in October, 0–0.5 m; correct calculation with these figures; 2
Mark scheme, page 3
Page 3 Mark Scheme Syllabus Paper Cambridge International AS Level – May/June 2016 8291 22 © Cambridge International Examinations 2016 Question Answer Marks 1(a)(iii) high precipitation, input of water into the lake or lagoon / low precipitation, reduced input into the lake or lagoon; precipitation increasing December to January, 199–220 mm; precipitation decreases to 9 mm in July; high temperatures throughout the year; lower and decreasing minimum temperatures as water recedes and rainfall decreases; temperature lowest in August, 14–28 °C; evaporation is greater than input from precipitation, water level falls / precipitation is greater than output by evaporation, water level rises; ref. to wet and dry seasons; (Award a maximum of 4 marks if there is no reference to data from Fig. 1.1. Credit other links to the water cycle, e.g. infiltration; interception;.) 6 1(a)(iv) there are other inputs and outputs from outside the local water cycle; example, e.g. run-off to a river; percolation to groundwater; groundwater flow; springs; 2
Mark scheme, page 4
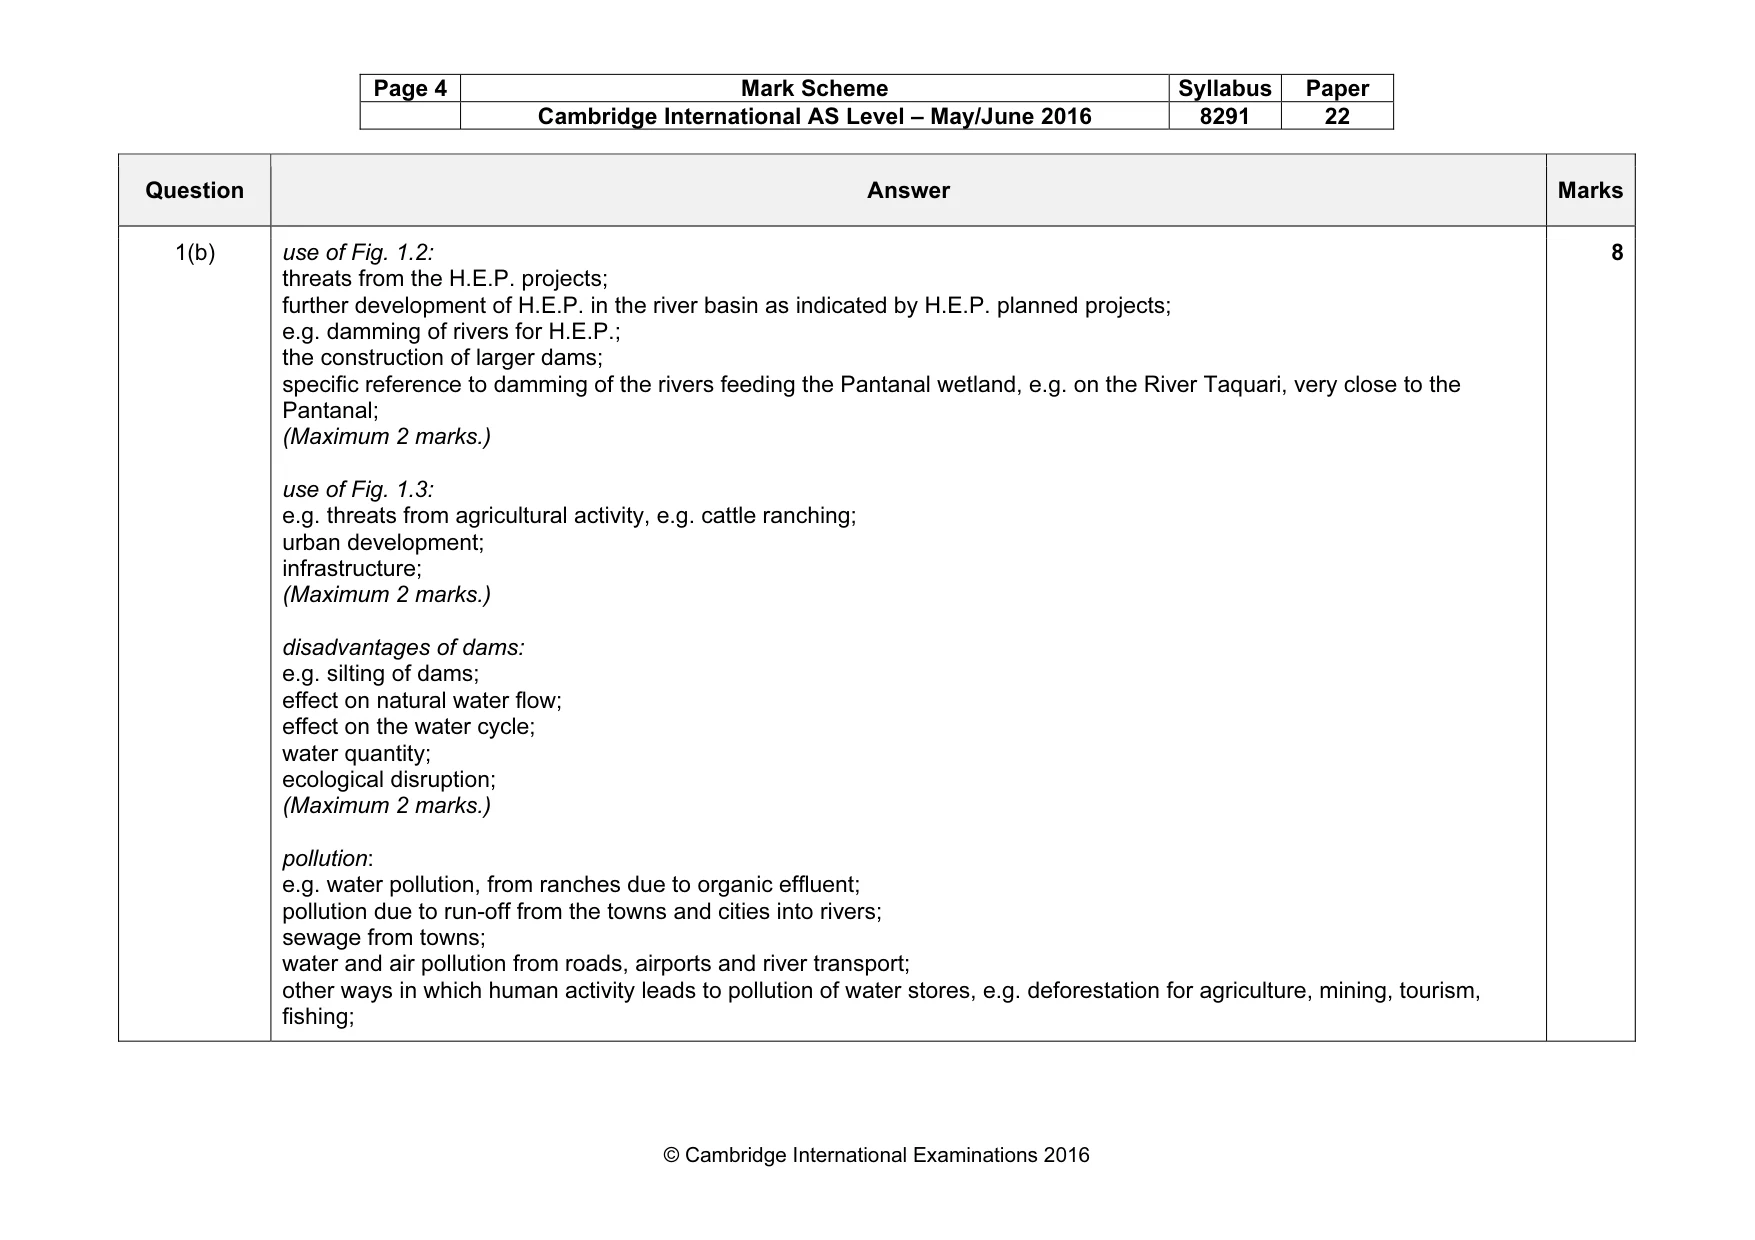
Page 4 Mark Scheme Syllabus Paper Cambridge International AS Level – May/June 2016 8291 22 © Cambridge International Examinations 2016 Question Answer Marks 1(b) use of Fig. 1.2: threats from the H.E.P. projects; further development of H.E.P. in the river basin as indicated by H.E.P. planned projects; e.g. damming of rivers for H.E.P.; the construction of larger dams; specific reference to damming of the rivers feeding the Pantanal wetland, e.g. on the River Taquari, very close to the Pantanal; (Maximum 2 marks.) use of Fig. 1.3: e.g. threats from agricultural activity, e.g. cattle ranching; urban development; infrastructure; (Maximum 2 marks.) disadvantages of dams: e.g. silting of dams; effect on natural water flow; effect on the water cycle; water quantity; ecological disruption; (Maximum 2 marks.) pollution: e.g. water pollution, from ranches due to organic effluent; pollution due to run-off from the towns and cities into rivers; sewage from towns; water and air pollution from roads, airports and river transport; other ways in which human activity leads to pollution of water stores, e.g. deforestation for agriculture, mining, tourism, fishing; 8
Mark scheme, page 5
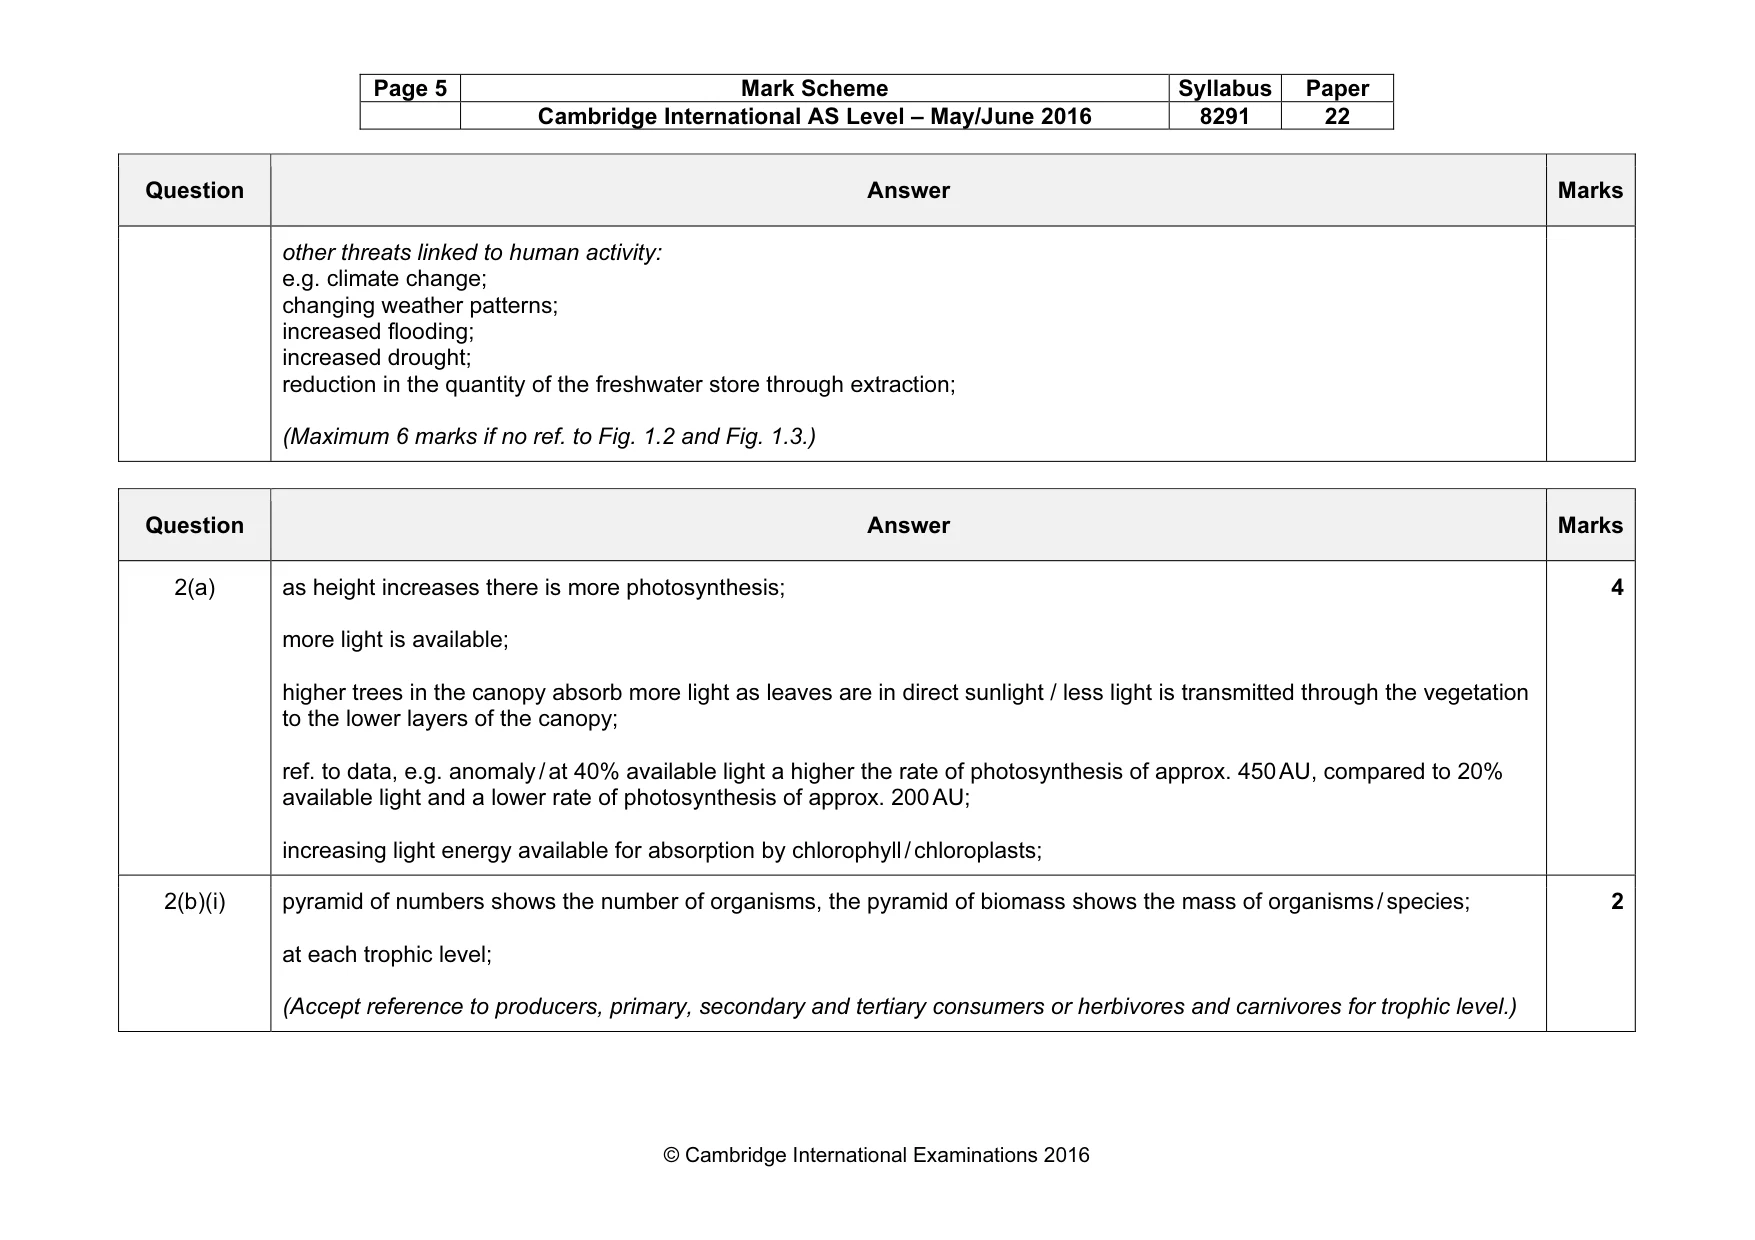
Page 5 Mark Scheme Syllabus Paper Cambridge International AS Level – May/June 2016 8291 22 © Cambridge International Examinations 2016 Question Answer Marks other threats linked to human activity: e.g. climate change; changing weather patterns; increased flooding; increased drought; reduction in the quantity of the freshwater store through extraction; (Maximum 6 marks if no ref. to Fig. 1.2 and Fig. 1.3.) Question Answer Marks 2(a) as height increases there is more photosynthesis; more light is available; higher trees in the canopy absorb more light as leaves are in direct sunlight / less light is transmitted through the vegetation to the lower layers of the canopy; ref. to data, e.g. anomaly / at 40% available light a higher the rate of photosynthesis of approx. 450 AU, compared to 20% available light and a lower rate of photosynthesis of approx. 200 AU; increasing light energy available for absorption by chlorophyll / chloroplasts; 4 2(b)(i) pyramid of numbers shows the number of organisms, the pyramid of biomass shows the mass of organisms / species; at each trophic level; (Accept reference to producers, primary, secondary and tertiary consumers or herbivores and carnivores for trophic level.) 2
Mark scheme, page 6
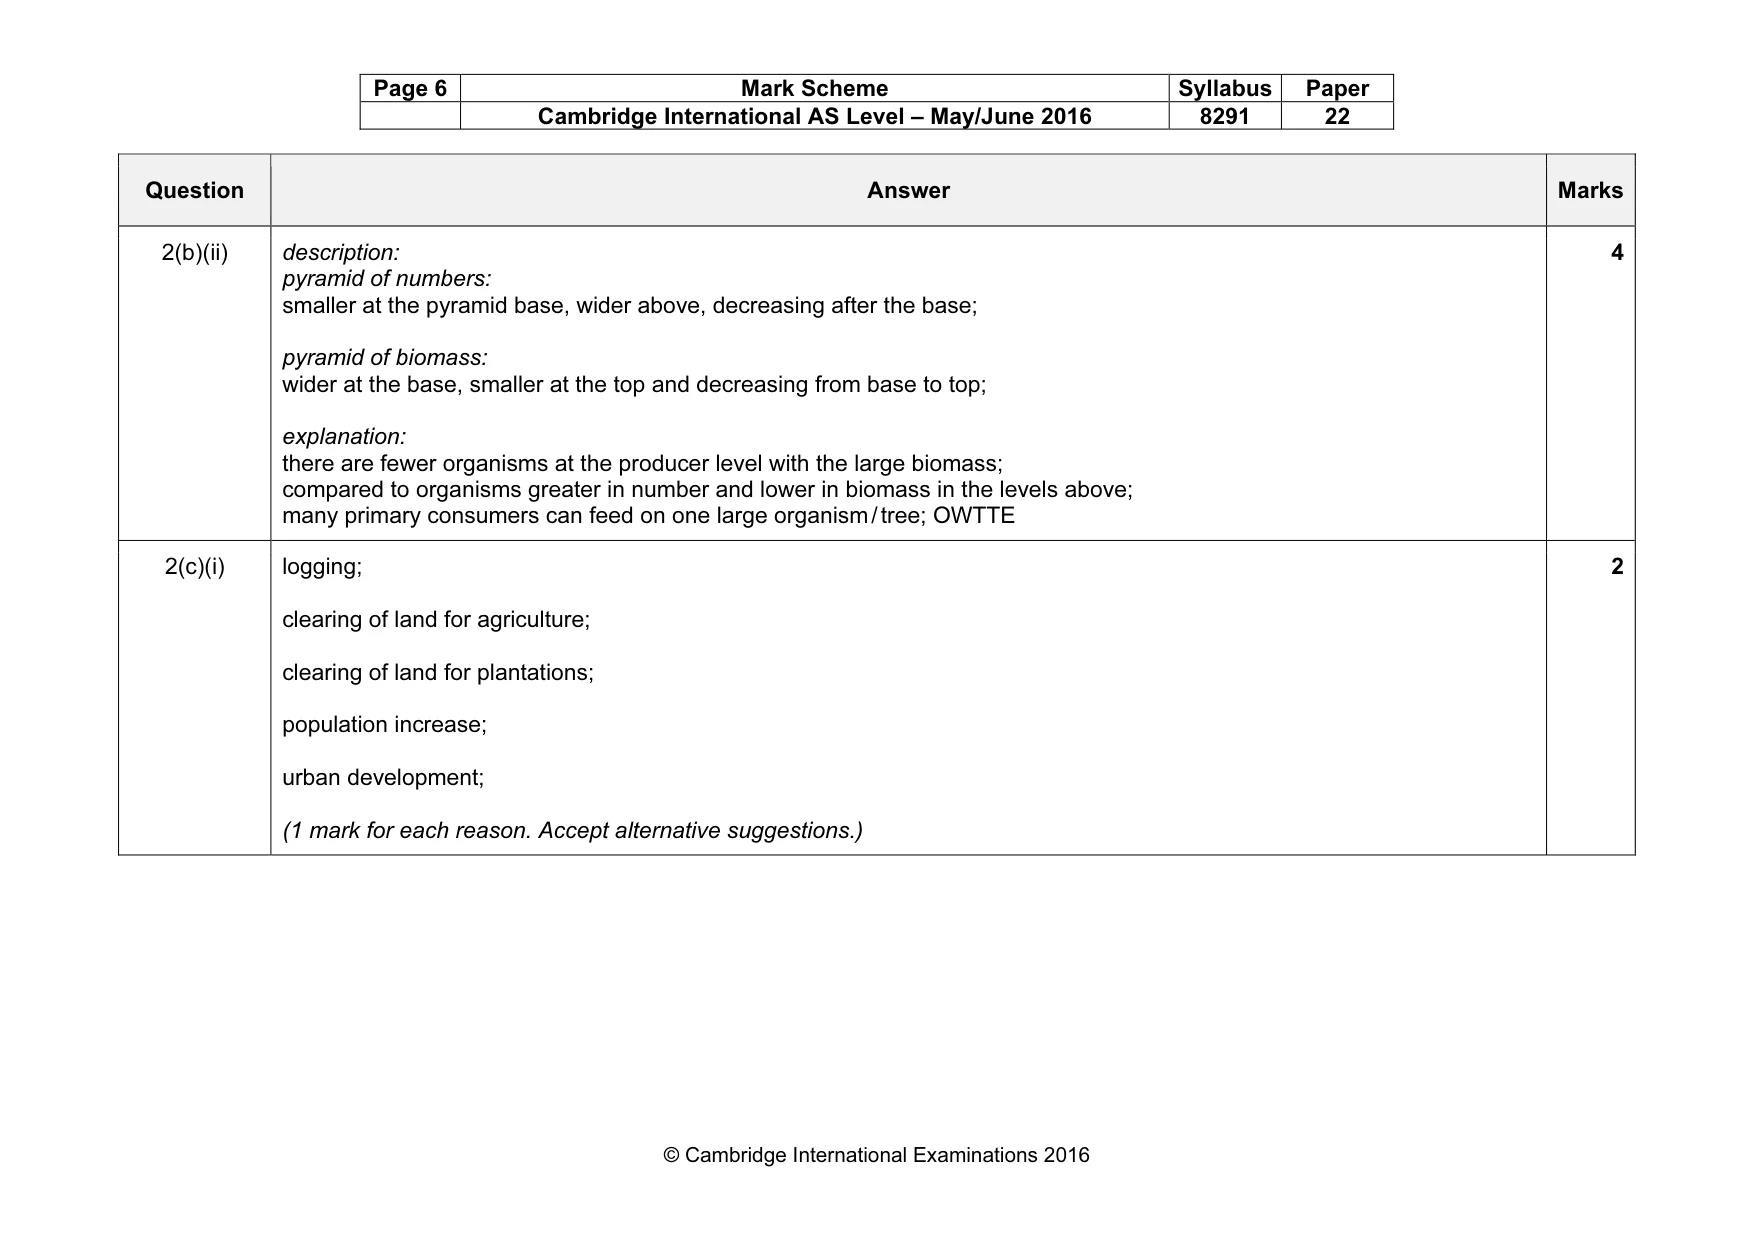
Page 6 Mark Scheme Syllabus Paper Cambridge International AS Level – May/June 2016 8291 22 © Cambridge International Examinations 2016 Question Answer Marks 2(b)(ii) description: pyramid of numbers: smaller at the pyramid base, wider above, decreasing after the base; pyramid of biomass: wider at the base, smaller at the top and decreasing from base to top; explanation: there are fewer organisms at the producer level with the large biomass; compared to organisms greater in number and lower in biomass in the levels above; many primary consumers can feed on one large organism / tree; OWTTE 4 2(c)(i) logging; clearing of land for agriculture; clearing of land for plantations; population increase; urban development; (1 mark for each reason. Accept alternative suggestions.) 2
Mark scheme, page 7
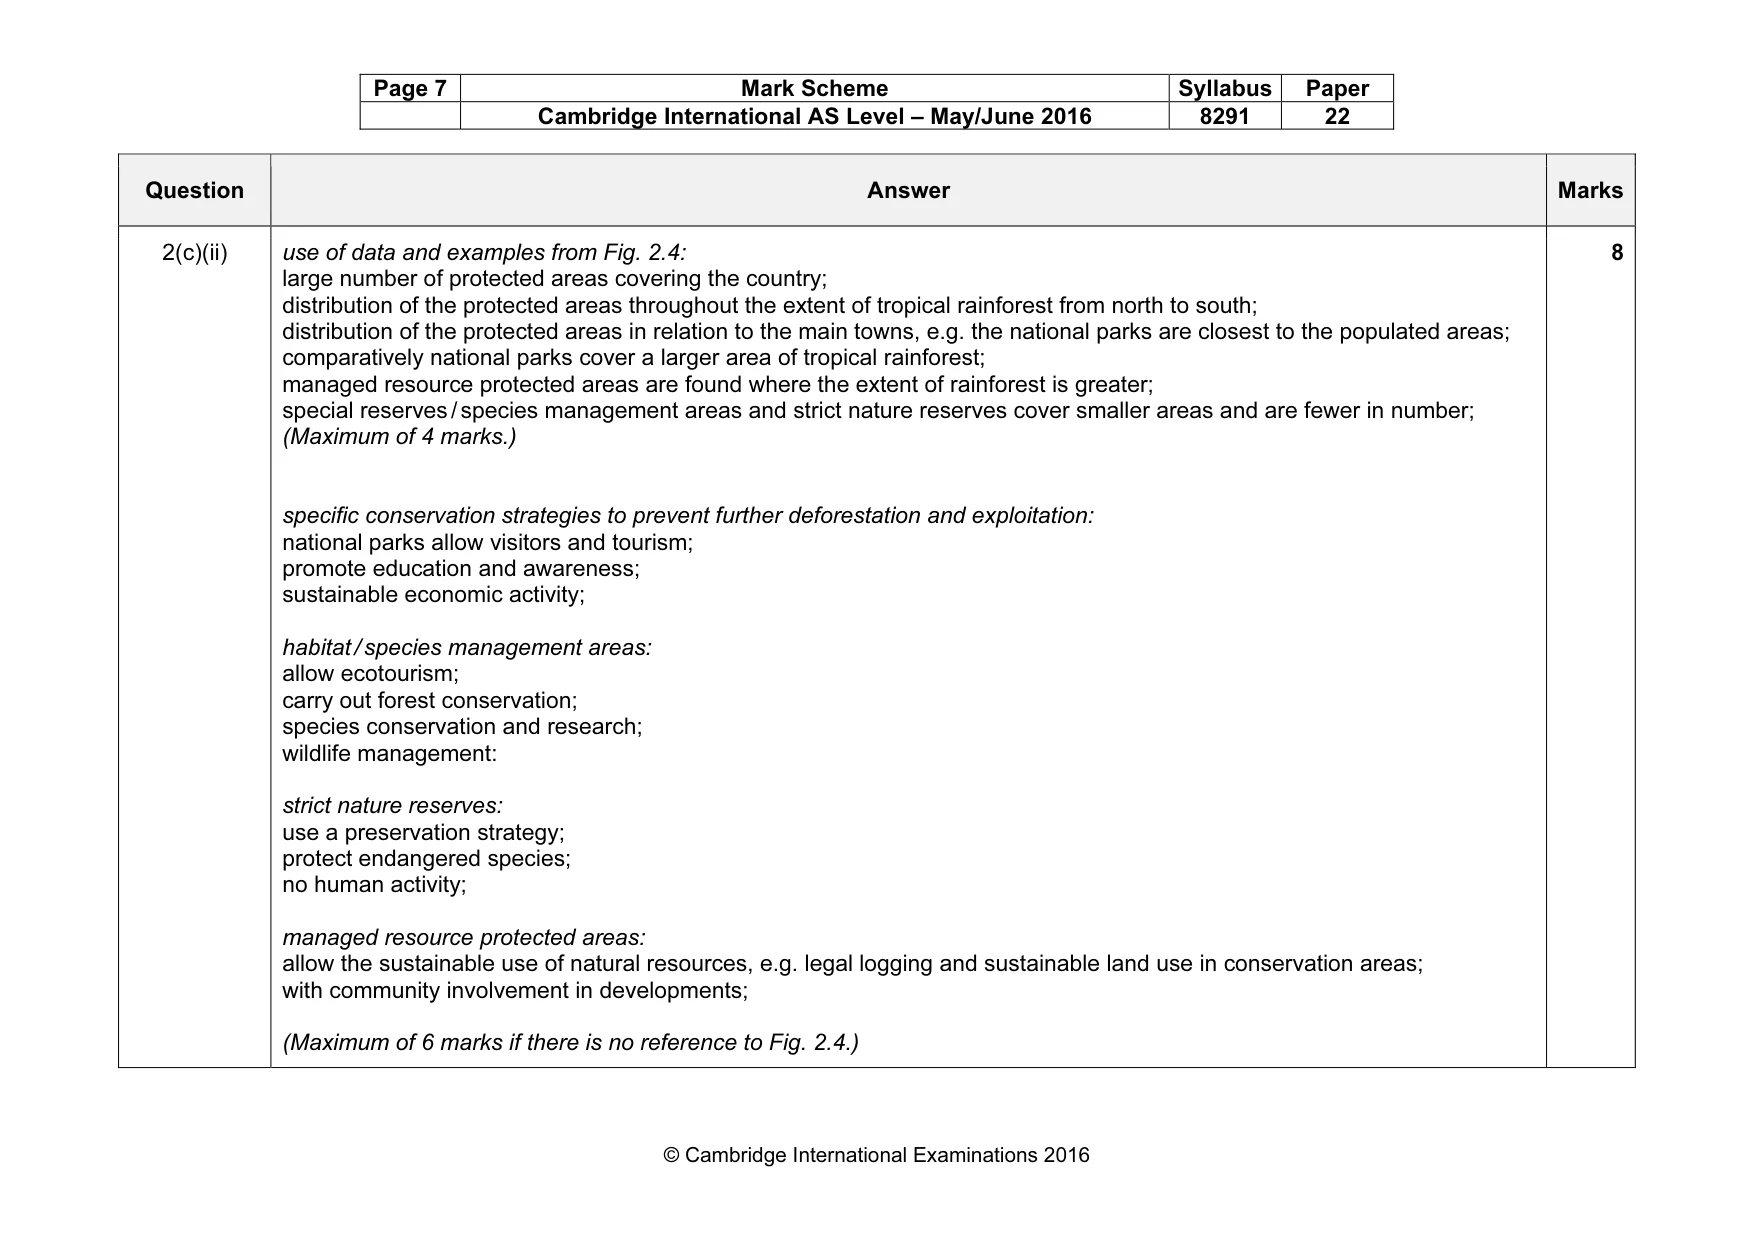
Page 7 Mark Scheme Syllabus Paper Cambridge International AS Level – May/June 2016 8291 22 © Cambridge International Examinations 2016 Question Answer Marks 2(c)(ii) use of data and examples from Fig. 2.4: large number of protected areas covering the country; distribution of the protected areas throughout the extent of tropical rainforest from north to south; distribution of the protected areas in relation to the main towns, e.g. the national parks are closest to the populated areas; comparatively national parks cover a larger area of tropical rainforest; managed resource protected areas are found where the extent of rainforest is greater; special reserves / species management areas and strict nature reserves cover smaller areas and are fewer in number; (Maximum of 4 marks.) specific conservation strategies to prevent further deforestation and exploitation: national parks allow visitors and tourism; promote education and awareness; sustainable economic activity; habitat / species management areas: allow ecotourism; carry out forest conservation; species conservation and research; wildlife management: strict nature reserves: use a preservation strategy; protect endangered species; no human activity; managed resource protected areas: allow the sustainable use of natural resources, e.g. legal logging and sustainable land use in conservation areas; with community involvement in developments; (Maximum of 6 marks if there is no reference to Fig. 2.4.) 8
Mark scheme, page 8
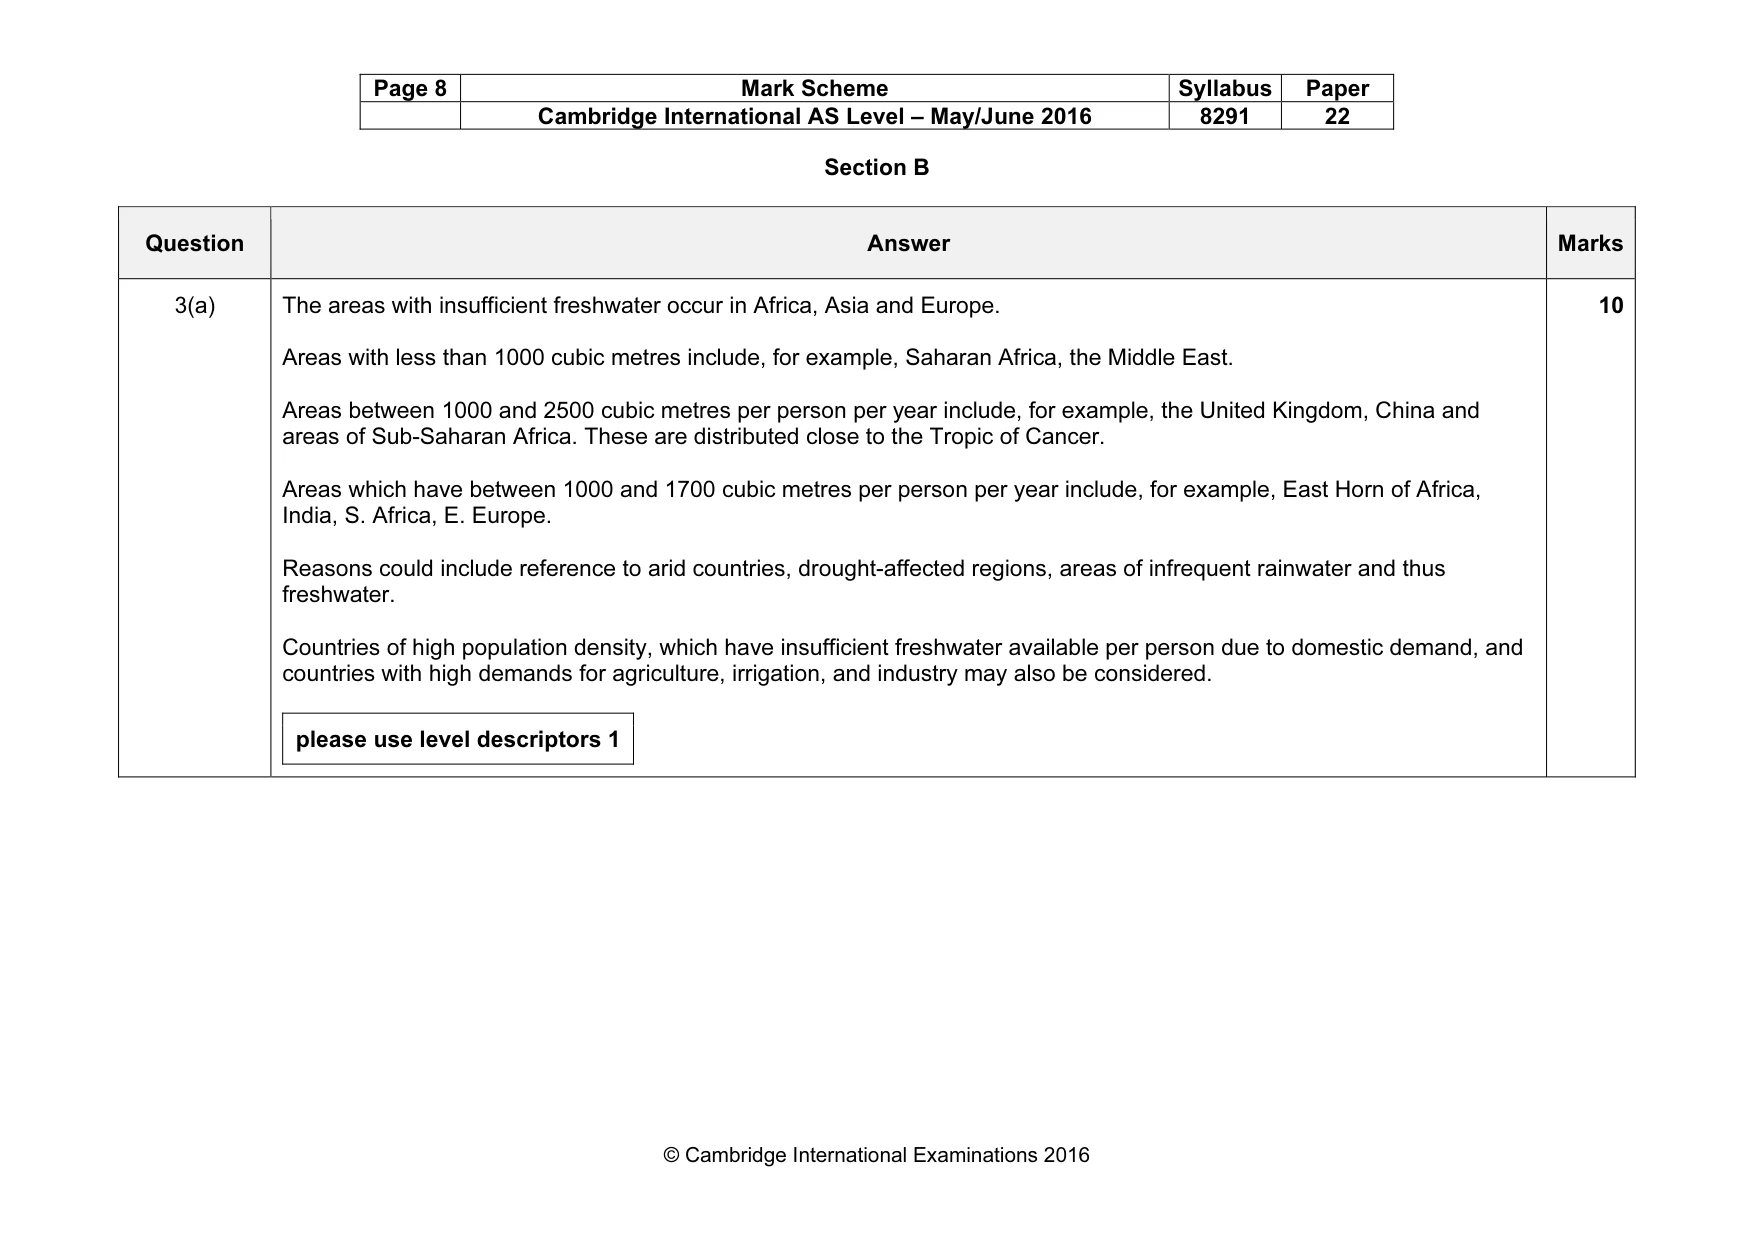
Page 8 Mark Scheme Syllabus Paper Cambridge International AS Level – May/June 2016 8291 22 © Cambridge International Examinations 2016 Section B Question Answer Marks 3(a) The areas with insufficient freshwater occur in Africa, Asia and Europe. Areas with less than 1000 cubic metres include, for example, Saharan Africa, the Middle East. Areas between 1000 and 2500 cubic metres per person per year include, for example, the United Kingdom, China and areas of Sub-Saharan Africa. These are distributed close to the Tropic of Cancer. Areas which have between 1000 and 1700 cubic metres per person per year include, for example, East Horn of Africa, India, S. Africa, E. Europe. Reasons could include reference to arid countries, drought-affected regions, areas of infrequent rainwater and thus freshwater. Countries of high population density, which have insufficient freshwater available per person due to domestic demand, and countries with high demands for agriculture, irrigation, and industry may also be considered. please use level descriptors 1 10
Mark scheme, page 9
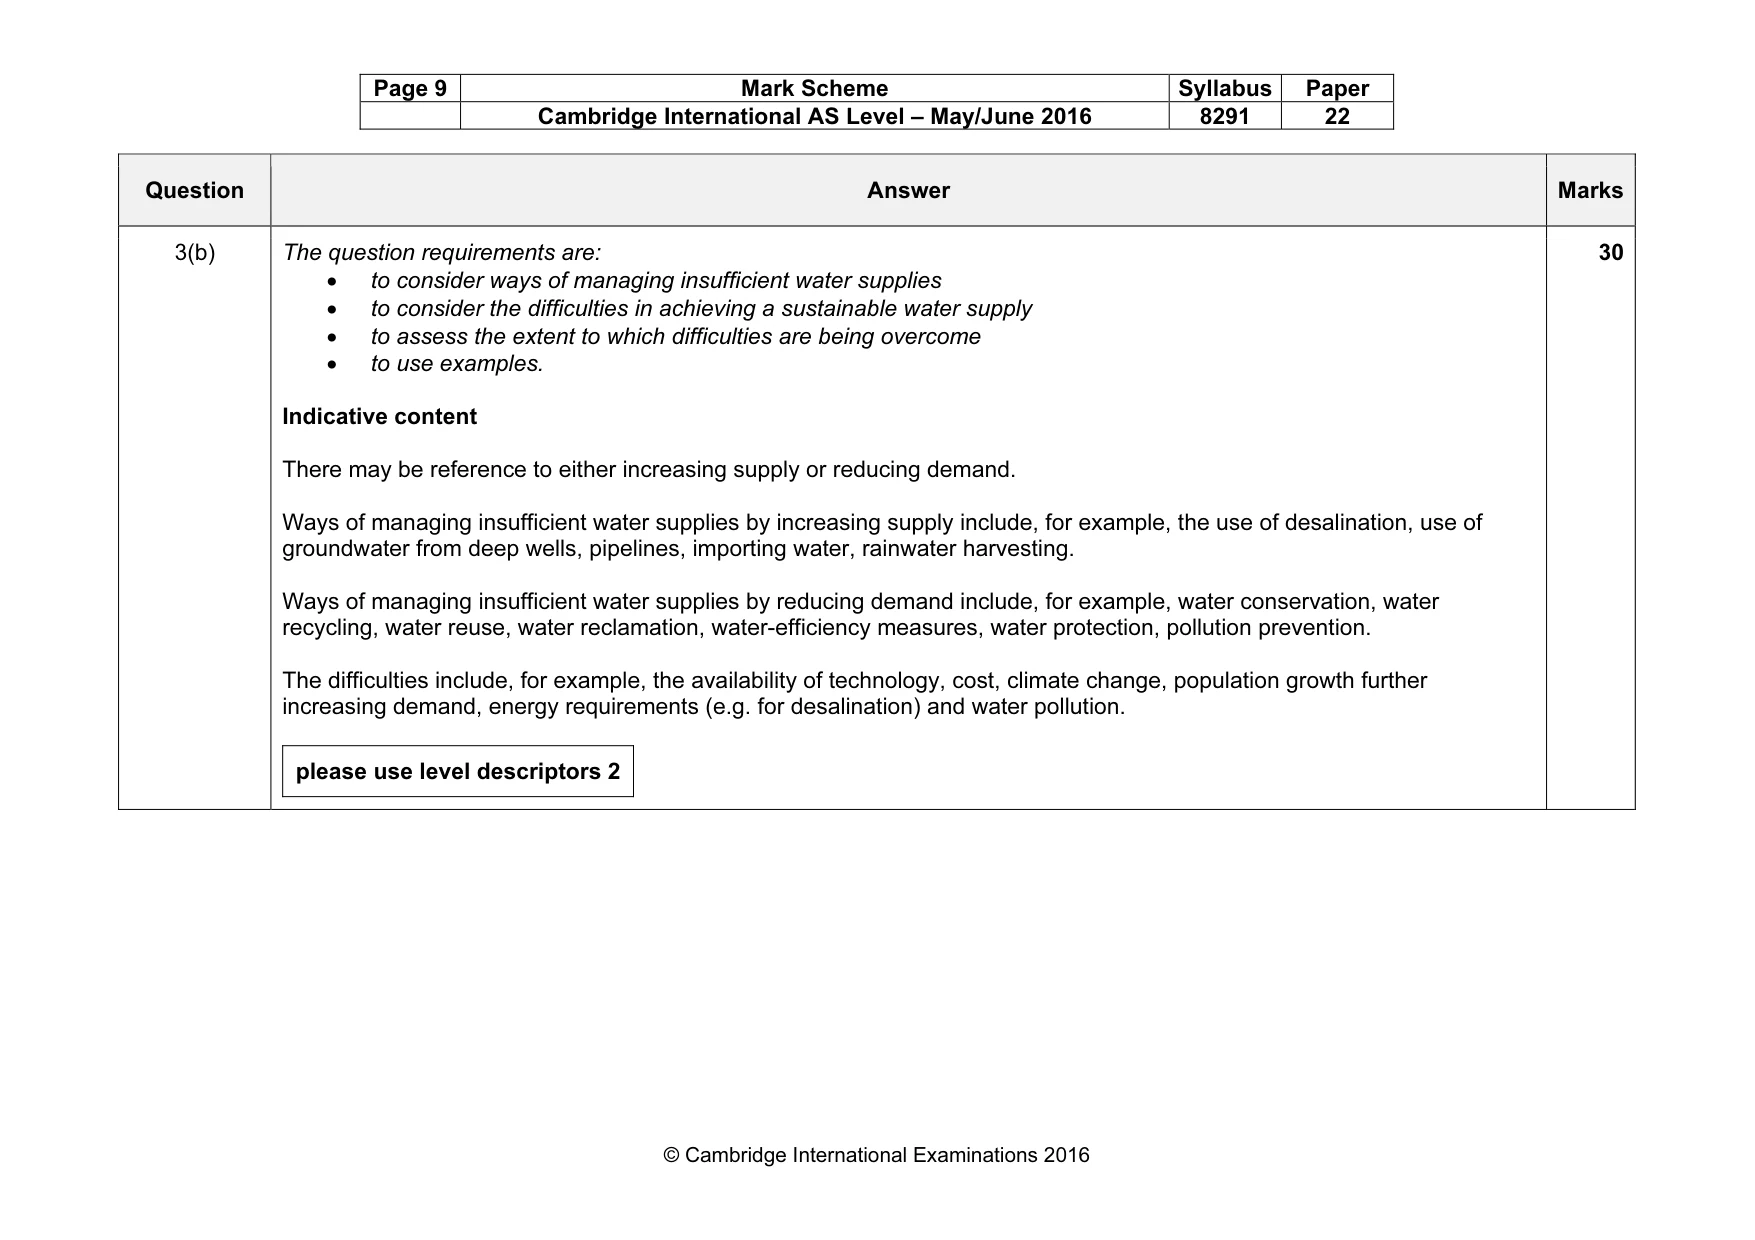
Page 9 Mark Scheme Syllabus Paper Cambridge International AS Level – May/June 2016 8291 22 © Cambridge International Examinations 2016 Question Answer Marks 3(b) The question requirements are: • to consider ways of managing insufficient water supplies • to consider the difficulties in achieving a sustainable water supply • to assess the extent to which difficulties are being overcome • to use examples. Indicative content There may be reference to either increasing supply or reducing demand. Ways of managing insufficient water supplies by increasing supply include, for example, the use of desalination, use of groundwater from deep wells, pipelines, importing water, rainwater harvesting. Ways of managing insufficient water supplies by reducing demand include, for example, water conservation, water recycling, water reuse, water reclamation, water-efficiency measures, water protection, pollution prevention. The difficulties include, for example, the availability of technology, cost, climate change, population growth further increasing demand, energy requirements (e.g. for desalination) and water pollution. please use level descriptors 2 30
Mark scheme, page 10
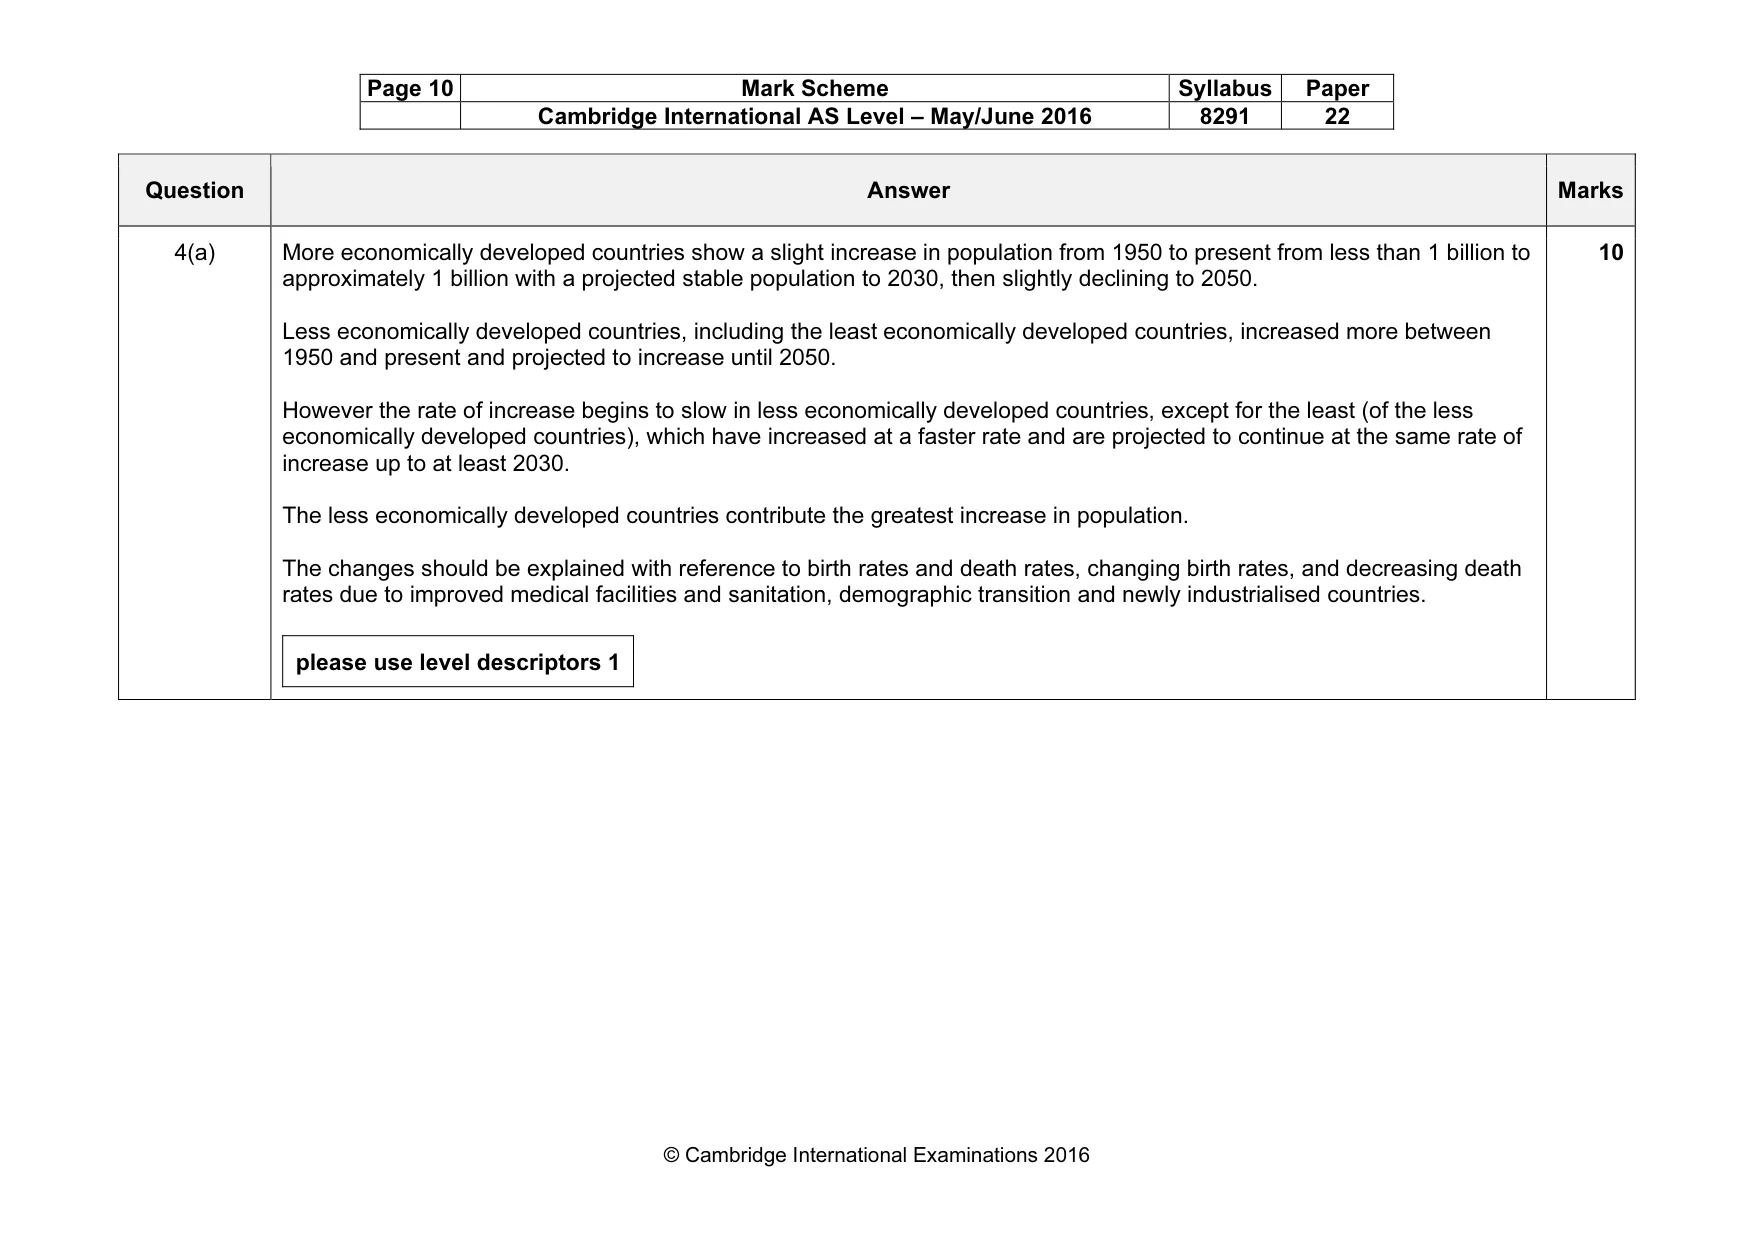
Page 10 Mark Scheme Syllabus Paper Cambridge International AS Level – May/June 2016 8291 22 © Cambridge International Examinations 2016 Question Answer Marks 4(a) More economically developed countries show a slight increase in population from 1950 to present from less than 1 billion to approximately 1 billion with a projected stable population to 2030, then slightly declining to 2050. Less economically developed countries, including the least economically developed countries, increased more between 1950 and present and projected to increase until 2050. However the rate of increase begins to slow in less economically developed countries, except for the least (of the less economically developed countries), which have increased at a faster rate and are projected to continue at the same rate of increase up to at least 2030. The less economically developed countries contribute the greatest increase in population. The changes should be explained with reference to birth rates and death rates, changing birth rates, and decreasing death rates due to improved medical facilities and sanitation, demographic transition and newly industrialised countries. please use level descriptors 1 10
Mark scheme, page 11
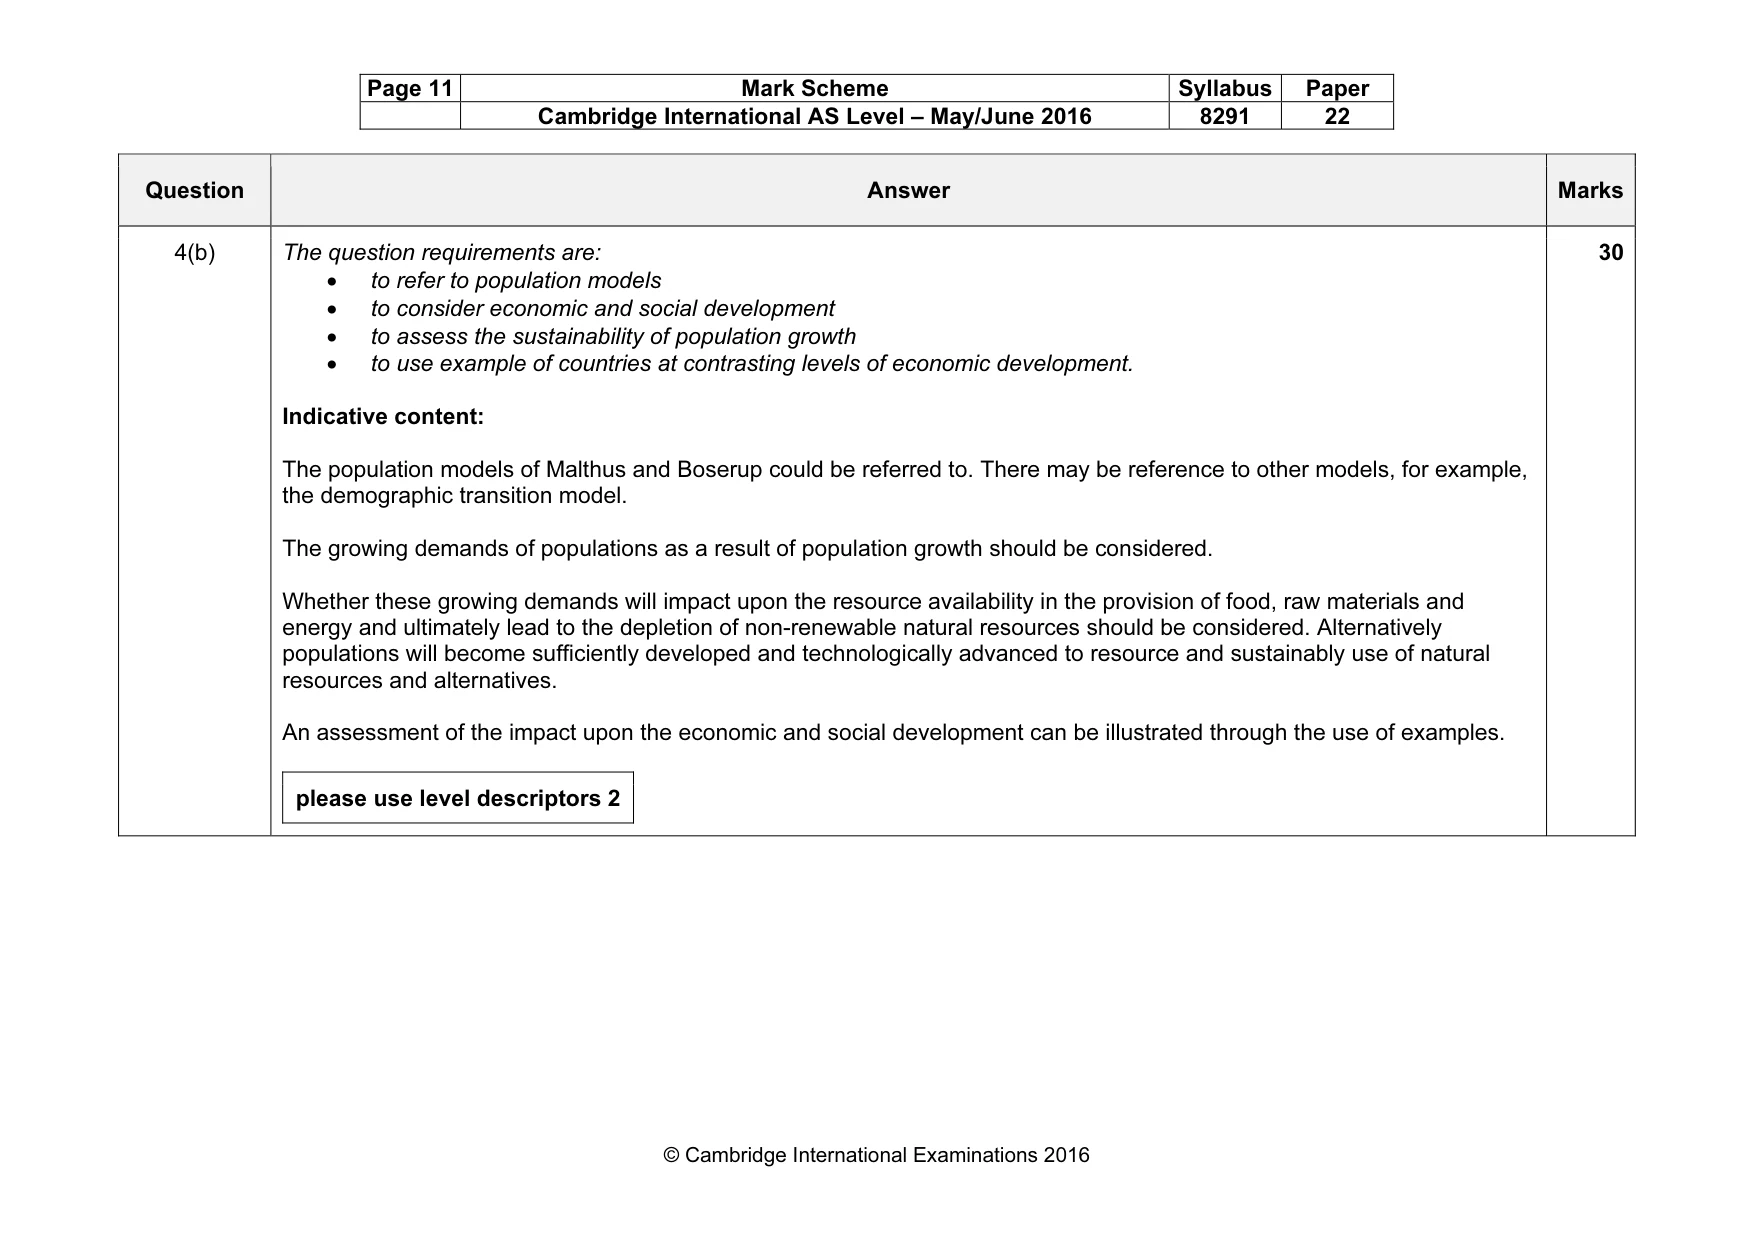
Page 11 Mark Scheme Syllabus Paper Cambridge International AS Level – May/June 2016 8291 22 © Cambridge International Examinations 2016 Question Answer Marks 4(b) The question requirements are: • to refer to population models • to consider economic and social development • to assess the sustainability of population growth • to use example of countries at contrasting levels of economic development. Indicative content: The population models of Malthus and Boserup could be referred to. There may be reference to other models, for example, the demographic transition model. The growing demands of populations as a result of population growth should be considered. Whether these growing demands will impact upon the resource availability in the provision of food, raw materials and energy and ultimately lead to the depletion of non-renewable natural resources should be considered. Alternatively populations will become sufficiently developed and technologically advanced to resource and sustainably use of natural resources and alternatives. An assessment of the impact upon the economic and social development can be illustrated through the use of examples. please use level descriptors 2 30
Mark scheme, page 12
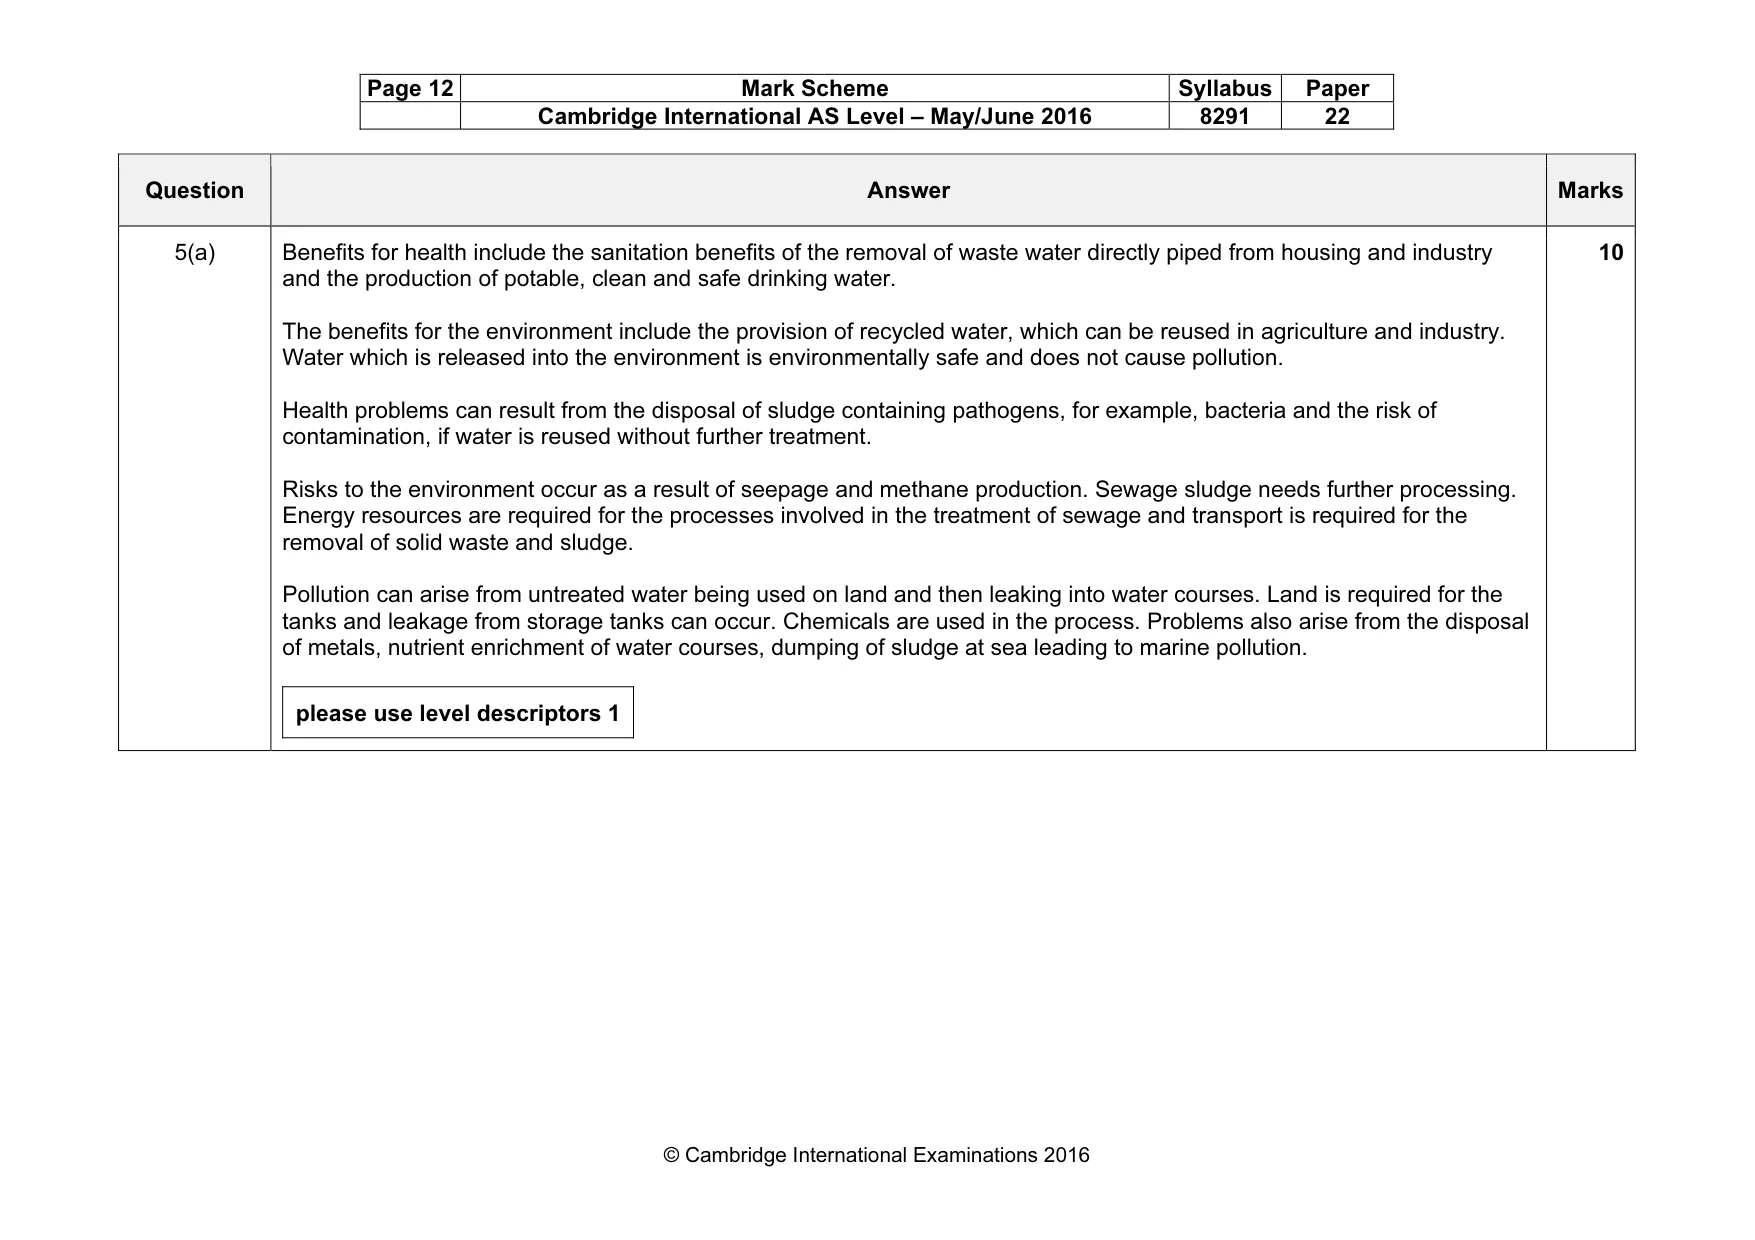
Page 12 Mark Scheme Syllabus Paper Cambridge International AS Level – May/June 2016 8291 22 © Cambridge International Examinations 2016 Question Answer Marks 5(a) Benefits for health include the sanitation benefits of the removal of waste water directly piped from housing and industry and the production of potable, clean and safe drinking water. The benefits for the environment include the provision of recycled water, which can be reused in agriculture and industry. Water which is released into the environment is environmentally safe and does not cause pollution. Health problems can result from the disposal of sludge containing pathogens, for example, bacteria and the risk of contamination, if water is reused without further treatment. Risks to the environment occur as a result of seepage and methane production. Sewage sludge needs further processing. Energy resources are required for the processes involved in the treatment of sewage and transport is required for the removal of solid waste and sludge. Pollution can arise from untreated water being used on land and then leaking into water courses. Land is required for the tanks and leakage from storage tanks can occur. Chemicals are used in the process. Problems also arise from the disposal of metals, nutrient enrichment of water courses, dumping of sludge at sea leading to marine pollution. please use level descriptors 1 10
Mark scheme, page 13
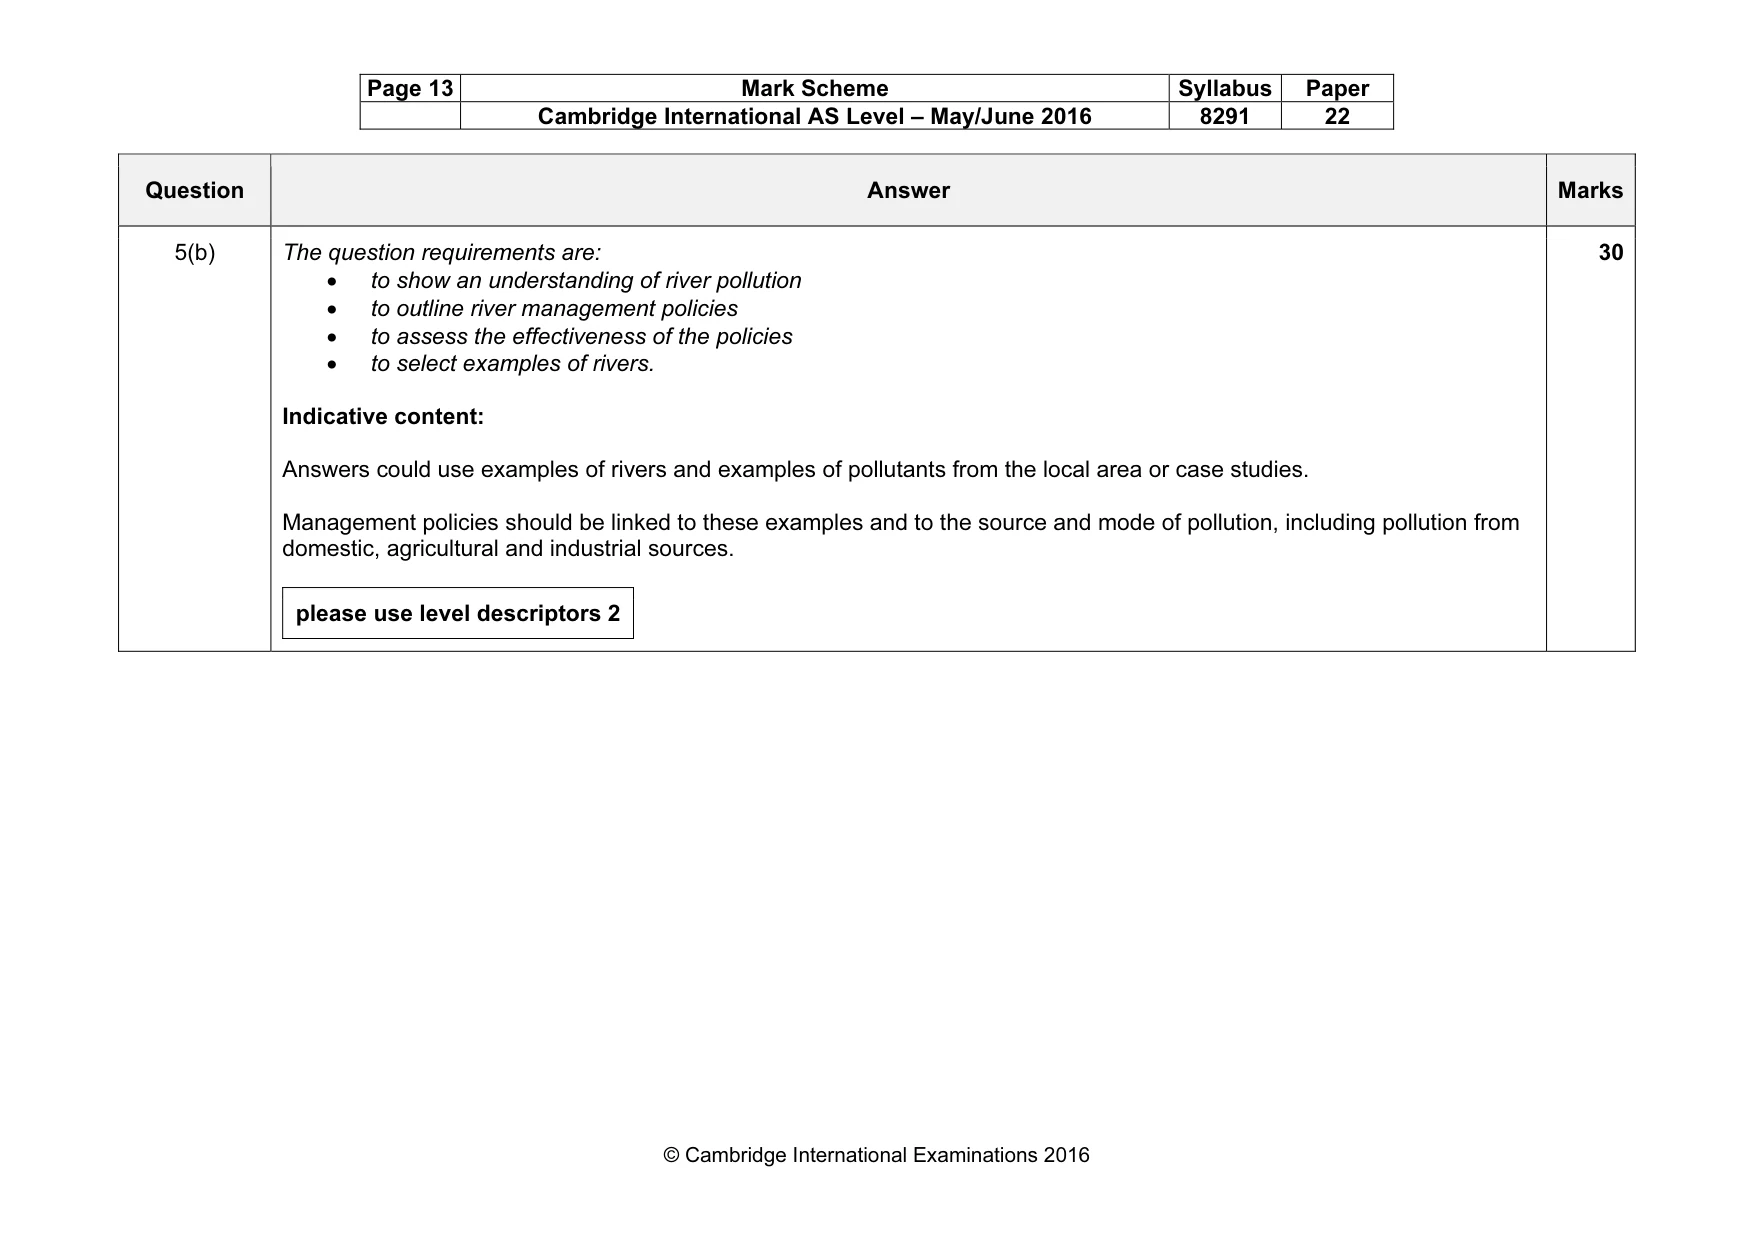
Page 13 Mark Scheme Syllabus Paper Cambridge International AS Level – May/June 2016 8291 22 © Cambridge International Examinations 2016 Question Answer Marks 5(b) The question requirements are: • to show an understanding of river pollution • to outline river management policies • to assess the effectiveness of the policies • to select examples of rivers. Indicative content: Answers could use examples of rivers and examples of pollutants from the local area or case studies. Management policies should be linked to these examples and to the source and mode of pollution, including pollution from domestic, agricultural and industrial sources. please use level descriptors 2 30
Mark scheme, page 14
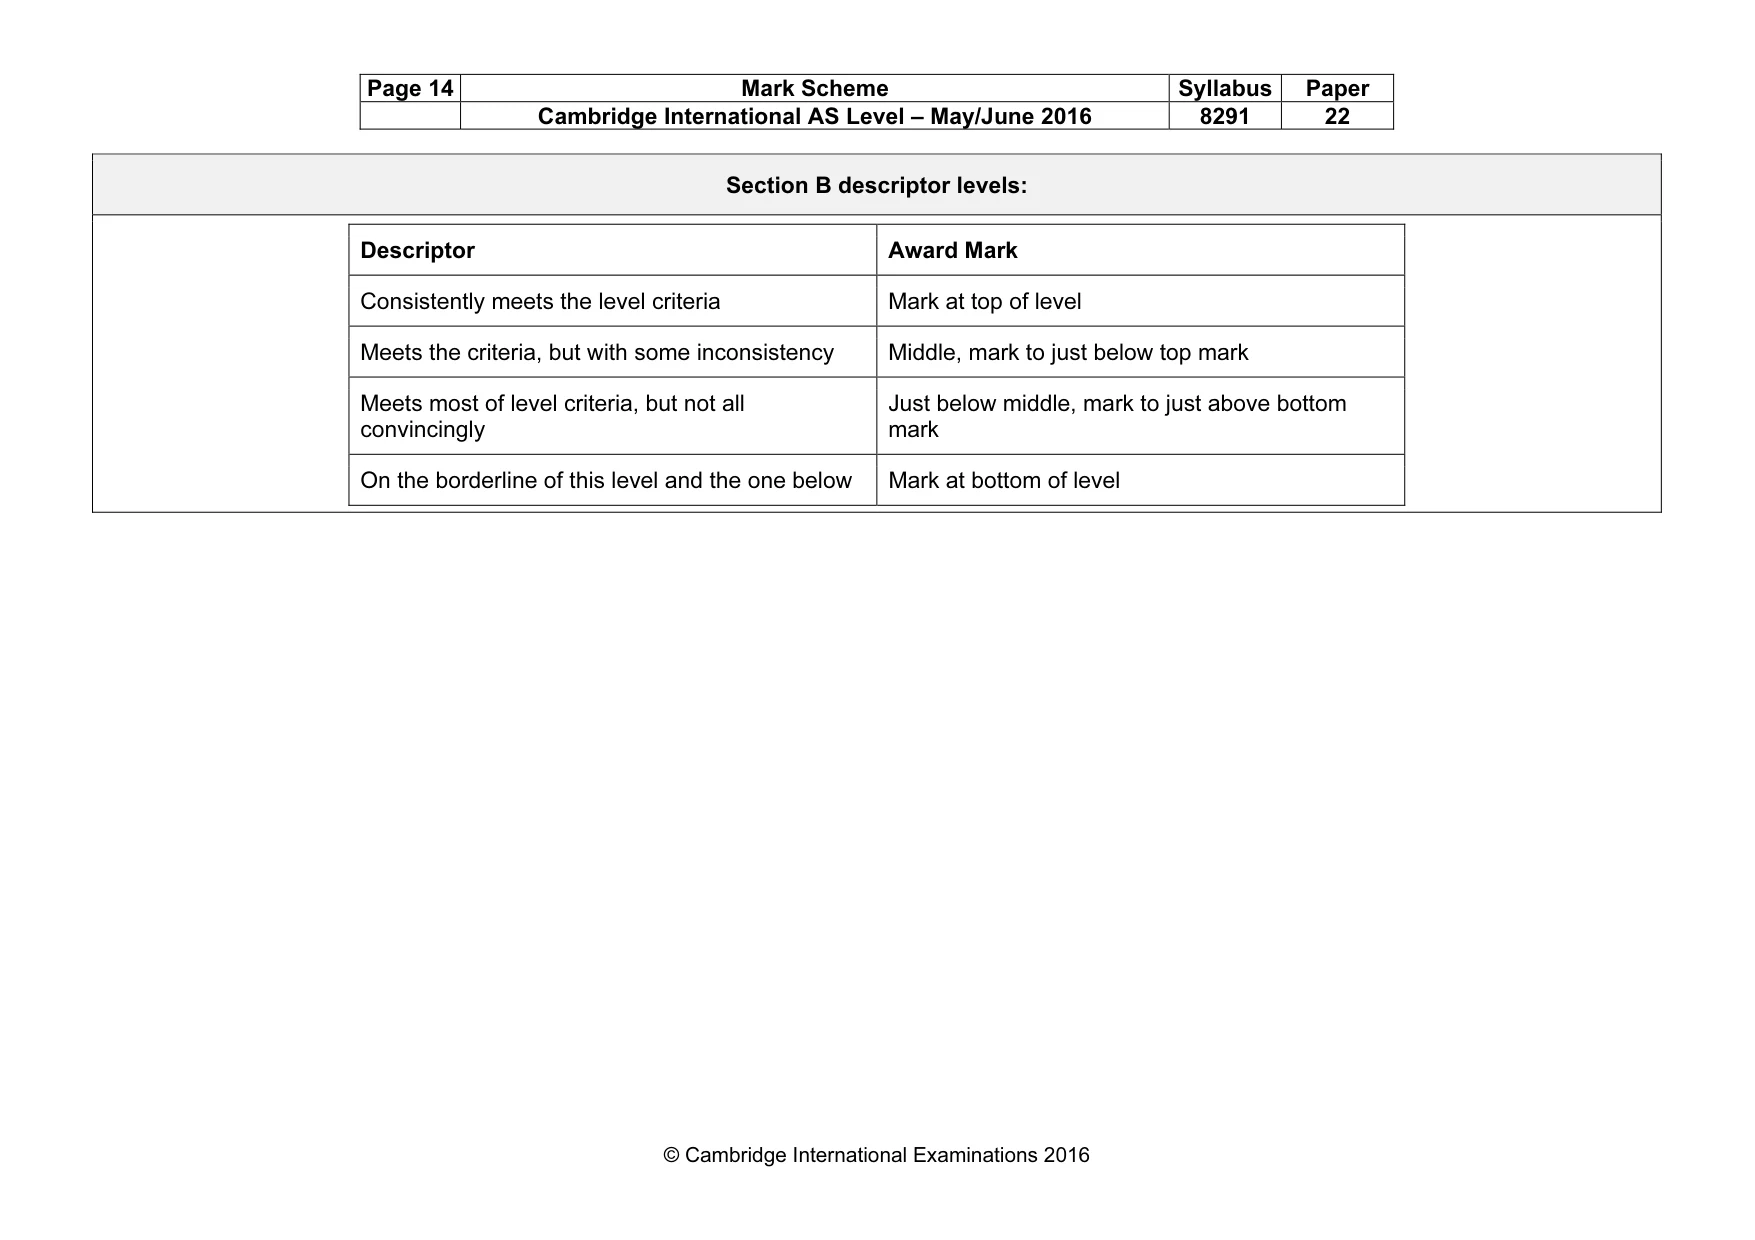
Page 14 Mark Scheme Syllabus Paper Cambridge International AS Level – May/June 2016 8291 22 © Cambridge International Examinations 2016 Section B descriptor levels: Descriptor Award Mark Consistently meets the level criteria Mark at top of level Meets the criteria, but with some inconsistency Middle, mark to just below top mark Meets most of level criteria, but not all convincingly Just below middle, mark to just above bottom mark On the borderline of this level and the one below Mark at bottom of level
Mark scheme, page 15
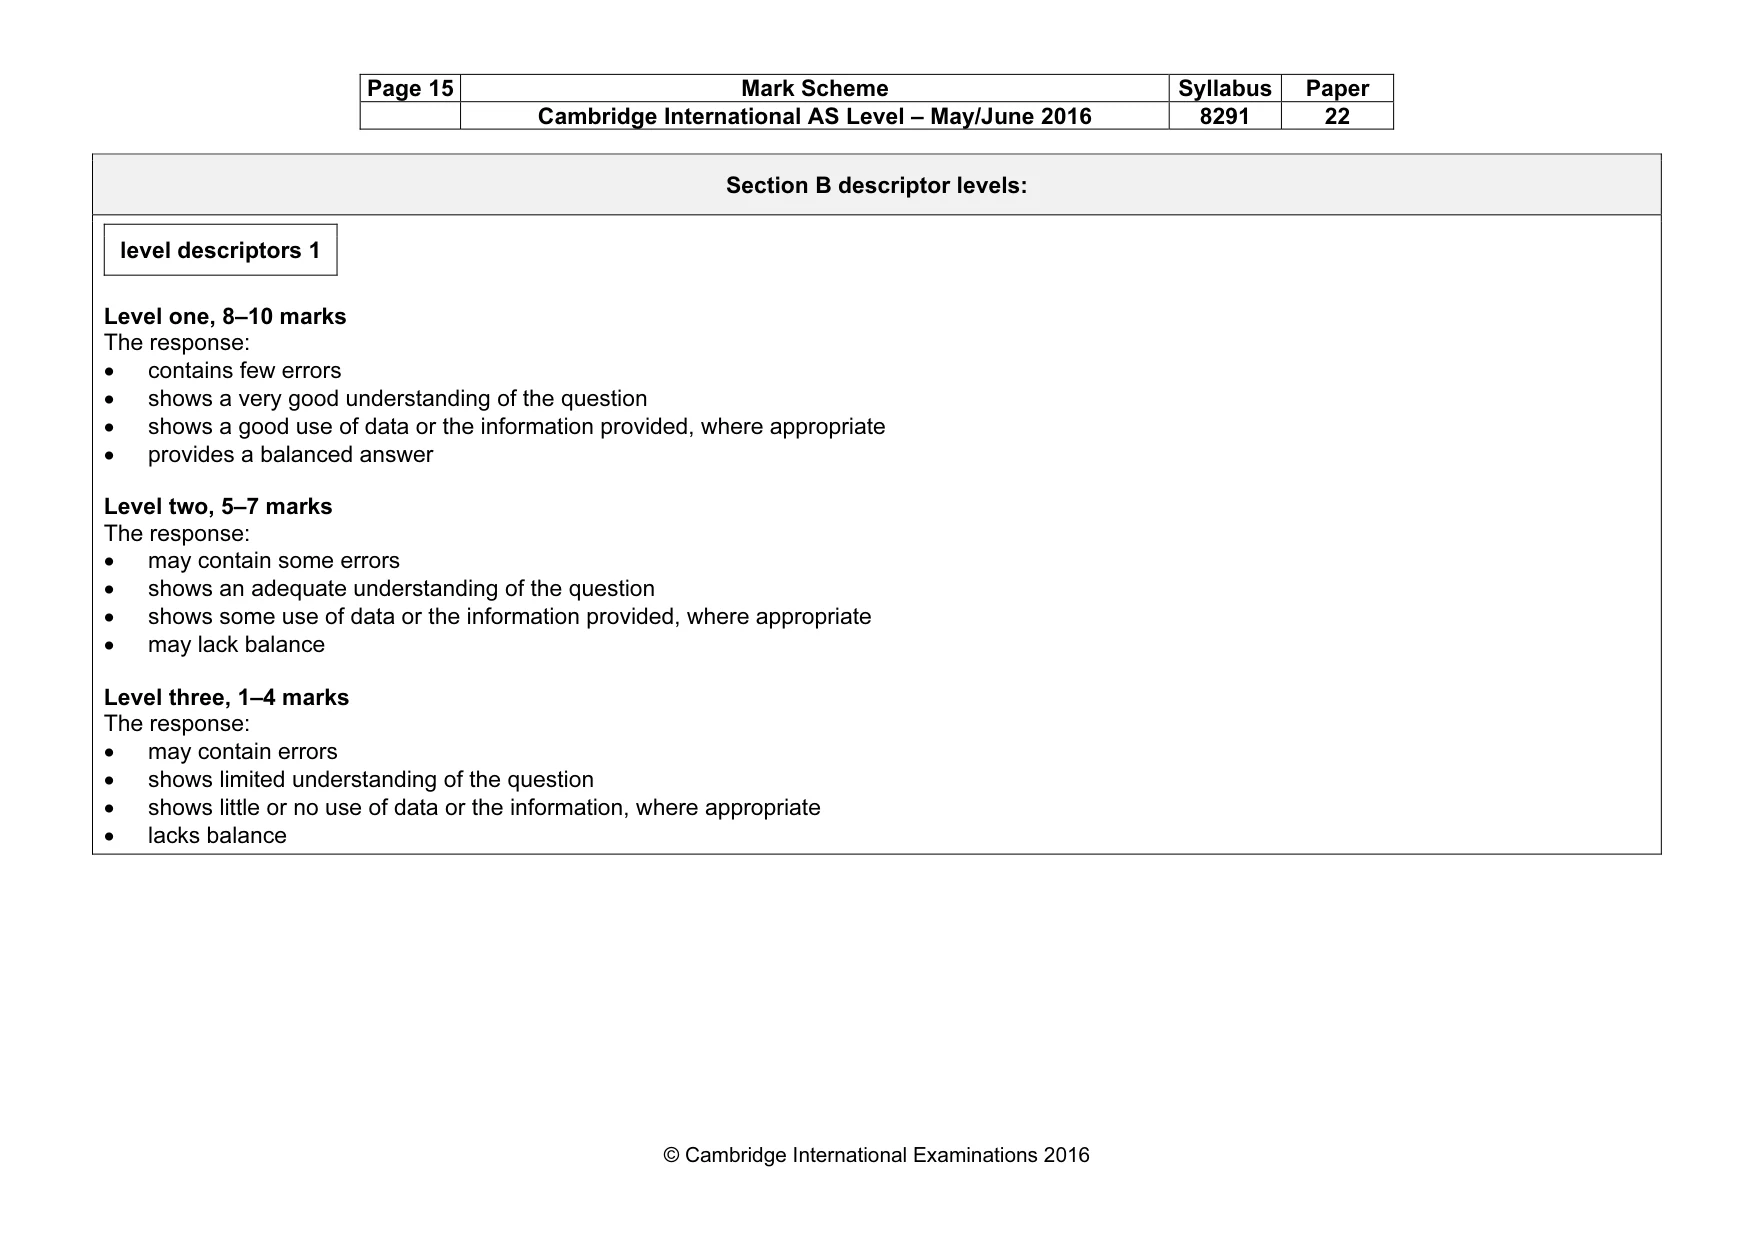
Page 15 Mark Scheme Syllabus Paper Cambridge International AS Level – May/June 2016 8291 22 © Cambridge International Examinations 2016 Section B descriptor levels: level descriptors 1 Level one, 8–10 marks The response: • contains few errors • shows a very good understanding of the question • shows a good use of data or the information provided, where appropriate • provides a balanced answer Level two, 5–7 marks The response: • may contain some errors • shows an adequate understanding of the question • shows some use of data or the information provided, where appropriate • may lack balance Level three, 1–4 marks The response: • may contain errors • shows limited understanding of the question • shows little or no use of data or the information, where appropriate • lacks balance
Mark scheme, page 16
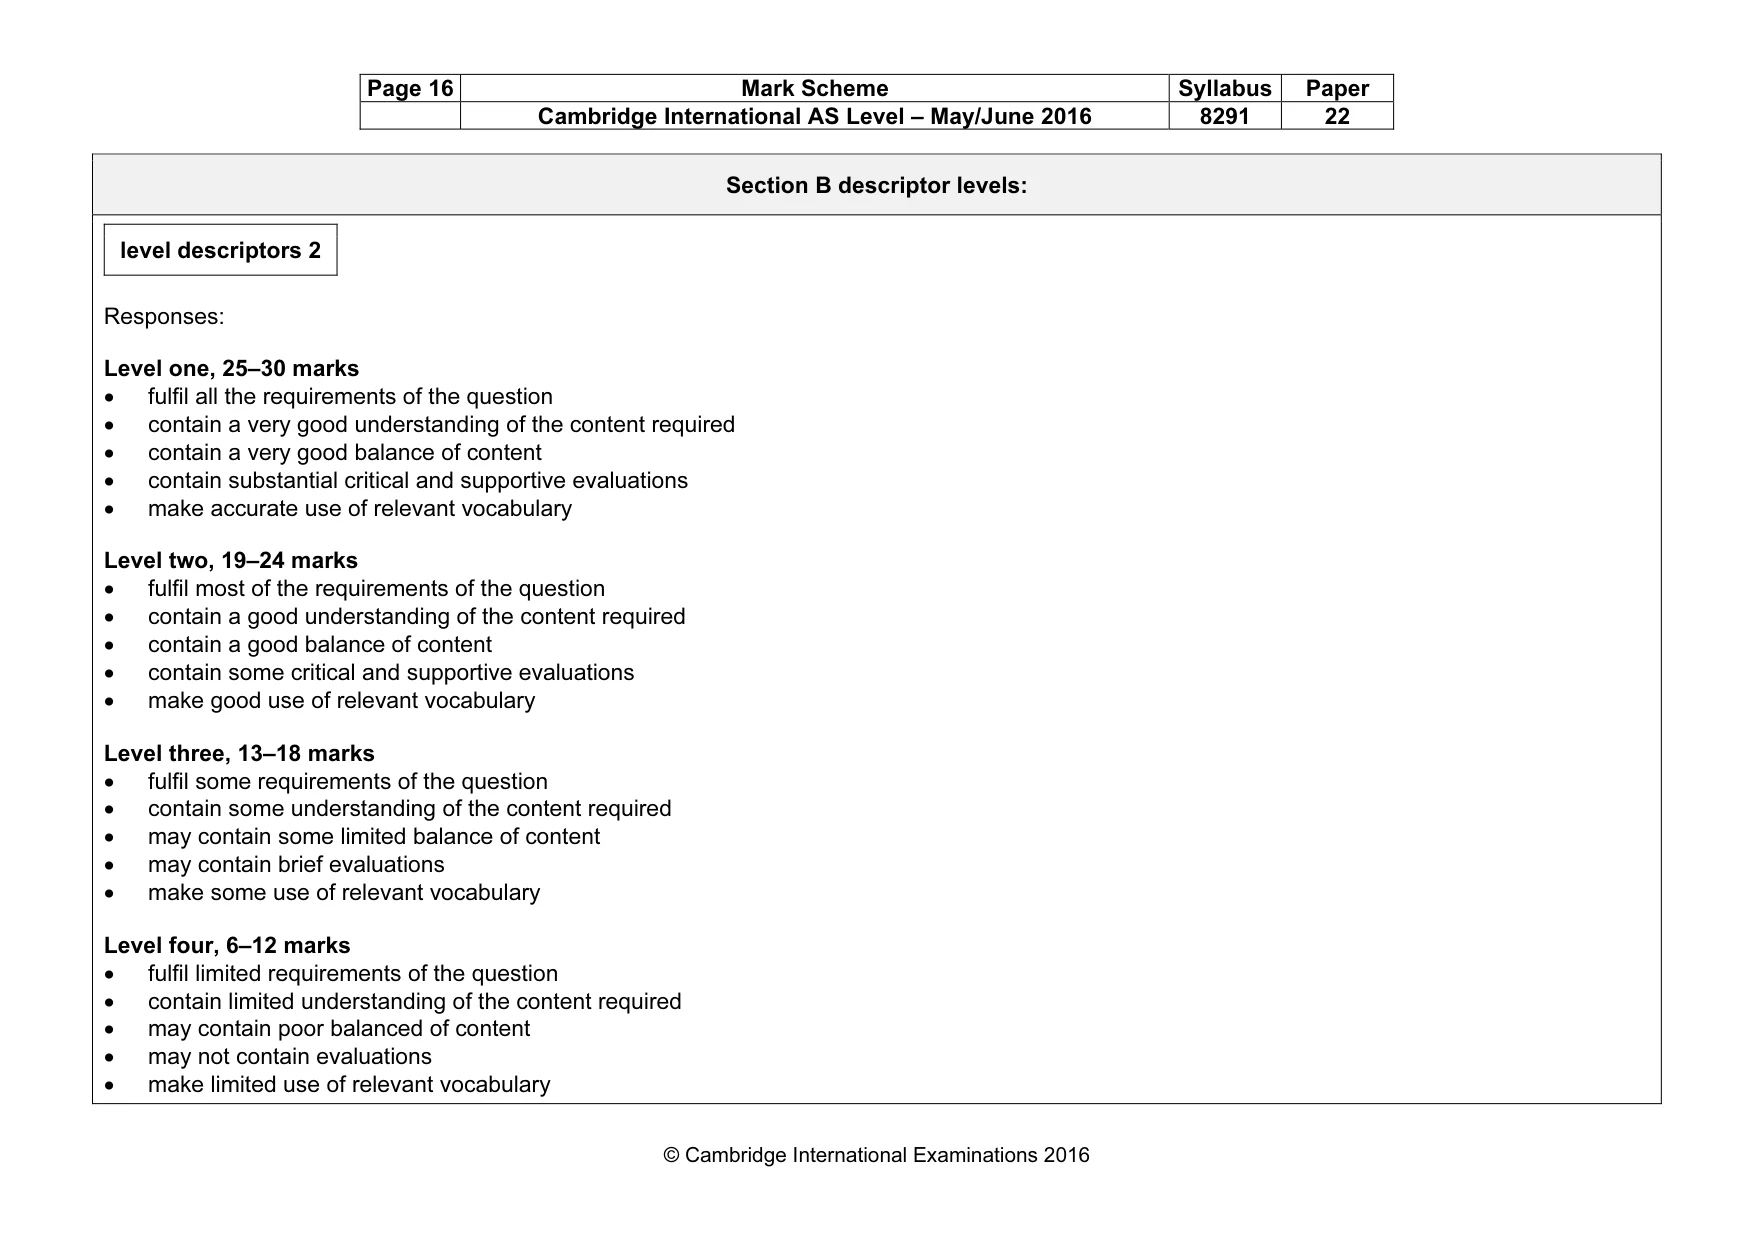
Page 16 Mark Scheme Syllabus Paper Cambridge International AS Level – May/June 2016 8291 22 © Cambridge International Examinations 2016 Section B descriptor levels: level descriptors 2 Responses: Level one, 25–30 marks • fulfil all the requirements of the question • contain a very good understanding of the content required • contain a very good balance of content • contain substantial critical and supportive evaluations • make accurate use of relevant vocabulary Level two, 19–24 marks • fulfil most of the requirements of the question • contain a good understanding of the content required • contain a good balance of content • contain some critical and supportive evaluations • make good use of relevant vocabulary Level three, 13–18 marks • fulfil some requirements of the question • contain some understanding of the content required • may contain some limited balance of content • may contain brief evaluations • make some use of relevant vocabulary Level four, 6–12 marks • fulfil limited requirements of the question • contain limited understanding of the content required • may contain poor balanced of content • may not contain evaluations • make limited use of relevant vocabulary
Mark scheme, page 17
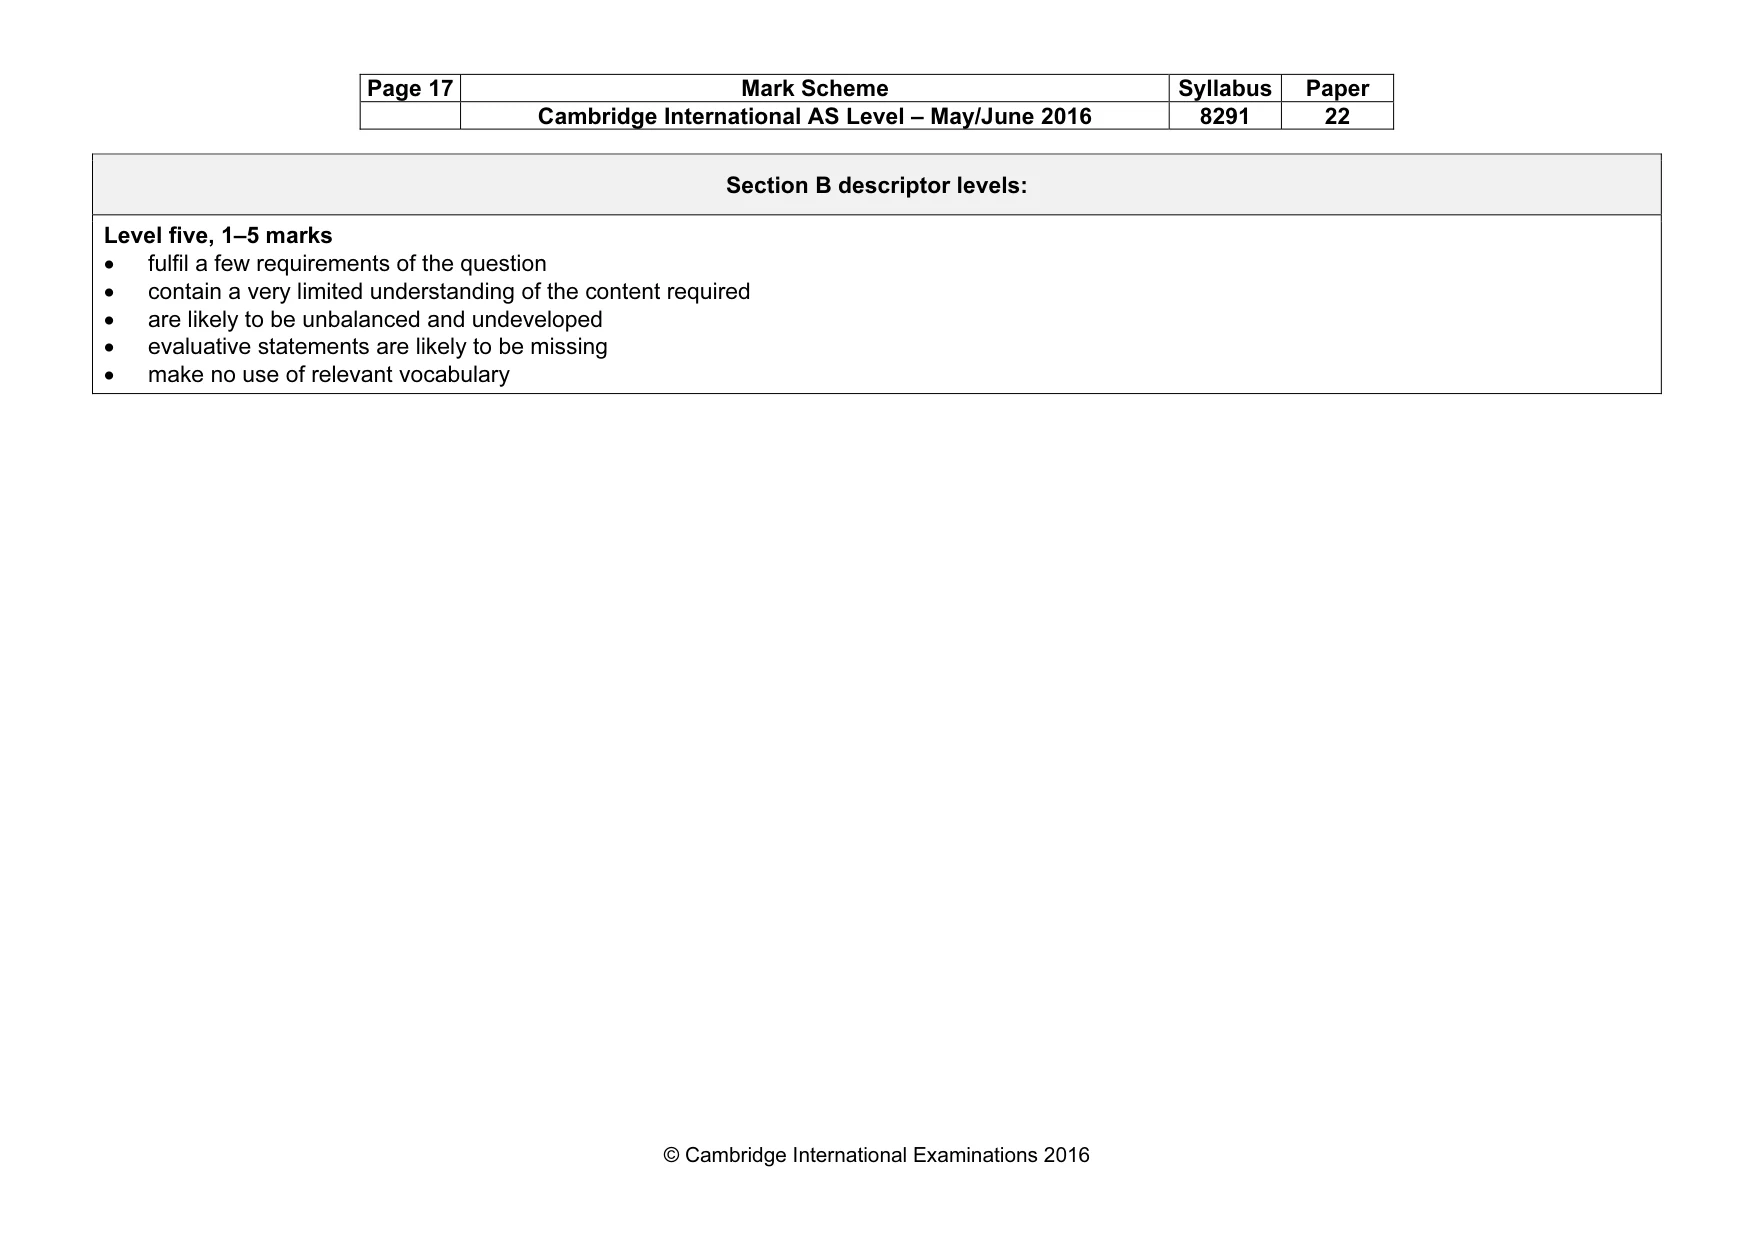
Page 17 Mark Scheme Syllabus Paper Cambridge International AS Level – May/June 2016 8291 22 © Cambridge International Examinations 2016 Section B descriptor levels: Level five, 1–5 marks • fulfil a few requirements of the question • contain a very limited understanding of the content required • are likely to be unbalanced and undeveloped • evaluative statements are likely to be missing • make no use of relevant vocabulary
What you needed in this session
Cambridge’s own grade thresholds for 2016 May/June, Paper 2 · Variant 2. A higher threshold means an easier paper — the bar moves with how the cohort did.