Cambridge A Level Environmental Management (AS only) 8291 — 2016 May/June Paper 2 · Variant 1
8291/21/M/J/16 · 80 marks · ≈90 min
The question paper and its mark scheme, free to read here and free to download. This is Cambridge’s own paper, exactly as it was sat.
Question paper12 pages



Mark scheme15 pages
Answers below. Sit the paper first if you are practising.
Paper as text
Question paper, page 1
This document consists of 11 printed pages and 1 blank page. DC (SLM/FD) 114353/2 © UCLES 2016 [Turn over Cambridge International Examinations Cambridge International Advanced Subsidiary Level * 2 5 5 6 5 1 8 2 6 1 * ENVIRONMENTAL MANAGEMENT 8291/21 Paper 2 Hydrosphere and Biosphere May/June 2016 1 hour 30 minutes Additional Materials: Answer Booklet/Paper READ THESE INSTRUCTIONS FIRST Write your Centre number, candidate number and name on all the work you hand in. Write in dark blue or black pen. You may use an HB pencil for any diagrams or graphs. Do not use staples, paper clips, glue or correction fluid. DO NOT WRITE IN ANY BARCODES. Electronic calculators may be used. You may lose marks if you do not show your working or if you do not use appropriate units. Section A Answer all questions in this section. Write your answers in the spaces provided on the question paper. Section B Answer one question from this section. Answer the question on the separate answer paper provided. At the end of the examination, 1. fasten all separate answer paper securely to the question paper; 2. enter the question number from Section B in the grid opposite. For Examiner’s Use Section A 1 2 Section B Total
Question paper, page 2
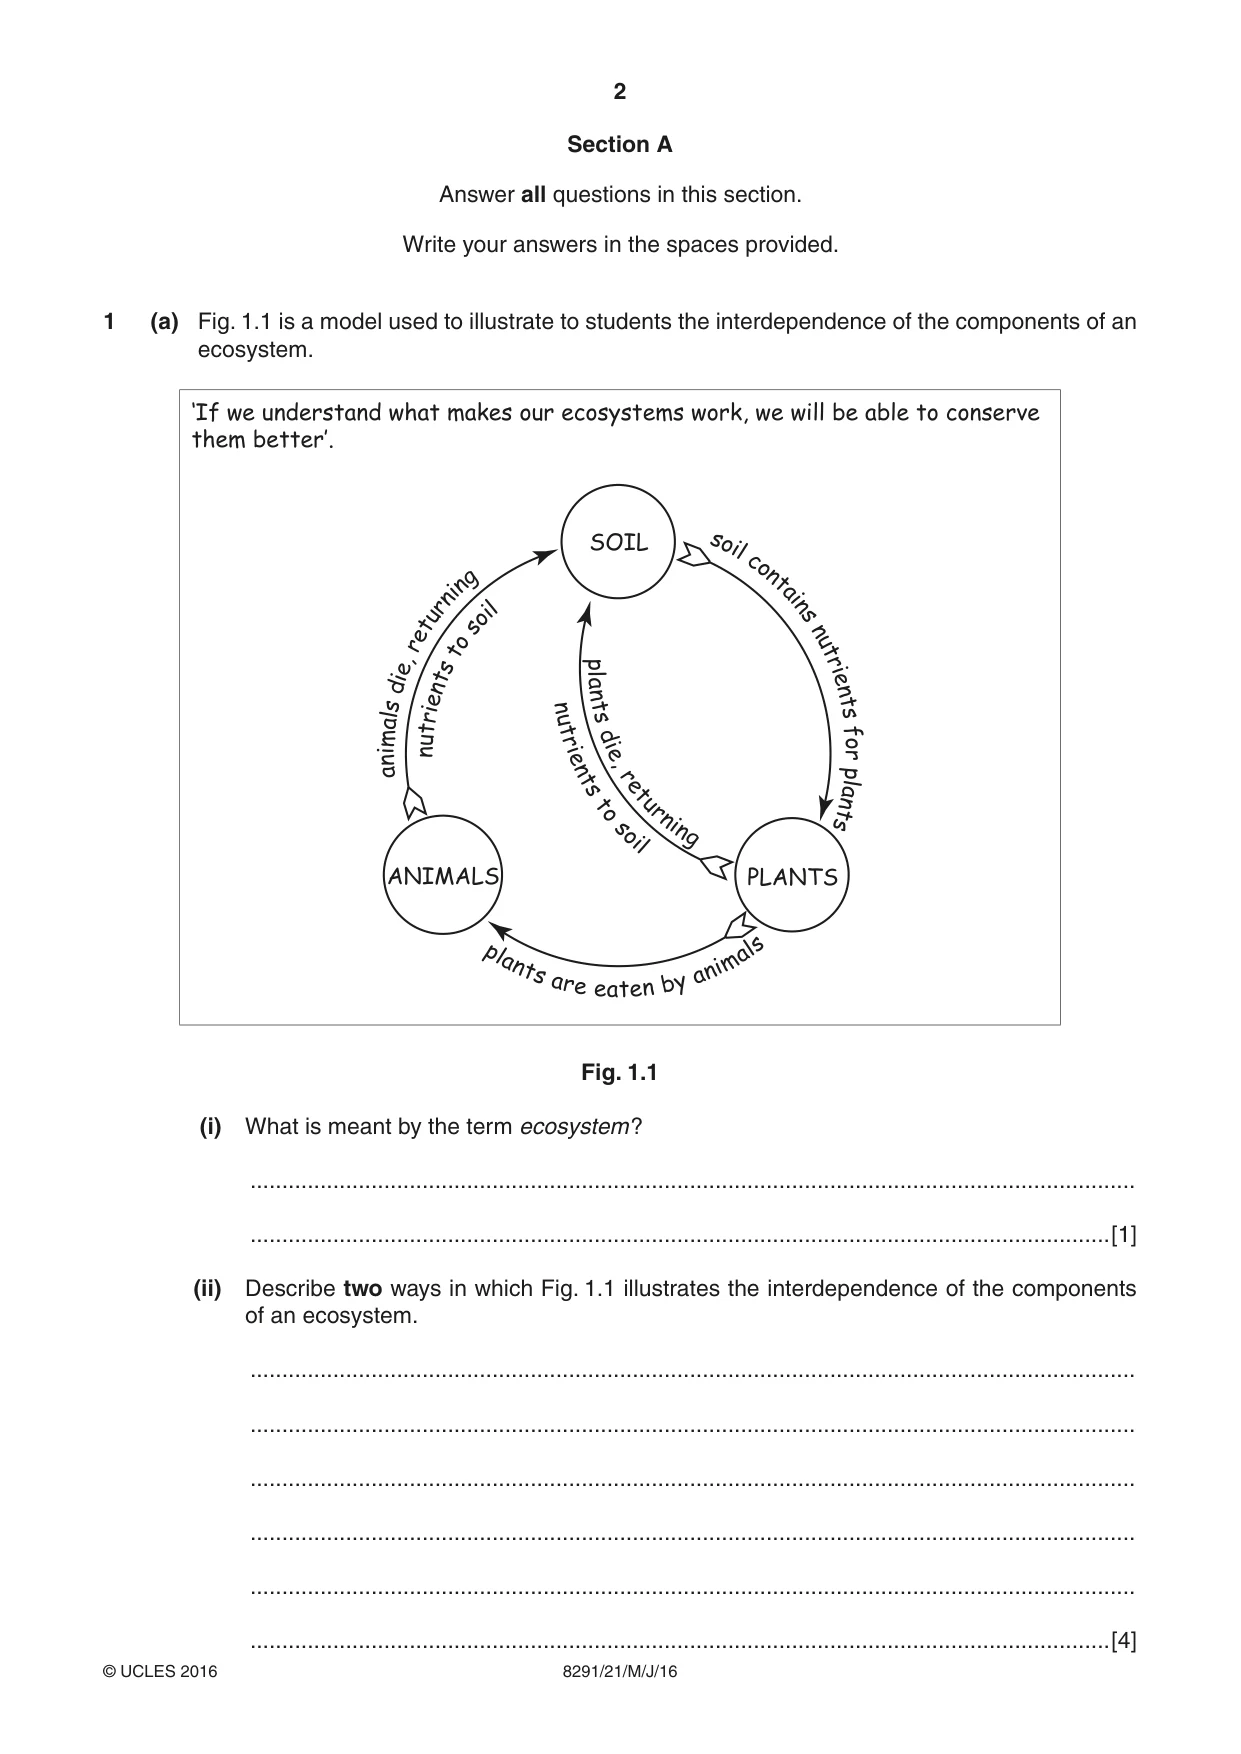
2 8291/21/M/J/16 © UCLES 2016 Section A Answer all questions in this section. Write your answers in the spaces provided. 1 (a) Fig. 1.1 is a model used to illustrate to students the interdependence of the components of an ecosystem. ‘If we understand what makes our ecosystems work, we will be able to conserve them better’. SOIL ANIMALS PLANTS pl a n t s a r e e a t e n b y a ni m al s a ni m al s di e, r e t u r ni n g n u t r i e n t s t o s o il s oi l c on t ai n s n u t ri e n t s f o r pl a n t s p l a n t s d i e , r e t u r n i n g n u t ri e n t s t o s oi l Fig. 1.1 (i) What is meant by the term ecosystem ? … …[1] (ii) Describe two ways in which Fig. 1.1 illustrates the interdependence of the components of an ecosystem. … … … … … …[4]
Question paper, page 3
3 8291/21/M/J/16 © UCLES 2016 [Turn over (iii) How might the model in Fig. 1.1 achieve the objective, ‘If we understand what makes our ecosystems work, we will be able to conserve them better.’? … … … … … … … … … …[5]
Question paper, page 4
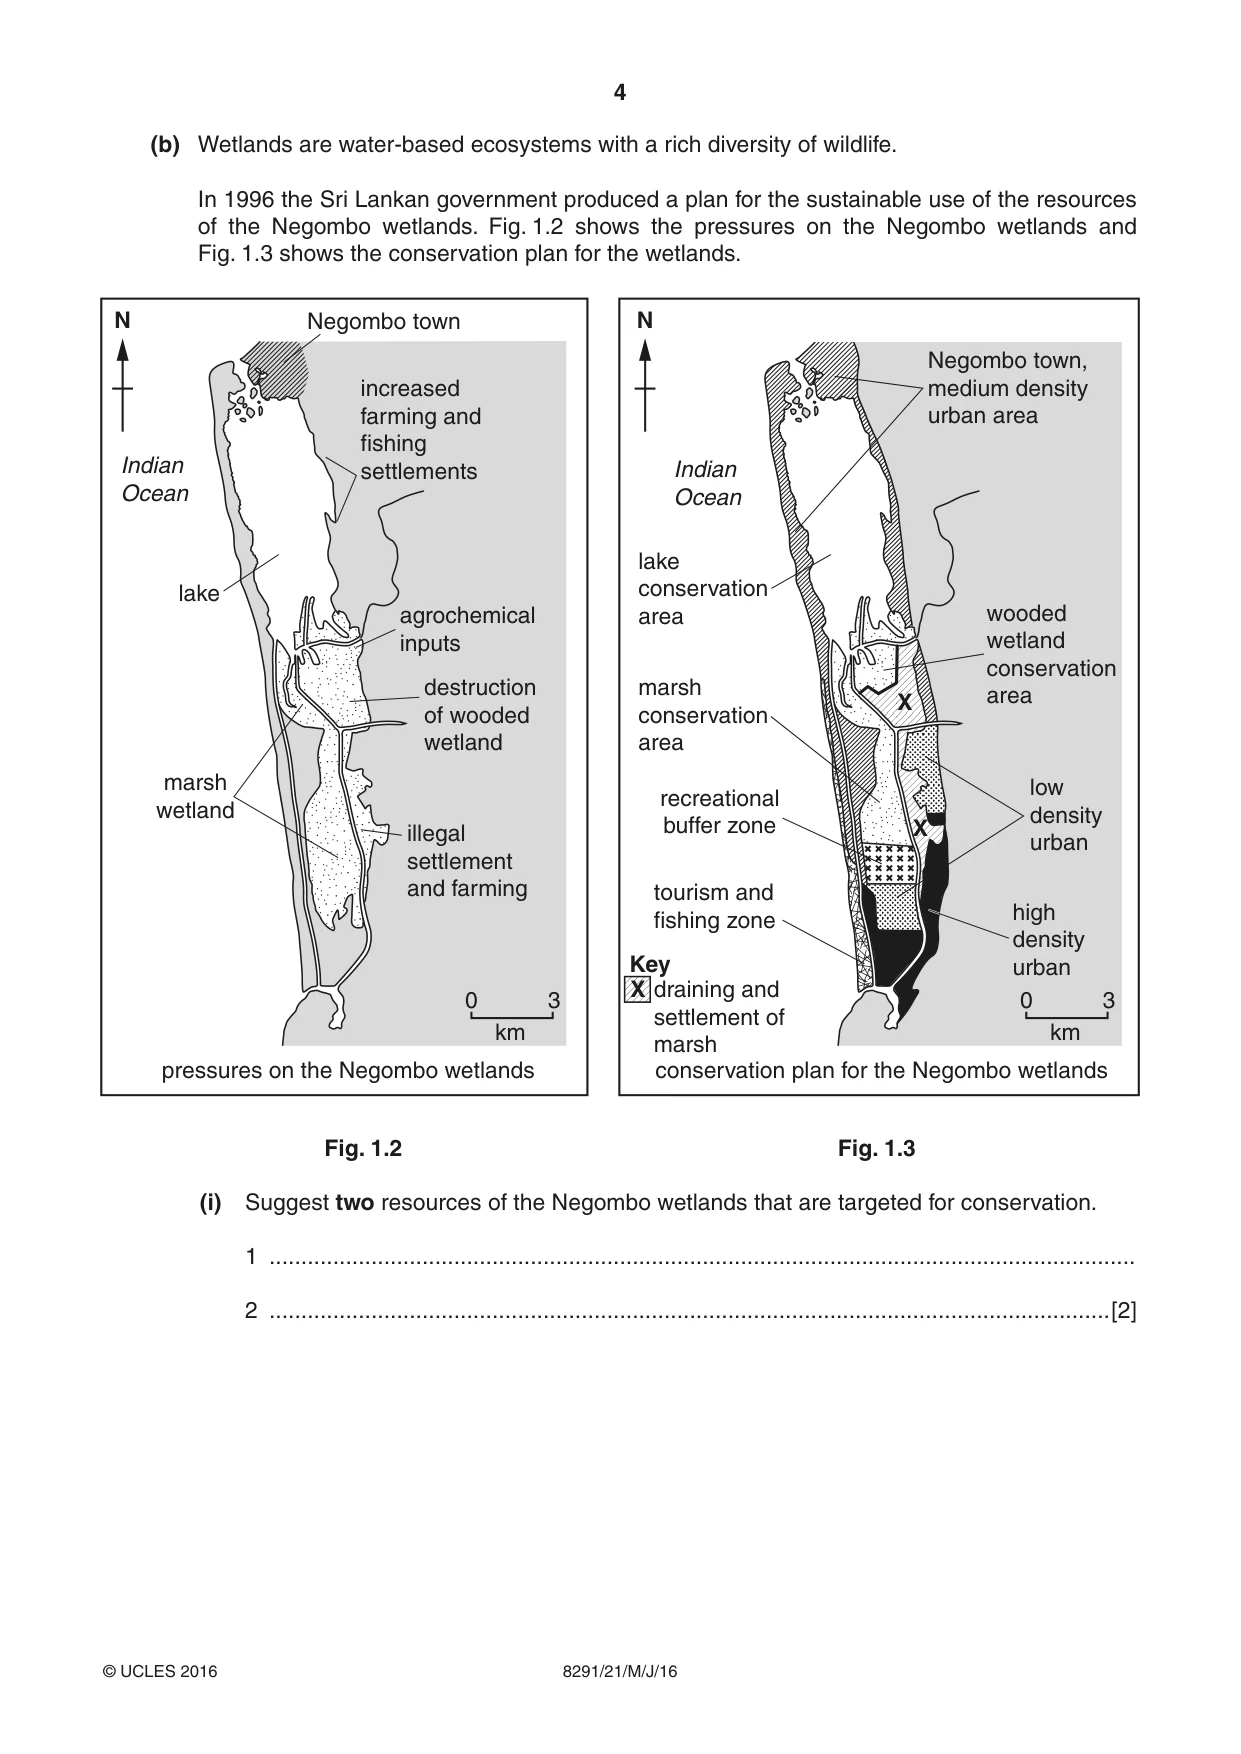
4 8291/21/M/J/16 © UCLES 2016 (b) Wetlands are water-based ecosystems with a rich diversity of wildlife. In 1996 the Sri Lankan government produced a plan for the sustainable use of the resources of the Negombo wetlands. Fig. 1.2 shows the pressures on the Negombo wetlands and Fig. 1.3 shows the conservation plan for the wetlands. Key draining and settlement of marsh X X X km 0 3 km 0 3 Negombo town, medium density urban area low density urban wooded wetland conservation area tourism and fishing zone pressures on the Negombo wetlands conservation plan for the Negombo wetlands recreational buffer zone lake conservation area marsh conservation area Indian Ocean Indian Ocean lake increased farming and fishing settlements Negombo town agrochemical inputs destruction of wooded wetland illegal settlement and farming marsh wetland high density urban N N Fig. 1.2 Fig. 1.3 (i) Suggest two resources of the Negombo wetlands that are targeted for conservation. 1 … 2 …[2]
Question paper, page 5
5 8291/21/M/J/16 © UCLES 2016 [Turn over (ii) With reference to Fig. 1.2 and Fig. 1.3, describe how the conservation plan might achieve a sustainable use of the resources of the Negombo wetlands. … … … … … … … … … … … … … … … … … … … …[8] [Total: 20]
Question paper, page 6
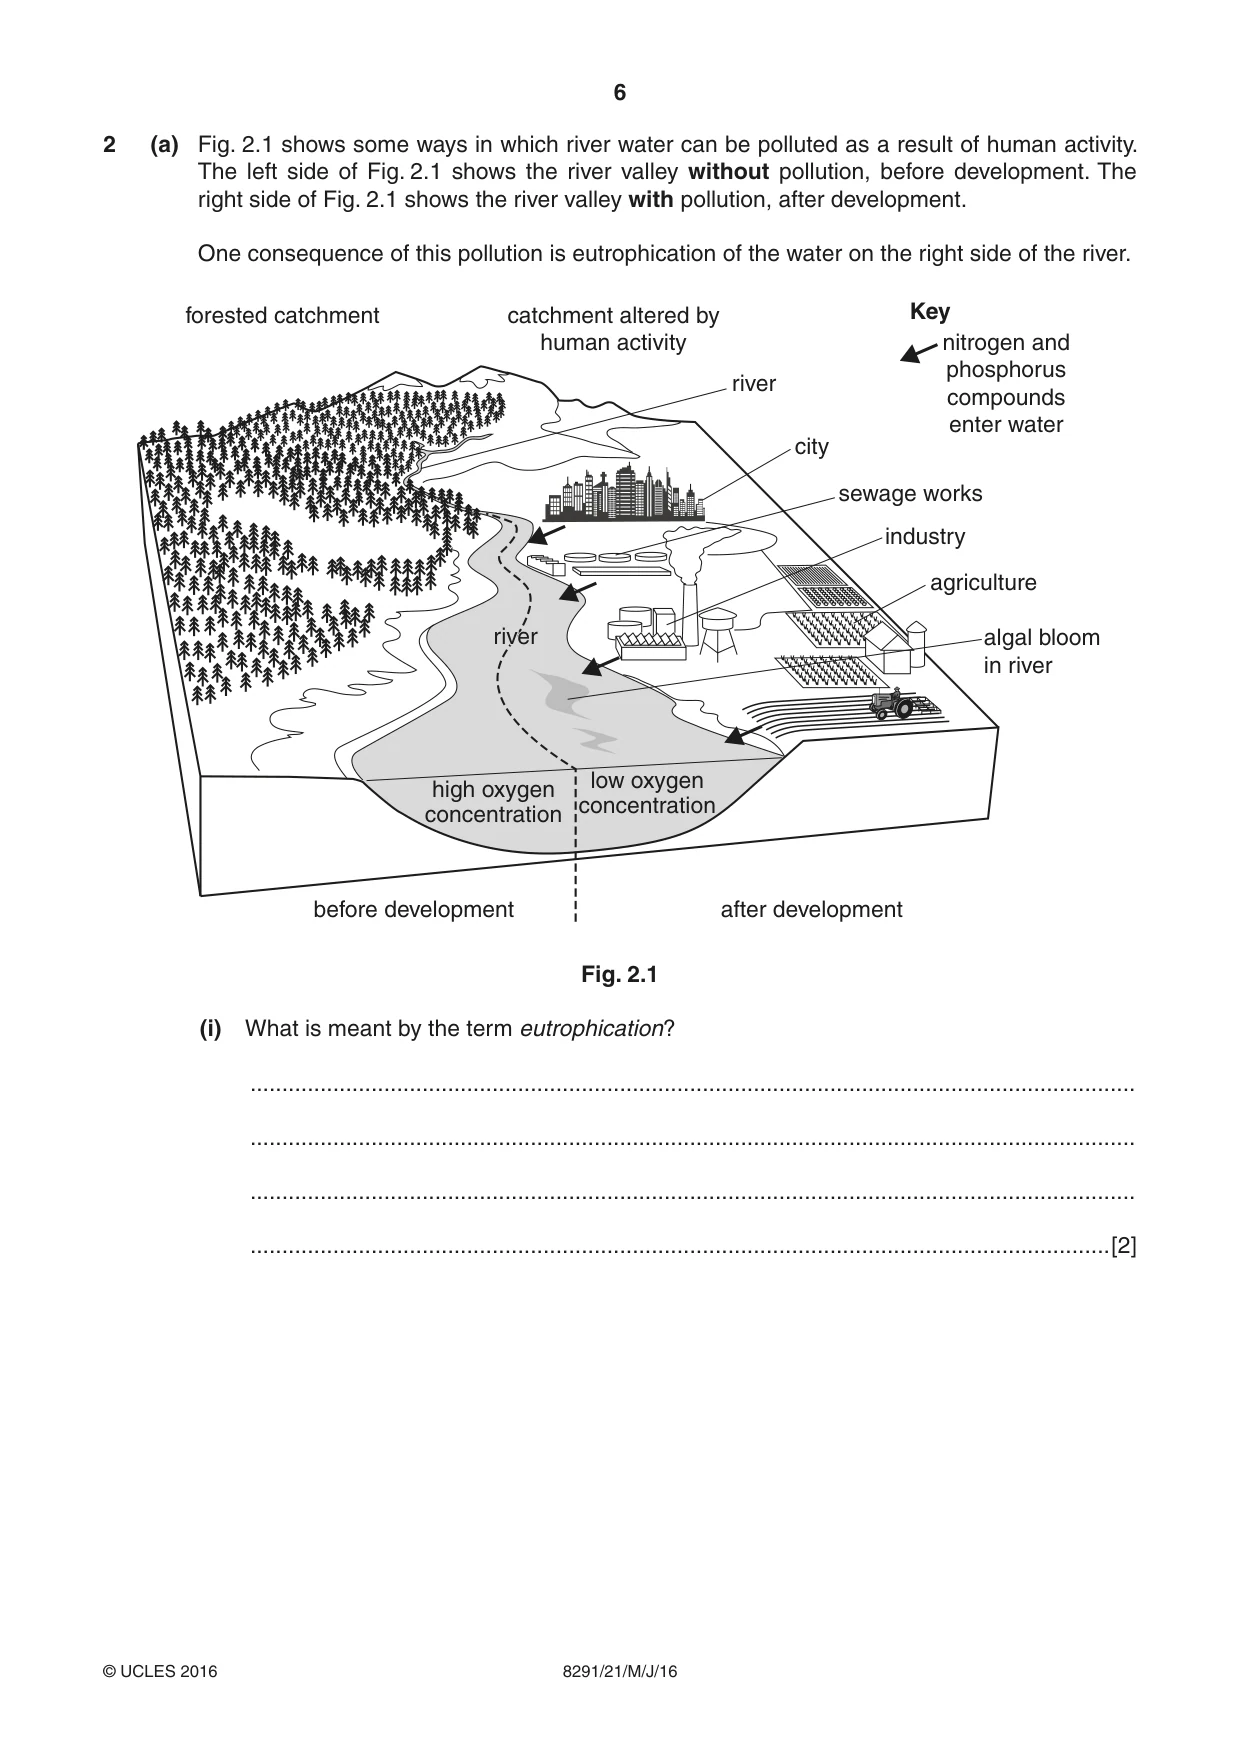
6 8291/21/M/J/16 © UCLES 2016 2 (a) Fig. 2.1 shows some ways in which river water can be polluted as a result of human activity. The left side of Fig. 2.1 shows the river valley without pollution, before development. The right side of Fig. 2.1 shows the river valley with pollution, after development. One consequence of this pollution is eutrophication of the water on the right side of the river. river catchment altered by human activity forested catchment city sewage works industry agriculture algal bloom in river high oxygen concentration before development after development river river low oxygen concentration nitrogen and phosphorus compounds enter water Key Fig. 2.1 (i) What is meant by the term eutrophication? … … … …[2]
Question paper, page 7
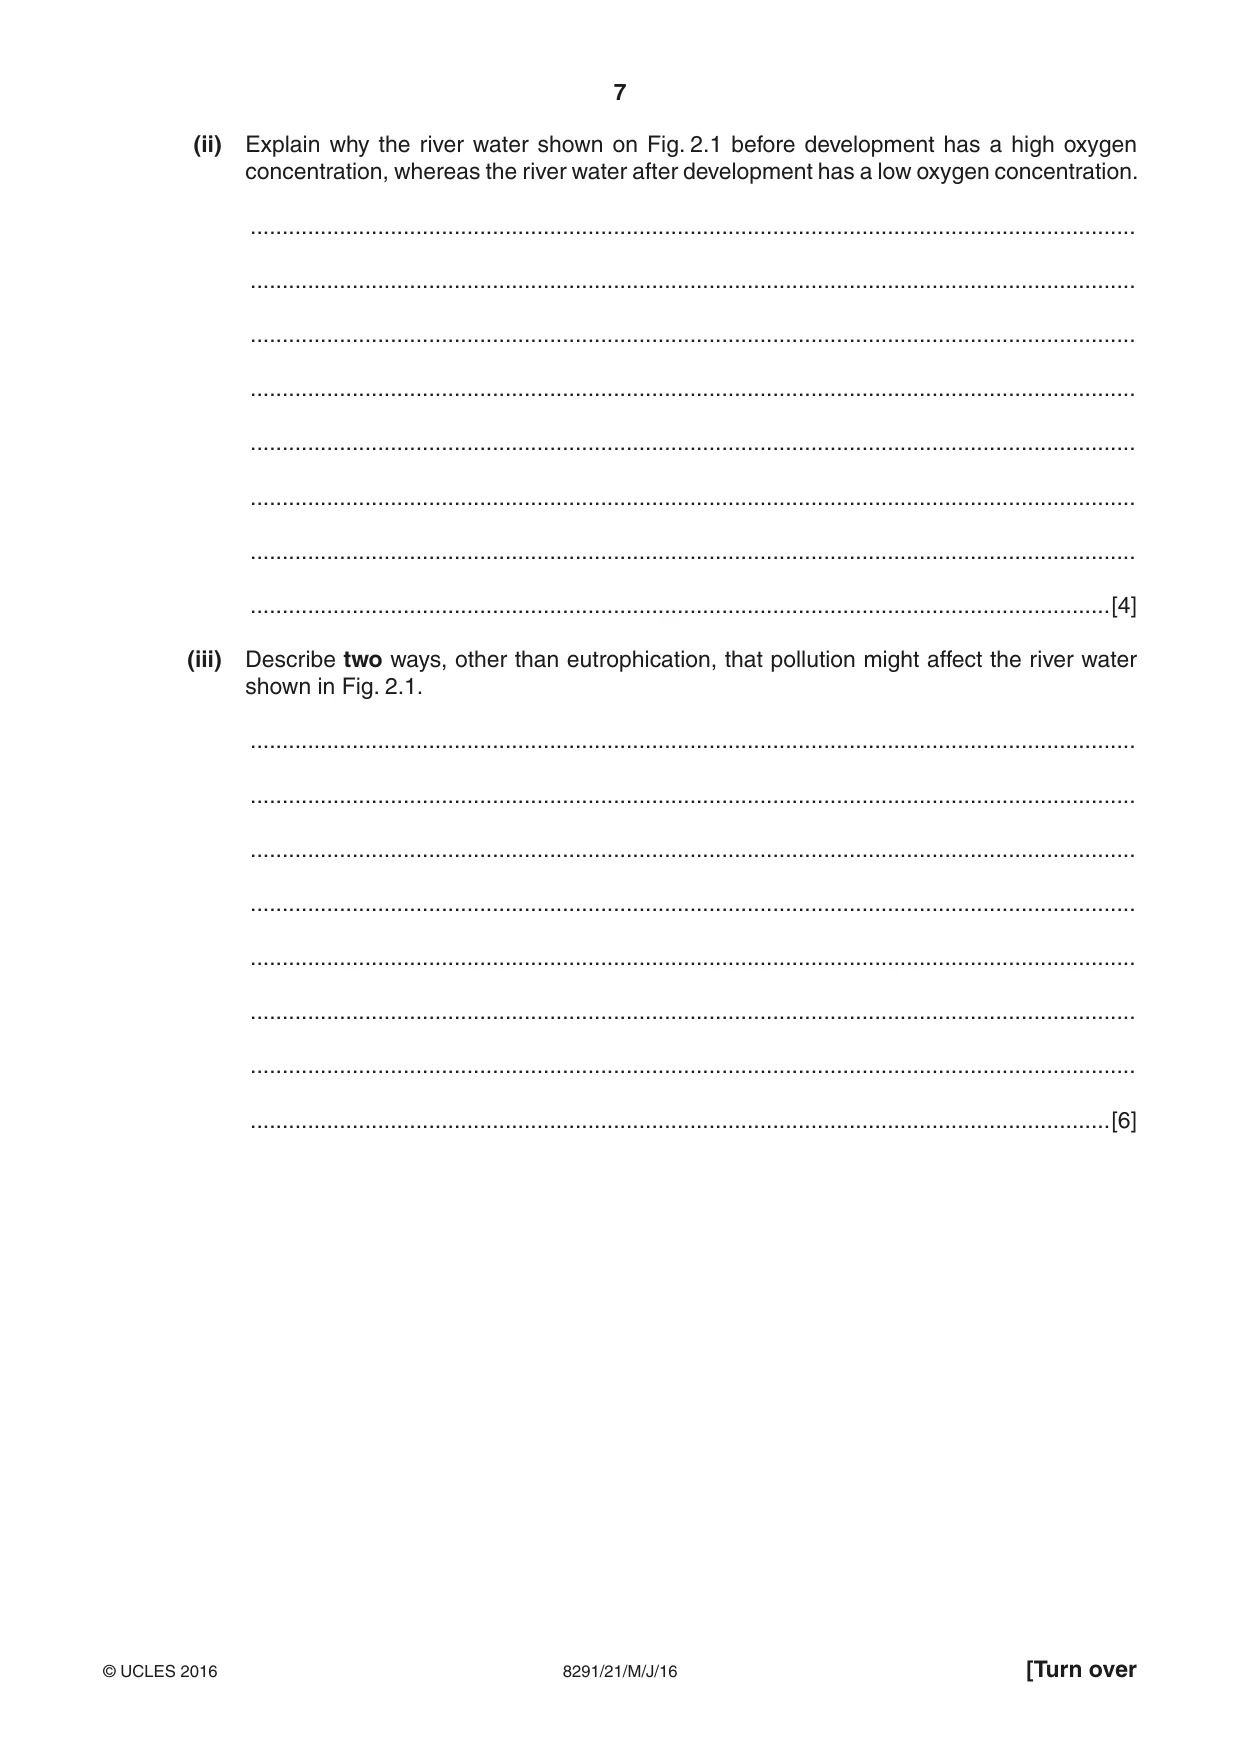
7 8291/21/M/J/16 © UCLES 2016 [Turn over (ii) Explain why the river water shown on Fig. 2.1 before development has a high oxygen concentration, whereas the river water after development has a low oxygen concentration. … … … … … … … …[4] (iii) Describe two ways, other than eutrophication, that pollution might affect the river water shown in Fig. 2.1. … … … … … … … …[6]
Question paper, page 8
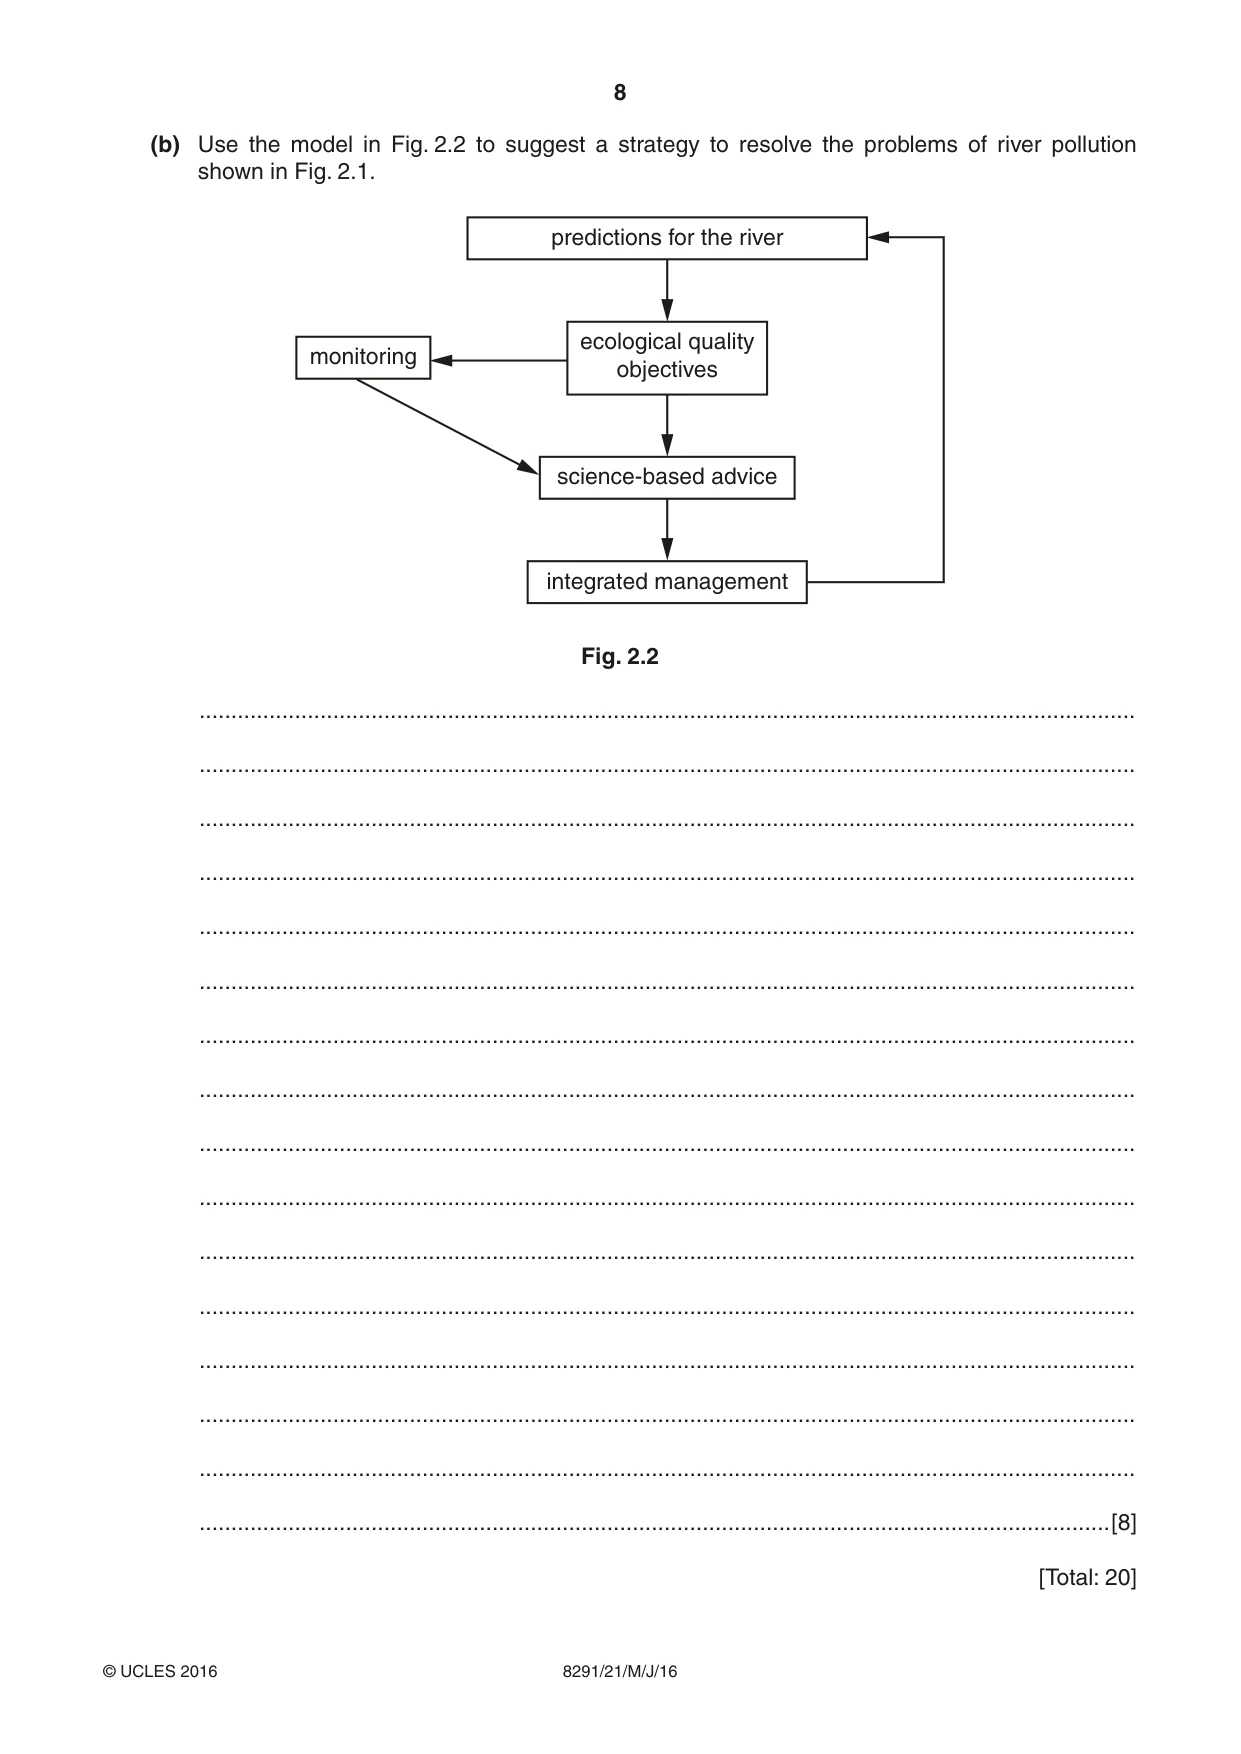
8 8291/21/M/J/16 © UCLES 2016 (b) Use the model in Fig. 2.2 to suggest a strategy to resolve the problems of river pollution shown in Fig. 2.1. predictions for the river ecological quality objectives science-based advice monitoring integrated management Fig. 2.2 … … … … … … … … … … … … … … … …[8] [Total: 20]
Question paper, page 9
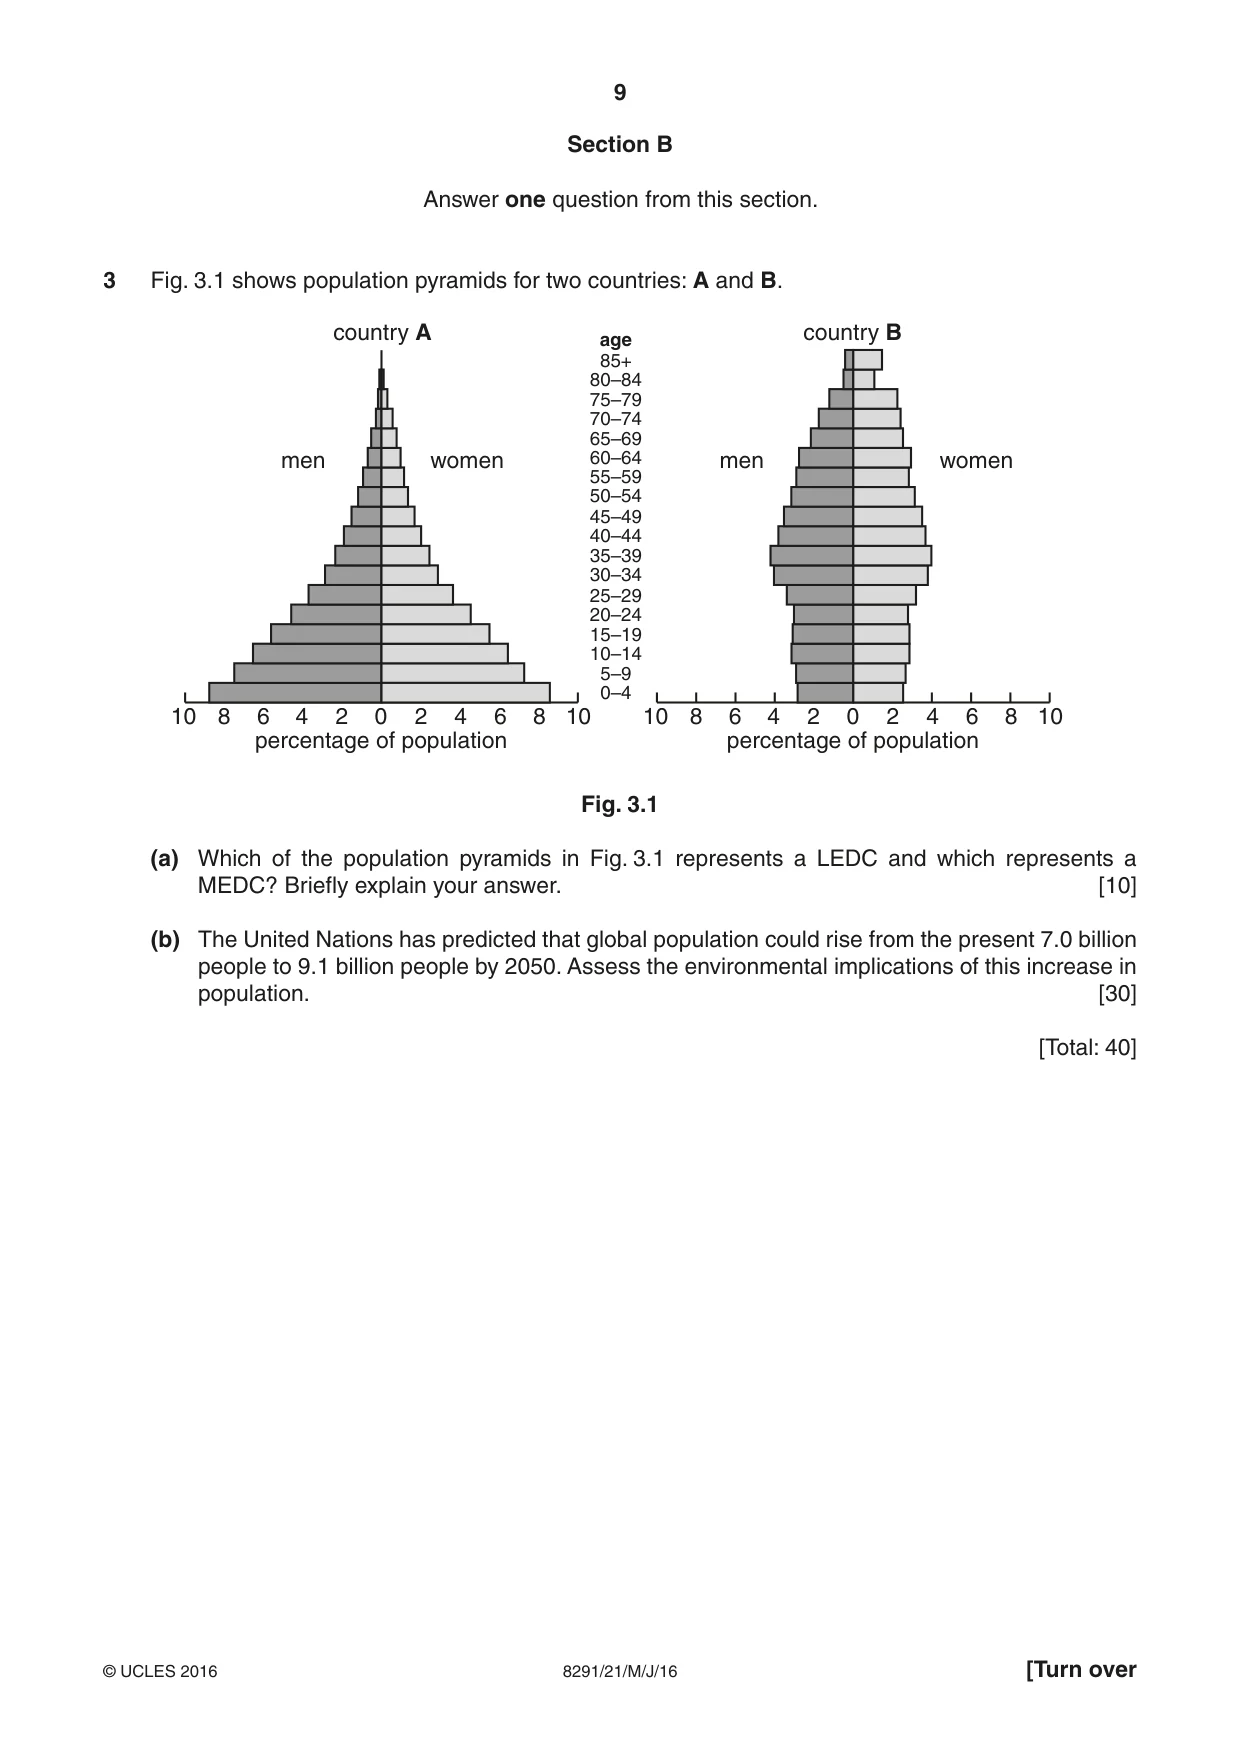
9 8291/21/M/J/16 © UCLES 2016 [Turn over Section B Answer one question from this section. 3 Fig. 3.1 shows population pyramids for two countries: A and B. 0 percentage of population men women 2 2 4 4 6 6 8 8 10 10 0 percentage of population men women 2 2 4 4 6 6 8 8 10 10 0–4 5–9 10–14 15–19 20–24 25–29 30–34 35–39 40–44 45–49 50–54 55–59 60–64 65–69 70–74 75–79 80–84 85+ age country A country B Fig. 3.1 (a) Which of the population pyramids in Fig. 3.1 represents a LEDC and which represents a MEDC? Briefly explain your answer. [10] (b) The United Nations has predicted that global population could rise from the present 7.0 billion people to 9.1 billion people by 2050. Assess the environmental implications of this increase in population. [30] [Total: 40]
Question paper, page 10
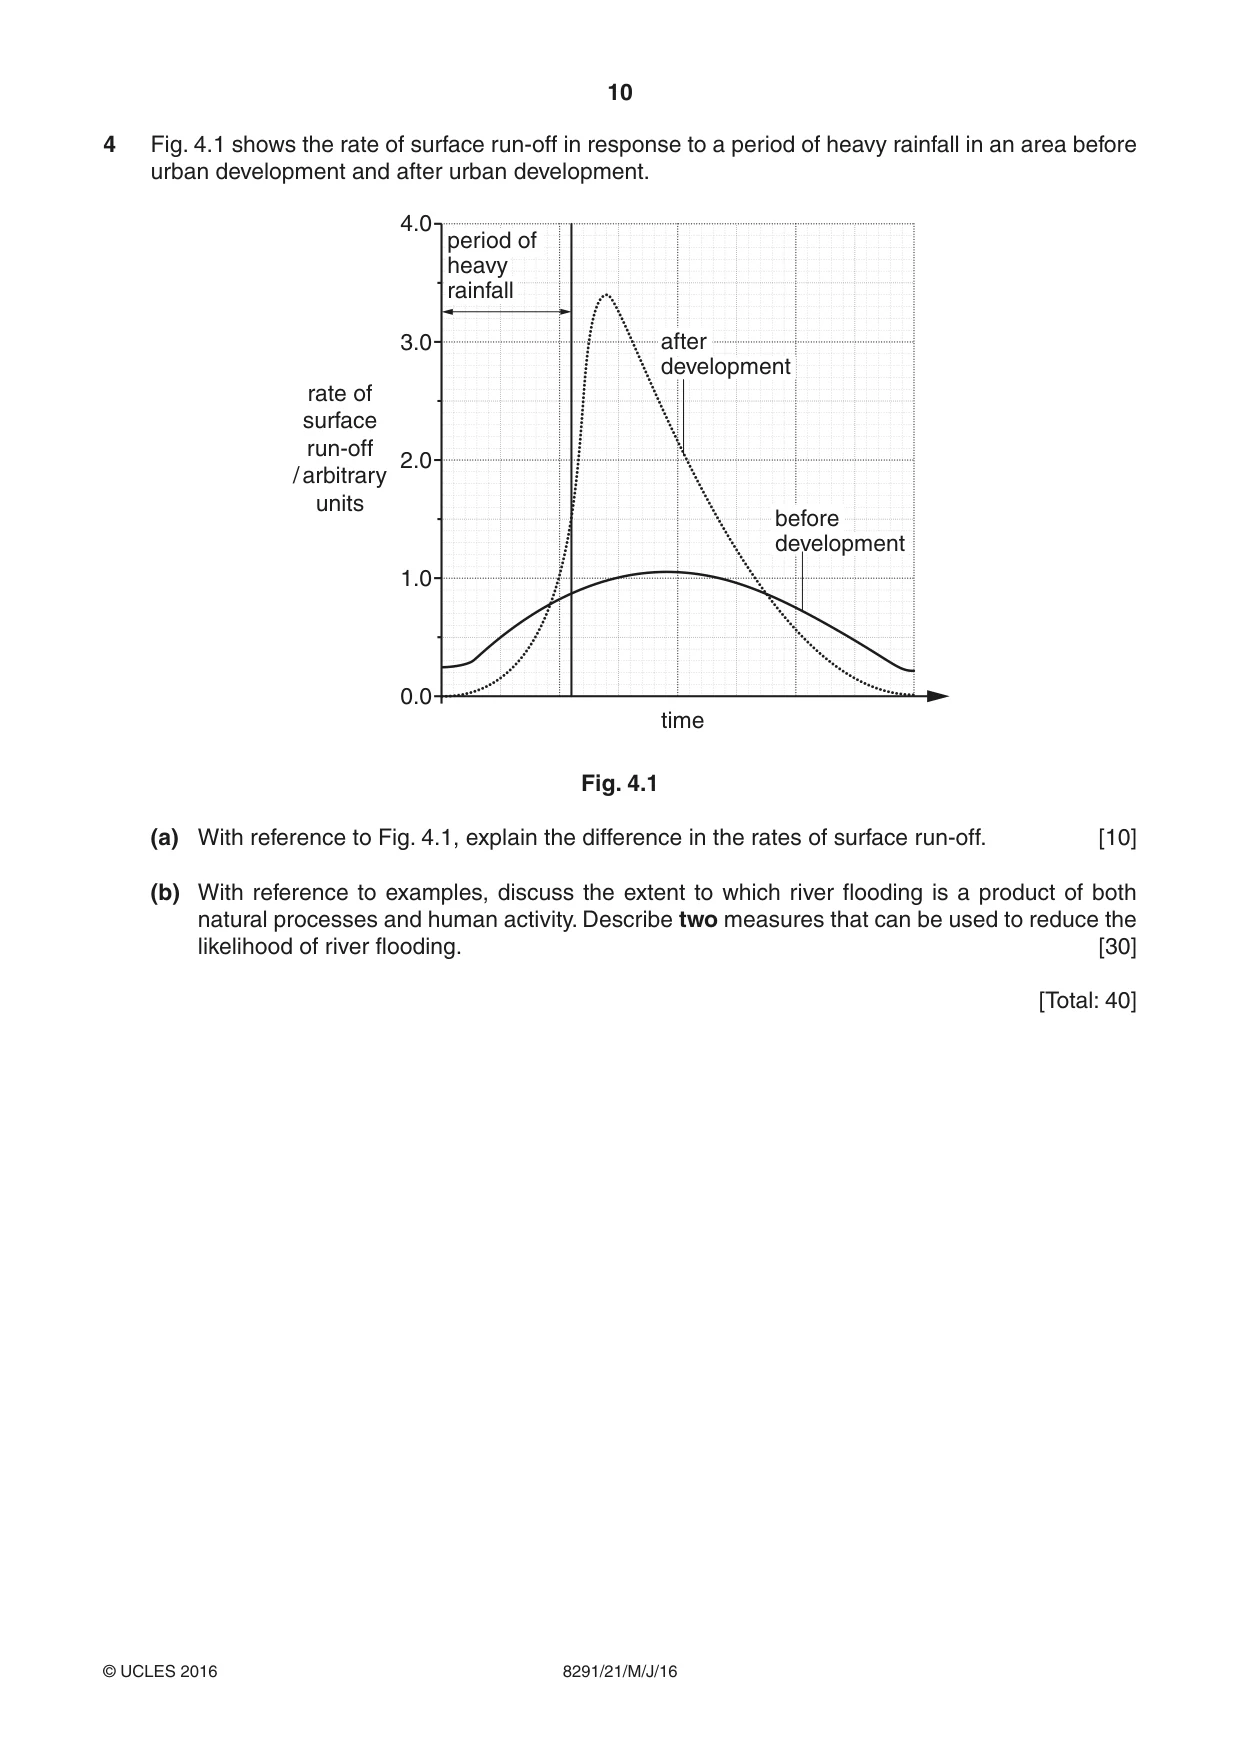
10 8291/21/M/J/16 © UCLES 2016 4 Fig. 4.1 shows the rate of surface run-off in response to a period of heavy rainfall in an area before urban development and after urban development. 0.0 1.0 2.0 3.0 4.0 rate of surface run-off / arbitrary units period of heavy rainfall after development before development time Fig. 4.1 (a) With reference to Fig. 4.1, explain the difference in the rates of surface run-off. [10] (b) With reference to examples, discuss the extent to which river flooding is a product of both natural processes and human activity. Describe two measures that can be used to reduce the likelihood of river flooding. [30] [Total: 40]
Question paper, page 11
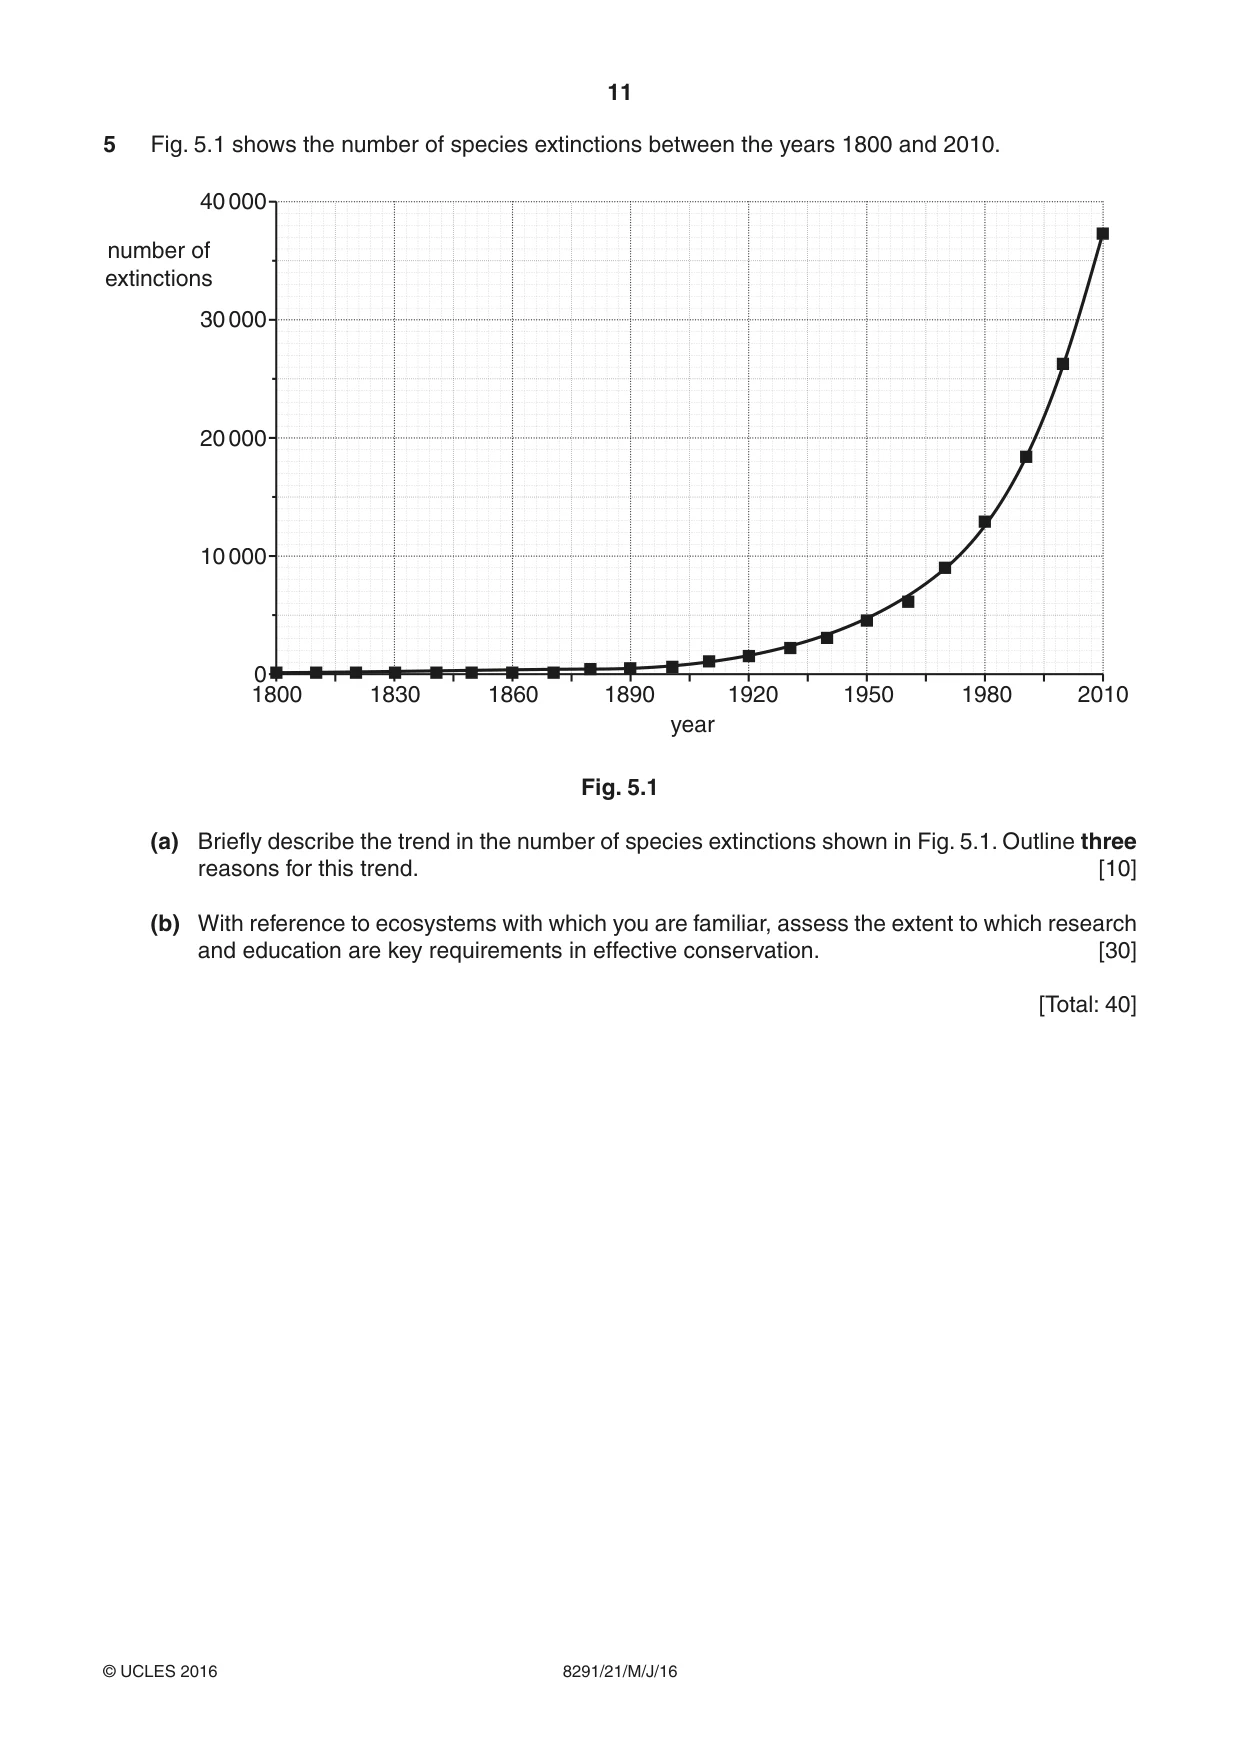
11 8291/21/M/J/16 © UCLES 2016 5 Fig. 5.1 shows the number of species extinctions between the years 1800 and 2010. 0 1800 1830 1860 1890 1920 year 1950 1980 2010 10 000 20 000 30 000 number of extinctions 40 000 Fig. 5.1 (a) Briefly describe the trend in the number of species extinctions shown in Fig. 5.1. Outline three reasons for this trend. [10] (b) With reference to ecosystems with which you are familiar, assess the extent to which research and education are key requirements in effective conservation. [30] [Total: 40]
Question paper, page 12
12 8291/21/M/J/16 © UCLES 2016 Permission to reproduce items where third-party owned material protected by copyright is included has been sought and cleared where possible. Every reasonable effort has been made by the publisher (UCLES) to trace copyright holders, but if any items requiring clearance have unwittingly been included, the publisher will be pleased to make amends at the earliest possible opportunity. To avoid the issue of disclosure of answer-related information to candidates, all copyright acknowledgements are reproduced online in the Cambridge International Examinations Copyright Acknowledgements Booklet. This is produced for each series of examinations and is freely available to download at www.cie.org.uk after the live examination series. Cambridge International Examinations is part of the Cambridge Assessment Group. Cambridge Assessment is the brand name of University of Cambridge Local Examinations Syndicate (UCLES), which is itself a department of the University of Cambridge. BLANK PAGE
Mark scheme, page 1
® IGCSE is the registered trademark of Cambridge International Examinations. This document consists of 15 printed pages. © UCLES 2016 [Turn over Cambridge International Examinations Cambridge International Advanced Subsidiary Level ENVIRONMENTAL MANAGEMENT 8291/21 Paper 2 May/June 2016 MARK SCHEME Maximum Mark: 80 Published This mark scheme is published as an aid to teachers and candidates, to indicate the requirements of the examination. It shows the basis on which Examiners were instructed to award marks. It does not indicate the details of the discussions that took place at an Examiners’ meeting before marking began, which would have considered the acceptability of alternative answers. Mark schemes should be read in conjunction with the question paper and the Principal Examiner Report for Teachers. Cambridge will not enter into discussions about these mark schemes. Cambridge is publishing the mark schemes for the May/June 2016 series for most Cambridge IGCSE®, Cambridge International A and AS Level components and some Cambridge O Level components.
Mark scheme, page 2
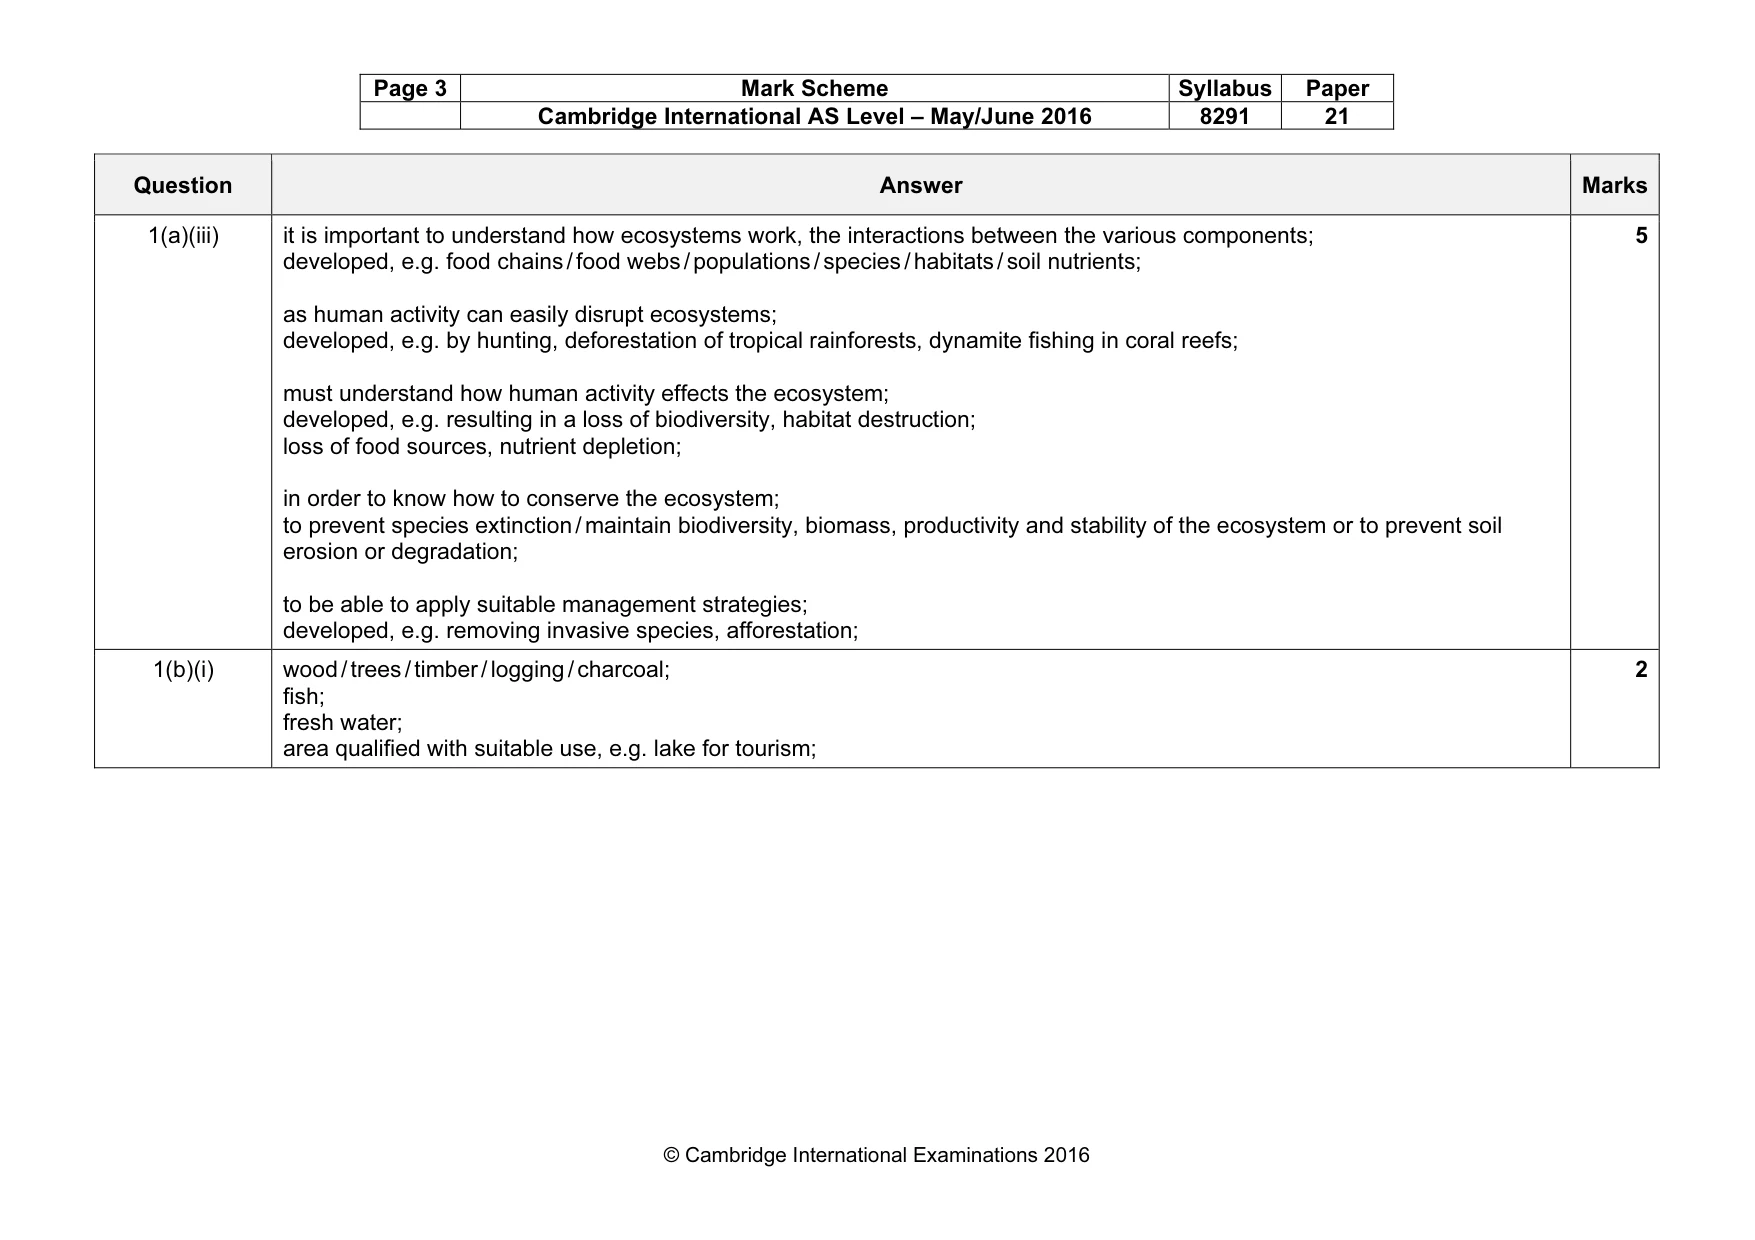
Page 2 Mark Scheme Syllabus Paper Cambridge International AS Level – May/June 2016 8291 21 © Cambridge International Examinations 2016 Section A Question Answer Marks 1(a)(i) a community / plants and animals / biotic / living components AND (interacting with the) environment / abiotic / non-living components; (Accept a simple statement, e.g. the community and environment.) 1 1(a)(ii) The model contains the interrelationships / interactions between the three components, soil, animals and plants for example through: nutrient recycling; the arrows show nutrient flows; between stores; decomposition / decomposers break down / decompose dead plants and animals; named example of a process, e.g. nitrification; energy flow; shows a feeding relationship; between producers and consumers / plants and animals in a food chain; between trophic levels; nutrient / mineral uptake by plants / plants absorb nutrients / minerals; use named nutrient / named mineral; for growth; to produce biomass; (secondary) productivity; (For each of two ways, 1 mark for the way and up to 2 marks for a developed point. Credit a maximum of 3 marks for any one well developed way.) 4
Mark scheme, page 3
Page 3 Mark Scheme Syllabus Paper Cambridge International AS Level – May/June 2016 8291 21 © Cambridge International Examinations 2016 Question Answer Marks 1(a)(iii) it is important to understand how ecosystems work, the interactions between the various components; developed, e.g. food chains / food webs / populations / species / habitats / soil nutrients; as human activity can easily disrupt ecosystems; developed, e.g. by hunting, deforestation of tropical rainforests, dynamite fishing in coral reefs; must understand how human activity effects the ecosystem; developed, e.g. resulting in a loss of biodiversity, habitat destruction; loss of food sources, nutrient depletion; in order to know how to conserve the ecosystem; to prevent species extinction / maintain biodiversity, biomass, productivity and stability of the ecosystem or to prevent soil erosion or degradation; to be able to apply suitable management strategies; developed, e.g. removing invasive species, afforestation; 5 1(b)(i) wood / trees / timber / logging / charcoal; fish; fresh water; area qualified with suitable use, e.g. lake for tourism; 2
Mark scheme, page 4
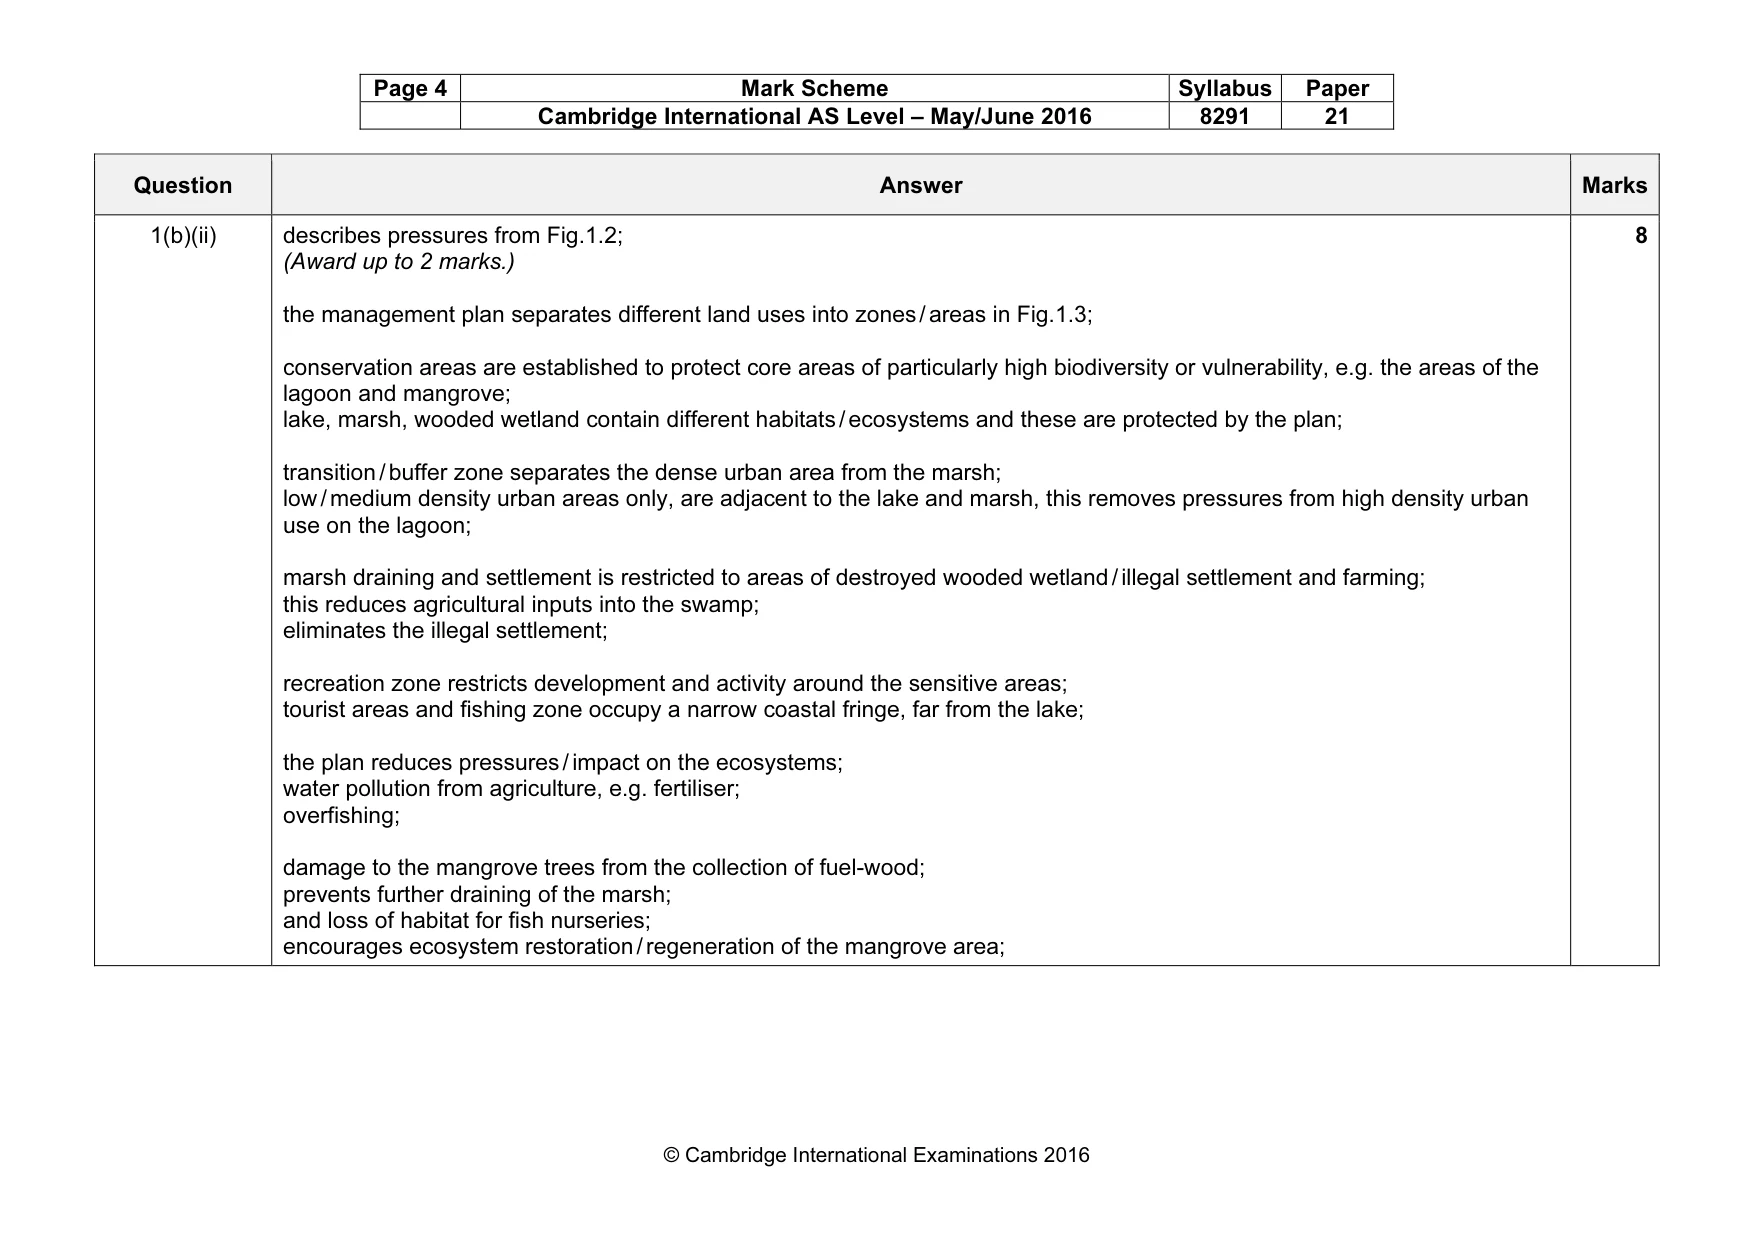
Page 4 Mark Scheme Syllabus Paper Cambridge International AS Level – May/June 2016 8291 21 © Cambridge International Examinations 2016 Question Answer Marks 1(b)(ii) describes pressures from Fig.1.2; (Award up to 2 marks.) the management plan separates different land uses into zones / areas in Fig.1.3; conservation areas are established to protect core areas of particularly high biodiversity or vulnerability, e.g. the areas of the lagoon and mangrove; lake, marsh, wooded wetland contain different habitats / ecosystems and these are protected by the plan; transition / buffer zone separates the dense urban area from the marsh; low / medium density urban areas only, are adjacent to the lake and marsh, this removes pressures from high density urban use on the lagoon; marsh draining and settlement is restricted to areas of destroyed wooded wetland / illegal settlement and farming; this reduces agricultural inputs into the swamp; eliminates the illegal settlement; recreation zone restricts development and activity around the sensitive areas; tourist areas and fishing zone occupy a narrow coastal fringe, far from the lake; the plan reduces pressures / impact on the ecosystems; water pollution from agriculture, e.g. fertiliser; overfishing; damage to the mangrove trees from the collection of fuel-wood; prevents further draining of the marsh; and loss of habitat for fish nurseries; encourages ecosystem restoration / regeneration of the mangrove area; 8
Mark scheme, page 5
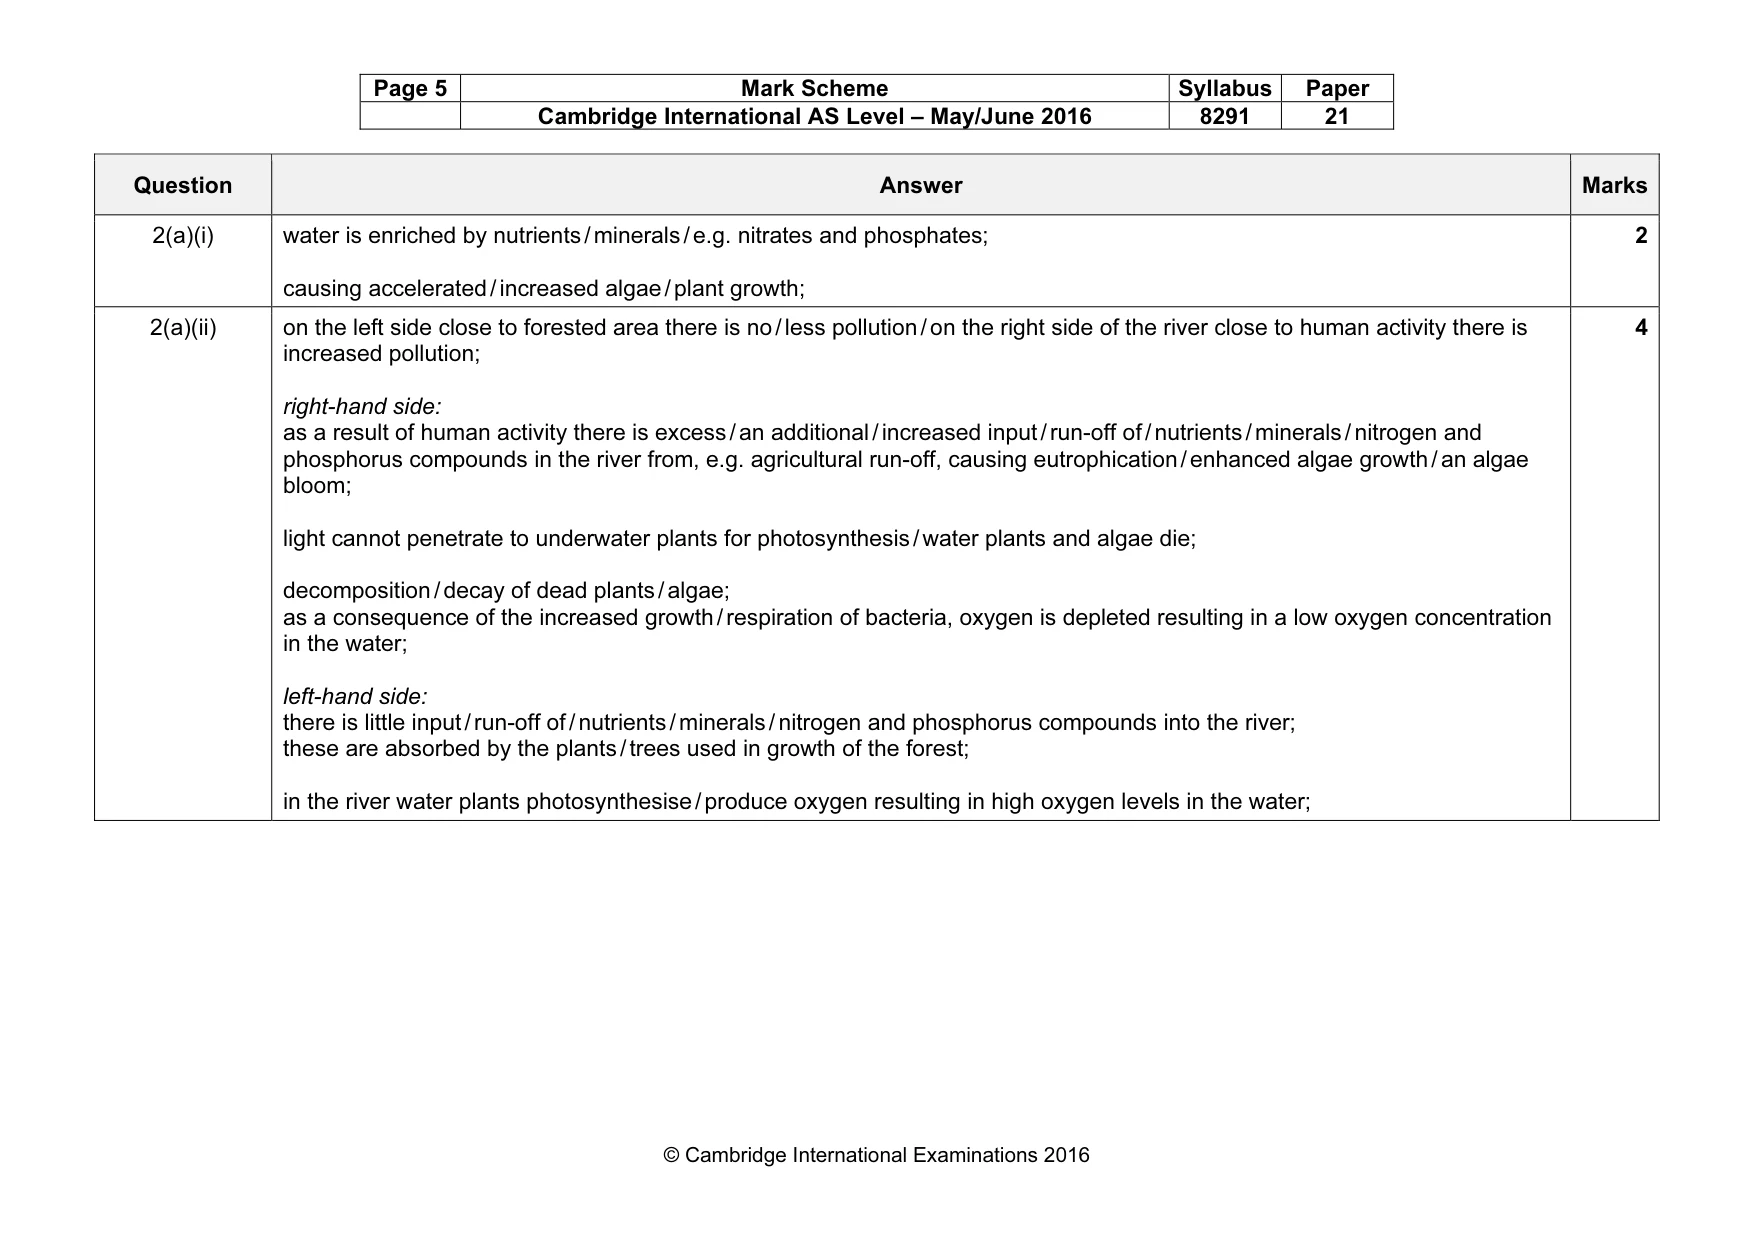
Page 5 Mark Scheme Syllabus Paper Cambridge International AS Level – May/June 2016 8291 21 © Cambridge International Examinations 2016 Question Answer Marks 2(a)(i) water is enriched by nutrients / minerals / e.g. nitrates and phosphates; causing accelerated / increased algae / plant growth; 2 2(a)(ii) on the left side close to forested area there is no / less pollution / on the right side of the river close to human activity there is increased pollution; right-hand side: as a result of human activity there is excess / an additional / increased input / run-off of / nutrients / minerals / nitrogen and phosphorus compounds in the river from, e.g. agricultural run-off, causing eutrophication / enhanced algae growth / an algae bloom; light cannot penetrate to underwater plants for photosynthesis / water plants and algae die; decomposition / decay of dead plants / algae; as a consequence of the increased growth / respiration of bacteria, oxygen is depleted resulting in a low oxygen concentration in the water; left-hand side: there is little input / run-off of / nutrients / minerals / nitrogen and phosphorus compounds into the river; these are absorbed by the plants / trees used in growth of the forest; in the river water plants photosynthesise / produce oxygen resulting in high oxygen levels in the water; 4
Mark scheme, page 6
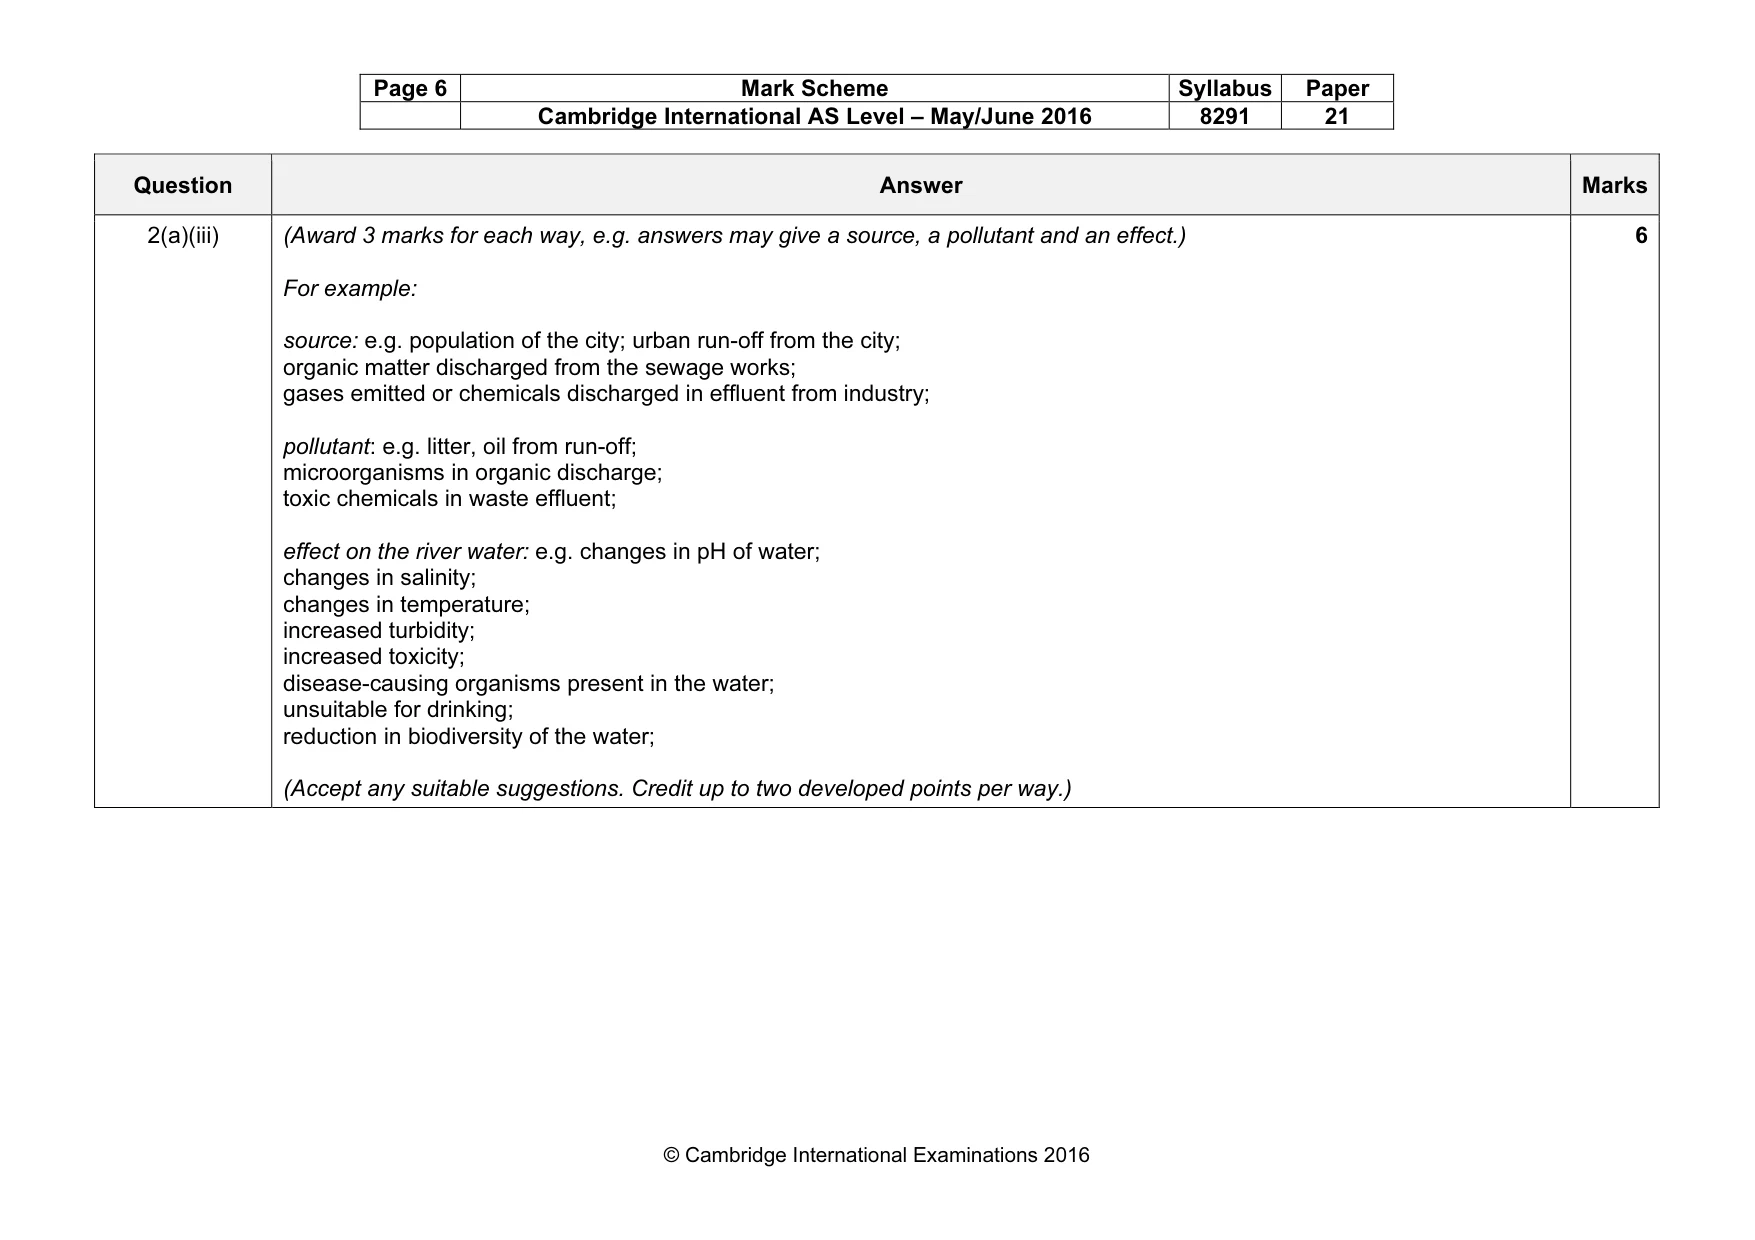
Page 6 Mark Scheme Syllabus Paper Cambridge International AS Level – May/June 2016 8291 21 © Cambridge International Examinations 2016 Question Answer Marks 2(a)(iii) (Award 3 marks for each way, e.g. answers may give a source, a pollutant and an effect.) For example: source: e.g. population of the city; urban run-off from the city; organic matter discharged from the sewage works; gases emitted or chemicals discharged in effluent from industry; pollutant: e.g. litter, oil from run-off; microorganisms in organic discharge; toxic chemicals in waste effluent; effect on the river water: e.g. changes in pH of water; changes in salinity; changes in temperature; increased turbidity; increased toxicity; disease-causing organisms present in the water; unsuitable for drinking; reduction in biodiversity of the water; (Accept any suitable suggestions. Credit up to two developed points per way.) 6
Mark scheme, page 7
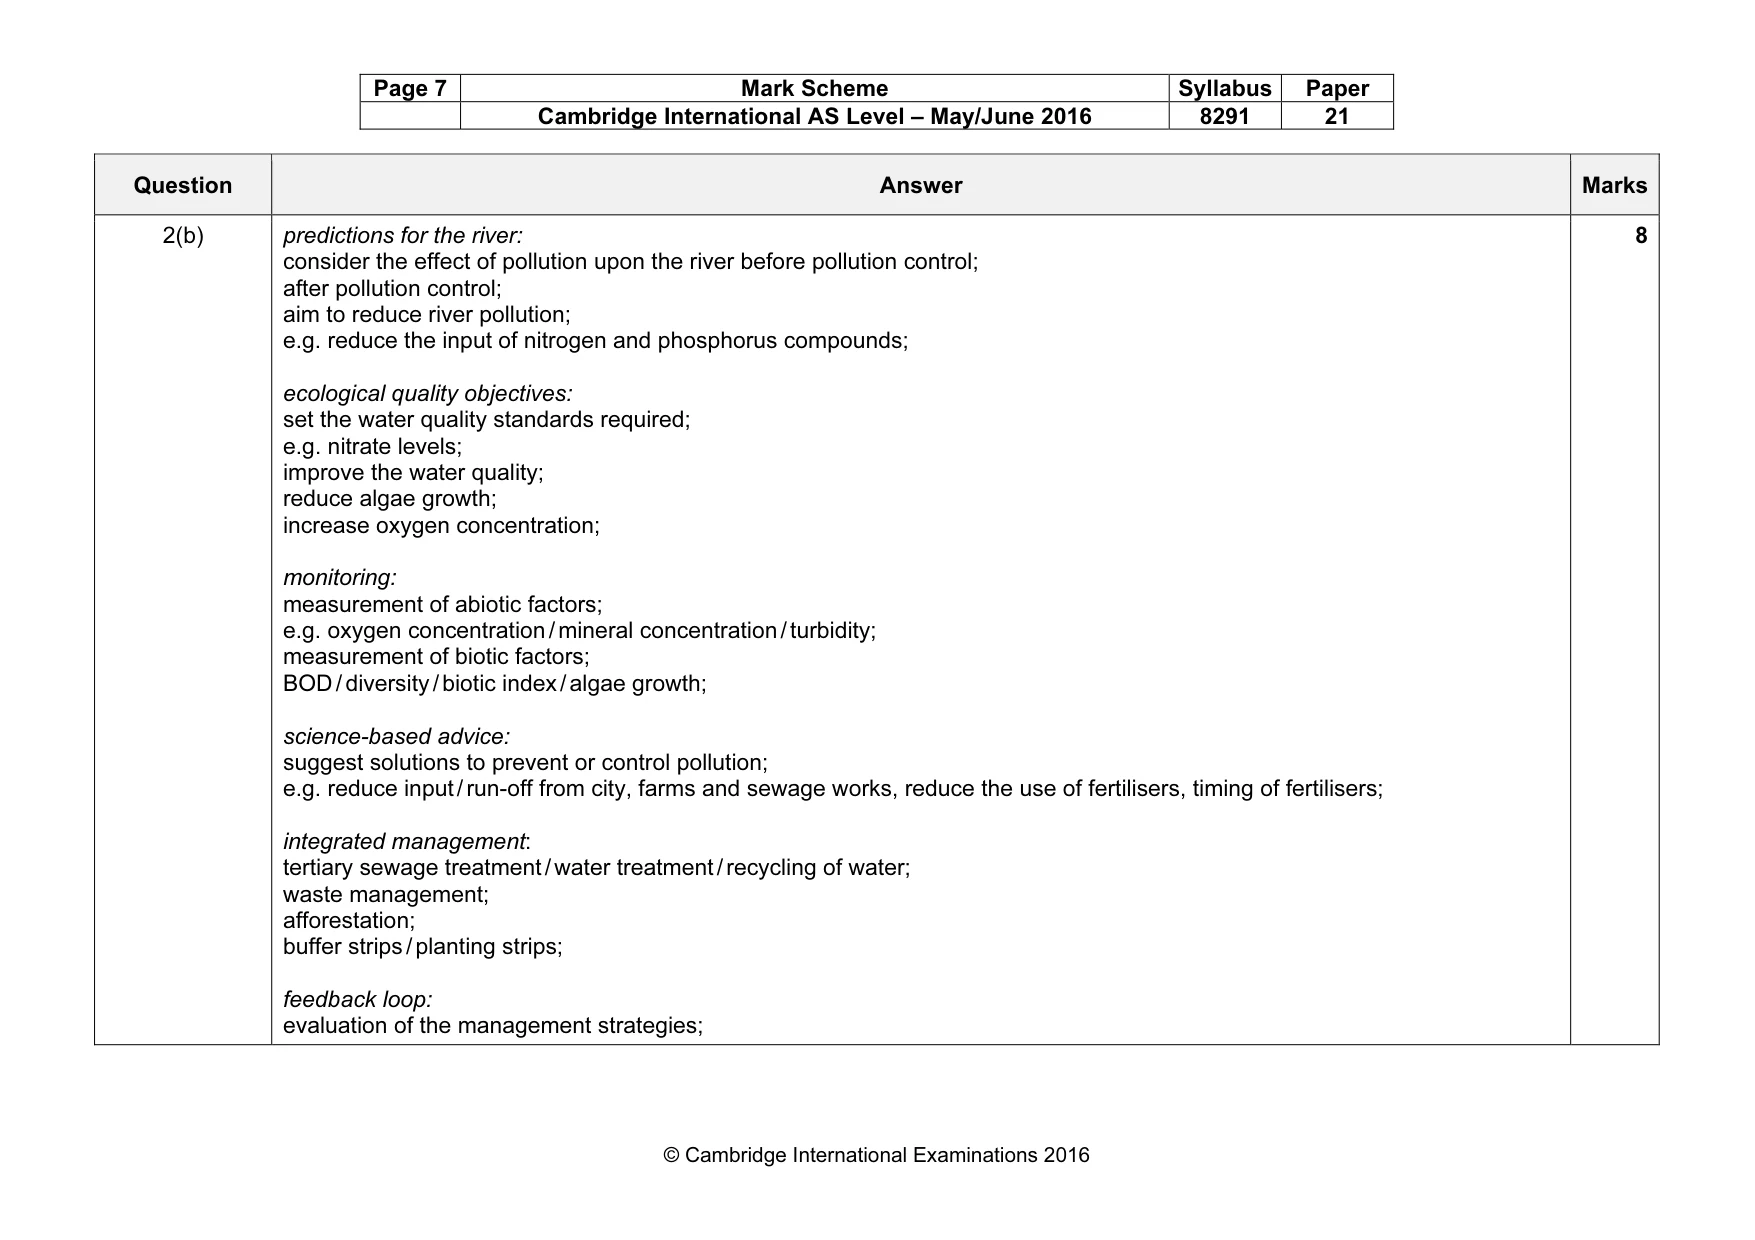
Page 7 Mark Scheme Syllabus Paper Cambridge International AS Level – May/June 2016 8291 21 © Cambridge International Examinations 2016 Question Answer Marks 2(b) predictions for the river: consider the effect of pollution upon the river before pollution control; after pollution control; aim to reduce river pollution; e.g. reduce the input of nitrogen and phosphorus compounds; ecological quality objectives: set the water quality standards required; e.g. nitrate levels; improve the water quality; reduce algae growth; increase oxygen concentration; monitoring: measurement of abiotic factors; e.g. oxygen concentration / mineral concentration / turbidity; measurement of biotic factors; BOD / diversity / biotic index / algae growth; science-based advice: suggest solutions to prevent or control pollution; e.g. reduce input / run-off from city, farms and sewage works, reduce the use of fertilisers, timing of fertilisers; integrated management: tertiary sewage treatment / water treatment / recycling of water; waste management; afforestation; buffer strips / planting strips; feedback loop: evaluation of the management strategies; 8
Mark scheme, page 8
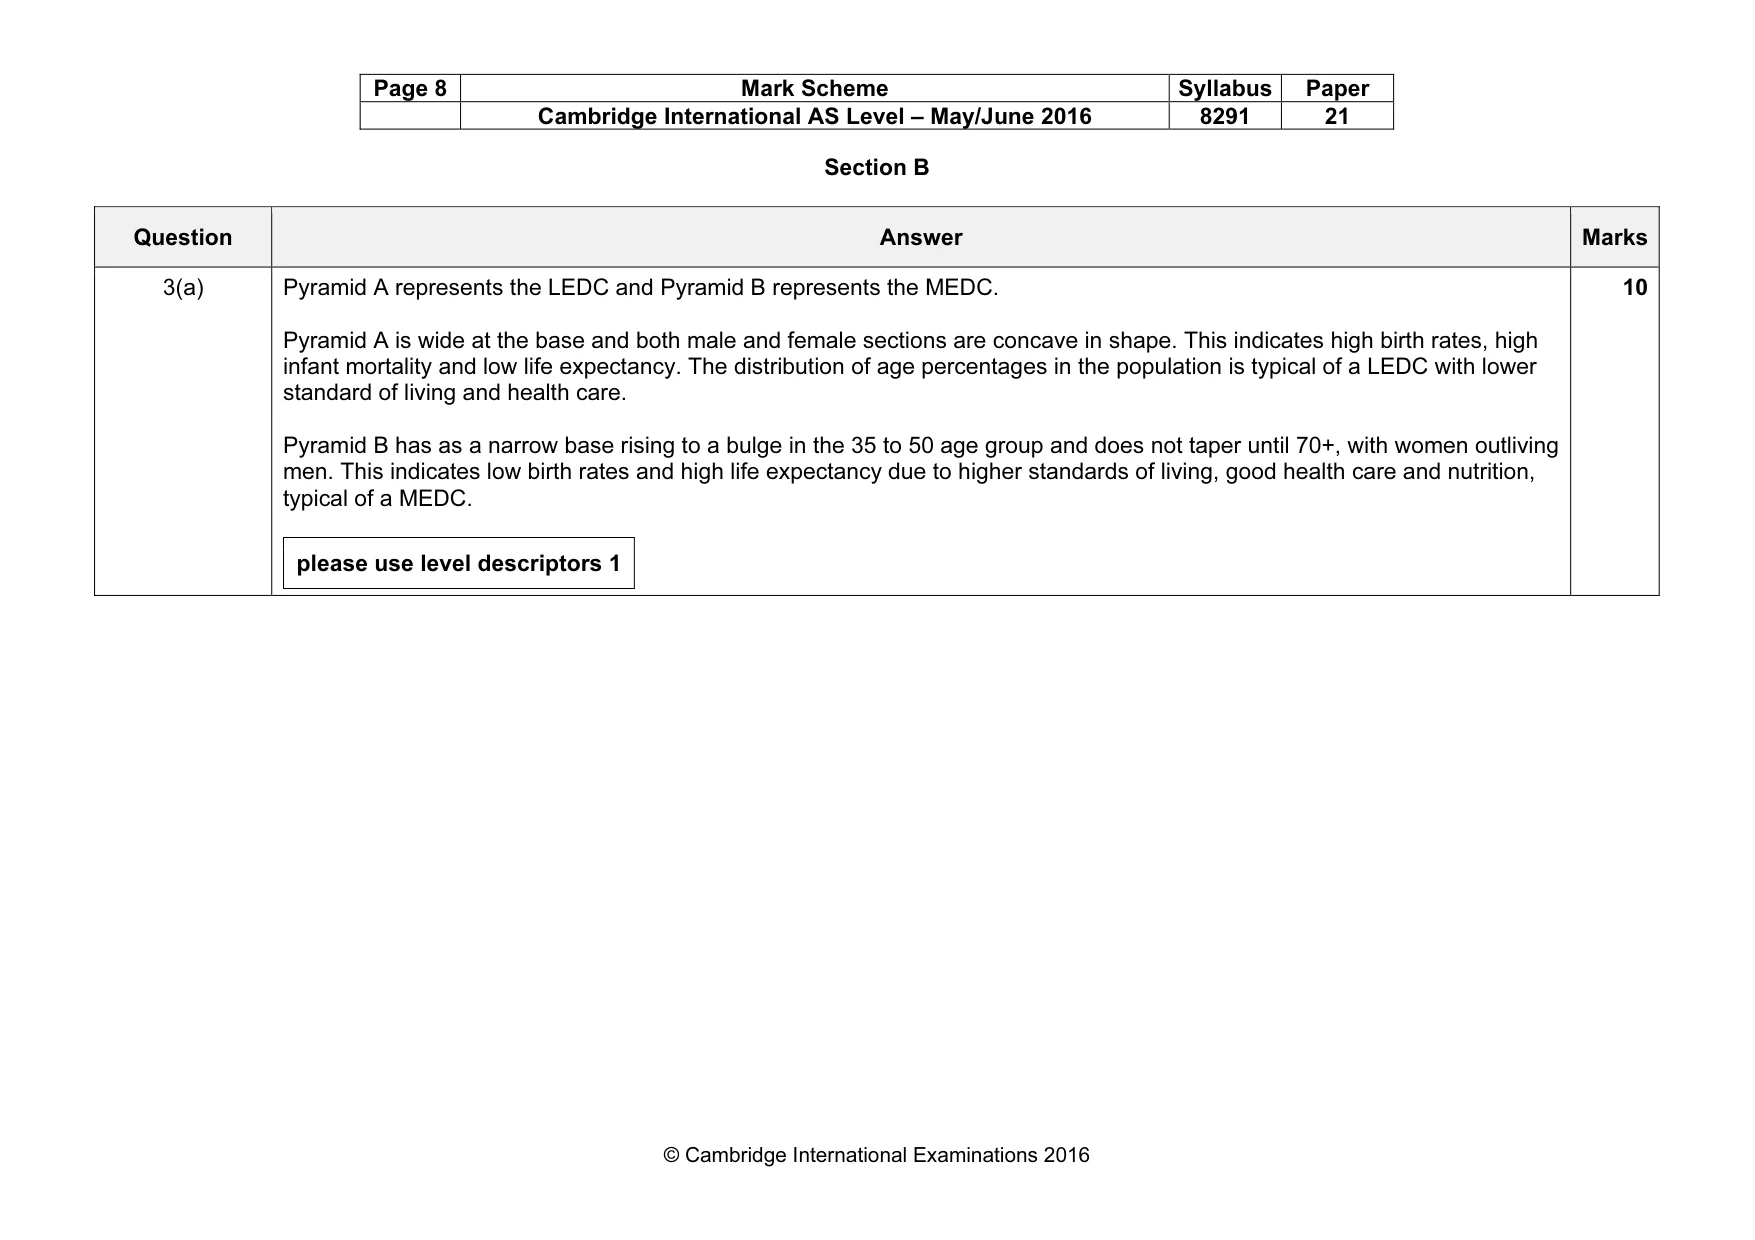
Page 8 Mark Scheme Syllabus Paper Cambridge International AS Level – May/June 2016 8291 21 © Cambridge International Examinations 2016 Section B Question Answer Marks 3(a) Pyramid A represents the LEDC and Pyramid B represents the MEDC. Pyramid A is wide at the base and both male and female sections are concave in shape. This indicates high birth rates, high infant mortality and low life expectancy. The distribution of age percentages in the population is typical of a LEDC with lower standard of living and health care. Pyramid B has as a narrow base rising to a bulge in the 35 to 50 age group and does not taper until 70+, with women outliving men. This indicates low birth rates and high life expectancy due to higher standards of living, good health care and nutrition, typical of a MEDC. please use level descriptors 1 10
Mark scheme, page 9
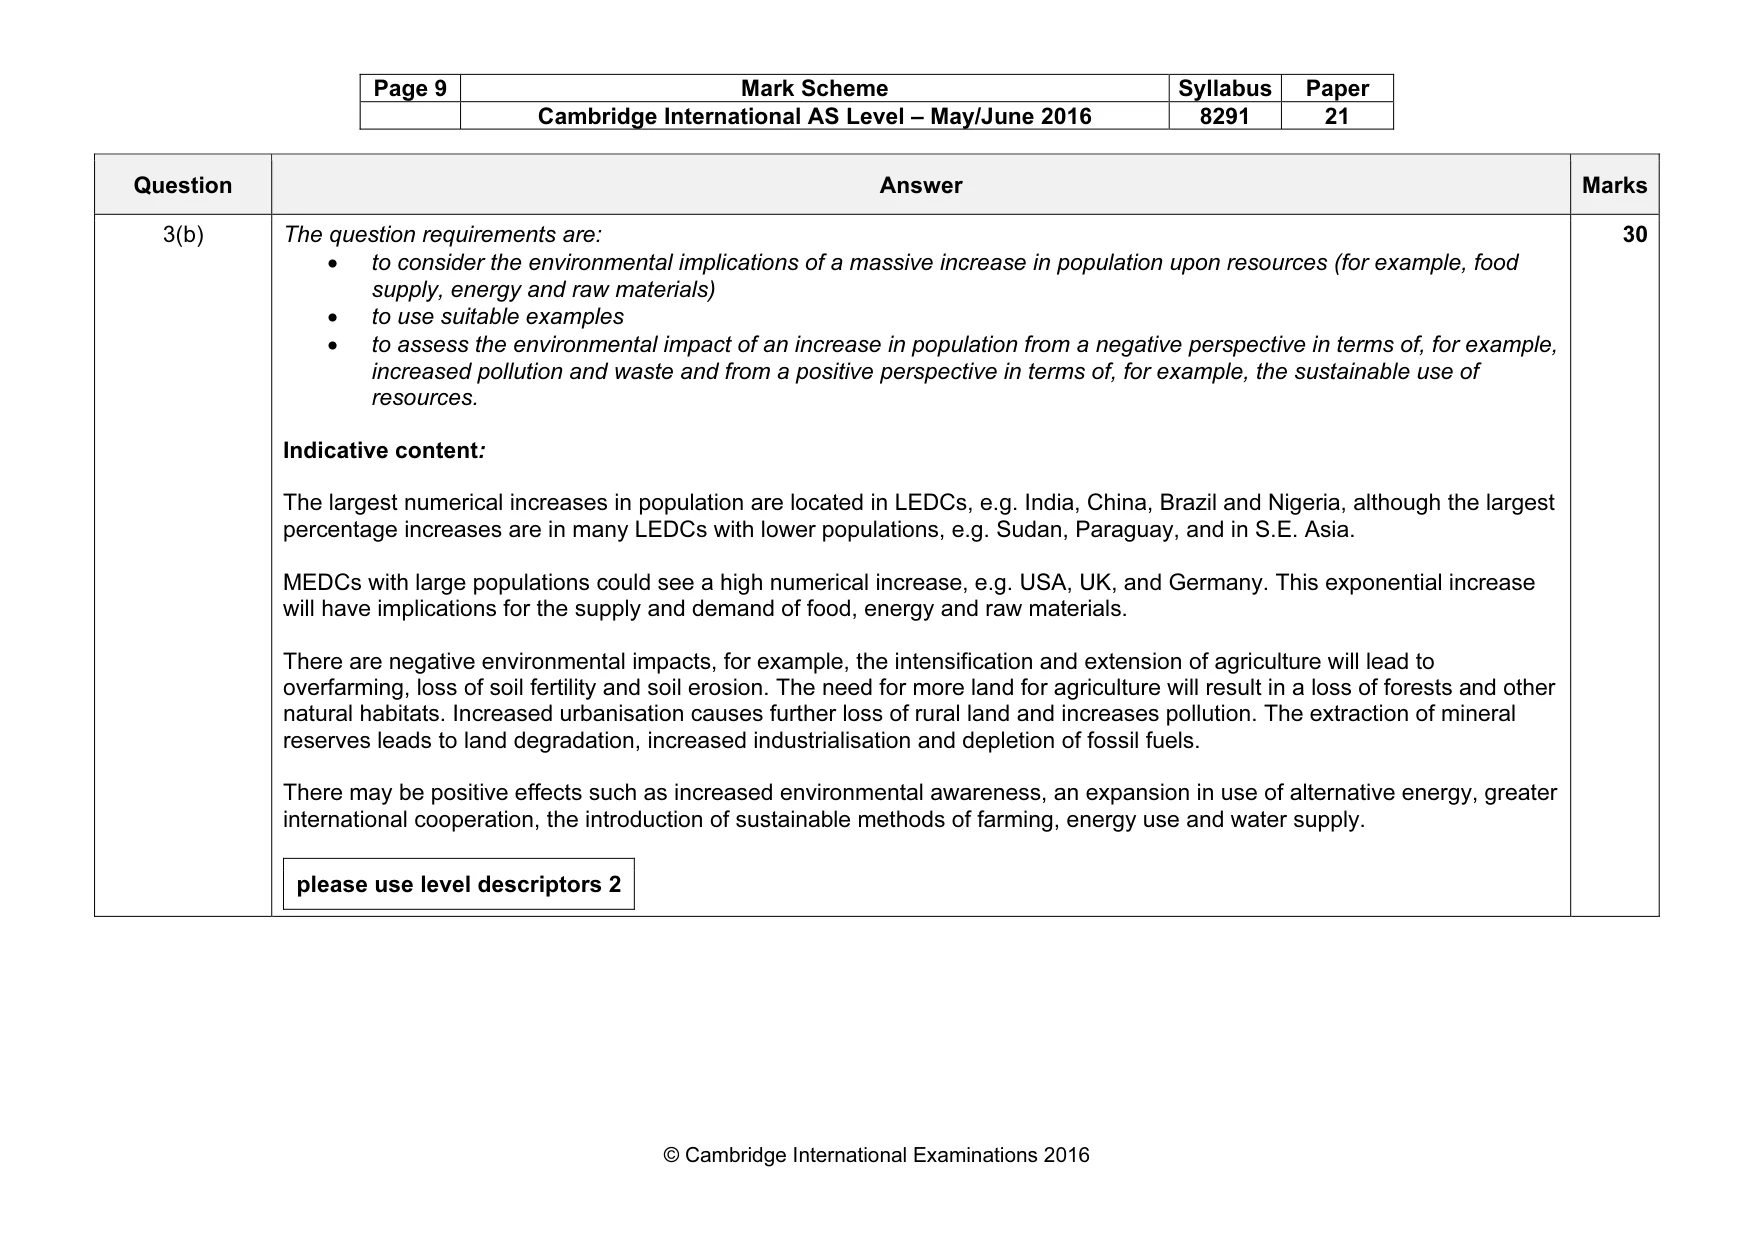
Page 9 Mark Scheme Syllabus Paper Cambridge International AS Level – May/June 2016 8291 21 © Cambridge International Examinations 2016 Question Answer Marks 3(b) The question requirements are: • to consider the environmental implications of a massive increase in population upon resources (for example, food supply, energy and raw materials) • to use suitable examples • to assess the environmental impact of an increase in population from a negative perspective in terms of, for example, increased pollution and waste and from a positive perspective in terms of, for example, the sustainable use of resources. Indicative content: The largest numerical increases in population are located in LEDCs, e.g. India, China, Brazil and Nigeria, although the largest percentage increases are in many LEDCs with lower populations, e.g. Sudan, Paraguay, and in S.E. Asia. MEDCs with large populations could see a high numerical increase, e.g. USA, UK, and Germany. This exponential increase will have implications for the supply and demand of food, energy and raw materials. There are negative environmental impacts, for example, the intensification and extension of agriculture will lead to overfarming, loss of soil fertility and soil erosion. The need for more land for agriculture will result in a loss of forests and other natural habitats. Increased urbanisation causes further loss of rural land and increases pollution. The extraction of mineral reserves leads to land degradation, increased industrialisation and depletion of fossil fuels. There may be positive effects such as increased environmental awareness, an expansion in use of alternative energy, greater international cooperation, the introduction of sustainable methods of farming, energy use and water supply. please use level descriptors 2 30
Mark scheme, page 10
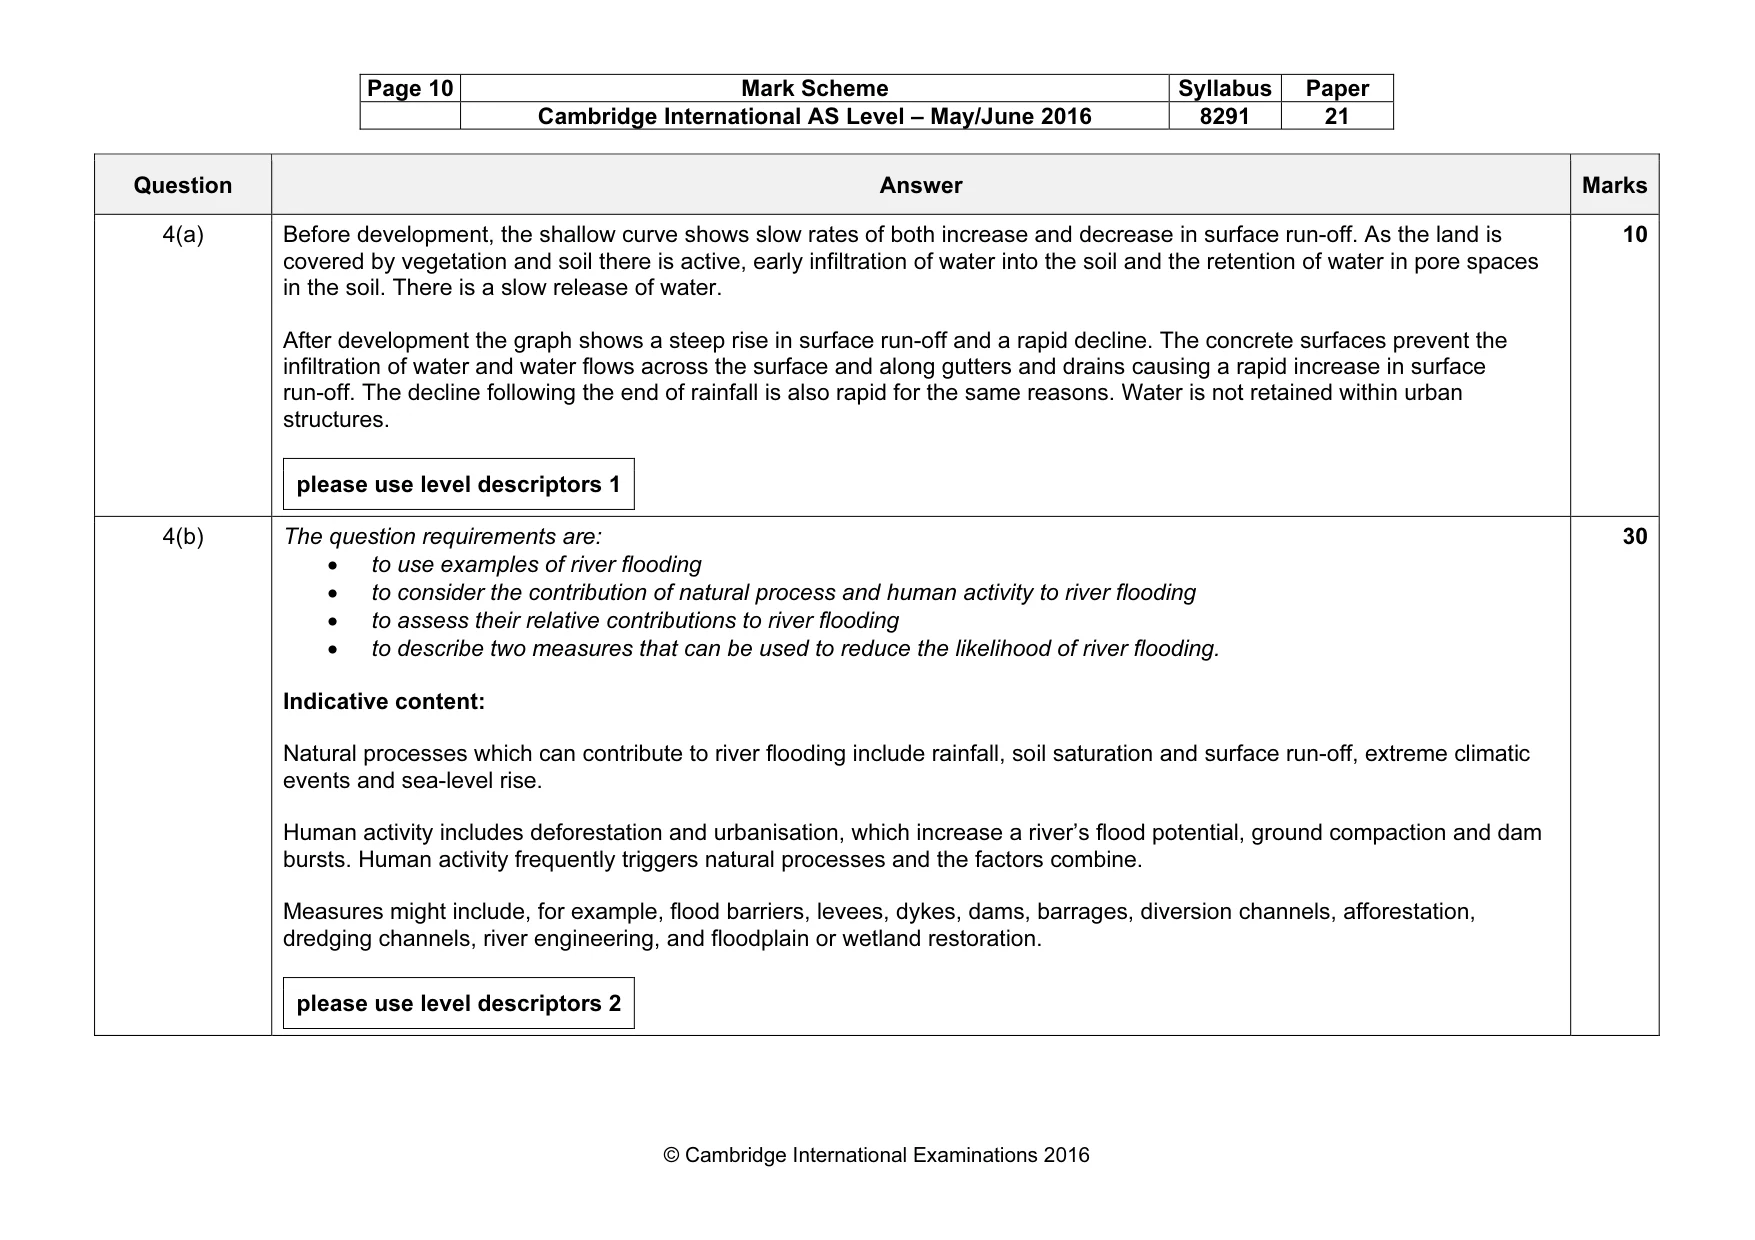
Page 10 Mark Scheme Syllabus Paper Cambridge International AS Level – May/June 2016 8291 21 © Cambridge International Examinations 2016 Question Answer Marks 4(a) Before development, the shallow curve shows slow rates of both increase and decrease in surface run-off. As the land is covered by vegetation and soil there is active, early infiltration of water into the soil and the retention of water in pore spaces in the soil. There is a slow release of water. After development the graph shows a steep rise in surface run-off and a rapid decline. The concrete surfaces prevent the infiltration of water and water flows across the surface and along gutters and drains causing a rapid increase in surface run-off. The decline following the end of rainfall is also rapid for the same reasons. Water is not retained within urban structures. please use level descriptors 1 10 4(b) The question requirements are: • to use examples of river flooding • to consider the contribution of natural process and human activity to river flooding • to assess their relative contributions to river flooding • to describe two measures that can be used to reduce the likelihood of river flooding. Indicative content: Natural processes which can contribute to river flooding include rainfall, soil saturation and surface run-off, extreme climatic events and sea-level rise. Human activity includes deforestation and urbanisation, which increase a river’s flood potential, ground compaction and dam bursts. Human activity frequently triggers natural processes and the factors combine. Measures might include, for example, flood barriers, levees, dykes, dams, barrages, diversion channels, afforestation, dredging channels, river engineering, and floodplain or wetland restoration. please use level descriptors 2 30
Mark scheme, page 11
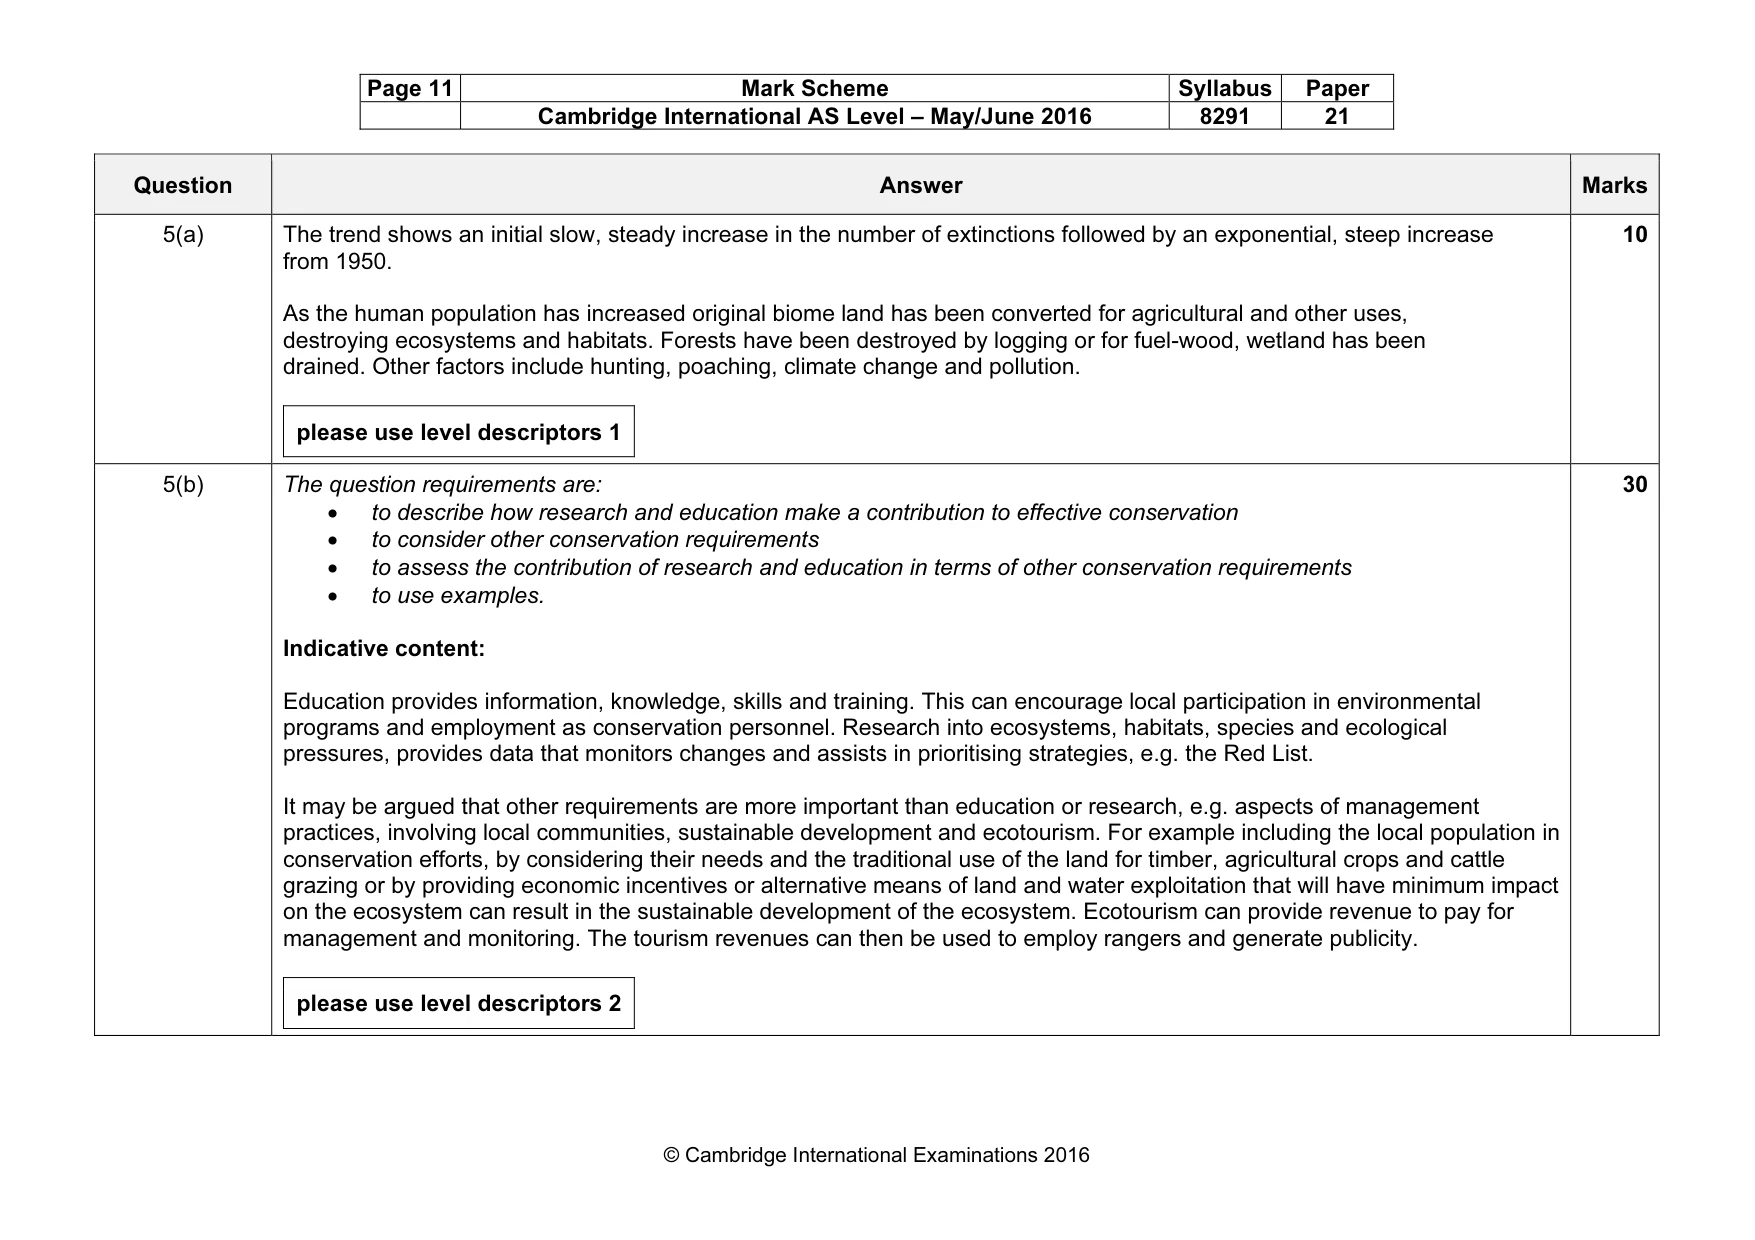
Page 11 Mark Scheme Syllabus Paper Cambridge International AS Level – May/June 2016 8291 21 © Cambridge International Examinations 2016 Question Answer Marks 5(a) The trend shows an initial slow, steady increase in the number of extinctions followed by an exponential, steep increase from 1950. As the human population has increased original biome land has been converted for agricultural and other uses, destroying ecosystems and habitats. Forests have been destroyed by logging or for fuel-wood, wetland has been drained. Other factors include hunting, poaching, climate change and pollution. please use level descriptors 1 10 5(b) The question requirements are: • to describe how research and education make a contribution to effective conservation • to consider other conservation requirements • to assess the contribution of research and education in terms of other conservation requirements • to use examples. Indicative content: Education provides information, knowledge, skills and training. This can encourage local participation in environmental programs and employment as conservation personnel. Research into ecosystems, habitats, species and ecological pressures, provides data that monitors changes and assists in prioritising strategies, e.g. the Red List. It may be argued that other requirements are more important than education or research, e.g. aspects of management practices, involving local communities, sustainable development and ecotourism. For example including the local population in conservation efforts, by considering their needs and the traditional use of the land for timber, agricultural crops and cattle grazing or by providing economic incentives or alternative means of land and water exploitation that will have minimum impact on the ecosystem can result in the sustainable development of the ecosystem. Ecotourism can provide revenue to pay for management and monitoring. The tourism revenues can then be used to employ rangers and generate publicity. please use level descriptors 2 30
Mark scheme, page 12
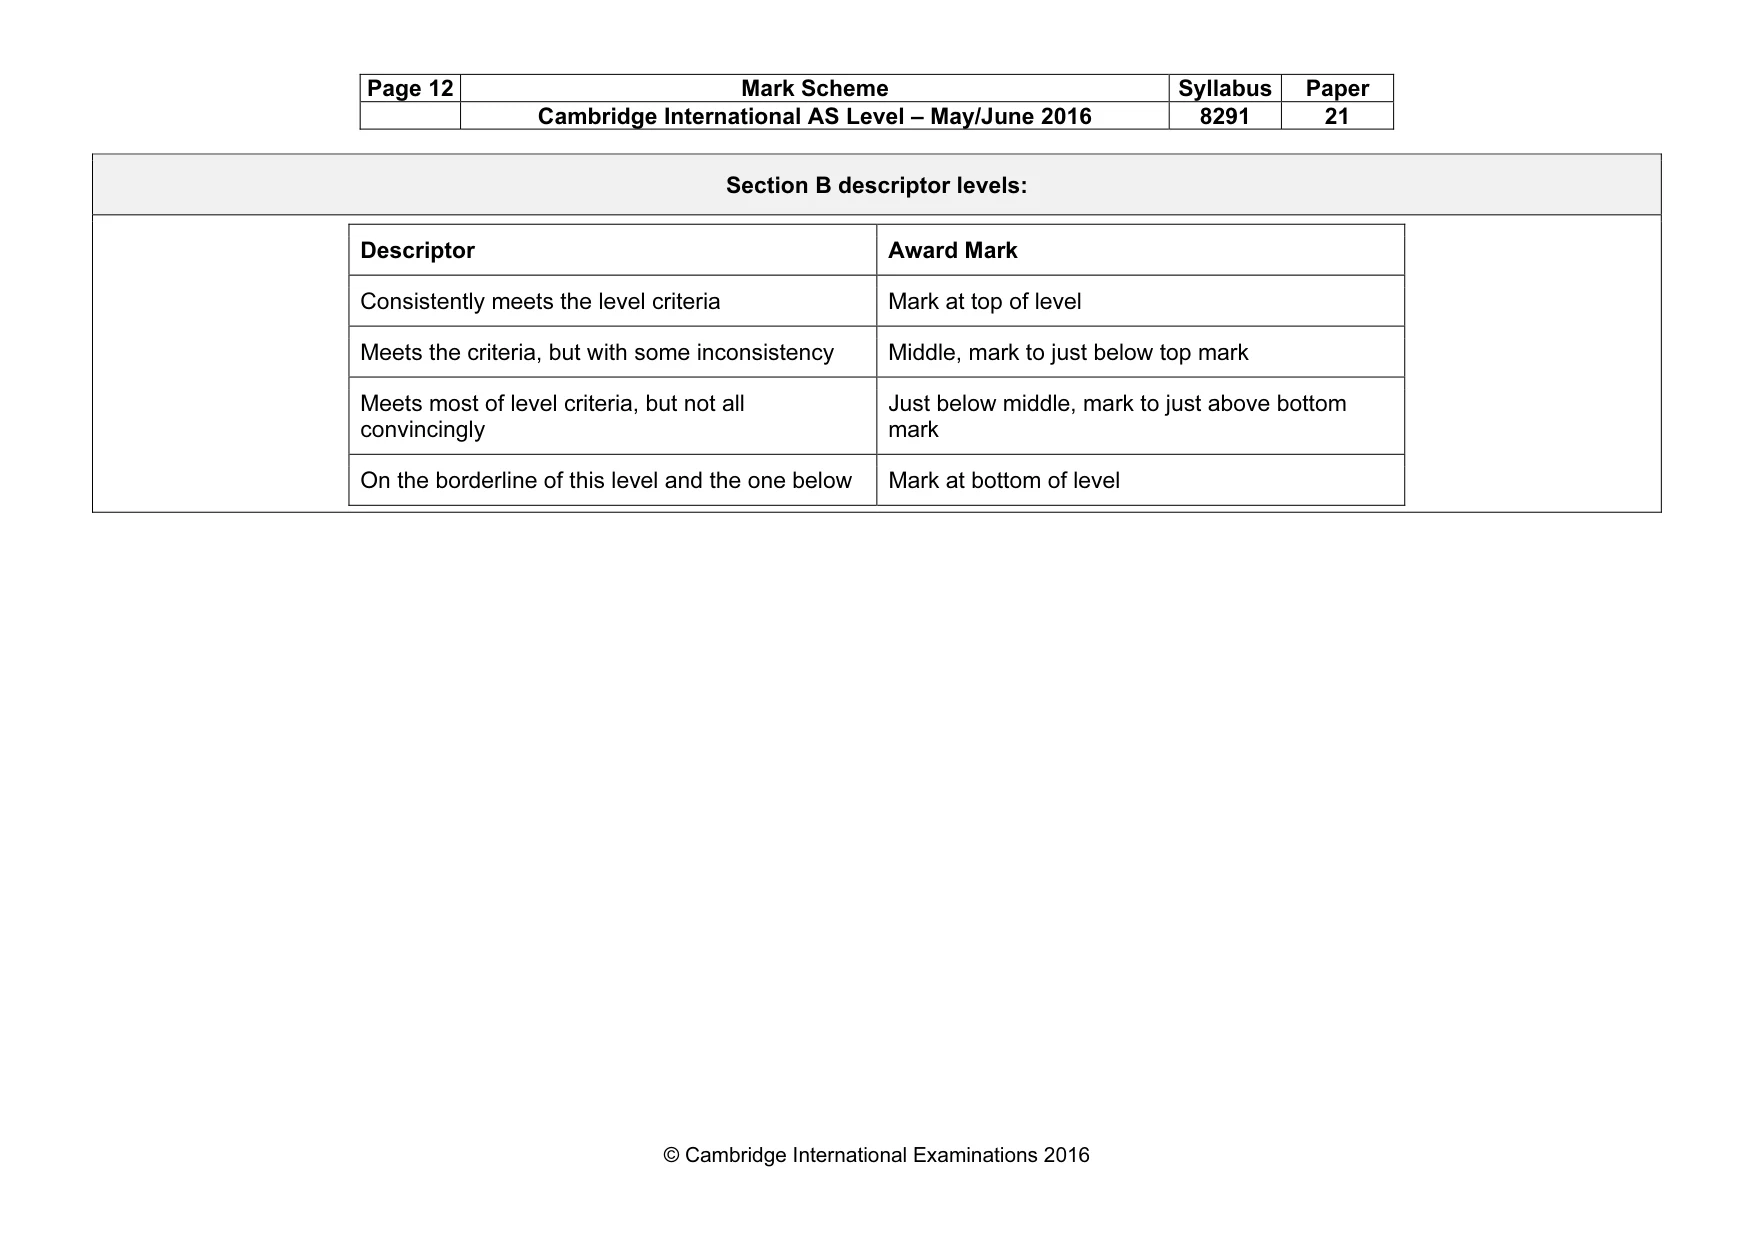
Page 12 Mark Scheme Syllabus Paper Cambridge International AS Level – May/June 2016 8291 21 © Cambridge International Examinations 2016 Section B descriptor levels: Descriptor Award Mark Consistently meets the level criteria Mark at top of level Meets the criteria, but with some inconsistency Middle, mark to just below top mark Meets most of level criteria, but not all convincingly Just below middle, mark to just above bottom mark On the borderline of this level and the one below Mark at bottom of level
Mark scheme, page 13
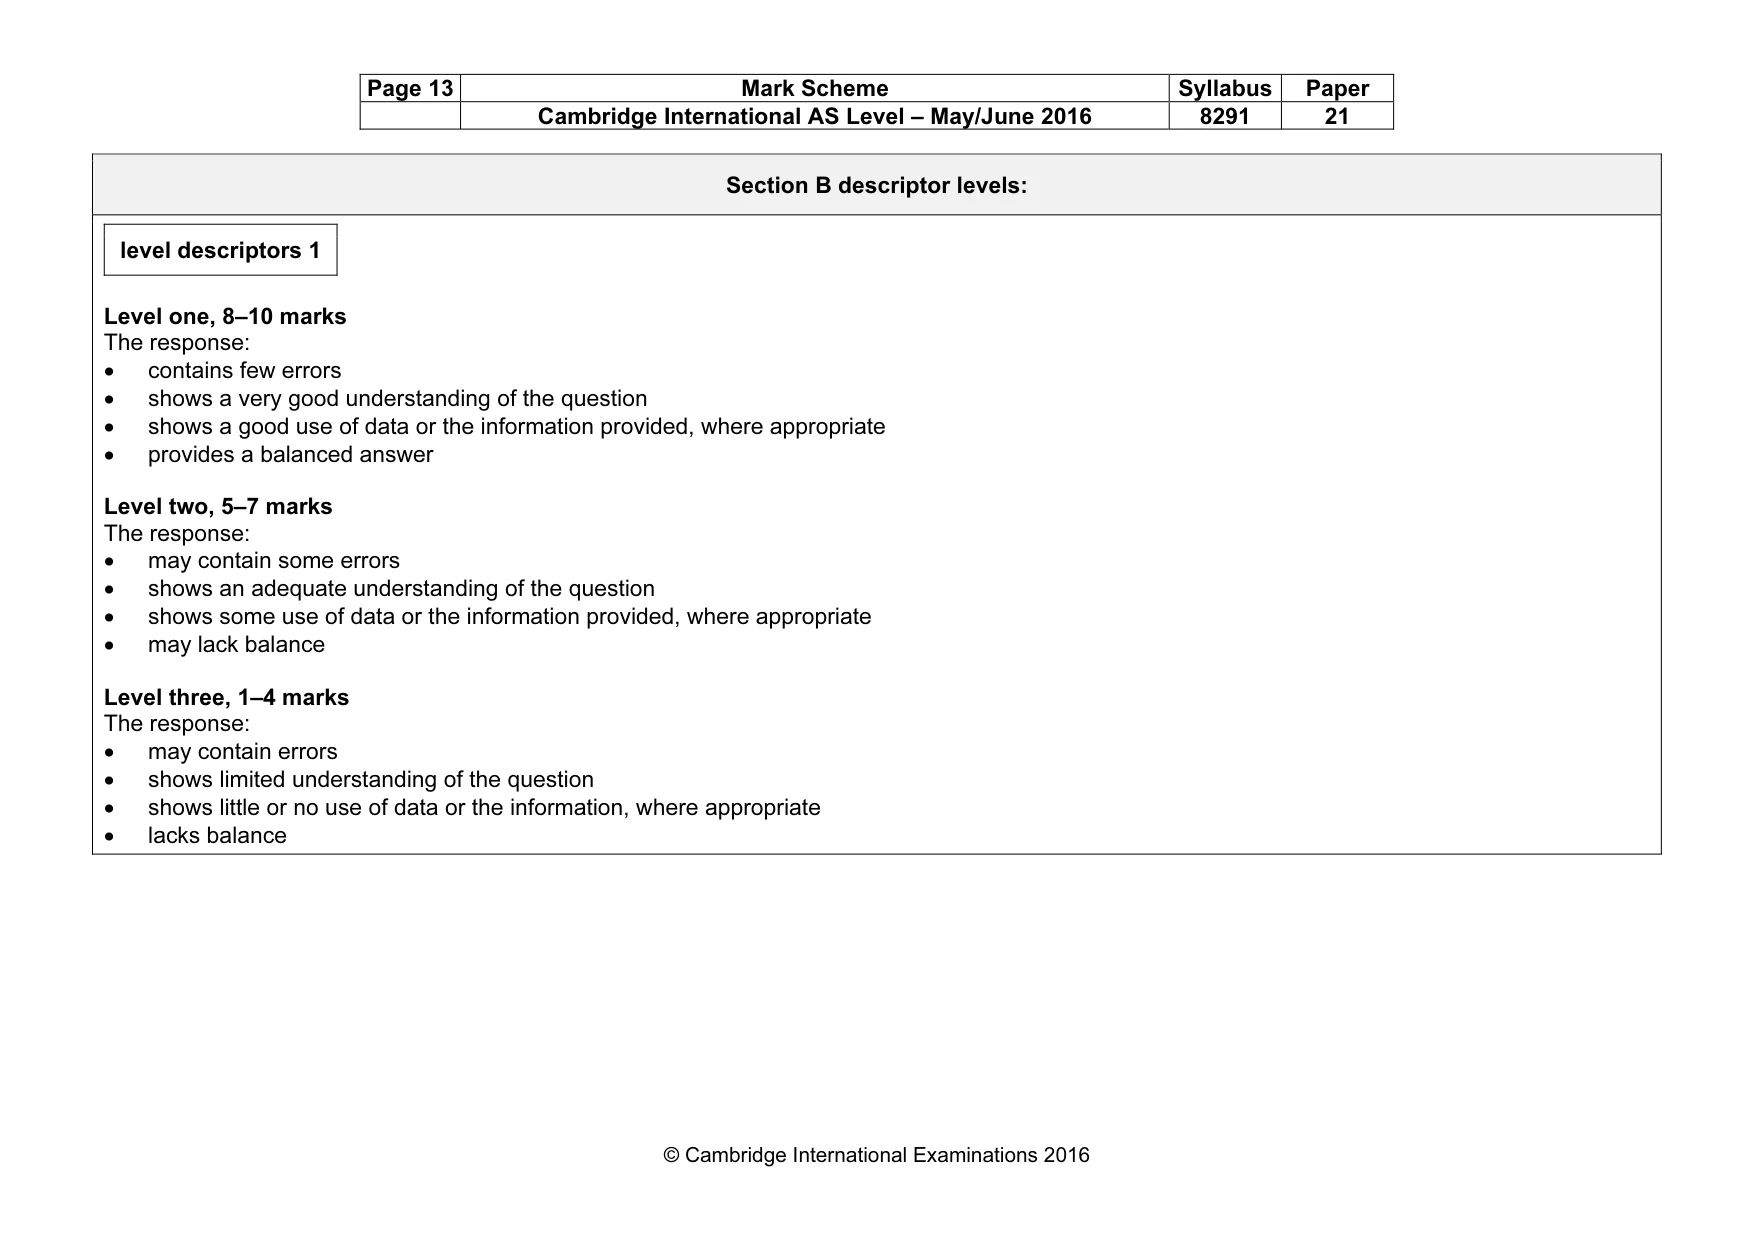
Page 13 Mark Scheme Syllabus Paper Cambridge International AS Level – May/June 2016 8291 21 © Cambridge International Examinations 2016 Section B descriptor levels: level descriptors 1 Level one, 8–10 marks The response: • contains few errors • shows a very good understanding of the question • shows a good use of data or the information provided, where appropriate • provides a balanced answer Level two, 5–7 marks The response: • may contain some errors • shows an adequate understanding of the question • shows some use of data or the information provided, where appropriate • may lack balance Level three, 1–4 marks The response: • may contain errors • shows limited understanding of the question • shows little or no use of data or the information, where appropriate • lacks balance
Mark scheme, page 14
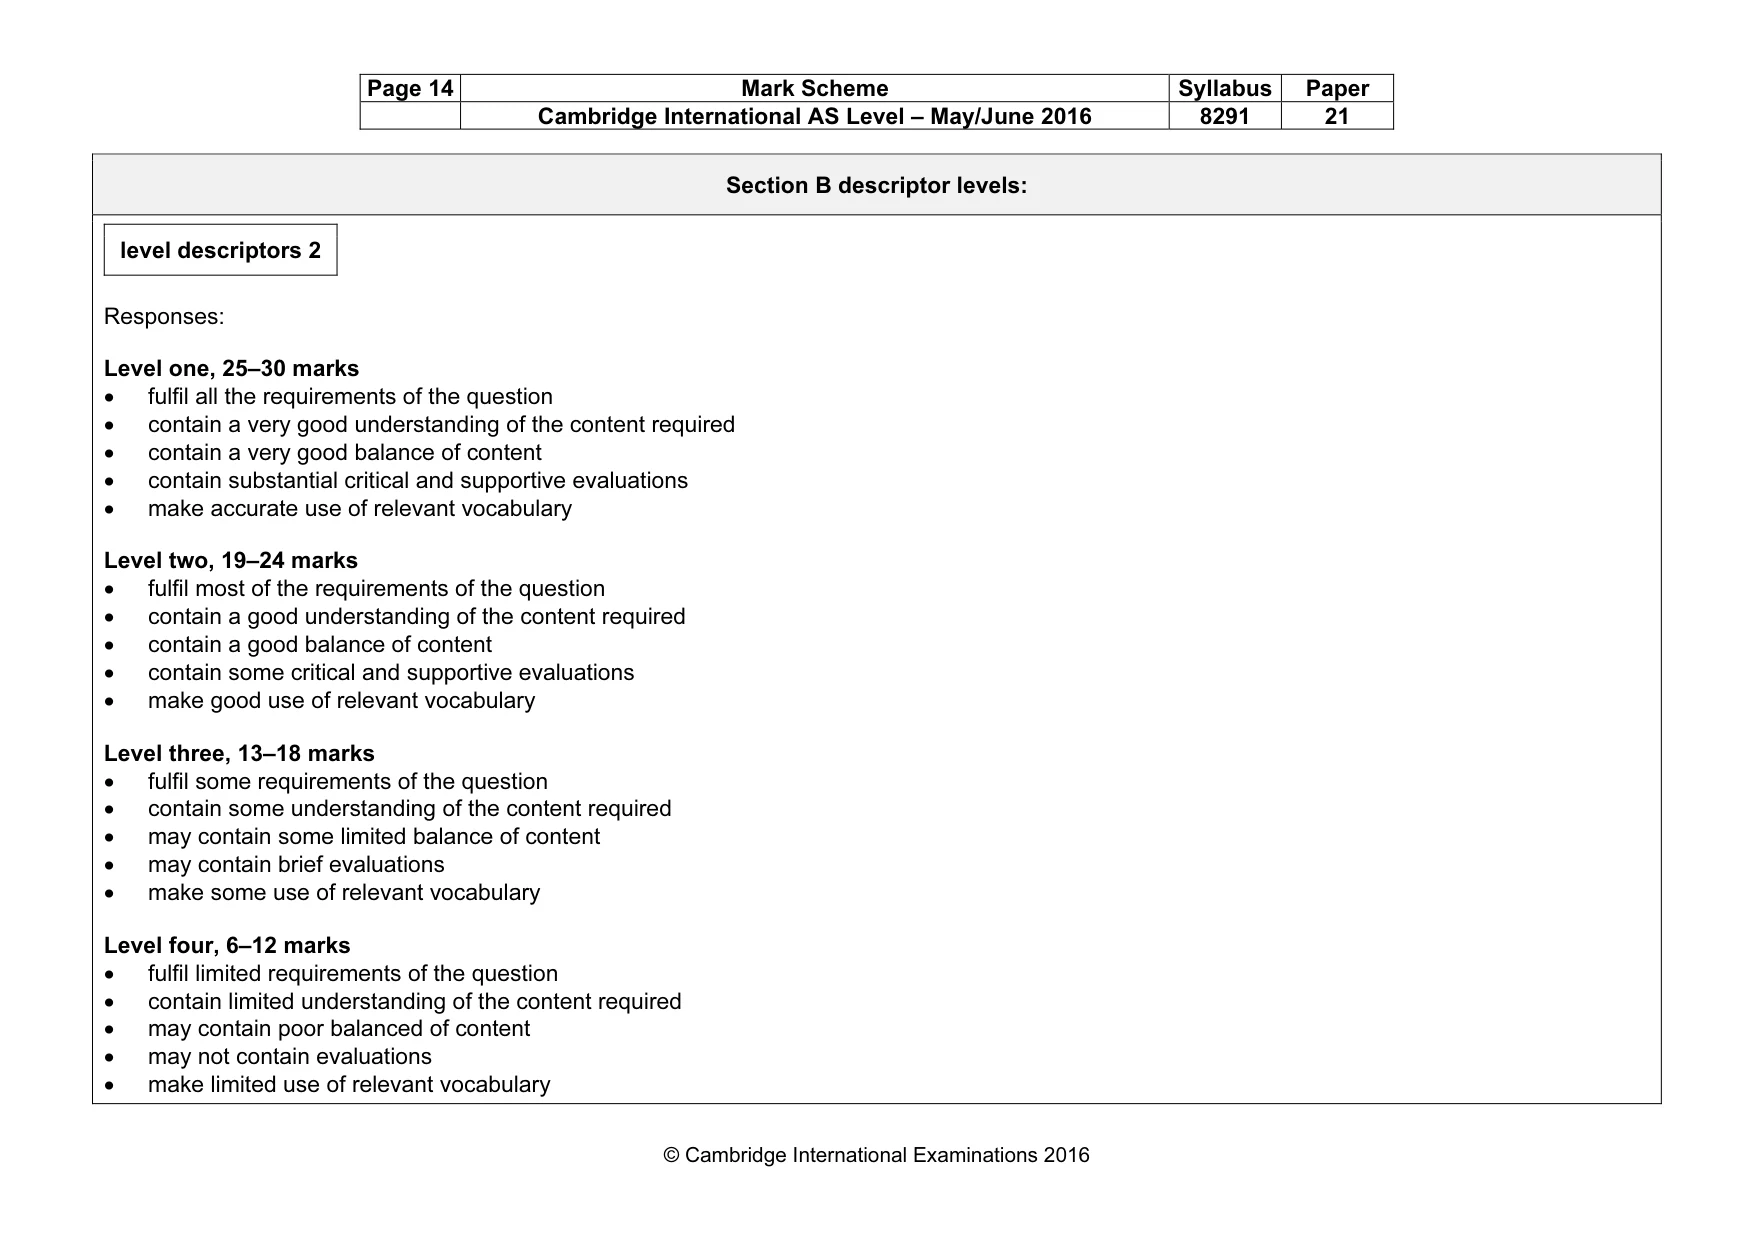
Page 14 Mark Scheme Syllabus Paper Cambridge International AS Level – May/June 2016 8291 21 © Cambridge International Examinations 2016 Section B descriptor levels: level descriptors 2 Responses: Level one, 25–30 marks • fulfil all the requirements of the question • contain a very good understanding of the content required • contain a very good balance of content • contain substantial critical and supportive evaluations • make accurate use of relevant vocabulary Level two, 19–24 marks • fulfil most of the requirements of the question • contain a good understanding of the content required • contain a good balance of content • contain some critical and supportive evaluations • make good use of relevant vocabulary Level three, 13–18 marks • fulfil some requirements of the question • contain some understanding of the content required • may contain some limited balance of content • may contain brief evaluations • make some use of relevant vocabulary Level four, 6–12 marks • fulfil limited requirements of the question • contain limited understanding of the content required • may contain poor balanced of content • may not contain evaluations • make limited use of relevant vocabulary
Mark scheme, page 15
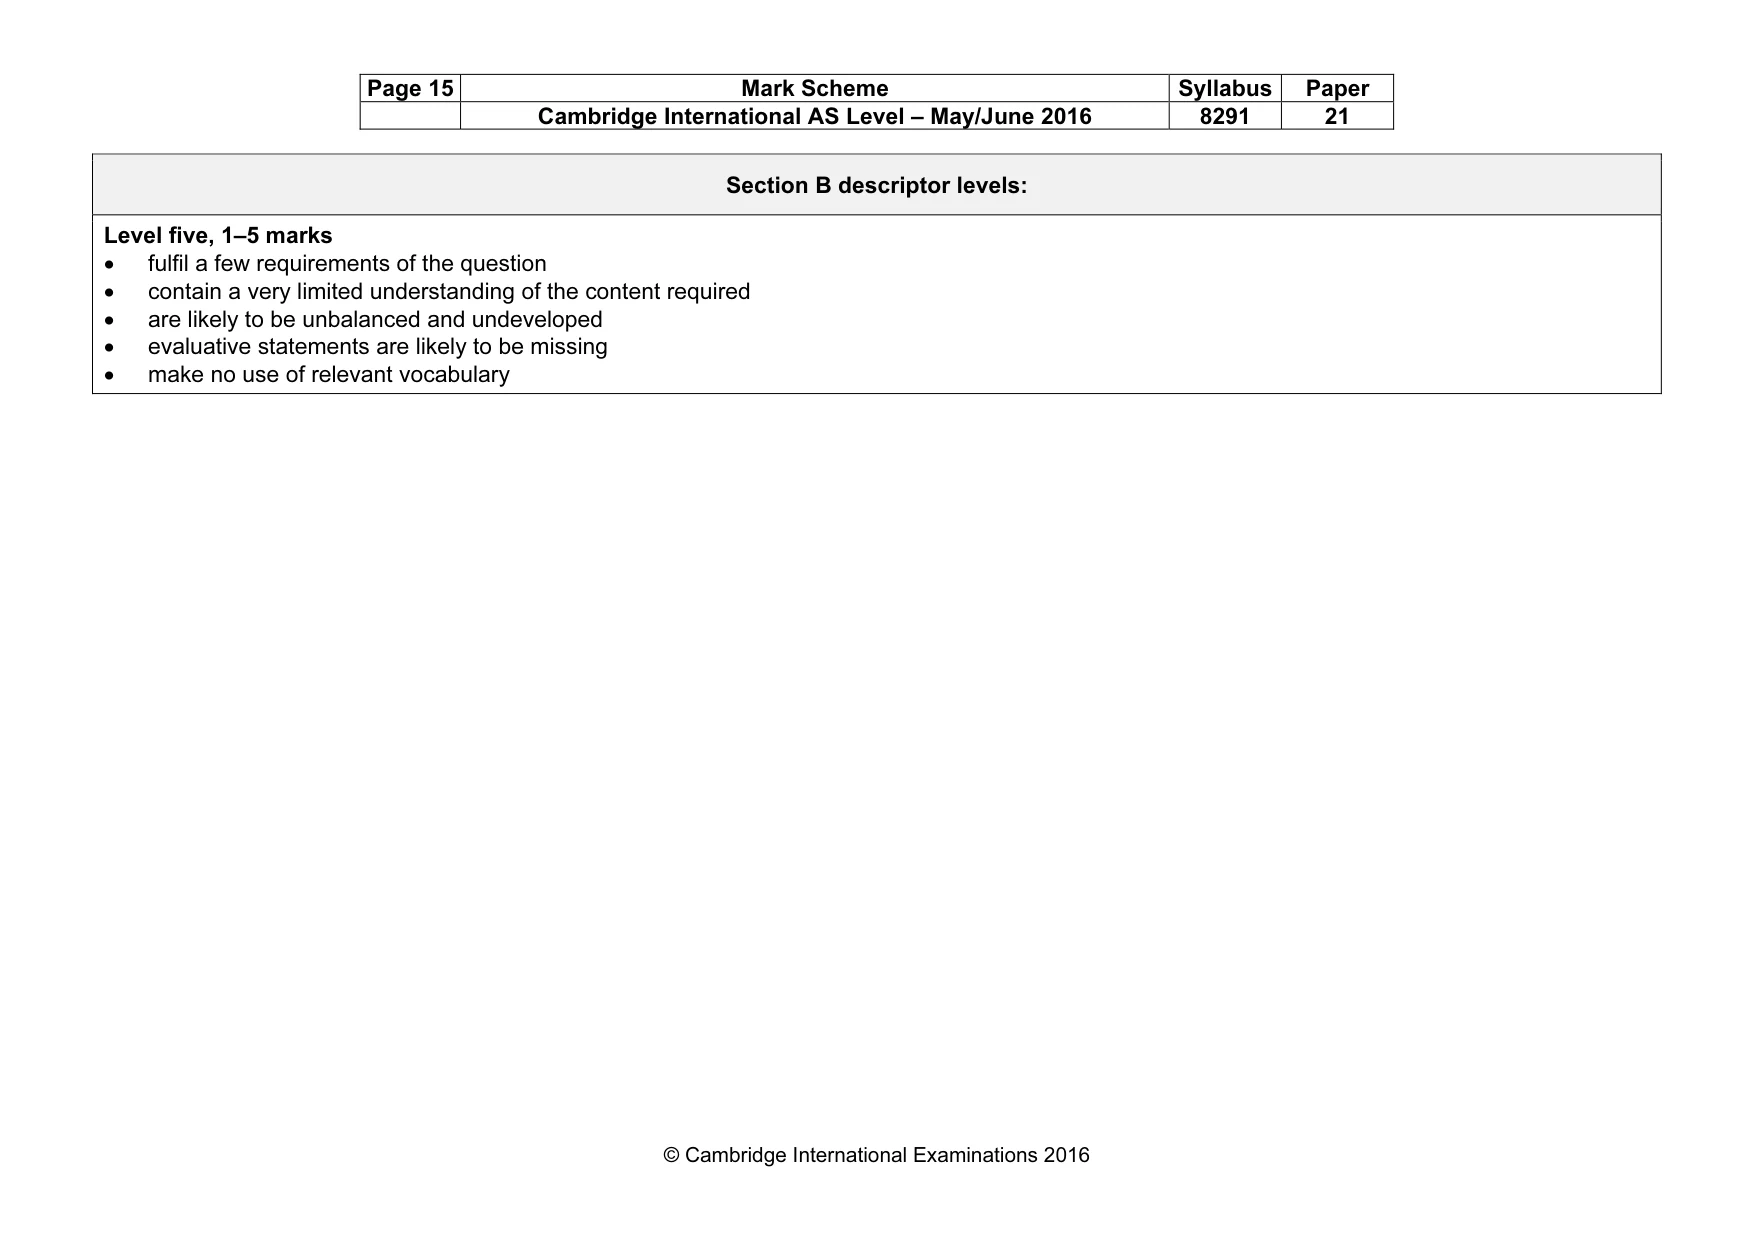
Page 15 Mark Scheme Syllabus Paper Cambridge International AS Level – May/June 2016 8291 21 © Cambridge International Examinations 2016 Section B descriptor levels: Level five, 1–5 marks • fulfil a few requirements of the question • contain a very limited understanding of the content required • are likely to be unbalanced and undeveloped • evaluative statements are likely to be missing • make no use of relevant vocabulary
What you needed in this session
Cambridge’s own grade thresholds for 2016 May/June, Paper 2 · Variant 1. A higher threshold means an easier paper — the bar moves with how the cohort did.