Cambridge A Level Environmental Management (AS only) 8291 — 2011 May/June Paper 2 · Variant 2
8291/22/M/J/11 · 80 marks · ≈90 min
The question paper and its mark scheme, free to read here and free to download. This is Cambridge’s own paper, exactly as it was sat.
Question paper12 pages

Mark scheme11 pages
Answers below. Sit the paper first if you are practising.
Paper as text
Question paper, page 1
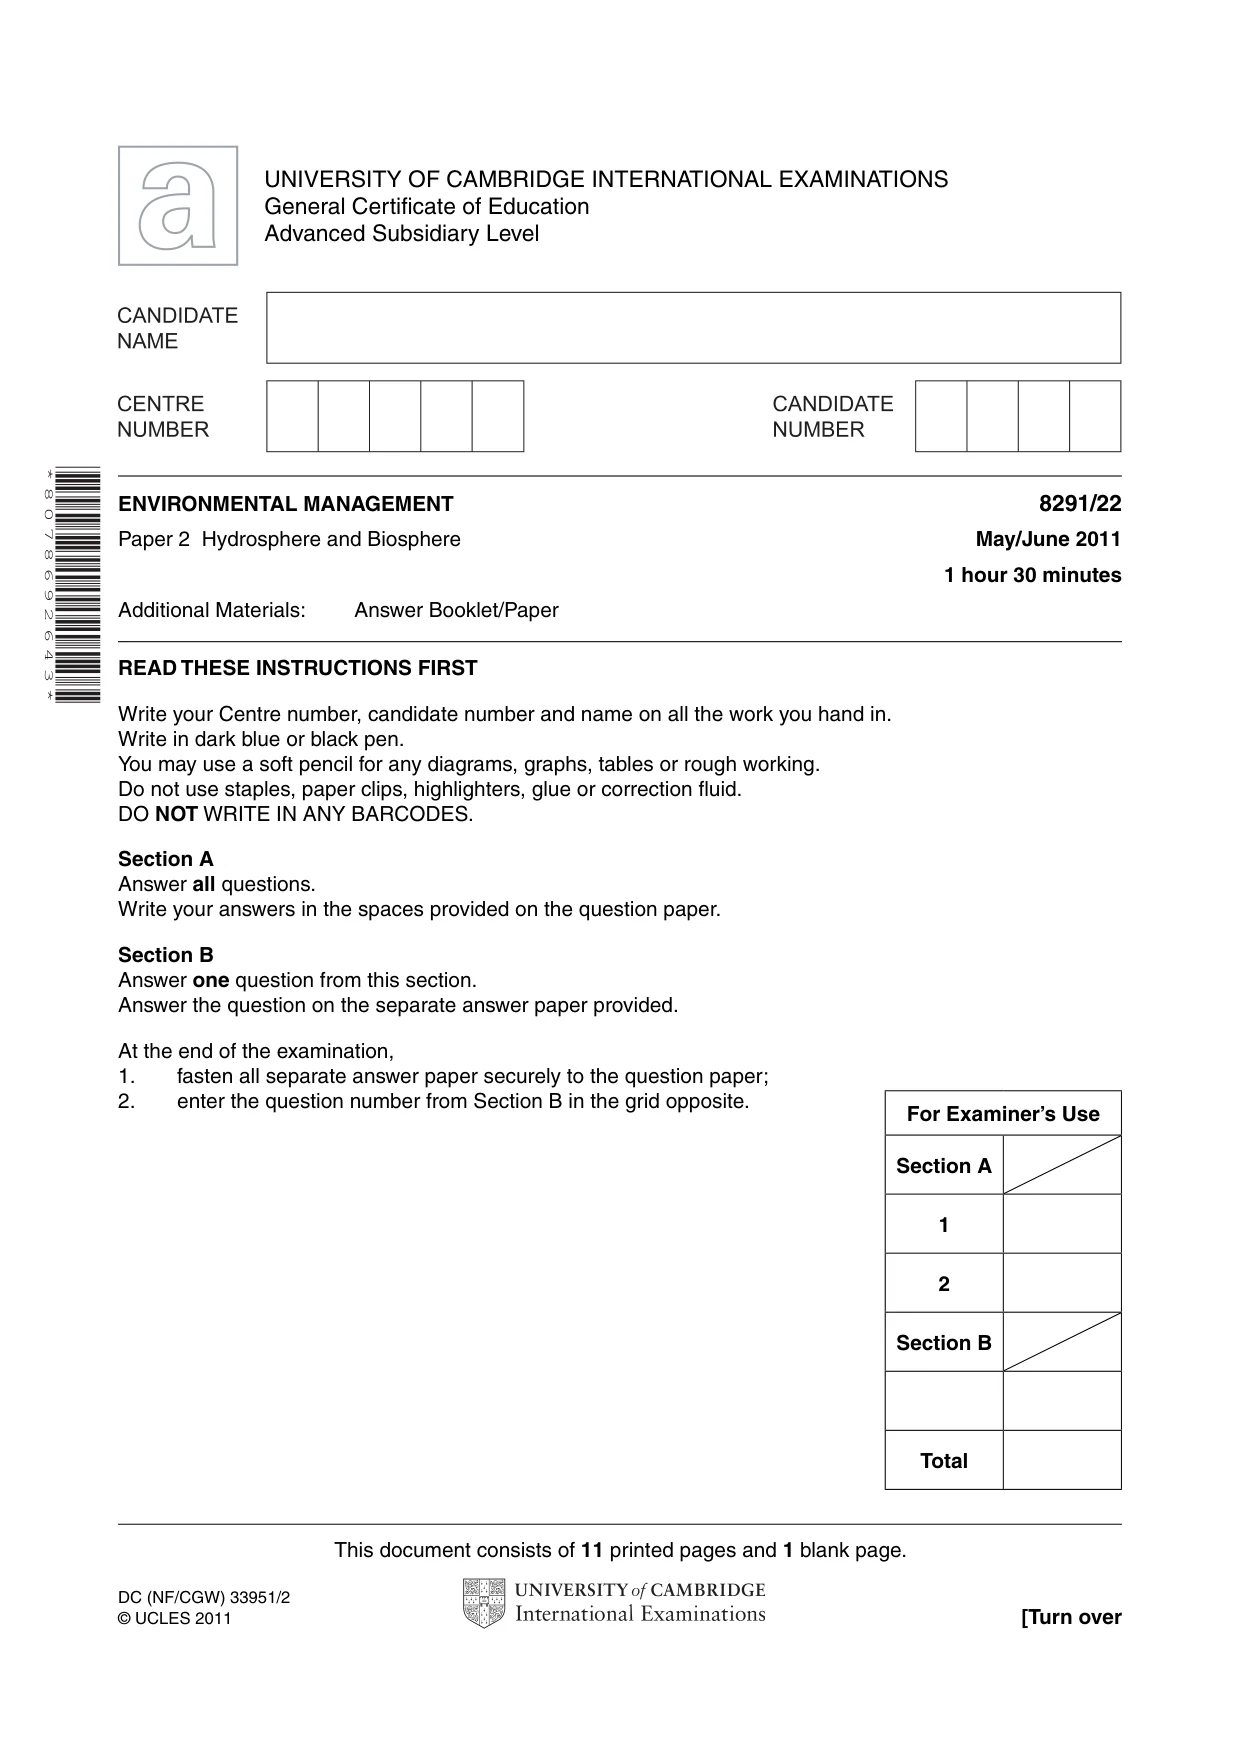
This document consists of 11 printed pages and 1 blank page. DC (NF/CGW) 33951/2 © UCLES 2011 [Turn over UNIVERSITY OF CAMBRIDGE INTERNATIONAL EXAMINATIONS General Certificate of Education Advanced Subsidiary Level * 8 0 7 8 6 9 2 6 4 3 * ENVIRONMENTAL MANAGEMENT 8291/22 Paper 2 Hydrosphere and Biosphere May/June 2011 1 hour 30 minutes Additional Materials: Answer Booklet/Paper READ THESE INSTRUCTIONS FIRST Write your Centre number, candidate number and name on all the work you hand in. Write in dark blue or black pen. You may use a soft pencil for any diagrams, graphs, tables or rough working. Do not use staples, paper clips, highlighters, glue or correction fluid. DO NOT WRITE IN ANY BARCODES. Section A Answer all questions. Write your answers in the spaces provided on the question paper. Section B Answer one question from this section. Answer the question on the separate answer paper provided. At the end of the examination, 1. fasten all separate answer paper securely to the question paper; 2. enter the question number from Section B in the grid opposite. For Examiner’s Use Section A 1 2 Section B Total
Question paper, page 2
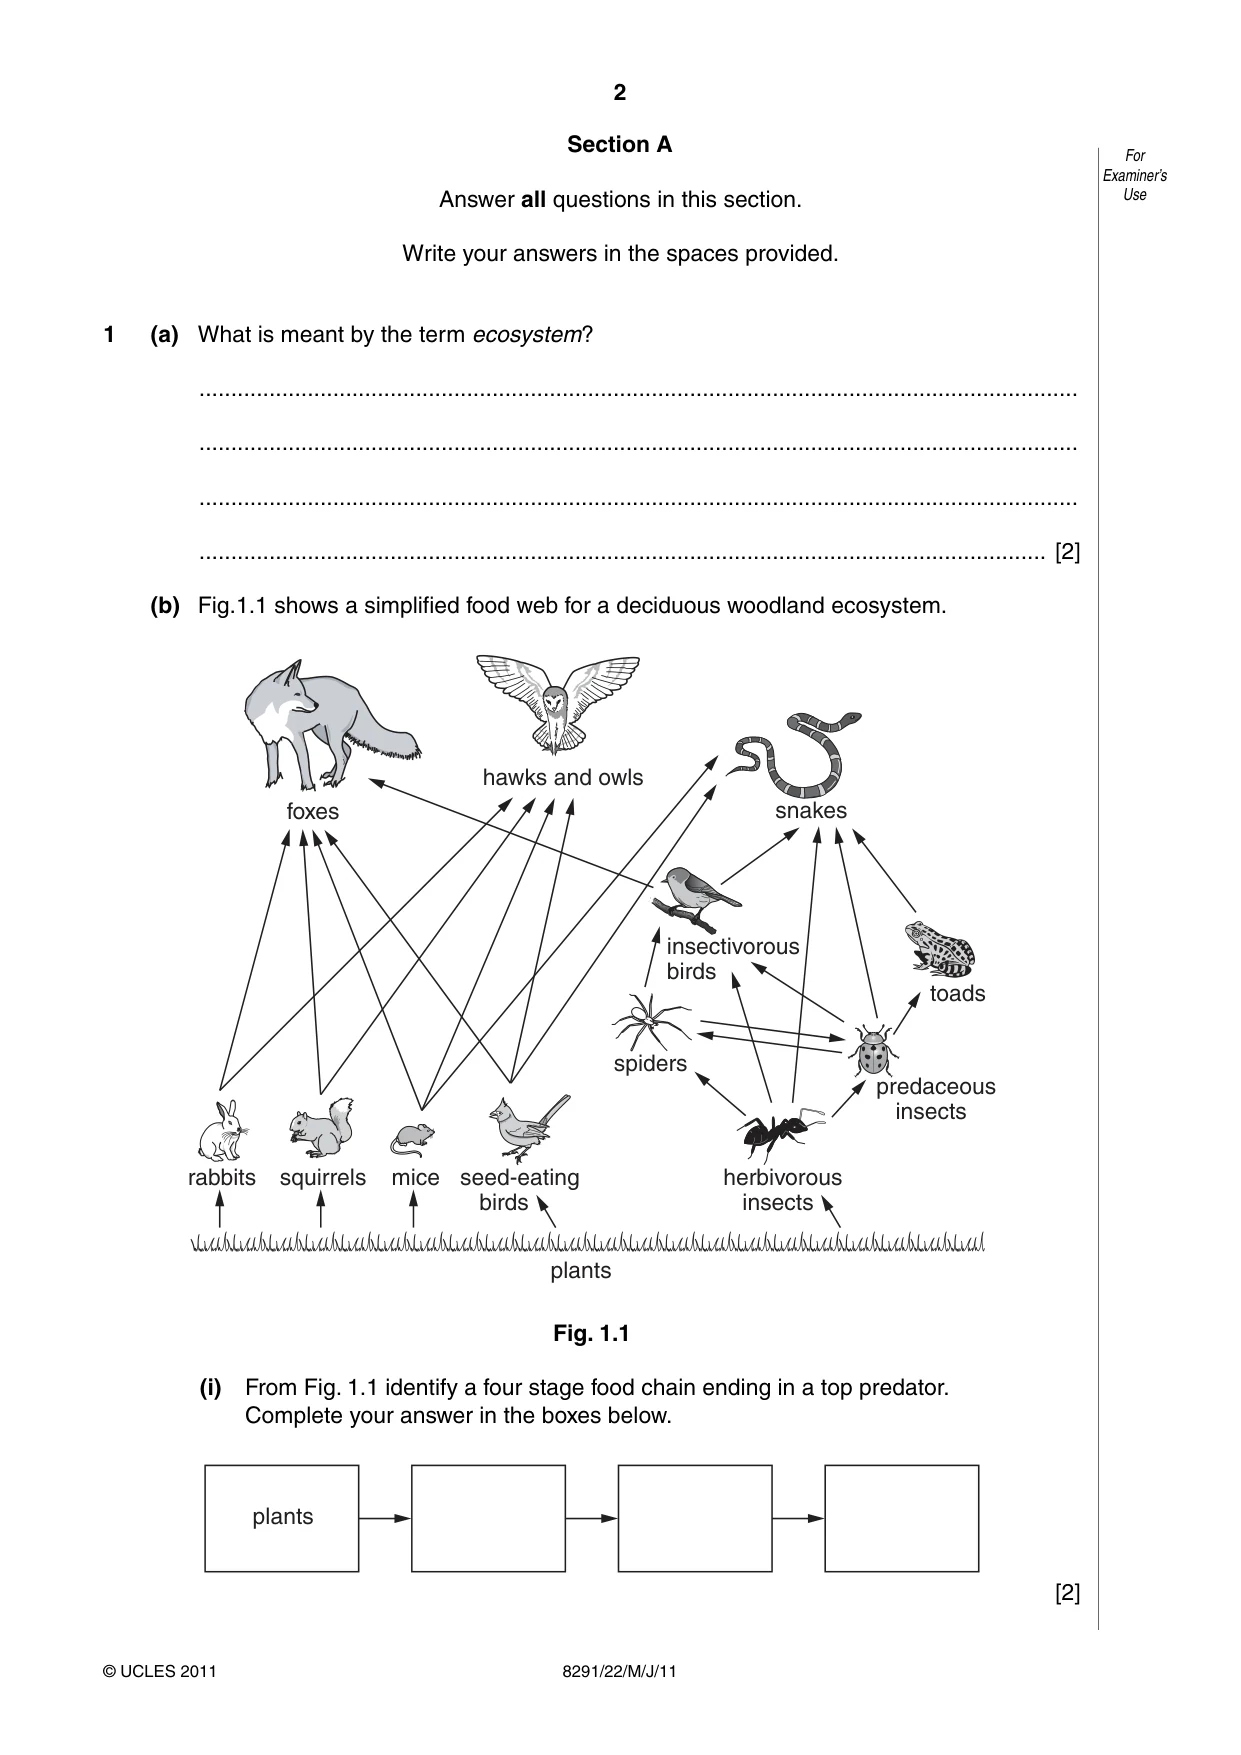
2 8291/22/M/J/11 © UCLES 2011 For Examiner’s Use Section A Answer all questions in this section. Write your answers in the spaces provided. 1 (a) What is meant by the term ecosystem? … … … … [2] (b) Fig.1.1 shows a simplified food web for a deciduous woodland ecosystem. rabbits foxes hawks and owls squirrels mice seed-eating birds herbivorous insects predaceous insects toads snakes spiders plants insectivorous birds Fig. 1.1 (i) From Fig. 1.1 identify a four stage food chain ending in a top predator. Complete your answer in the boxes below. plants [2]
Question paper, page 3
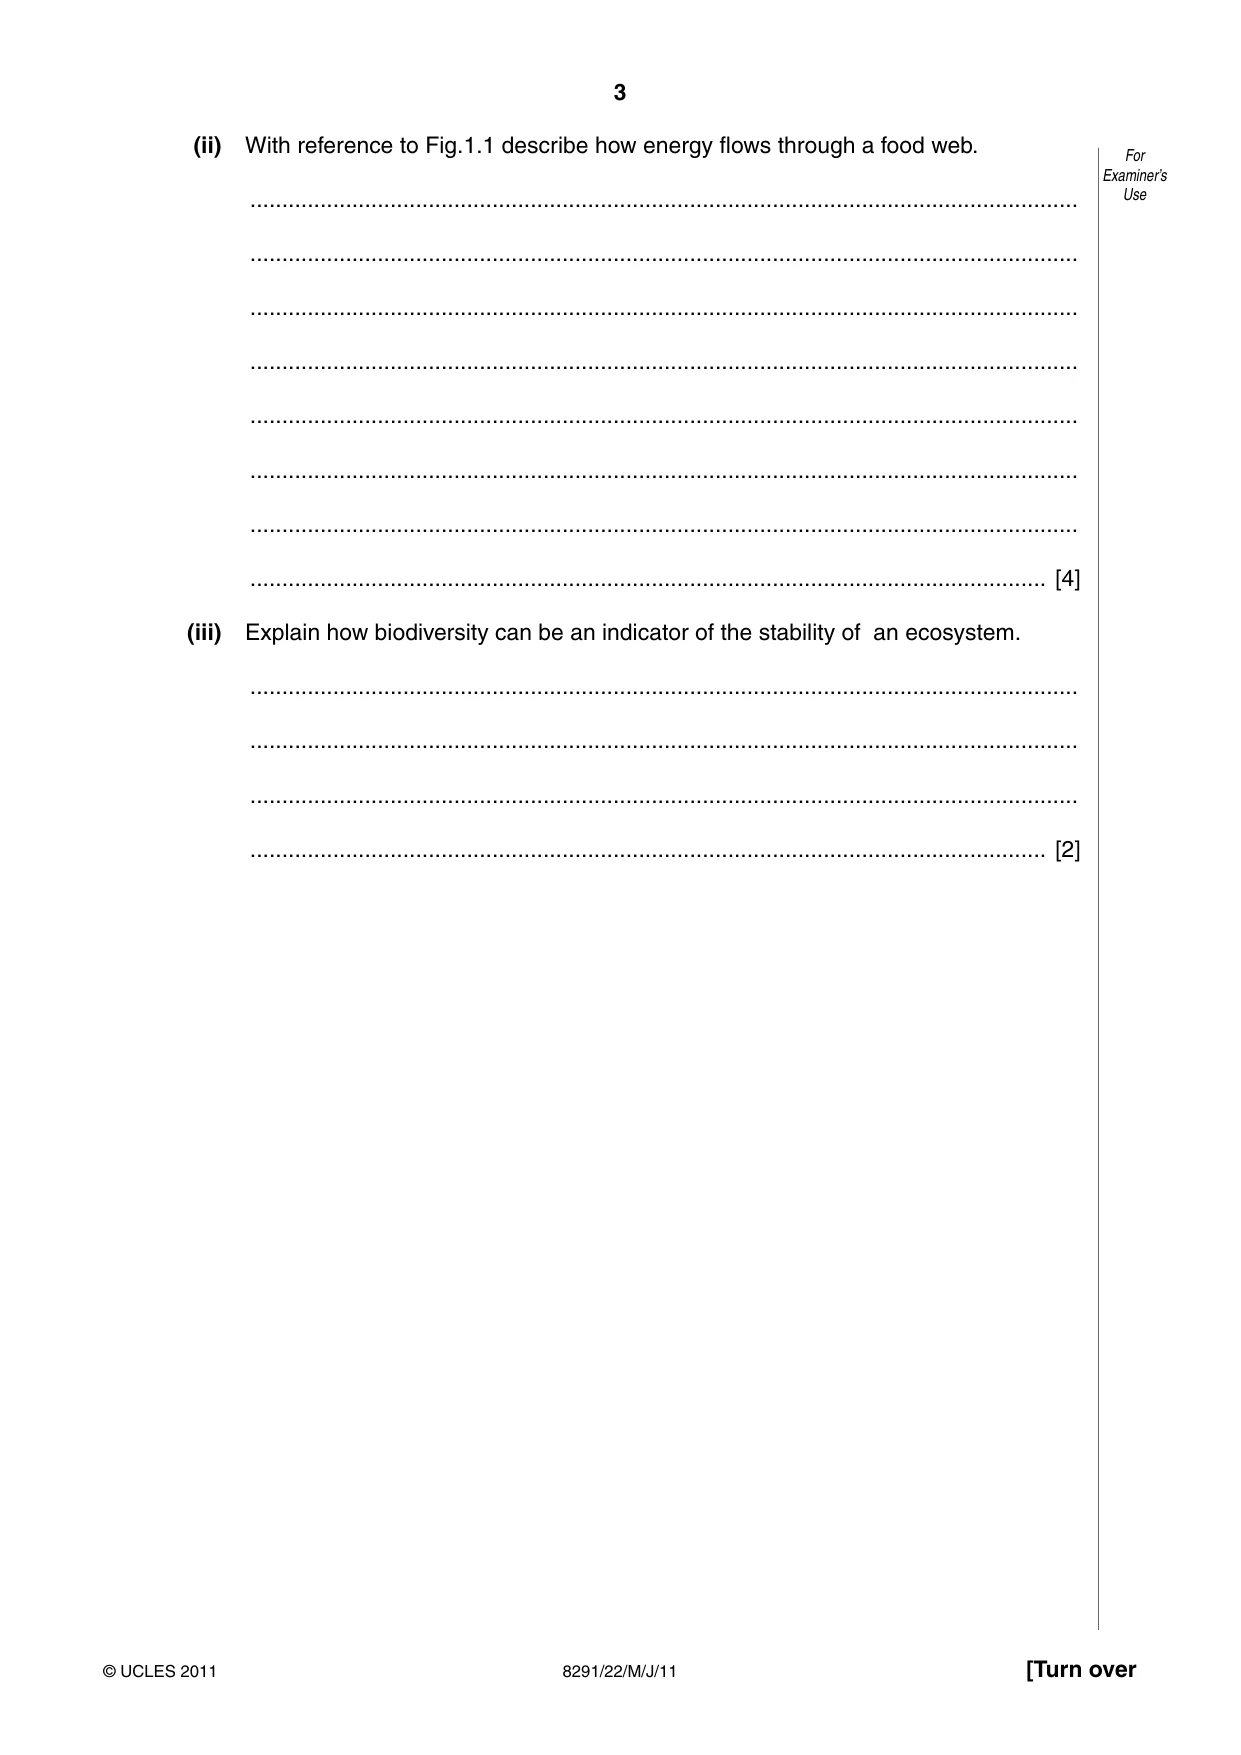
3 8291/22/M/J/11 © UCLES 2011 [Turn over For Examiner’s Use (ii) With reference to Fig.1.1 describe how energy flows through a food web. … … … … … … … … [4] (iii) Explain how biodiversity can be an indicator of the stability of an ecosystem. … … … … [2]
Question paper, page 4
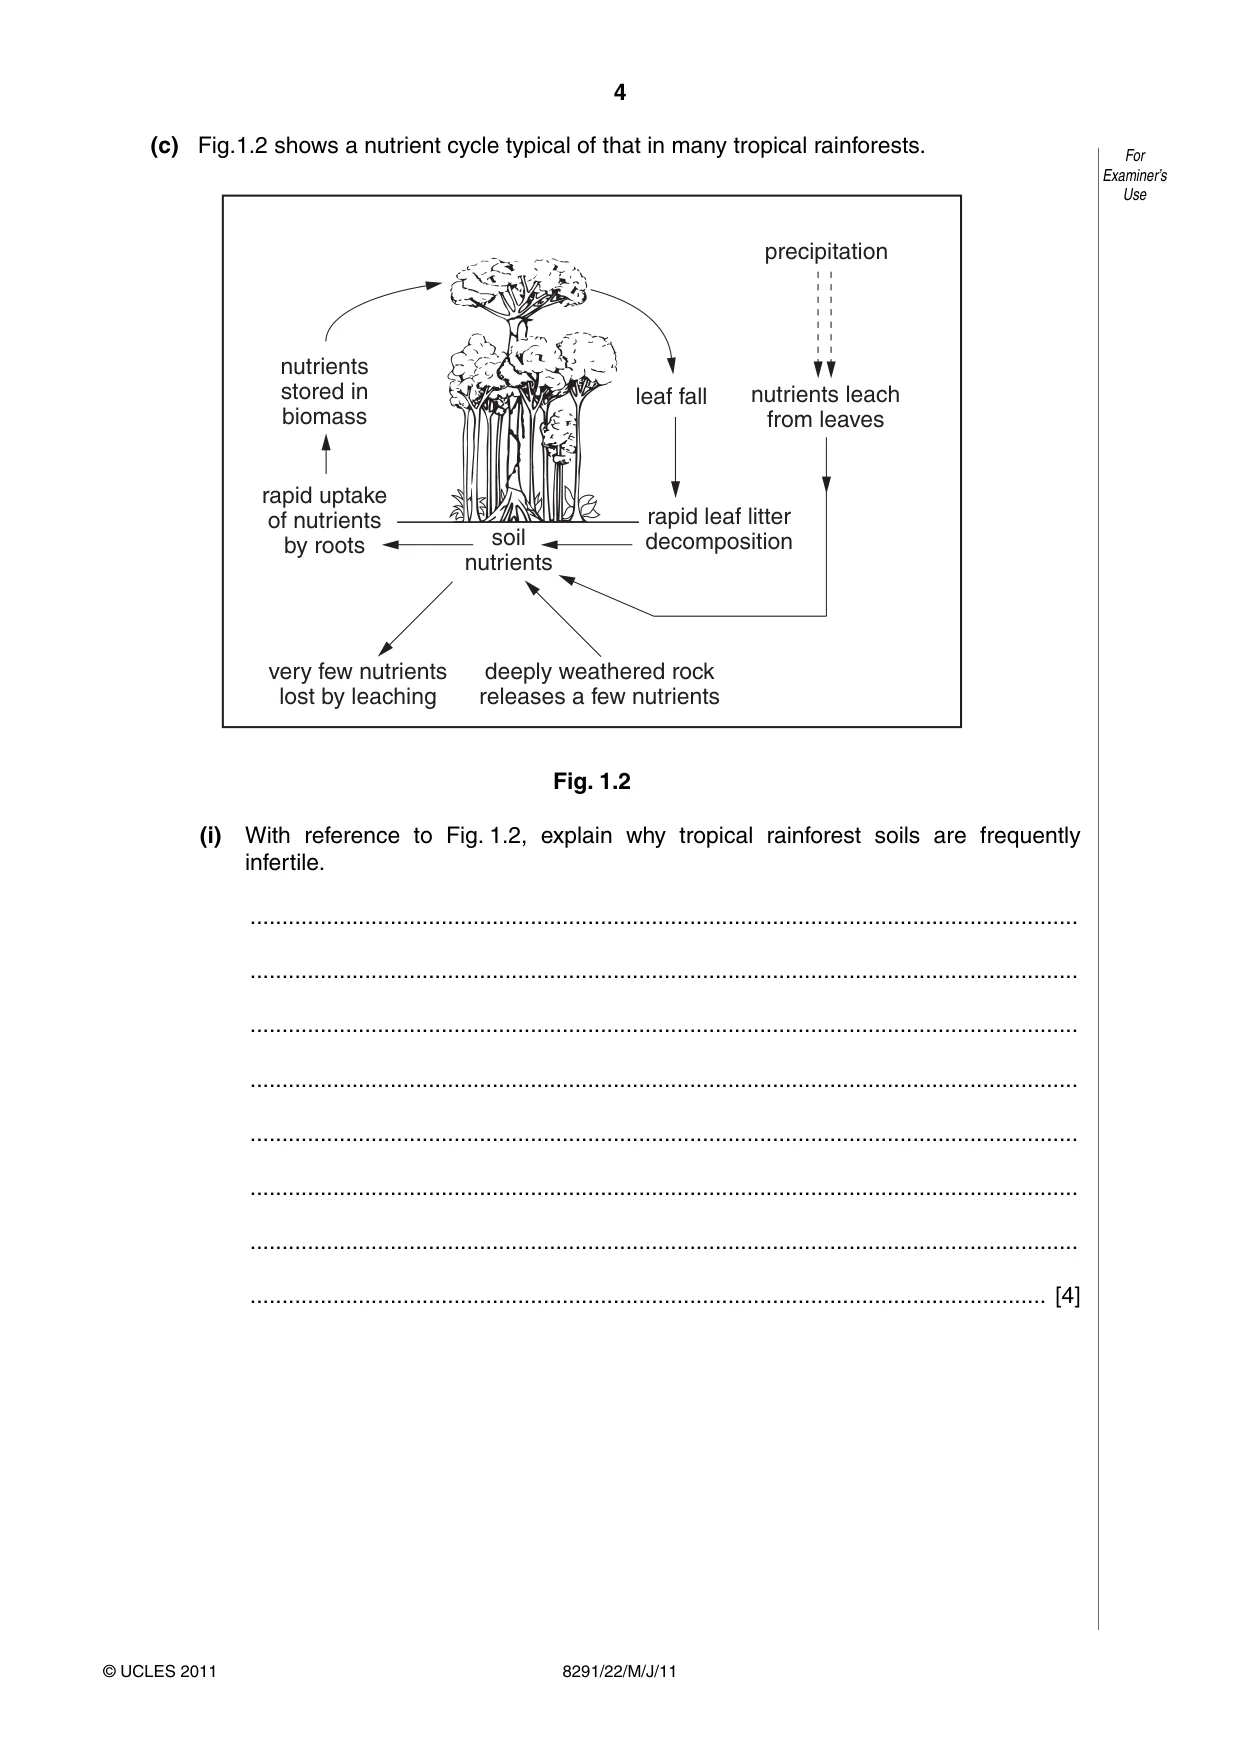
4 8291/22/M/J/11 © UCLES 2011 For Examiner’s Use (c) Fig.1.2 shows a nutrient cycle typical of that in many tropical rainforests. soil nutrients rapid leaf litter decomposition precipitation very few nutrients lost by leaching deeply weathered rock releases a few nutrients nutrients leach from leaves rapid uptake of nutrients by roots nutrients stored in biomass leaf fall Fig. 1.2 (i) With reference to Fig. 1.2, explain why tropical rainforest soils are frequently infertile. … … … … … … … … [4]
Question paper, page 5
5 8291/22/M/J/11 © UCLES 2011 [Turn over For Examiner’s Use (ii) Describe the effects that deforestation would have on the nutrient flows shown in Fig. 1.2. … … … … … … … … … … … … … … [6] [Total: 20]
Question paper, page 6
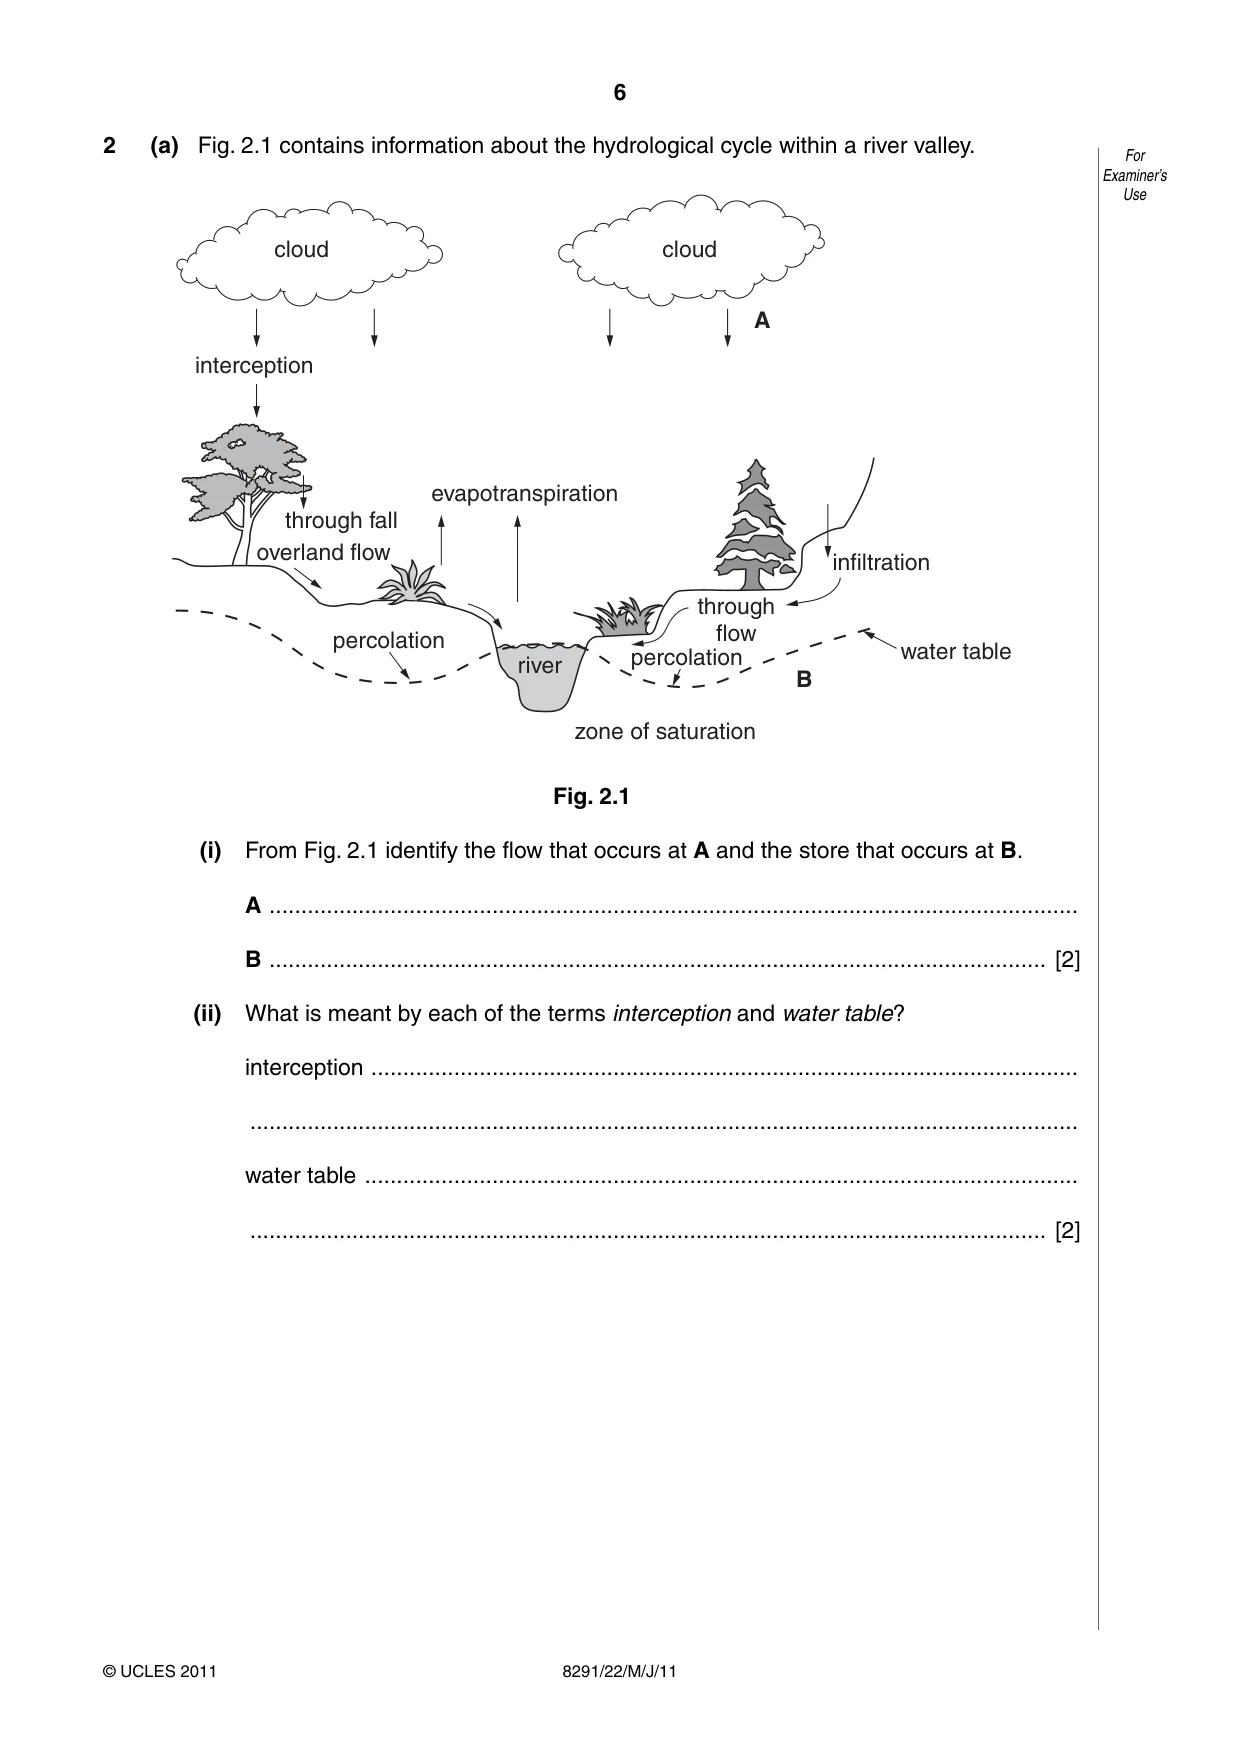
6 8291/22/M/J/11 © UCLES 2011 For Examiner’s Use 2 (a) Fig. 2.1 contains information about the hydrological cycle within a river valley. cloud cloud infiltration through flow A B interception through fall evapotranspiration river percolation percolation water table zone of saturation overland flow Fig. 2.1 (i) From Fig. 2.1 identify the flow that occurs at A and the store that occurs at B. A … B … [2] (ii) What is meant by each of the terms interception and water table? interception … … water table … … [2]
Question paper, page 7
7 8291/22/M/J/11 © UCLES 2011 [Turn over For Examiner’s Use (iii) Describe how the hydrological cycle shown in Fig. 2.1 might respond: during a long dry summer, … … … … … … during a period of prolonged rainfall. … … … … … … [6]
Question paper, page 8
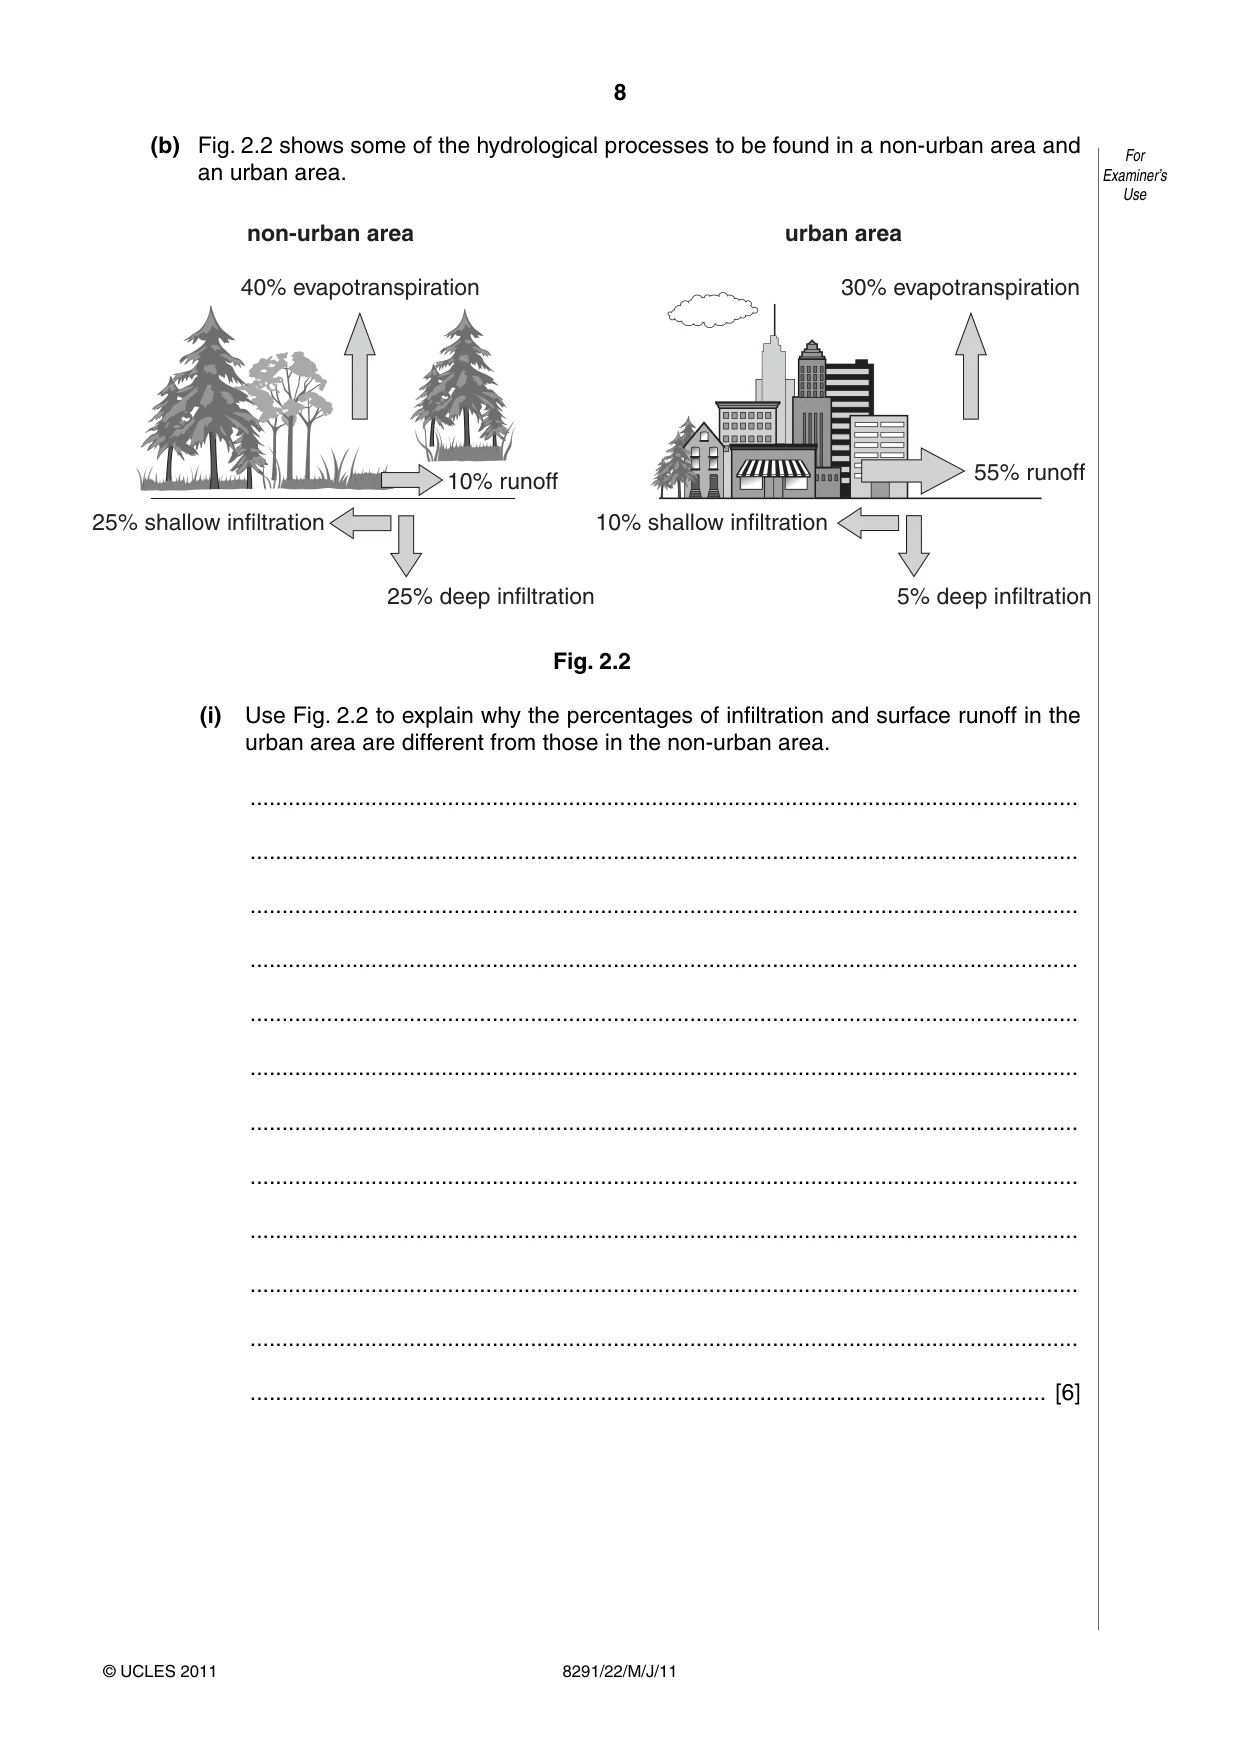
8 8291/22/M/J/11 © UCLES 2011 For Examiner’s Use (b) Fig. 2.2 shows some of the hydrological processes to be found in a non-urban area and an urban area. non-urban area 40% evapotranspiration 30% evapotranspiration urban area 10% runoff 55% runoff 25% shallow infiltration 25% deep infiltration 10% shallow infiltration 5% deep infiltration Fig. 2.2 (i) Use Fig. 2.2 to explain why the percentages of infiltration and surface runoff in the urban area are different from those in the non-urban area. … … … … … … … … … … … … [6]
Question paper, page 9
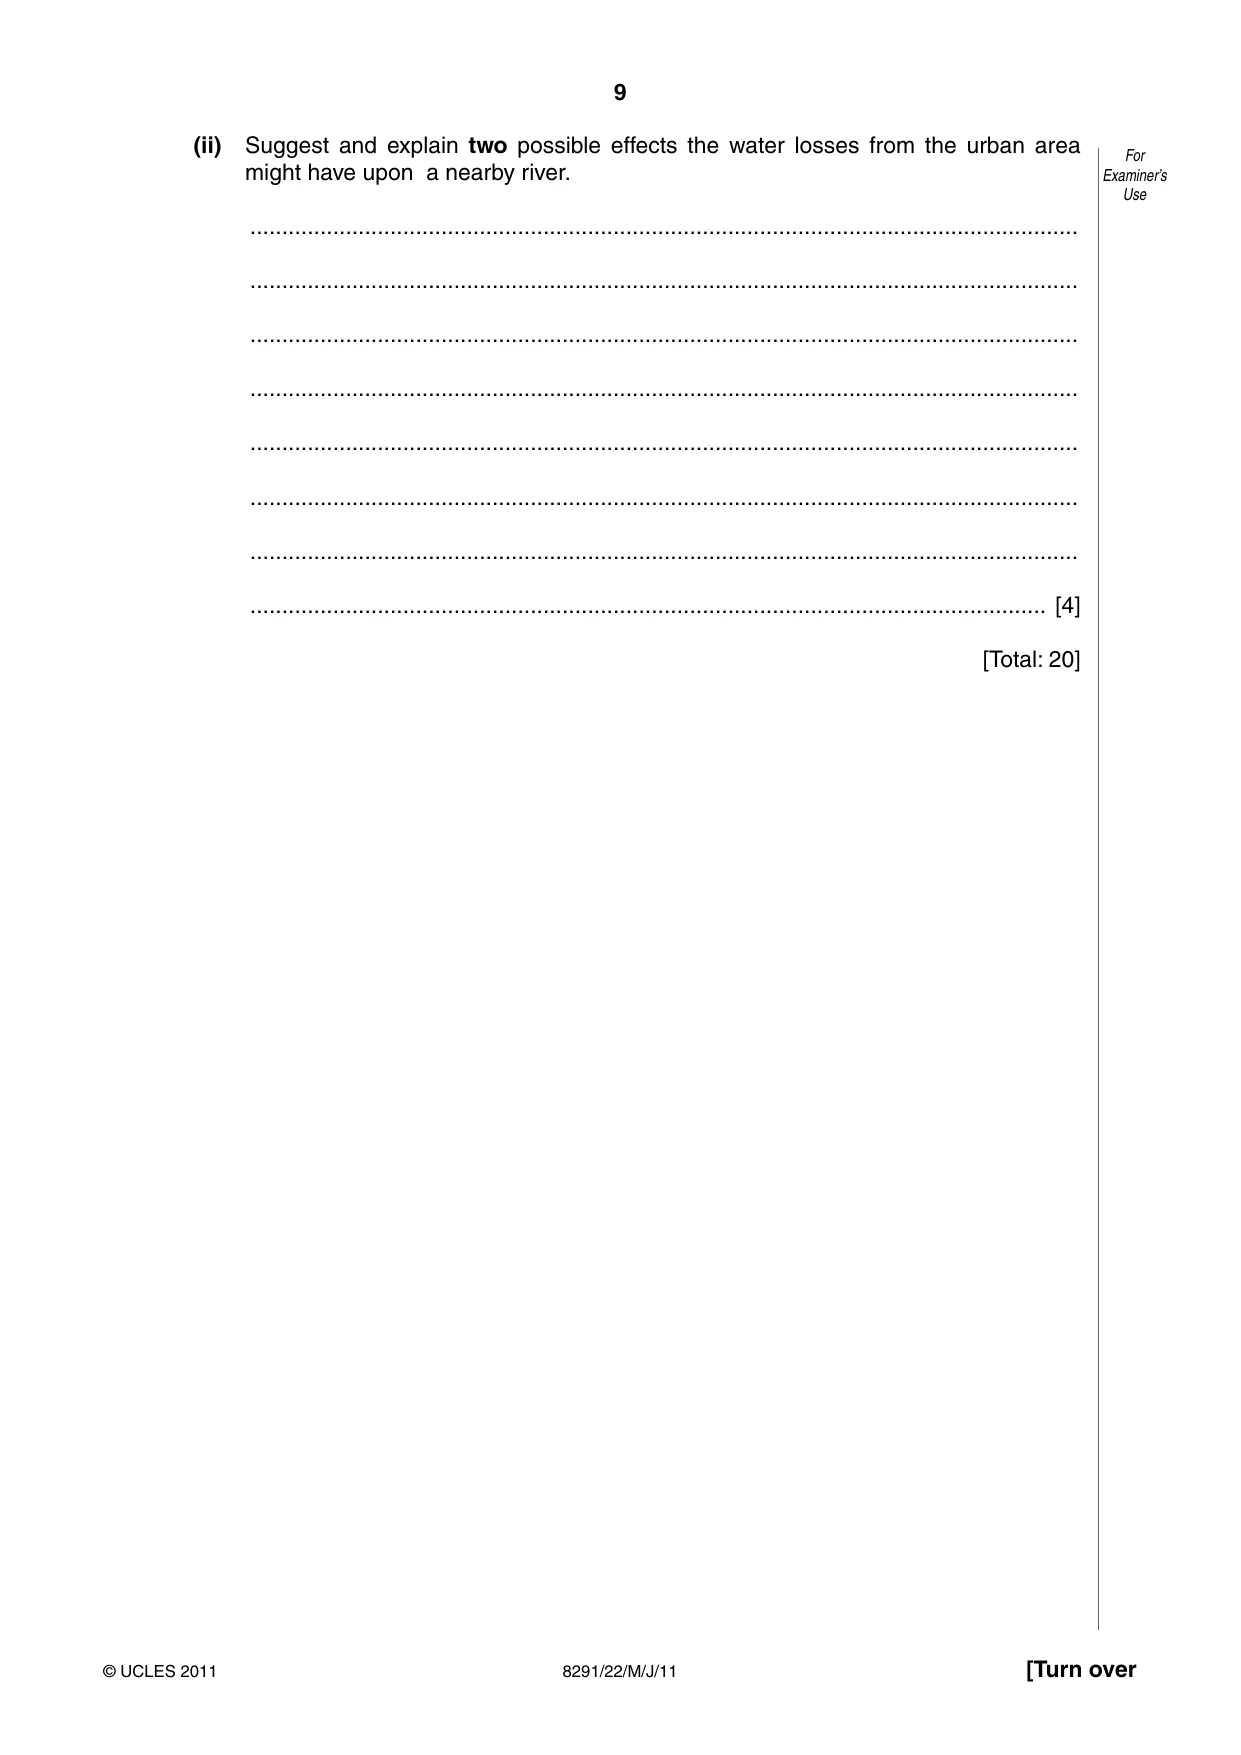
9 8291/22/M/J/11 © UCLES 2011 [Turn over For Examiner’s Use (ii) Suggest and explain two possible effects the water losses from the urban area might have upon a nearby river. … … … … … … … … [4] [Total: 20]
Question paper, page 10
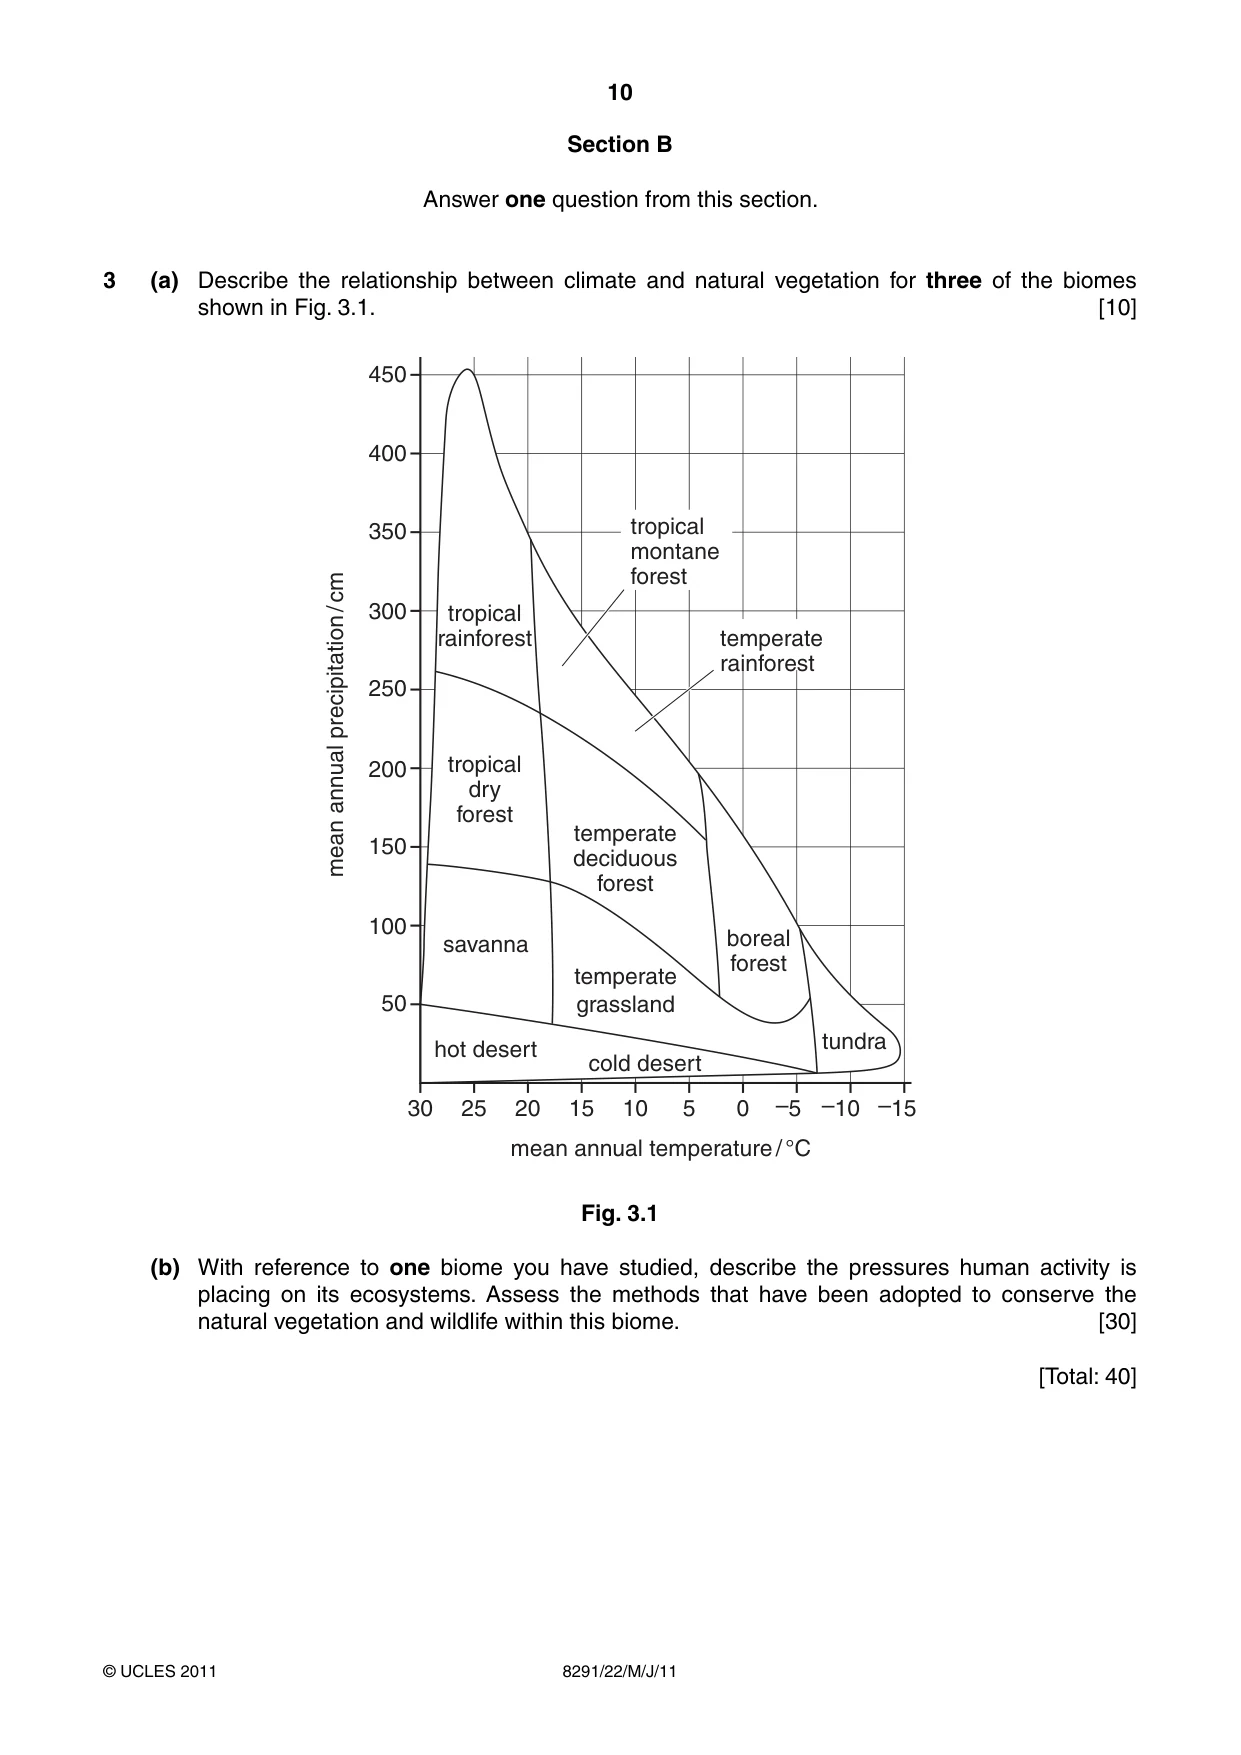
10 8291/22/M/J/11 © UCLES 2011 Section B Answer one question from this section. 3 (a) Describe the relationship between climate and natural vegetation for three of the biomes shown in Fig. 3.1. [10] 450 350 400 300 250 200 150 100 50 30 25 20 15 10 mean annual temperature / °C tropical rainforest tropical dry forest savanna hot desert cold desert temperate grassland tundra boreal forest temperate deciduous forest mean annual precipitation / cm 5 0 –5 –10 –15 tropical montane forest temperate rainforest Fig. 3.1 (b) With reference to one biome you have studied, describe the pressures human activity is placing on its ecosystems. Assess the methods that have been adopted to conserve the natural vegetation and wildlife within this biome. [30] [Total: 40]
Question paper, page 11
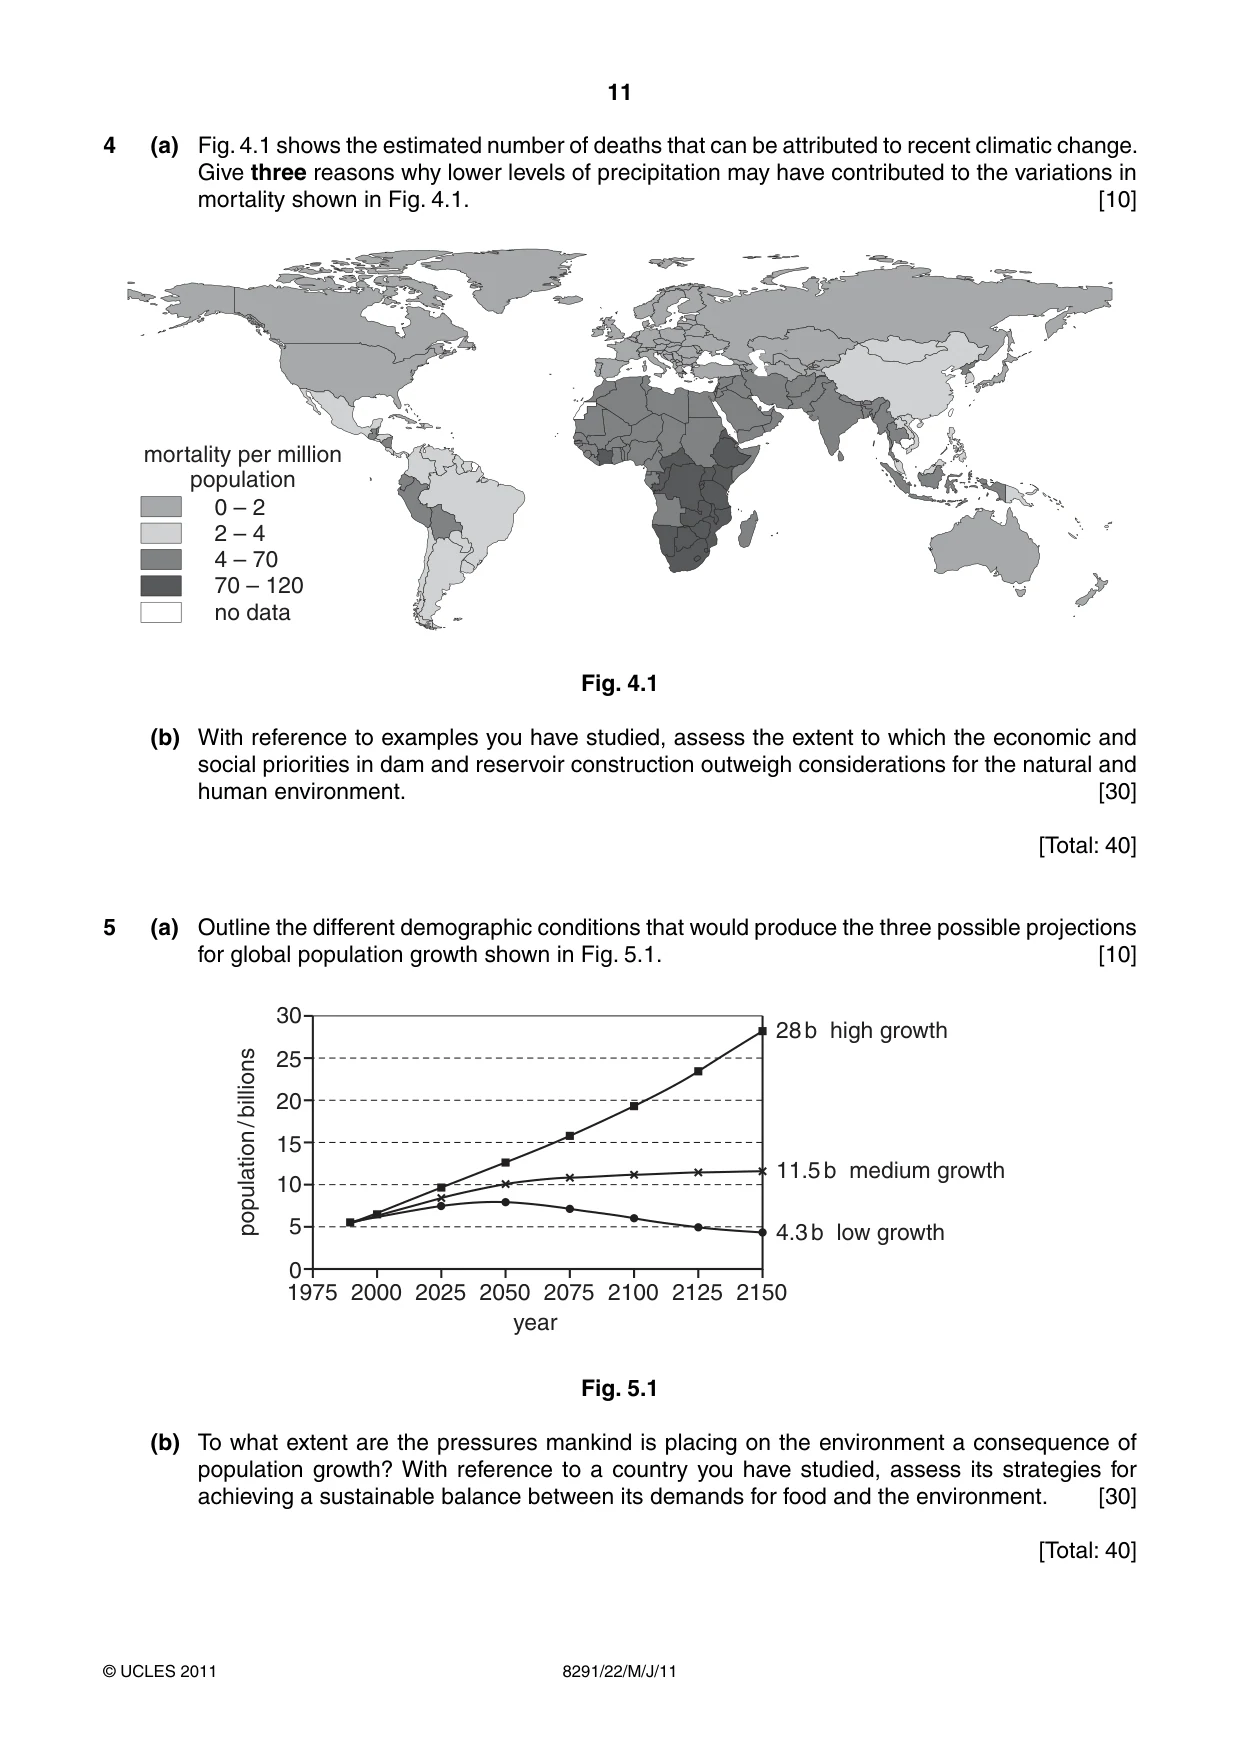
11 8291/22/M/J/11 © UCLES 2011 4 (a) Fig. 4.1 shows the estimated number of deaths that can be attributed to recent climatic change. Give three reasons why lower levels of precipitation may have contributed to the variations in mortality shown in Fig. 4.1. [10] 0 – 2 mortality per million population 2 – 4 4 – 70 70 – 120 no data Fig. 4.1 (b) With reference to examples you have studied, assess the extent to which the economic and social priorities in dam and reservoir construction outweigh considerations for the natural and human environment. [30] [Total: 40] 5 (a) Outline the different demographic conditions that would produce the three possible projections for global population growth shown in Fig. 5.1. [10] 30 25 20 15 1975 2000 2025 2050 year 2075 28 b high growth 11.5 b medium growth 4.3 b low growth 2100 2125 2150 10 population / billions 5 0 Fig. 5.1 (b) To what extent are the pressures mankind is placing on the environment a consequence of population growth? With reference to a country you have studied, assess its strategies for achieving a sustainable balance between its demands for food and the environment. [30] [Total: 40]
Question paper, page 12
12 8291/22/M/J/11 © UCLES 2011 Permission to reproduce items where third-party owned material protected by copyright is included has been sought and cleared where possible. Every reasonable effort has been made by the publisher (UCLES) to trace copyright holders, but if any items requiring clearance have unwittingly been included, the publisher will be pleased to make amends at the earliest possible opportunity. University of Cambridge International Examinations is part of the Cambridge Assessment Group. Cambridge Assessment is the brand name of University of Cambridge Local Examinations Syndicate (UCLES), which is itself a department of the University of Cambridge. BLANK PAGE
Mark scheme, page 1
UNIVERSITY OF CAMBRIDGE INTERNATIONAL EXAMINATIONS GCE Advanced Subsidiary Level MARK SCHEME for the May/June 2011 question paper for the guidance of teachers 8291 ENVIRONMENTAL MANAGEMENT 8291/22 Paper 2, maximum raw mark 80 This mark scheme is published as an aid to teachers and candidates, to indicate the requirements of the examination. It shows the basis on which Examiners were instructed to award marks. It does not indicate the details of the discussions that took place at an Examiners’ meeting before marking began, which would have considered the acceptability of alternative answers. Mark schemes must be read in conjunction with the question papers and the report on the examination. • Cambridge will not enter into discussions or correspondence in connection with these mark schemes. Cambridge is publishing the mark schemes for the May/June 2011 question papers for most IGCSE, GCE Advanced Level and Advanced Subsidiary Level syllabuses and some Ordinary Level syllabuses.
Mark scheme, page 2
Page 2 Mark Scheme: Teachers’ version Syllabus Paper GCE AS LEVEL – May/June 2011 8291 22 © University of Cambridge International Examinations 2011 Section A Answer all questions in this section. 1 (a) What is meant by the term ecosystem? [2] A community (fauna and flora) in which energy and matter interact with themselves, the biotic and the abiotic elements of the environment. (b) Fig. 1.1 shows a simplified food web for a deciduous woodland ecosystem. (i) From Fig. 1.1 identify a four stage chain ending in a top predator. Complete your answer in the boxes below. [2] 2 marks for all three and 1 mark for the first correct primary consumer. Accept other correct 4 stage food chains from Fig1.1 ending with a top predator. (ii) With reference to Fig. 1.1 describe how energy flows through a food web. [4] Award one mark for each of four relevant points. If there is no reference to Fig 1.1 award a max of 3. Biomass is equivalent to stored energy; accept chemical energy (1); energy is transferred between trophic levels(1); only 10% of energy is passed on to the next trophic level (or 90% loss) (1) through respiration at each stage (1); biomass/stored energy decreases up the trophic levels (1). (iii) Explain how biodiversity can be an indicator of the stability of an ecosystem. [2] According to the biome, when there is a wide and full diversity of species probably within a climax or plagio-climax, the system is healthy (could be expressed in terms of energy); with less diversity and species for the ecosystem some degradation has occurred and the system is less healthy. Accept alternatives and generalised answers, for example, in a stable ecosystem biotic factors dominate the ecosystem with complex food webs allowing alternative food sources. plants herbivorous insects Insectivorous birds snakes
Mark scheme, page 3
Page 3 Mark Scheme: Teachers’ version Syllabus Paper GCE AS LEVEL – May/June 2011 8291 22 © University of Cambridge International Examinations 2011 (c) Fig. 1.2 shows a nutrient cycle typical of that in many tropical rainforests. (i) With reference to Fig. 1.2, explain why tropical rainforest soils are frequently infertile. [4] The key to this answer is that most nutrients are stored in the biomass and the reasoning should relate to this point. Credit bullet point 1 (expected) and three related points. ● most nutrients are stored in the biomass (1 mark) ● rapid cycling of nutrient leaving little in a soil that is deeply weathered (1 mark) ● little nutrient take up from the soil (1 mark) ● nutrients leached from the soil (1 mark) ● deeply weathered rock releases few nutrients (1 mark). (ii) Describe the effects that deforestation would have on the nutrient flows shown in Fig. 1.2. [6] Credit 6 linked points each with one mark. If there is no linkage then max 4. Candidates should focus on the immediate links with the forest then review knock-on effects. e.g. deforestation – no interception – ppt. reaches the surface – leaching of nutrients and surface runoff causing soil erosion – nutrient store removed from the biomass. This could ultimately lead to desertification. [Total: 20] 2 (a) Fig. 2.1 contains information about the hydrological cycle within a river valley. (i) From Fig. 2.1 identify the flow that occurs at A and the store that occurs at B. [2] A = precipitation B = groundwater store (ii) What is meant by each of the terms interception and water table. [2] Interception – where leaves provide temporary ppt. storage Water table – the upper level of saturation in the soil or underlying rock (iii) Describe how the hydrological cycle shown in Fig. 2.1 might respond: [6] ● during a long dry summer, Award 1 mark for each of three linked points of 3; if not linked a max of 2, e.g. lower water table – therefore infiltration – slow movement to the groundwater store – river slow to respond. Credit other valid descriptions. ● during a period of prolonged rainfall. Award 1 mark for each of three linked points of 3; if not linked a max of 2. e.g. ppt reaches the surface – rapid surface runoff – soil erosion or ground saturated – surface runoff – river floods.
Mark scheme, page 4
Page 4 Mark Scheme: Teachers’ version Syllabus Paper GCE AS LEVEL – May/June 2011 8291 22 © University of Cambridge International Examinations 2011 (b) Fig. 2.2 shows some of the hydrological processes to be found in a non-urban area and an urban area. (i) Use Fig. 2.2 to explain why the percentages of infiltration and surface runoff in the urban area are different from those in the non-urban area. [6] Although a contrast is needed credit up to 3 for the non-urban area and 3 for the urban area or a max 4 if only deals with the urban area. The question requires an explanation, for which detail from Fig 2.2 is needed. Credit each distinct point with 1 mark. Non-urban area: – normal processes of evapo-transpiration/infiltration restrict surface runoff to 10%. Urban area:– contains impermeable surfaces enabling 25% surface runoff + remaining water is directed through drains and very little into the soil and underlying rock (5%); less vegetation reduced transpiration but there is active evaporation off urban surface (30%). (ii) Suggest and explain two possible effects the water losses from the urban area might have upon a nearby river. [4] The answer requires two effects, a contribution to flooding and a contribution to river pollution. For example, urban surface directs water very efficiently, via gutters, drains and sewers into a nearby river. There is active and efficient surface runoff; therefore river discharge can increase quickly causing flooding. Runoff may pollute the water resulting in eutrophication (2 marks). [Total: 20]
Mark scheme, page 5
Page 5 Mark Scheme: Teachers’ version Syllabus Paper GCE AS LEVEL – May/June 2011 8291 22 © University of Cambridge International Examinations 2011 Section B Answer one question from this section. 3 (a) Describe the relationship between climate and natural vegetation for three of the biomes shown in Fig. 3.1. [10] Fig. 3.1 is a model that graphically locates biomes according to temperature and rainfall. Candidates need to identify the limits of each biome. For each chosen credit 2 marks for its temperature and rainfall limits and 1 mark for vegetation. There is one floating mark. 8–10 marks Answers should clearly link vegetation with rainfall and temperature details for three biomes. 4–7 marks Answers will give good detail on at least one biome; if three are considered, expect weak detail on one or two. 1–3 mark Answers may detail one biome but mostly all three will receive very weak coverage. (b) With reference to one biome you have studied, describe the pressures human activity is placing on its ecosystems. Assess the methods that have been adopted to conserve the natural vegetation and wildlife within this biome. [30] Although it is likely that most candidates will select TRF; hopefully Fig. 3.1 will divert some to other climes. The question requires candidates to select a biome, describe the pressures exerted upon its ecosystems and assess the appropriate conservation measures. Pressures might include: urban growth, agriculture, population increase, tourism and deforestation. Natural events are not required; care should be taken in references to global warming as it is a natural response and its causes still debated. Measures might include/combine: designated conservation sites, ecotourism, urban planning, sustainable forestry, etc. Band 1 answers will contain a clear and named biome reference and understand that it contains a variety of ecosystems. At least two distinct threats should be mentioned with conservation measures that are pertinent to the chosen biome. (25–30) Band 3 answers will be limited in the coverage of both ecosystems and pressure. Conservation measures will be briefly described and may lose linkages with the chosen biome. (13–18) Band 4 answers may lack balance and detail. They will give ecosystems some superficial coverage but lack clarity on related conservation measures. (6–12) [Total: 40]
Mark scheme, page 6
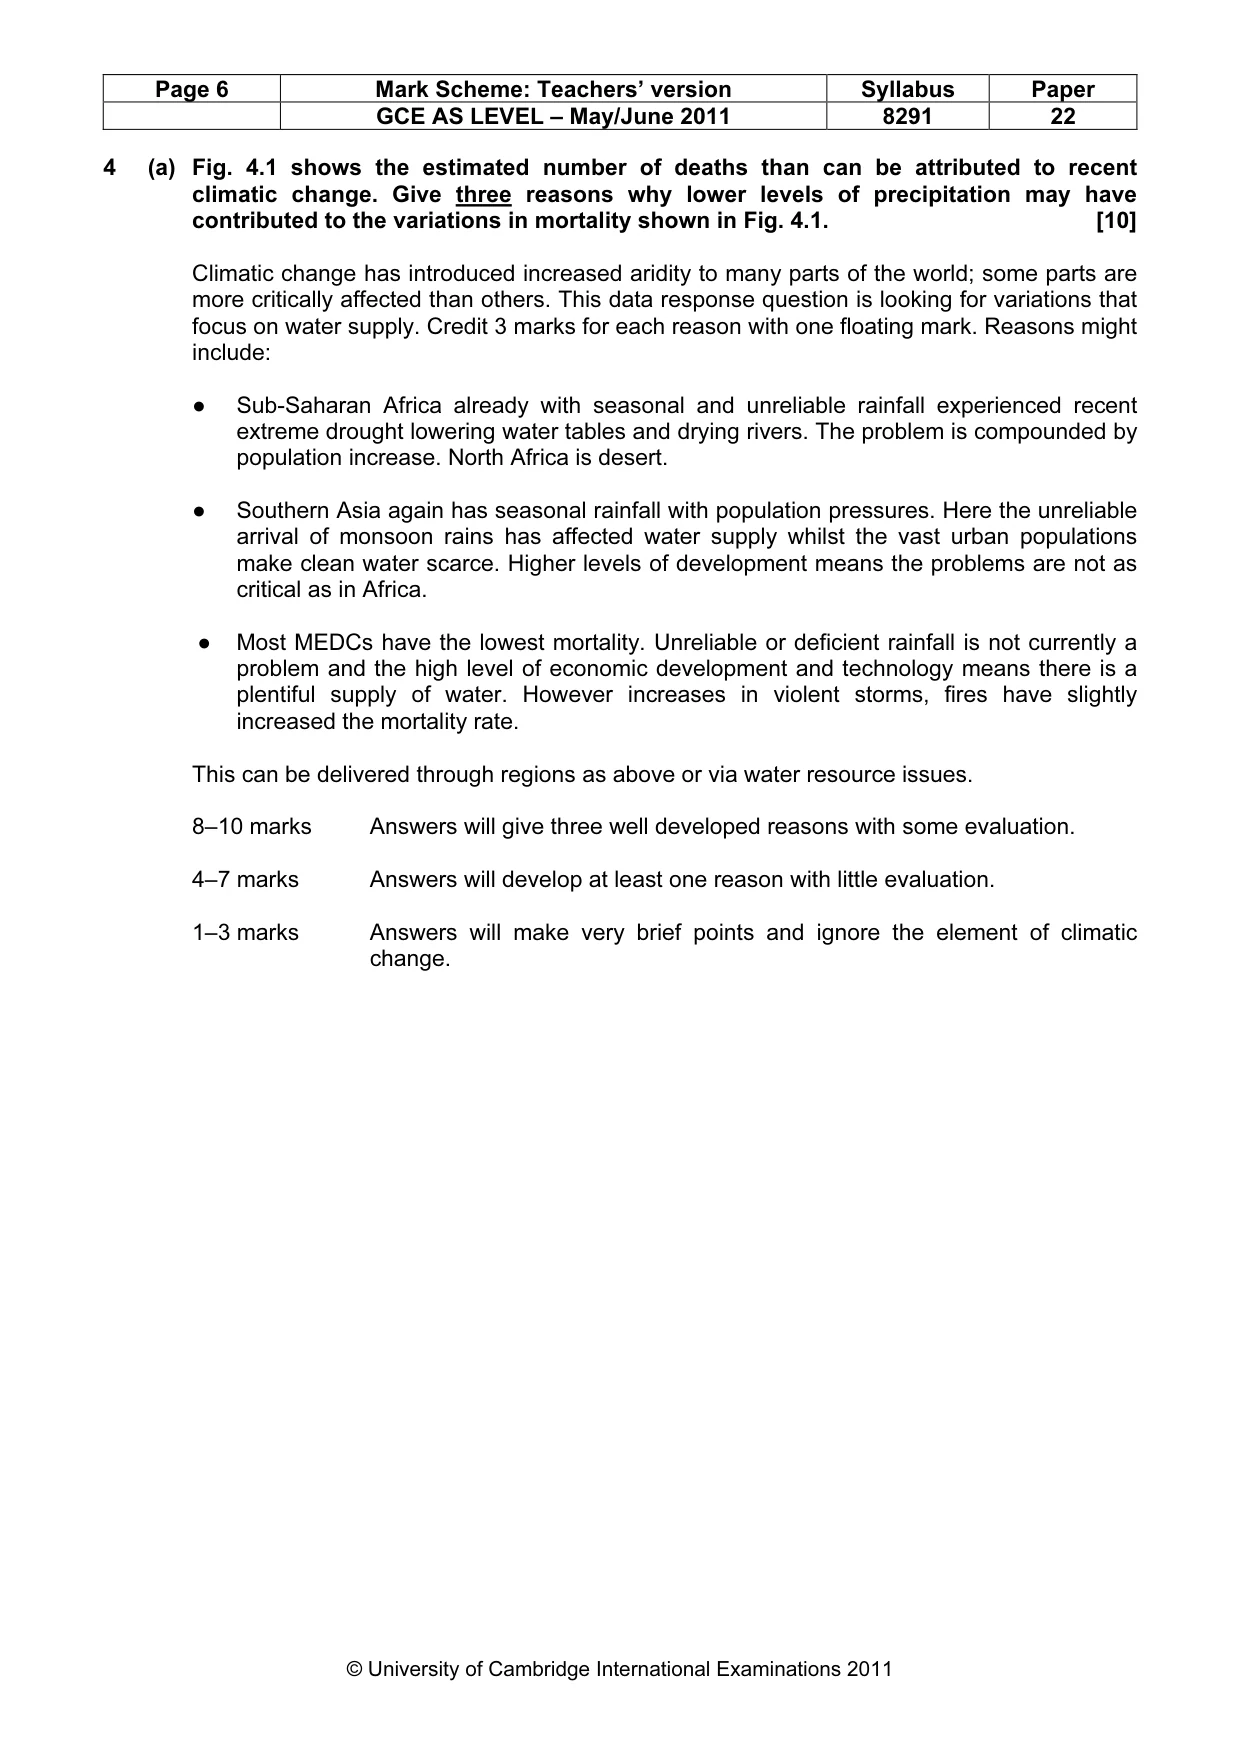
Page 6 Mark Scheme: Teachers’ version Syllabus Paper GCE AS LEVEL – May/June 2011 8291 22 © University of Cambridge International Examinations 2011 4 (a) Fig. 4.1 shows the estimated number of deaths than can be attributed to recent climatic change. Give three reasons why lower levels of precipitation may have contributed to the variations in mortality shown in Fig. 4.1. [10] Climatic change has introduced increased aridity to many parts of the world; some parts are more critically affected than others. This data response question is looking for variations that focus on water supply. Credit 3 marks for each reason with one floating mark. Reasons might include: ● Sub-Saharan Africa already with seasonal and unreliable rainfall experienced recent extreme drought lowering water tables and drying rivers. The problem is compounded by population increase. North Africa is desert. ● Southern Asia again has seasonal rainfall with population pressures. Here the unreliable arrival of monsoon rains has affected water supply whilst the vast urban populations make clean water scarce. Higher levels of development means the problems are not as critical as in Africa. ● Most MEDCs have the lowest mortality. Unreliable or deficient rainfall is not currently a problem and the high level of economic development and technology means there is a plentiful supply of water. However increases in violent storms, fires have slightly increased the mortality rate. This can be delivered through regions as above or via water resource issues. 8–10 marks Answers will give three well developed reasons with some evaluation. 4–7 marks Answers will develop at least one reason with little evaluation. 1–3 marks Answers will make very brief points and ignore the element of climatic change.
Mark scheme, page 7
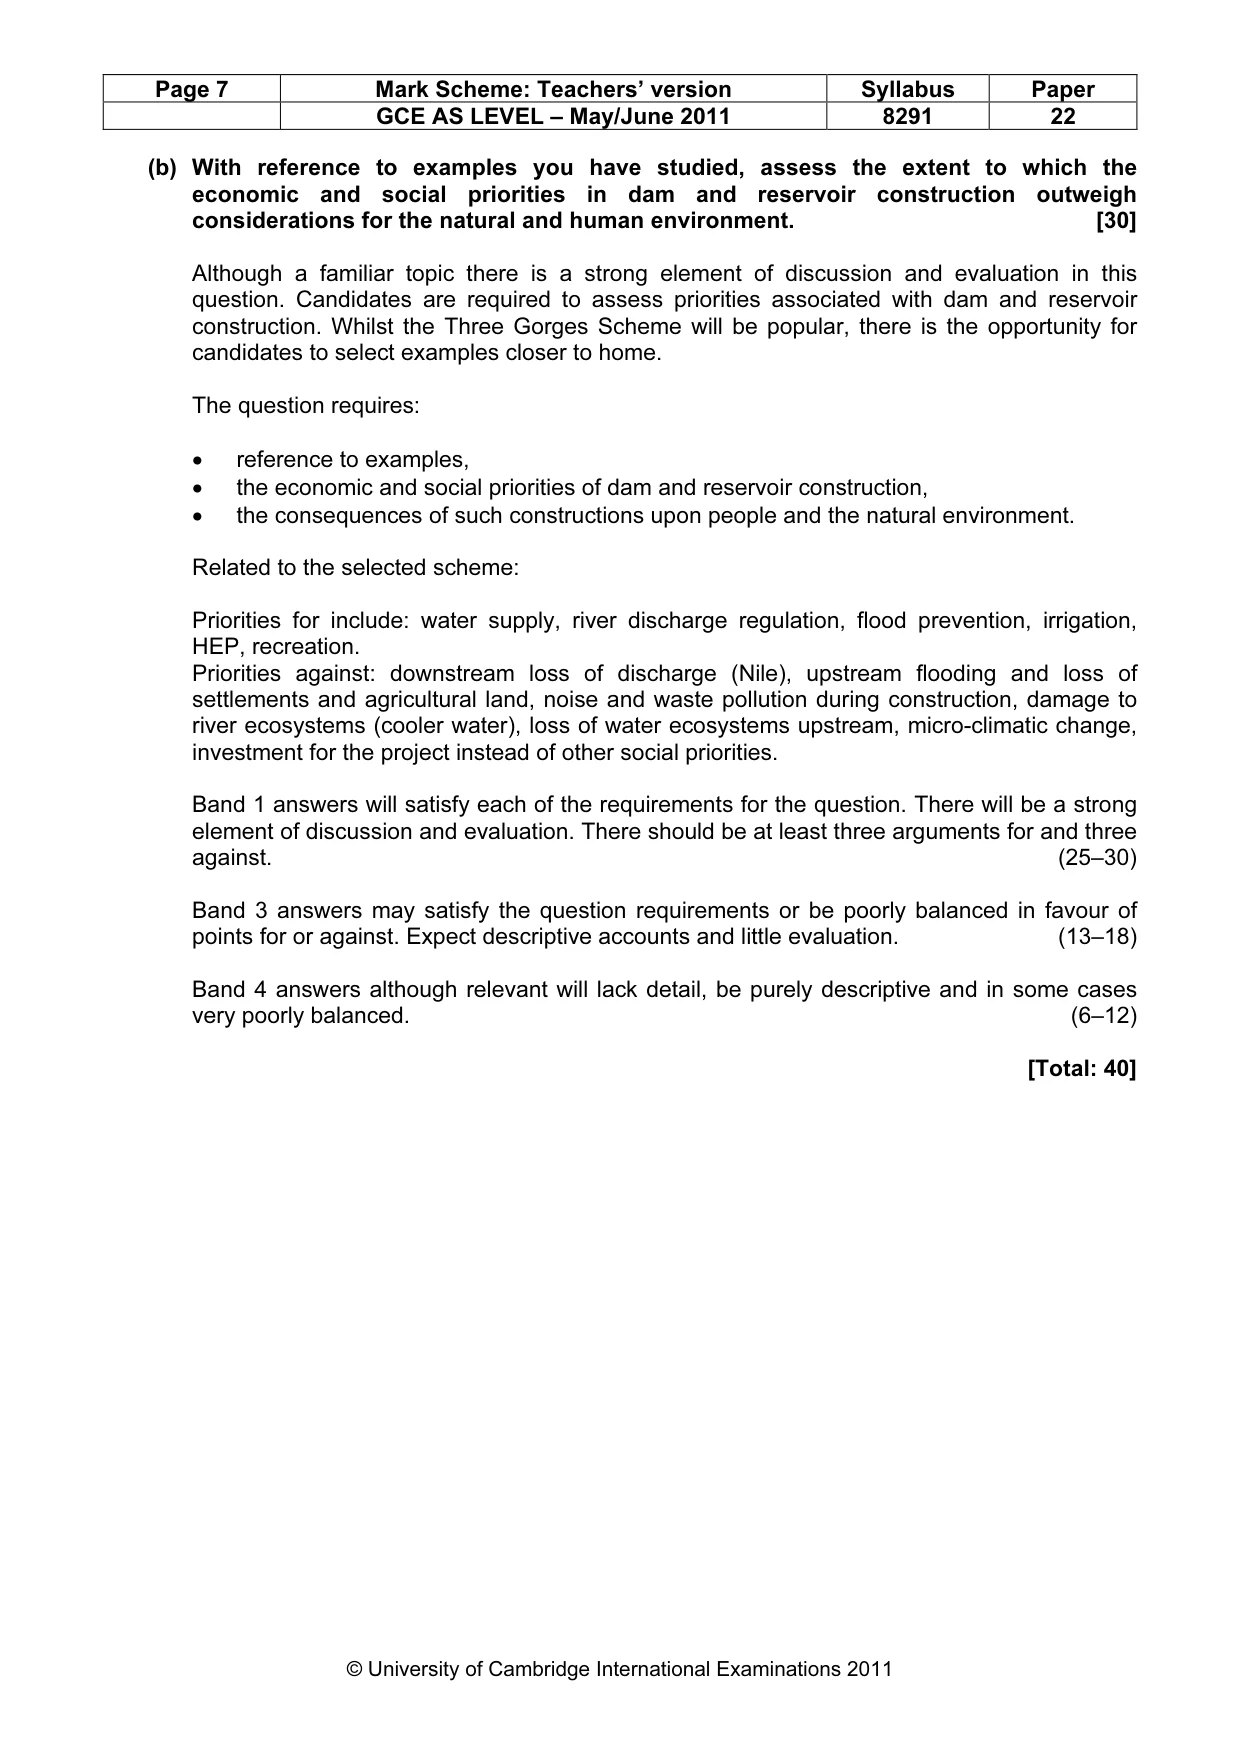
Page 7 Mark Scheme: Teachers’ version Syllabus Paper GCE AS LEVEL – May/June 2011 8291 22 © University of Cambridge International Examinations 2011 (b) With reference to examples you have studied, assess the extent to which the economic and social priorities in dam and reservoir construction outweigh considerations for the natural and human environment. [30] Although a familiar topic there is a strong element of discussion and evaluation in this question. Candidates are required to assess priorities associated with dam and reservoir construction. Whilst the Three Gorges Scheme will be popular, there is the opportunity for candidates to select examples closer to home. The question requires: • reference to examples, • the economic and social priorities of dam and reservoir construction, • the consequences of such constructions upon people and the natural environment. Related to the selected scheme: Priorities for include: water supply, river discharge regulation, flood prevention, irrigation, HEP, recreation. Priorities against: downstream loss of discharge (Nile), upstream flooding and loss of settlements and agricultural land, noise and waste pollution during construction, damage to river ecosystems (cooler water), loss of water ecosystems upstream, micro-climatic change, investment for the project instead of other social priorities. Band 1 answers will satisfy each of the requirements for the question. There will be a strong element of discussion and evaluation. There should be at least three arguments for and three against. (25–30) Band 3 answers may satisfy the question requirements or be poorly balanced in favour of points for or against. Expect descriptive accounts and little evaluation. (13–18) Band 4 answers although relevant will lack detail, be purely descriptive and in some cases very poorly balanced. (6–12) [Total: 40]
Mark scheme, page 8
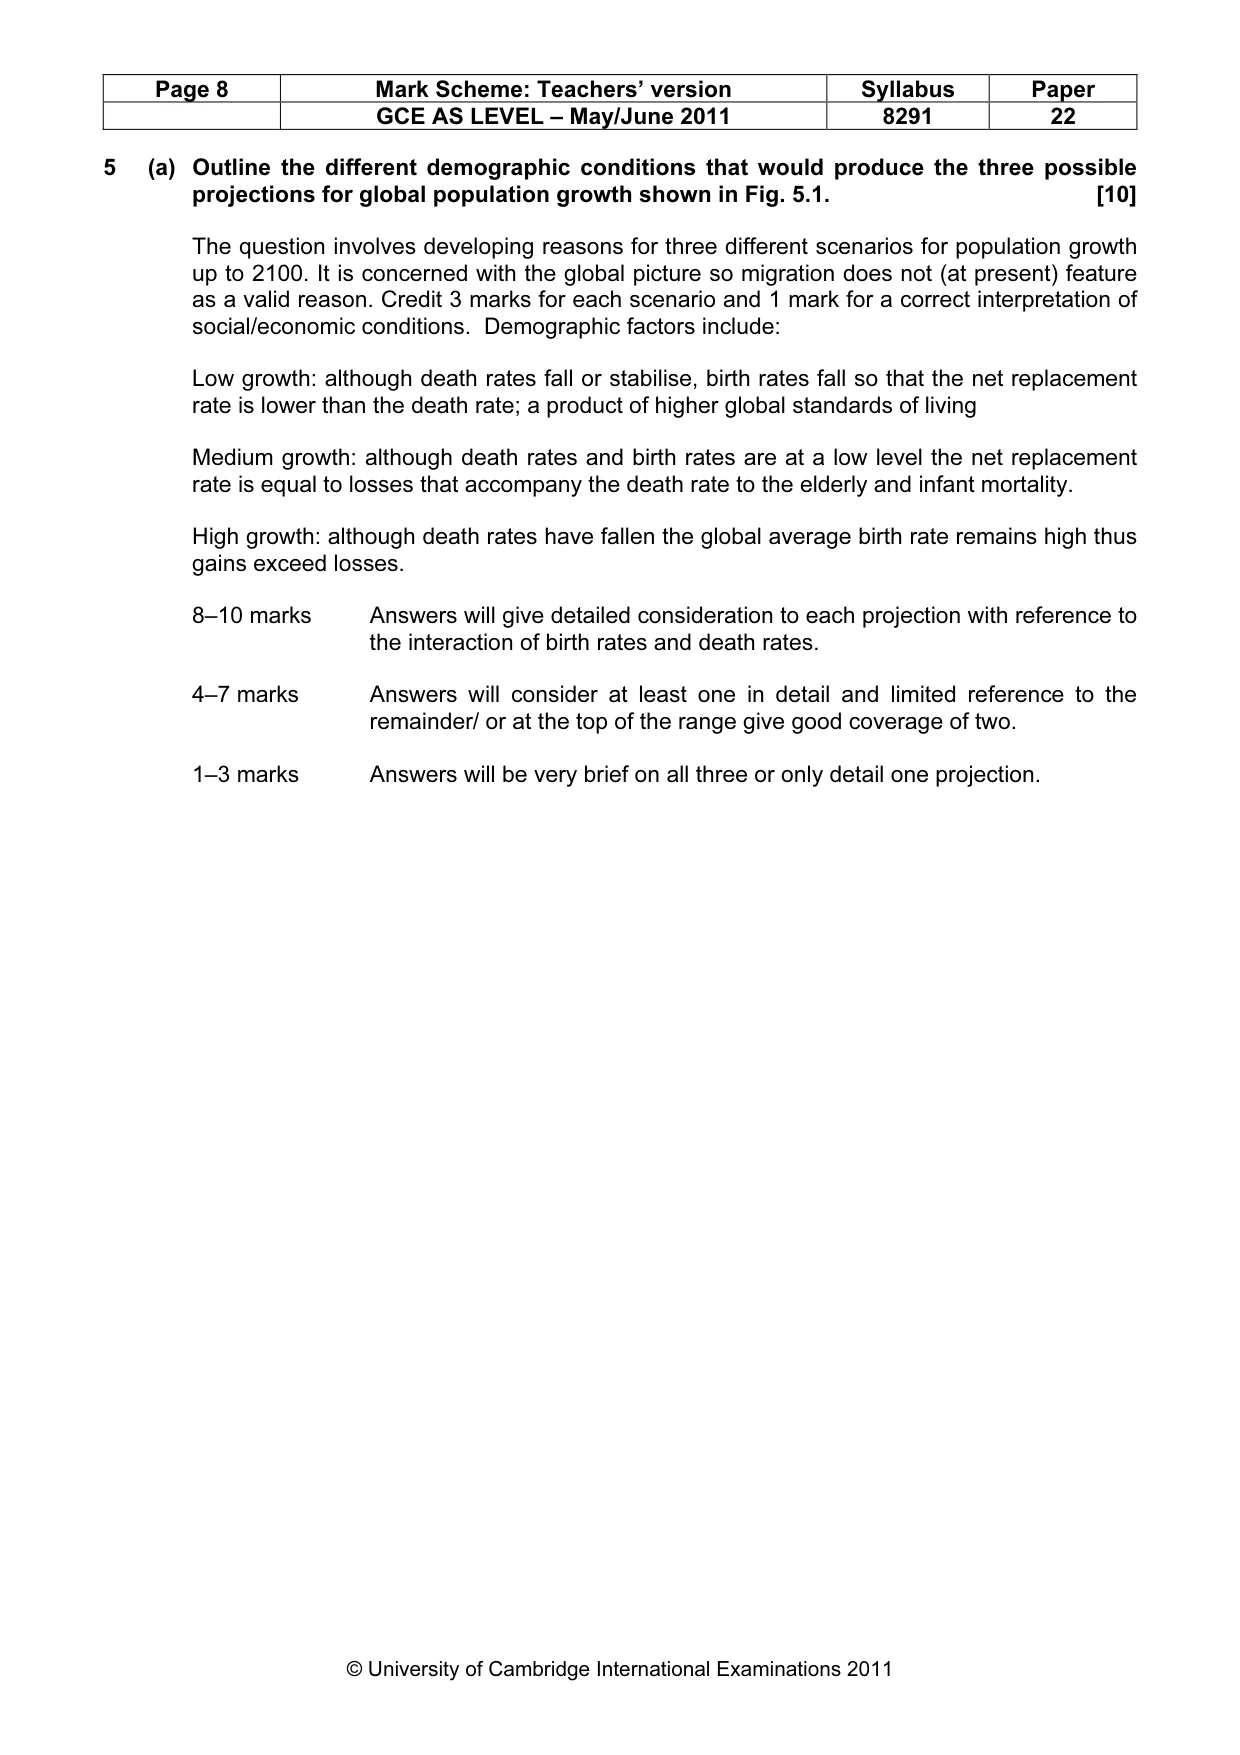
Page 8 Mark Scheme: Teachers’ version Syllabus Paper GCE AS LEVEL – May/June 2011 8291 22 © University of Cambridge International Examinations 2011 5 (a) Outline the different demographic conditions that would produce the three possible projections for global population growth shown in Fig. 5.1. [10] The question involves developing reasons for three different scenarios for population growth up to 2100. It is concerned with the global picture so migration does not (at present) feature as a valid reason. Credit 3 marks for each scenario and 1 mark for a correct interpretation of social/economic conditions. Demographic factors include: Low growth: although death rates fall or stabilise, birth rates fall so that the net replacement rate is lower than the death rate; a product of higher global standards of living Medium growth: although death rates and birth rates are at a low level the net replacement rate is equal to losses that accompany the death rate to the elderly and infant mortality. High growth: although death rates have fallen the global average birth rate remains high thus gains exceed losses. 8–10 marks Answers will give detailed consideration to each projection with reference to the interaction of birth rates and death rates. 4–7 marks Answers will consider at least one in detail and limited reference to the remainder/ or at the top of the range give good coverage of two. 1–3 marks Answers will be very brief on all three or only detail one projection.
Mark scheme, page 9
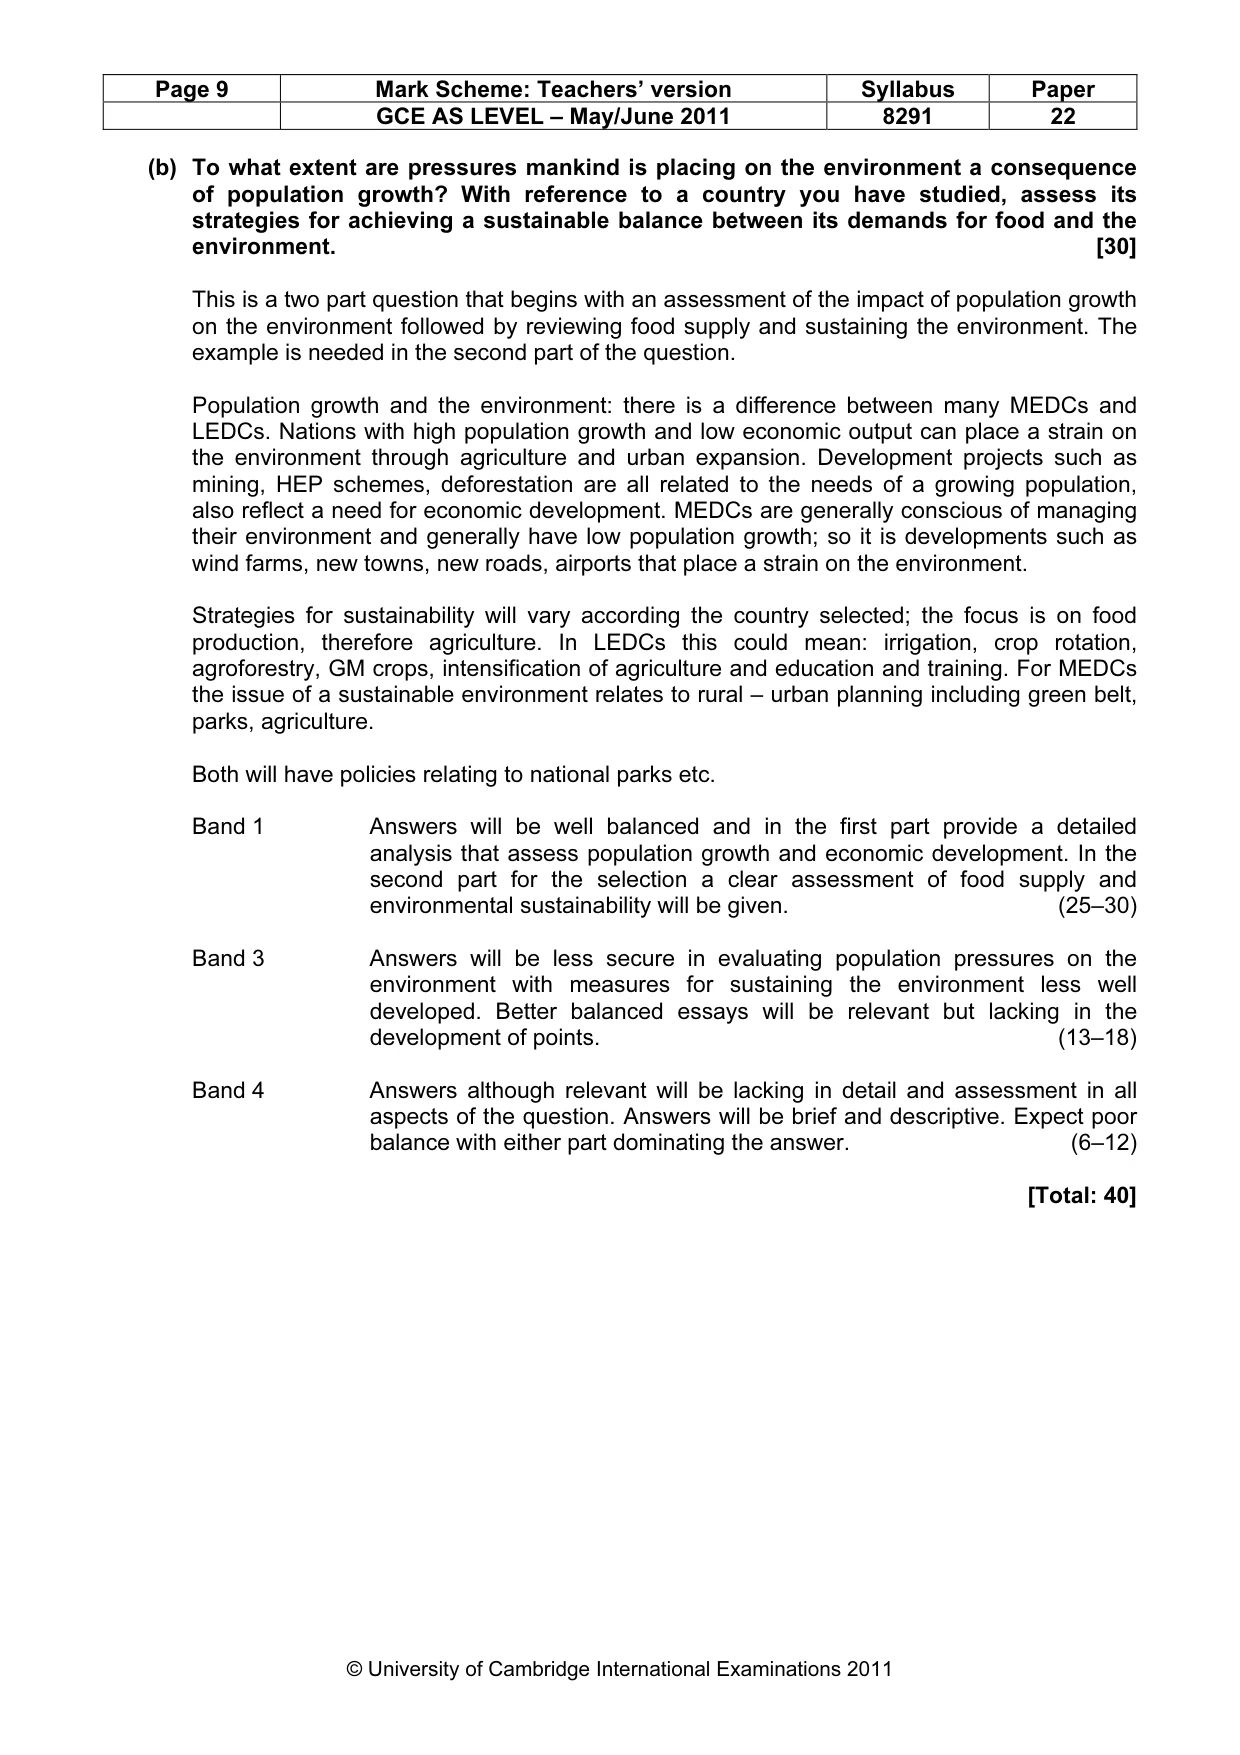
Page 9 Mark Scheme: Teachers’ version Syllabus Paper GCE AS LEVEL – May/June 2011 8291 22 © University of Cambridge International Examinations 2011 (b) To what extent are pressures mankind is placing on the environment a consequence of population growth? With reference to a country you have studied, assess its strategies for achieving a sustainable balance between its demands for food and the environment. [30] This is a two part question that begins with an assessment of the impact of population growth on the environment followed by reviewing food supply and sustaining the environment. The example is needed in the second part of the question. Population growth and the environment: there is a difference between many MEDCs and LEDCs. Nations with high population growth and low economic output can place a strain on the environment through agriculture and urban expansion. Development projects such as mining, HEP schemes, deforestation are all related to the needs of a growing population, also reflect a need for economic development. MEDCs are generally conscious of managing their environment and generally have low population growth; so it is developments such as wind farms, new towns, new roads, airports that place a strain on the environment. Strategies for sustainability will vary according the country selected; the focus is on food production, therefore agriculture. In LEDCs this could mean: irrigation, crop rotation, agroforestry, GM crops, intensification of agriculture and education and training. For MEDCs the issue of a sustainable environment relates to rural – urban planning including green belt, parks, agriculture. Both will have policies relating to national parks etc. Band 1 Answers will be well balanced and in the first part provide a detailed analysis that assess population growth and economic development. In the second part for the selection a clear assessment of food supply and environmental sustainability will be given. (25–30) Band 3 Answers will be less secure in evaluating population pressures on the environment with measures for sustaining the environment less well developed. Better balanced essays will be relevant but lacking in the development of points. (13–18) Band 4 Answers although relevant will be lacking in detail and assessment in all aspects of the question. Answers will be brief and descriptive. Expect poor balance with either part dominating the answer. (6–12) [Total: 40]
Mark scheme, page 10
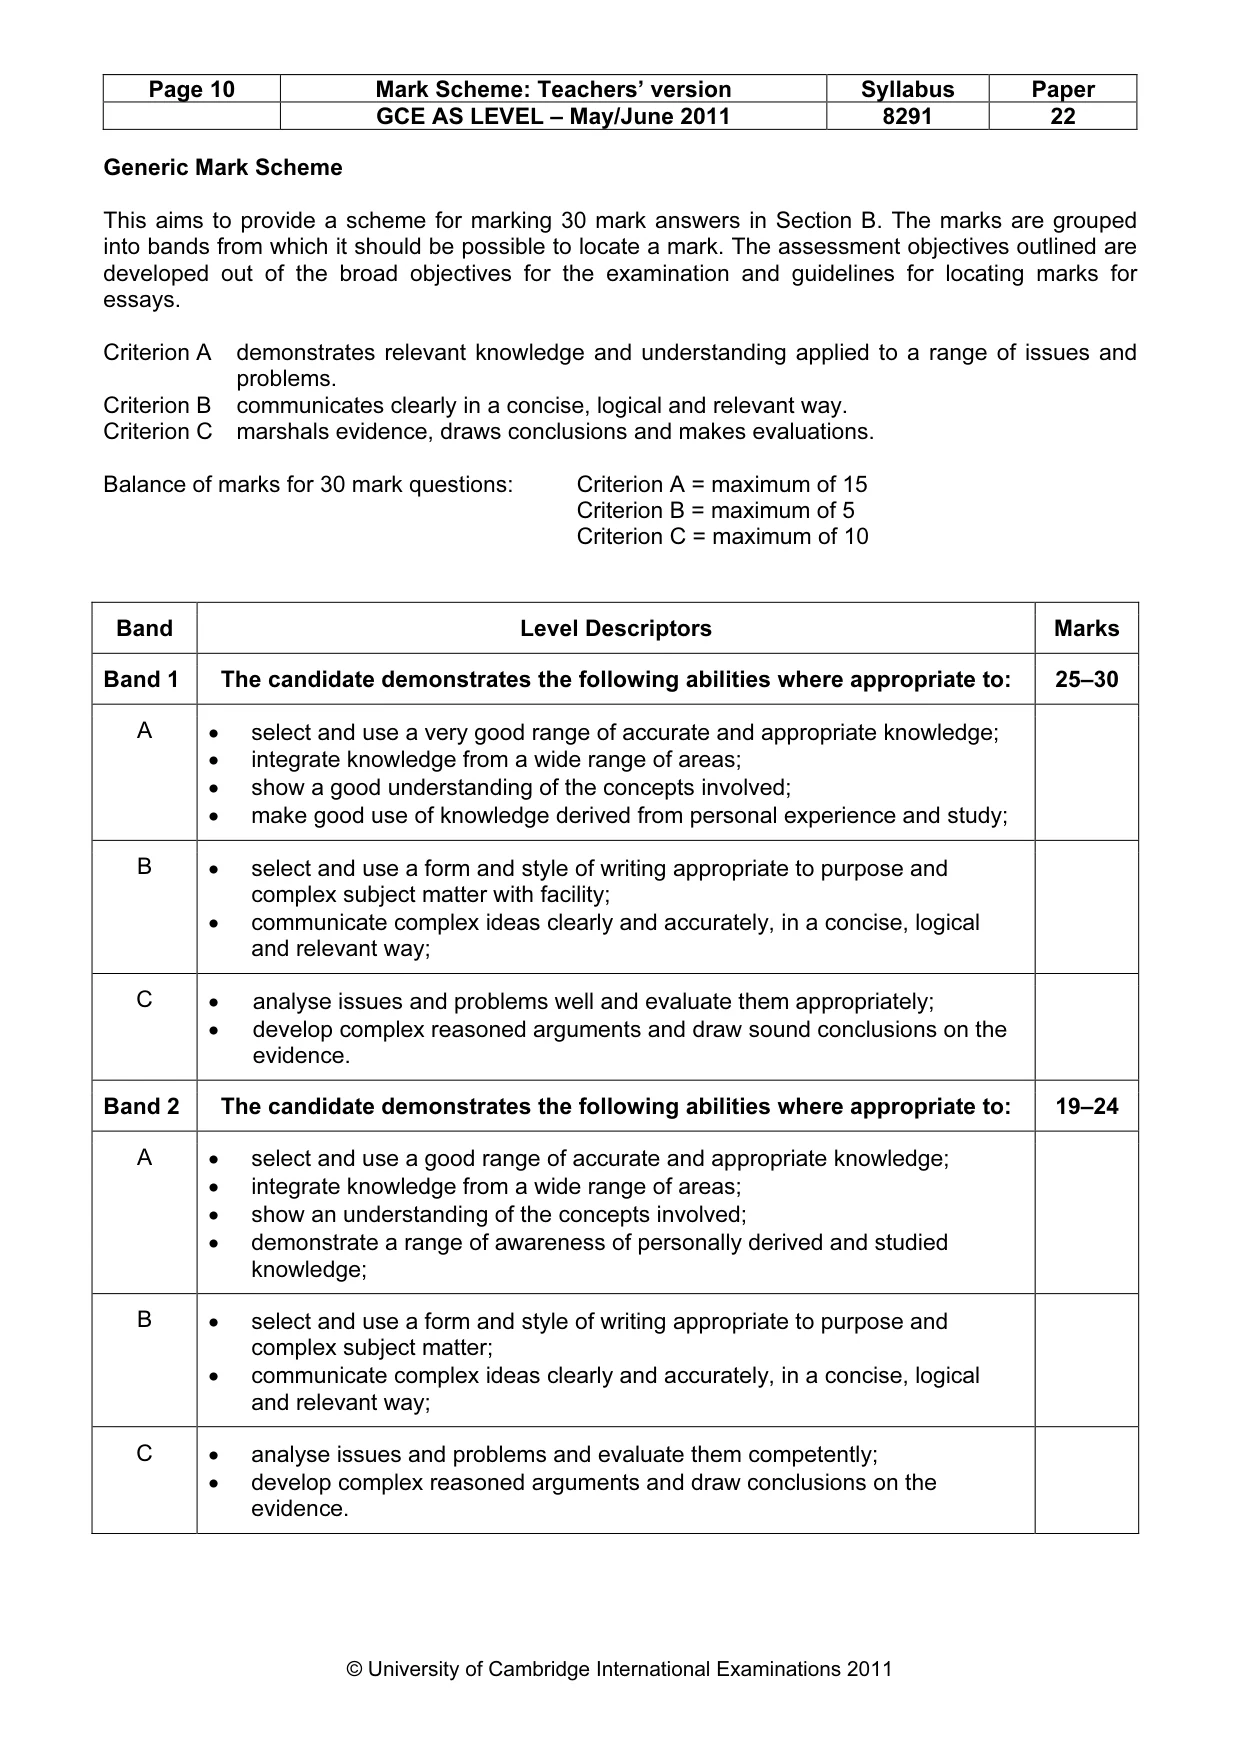
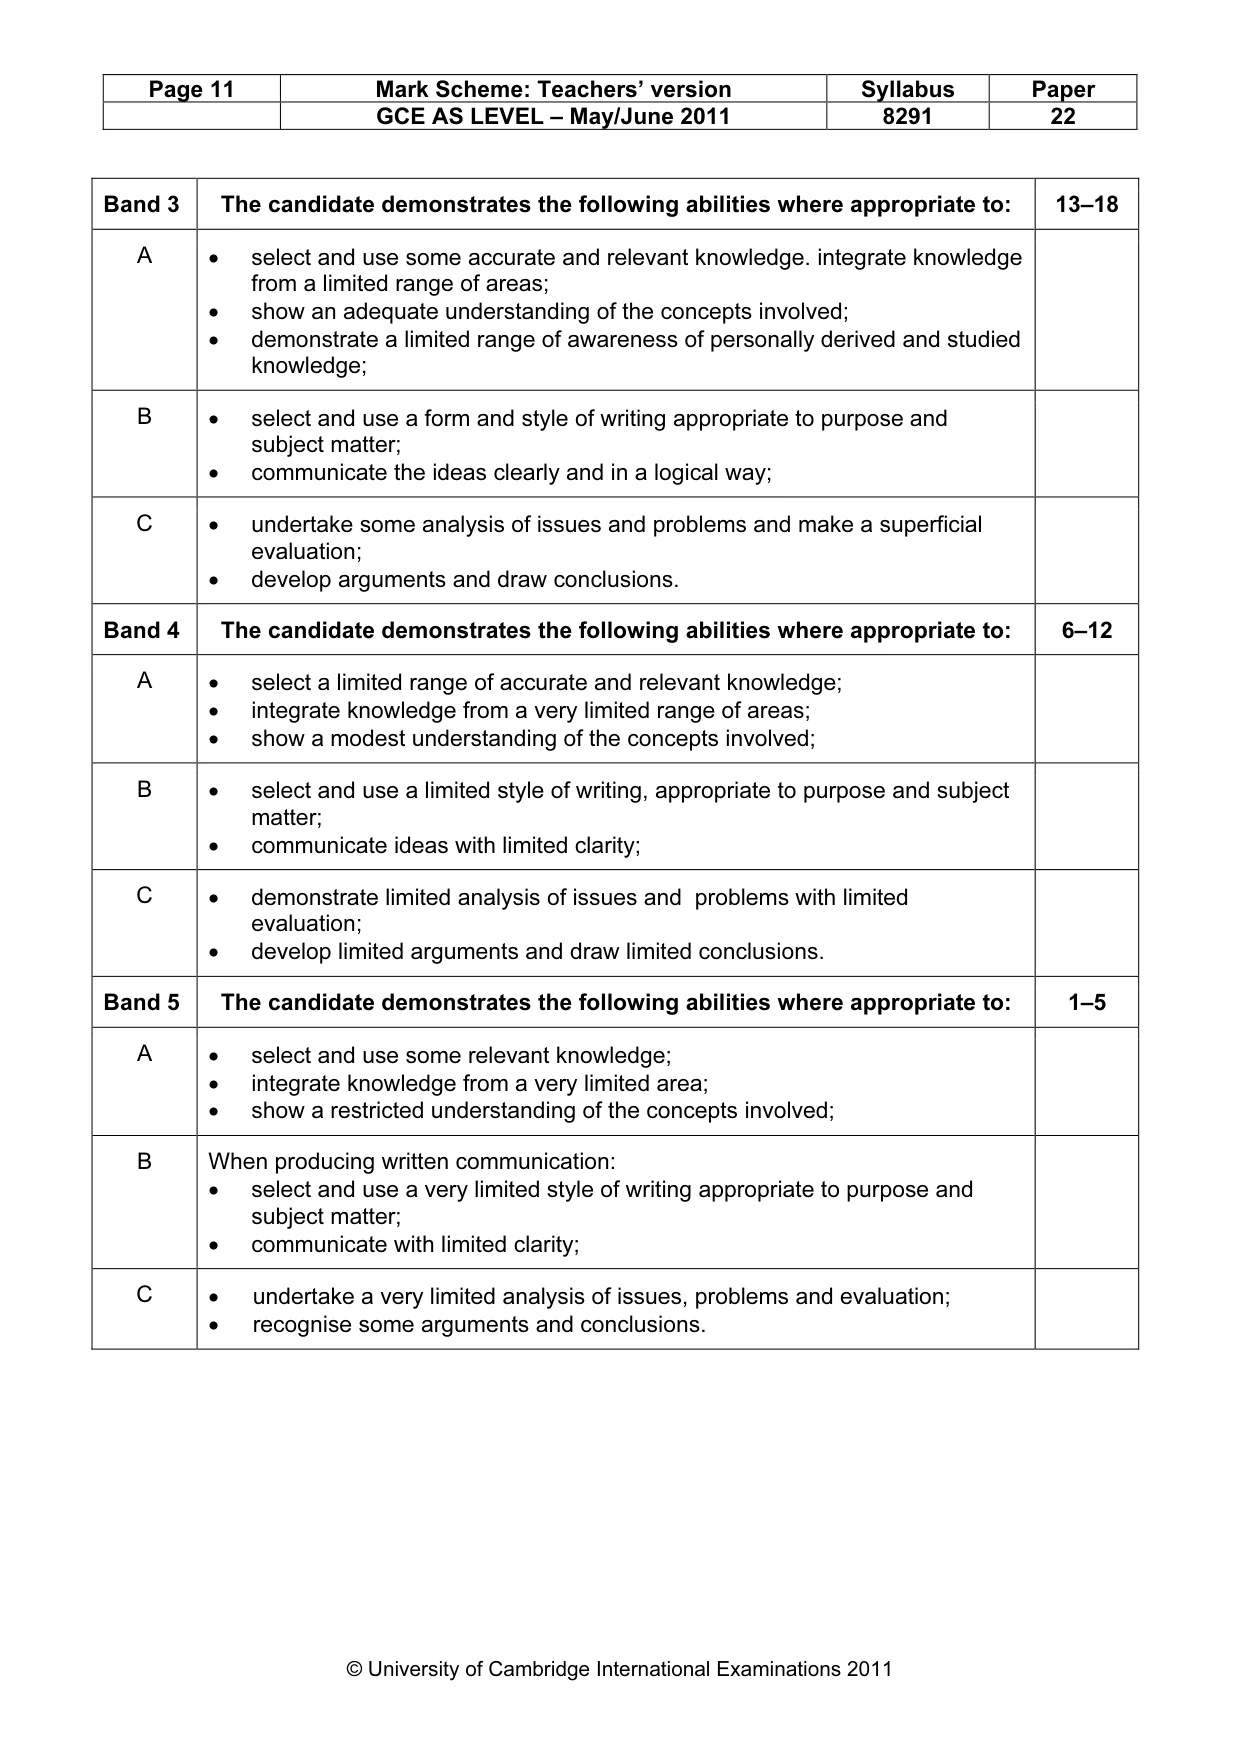
Page 10 Mark Scheme: Teachers’ version Syllabus Paper GCE AS LEVEL – May/June 2011 8291 22 © University of Cambridge International Examinations 2011 Generic Mark Scheme This aims to provide a scheme for marking 30 mark answers in Section B. The marks are grouped into bands from which it should be possible to locate a mark. The assessment objectives outlined are developed out of the broad objectives for the examination and guidelines for locating marks for essays. Criterion A demonstrates relevant knowledge and understanding applied to a range of issues and problems. Criterion B communicates clearly in a concise, logical and relevant way. Criterion C marshals evidence, draws conclusions and makes evaluations. Balance of marks for 30 mark questions: Criterion A = maximum of 15 Criterion B = maximum of 5 Criterion C = maximum of 10 Band Level Descriptors Marks Band 1 The candidate demonstrates the following abilities where appropriate to: 25–30 A • select and use a very good range of accurate and appropriate knowledge; • integrate knowledge from a wide range of areas; • show a good understanding of the concepts involved; • make good use of knowledge derived from personal experience and study; B • select and use a form and style of writing appropriate to purpose and complex subject matter with facility; • communicate complex ideas clearly and accurately, in a concise, logical and relevant way; C • analyse issues and problems well and evaluate them appropriately; • develop complex reasoned arguments and draw sound conclusions on the evidence. Band 2 The candidate demonstrates the following abilities where appropriate to: 19–24 A • select and use a good range of accurate and appropriate knowledge; • integrate knowledge from a wide range of areas; • show an understanding of the concepts involved; • demonstrate a range of awareness of personally derived and studied knowledge; B • select and use a form and style of writing appropriate to purpose and complex subject matter; • communicate complex ideas clearly and accurately, in a concise, logical and relevant way; C • analyse issues and problems and evaluate them competently; • develop complex reasoned arguments and draw conclusions on the evidence.
Mark scheme, page 11
Page 11 Mark Scheme: Teachers’ version Syllabus Paper GCE AS LEVEL – May/June 2011 8291 22 © University of Cambridge International Examinations 2011 Band 3 The candidate demonstrates the following abilities where appropriate to: 13–18 A • select and use some accurate and relevant knowledge. integrate knowledge from a limited range of areas; • show an adequate understanding of the concepts involved; • demonstrate a limited range of awareness of personally derived and studied knowledge; B • select and use a form and style of writing appropriate to purpose and subject matter; • communicate the ideas clearly and in a logical way; C • undertake some analysis of issues and problems and make a superficial evaluation; • develop arguments and draw conclusions. Band 4 The candidate demonstrates the following abilities where appropriate to: 6–12 A • select a limited range of accurate and relevant knowledge; • integrate knowledge from a very limited range of areas; • show a modest understanding of the concepts involved; B • select and use a limited style of writing, appropriate to purpose and subject matter; • communicate ideas with limited clarity; C • demonstrate limited analysis of issues and problems with limited evaluation; • develop limited arguments and draw limited conclusions. Band 5 The candidate demonstrates the following abilities where appropriate to: 1–5 A • select and use some relevant knowledge; • integrate knowledge from a very limited area; • show a restricted understanding of the concepts involved; B When producing written communication: • select and use a very limited style of writing appropriate to purpose and subject matter; • communicate with limited clarity; C • undertake a very limited analysis of issues, problems and evaluation; • recognise some arguments and conclusions.
What you needed in this session
Cambridge’s own grade thresholds for 2011 May/June, Paper 2 · Variant 2. A higher threshold means an easier paper — the bar moves with how the cohort did.