Cambridge A Level Environmental Management (AS only) 8291 — 2011 May/June Paper 2 · Variant 1
8291/21/M/J/11 · 80 marks · ≈90 min
The question paper and its mark scheme, free to read here and free to download. This is Cambridge’s own paper, exactly as it was sat.
Question paper12 pages
Mark scheme11 pages
Answers below. Sit the paper first if you are practising.
Paper as text
Question paper, page 1
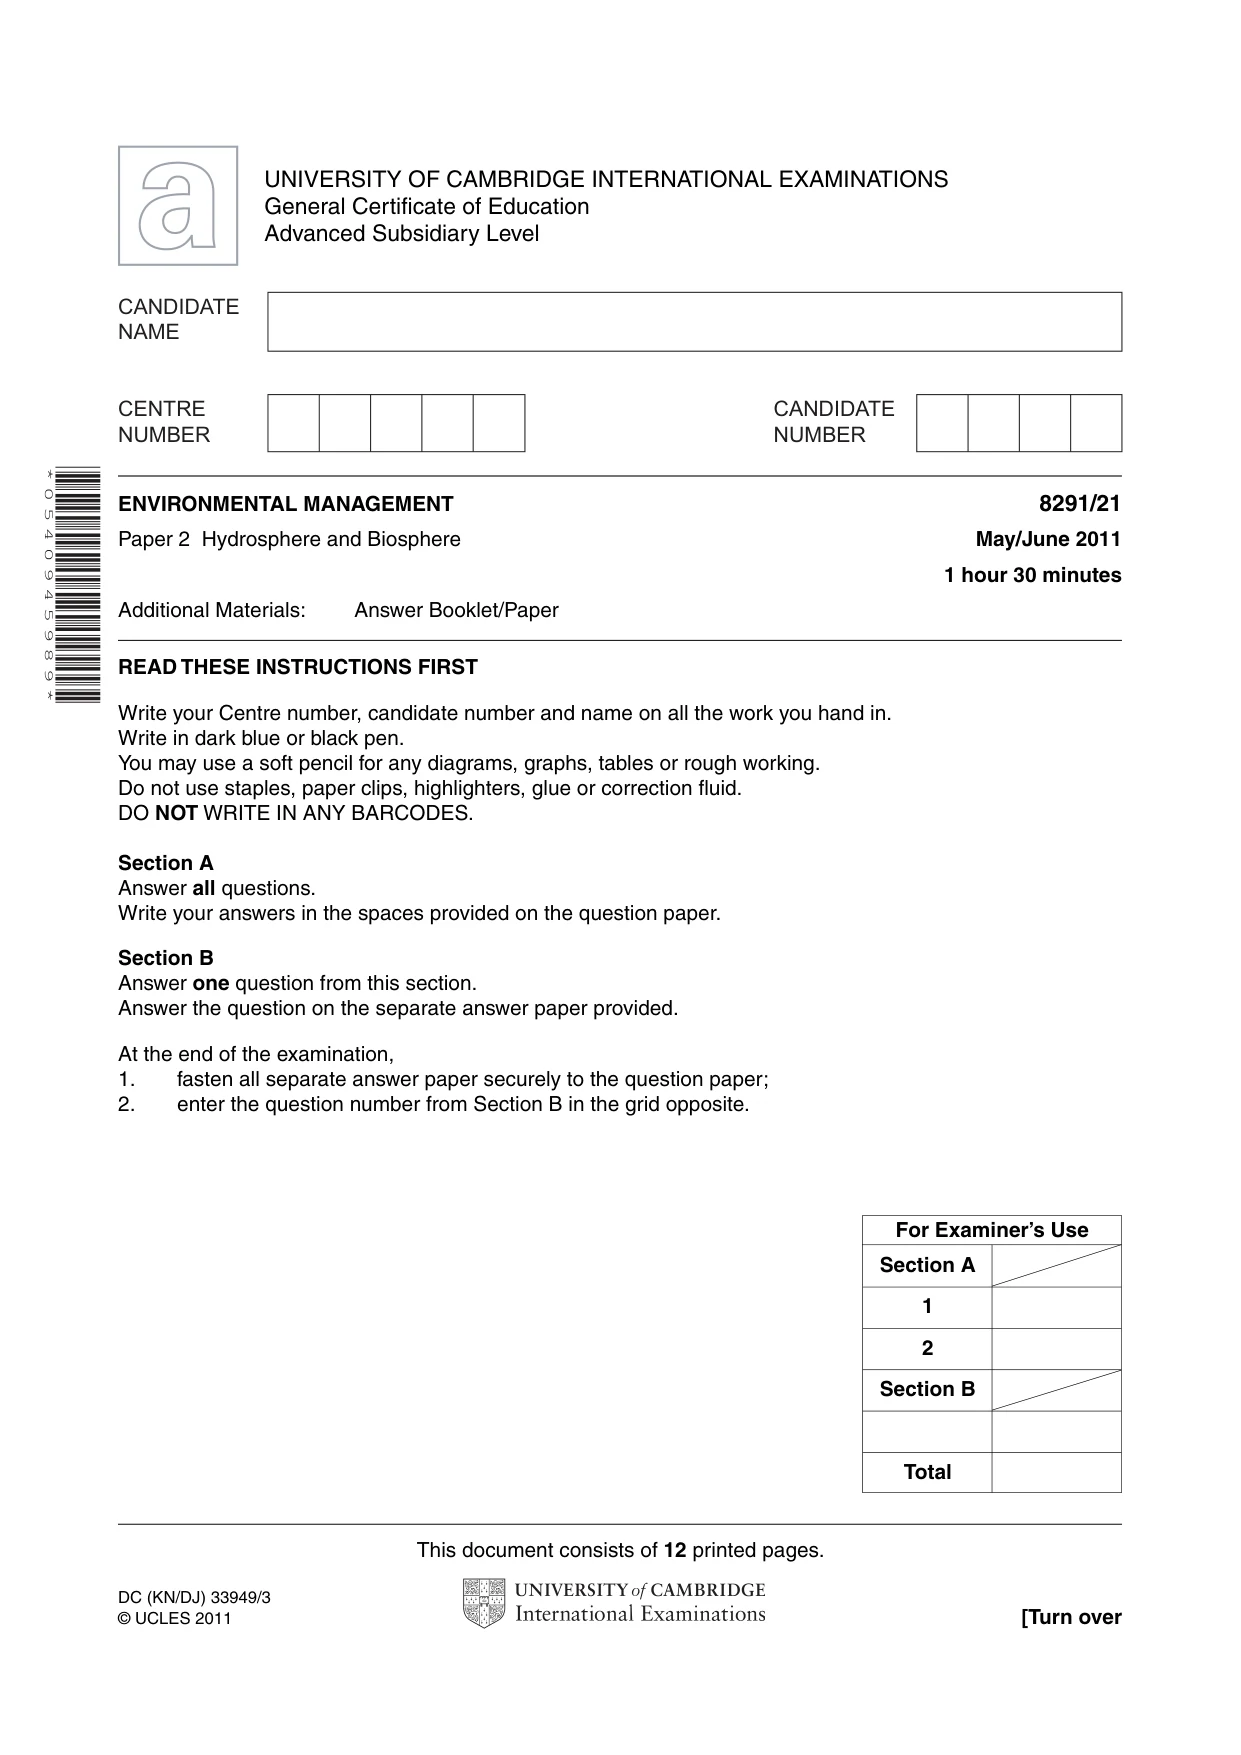
This document consists of 12 printed pages. DC (KN/DJ) 33949/3 © UCLES 2011 [Turn over UNIVERSITY OF CAMBRIDGE INTERNATIONAL EXAMINATIONS General Certificate of Education Advanced Subsidiary Level READ THESE INSTRUCTIONS FIRST Write your Centre number, candidate number and name on all the work you hand in. Write in dark blue or black pen. You may use a soft pencil for any diagrams, graphs, tables or rough working. Do not use staples, paper clips, highlighters, glue or correction fluid. DO NOT WRITE IN ANY BARCODES. Section A Answer all questions. Write your answers in the spaces provided on the question paper. Section B Answer one question from this section. Answer the question on the separate answer paper provided. At the end of the examination, 1. fasten all separate answer paper securely to the question paper; 2. enter the question number from Section B in the grid opposite. CANDIDATE NAME CENTRE NUMBER CANDIDATE NUMBER ENVIRONMENTAL MANAGEMENT 8291/21 Paper 2 Hydrosphere and Biosphere May/June 2011 1 hour 30 minutes Additional Materials: Answer Booklet/Paper * 0 5 4 0 9 4 5 9 8 9 * For Examiner’s Use Section A 1 2 Section B Total
Question paper, page 2
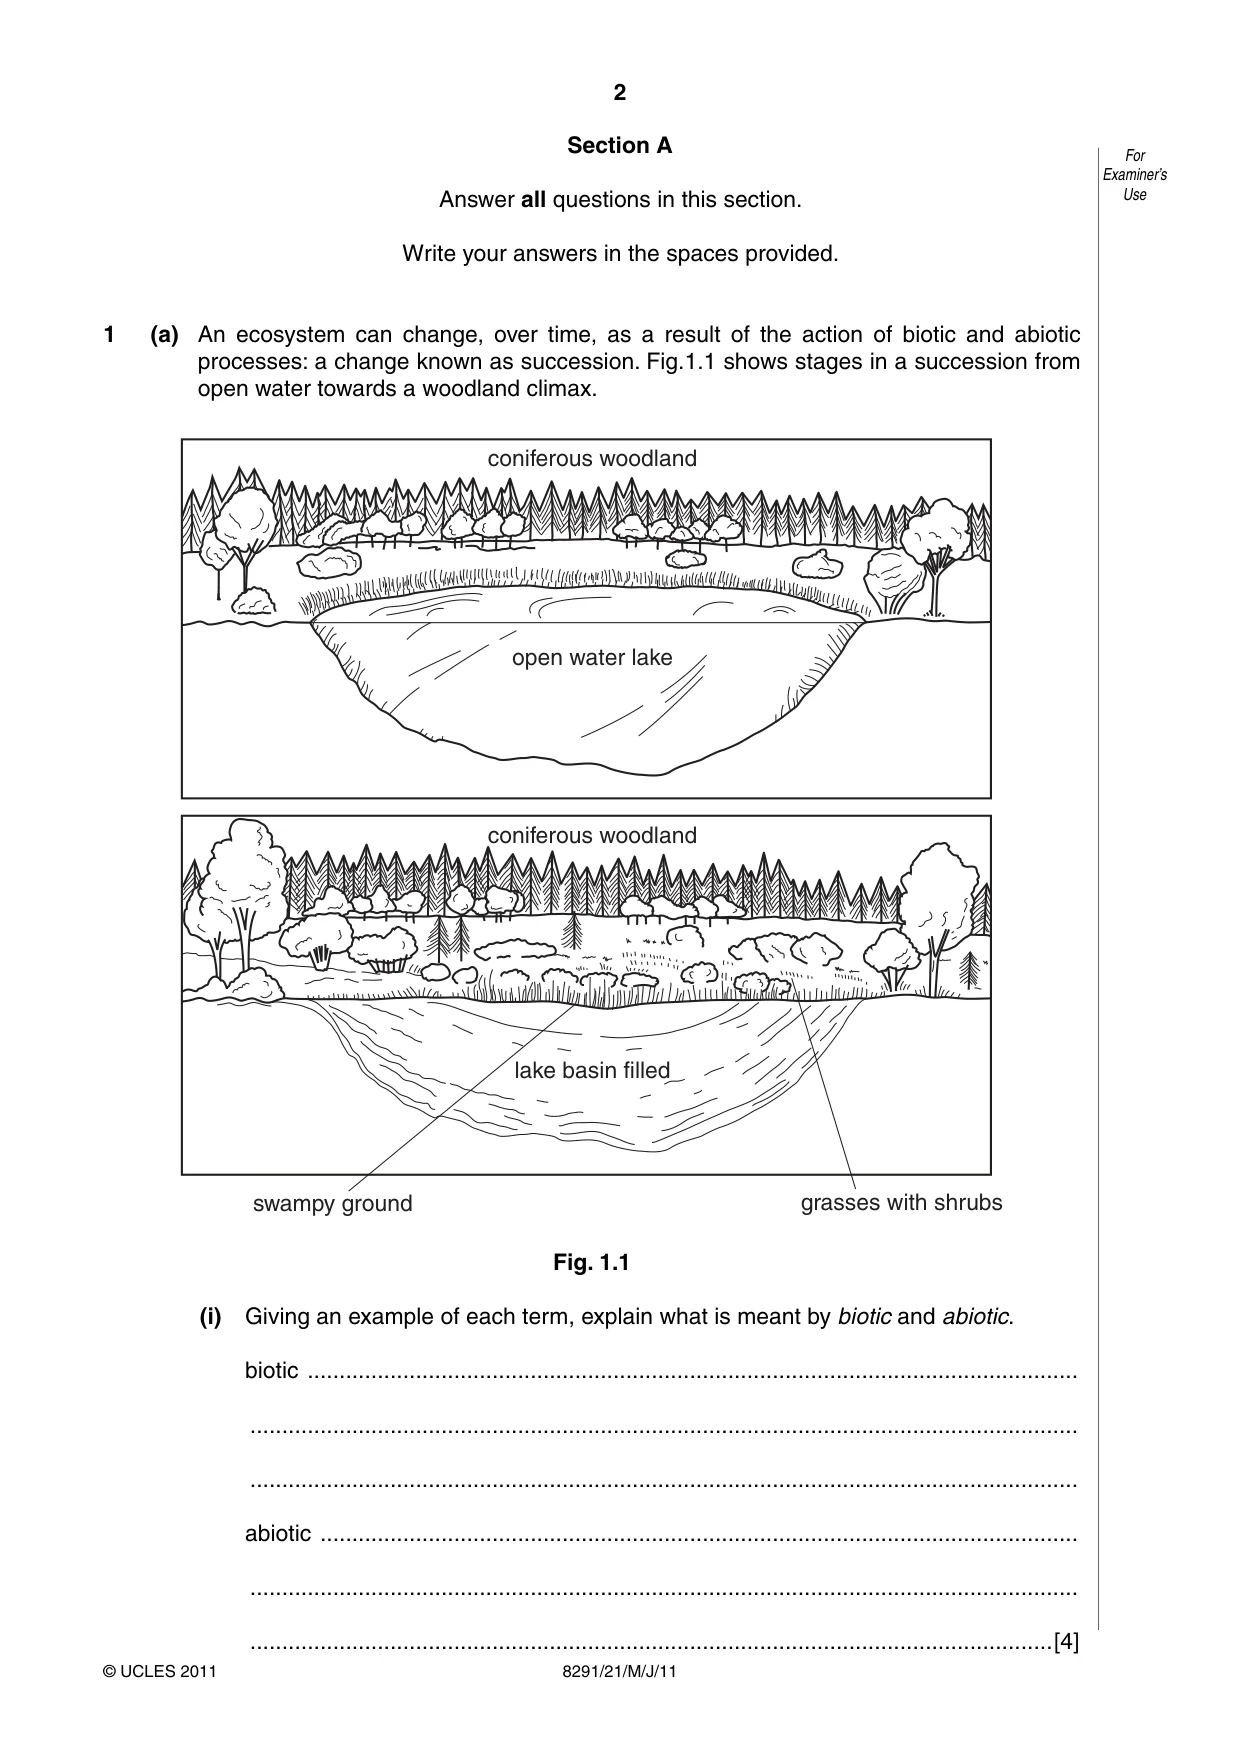
2 8291/21/M/J/11 For Examiner’s Use © UCLES 2011 Section A Answer all questions in this section. Write your answers in the spaces provided. 1 (a) An ecosystem can change, over time, as a result of the action of biotic and abiotic processes: a change known as succession. Fig.1.1 shows stages in a succession from open water towards a woodland climax. open water lake coniferous woodland coniferous woodland lake basin filled grasses with shrubs swampy ground Fig. 1.1 (i) Giving an example of each term, explain what is meant by biotic and abiotic. biotic … … … abiotic … … …[4]
Question paper, page 3
3 8291/21/M/J/11 [Turn over For Examiner’s Use © UCLES 2011 (ii) Suggest how the action of biotic and abiotic processes could have brought about the changes shown in Fig. 1.1. … … … … … … … …[4] (iii) Provided there is no human intervention, suggest how the area of grass and swampy ground develops into a woodland climax. … … … …[2]
Question paper, page 4
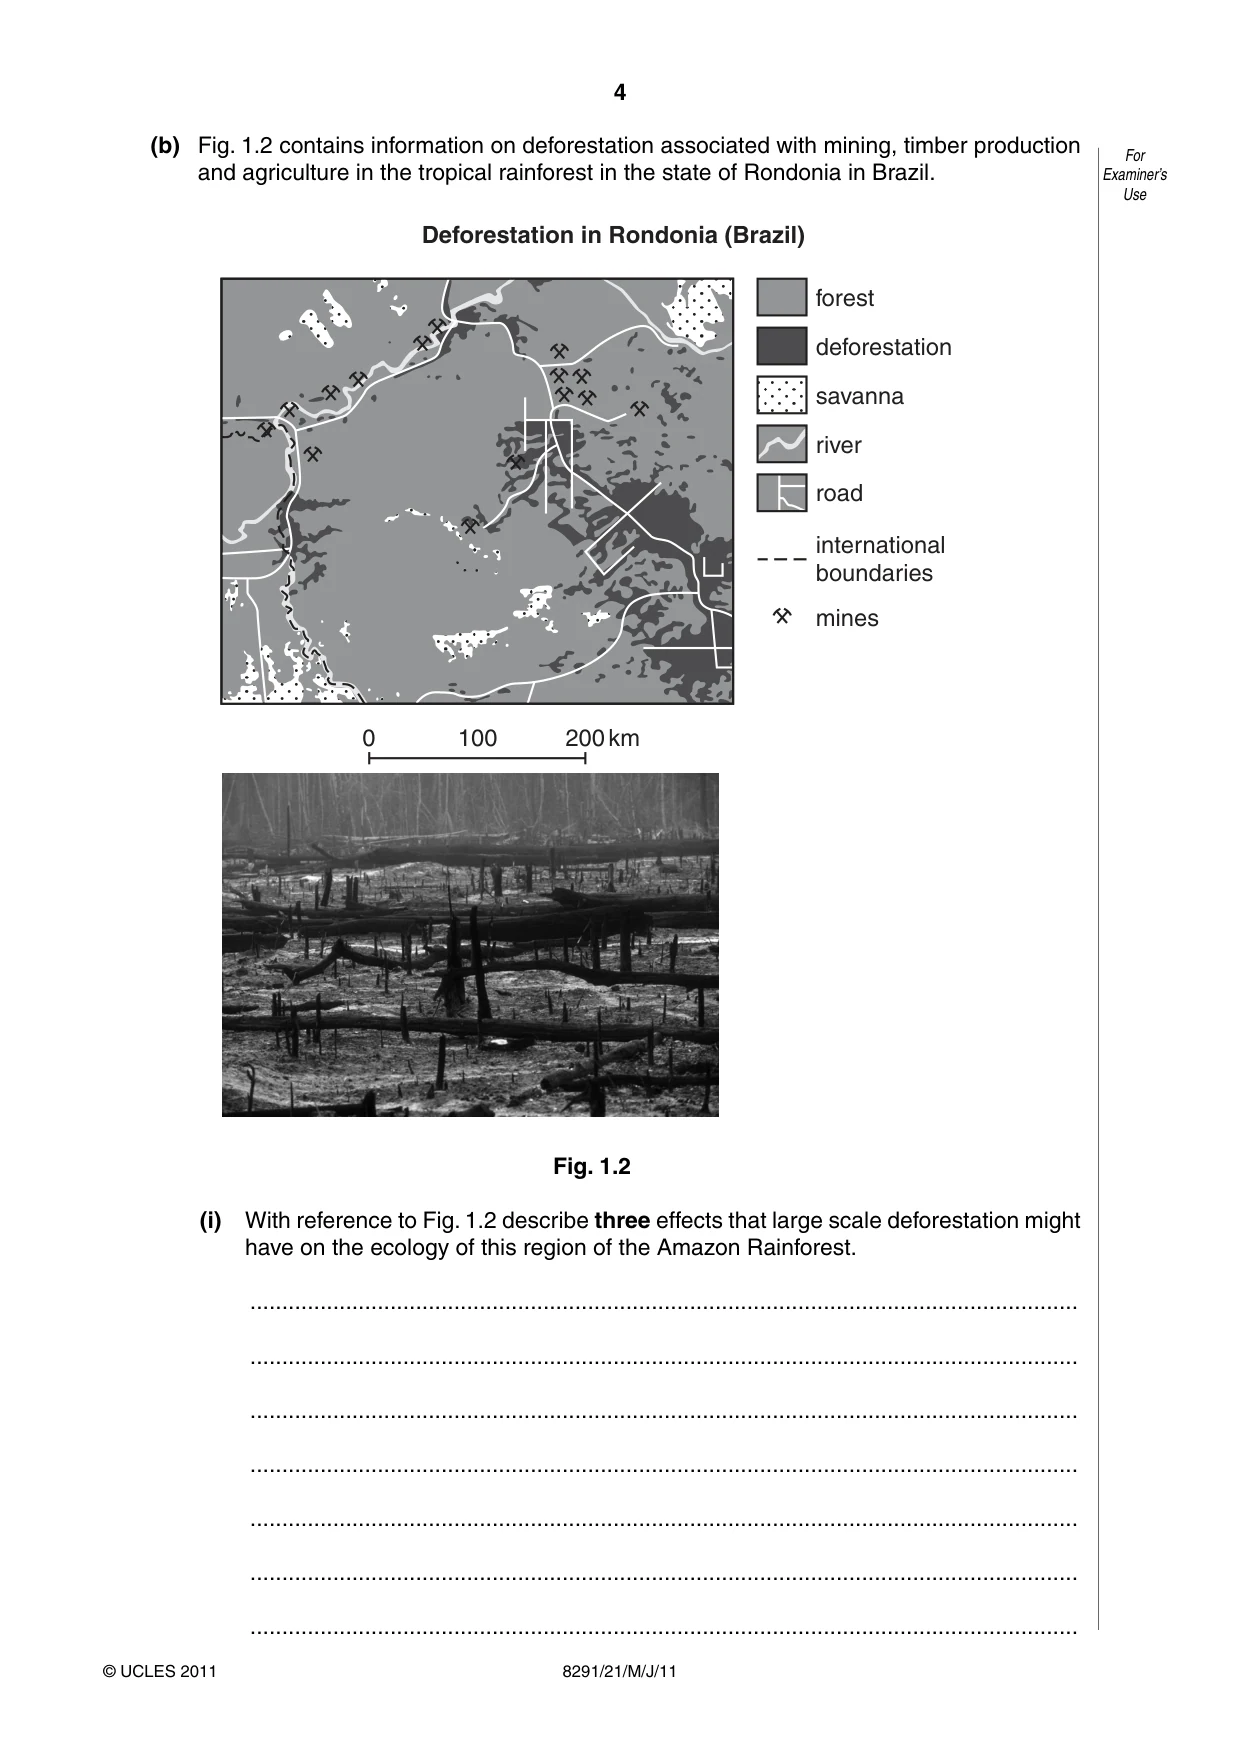
4 8291/21/M/J/11 For Examiner’s Use © UCLES 2011 (b) Fig. 1.2 contains information on deforestation associated with mining, timber production and agriculture in the tropical rainforest in the state of Rondonia in Brazil. Deforestation in Rondonia (Brazil) forest deforestation savanna river mines international boundaries 0 100 200 km road Fig. 1.2 (i) With reference to Fig. 1.2 describe three effects that large scale deforestation might have on the ecology of this region of the Amazon Rainforest. … … … … … … …
Question paper, page 5
5 8291/21/M/J/11 [Turn over For Examiner’s Use © UCLES 2011 … … … … … … … … …[6] (ii) Explain why it might take longer for an area of tropical rainforest to recover from mining than from felling and fires. … … … … … … … … … …[4] [Total: 20]
Question paper, page 6
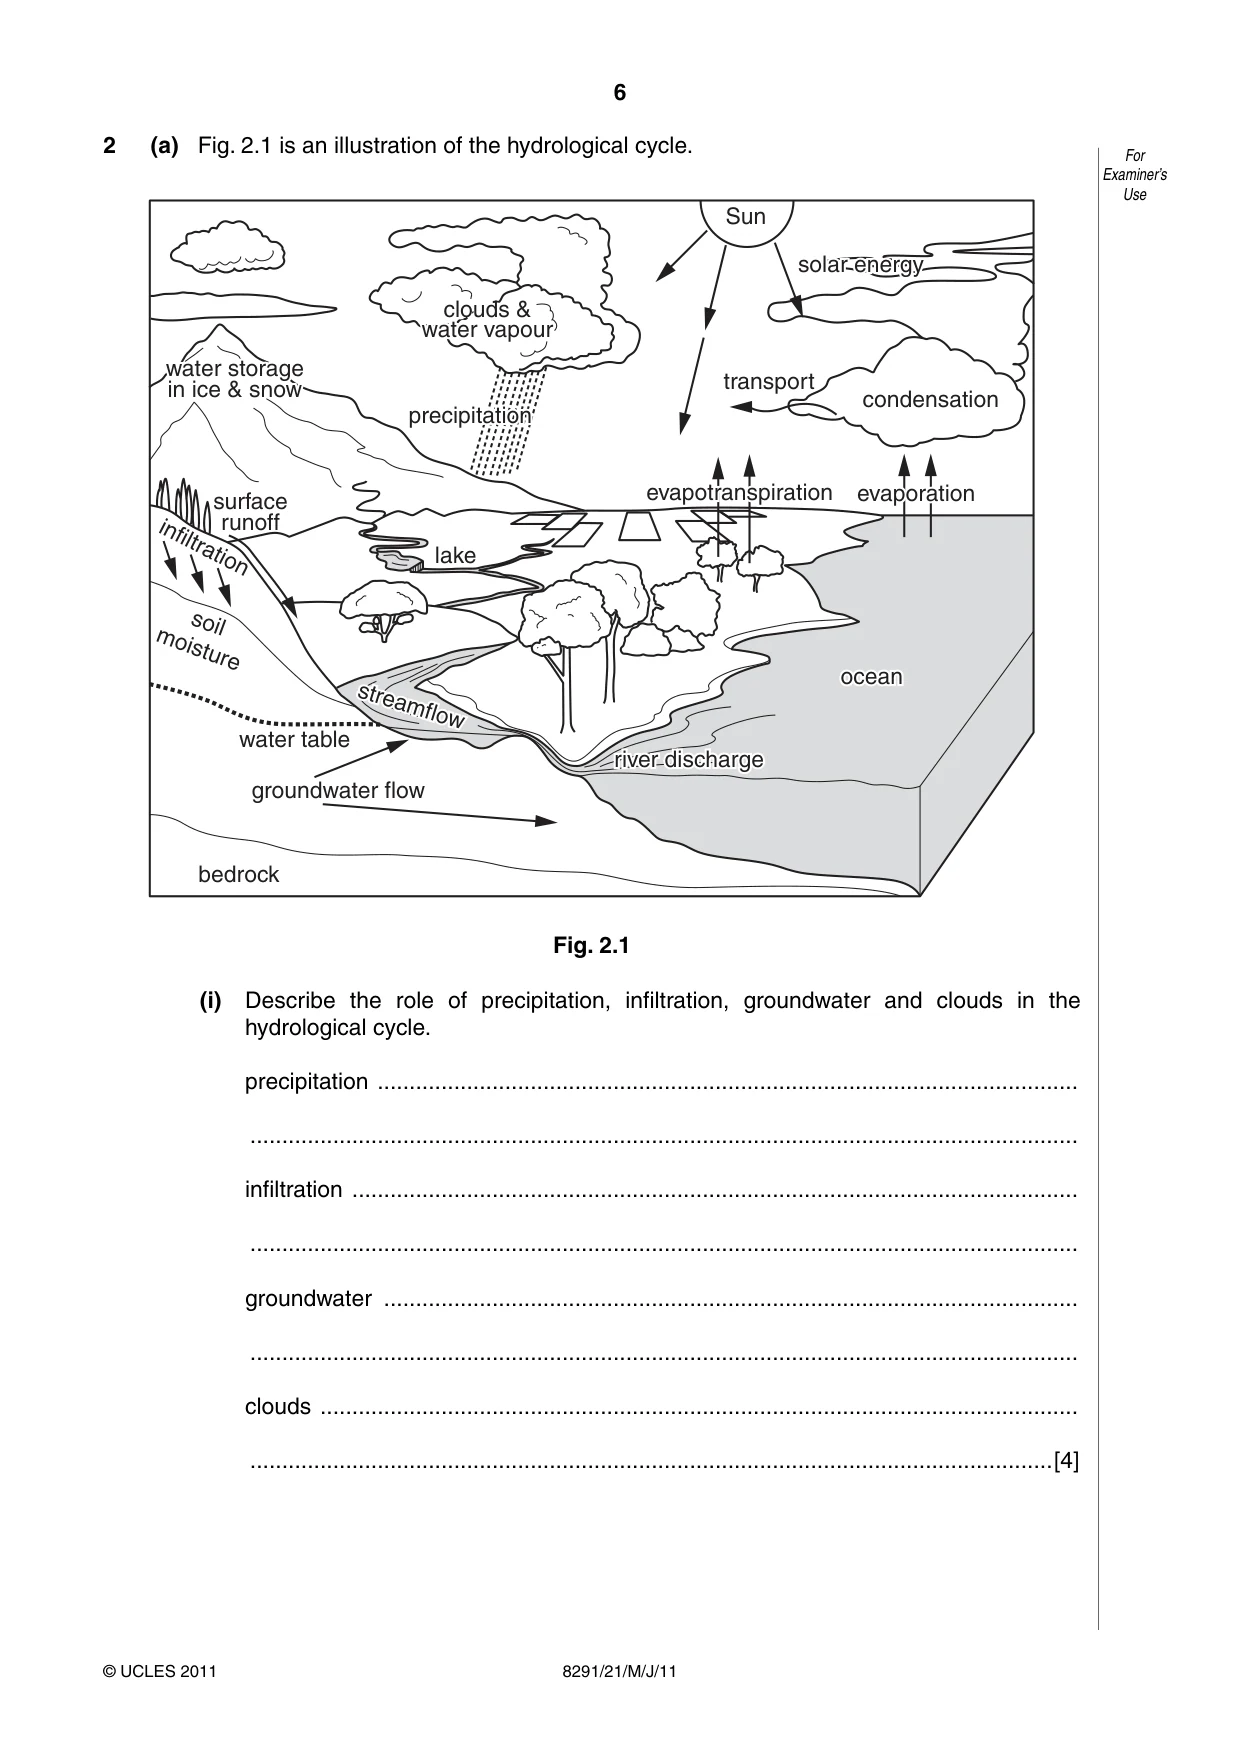
6 8291/21/M/J/11 For Examiner’s Use © UCLES 2011 2 (a) Fig. 2.1 is an illustration of the hydrological cycle. groundwater flow ocean ocean water table surface runoff soil moisture bedrock infiltration lake water storage water storage in ice & snow in ice & snow water storage in ice & snow precipitation precipitation precipitation Sun evapotranspiration evapotranspiration evapotranspiration condensation transport solar energy solar energy solar energy clouds & clouds & water vapor water vapor clouds & water vapour evaporation evaporation evaporation river discharge river discharge river discharge streamflow streamflow streamflow Fig. 2.1 (i) Describe the role of precipitation, infiltration, groundwater and clouds in the hydrological cycle. precipitation … … infiltration … … groundwater … … clouds … …[4]
Question paper, page 7
7 8291/21/M/J/11 [Turn over For Examiner’s Use © UCLES 2011 (ii) Global warming can mean a decrease in precipitation for some areas and an increase in other areas. Describe how either a decrease or an increase in precipitation could affect the hydrological system shown in Fig. 2.1. … … … … … … … … … … … … …[6]
Question paper, page 8
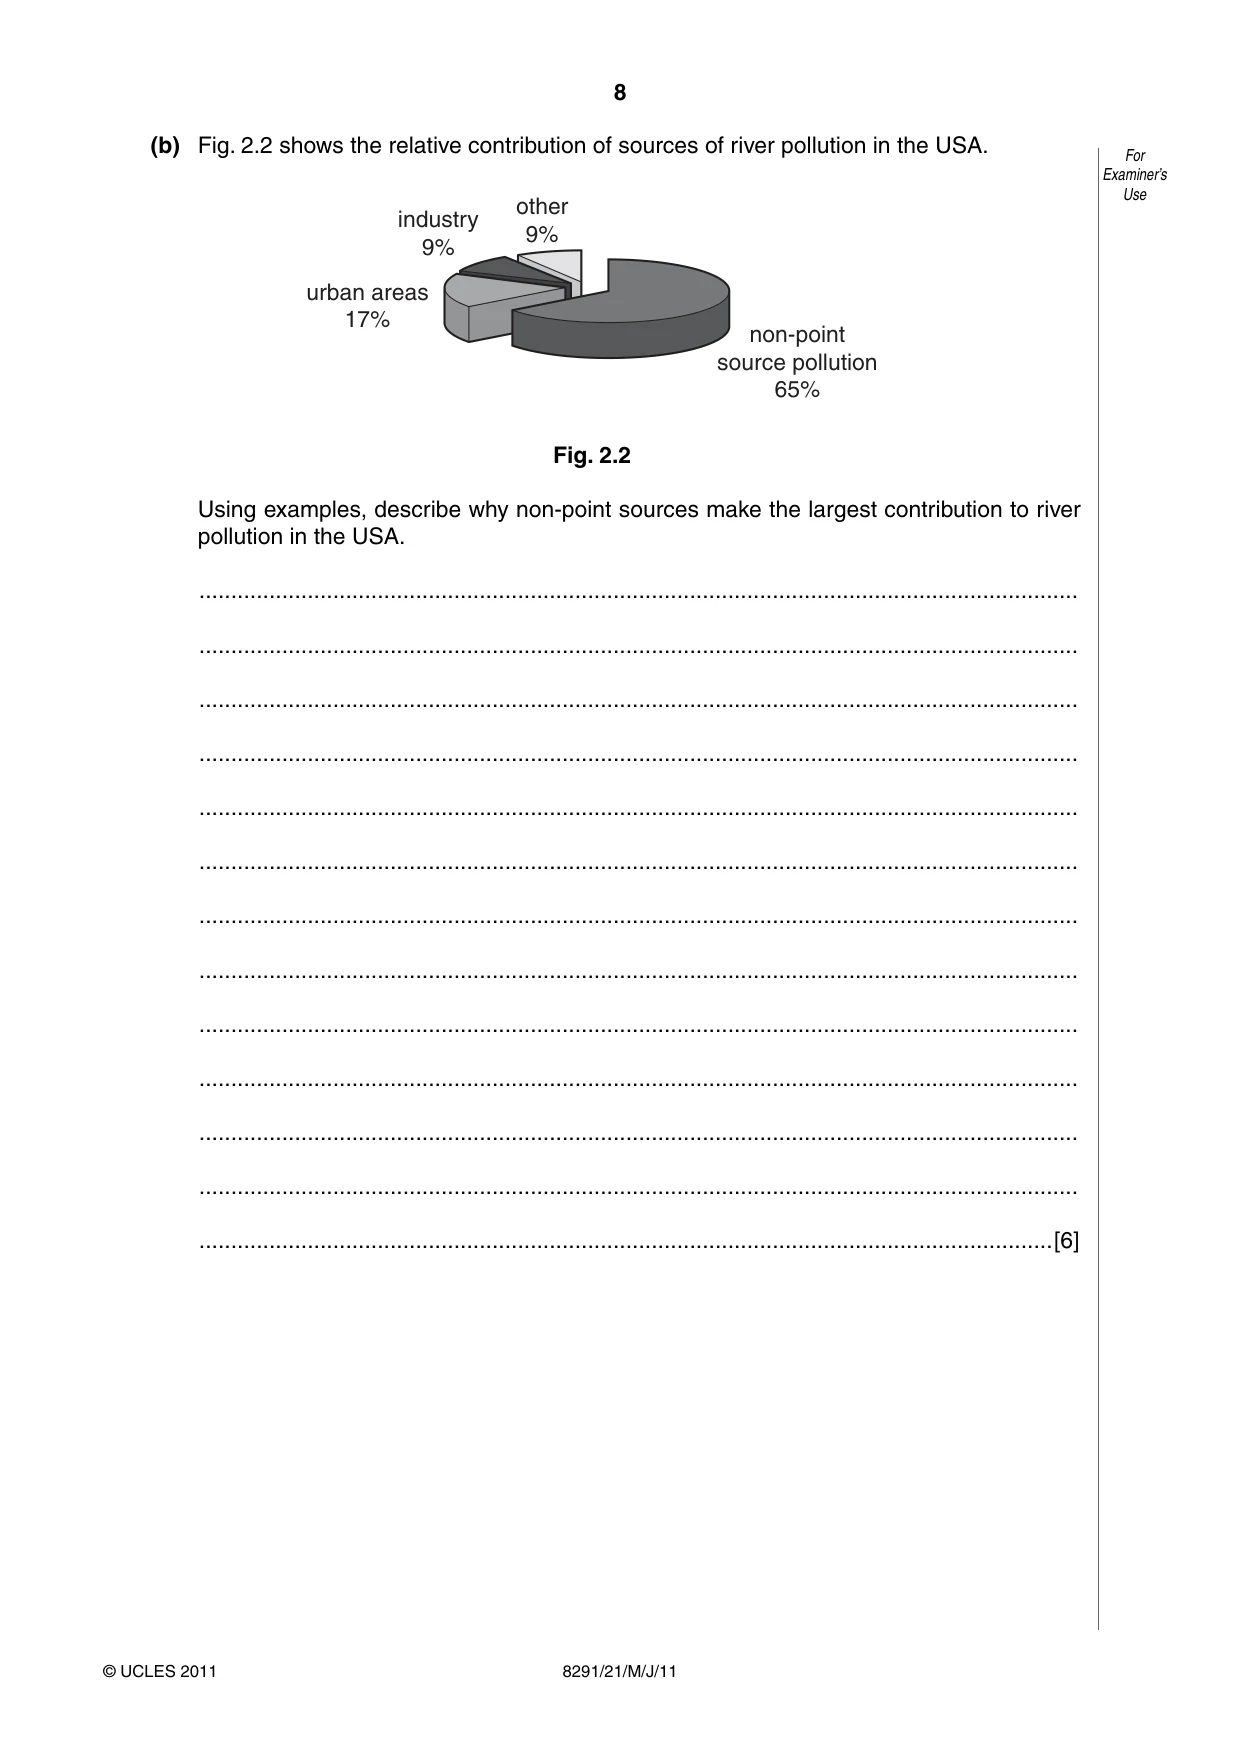
8 8291/21/M/J/11 For Examiner’s Use © UCLES 2011 (b) Fig. 2.2 shows the relative contribution of sources of river pollution in the USA. other 9% industry 9% urban areas 17% non-point source pollution 65% Fig. 2.2 Using examples, describe why non-point sources make the largest contribution to river pollution in the USA. … … … … … … … … … … … … …[6]
Question paper, page 9
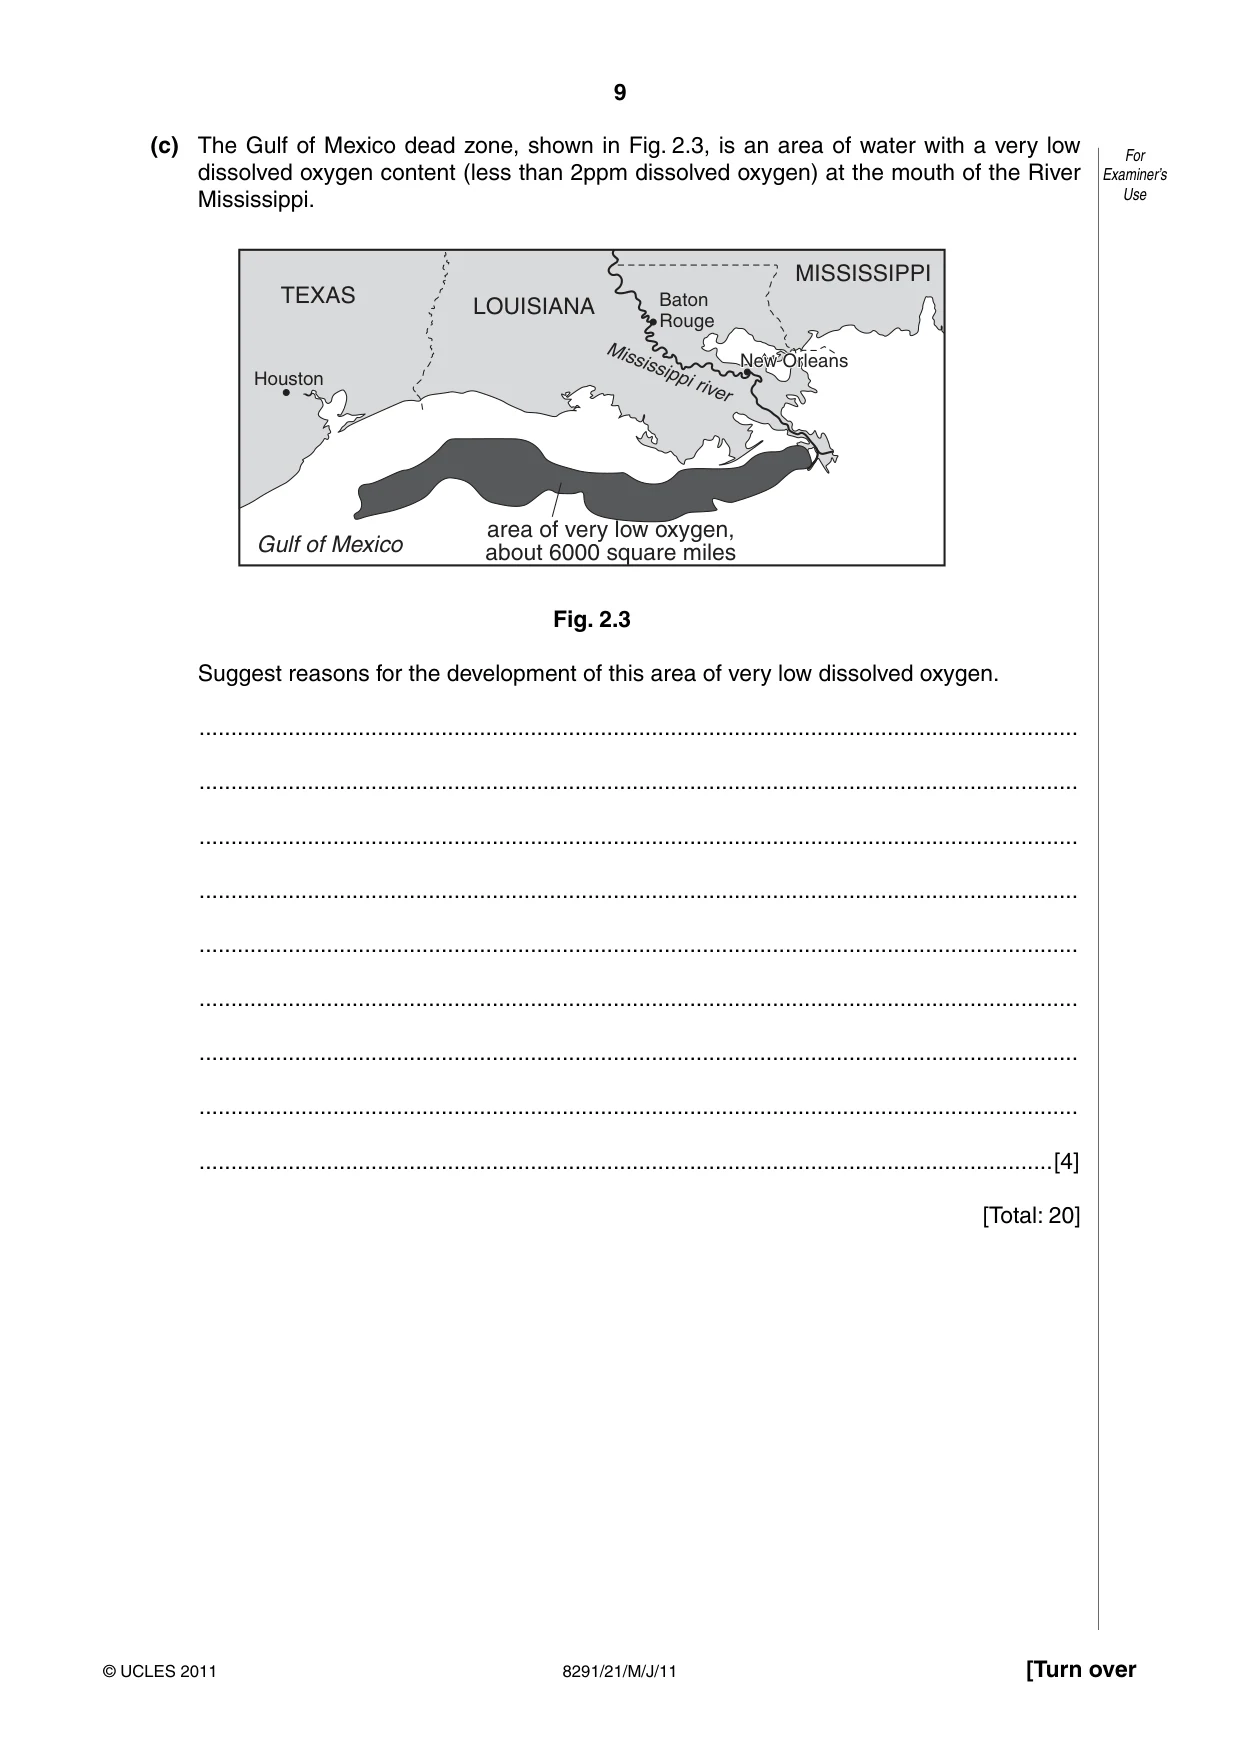
9 8291/21/M/J/11 [Turn over For Examiner’s Use © UCLES 2011 (c) The Gulf of Mexico dead zone, shown in Fig. 2.3, is an area of water with a very low dissolved oxygen content (less than 2ppm dissolved oxygen) at the mouth of the River Mississippi. Gulf of Mexico area of very low oxygen, about 6000 square miles Houston New Orleans New Orleans New Orleans Baton Rouge TEXAS LOUISIANA MISSISSIPPI Mississippi river Fig. 2.3 Suggest reasons for the development of this area of very low dissolved oxygen. … … … … … … … … …[4] [Total: 20]
Question paper, page 10
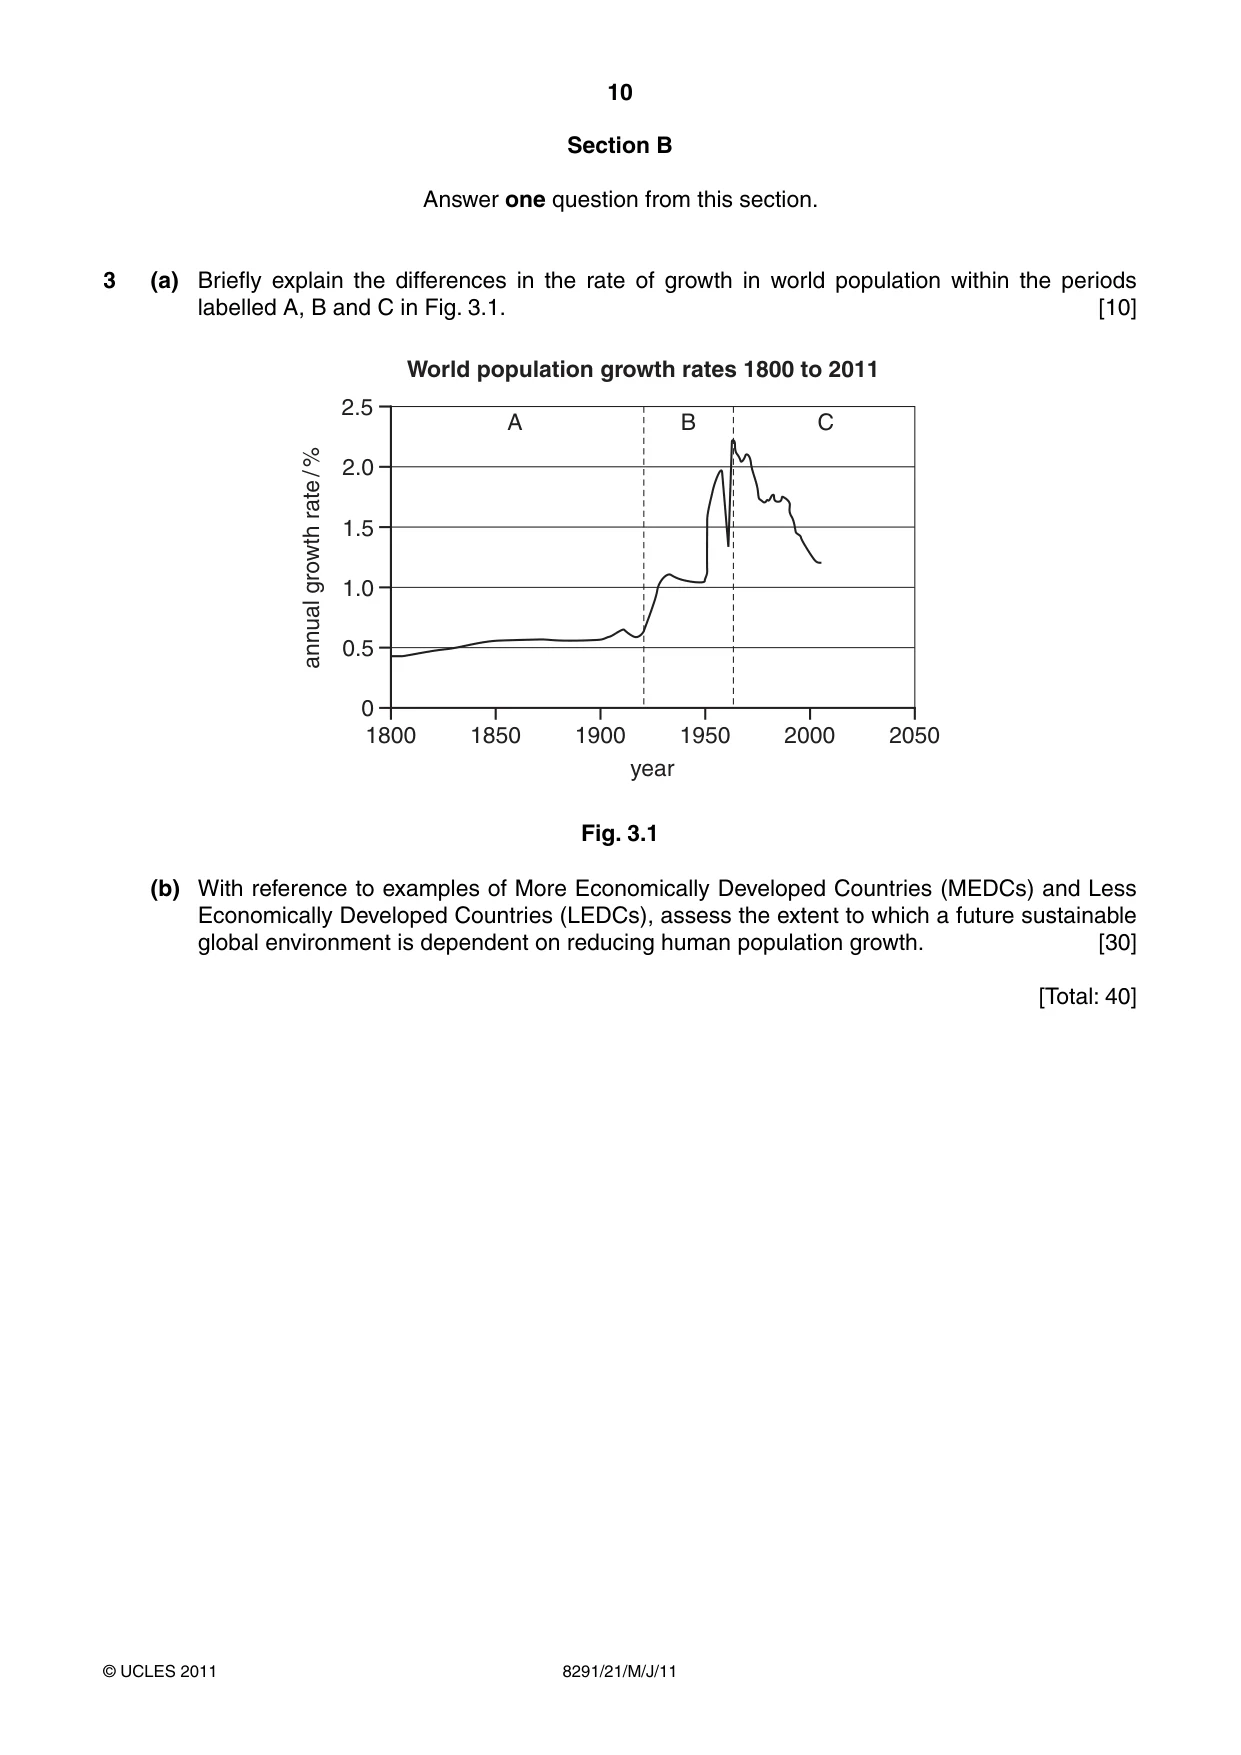
10 8291/21/M/J/11 © UCLES 2011 Section B Answer one question from this section. 3 (a) Briefly explain the differences in the rate of growth in world population within the periods labelled A, B and C in Fig. 3.1. [10] 2.5 A B C 2.0 1.5 annual growth rate / % 1.0 0.5 0 1800 1850 1900 year 1950 2000 2050 World population growth rates 1800 to 2011 Fig. 3.1 (b) With reference to examples of More Economically Developed Countries (MEDCs) and Less Economically Developed Countries (LEDCs), assess the extent to which a future sustainable global environment is dependent on reducing human population growth. [30] [Total: 40]
Question paper, page 11
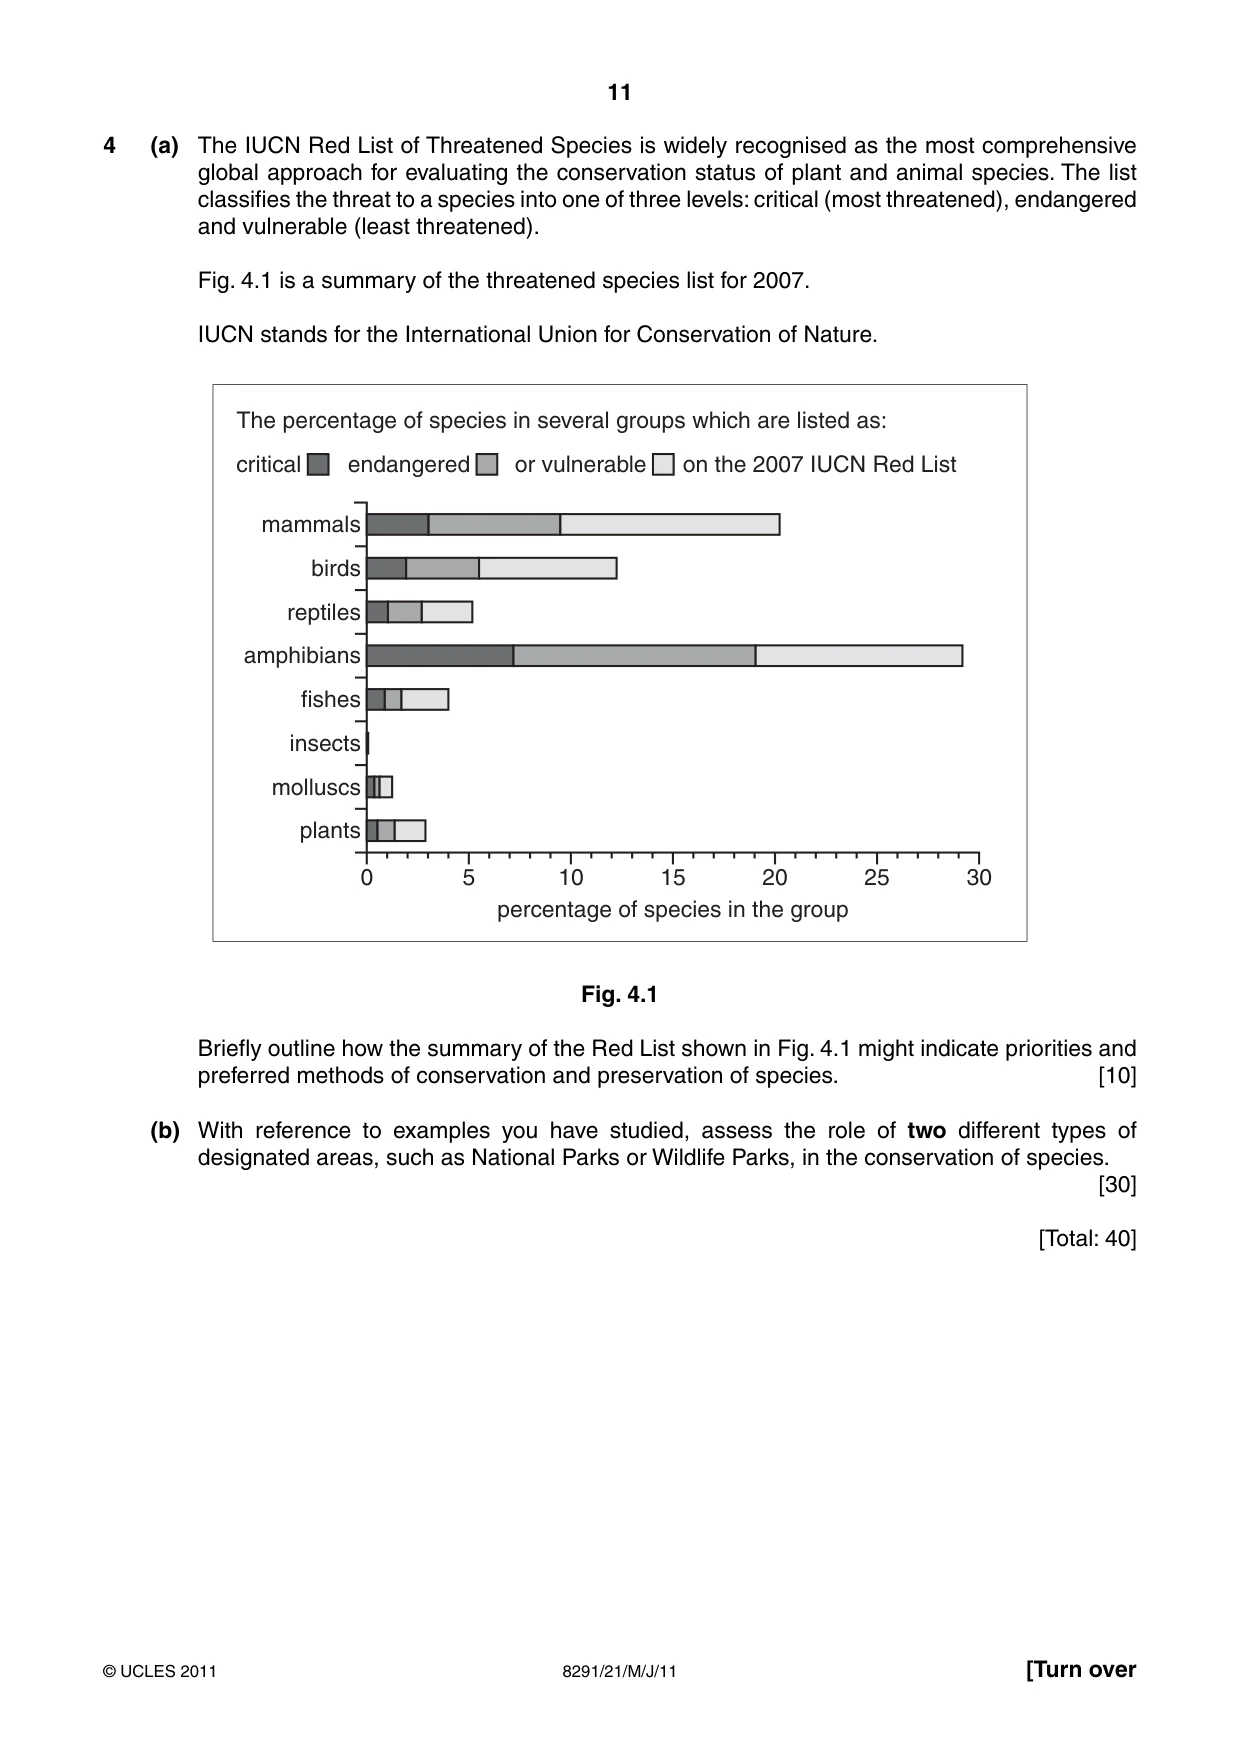
11 8291/21/M/J/11 © UCLES 2011 [Turn over 4 (a) The IUCN Red List of Threatened Species is widely recognised as the most comprehensive global approach for evaluating the conservation status of plant and animal species. The list classifies the threat to a species into one of three levels: critical (most threatened), endangered and vulnerable (least threatened). Fig. 4.1 is a summary of the threatened species list for 2007. IUCN stands for the International Union for Conservation of Nature. mammals birds reptiles amphibians fishes insects molluscs plants 0 5 10 15 percentage of species in the group 20 25 30 critical endangered or vulnerable on the 2007 IUCN Red List The percentage of species in several groups which are listed as: Fig. 4.1 Briefly outline how the summary of the Red List shown in Fig. 4.1 might indicate priorities and preferred methods of conservation and preservation of species. [10] (b) With reference to examples you have studied, assess the role of two different types of designated areas, such as National Parks or Wildlife Parks, in the conservation of species. [30] [Total: 40]
Question paper, page 12
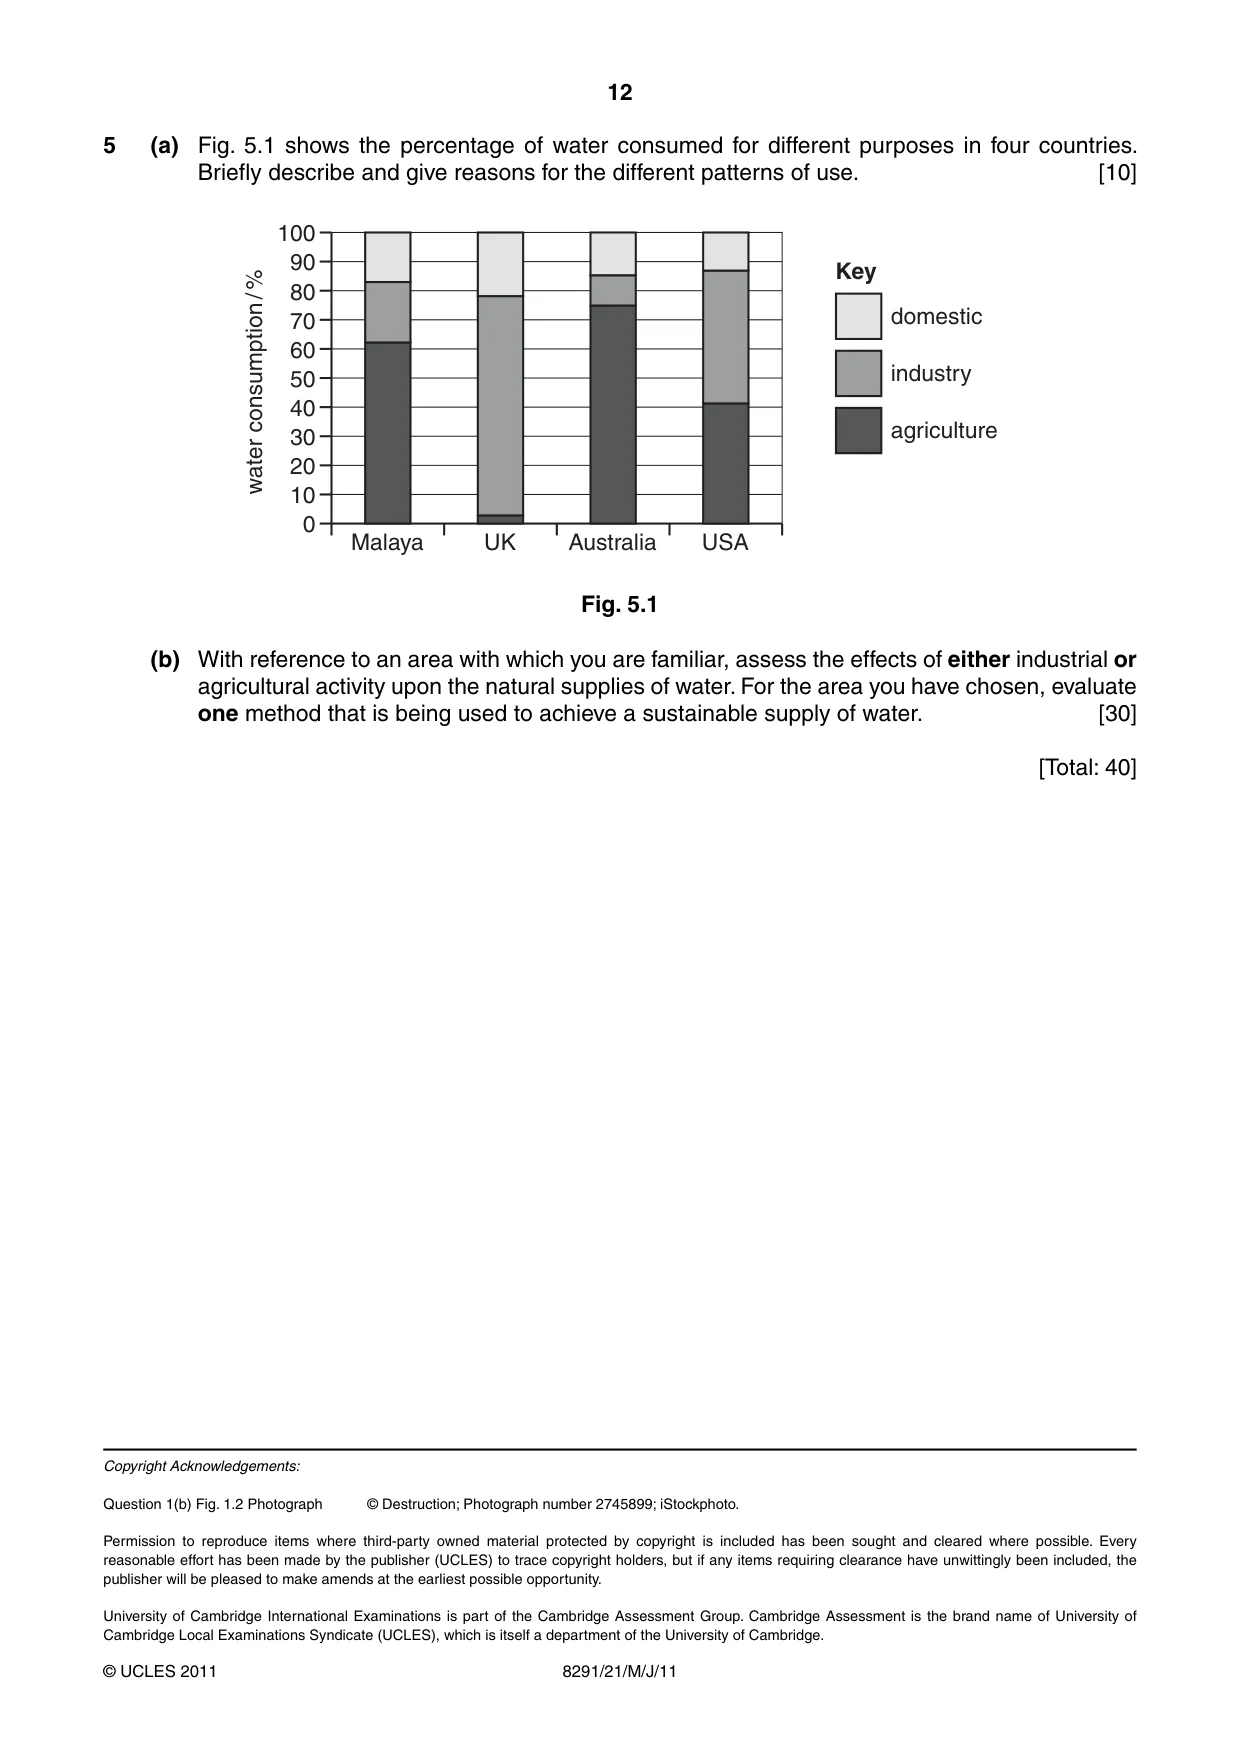
12 8291/21/M/J/11 © UCLES 2011 5 (a) Fig. 5.1 shows the percentage of water consumed for different purposes in four countries. Briefly describe and give reasons for the different patterns of use. [10] 100 water consumption / % 90 80 70 60 50 40 30 20 10 0 Malaya UK Australia USA Key domestic industry agriculture Fig. 5.1 (b) With reference to an area with which you are familiar, assess the effects of either industrial or agricultural activity upon the natural supplies of water. For the area you have chosen, evaluate one method that is being used to achieve a sustainable supply of water. [30] [Total: 40] Copyright Acknowledgements: Question 1(b) Fig. 1.2 Photograph © Destruction; Photograph number 2745899; iStockphoto. Permission to reproduce items where third-party owned material protected by copyright is included has been sought and cleared where possible. Every reasonable effort has been made by the publisher (UCLES) to trace copyright holders, but if any items requiring clearance have unwittingly been included, the publisher will be pleased to make amends at the earliest possible opportunity. University of Cambridge International Examinations is part of the Cambridge Assessment Group. Cambridge Assessment is the brand name of University of Cambridge Local Examinations Syndicate (UCLES), which is itself a department of the University of Cambridge.
Mark scheme, page 1
UNIVERSITY OF CAMBRIDGE INTERNATIONAL EXAMINATIONS GCE Advanced Subsidiary Level and GCE Advanced Level MARK SCHEME for the May/June 2011 question paper for the guidance of teachers 8291 ENVIRONMENTAL MANAGEMENT 8291/21 Paper 2, maximum raw mark 80 This mark scheme is published as an aid to teachers and candidates, to indicate the requirements of the examination. It shows the basis on which Examiners were instructed to award marks. It does not indicate the details of the discussions that took place at an Examiners’ meeting before marking began, which would have considered the acceptability of alternative answers. Mark schemes must be read in conjunction with the question papers and the report on the examination. • Cambridge will not enter into discussions or correspondence in connection with these mark schemes. Cambridge is publishing the mark schemes for the May/June 2011 question papers for most IGCSE, GCE Advanced Level and Advanced Subsidiary Level syllabuses and some Ordinary Level syllabuses.
Mark scheme, page 2
Page 2 Mark Scheme: Teachers’ version Syllabus Paper GCE AS/A LEVEL – May/June 2011 8291 21 © University of Cambridge International Examinations 2011 Section A Answer all questions in this section. 1 (a) An ecosystem can change, over time, as a result of the action of biotic and abiotic processes: a change known as succession. Fig. 1.1 shows stages in a succession from open water towards a woodland climax. (i) Giving an example of each term, explain what is meant by biotic and abiotic. [4] Credit one mark for the definition and the second for the example. Credit reflexive points non-living and living with one mark. Abiotic:- an element derived from the physical environment such as soil, water, heat i.e. non-living. Biotic:- a factor derived from fauna or flora including vegetation, humus, insects i.e. biological factors. (ii) Suggest how the action of biotic and abiotic processes could have brought about the changes shown in Fig. 1.1. [4] The establishment of meadow grass is a seral stage in the succession. The succession involves: • the gradual infilling of the lake from sediment (abiotic)(1 mark) and lake vegetation reeds (1 mark) etc. • the formation of marshy ground derived from grasses, moss (1 mark). • following some drying of the surface, the invasion of shrubs, bushes and around the edge, trees; the area of swamp ground has contracted to the centre (1 mark). A maximum of 2 marks if there no reference to Fig. 1.1. (iii) Provided there is no human intervention, suggest how the area of grass and swampy ground develops into a woodland climax. [2] This takes the succession beyond the stages in Fig. 1.1. Answers should include: further invasion by woodland – soil adaptation via soil humus content, development of woodland ecosystem. As there are only two marks do not expect lengthy and complex answers. Credit 1 mark for two linked points.
Mark scheme, page 3
Page 3 Mark Scheme: Teachers’ version Syllabus Paper GCE AS/A LEVEL – May/June 2011 8291 21 © University of Cambridge International Examinations 2011 (b) Fig. 1.2 contains information on deforestation associated with mining, timber production and agriculture in the tropical rain forest in the state of Rondonia in Brazil. (i) With reference to Fig. 1.2 describe three effects that large scale deforestation might have on the ecology of this region of the Amazon Rain Forest. [6] Credit each of three points with 2 marks. As an assessment is needed do not credit a single word or very simple statement. 2 marks for a well developed point involving a brief description and assessment. There are a wide range of points that could include: loss of biodiversity, loss of habitat, increased soil erosion, river pollution, and desertification. (ii) Explain why it might take longer for an area of tropical rain forest to recover from mining than from felling and fires. [4] Award 1 mark for 4 points with up to 3 marks for felling/fires and max 2 for mining. Basically the type of disturbance can have different effects and the recovery time will vary. Fires retain the roots and seeds embedded in the ground therefore quick recovery. Felling retains the soil, root systems and vegetation. Mining imposes more difficulties as both soil and vegetation are removed; plus, chemical and solid waste adds to land and river pollution. [Total: 20] 2 (a) Fig. 2.1 is an illustration of the hydrological cycle. (i) Describe the role of precipitation, infiltration, ground water and clouds in the hydrological cycle. [4] Only credit answers that mention the role of the component. e.g. precipitation the major input of water to start the cycle infiltration the passage of water into the soil towards the water table ground water water stored within pores, joints, etc, beneath the water table clouds act as a temporary store of water vapour (ii) Global warming can mean a decrease in precipitation for some areas and an increase in other areas. Describe how either a decrease or an increase in precipitation could affect the hydrological system shown in Fig. 2.1. [6] Award 2 marks for each of three valid and developed points for either condition. Weakly developed but relevant points deserve 1 mark. A decrease in ppt: will reduce snow and ice storage, river discharge with knock on effects such as vegetation degradation and the need for reservoirs and careful water management. An increase in ppt: could increase snow and ice-fields; increase river discharge and introduce the likelihood of flooding as the groundwater store will rise encouraging saturation.
Mark scheme, page 4
Page 4 Mark Scheme: Teachers’ version Syllabus Paper GCE AS/A LEVEL – May/June 2011 8291 21 © University of Cambridge International Examinations 2011 (b) Fig. 2.2 shows the relative contribution of sources of river pollution in the USA. Using examples, describe why non-point sources make the largest contribution to river pollution in the USA. [6] Non-point sources are where the pollutant has been transported to another location via groundwater, rivers, and wind. Agricultural pollutants enter ground water then rivers en-route to a lake or the sea. Industrial pollution can enter rivers, the air, e.g. acid rain affects vegetation and water some distance from the source. Domestic waste enters sewers, then outlets (point) before being transported downstream. Therefore most recorded pollution (65%) is found in areas distant from the actual source. 5-6 mark answers will use the data and give at least two reasons why most pollution is transported away from its original source. Such answers should refer to the lack of regulation and control. 3-4 mark answers will describe at least one reason why non-point is the largest and mention contributors. 1-2 mark answers will lack clarity on non-point pollution and hint at reasons rather than stating them. (c) The Gulf of Mexico dead zone, shown in Fig. 2.3, is a region of water with a very low dissolved oxygen content (less than 2ppm dissolved oxygen) at the mouth of the River Mississippi. Suggest reasons for the development of this area of very low dissolved oxygen. [4] Answers should contain: • references to agricultural and industrial pollution from the Mississippi • eutrophication (enrichment by minerals) causing algae (red tides) • algae have a high turnover rate. Dead algae are broken down by anaerobic bacteria which uses up oxygen • low oxygen plus the blocking of sunlight can kill off fish and other marine life. [Total: 20]
Mark scheme, page 5
Page 5 Mark Scheme: Teachers’ version Syllabus Paper GCE AS/A LEVEL – May/June 2011 8291 21 © University of Cambridge International Examinations 2011 Section B Answer one question from this section. 3 (a) Briefly explain the differences in the rate of growth in world population within the periods labelled A, B and C in Fig. 3.1. [10] The graph refers to rates of population growth, not population size, therefore there is positive population growth during the whole period. As A, B and C are specific periods credit 3 marks for each and 1 for recognising the idea of positive population growth rates. The changes to the rates are caused by socio-economic conditions. A The rate is low; large families are common due to a high birth rate but the birth rate is also high. Such factors as replacement needs, culture, maintaining the work-force, poor medical care, disease account for this phase of low population growth. B A period of accelerating population growth and the death rate plummets and the birth rate remains high. Improvements to medical care, vaccinations, better food and most important a higher standard of living increase life expectancy. It takes longer for the birth rate to catch up. C A return to low population growth. High living standards, family planning, career mothers etc, help to reduce the birth rate to the low position of the death rate. Because this is a global statistic it masks the fact that some countries have entered negative population growth. 8 to 10 mark answers will consider each stage with, for each, two aspects of the descriptors above. 4 to 7 mark answers will consider at least two elements and give limited coverage of the descriptors (i.e. 1 or 2). Maximum of 6 if the answer only mentions the data. 1 to 3 mark answers may be very brief in all three elements or only consider one.
Mark scheme, page 6
Page 6 Mark Scheme: Teachers’ version Syllabus Paper GCE AS/A LEVEL – May/June 2011 8291 21 © University of Cambridge International Examinations 2011 (b) With reference to examples of More Economically Developed Countries (MEDCs) and Less Economically Developed Countries (LEDCs), assess the extent to which a future sustainable global environment is dependent on reducing human population growth. [30] The question is about the benefits to be accrued from reducing population growth. As the scale and nature of the benefits for MEDCs are different to LEDCs there is an expectation to use examples from both. The question requirements are: • to express an understanding of the fact that continued high rates of population growth are unsustainable • as the Earth has finite resources there is a point at which it cannot support its population (thought to be in the region of 15 billion) • it follows that the one variable that can be better managed is population: the argument is Malthusian • this scenario should be debated; optimists would argue for ‘necessity is the mother of invention’ • candidates need to select examples from both LEDCs and MEDCs to argue their case. Band 1 answers will cover the five requirements of the question. These answers do not have to agree with Engleman’s statement (the question statement) but should make valid and supported evaluations. [25 – 30] Band 3 answers will be less well balanced and argue for one side of the argument. Expect some answers to be general or superficial in coverage. Examples will be stated but not necessarily integrated into the analysis. Good answers with only 1 example maximum 18. [13 – 18] Band 4 answers will be brief and give limited arguments both for and against Engleman's statement. Other answers will only develop either LEDCs or MEDCs. Examples will be poorly developed. [6 – 12] [Total: 40]
Mark scheme, page 7
Page 7 Mark Scheme: Teachers’ version Syllabus Paper GCE AS/A LEVEL – May/June 2011 8291 21 © University of Cambridge International Examinations 2011 4 (a) The IUCN Red List of Threatened Species is widely recognized as the most comprehensive global approach for evaluating the conservation status of plant and animal species. The list classifies the threat to a species into one of three levels: critical (most threatened), endangered and vulnerable (least threatened). Fig. 4.1 is a summary of the threatened species list for 2007. IUCN stands for The International Union for Conservation of Nature. Briefly outline how the summary of the Red List shown in Fig. 4.1 might indicate priorities and preferred methods of conservation and preservation of species. [10] IUCN (International Union for Conservation of Nature) The research into, and subsequent publication of such information informs conservationists, governments and the general public; this in itself is a vital aspect of environmental management. Answers should consider the ways in which the list highlights species whose survival is at a critical stage; they are endangered or vulnerable. Based on this, ways of preserving or conserving species can be planned. Where the situation is: • critical, preservation in zoos, aquaria, aviaries can occur; here they can be studied, bred and possibly prepared to be returned to the wild. Strict legislation on hunting/poaching • endangered species are carefully monitored via wildlife parks, national parks; individual animals are ‘ringed’ or ‘tagged’ and numbers recorded, etc. Legislation controlling poaching and hunting/ culling is carefully controlled • vulnerable species have less surveillance but animals are observed in the wild or in monitored parks. 8 to 10 mark answers have reference to the three levels with appropriate conservation and preservation strategies. 4 to 7 mark answers are less clear about the three levels and conservation rather than preservation is linked to at least one of the levels. Maximum of 6 for an answer that only quotes data from the chart. 1 to 3 mark answers are relevant but give the three levels superficial coverage and it is unlikely that these are linked to conservation.
Mark scheme, page 8
Page 8 Mark Scheme: Teachers’ version Syllabus Paper GCE AS/A LEVEL – May/June 2011 8291 21 © University of Cambridge International Examinations 2011 (b) With reference to examples you have studied, assess the role of two different types of designated areas such as National Parks or Wildlife Parks, in the conservation of species. [30] Part (a) should provide an effective lead in to the content of this question. The question is concerned with how species are conserved within designated areas. Although the question refers to national parks and wildlife parks, this is only meant as guidance. The question requirements are to: • select two different types of conservation areas • describe how they engage on the conservation of species • assess this role in terms of success or failure Examples can include: wildlife parks, national parks, world heritage sites, safari parks, zoos, sites of special scientific interest or any other local designation. Strategies would be: confinement and protection of species; breeding, research into the species and its habitat, education, recording of species, promotion of ecotourism or limited tourism. Assessments might consider: practicalities, politics, hunting and poaching, cost, encroachment. Band 1 answers will consider all question requirements in a well balanced and evaluative essay. Good use will be made of exemplar material. [25 – 30] Band 3 answers may be relevant but superficial. The answer may lack balance and concentrate on one type of conservation area. [13 – 18] Band 4 answers will be brief, possibly poorly balanced with a focus on conservation need rather than strategies. [6 – 12] [Total: 40]
Mark scheme, page 9
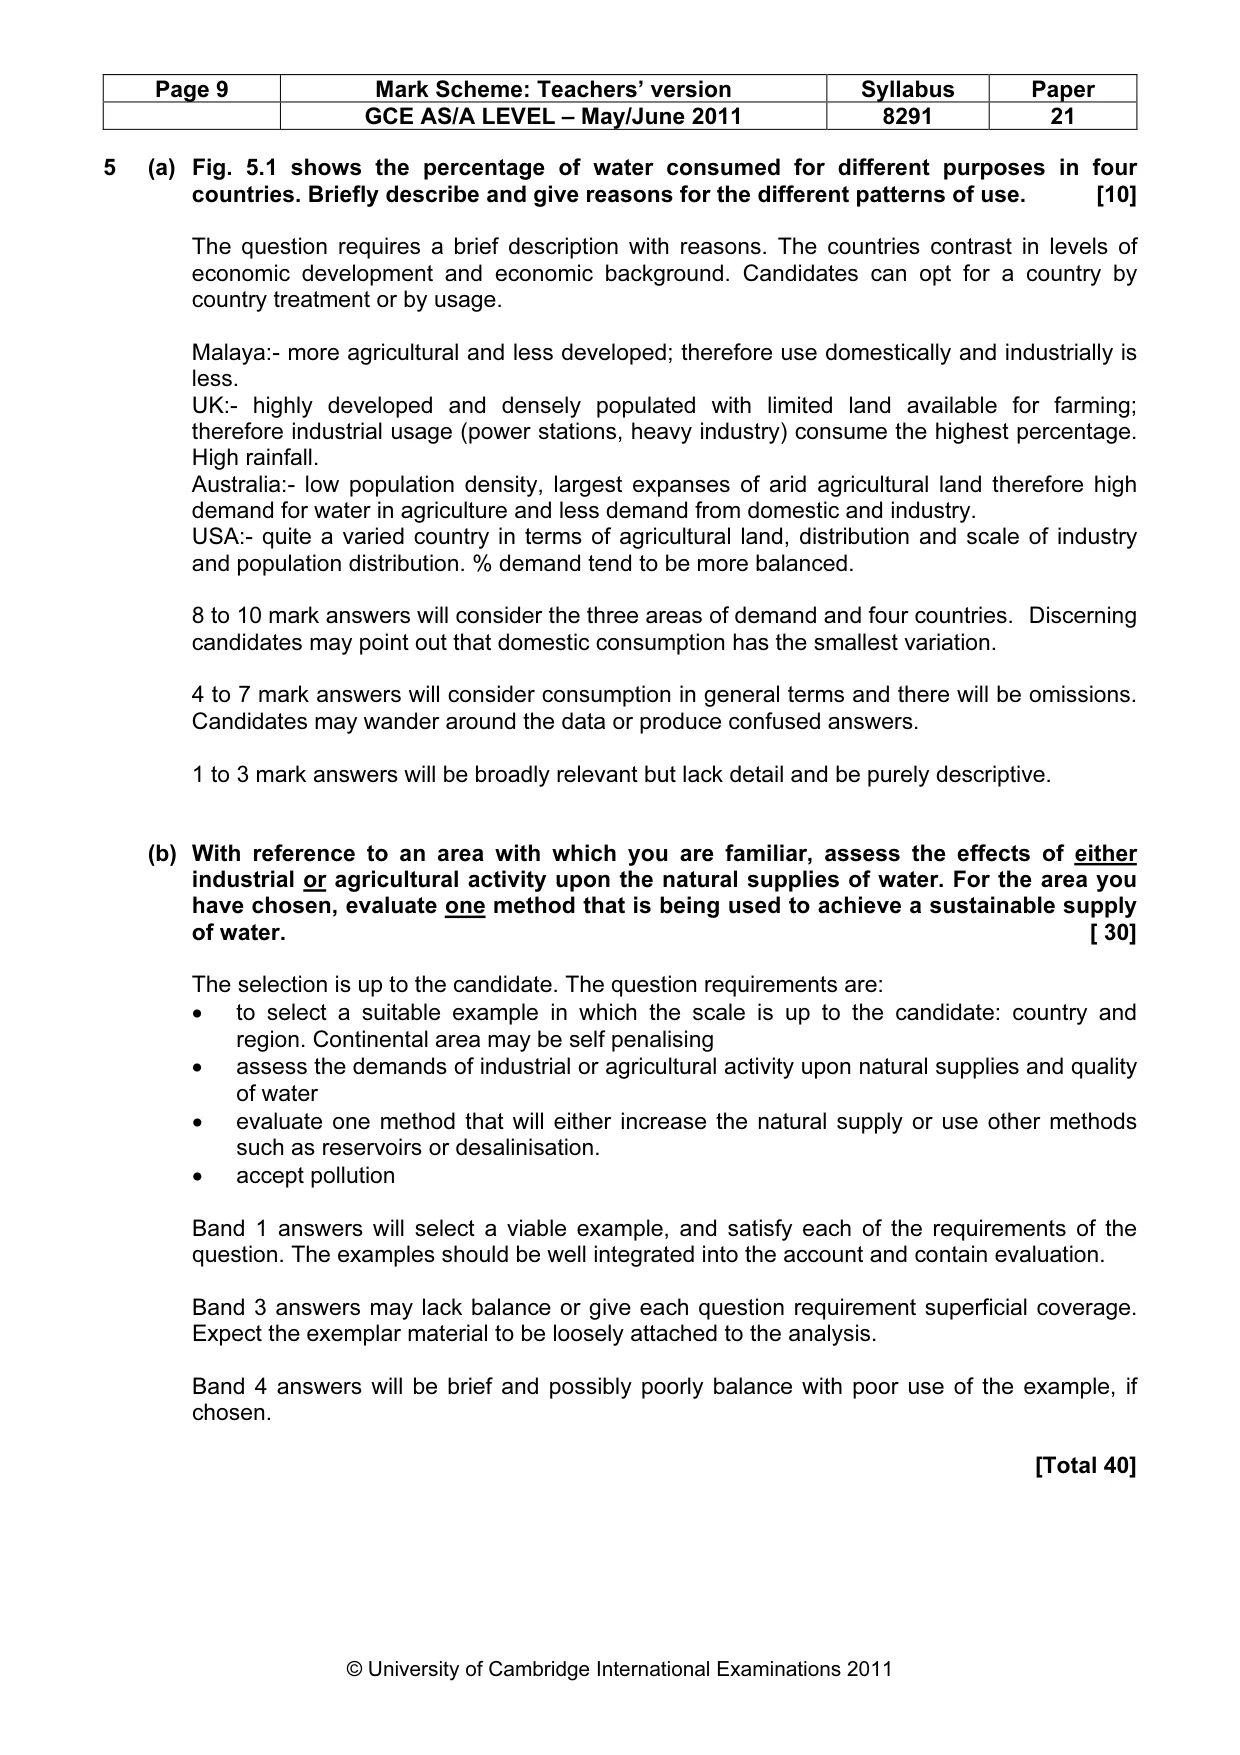
Page 9 Mark Scheme: Teachers’ version Syllabus Paper GCE AS/A LEVEL – May/June 2011 8291 21 © University of Cambridge International Examinations 2011 5 (a) Fig. 5.1 shows the percentage of water consumed for different purposes in four countries. Briefly describe and give reasons for the different patterns of use. [10] The question requires a brief description with reasons. The countries contrast in levels of economic development and economic background. Candidates can opt for a country by country treatment or by usage. Malaya:- more agricultural and less developed; therefore use domestically and industrially is less. UK:- highly developed and densely populated with limited land available for farming; therefore industrial usage (power stations, heavy industry) consume the highest percentage. High rainfall. Australia:- low population density, largest expanses of arid agricultural land therefore high demand for water in agriculture and less demand from domestic and industry. USA:- quite a varied country in terms of agricultural land, distribution and scale of industry and population distribution. % demand tend to be more balanced. 8 to 10 mark answers will consider the three areas of demand and four countries. Discerning candidates may point out that domestic consumption has the smallest variation. 4 to 7 mark answers will consider consumption in general terms and there will be omissions. Candidates may wander around the data or produce confused answers. 1 to 3 mark answers will be broadly relevant but lack detail and be purely descriptive. (b) With reference to an area with which you are familiar, assess the effects of either industrial or agricultural activity upon the natural supplies of water. For the area you have chosen, evaluate one method that is being used to achieve a sustainable supply of water. [ 30] The selection is up to the candidate. The question requirements are: • to select a suitable example in which the scale is up to the candidate: country and region. Continental area may be self penalising • assess the demands of industrial or agricultural activity upon natural supplies and quality of water • evaluate one method that will either increase the natural supply or use other methods such as reservoirs or desalinisation. • accept pollution Band 1 answers will select a viable example, and satisfy each of the requirements of the question. The examples should be well integrated into the account and contain evaluation. Band 3 answers may lack balance or give each question requirement superficial coverage. Expect the exemplar material to be loosely attached to the analysis. Band 4 answers will be brief and possibly poorly balance with poor use of the example, if chosen. [Total 40]
Mark scheme, page 10
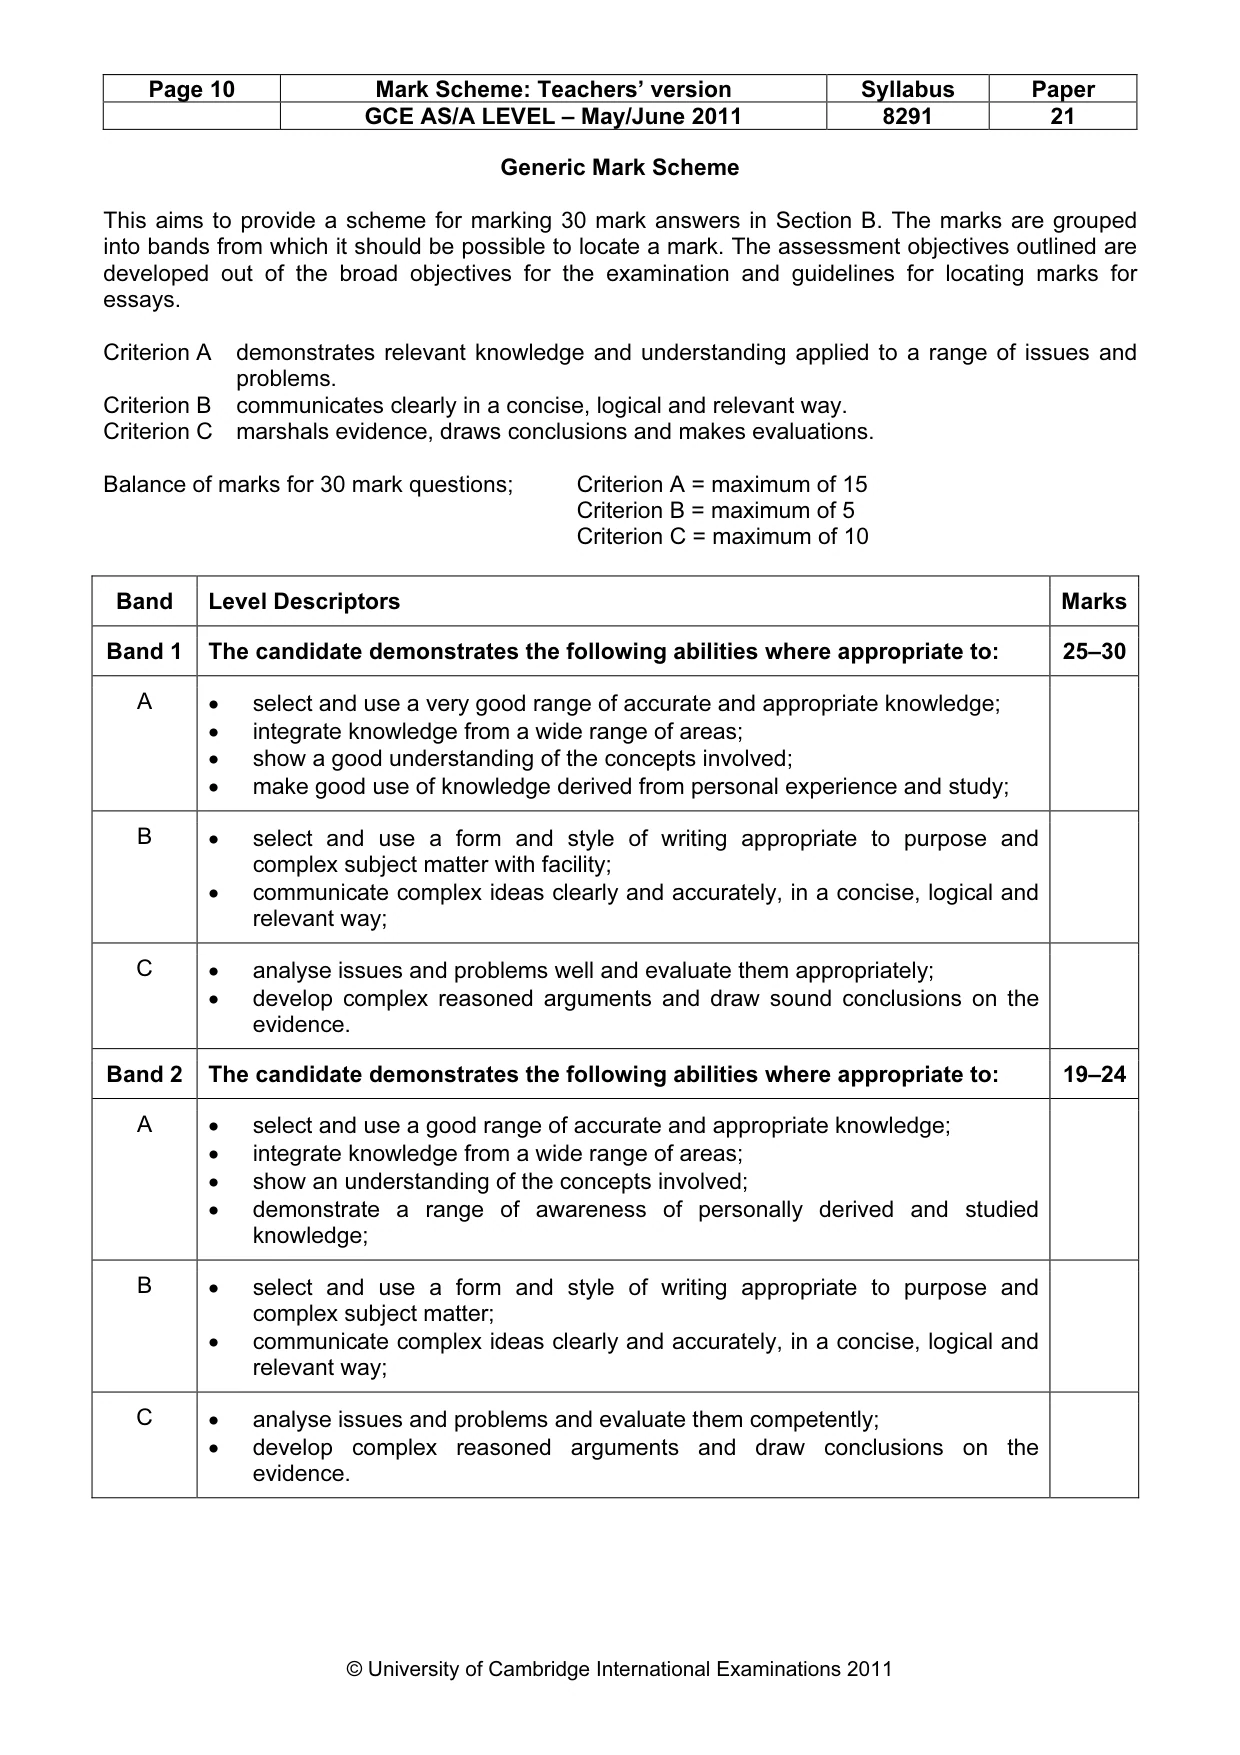
Page 10 Mark Scheme: Teachers’ version Syllabus Paper GCE AS/A LEVEL – May/June 2011 8291 21 © University of Cambridge International Examinations 2011 Generic Mark Scheme This aims to provide a scheme for marking 30 mark answers in Section B. The marks are grouped into bands from which it should be possible to locate a mark. The assessment objectives outlined are developed out of the broad objectives for the examination and guidelines for locating marks for essays. Criterion A demonstrates relevant knowledge and understanding applied to a range of issues and problems. Criterion B communicates clearly in a concise, logical and relevant way. Criterion C marshals evidence, draws conclusions and makes evaluations. Balance of marks for 30 mark questions; Criterion A = maximum of 15 Criterion B = maximum of 5 Criterion C = maximum of 10 Band Level Descriptors Marks Band 1 The candidate demonstrates the following abilities where appropriate to: 25–30 A • select and use a very good range of accurate and appropriate knowledge; • integrate knowledge from a wide range of areas; • show a good understanding of the concepts involved; • make good use of knowledge derived from personal experience and study; B • select and use a form and style of writing appropriate to purpose and complex subject matter with facility; • communicate complex ideas clearly and accurately, in a concise, logical and relevant way; C • analyse issues and problems well and evaluate them appropriately; • develop complex reasoned arguments and draw sound conclusions on the evidence. Band 2 The candidate demonstrates the following abilities where appropriate to: 19–24 A • select and use a good range of accurate and appropriate knowledge; • integrate knowledge from a wide range of areas; • show an understanding of the concepts involved; • demonstrate a range of awareness of personally derived and studied knowledge; B • select and use a form and style of writing appropriate to purpose and complex subject matter; • communicate complex ideas clearly and accurately, in a concise, logical and relevant way; C • analyse issues and problems and evaluate them competently; • develop complex reasoned arguments and draw conclusions on the evidence.
Mark scheme, page 11
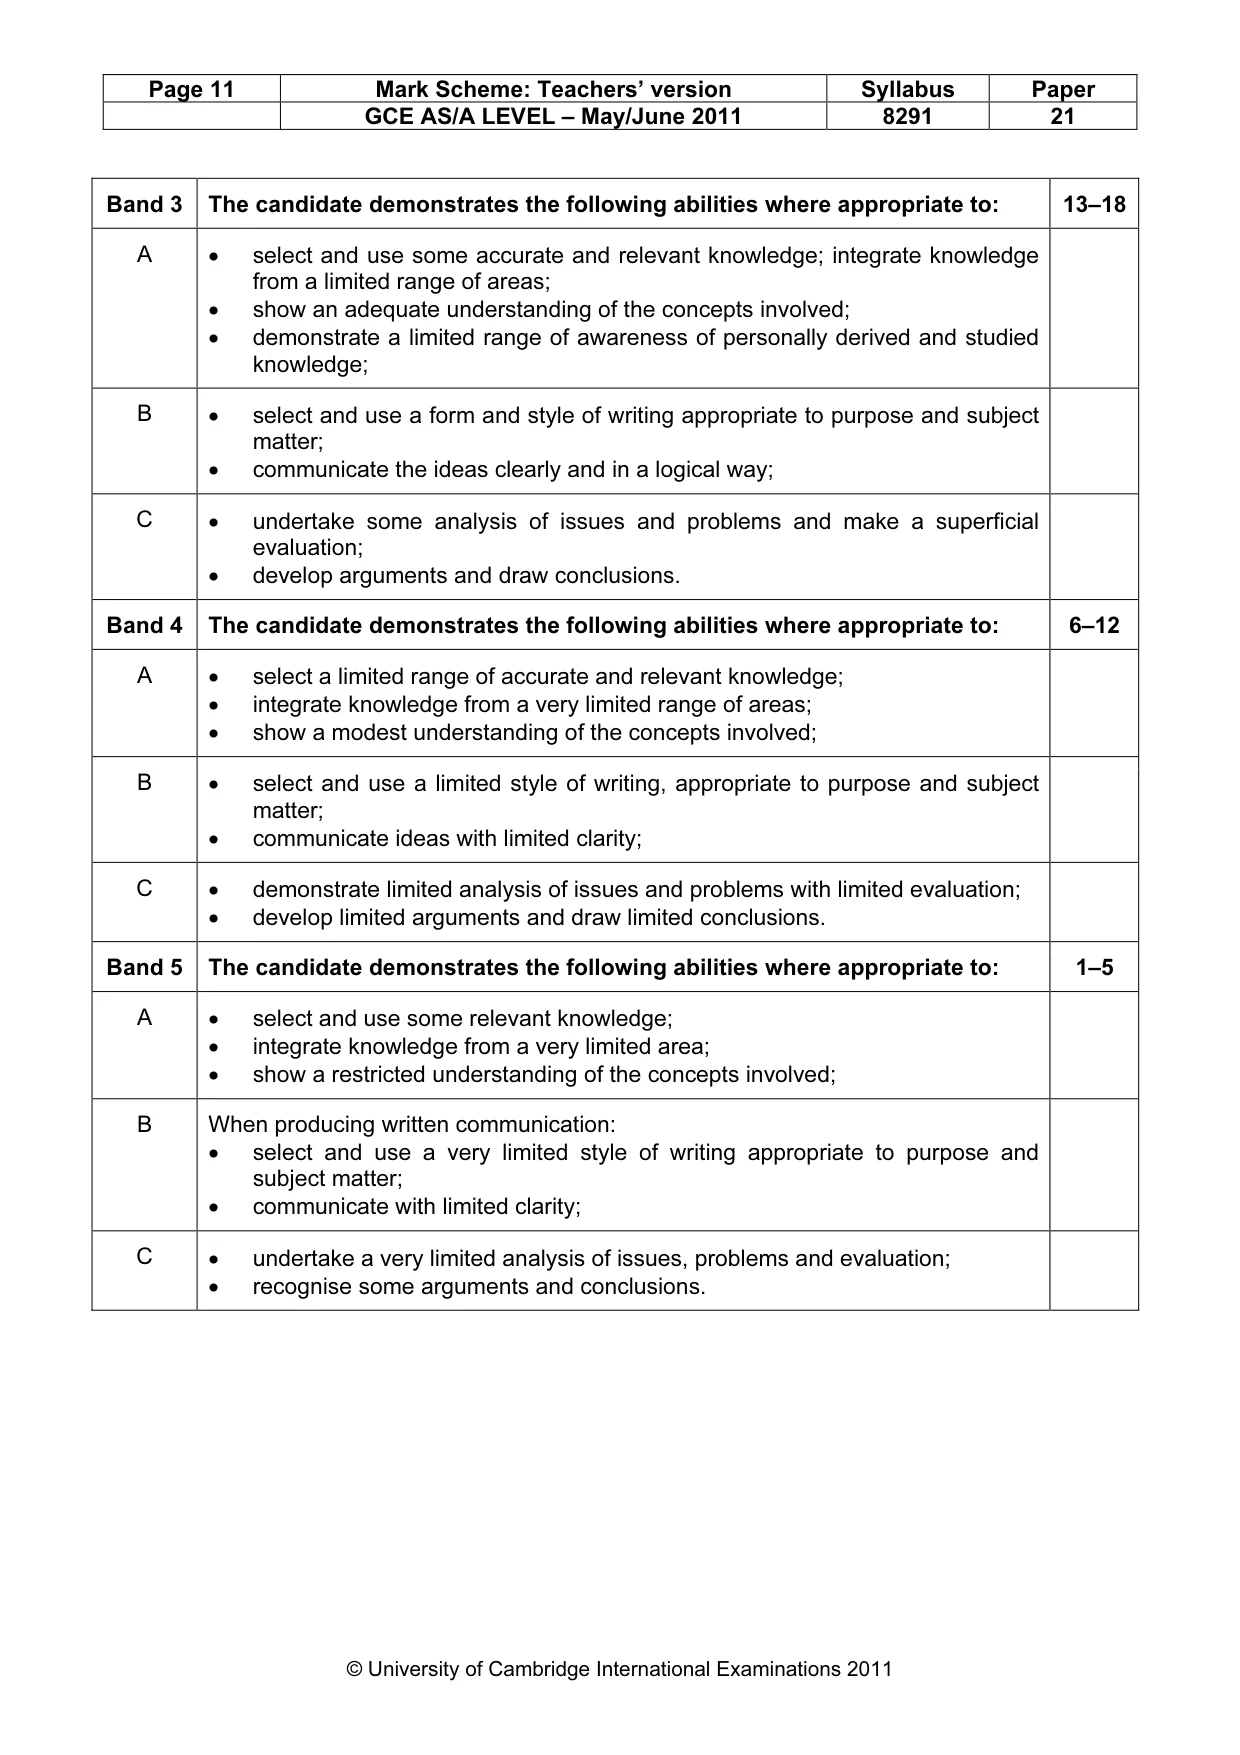
Page 11 Mark Scheme: Teachers’ version Syllabus Paper GCE AS/A LEVEL – May/June 2011 8291 21 © University of Cambridge International Examinations 2011 Band 3 The candidate demonstrates the following abilities where appropriate to: 13–18 A • select and use some accurate and relevant knowledge; integrate knowledge from a limited range of areas; • show an adequate understanding of the concepts involved; • demonstrate a limited range of awareness of personally derived and studied knowledge; B • select and use a form and style of writing appropriate to purpose and subject matter; • communicate the ideas clearly and in a logical way; C • undertake some analysis of issues and problems and make a superficial evaluation; • develop arguments and draw conclusions. Band 4 The candidate demonstrates the following abilities where appropriate to: 6–12 A • select a limited range of accurate and relevant knowledge; • integrate knowledge from a very limited range of areas; • show a modest understanding of the concepts involved; B • select and use a limited style of writing, appropriate to purpose and subject matter; • communicate ideas with limited clarity; C • demonstrate limited analysis of issues and problems with limited evaluation; • develop limited arguments and draw limited conclusions. Band 5 The candidate demonstrates the following abilities where appropriate to: 1–5 A • select and use some relevant knowledge; • integrate knowledge from a very limited area; • show a restricted understanding of the concepts involved; B When producing written communication: • select and use a very limited style of writing appropriate to purpose and subject matter; • communicate with limited clarity; C • undertake a very limited analysis of issues, problems and evaluation; • recognise some arguments and conclusions.
What you needed in this session
Cambridge’s own grade thresholds for 2011 May/June, Paper 2 · Variant 1. A higher threshold means an easier paper — the bar moves with how the cohort did.