Cambridge A Level Economics 9708 — 2022 Feb/March Paper 4 · Variant 2
9708/42/F/M/22 · 7 questions · 70 marks · ≈79 min
The question paper and its mark scheme, free to read here and free to download. This is Cambridge’s own paper, exactly as it was sat.
Question paper4 pages


Mark scheme16 pages
Answers below. Sit the paper first if you are practising.






Questions as text
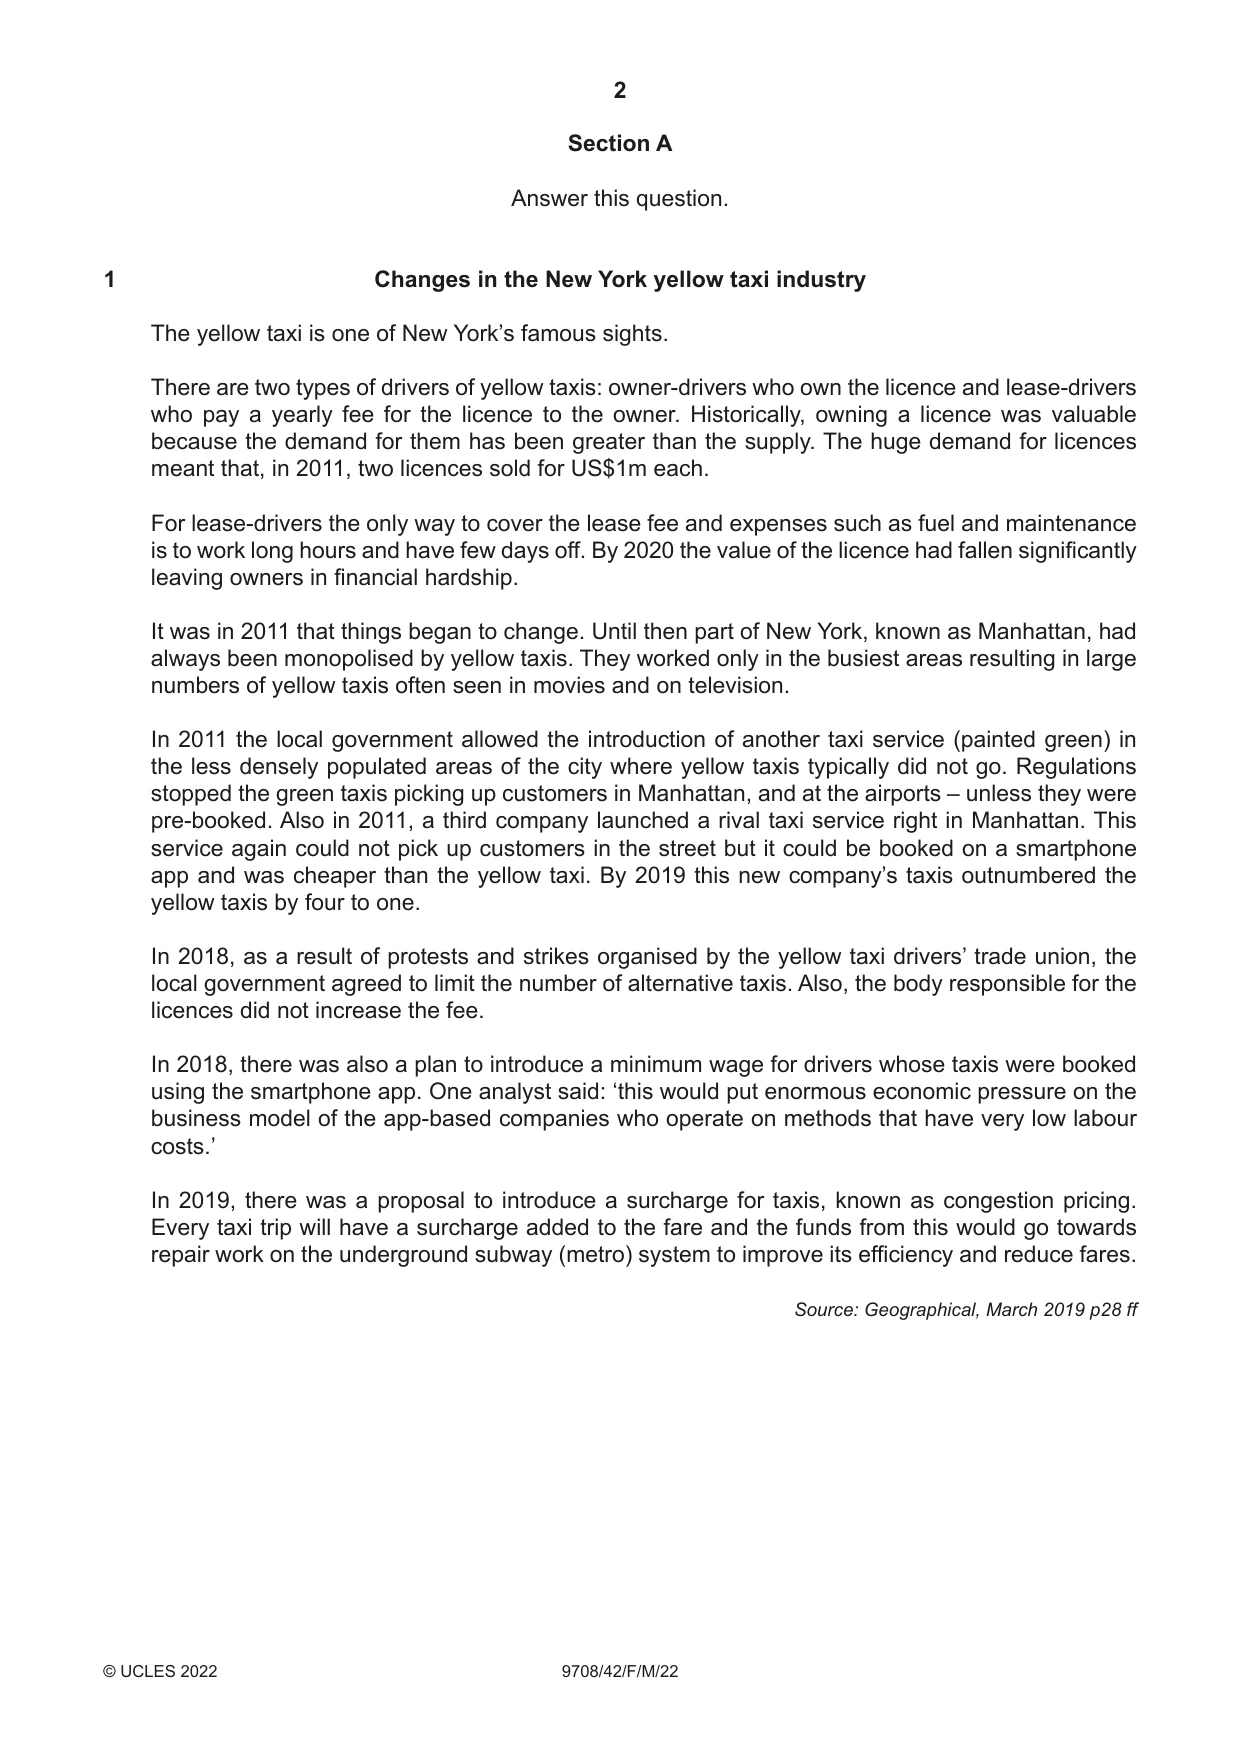
Q1 · Changes in the New York yellow taxi industry The yellow taxi is one of New York’s famous…
1 Changes in the New York yellow taxi industry The yellow taxi is one of New York’s famous sights. There are two types of drivers of yellow taxis: owner-drivers who own the licence and lease-drivers who pay a yearly fee for the licence to the owner. Historically, owning a licence was valuable because the demand for them has been greater than the supply. The huge demand for licences meant that, in 2011, two licences sold for US$1m each. For lease-drivers the only way to cover the lease fee and expenses such as fuel and maintenance is to work long hours and have few days off. By 2020 the value of the licence had fallen significantly leaving owners in financial hardship. It was in 2011 that things began to change. Until then part of New York, known as Manhattan, had always been monopolised by yellow taxis. They worked only in the busiest areas resulting in large numbers of yellow taxis often seen in movies and on television. In 2011 the local government allowed the introduction of another taxi service (painted green) in the less densely populated areas of the city where yellow taxis typically did not go. Regulations stopped the green taxis picking up customers in Manhattan, and at the airports – unless they were pre-booked. Also in 2011, a third company launched a rival taxi service right in Manhattan. This service again could not pick up customers in the street but it could be booked on a smartphone app and was cheaper than the yellow taxi. By 2019 this new company’s taxis outnumbered the yellow taxis by four to one. In 2018, as a result of protests and strikes organised by the yellow taxi drivers’ trade union, the local government agreed to limit the number of alternative taxis. Also, the body responsible for the licences did not increase the fee. In 2018, there was also a plan to introduce a minimum wage for drivers whose taxis were booked using the smartphone app. One analyst said: ‘this would put enormous economic pressure on the business model of the app-based companies who operate on methods that have very low labour costs.’ In 2019, there was a proposal to introduce a surcharge for taxis, known as congestion pricing. Every taxi trip will have a surcharge added to the fare and the funds from this would go towards repair work on the underground subway (metro) system to improve its efficiency and reduce fares. Source: Geographical, March 2019 p28 ff (a) Distinguish between a fixed cost and a variable cost and identify one example of each from the article. [3] (b) Cross-subsidisation is when consumers of one product are charged higher prices in order to subsidise consumers of other products who then pay lower prices. Identify an example of cross-subsidisation in the article and consider whether it can be justified. [5] (c) Analyse whether there is any evidence that the market structure for New York taxis could be called a monopoly. [5] (d) Identify two types of local government intervention allowed in 2018 and discuss how these might affect the profits of taxi owners. [7]
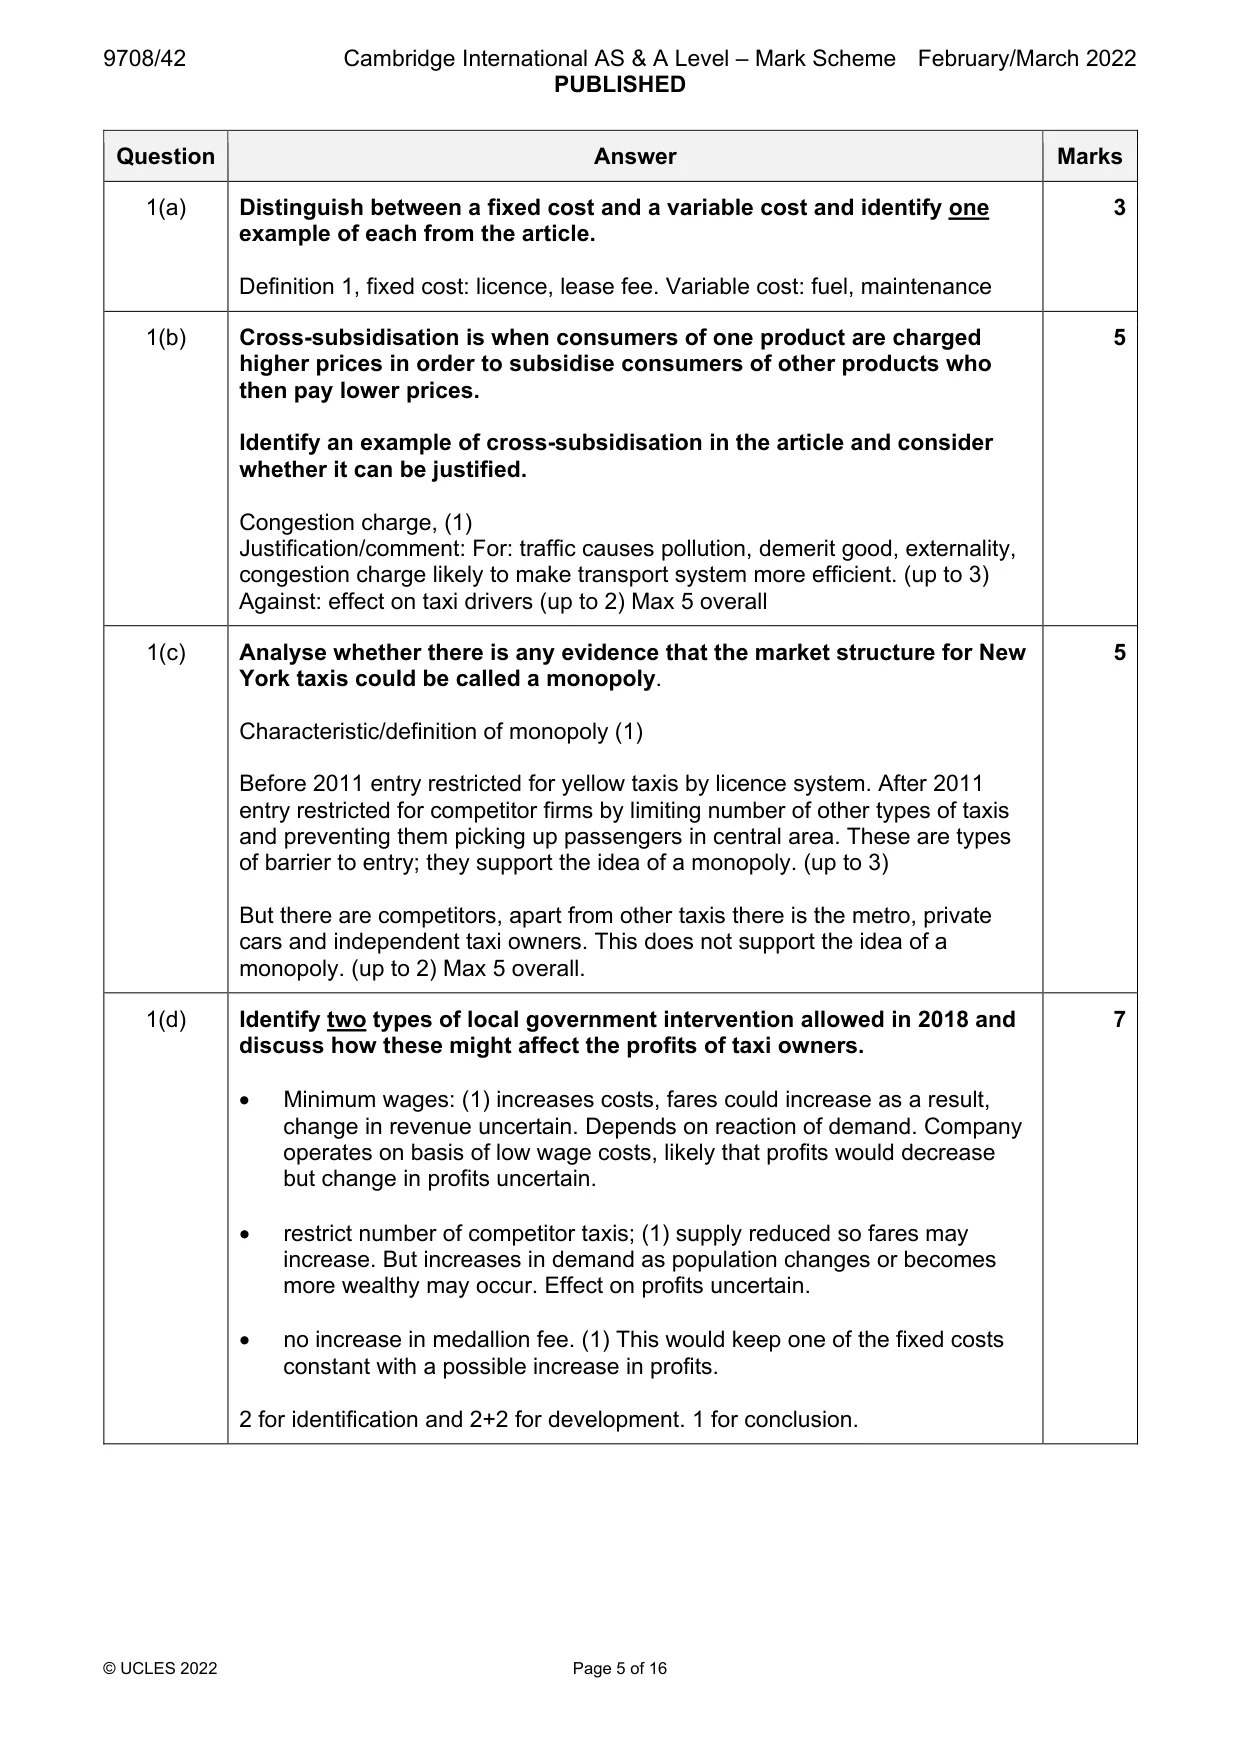
Mark scheme: Question Answer Marks 1(a) Distinguish between a fixed cost and a variable cost and identify one 3 example of each from the article. Definition 1, fixed cost: licence, lease fee. Variable cost: fuel, maintenance 1(b) Cross-subsidisation is when consumers of one product are charged 5 higher prices in order to subsidise consumers of other products who then pay lower prices. Identify an example of cross-subsidisation in the article and consider whether it can be justified. Congestion charge, (1) Justification/comment: For: traffic causes pollution, demerit good, externality, congestion charge likely to make transport system more efficient. (up to 3) Against: effect on taxi drivers (up to 2) Max 5 overall 1(c) Analyse whether there is any evidence that the market structure for New 5 York taxis could be called a monopoly. Characteristic/definition of monopoly (1) Before 2011 entry restricted for yellow taxis by licence system. After 2011 entry restricted for competitor firms by limiting number of other types of taxis and preventing them picking up passengers in central area. These are types of barrier to entry; they support the idea of a monopoly. (up to 3) But there are competitors, apart from other taxis there is the metro, private cars and independent taxi owners. This does not support the idea of a monopoly. (up to 2) Max 5 overall. 1(d) Identify two types of local government intervention allowed in 2018 and 7 discuss how these might affect the profits of taxi owners. • Minimum wages: (1) increases costs, fares could increase as a result, change in revenue uncertain. Depends on reaction of demand. Company operates on basis of low wage costs, likely that profits would decrease but change in profits uncertain. • restrict number of competitor taxis; (1) supply reduced so fares may increase. But increases in demand as population changes or becomes more wealthy may occur. Effect on profits uncertain. • no increase in medallion fee. (1) This would keep one of the fixed costs constant with a possible increase in profits. 2 for identification and 2+2 for development. 1 for conclusion.
More questions on Methods and effects of government intervention in markets
Q2 · Explain what is meant by dynamic efficiency and consider which type of market structure…
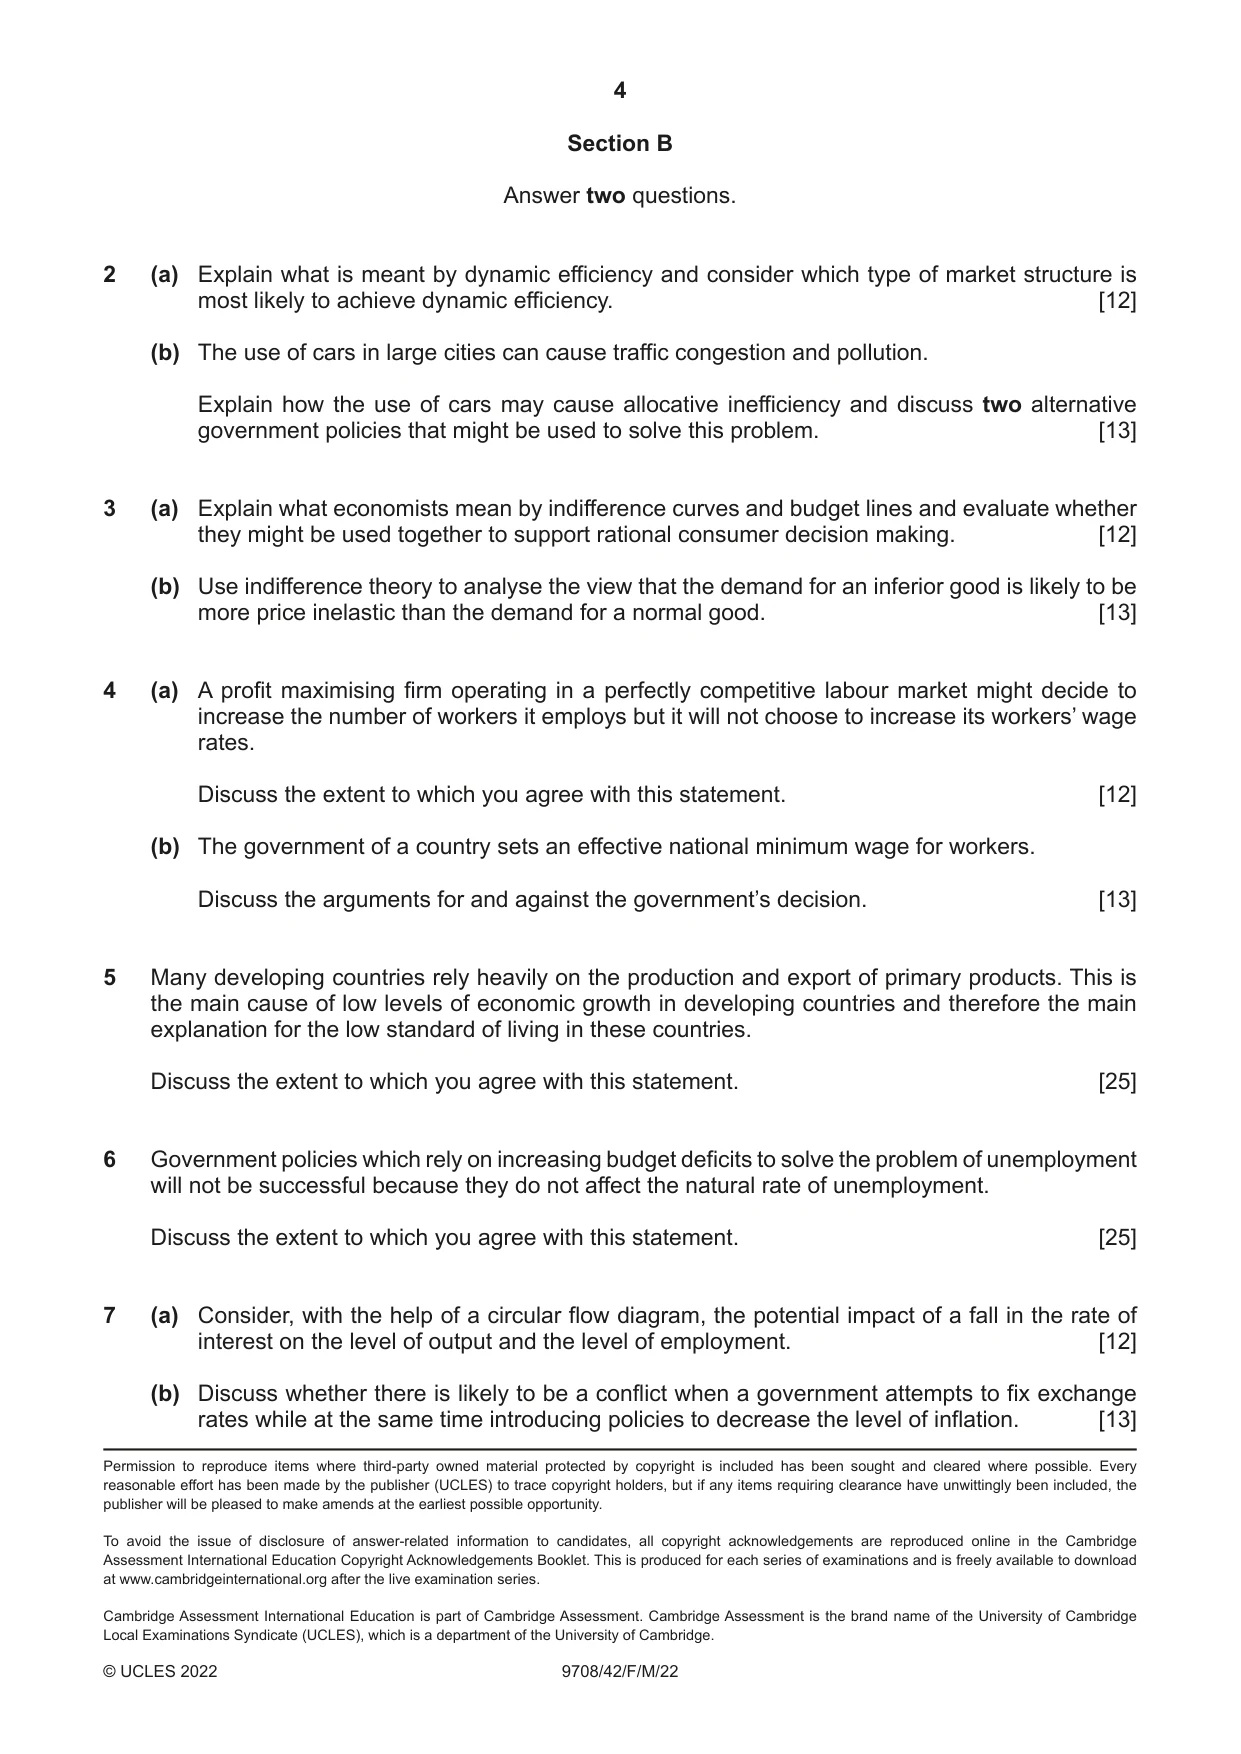
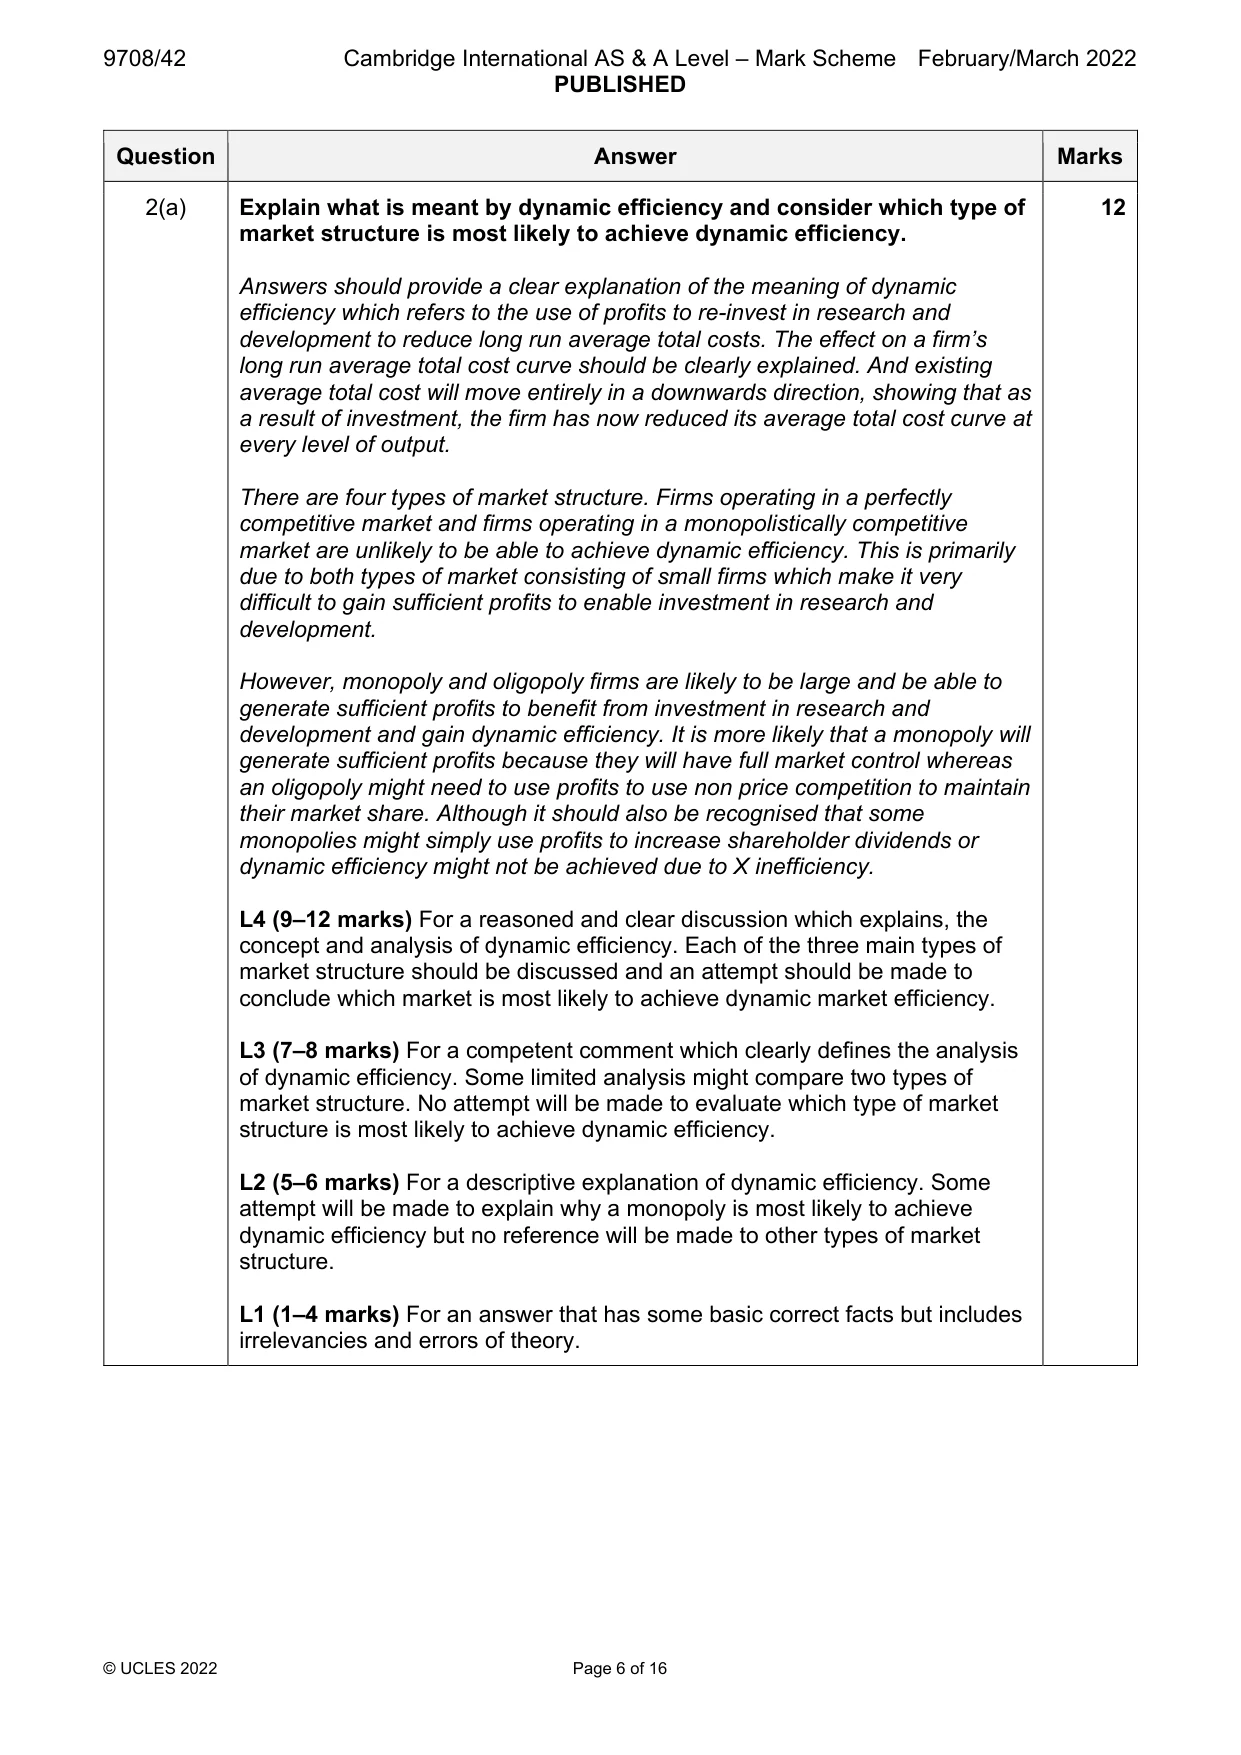
2 (a) Explain what is meant by dynamic efficiency and consider which type of market structure is most likely to achieve dynamic efficiency. [12] (b) The use of cars in large cities can cause traffic congestion and pollution. Explain how the use of cars may cause allocative inefficiency and discuss two alternative government policies that might be used to solve this problem. [13]
Mark scheme: 2(a) Explain what is meant by dynamic efficiency and consider which type of 12 market structure is most likely to achieve dynamic efficiency. Answers should provide a clear explanation of the meaning of dynamic efficiency which refers to the use of profits to re-invest in research and development to reduce long run average total costs. The effect on a firm’s long run average total cost curve should be clearly explained. And existing average total cost will move entirely in a downwards direction, showing that as a result of investment, the firm has now reduced its average total cost curve at every level of output. There are four types of market structure. Firms operating in a perfectly competitive market and firms operating in a monopolistically competitive market are unlikely to be able to achieve dynamic efficiency. This is primarily due to both types of market consisting of small firms which make it very difficult to gain sufficient profits to enable investment in research and development. However, monopoly and oligopoly firms are likely to be large and be able to generate sufficient profits to benefit from investment in research and development and gain dynamic efficiency. It is more likely that a monopoly will generate sufficient profits because they will have full market control whereas an oligopoly might need to use profits to use non price competition to maintain their market share. Although it should also be recognised that some monopolies might simply use profits to increase shareholder dividends or dynamic efficiency might not be achieved due to X inefficiency. L4 (9–12 marks) For a reasoned and clear discussion which explains, the concept and analysis of dynamic efficiency. Each of the three main types of market structure should be discussed and an attempt should be made to conclude which market is most likely to achieve dynamic market efficiency. L3 (7–8 marks) For a competent comment which clearly defines the analysis of dynamic efficiency. Some limited analysis might compare two types of market structure. No attempt will be made to evaluate which type of market structure is most likely to achieve dynamic efficiency. L2 (5–6 marks) For a descriptive explanation of dynamic efficiency. Some attempt will be made to explain why a monopoly is most likely to achieve dynamic efficiency but no reference will be made to other types of market structure. L1 (1–4 marks) For an answer that has some basic correct facts but includes irrelevancies and errors of theory. 2(b) The use of cars in large cities can cause traffic congestion and 13 pollution. Explain how the use of cars may cause allocative inefficiency and discuss two alternative government policies that might be used to solve this problem. Allocative inefficiency occurs when a good/service is over/under produced which prevents an outcome which will maximize consumer satisfaction. Motor cars can cause traffic congestion and pollution which both contribute towards producing an allocatively inefficient outcome. Congestion is associated with slower transport/distribution and this causes inefficiency. Pollution produces negative externalities which are additional costs which are not incurred by the user of motor cars but which have to be borne by society in general. When these additional costs are not taken into account, more motor cars are produced, sold and used than would otherwise be the case, therefore allocative efficiency in relation to the amount of resources used to produce cars is not achieved. There are a number of alternative government policies which can be used to address the overproduction of cars. Policies might include: taxation, legislation, regulation, advertising, subsidising alternative methods of transport. Each policy can be evaluated. For example, subsidising alternative forms of transport might be costly and the cross elasticity of demand for motor cars and alternative forms of transport might be very low. L4 (9–13 marks) for a clear, explanation of allocative efficiency and the link between motor car use, traffic congestion, pollution, negative externalities and allocative inefficiency. Two government policies should be identified to address this problem and at least one evaluative comment in each case should be provided. L3 (7–8 marks) for an explanation of allocative efficiency and some attempt to link this concept to the negative impact of the use of motor cars on society. Some analysis will be provided which shows the relationship between allocative inefficiency and negative externalities. At least one government policy should be identified and its effectiveness discussed; or two policies with no evaluation. L2 (5–6 marks) for a more descriptive explanation that indicates knowledge of allocative efficiency but does not link this closely to negative externalities and the negative effects on society of the use of motor cars. Government intervention might be briefly referred to but not analysed or discussed. L1 (1–4 marks) for an answer that has some basic correct facts but includes irrelevancies and errors of theory.
Q3 · Explain what economists mean by indifference curves and budget lines and evaluate whether…
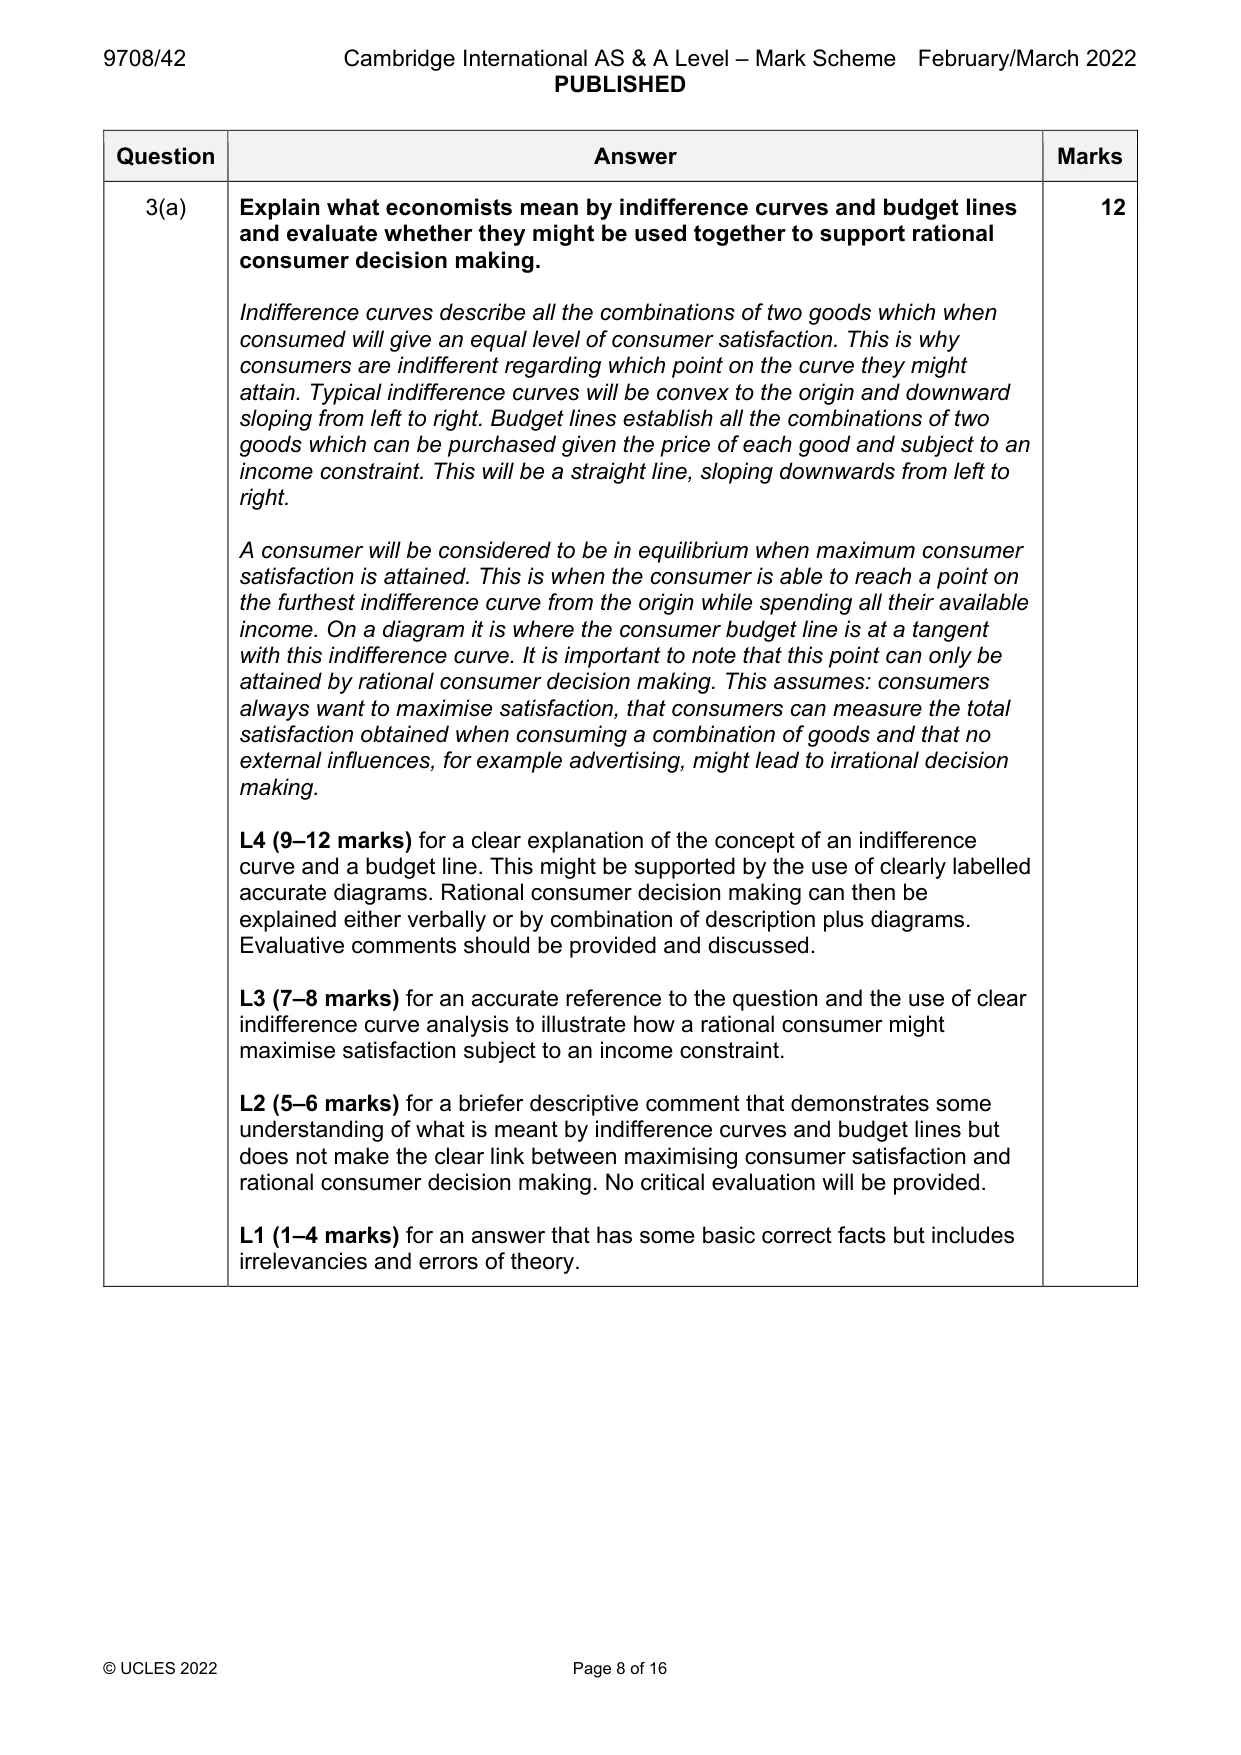
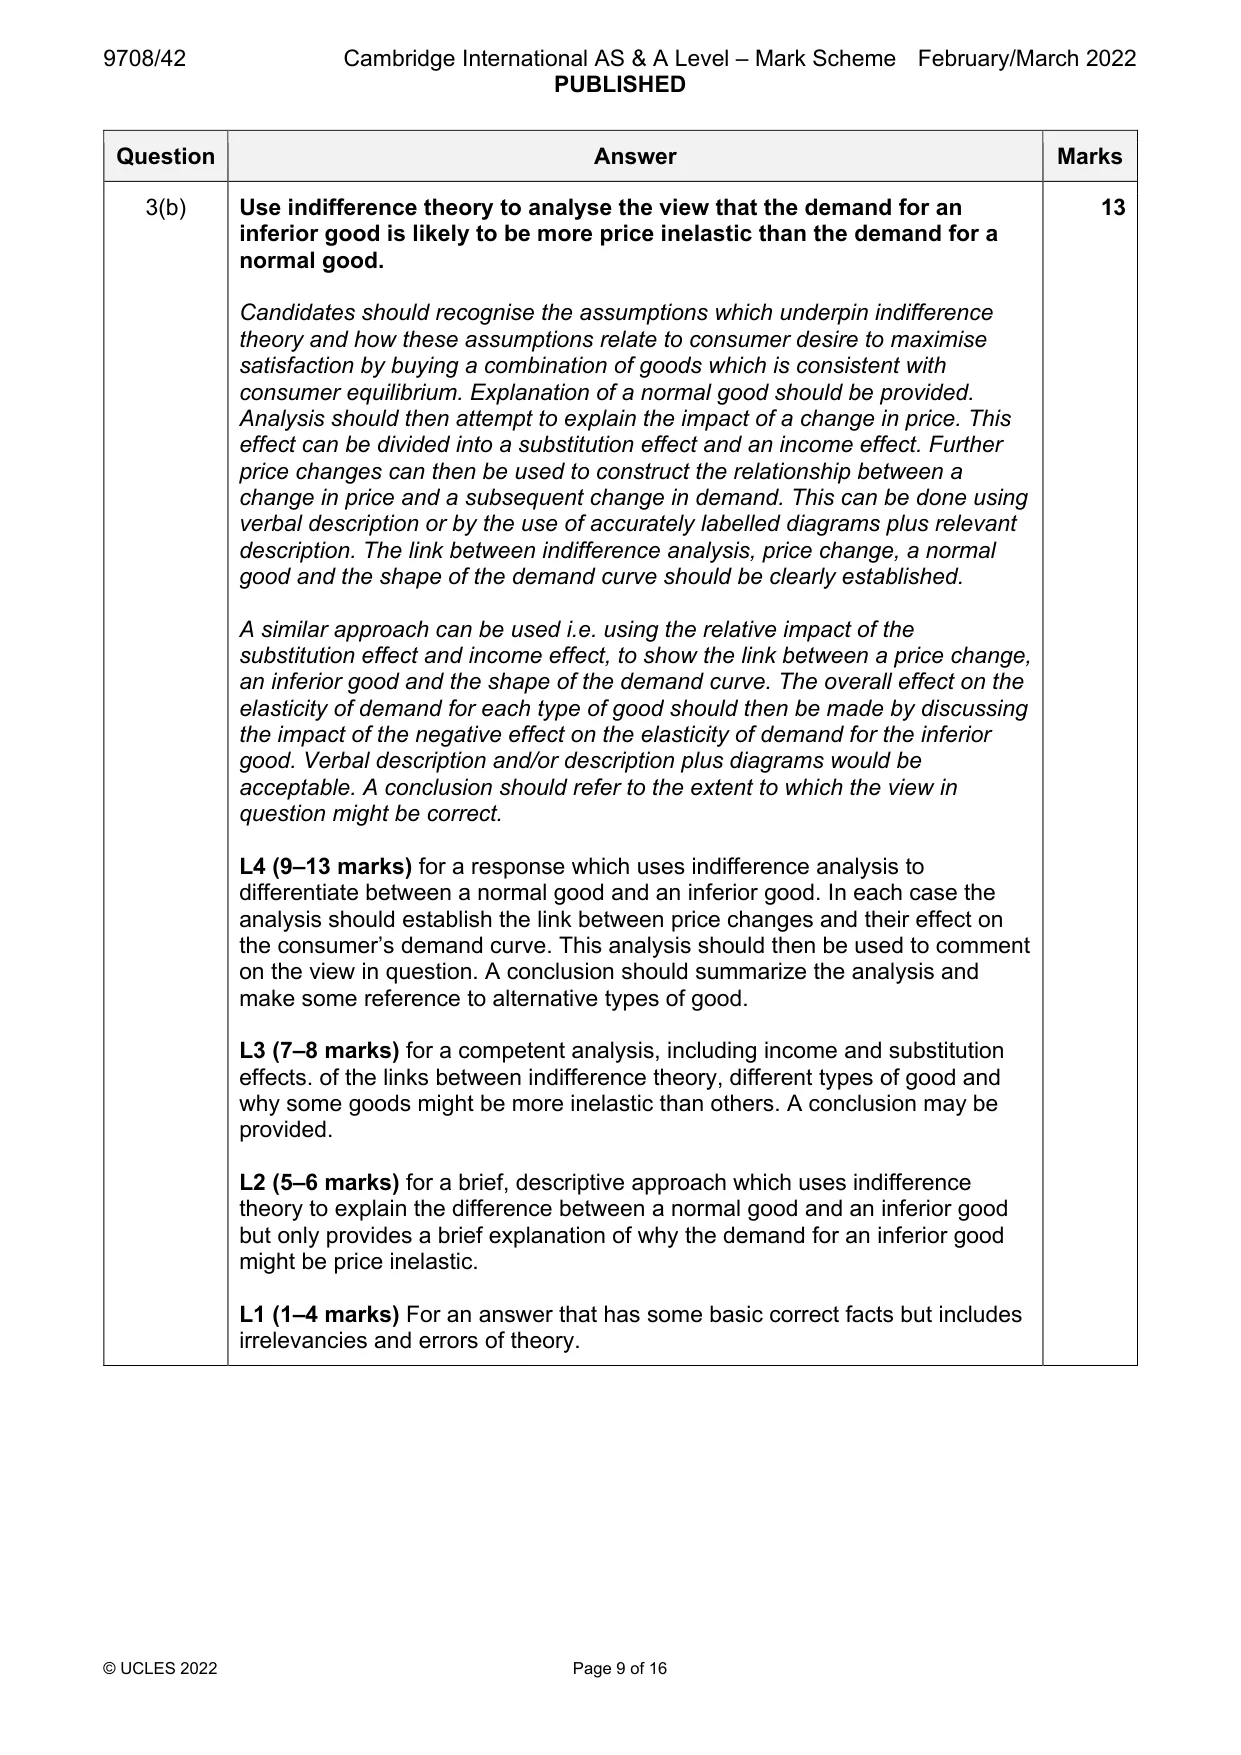
3 (a) Explain what economists mean by indifference curves and budget lines and evaluate whether they might be used together to support rational consumer decision making. [12] (b) Use indifference theory to analyse the view that the demand for an inferior good is likely to be more price inelastic than the demand for a normal good. [13]
Mark scheme: 3(a) Explain what economists mean by indifference curves and budget lines 12 and evaluate whether they might be used together to support rational consumer decision making. Indifference curves describe all the combinations of two goods which when consumed will give an equal level of consumer satisfaction. This is why consumers are indifferent regarding which point on the curve they might attain. Typical indifference curves will be convex to the origin and downward sloping from left to right. Budget lines establish all the combinations of two goods which can be purchased given the price of each good and subject to an income constraint. This will be a straight line, sloping downwards from left to right. A consumer will be considered to be in equilibrium when maximum consumer satisfaction is attained. This is when the consumer is able to reach a point on the furthest indifference curve from the origin while spending all their available income. On a diagram it is where the consumer budget line is at a tangent with this indifference curve. It is important to note that this point can only be attained by rational consumer decision making. This assumes: consumers always want to maximise satisfaction, that consumers can measure the total satisfaction obtained when consuming a combination of goods and that no external influences, for example advertising, might lead to irrational decision making. L4 (9–12 marks) for a clear explanation of the concept of an indifference curve and a budget line. This might be supported by the use of clearly labelled accurate diagrams. Rational consumer decision making can then be explained either verbally or by combination of description plus diagrams. Evaluative comments should be provided and discussed. L3 (7–8 marks) for an accurate reference to the question and the use of clear indifference curve analysis to illustrate how a rational consumer might maximise satisfaction subject to an income constraint. L2 (5–6 marks) for a briefer descriptive comment that demonstrates some understanding of what is meant by indifference curves and budget lines but does not make the clear link between maximising consumer satisfaction and rational consumer decision making. No critical evaluation will be provided. L1 (1–4 marks) for an answer that has some basic correct facts but includes irrelevancies and errors of theory. 3(b) Use indifference theory to analyse the view that the demand for an 13 inferior good is likely to be more price inelastic than the demand for a normal good. Candidates should recognise the assumptions which underpin indifference theory and how these assumptions relate to consumer desire to maximise satisfaction by buying a combination of goods which is consistent with consumer equilibrium. Explanation of a normal good should be provided. Analysis should then attempt to explain the impact of a change in price. This effect can be divided into a substitution effect and an income effect. Further price changes can then be used to construct the relationship between a change in price and a subsequent change in demand. This can be done using verbal description or by the use of accurately labelled diagrams plus relevant description. The link between indifference analysis, price change, a normal good and the shape of the demand curve should be clearly established. A similar approach can be used i.e. using the relative impact of the substitution effect and income effect, to show the link between a price change, an inferior good and the shape of the demand curve. The overall effect on the elasticity of demand for each type of good should then be made by discussing the impact of the negative effect on the elasticity of demand for the inferior good. Verbal description and/or description plus diagrams would be acceptable. A conclusion should refer to the extent to which the view in question might be correct. L4 (9–13 marks) for a response which uses indifference analysis to differentiate between a normal good and an inferior good. In each case the analysis should establish the link between price changes and their effect on the consumer’s demand curve. This analysis should then be used to comment on the view in question. A conclusion should summarize the analysis and make some reference to alternative types of good. L3 (7–8 marks) for a competent analysis, including income and substitution effects. of the links between indifference theory, different types of good and why some goods might be more inelastic than others. A conclusion may be provided. L2 (5–6 marks) for a brief, descriptive approach which uses indifference theory to explain the difference between a normal good and an inferior good but only provides a brief explanation of why the demand for an inferior good might be price inelastic. L1 (1–4 marks) For an answer that has some basic correct facts but includes irrelevancies and errors of theory.
Q4 · A profit maximising firm operating in a perfectly competitive labour market might decide…
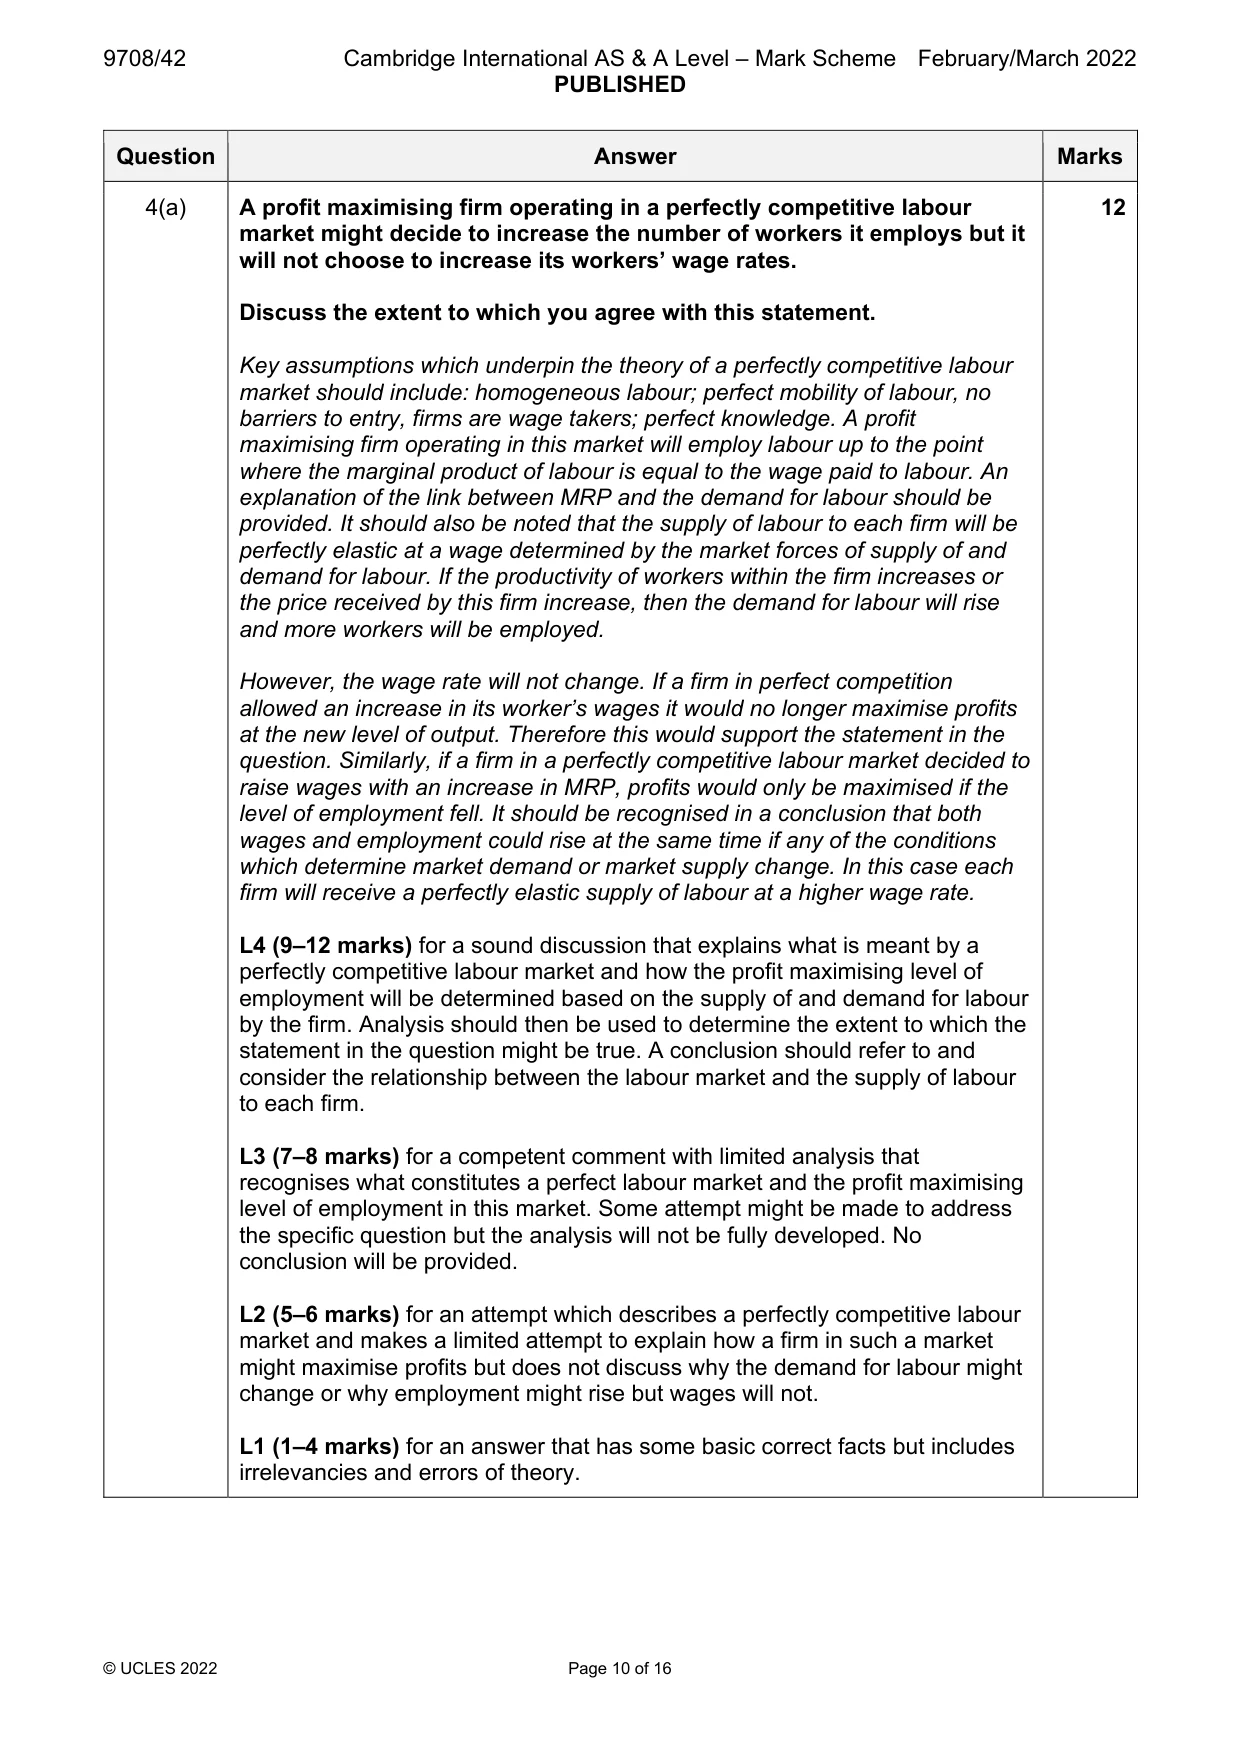
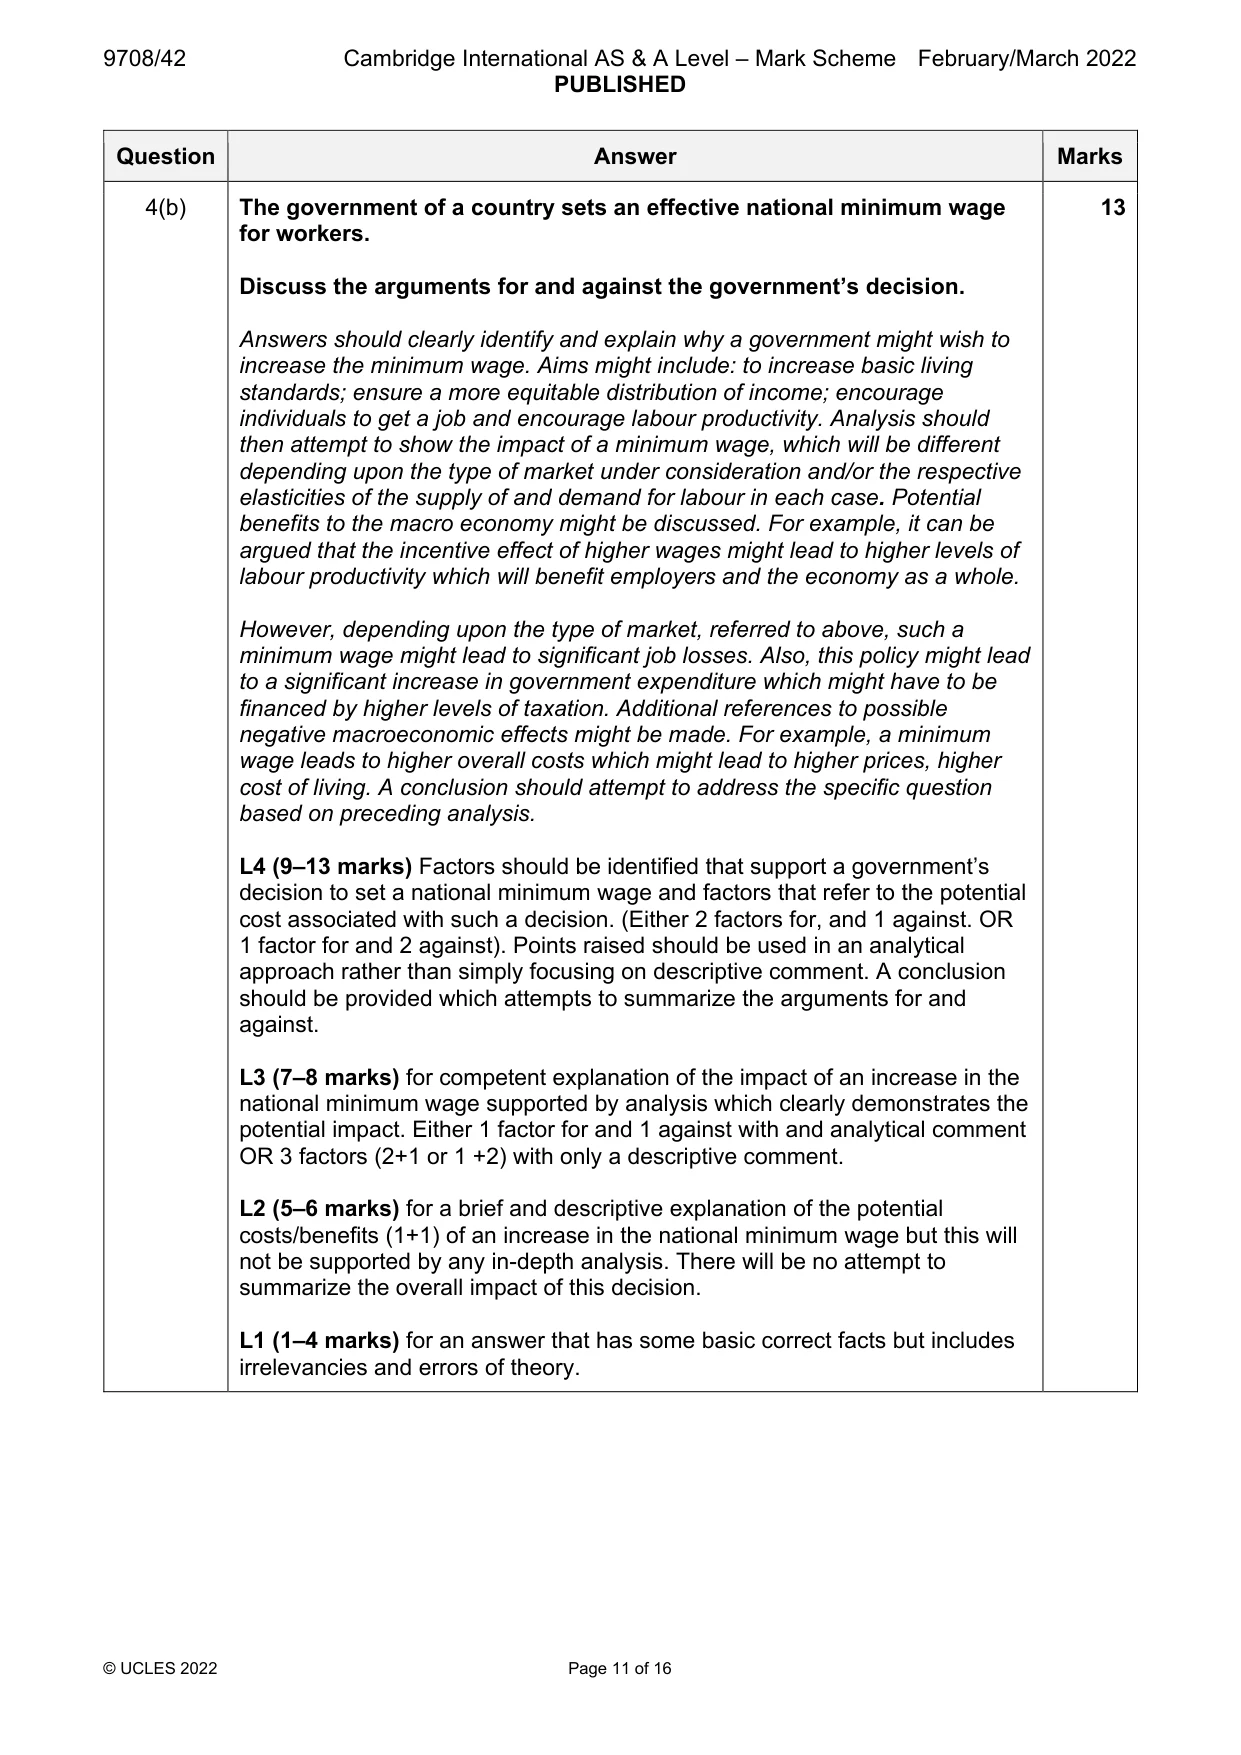
4 (a) A profit maximising firm operating in a perfectly competitive labour market might decide to increase the number of workers it employs but it will not choose to increase its workers’ wage rates. Discuss the extent to which you agree with this statement. [12] (b) The government of a country sets an effective national minimum wage for workers. Discuss the arguments for and against the government’s decision. [13]
Mark scheme: 4(a) A profit maximising firm operating in a perfectly competitive labour 12 market might decide to increase the number of workers it employs but it will not choose to increase its workers’ wage rates. Discuss the extent to which you agree with this statement. Key assumptions which underpin the theory of a perfectly competitive labour market should include: homogeneous labour; perfect mobility of labour, no barriers to entry, firms are wage takers; perfect knowledge. A profit maximising firm operating in this market will employ labour up to the point where the marginal product of labour is equal to the wage paid to labour. An explanation of the link between MRP and the demand for labour should be provided. It should also be noted that the supply of labour to each firm will be perfectly elastic at a wage determined by the market forces of supply of and demand for labour. If the productivity of workers within the firm increases or the price received by this firm increase, then the demand for labour will rise and more workers will be employed. However, the wage rate will not change. If a firm in perfect competition allowed an increase in its worker’s wages it would no longer maximise profits at the new level of output. Therefore this would support the statement in the question. Similarly, if a firm in a perfectly competitive labour market decided to raise wages with an increase in MRP, profits would only be maximised if the level of employment fell. It should be recognised in a conclusion that both wages and employment could rise at the same time if any of the conditions which determine market demand or market supply change. In this case each firm will receive a perfectly elastic supply of labour at a higher wage rate. L4 (9–12 marks) for a sound discussion that explains what is meant by a perfectly competitive labour market and how the profit maximising level of employment will be determined based on the supply of and demand for labour by the firm. Analysis should then be used to determine the extent to which the statement in the question might be true. A conclusion should refer to and consider the relationship between the labour market and the supply of labour to each firm. L3 (7–8 marks) for a competent comment with limited analysis that recognises what constitutes a perfect labour market and the profit maximising level of employment in this market. Some attempt might be made to address the specific question but the analysis will not be fully developed. No conclusion will be provided. L2 (5–6 marks) for an attempt which describes a perfectly competitive labour market and makes a limited attempt to explain how a firm in such a market might maximise profits but does not discuss why the demand for labour might change or why employment might rise but wages will not. L1 (1–4 marks) for an answer that has some basic correct facts but includes irrelevancies and errors of theory. 4(b) The government of a country sets an effective national minimum wage 13 for workers. Discuss the arguments for and against the government’s decision. Answers should clearly identify and explain why a government might wish to increase the minimum wage. Aims might include: to increase basic living standards; ensure a more equitable distribution of income; encourage individuals to get a job and encourage labour productivity. Analysis should then attempt to show the impact of a minimum wage, which will be different depending upon the type of market under consideration and/or the respective elasticities of the supply of and demand for labour in each case. Potential benefits to the macro economy might be discussed. For example, it can be argued that the incentive effect of higher wages might lead to higher levels of labour productivity which will benefit employers and the economy as a whole. However, depending upon the type of market, referred to above, such a minimum wage might lead to significant job losses. Also, this policy might lead to a significant increase in government expenditure which might have to be financed by higher levels of taxation. Additional references to possible negative macroeconomic effects might be made. For example, a minimum wage leads to higher overall costs which might lead to higher prices, higher cost of living. A conclusion should attempt to address the specific question based on preceding analysis. L4 (9–13 marks) Factors should be identified that support a government’s decision to set a national minimum wage and factors that refer to the potential cost associated with such a decision. (Either 2 factors for, and 1 against. OR 1 factor for and 2 against). Points raised should be used in an analytical approach rather than simply focusing on descriptive comment. A conclusion should be provided which attempts to summarize the arguments for and against. L3 (7–8 marks) for competent explanation of the impact of an increase in the national minimum wage supported by analysis which clearly demonstrates the potential impact. Either 1 factor for and 1 against with and analytical comment OR 3 factors (2+1 or 1 +2) with only a descriptive comment. L2 (5–6 marks) for a brief and descriptive explanation of the potential costs/benefits (1+1) of an increase in the national minimum wage but this will not be supported by any in-depth analysis. There will be no attempt to summarize the overall impact of this decision. L1 (1–4 marks) for an answer that has some basic correct facts but includes irrelevancies and errors of theory.
More questions on Labour market forces and government intervention
Q5 · Many developing countries rely heavily on the production and export of primary products
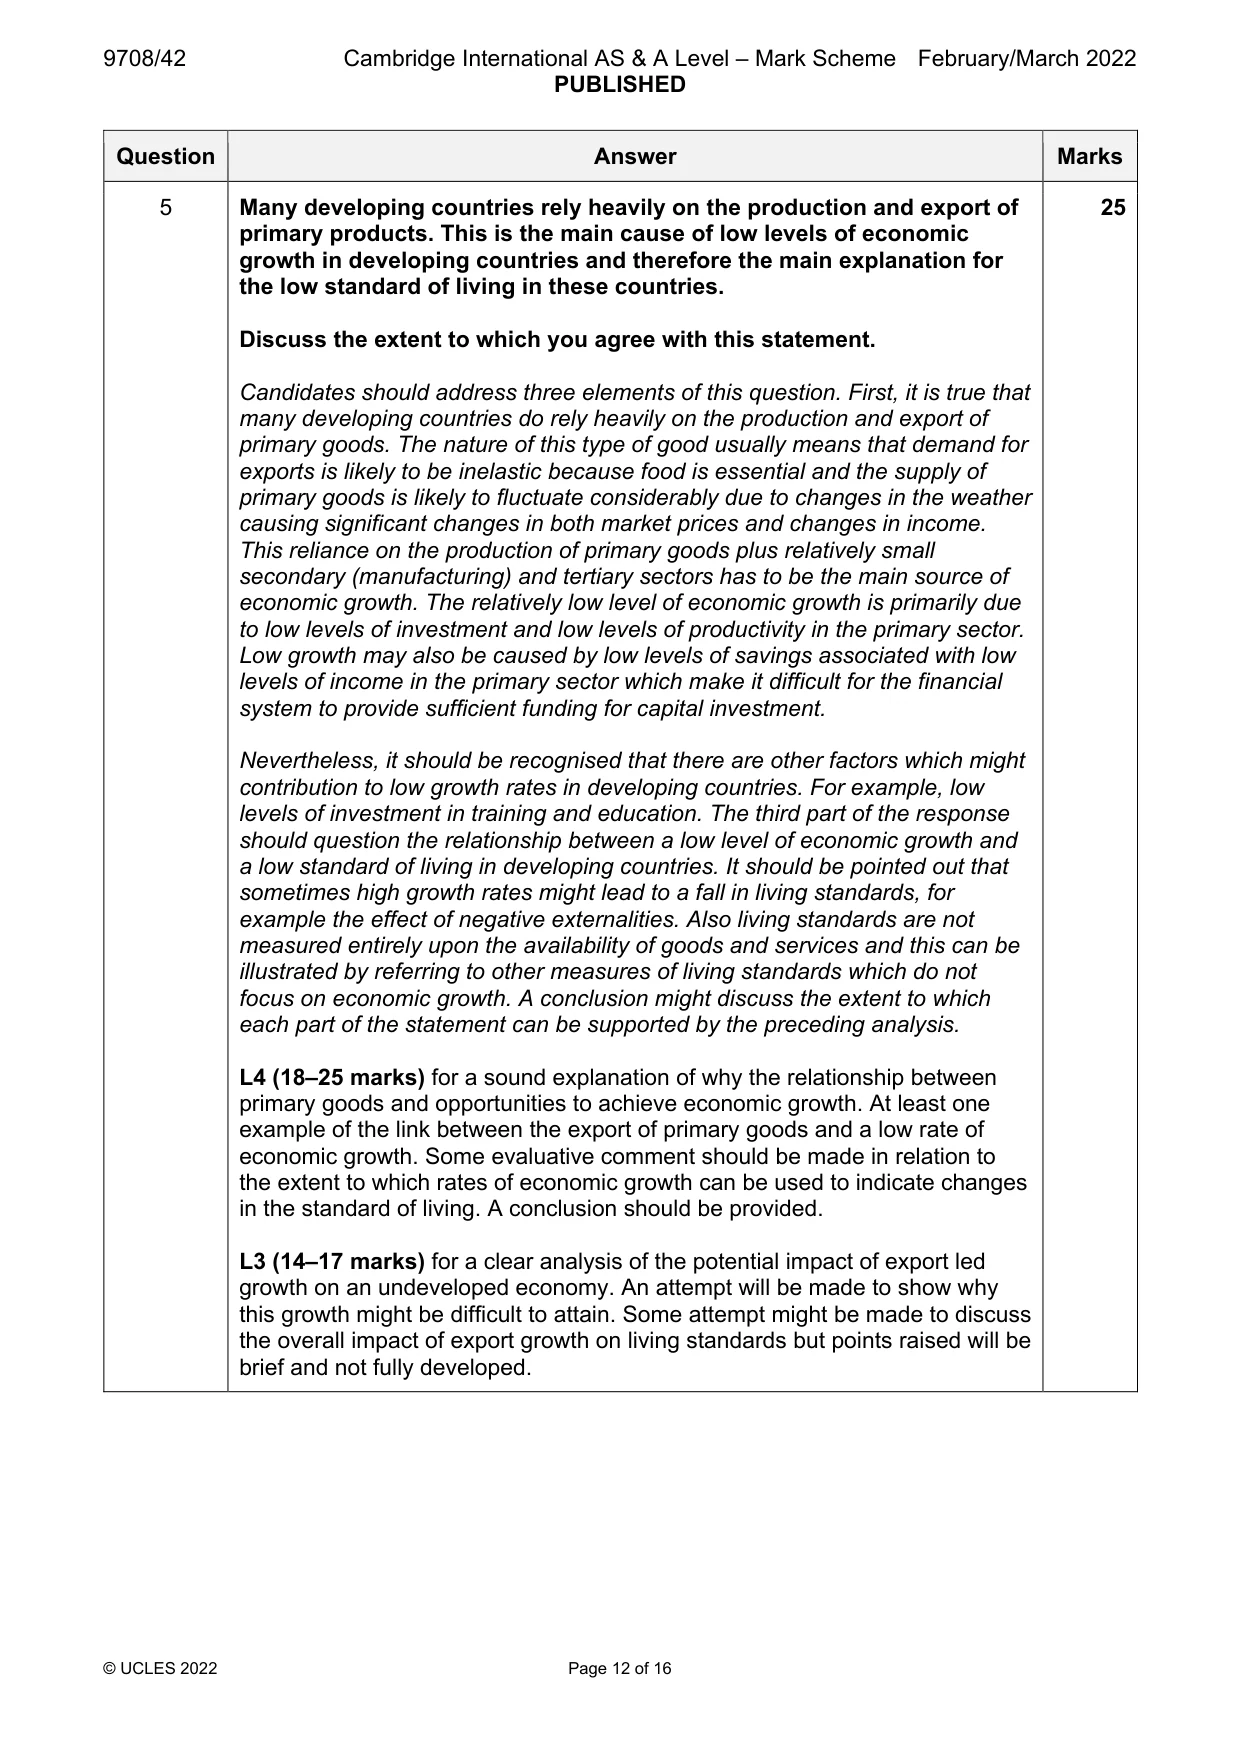
5 Many developing countries rely heavily on the production and export of primary products. This is the main cause of low levels of economic growth in developing countries and therefore the main explanation for the low standard of living in these countries. Discuss the extent to which you agree with this statement. [25]
Mark scheme: 5 Many developing countries rely heavily on the production and export of 25 primary products. This is the main cause of low levels of economic growth in developing countries and therefore the main explanation for the low standard of living in these countries. Discuss the extent to which you agree with this statement. Candidates should address three elements of this question. First, it is true that many developing countries do rely heavily on the production and export of primary goods. The nature of this type of good usually means that demand for exports is likely to be inelastic because food is essential and the supply of primary goods is likely to fluctuate considerably due to changes in the weather causing significant changes in both market prices and changes in income. This reliance on the production of primary goods plus relatively small secondary (manufacturing) and tertiary sectors has to be the main source of economic growth. The relatively low level of economic growth is primarily due to low levels of investment and low levels of productivity in the primary sector. Low growth may also be caused by low levels of savings associated with low levels of income in the primary sector which make it difficult for the financial system to provide sufficient funding for capital investment. Nevertheless, it should be recognised that there are other factors which might contribution to low growth rates in developing countries. For example, low levels of investment in training and education. The third part of the response should question the relationship between a low level of economic growth and a low standard of living in developing countries. It should be pointed out that sometimes high growth rates might lead to a fall in living standards, for example the effect of negative externalities. Also living standards are not measured entirely upon the availability of goods and services and this can be illustrated by referring to other measures of living standards which do not focus on economic growth. A conclusion might discuss the extent to which each part of the statement can be supported by the preceding analysis. L4 (18–25 marks) for a sound explanation of why the relationship between primary goods and opportunities to achieve economic growth. At least one example of the link between the export of primary goods and a low rate of economic growth. Some evaluative comment should be made in relation to the extent to which rates of economic growth can be used to indicate changes in the standard of living. A conclusion should be provided. L3 (14–17 marks) for a clear analysis of the potential impact of export led growth on an undeveloped economy. An attempt will be made to show why this growth might be difficult to attain. Some attempt might be made to discuss the overall impact of export growth on living standards but points raised will be brief and not fully developed. 5 L2 (10–13 marks) for a response which is descriptive rather than analytical. Answers might focus on factors which affect living standards in undeveloped countries. There will be only a very limited attempt to explain why export led growth based on primary products might be difficult. Links between growth and changes in the standard of living in developing countries will not be developed. L1 (1–9 marks) for an answer that has some basic correct facts but includes irrelevancies and errors of theory.
Q6 · Government policies which rely on increasing budget deficits to solve the problem of…
6 Government policies which rely on increasing budget deficits to solve the problem of unemployment will not be successful because they do not affect the natural rate of unemployment. Discuss the extent to which you agree with this statement. [25]
Mark scheme: 6 Government policies which rely on increasing budget deficits to solve 25 the problem of unemployment will not be successful because they do not affect the natural rate of unemployment. Discuss the extent to which you agree with this statement. Budget deficits used to solve the problem of unemployment are generally associated with Keynesian demand management policies. This policy approach is adopted to address the specific problem of cyclical unemployment where there is insufficient aggregate monetary demand in an economy. A budget deficit will produce net government spending which, in conjunction with the multiplier effect of this spending can lead to an increase in monetary demand which will solve the problem of cyclical unemployment. At this point it is assumed that the labour market is in equilibrium. However, natural unemployment relates to those workers who remain unemployed even though the labour market is in equilibrium. This is primarily due to market frictions on the labour market which lead to frictional and structural unemployment. In this situation, policies which rely upon budget deficits stimulating aggregate demand are unlikely to be successful. Alternative policies which focus upon the supply of labour are more appropriate. For example, Trade Union reform, reducing taxes on profits, subsidising new growth industries, might be used. Therefore, to some extent the statement in question is correct. It should however be also noted that increasing budget deficits might still fail to solve the problem of unemployment regardless of the impact of the natural rate of unemployment. For example, a budget deficit might lead to higher interest rates which might have a negative effect on investment, aggregate demand and employment. In addition, a budget deficit might lead to an increase in the money supply which might cause inflation and the further loss of jobs in the long run. A conclusion should refer to the above which suggests that the statement in question is only partially correct. L4 (18–25 marks) for a clear analysis of the relationship between an increase in a budget deficit and a reduction in unemployment. The natural rate of unemployment should be explained and linked to the specific question. Evaluation comment should be provided to establish the extent to which one might agree with the statement in question. A conclusion should be provided based on the preceding analysis/evaluation. L3 (14–17 marks) for accurate but only partially developed analysis based on the theory of cyclical unemployment and an explanation of natural unemployment. A limited attempt will be made to link the relationship between these two types of unemployment to the specific question. No evaluative comment will be provided. L2 (10–13 marks) for a mainly descriptive comment which links budget deficits to cyclical unemployment and explains what is meant by the natural rate of unemployment but does not link this comment to the specific question. L1 (1–9 marks) for an answer that has some basic correct facts but includes irrelevancies and errors of theory.
More questions on Effectiveness of policy options to meet all macroeconomic objectives
Q7 · Consider, with the help of a circular flow diagram, the potential impact of a fall in the…
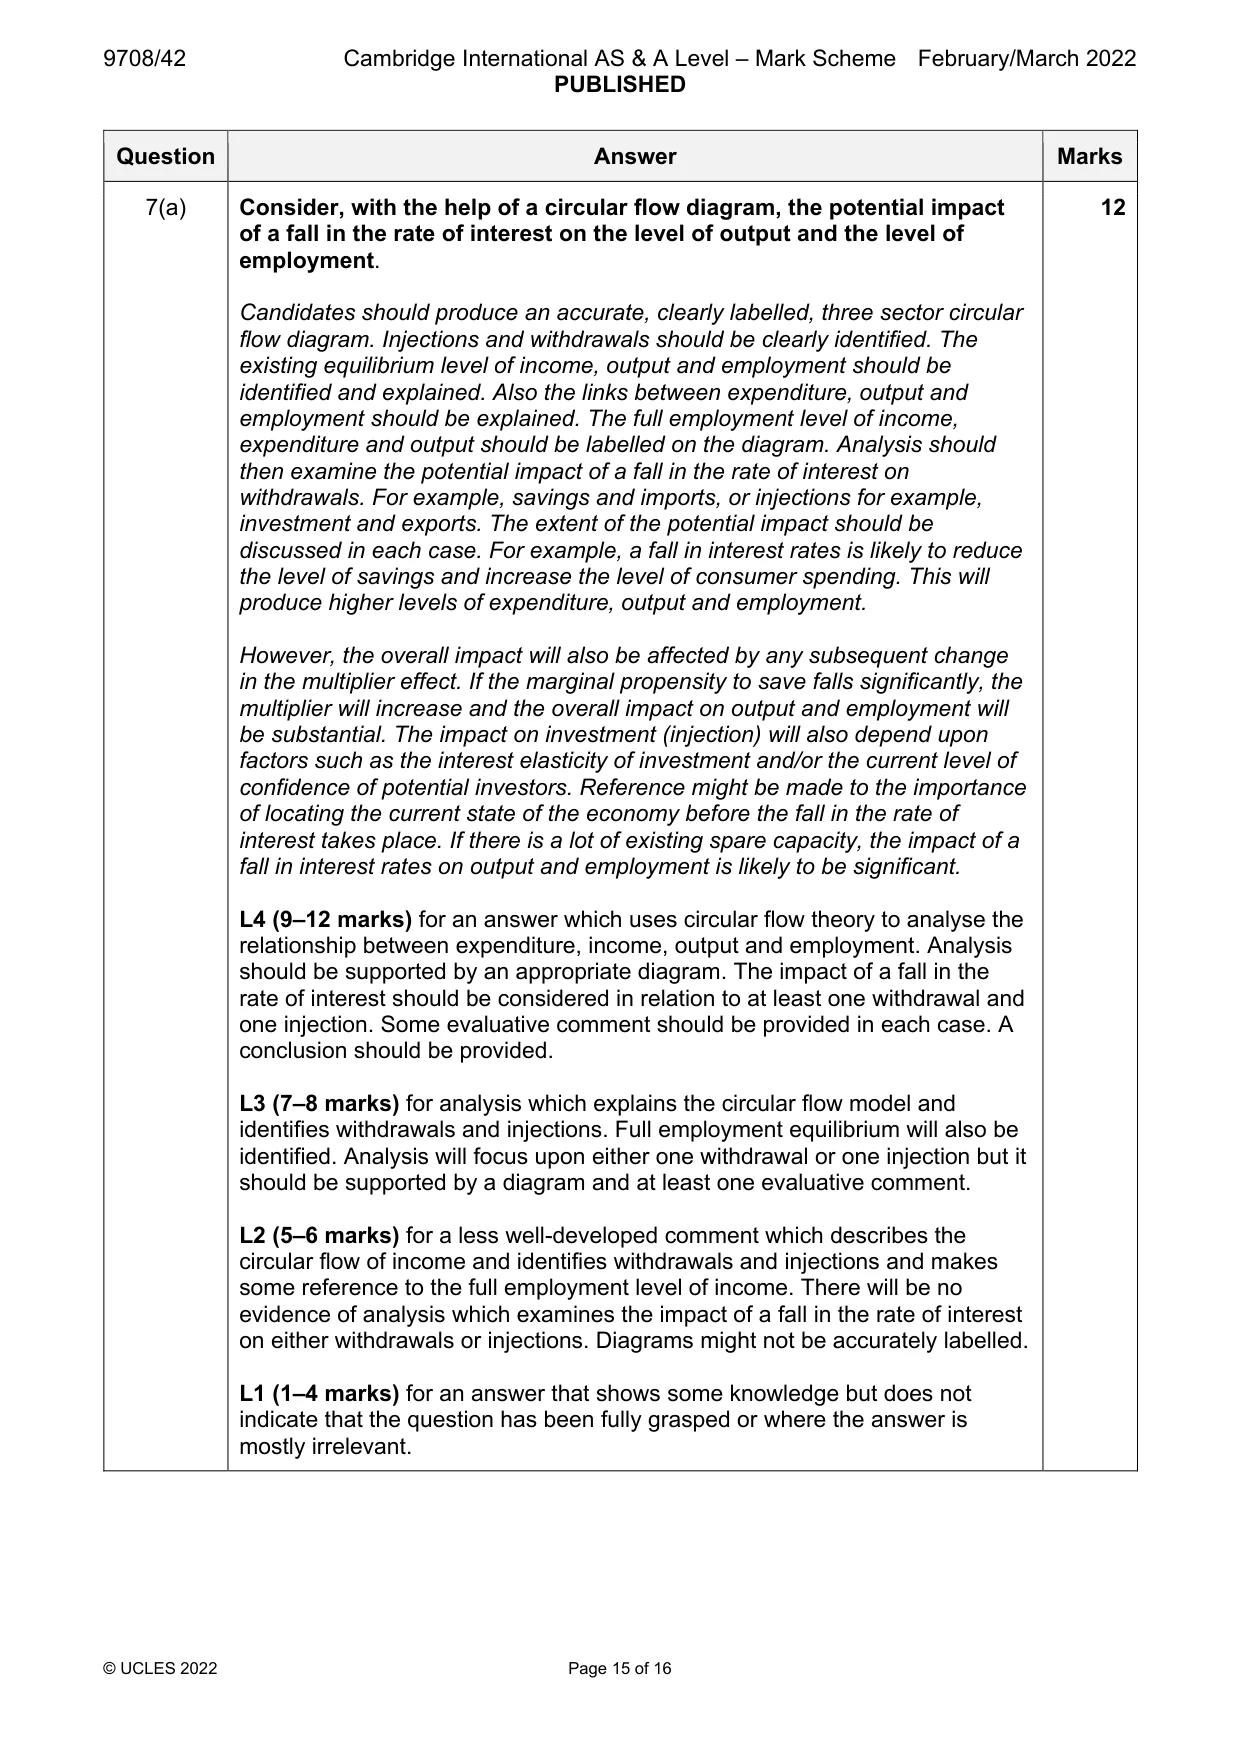
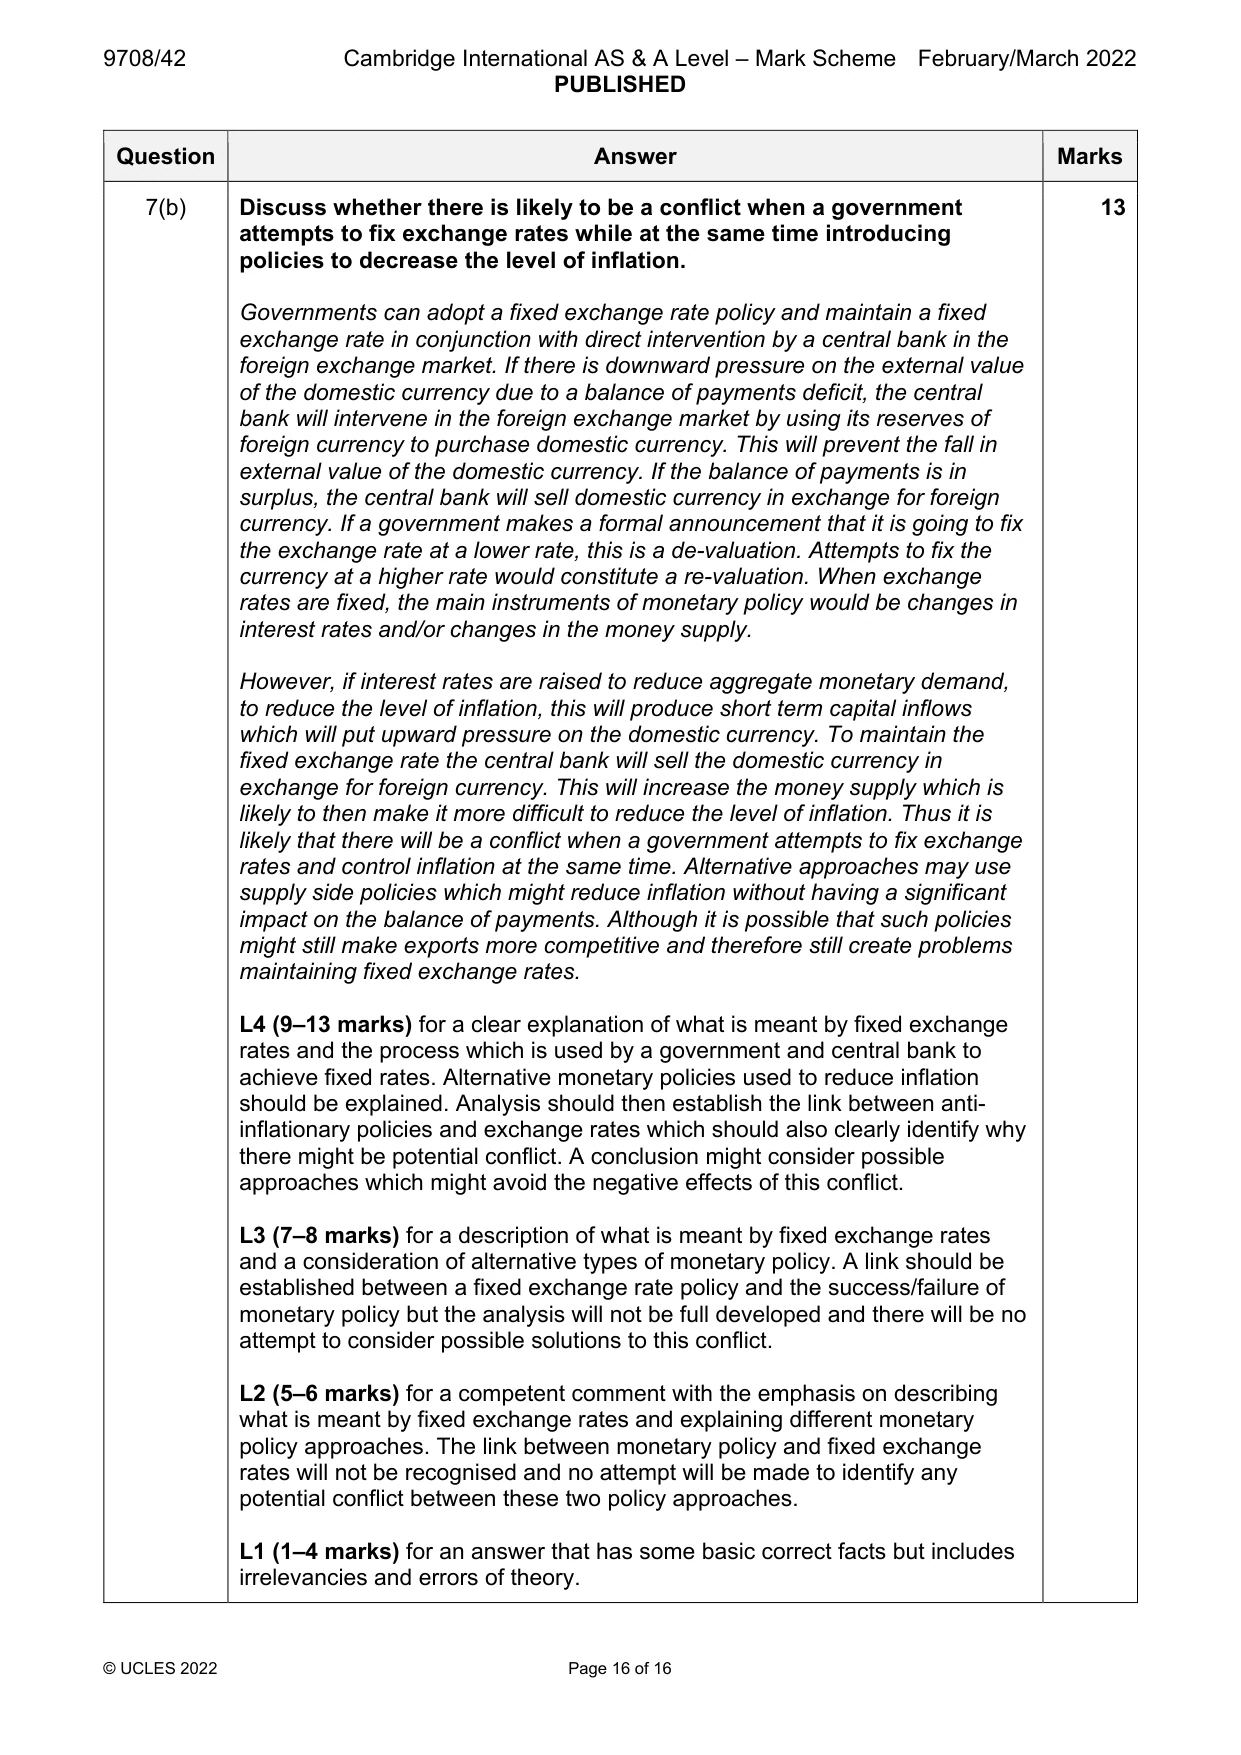
7 (a) Consider, with the help of a circular flow diagram, the potential impact of a fall in the rate of interest on the level of output and the level of employment. [12] (b) Discuss whether there is likely to be a conflict when a government attempts to fix exchange rates while at the same time introducing policies to decrease the level of inflation. [13]
Mark scheme: 7(a) Consider, with the help of a circular flow diagram, the potential impact 12 of a fall in the rate of interest on the level of output and the level of employment. Candidates should produce an accurate, clearly labelled, three sector circular flow diagram. Injections and withdrawals should be clearly identified. The existing equilibrium level of income, output and employment should be identified and explained. Also the links between expenditure, output and employment should be explained. The full employment level of income, expenditure and output should be labelled on the diagram. Analysis should then examine the potential impact of a fall in the rate of interest on withdrawals. For example, savings and imports, or injections for example, investment and exports. The extent of the potential impact should be discussed in each case. For example, a fall in interest rates is likely to reduce the level of savings and increase the level of consumer spending. This will produce higher levels of expenditure, output and employment. However, the overall impact will also be affected by any subsequent change in the multiplier effect. If the marginal propensity to save falls significantly, the multiplier will increase and the overall impact on output and employment will be substantial. The impact on investment (injection) will also depend upon factors such as the interest elasticity of investment and/or the current level of confidence of potential investors. Reference might be made to the importance of locating the current state of the economy before the fall in the rate of interest takes place. If there is a lot of existing spare capacity, the impact of a fall in interest rates on output and employment is likely to be significant. L4 (9–12 marks) for an answer which uses circular flow theory to analyse the relationship between expenditure, income, output and employment. Analysis should be supported by an appropriate diagram. The impact of a fall in the rate of interest should be considered in relation to at least one withdrawal and one injection. Some evaluative comment should be provided in each case. A conclusion should be provided. L3 (7–8 marks) for analysis which explains the circular flow model and identifies withdrawals and injections. Full employment equilibrium will also be identified. Analysis will focus upon either one withdrawal or one injection but it should be supported by a diagram and at least one evaluative comment. L2 (5–6 marks) for a less well-developed comment which describes the circular flow of income and identifies withdrawals and injections and makes some reference to the full employment level of income. There will be no evidence of analysis which examines the impact of a fall in the rate of interest on either withdrawals or injections. Diagrams might not be accurately labelled. L1 (1–4 marks) for an answer that shows some knowledge but does not indicate that the question has been fully grasped or where the answer is mostly irrelevant. 7(b) Discuss whether there is likely to be a conflict when a government 13 attempts to fix exchange rates while at the same time introducing policies to decrease the level of inflation. Governments can adopt a fixed exchange rate policy and maintain a fixed exchange rate in conjunction with direct intervention by a central bank in the foreign exchange market. If there is downward pressure on the external value of the domestic currency due to a balance of payments deficit, the central bank will intervene in the foreign exchange market by using its reserves of foreign currency to purchase domestic currency. This will prevent the fall in external value of the domestic currency. If the balance of payments is in surplus, the central bank will sell domestic currency in exchange for foreign currency. If a government makes a formal announcement that it is going to fix the exchange rate at a lower rate, this is a de-valuation. Attempts to fix the currency at a higher rate would constitute a re-valuation. When exchange rates are fixed, the main instruments of monetary policy would be changes in interest rates and/or changes in the money supply. However, if interest rates are raised to reduce aggregate monetary demand, to reduce the level of inflation, this will produce short term capital inflows which will put upward pressure on the domestic currency. To maintain the fixed exchange rate the central bank will sell the domestic currency in exchange for foreign currency. This will increase the money supply which is likely to then make it more difficult to reduce the level of inflation. Thus it is likely that there will be a conflict when a government attempts to fix exchange rates and control inflation at the same time. Alternative approaches may use supply side policies which might reduce inflation without having a significant impact on the balance of payments. Although it is possible that such policies might still make exports more competitive and therefore still create problems maintaining fixed exchange rates. L4 (9–13 marks) for a clear explanation of what is meant by fixed exchange rates and the process which is used by a government and central bank to achieve fixed rates. Alternative monetary policies used to reduce inflation should be explained. Analysis should then establish the link between anti- inflationary policies and exchange rates which should also clearly identify why there might be potential conflict. A conclusion might consider possible approaches which might avoid the negative effects of this conflict. L3 (7–8 marks) for a description of what is meant by fixed exchange rates and a consideration of alternative types of monetary policy. A link should be established between a fixed exchange rate policy and the success/failure of monetary policy but the analysis will not be full developed and there will be no attempt to consider possible solutions to this conflict. L2 (5–6 marks) for a competent comment with the emphasis on describing what is meant by fixed exchange rates and explaining different monetary policy approaches. The link between monetary policy and fixed exchange rates will not be recognised and no attempt will be made to identify any potential conflict between these two policy approaches. L1 (1–4 marks) for an answer that has some basic correct facts but includes irrelevancies and errors of theory.
More questions on Links between macroeconomic problems and their interrelatedness
What was in this paper
The subtopics covered by these 7 questions, and how many questions each got. Open one in a new tab to see every Cambridge question on it.
1Effectiveness of policy options to meet all macroeconomic objectives1Government policies to achieve efficient resource allocation and correct market failure1Indifference curves and budget lines1Labour market forces and government intervention1Links between macroeconomic problems and their interrelatedness1Methods and effects of government intervention in markets1What you needed in this session
Cambridge’s own grade thresholds for 2022 Feb/March, Paper 4 · Variant 2. A higher threshold means an easier paper — the bar moves with how the cohort did.