Cambridge A Level Economics 9708 — 2020 May/June Paper 4 · Variant 2
9708/42/M/J/20 · 7 questions · 170 marks · ≈191 min
The question paper and its mark scheme, free to read here and free to download. This is Cambridge’s own paper, exactly as it was sat.
Question paper4 pages


Mark scheme10 pages
Answers below. Sit the paper first if you are practising.





Questions as text
Q1 · The impact of economic concentration By locating closely together manufacturers can often…
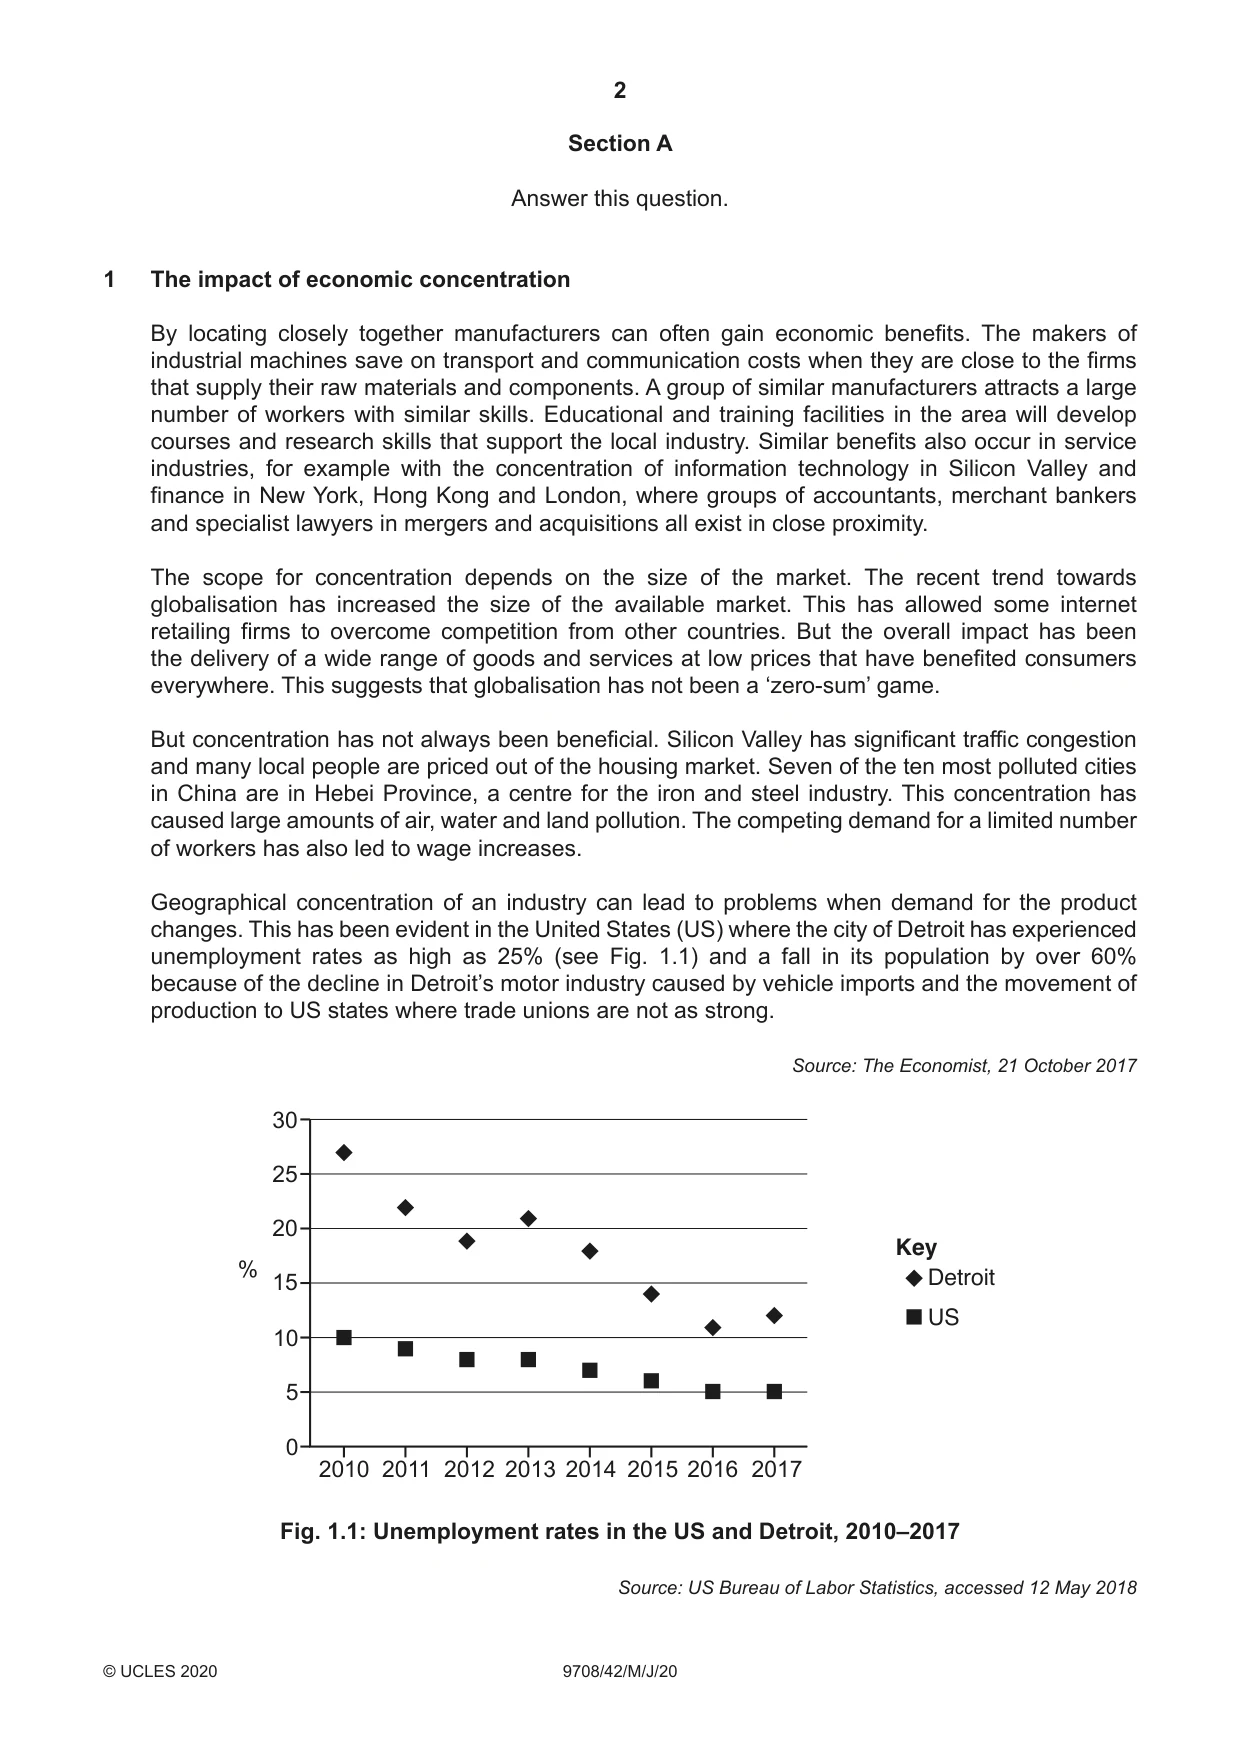
1 The impact of economic concentration By locating closely together manufacturers can often gain economic benefits. The makers of industrial machines save on transport and communication costs when they are close to the firms that supply their raw materials and components. A group of similar manufacturers attracts a large number of workers with similar skills. Educational and training facilities in the area will develop courses and research skills that support the local industry. Similar benefits also occur in service industries, for example with the concentration of information technology in Silicon Valley and finance in New York, Hong Kong and London, where groups of accountants, merchant bankers and specialist lawyers in mergers and acquisitions all exist in close proximity. The scope for concentration depends on the size of the market. The recent trend towards globalisation has increased the size of the available market. This has allowed some internet retailing firms to overcome competition from other countries. But the overall impact has been the delivery of a wide range of goods and services at low prices that have benefited consumers everywhere. This suggests that globalisation has not been a ‘zero-sum’ game. But concentration has not always been beneficial. Silicon Valley has significant traffic congestion and many local people are priced out of the housing market. Seven of the ten most polluted cities in China are in Hebei Province, a centre for the iron and steel industry. This concentration has caused large amounts of air, water and land pollution. The competing demand for a limited number of workers has also led to wage increases. Geographical concentration of an industry can lead to problems when demand for the product changes. This has been evident in the United States (US) where the city of Detroit has experienced unemployment rates as high as 25% (see Fig. 1.1) and a fall in its population by over 60% because of the decline in Detroit’s motor industry caused by vehicle imports and the movement of production to US states where trade unions are not as strong. Source: The Economist, 21 October 2017 30 25 20 Key % 15 Detroit US 10 5 0 2010 2011 2012 2013 2014 2015 2016 2017 Fig. 1.1: Unemployment rates in the US and Detroit, 2010–2017 Source: US Bureau of Labor Statistics, accessed 12 May 2018 (a) Explain the meaning of zero-sum in game theory. [2] (b) Use the information to explain how external economies of scale develop. Show, with the aid of a diagram, how this would affect a firm’s average costs. [5] (c) There is a fall in demand for the product of a geographically concentrated industry. Analyse the economic implications of this for the area where the industry is located. [6] (d) Consider how the negative externalities from concentrated industrial production can be reduced. [7]
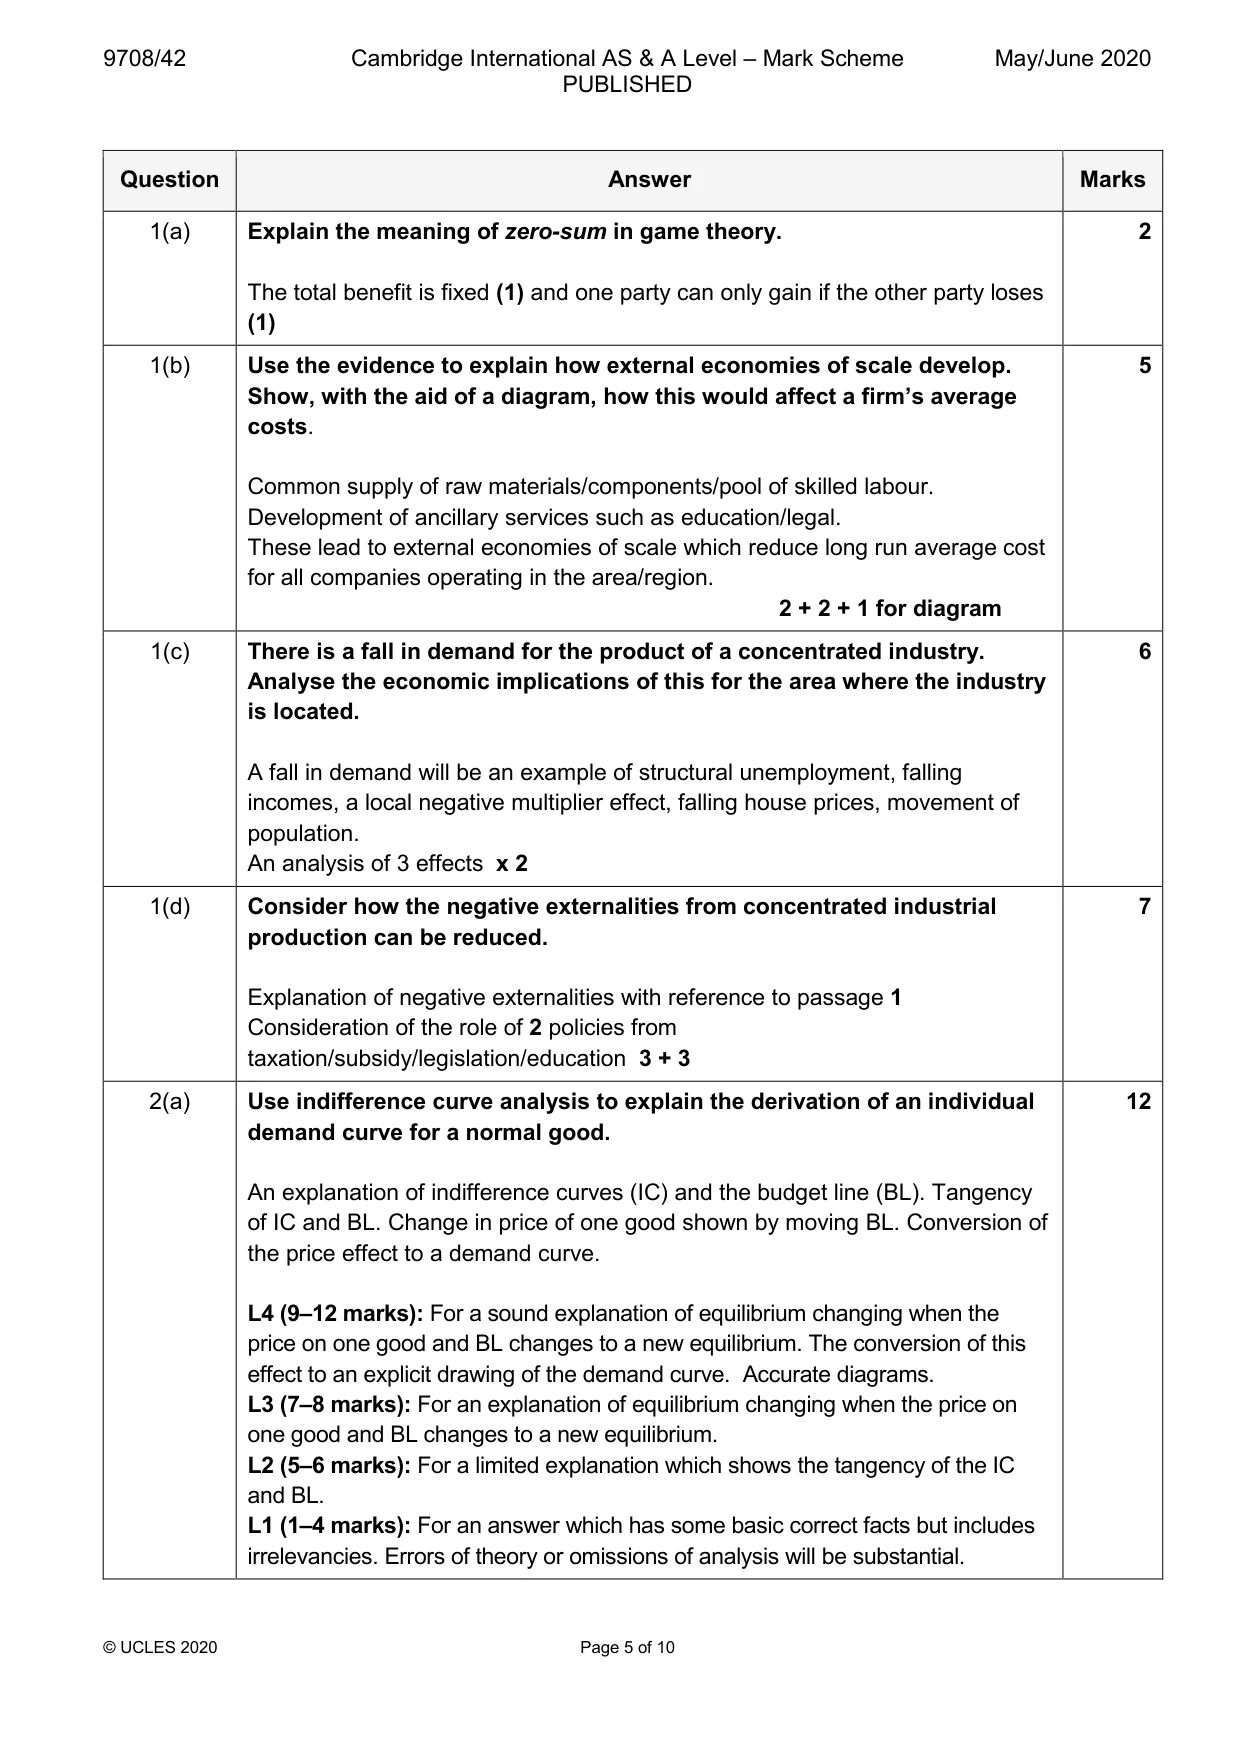
Mark scheme: Question Answer Marks 1(a) Explain the meaning of zero-sum in game theory. 2 The total benefit is fixed (1) and one party can only gain if the other party loses (1) 1(b) Use the evidence to explain how external economies of scale develop. 5 Show, with the aid of a diagram, how this would affect a firm’s average costs. Common supply of raw materials/components/pool of skilled labour. Development of ancillary services such as education/legal. These lead to external economies of scale which reduce long run average cost for all companies operating in the area/region. 2 + 2 + 1 for diagram 1(c) There is a fall in demand for the product of a concentrated industry. 6 Analyse the economic implications of this for the area where the industry is located. A fall in demand will be an example of structural unemployment, falling incomes, a local negative multiplier effect, falling house prices, movement of population. An analysis of 3 effects x 2 1(d) Consider how the negative externalities from concentrated industrial 7 production can be reduced. Explanation of negative externalities with reference to passage 1 Consideration of the role of 2 policies from taxation/subsidy/legislation/education 3 + 3
Q2 · Use indifference curve analysis to explain the derivation of an individual demand curve…
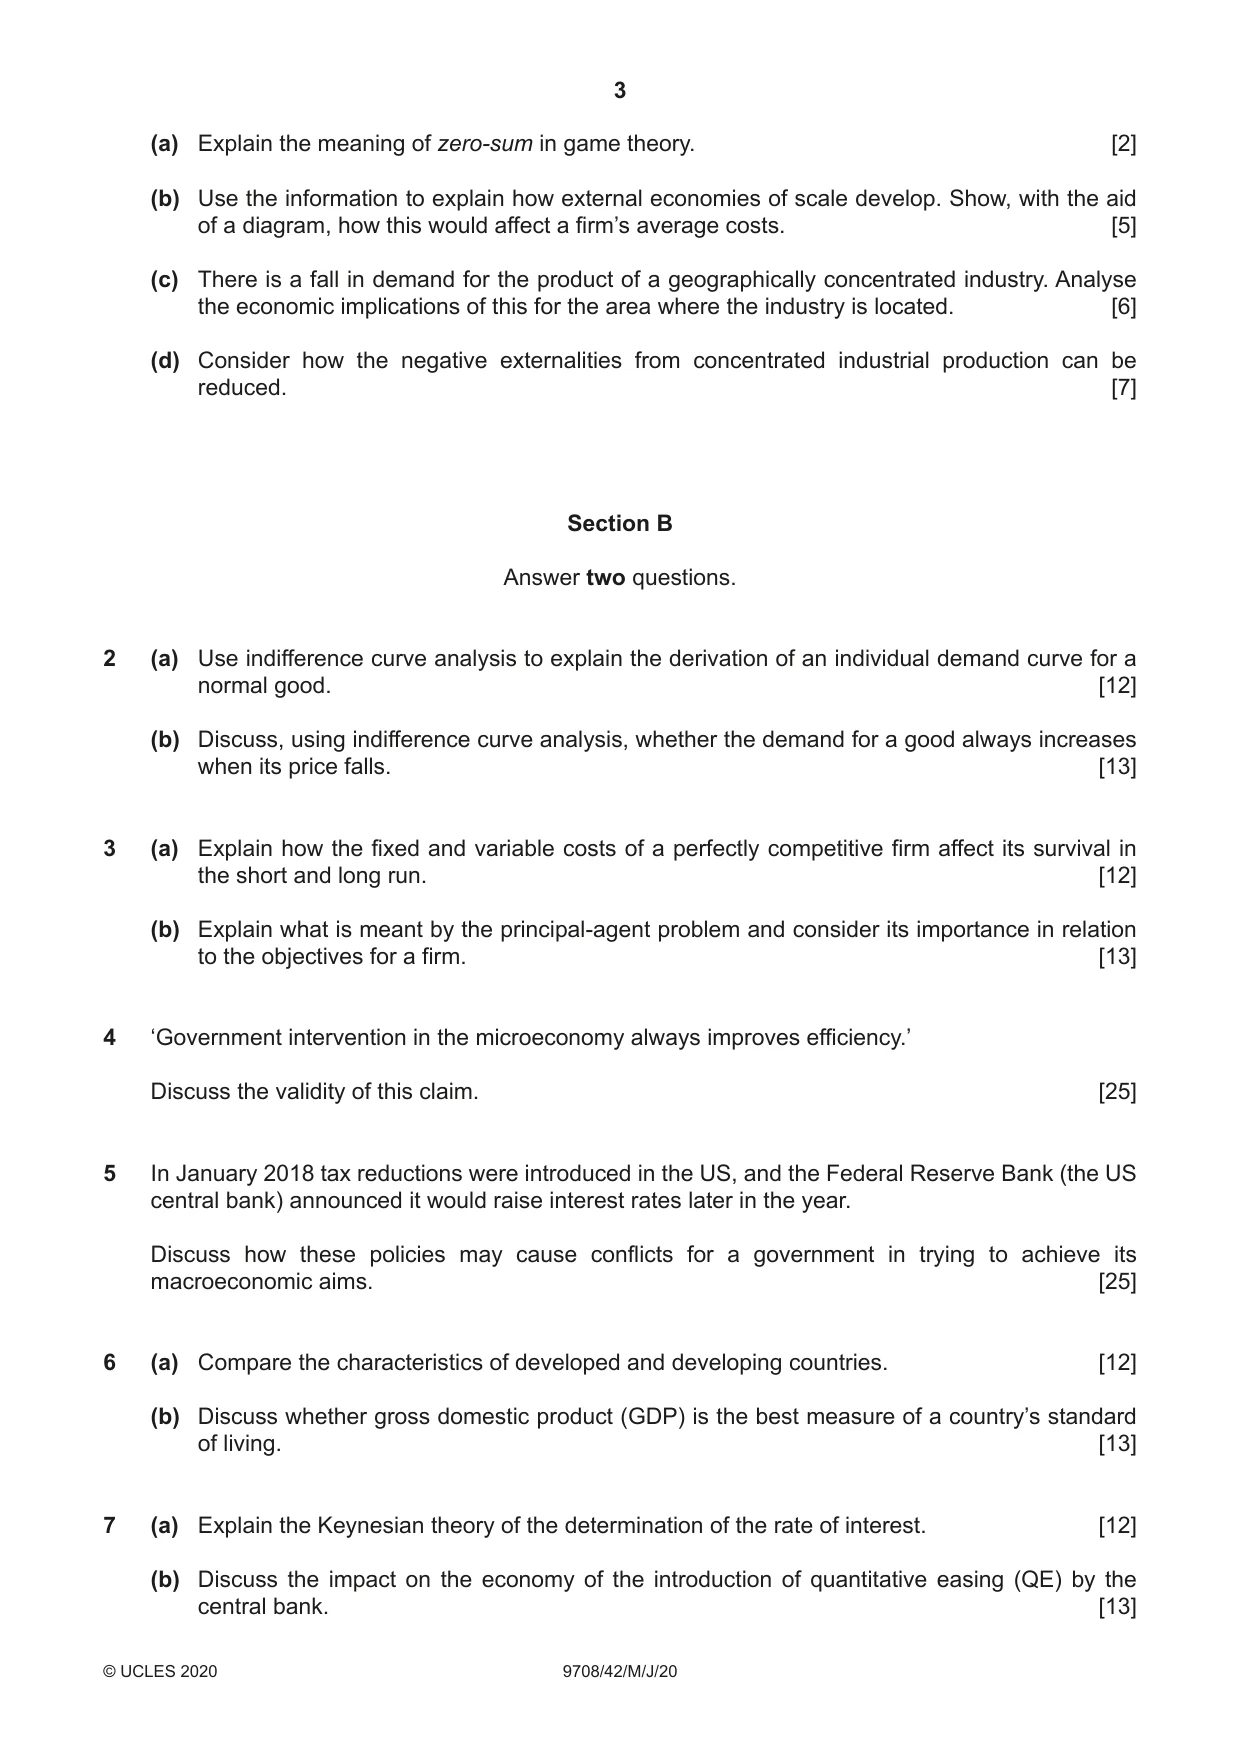
2 (a) Use indifference curve analysis to explain the derivation of an individual demand curve for a normal good. [12] (b) Discuss, using indifference curve analysis, whether the demand for a good always increases when its price falls. [13]
Mark scheme: 2(a) Use indifference curve analysis to explain the derivation of an individual 12 demand curve for a normal good. An explanation of indifference curves (IC) and the budget line (BL). Tangency of IC and BL. Change in price of one good shown by moving BL. Conversion of the price effect to a demand curve. L4 (9–12 marks): For a sound explanation of equilibrium changing when the price on one good and BL changes to a new equilibrium. The conversion of this effect to an explicit drawing of the demand curve. Accurate diagrams. L3 (7–8 marks): For an explanation of equilibrium changing when the price on one good and BL changes to a new equilibrium. L2 (5–6 marks): For a limited explanation which shows the tangency of the IC and BL. L1 (1–4 marks): For an answer which has some basic correct facts but includes irrelevancies. Errors of theory or omissions of analysis will be substantial. 2(b) Discuss, using indifference curve analysis, whether the demand for a 13 good always increases when its price falls. Income and substitution effects need to be explained and applied in the context of a falling price. The three alternatives: i) YE & SE are both positive and reinforce each other, ii) YE is negative & SE is positive but more than YE and iii) YE is negative but greater than SE are. L4 (9–13 marks): For an answer which concentrates on either the fall in income, and impact on demand or the fall in price showing the movement of the BL and the impact on the quantity demanded. Discussion of the significance of the income effect and the substitution effects. Accurate diagrams. Max 11 if no conclusion. L3 (7–8 marks): For an answer which concentrates on either the fall in income, and impact on demand and the fall in price showing the movement of the BL and the impact on the quantity demanded. L2 (5–6 marks): For an answer which concentrates on either the fall in income, and impact on demand or the fall in price showing the movement of the BL and the impact on the quantity demanded. L1 (1–4 marks): For an answer which has some basic correct facts but includes irrelevancies. Errors of theory or omissions of analysis will be substantial.
Q3 · Explain how the fixed and variable costs of a perfectly competitive firm affect its…
3 (a) Explain how the fixed and variable costs of a perfectly competitive firm affect its survival in the short and long run. [12] (b) Explain what is meant by the principal-agent problem and consider its importance in relation to the objectives for a firm. [13]
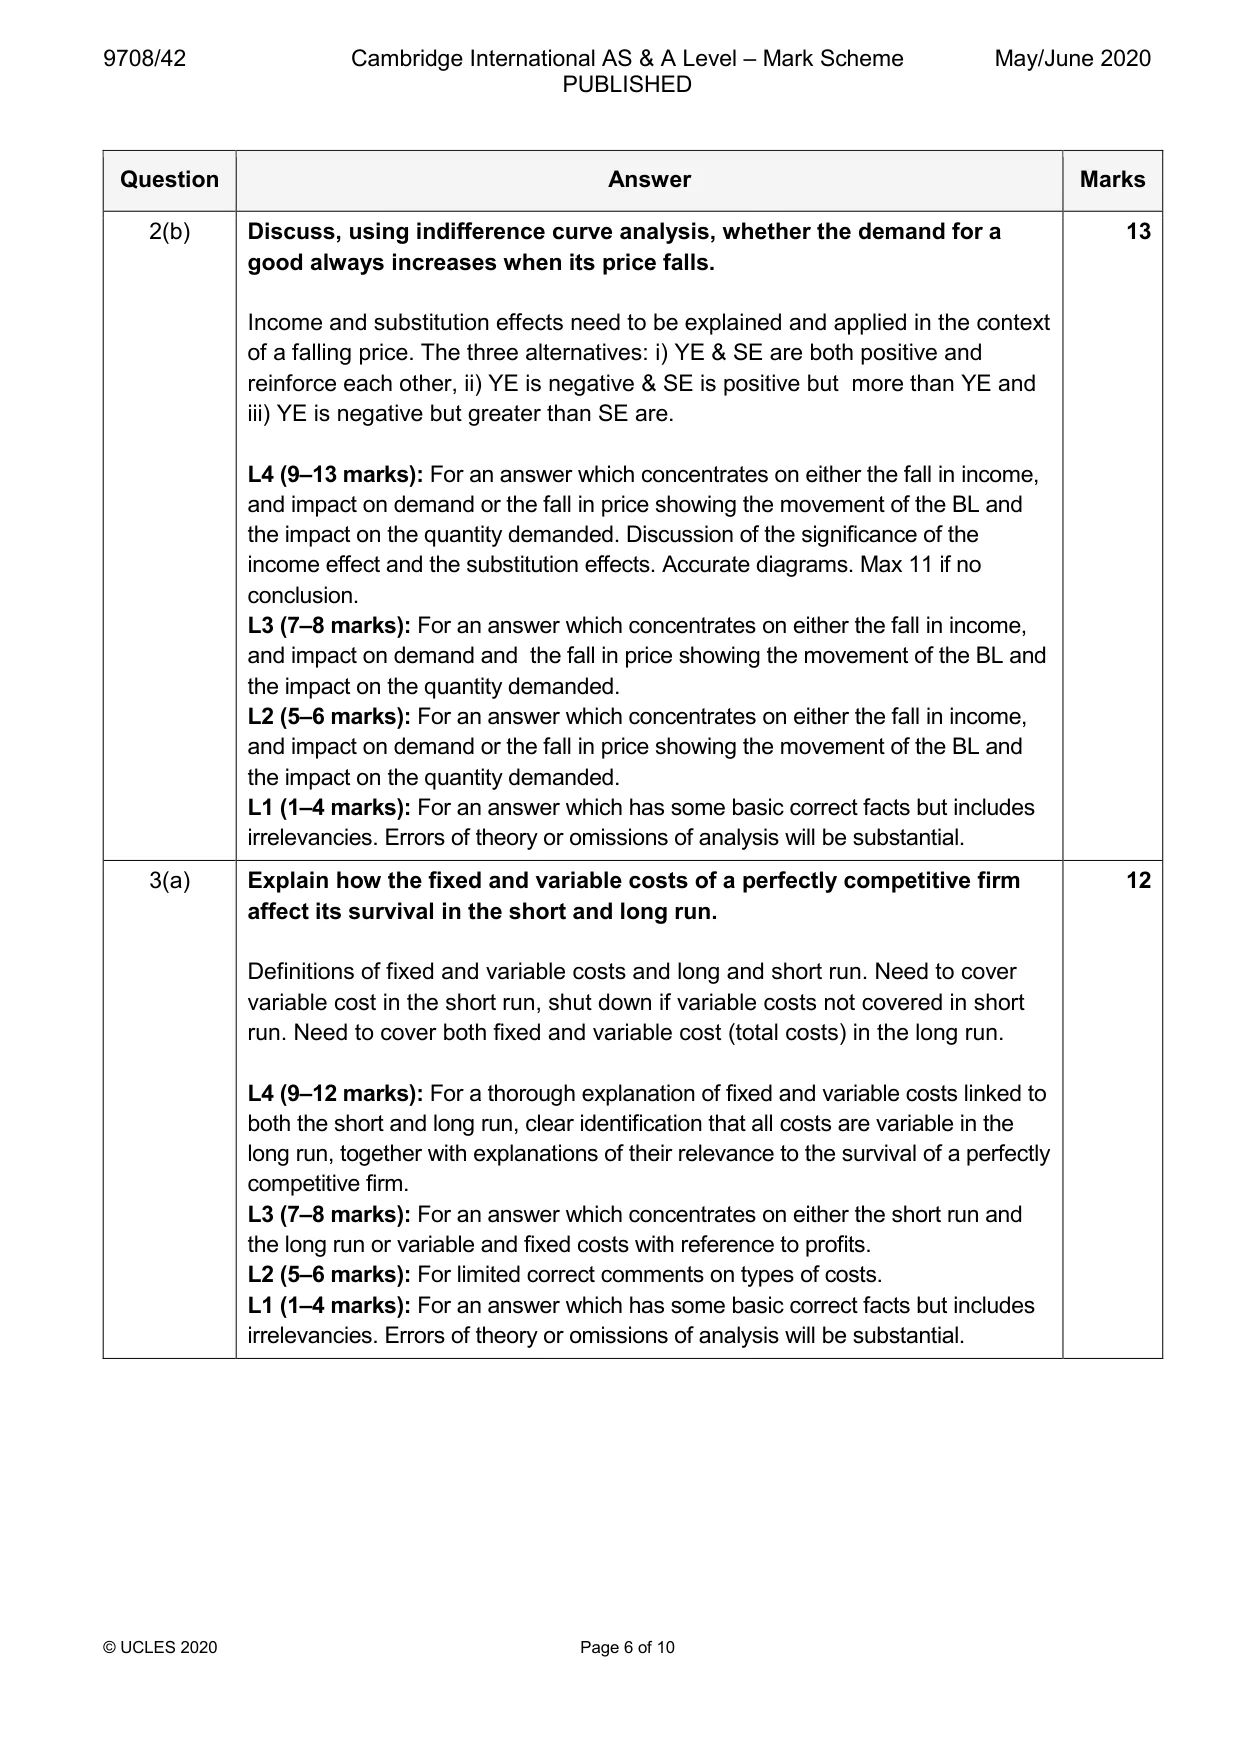
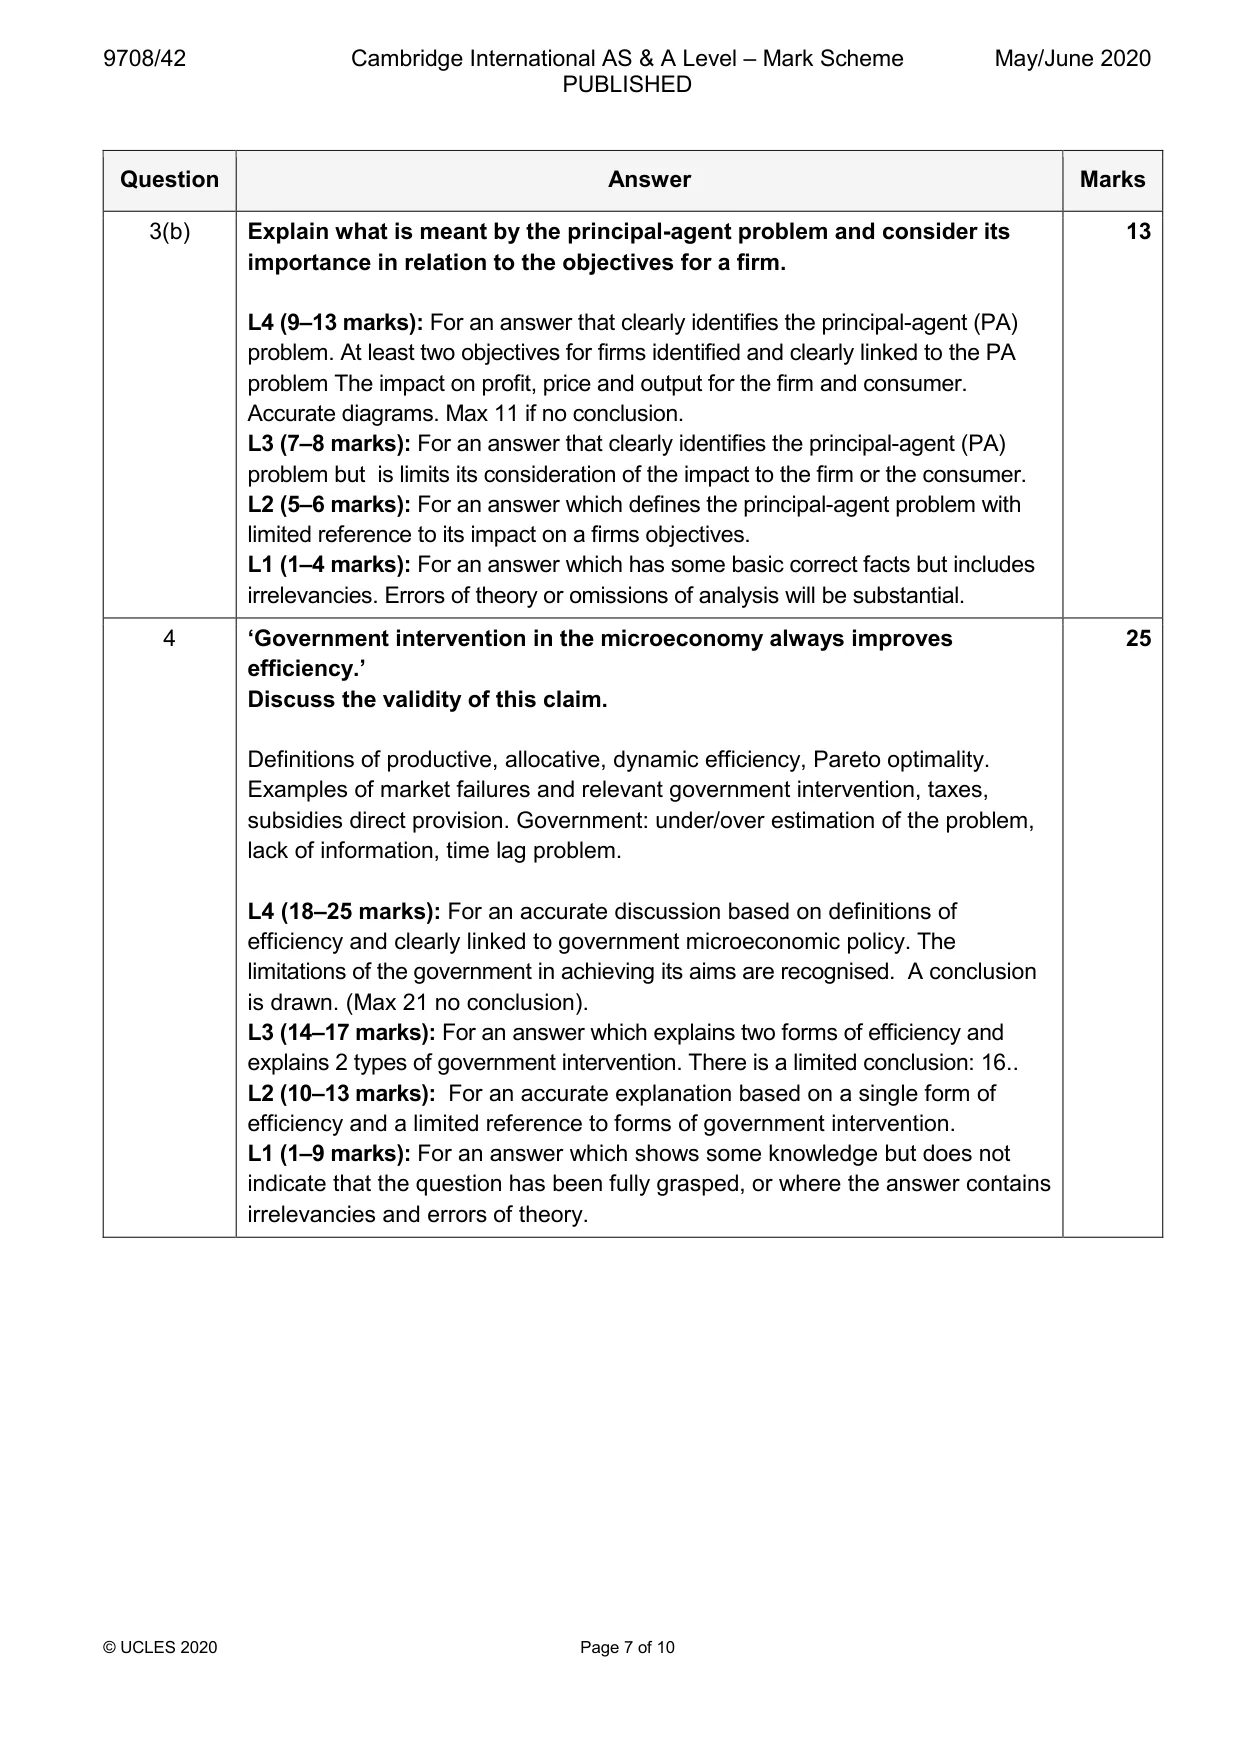
Mark scheme: 3(a) Explain how the fixed and variable costs of a perfectly competitive firm 12 affect its survival in the short and long run. Definitions of fixed and variable costs and long and short run. Need to cover variable cost in the short run, shut down if variable costs not covered in short run. Need to cover both fixed and variable cost (total costs) in the long run. L4 (9–12 marks): For a thorough explanation of fixed and variable costs linked to both the short and long run, clear identification that all costs are variable in the long run, together with explanations of their relevance to the survival of a perfectly competitive firm. L3 (7–8 marks): For an answer which concentrates on either the short run and the long run or variable and fixed costs with reference to profits. L2 (5–6 marks): For limited correct comments on types of costs. L1 (1–4 marks): For an answer which has some basic correct facts but includes irrelevancies. Errors of theory or omissions of analysis will be substantial. 3(b) Explain what is meant by the principal-agent problem and consider its 13 importance in relation to the objectives for a firm. L4 (9–13 marks): For an answer that clearly identifies the principal-agent (PA) problem. At least two objectives for firms identified and clearly linked to the PA problem The impact on profit, price and output for the firm and consumer. Accurate diagrams. Max 11 if no conclusion. L3 (7–8 marks): For an answer that clearly identifies the principal-agent (PA) problem but is limits its consideration of the impact to the firm or the consumer. L2 (5–6 marks): For an answer which defines the principal-agent problem with limited reference to its impact on a firms objectives. L1 (1–4 marks): For an answer which has some basic correct facts but includes irrelevancies. Errors of theory or omissions of analysis will be substantial.
More questions on Differing objectives and policies of firms
Q4 · ‘Government intervention in the microeconomy always improves efficiency.’ Discuss the…
4 ‘Government intervention in the microeconomy always improves efficiency.’ Discuss the validity of this claim. [25]
Mark scheme: 4 ‘Government intervention in the microeconomy always improves 25 efficiency.’ Discuss the validity of this claim. Definitions of productive, allocative, dynamic efficiency, Pareto optimality. Examples of market failures and relevant government intervention, taxes, subsidies direct provision. Government: under/over estimation of the problem, lack of information, time lag problem. L4 (18–25 marks): For an accurate discussion based on definitions of efficiency and clearly linked to government microeconomic policy. The limitations of the government in achieving its aims are recognised. A conclusion is drawn. (Max 21 no conclusion). L3 (14–17 marks): For an answer which explains two forms of efficiency and explains 2 types of government intervention. There is a limited conclusion: 16.. L2 (10–13 marks): For an accurate explanation based on a single form of efficiency and a limited reference to forms of government intervention. L1 (1–9 marks): For an answer which shows some knowledge but does not indicate that the question has been fully grasped, or where the answer contains irrelevancies and errors of theory.
Q5 · In January 2018 tax reductions were introduced in the US, and the Federal Reserve Bank…
5 In January 2018 tax reductions were introduced in the US, and the Federal Reserve Bank (the US central bank) announced it would raise interest rates later in the year. Discuss how these policies may cause conflicts for a government in trying to achieve its macroeconomic aims. [25]
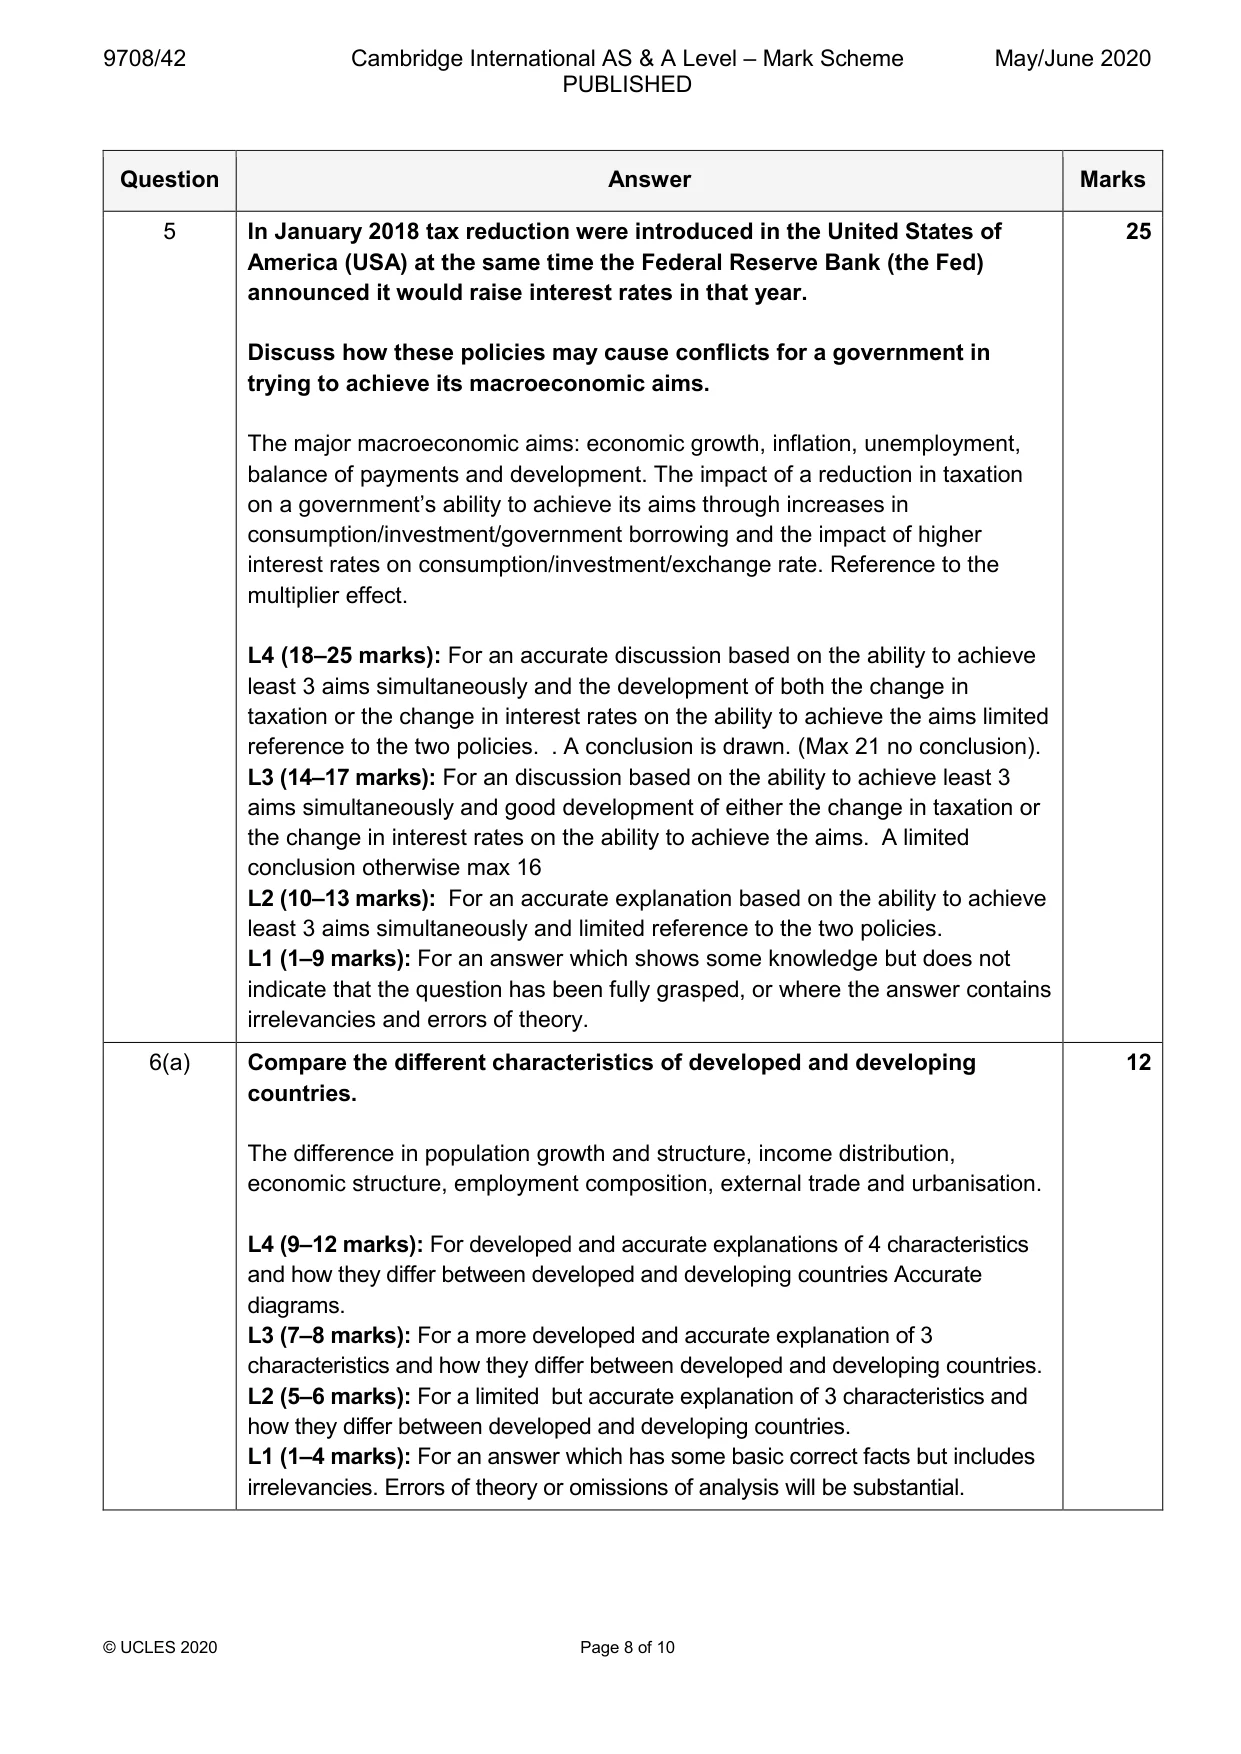
Mark scheme: 5 In January 2018 tax reduction were introduced in the United States of 25 America (USA) at the same time the Federal Reserve Bank (the Fed) announced it would raise interest rates in that year. Discuss how these policies may cause conflicts for a government in trying to achieve its macroeconomic aims. The major macroeconomic aims: economic growth, inflation, unemployment, balance of payments and development. The impact of a reduction in taxation on a government’s ability to achieve its aims through increases in consumption/investment/government borrowing and the impact of higher interest rates on consumption/investment/exchange rate. Reference to the multiplier effect. L4 (18–25 marks): For an accurate discussion based on the ability to achieve least 3 aims simultaneously and the development of both the change in taxation or the change in interest rates on the ability to achieve the aims limited reference to the two policies. . A conclusion is drawn. (Max 21 no conclusion). L3 (14–17 marks): For an discussion based on the ability to achieve least 3 aims simultaneously and good development of either the change in taxation or the change in interest rates on the ability to achieve the aims. A limited conclusion otherwise max 16 L2 (10–13 marks): For an accurate explanation based on the ability to achieve least 3 aims simultaneously and limited reference to the two policies. L1 (1–9 marks): For an answer which shows some knowledge but does not indicate that the question has been fully grasped, or where the answer contains irrelevancies and errors of theory.
More questions on Links between macroeconomic problems and their interrelatedness
Q6 · Compare the characteristics of developed and developing countries
6 (a) Compare the characteristics of developed and developing countries. [12] (b) Discuss whether gross domestic product (GDP) is the best measure of a country’s standard of living. [13]
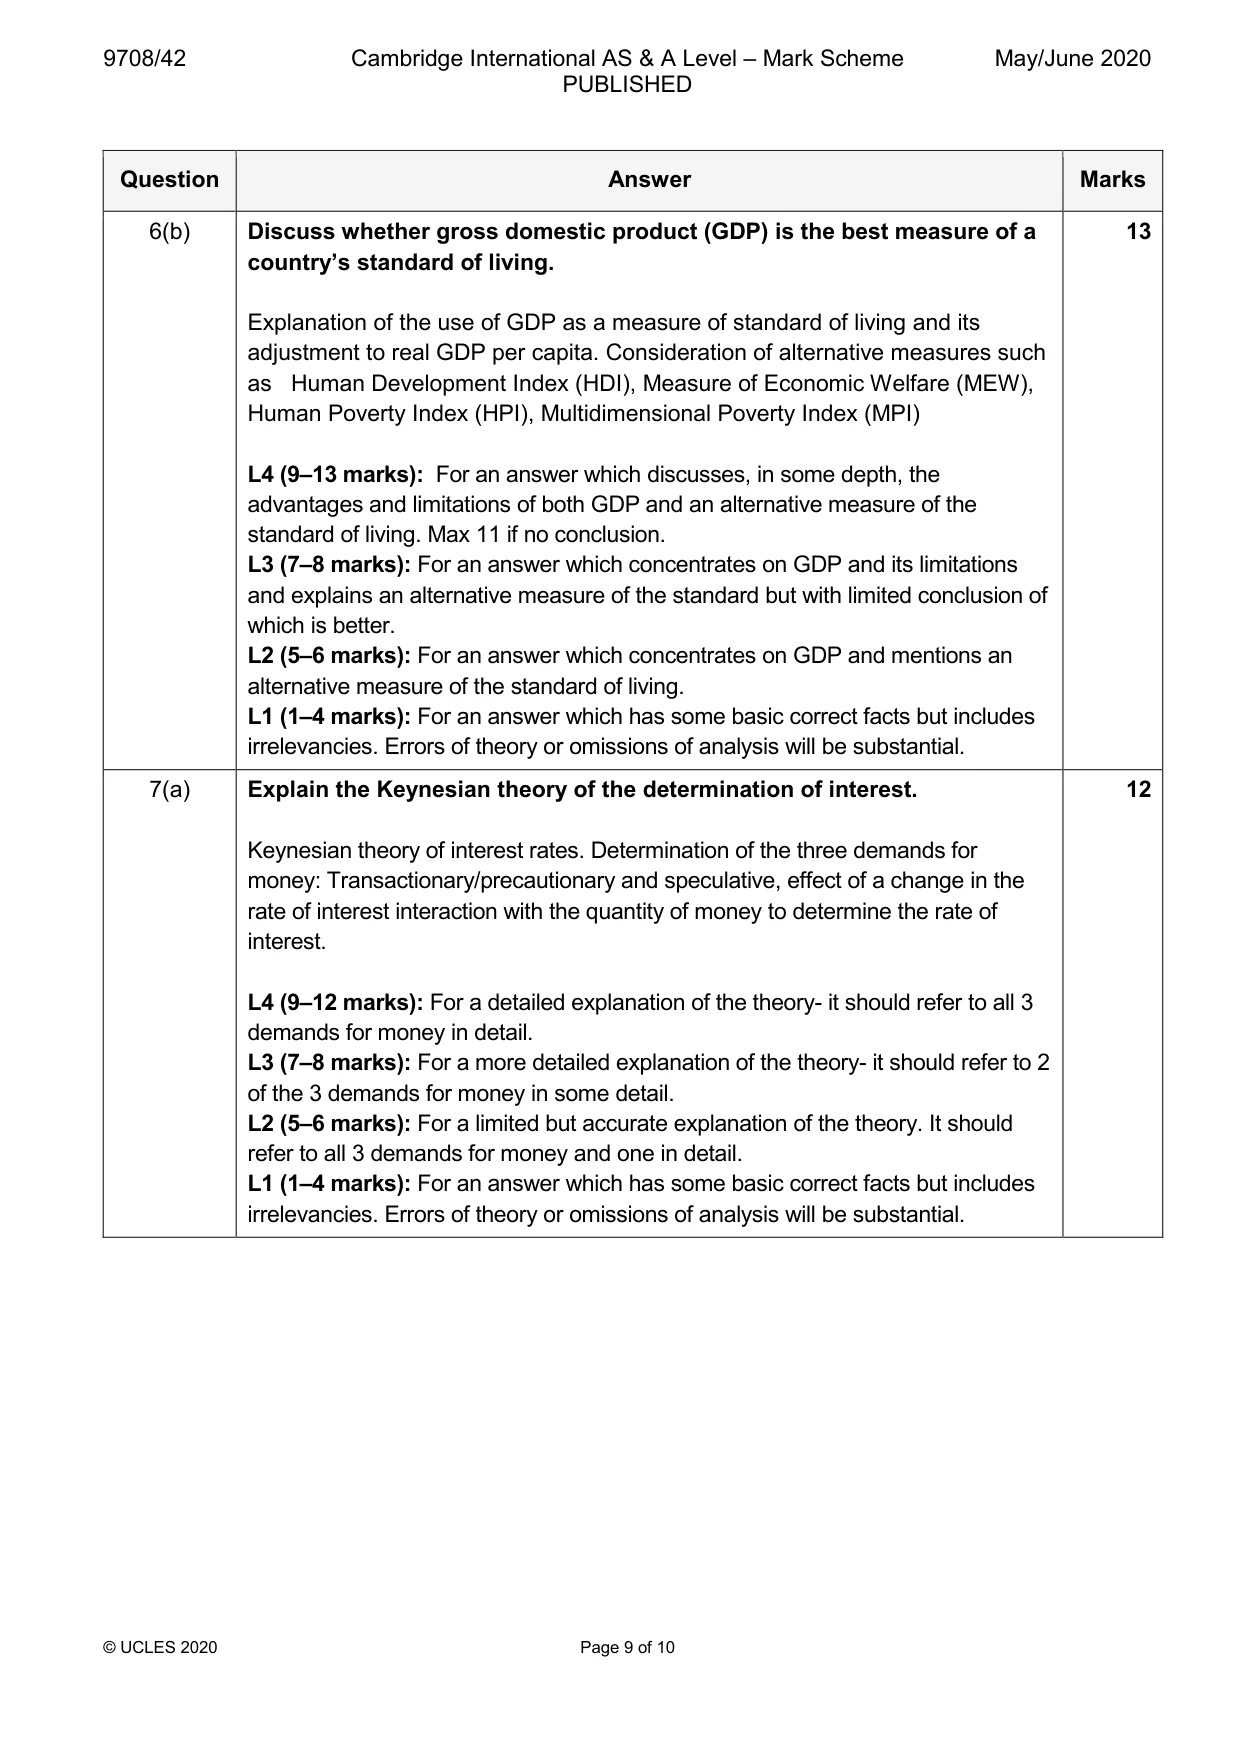
Mark scheme: 6(a) Compare the different characteristics of developed and developing 12 countries. The difference in population growth and structure, income distribution, economic structure, employment composition, external trade and urbanisation. L4 (9–12 marks): For developed and accurate explanations of 4 characteristics and how they differ between developed and developing countries Accurate diagrams. L3 (7–8 marks): For a more developed and accurate explanation of 3 characteristics and how they differ between developed and developing countries. L2 (5–6 marks): For a limited but accurate explanation of 3 characteristics and how they differ between developed and developing countries. L1 (1–4 marks): For an answer which has some basic correct facts but includes irrelevancies. Errors of theory or omissions of analysis will be substantial. 6(b) Discuss whether gross domestic product (GDP) is the best measure of a 13 country’s standard of living. Explanation of the use of GDP as a measure of standard of living and its adjustment to real GDP per capita. Consideration of alternative measures such as Human Development Index (HDI), Measure of Economic Welfare (MEW), Human Poverty Index (HPI), Multidimensional Poverty Index (MPI) L4 (9–13 marks): For an answer which discusses, in some depth, the advantages and limitations of both GDP and an alternative measure of the standard of living. Max 11 if no conclusion. L3 (7–8 marks): For an answer which concentrates on GDP and its limitations and explains an alternative measure of the standard but with limited conclusion of which is better. L2 (5–6 marks): For an answer which concentrates on GDP and mentions an alternative measure of the standard of living. L1 (1–4 marks): For an answer which has some basic correct facts but includes irrelevancies. Errors of theory or omissions of analysis will be substantial.
Q7 · Explain the Keynesian theory of the determination of the rate of interest
7 (a) Explain the Keynesian theory of the determination of the rate of interest. [12] (b) Discuss the impact on the economy of the introduction of quantitative easing (QE) by the central bank. [13]
Mark scheme: 7(a) Explain the Keynesian theory of the determination of interest. 12 Keynesian theory of interest rates. Determination of the three demands for money: Transactionary/precautionary and speculative, effect of a change in the rate of interest interaction with the quantity of money to determine the rate of interest. L4 (9–12 marks): For a detailed explanation of the theory- it should refer to all 3 demands for money in detail. L3 (7–8 marks): For a more detailed explanation of the theory- it should refer to 2 of the 3 demands for money in some detail. L2 (5–6 marks): For a limited but accurate explanation of the theory. It should refer to all 3 demands for money and one in detail. L1 (1–4 marks): For an answer which has some basic correct facts but includes irrelevancies. Errors of theory or omissions of analysis will be substantial. 7(b) Discuss the impact on the economy of the introduction of quantitative 13 easing (QE) by the central bank. Explanation of the meaning of QE. Discussion of the impact of QE either through the wealth effect from rising asset prices or effect on interest rates. The money transmission mechanism and its impact on aggregate demand. Multiplier effect of increased consumption on imports/ taxation/investment. L4 (9–13 marks): For a balanced answer which explains QE and discusses in detail the impact of QE on a range of economic variables. . Maximum 11 marks if no conclusion. L3 (7–8 marks): For an answer which explains QE and discusses the impact of QE on a single economic variable e.g. output. L2 (5–6 marks): For an answer which explains QE but fails to apply its impact to the economy. L1 (1–4 marks): For an answer which has some basic correct facts but includes irrelevancies. Errors of theory or omissions of analysis will be substantial.
What was in this paper
The subtopics covered by these 7 questions, and how many questions each got. Open one in a new tab to see every Cambridge question on it.