Cambridge A Level Economics 9708 — 2020 Feb/March Paper 4 · Variant 2
9708/42/F/M/20 · 7 questions · 70 marks · ≈79 min
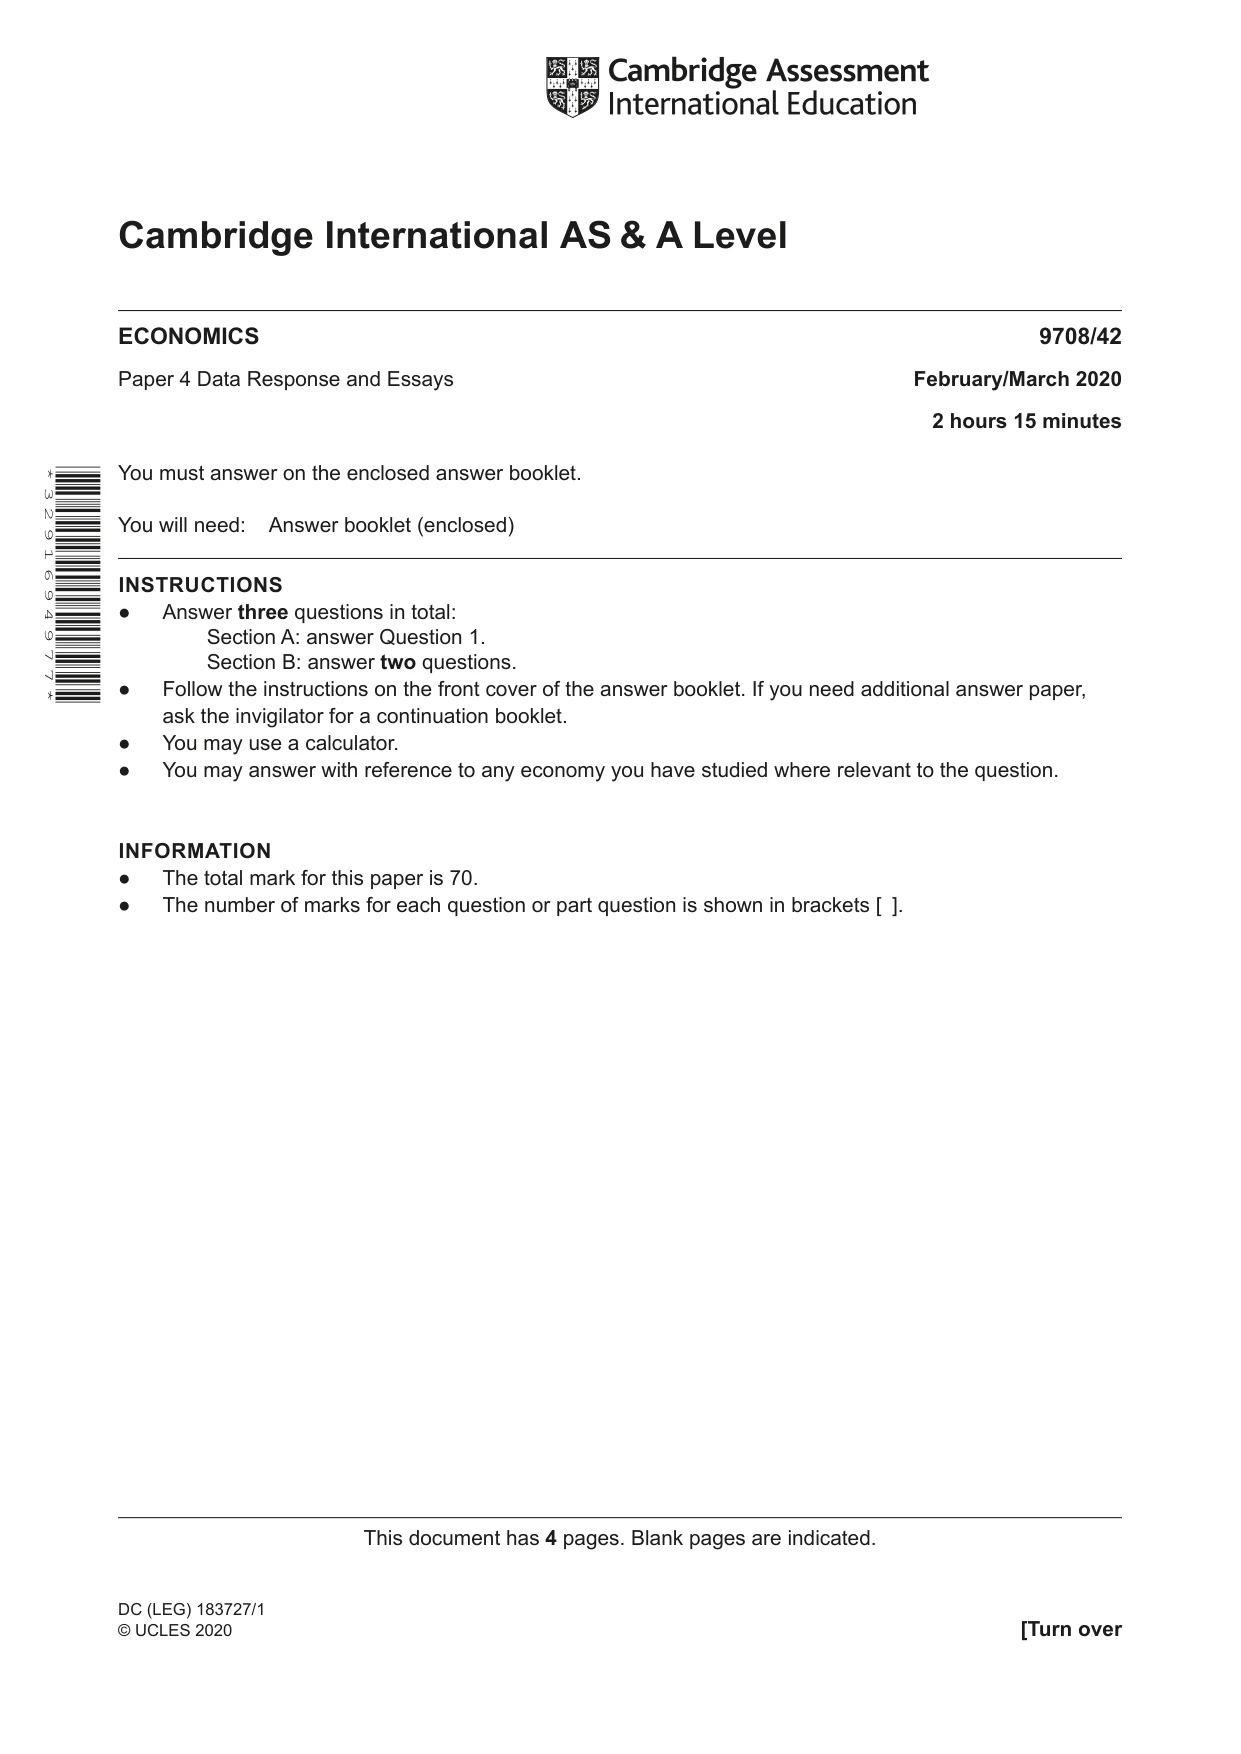
The question paper and its mark scheme, free to read here and free to download. This is Cambridge’s own paper, exactly as it was sat.
Question paper4 pages
Mark scheme10 pages
Answers below. Sit the paper first if you are practising.




Questions as text
Q1 · Well-being and economic growth For many years governments have sought to deal with…
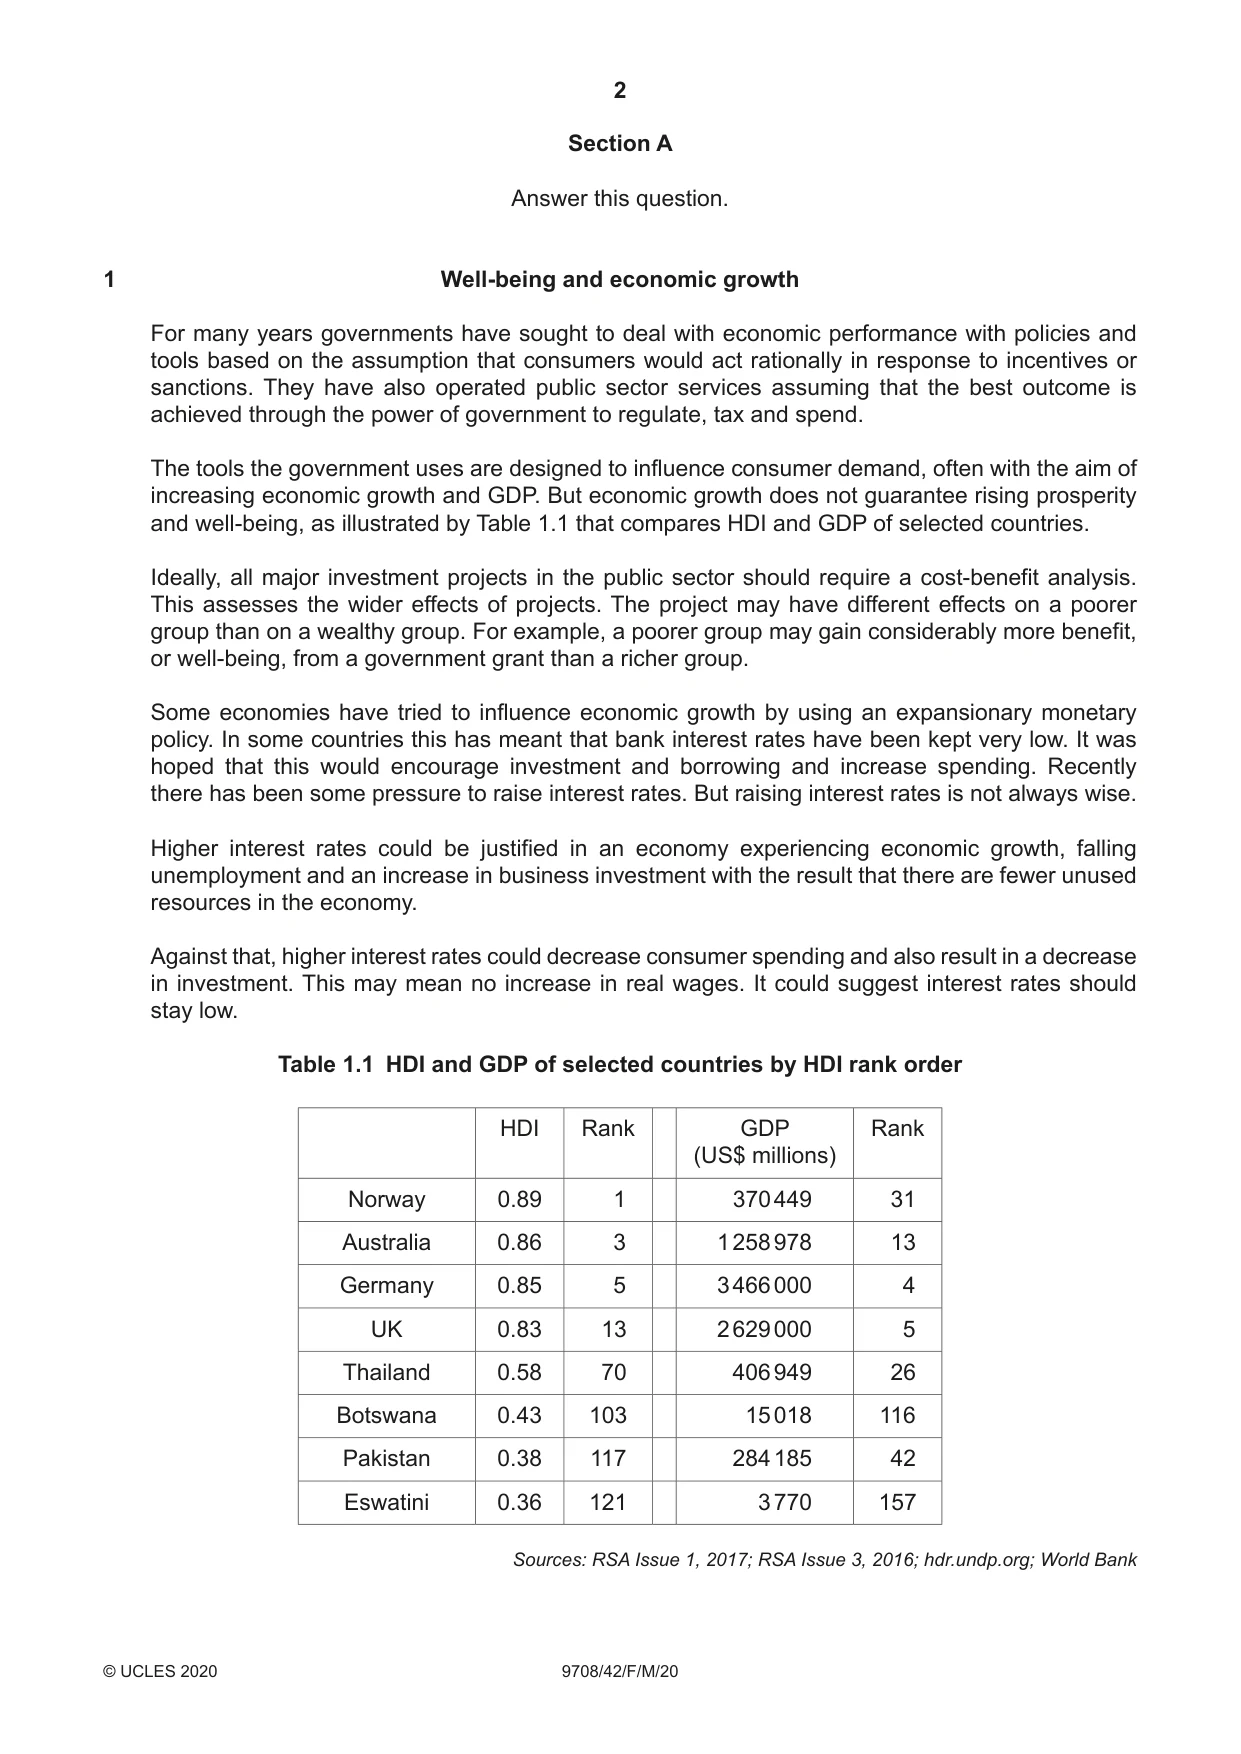
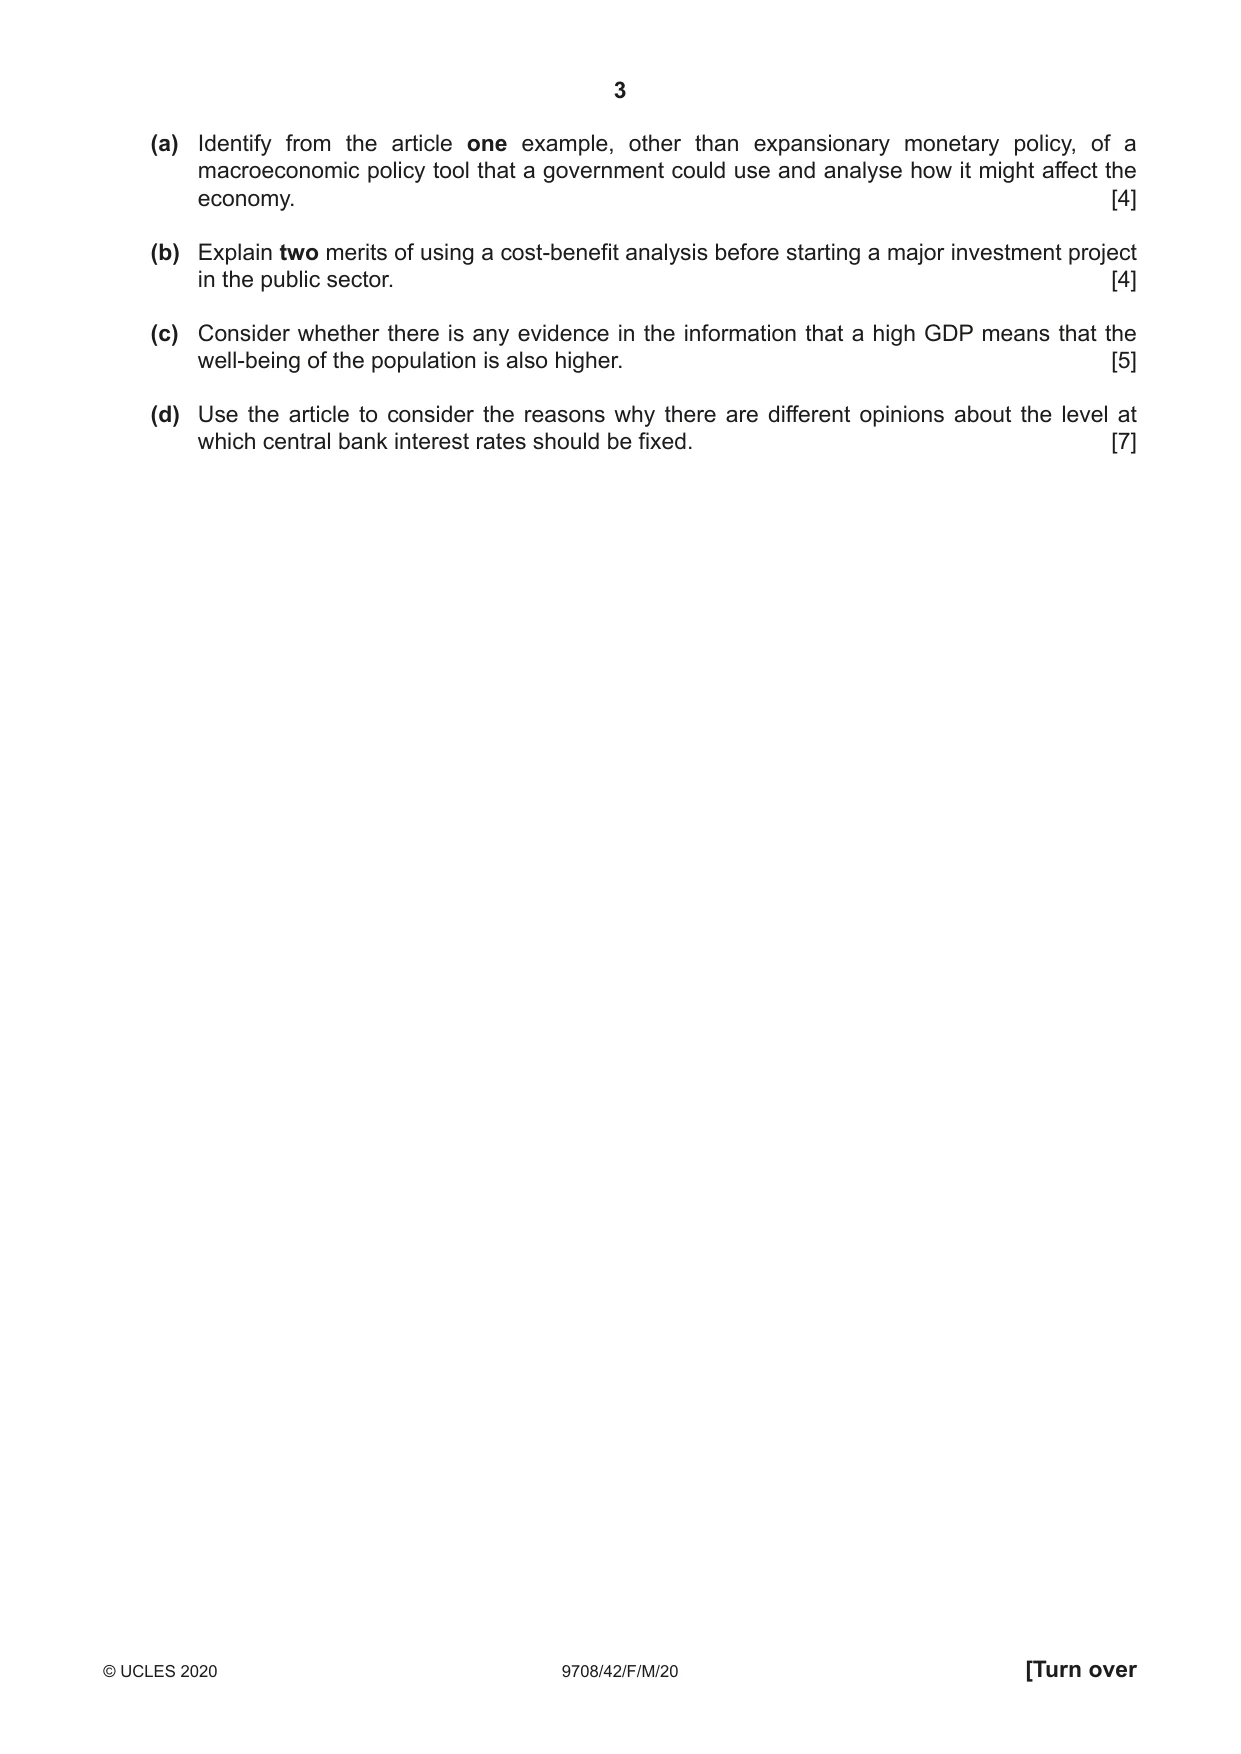
1 Well-being and economic growth For many years governments have sought to deal with economic performance with policies and tools based on the assumption that consumers would act rationally in response to incentives or sanctions. They have also operated public sector services assuming that the best outcome is achieved through the power of government to regulate, tax and spend. The tools the government uses are designed to influence consumer demand, often with the aim of increasing economic growth and GDP. But economic growth does not guarantee rising prosperity and well-being, as illustrated by Table 1.1 that compares HDI and GDP of selected countries. Ideally, all major investment projects in the public sector should require a cost-benefit analysis. This assesses the wider effects of projects. The project may have different effects on a poorer group than on a wealthy group. For example, a poorer group may gain considerably more benefit, or well-being, from a government grant than a richer group. Some economies have tried to influence economic growth by using an expansionary monetary policy. In some countries this has meant that bank interest rates have been kept very low. It was hoped that this would encourage investment and borrowing and increase spending. Recently there has been some pressure to raise interest rates. But raising interest rates is not always wise. Higher interest rates could be justified in an economy experiencing economic growth, falling unemployment and an increase in business investment with the result that there are fewer unused resources in the economy. Against that, higher interest rates could decrease consumer spending and also result in a decrease in investment. This may mean no increase in real wages. It could suggest interest rates should stay low. Table 1.1 HDI and GDP of selected countries by HDI rank order HDI Rank GDP Rank (US$ millions) Norway 0.89 1 370 449 31 Australia 0.86 3 1 258 978 13 Germany 0.85 5 3 466 000 4 UK 0.83 13 2 629 000 5 Thailand 0.58 70 406 949 26 Botswana 0.43 103 15 018 116 Pakistan 0.38 117 284 185 42 Eswatini 0.36 121 3 770 157 Sources: RSA Issue 1, 2017; RSA Issue 3, 2016; hdr.undp.org; World Bank (a) Identify from the article one example, other than expansionary monetary policy, of a macroeconomic policy tool that a government could use and analyse how it might affect the economy. [4] (b) Explain two merits of using a cost-benefit analysis before starting a major investment project in the public sector. [4] (c) Consider whether there is any evidence in the information that a high GDP means that the well-being of the population is also higher. [5] (d) Use the article to consider the reasons why there are different opinions about the level at which central bank interest rates should be fixed. [7]
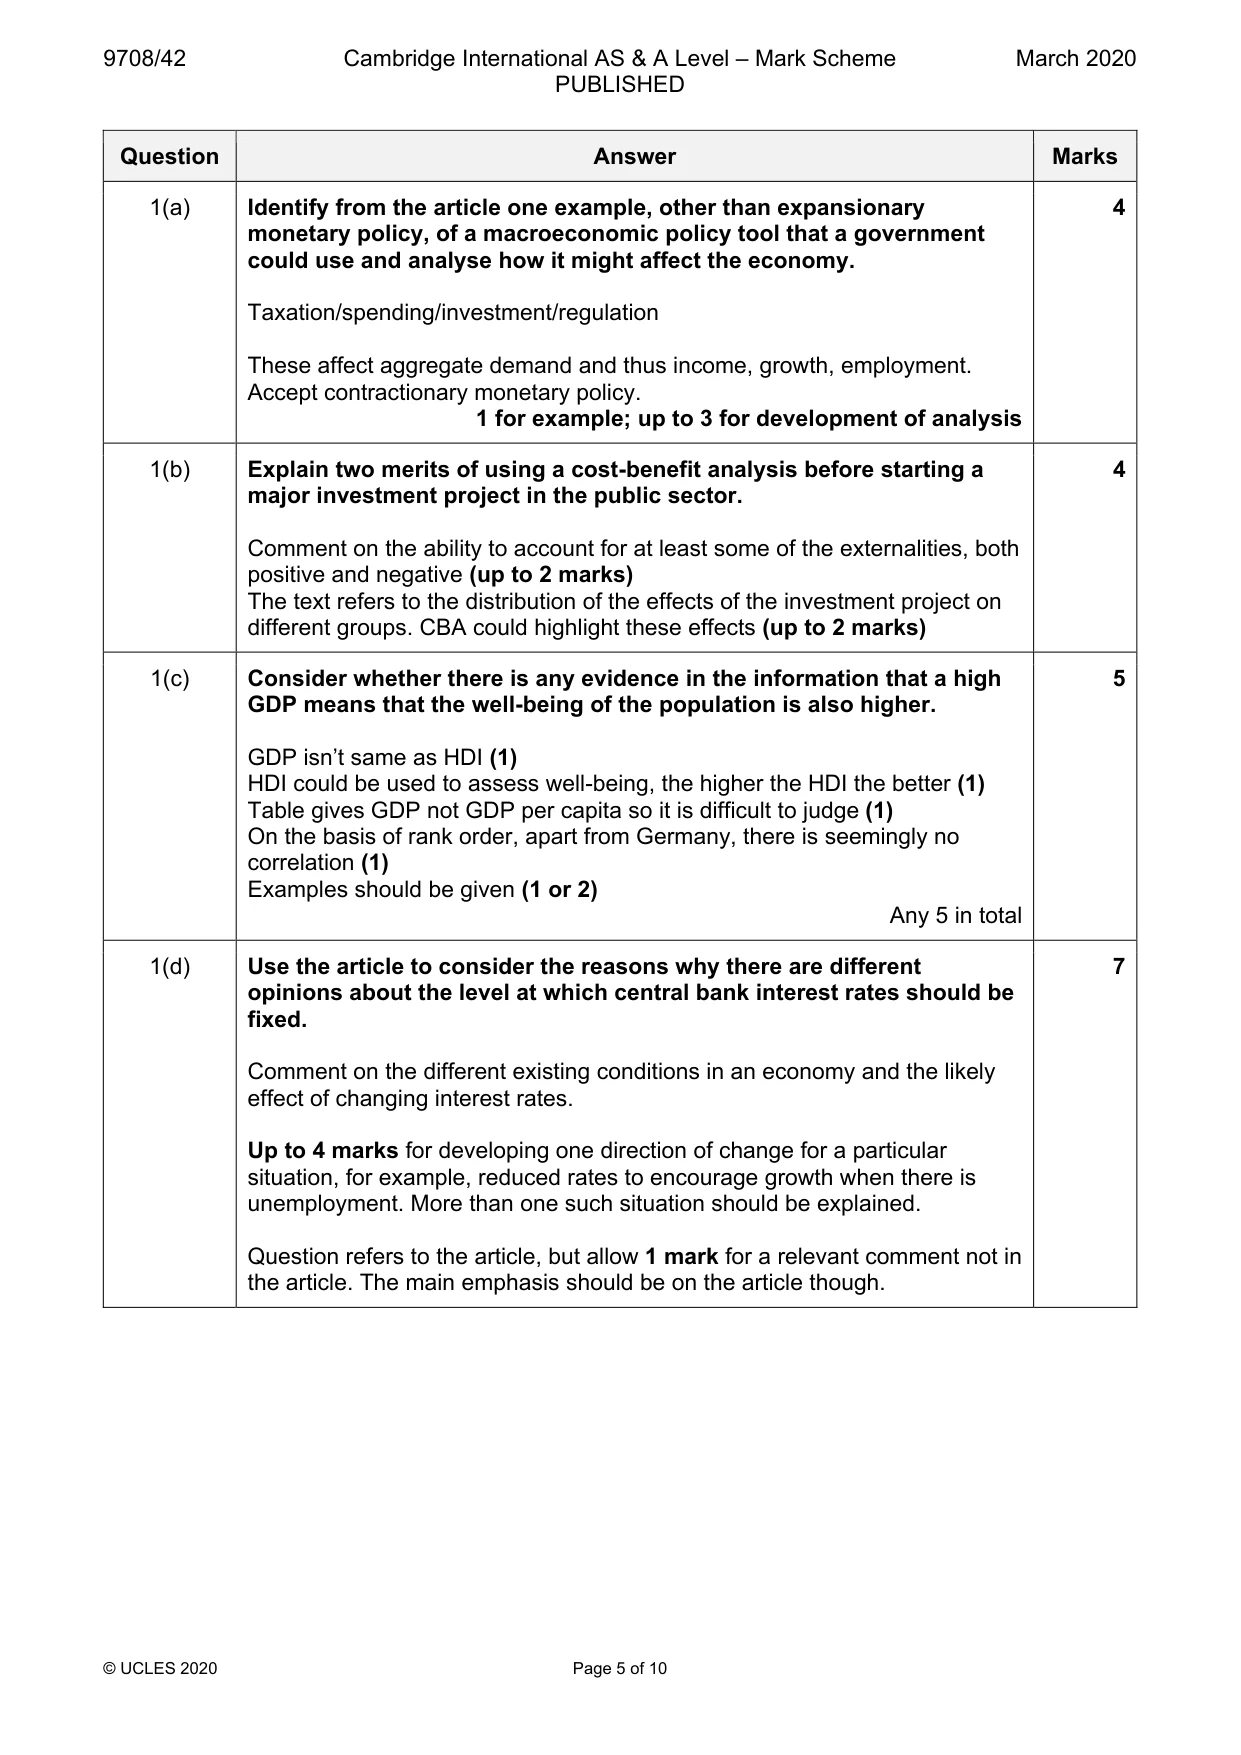
Mark scheme: Question Answer Marks 1(a) Identify from the article one example, other than expansionary 4 monetary policy, of a macroeconomic policy tool that a government could use and analyse how it might affect the economy. Taxation/spending/investment/regulation These affect aggregate demand and thus income, growth, employment. Accept contractionary monetary policy. 1 for example; up to 3 for development of analysis 1(b) Explain two merits of using a cost-benefit analysis before starting a 4 major investment project in the public sector. Comment on the ability to account for at least some of the externalities, both positive and negative (up to 2 marks) The text refers to the distribution of the effects of the investment project on different groups. CBA could highlight these effects (up to 2 marks) 1(c) Consider whether there is any evidence in the information that a high 5 GDP means that the well-being of the population is also higher. GDP isn’t same as HDI (1) HDI could be used to assess well-being, the higher the HDI the better (1) Table gives GDP not GDP per capita so it is difficult to judge (1) On the basis of rank order, apart from Germany, there is seemingly no correlation (1) Examples should be given (1 or 2) Any 5 in total 1(d) Use the article to consider the reasons why there are different 7 opinions about the level at which central bank interest rates should be fixed. Comment on the different existing conditions in an economy and the likely effect of changing interest rates. Up to 4 marks for developing one direction of change for a particular situation, for example, reduced rates to encourage growth when there is unemployment. More than one such situation should be explained. Question refers to the article, but allow 1 mark for a relevant comment not in the article. The main emphasis should be on the article though.
Q2 · ‘The existence of externalities implies market failure and therefore that the good should…
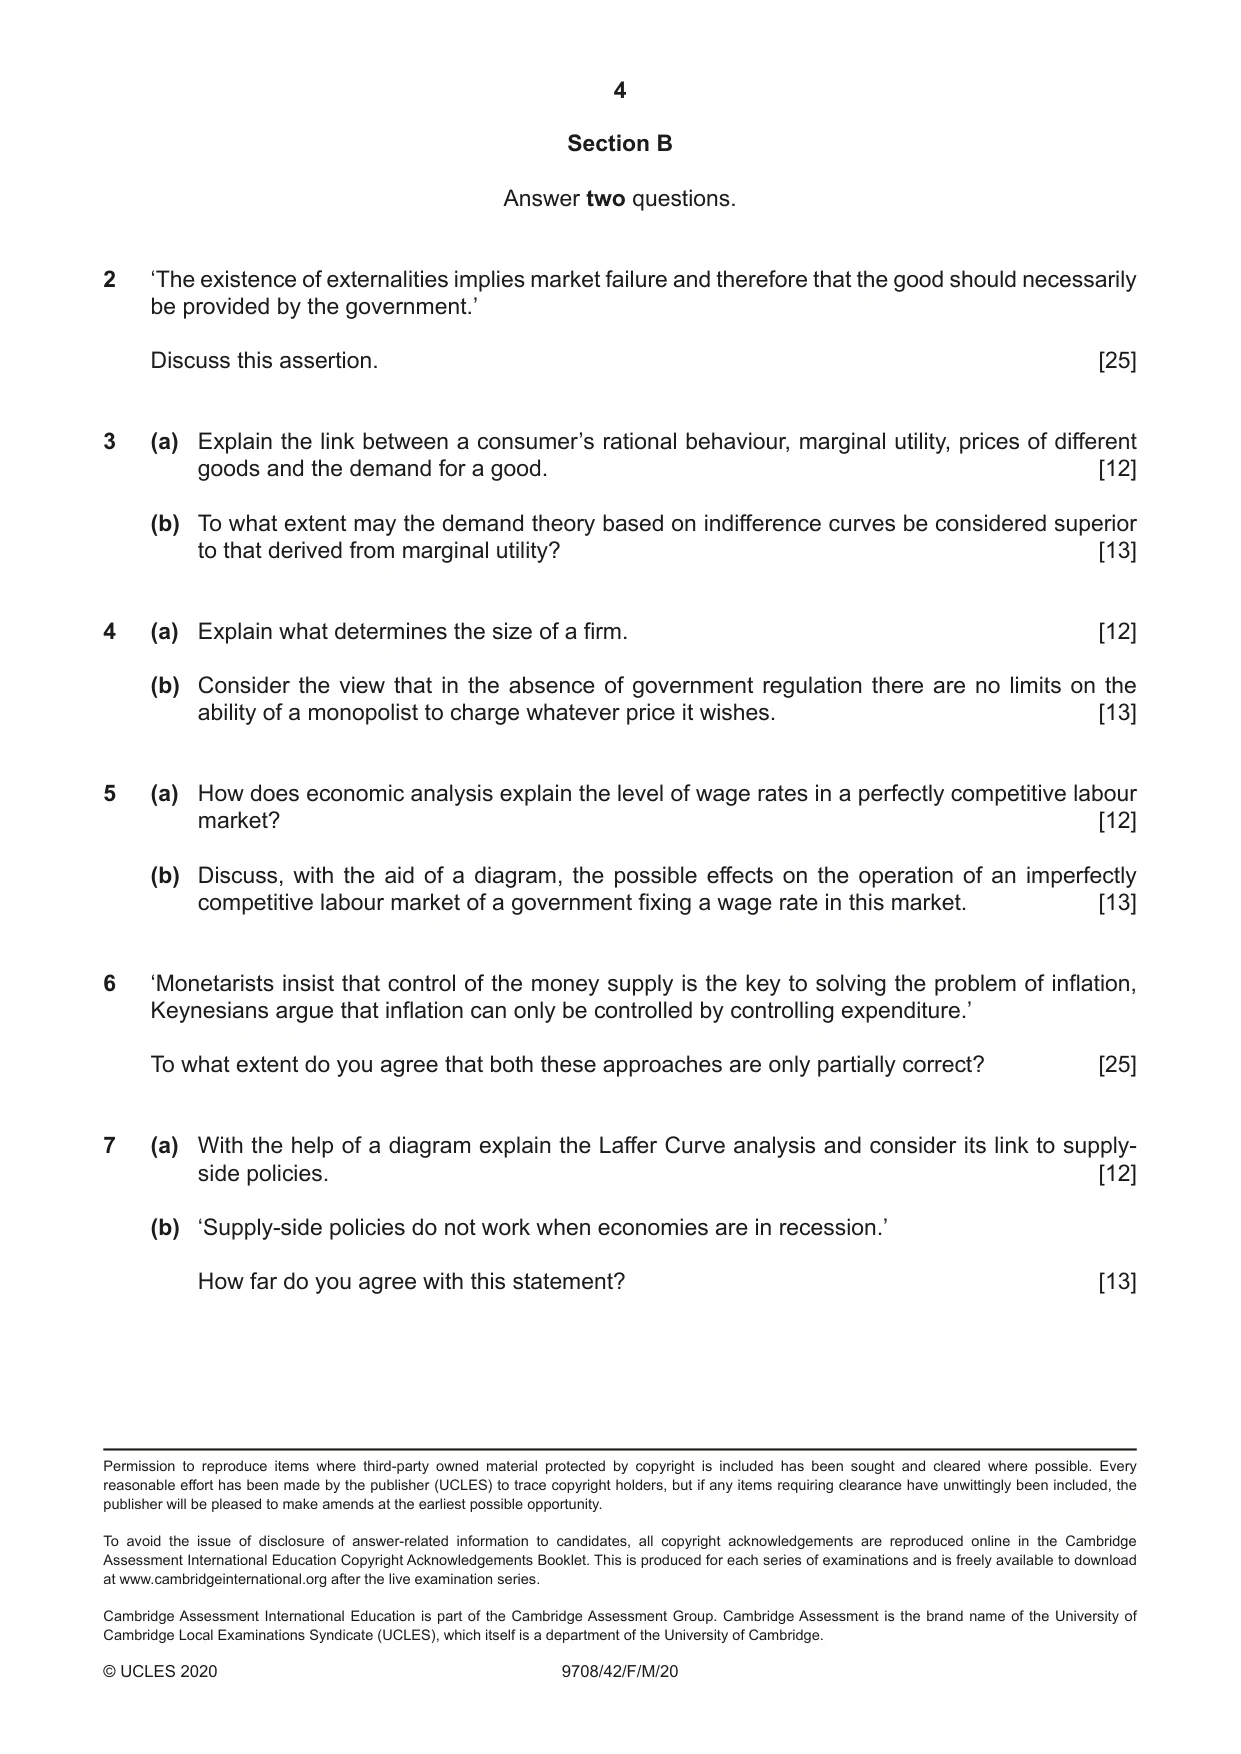
2 ‘The existence of externalities implies market failure and therefore that the good should necessarily be provided by the government.’ Discuss this assertion. [25]
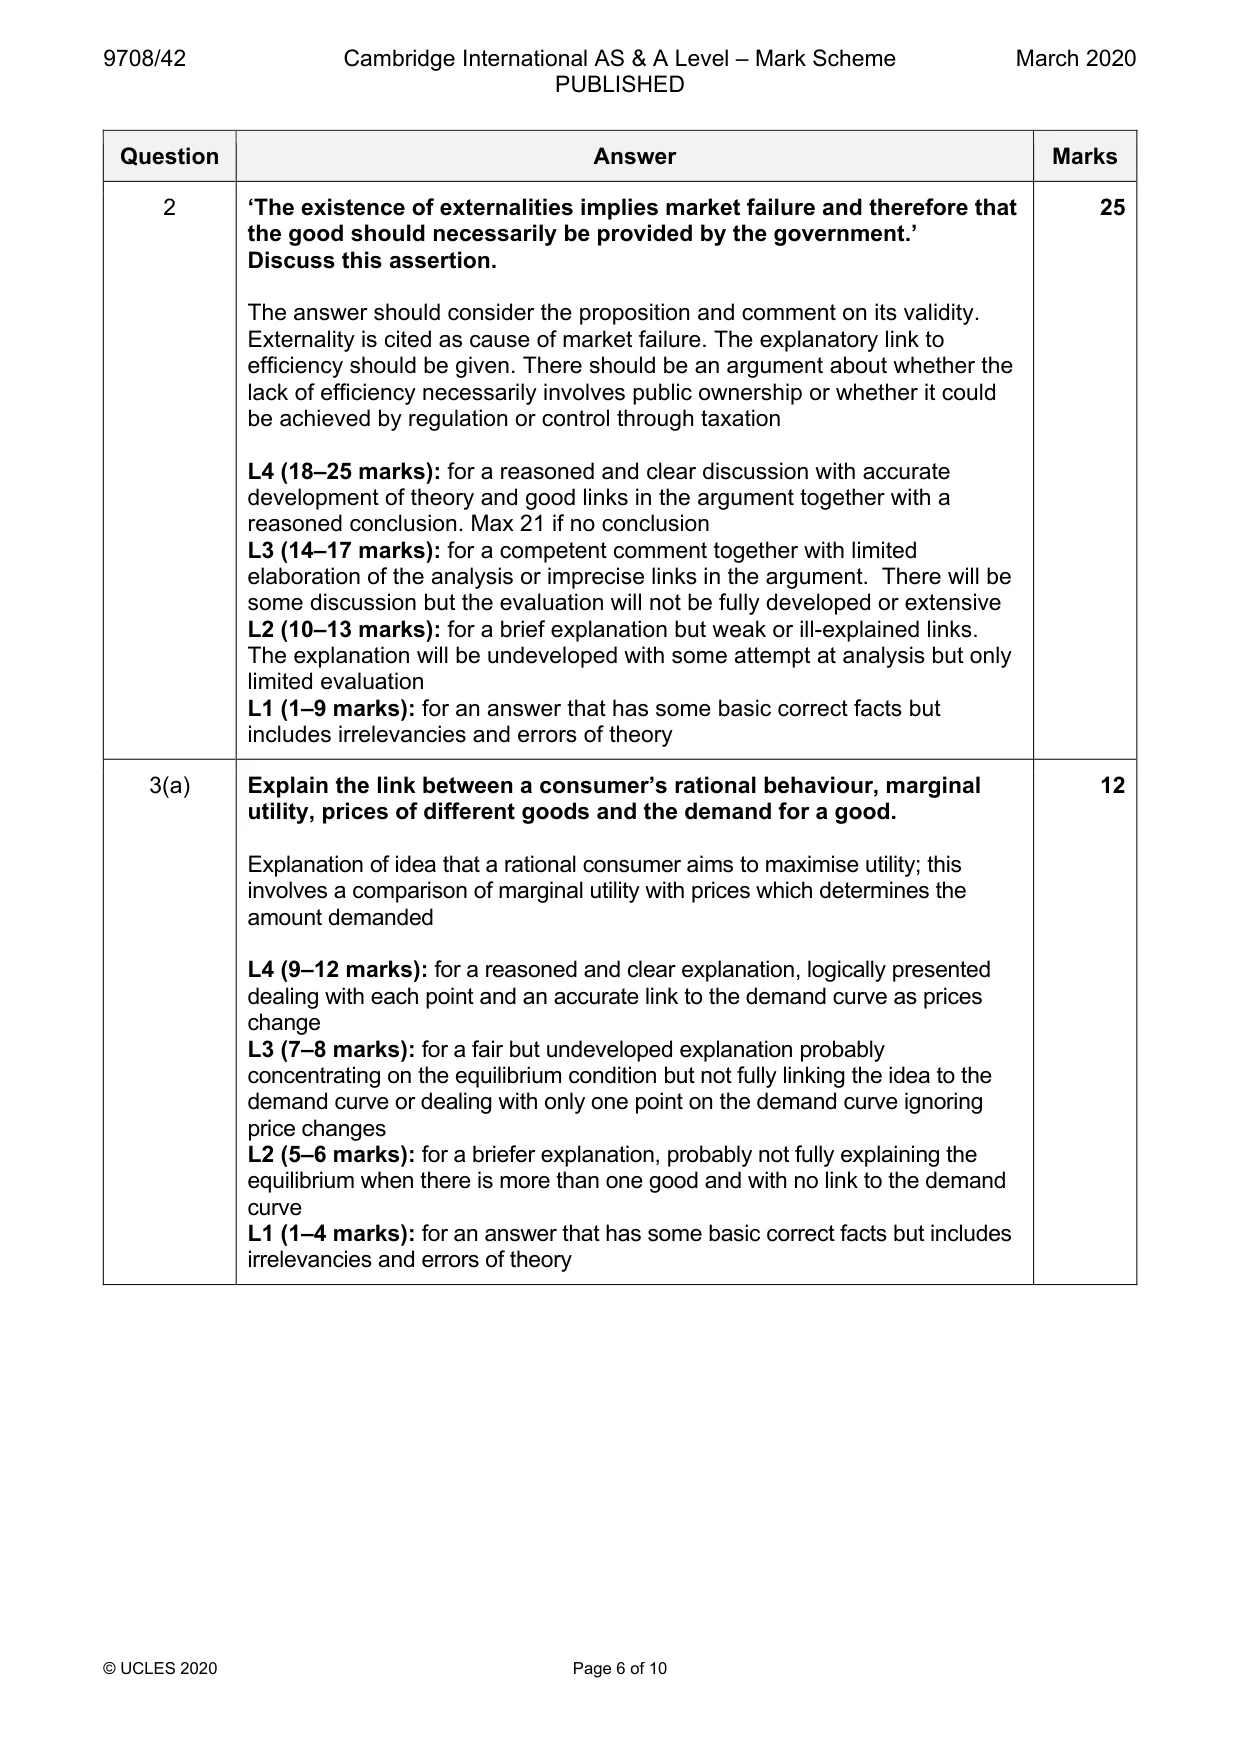
Mark scheme: 2 ‘The existence of externalities implies market failure and therefore that 25 the good should necessarily be provided by the government.’ Discuss this assertion. The answer should consider the proposition and comment on its validity. Externality is cited as cause of market failure. The explanatory link to efficiency should be given. There should be an argument about whether the lack of efficiency necessarily involves public ownership or whether it could be achieved by regulation or control through taxation L4 (18–25 marks): for a reasoned and clear discussion with accurate development of theory and good links in the argument together with a reasoned conclusion. Max 21 if no conclusion L3 (14–17 marks): for a competent comment together with limited elaboration of the analysis or imprecise links in the argument. There will be some discussion but the evaluation will not be fully developed or extensive L2 (10–13 marks): for a brief explanation but weak or ill-explained links. The explanation will be undeveloped with some attempt at analysis but only limited evaluation L1 (1–9 marks): for an answer that has some basic correct facts but includes irrelevancies and errors of theory
More questions on Private costs and benefits, externalities and social costs and benefits
Q3 · Explain the link between a consumer’s rational behaviour, marginal utility, prices of…
3 (a) Explain the link between a consumer’s rational behaviour, marginal utility, prices of different goods and the demand for a good. [12] (b) To what extent may the demand theory based on indifference curves be considered superior to that derived from marginal utility? [13]
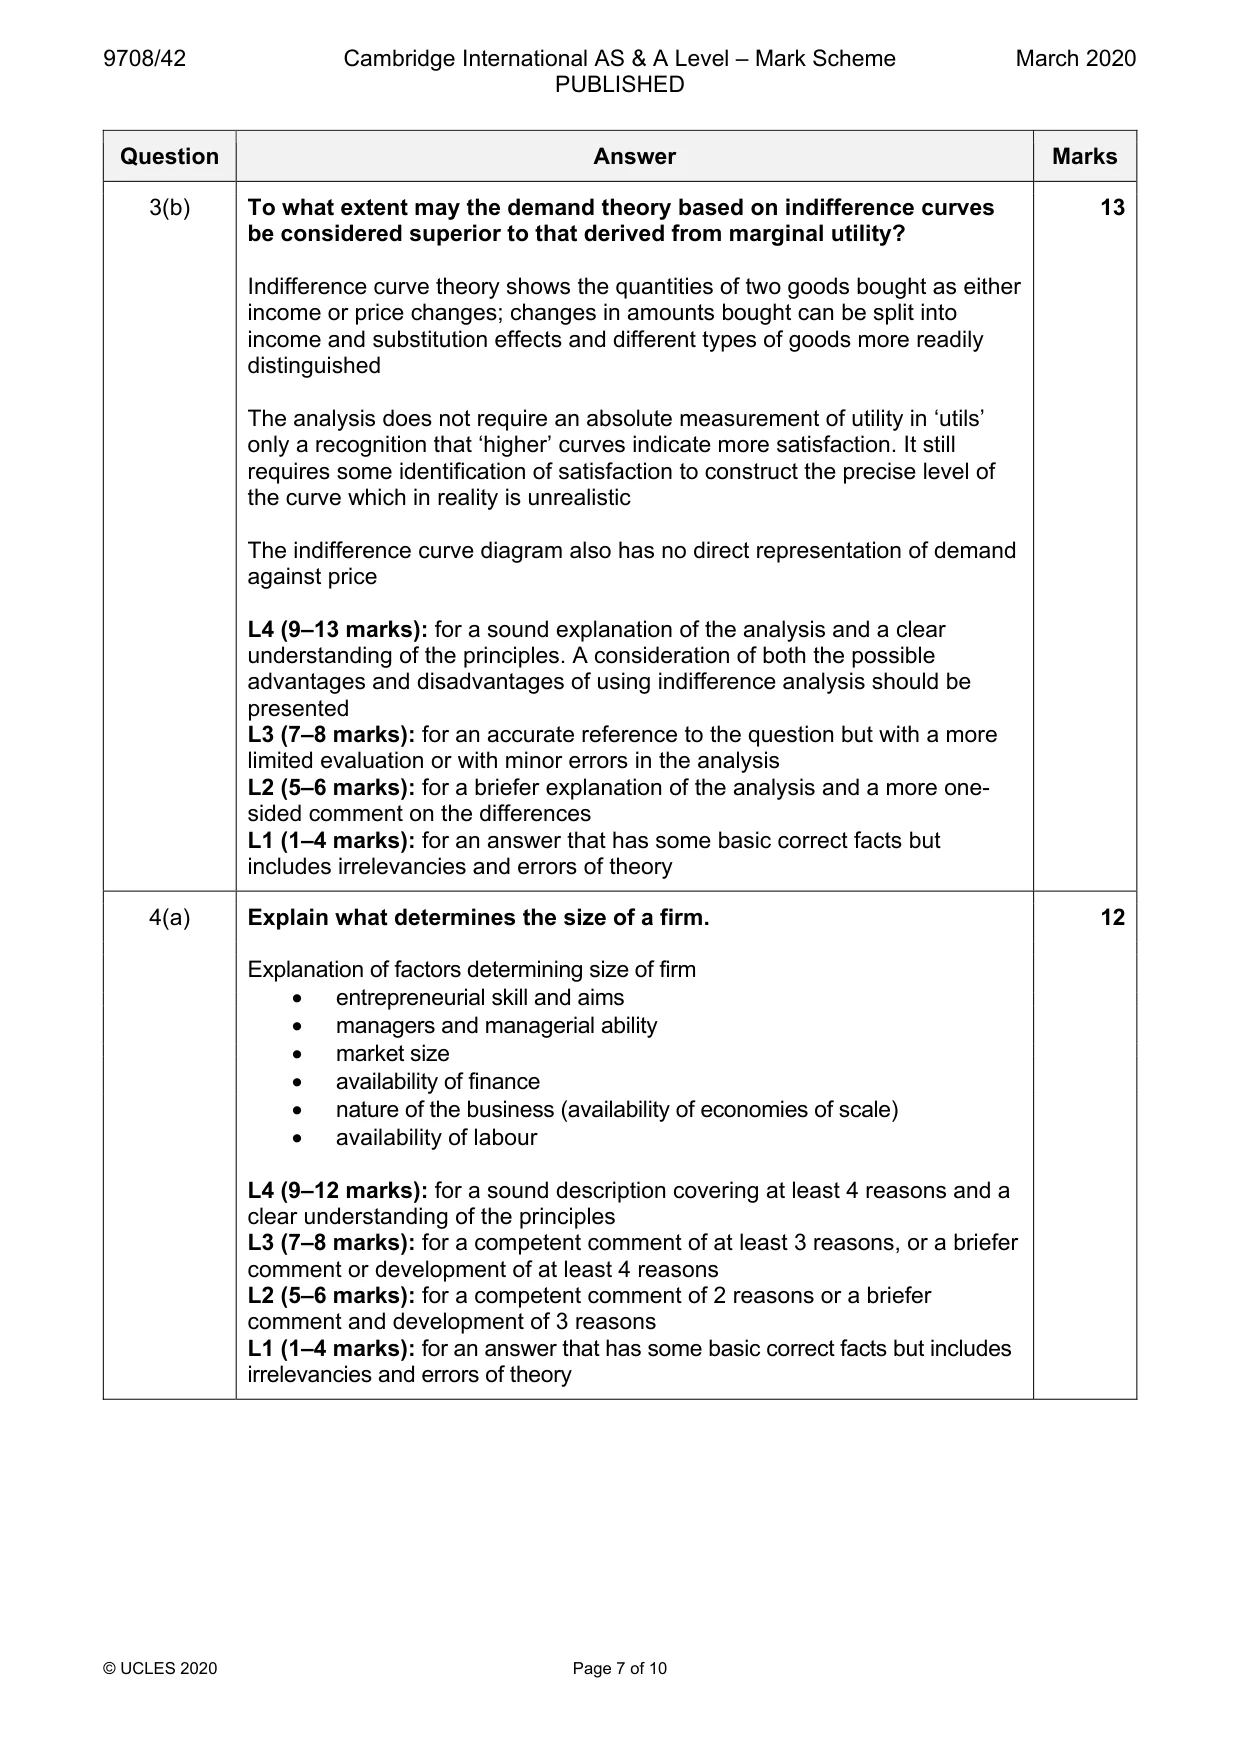
Mark scheme: 3(a) Explain the link between a consumer’s rational behaviour, marginal 12 utility, prices of different goods and the demand for a good. Explanation of idea that a rational consumer aims to maximise utility; this involves a comparison of marginal utility with prices which determines the amount demanded L4 (9–12 marks): for a reasoned and clear explanation, logically presented dealing with each point and an accurate link to the demand curve as prices change L3 (7–8 marks): for a fair but undeveloped explanation probably concentrating on the equilibrium condition but not fully linking the idea to the demand curve or dealing with only one point on the demand curve ignoring price changes L2 (5–6 marks): for a briefer explanation, probably not fully explaining the equilibrium when there is more than one good and with no link to the demand curve L1 (1–4 marks): for an answer that has some basic correct facts but includes irrelevancies and errors of theory 3(b) To what extent may the demand theory based on indifference curves 13 be considered superior to that derived from marginal utility? Indifference curve theory shows the quantities of two goods bought as either income or price changes; changes in amounts bought can be split into income and substitution effects and different types of goods more readily distinguished The analysis does not require an absolute measurement of utility in ‘utils’ only a recognition that ‘higher’ curves indicate more satisfaction. It still requires some identification of satisfaction to construct the precise level of the curve which in reality is unrealistic The indifference curve diagram also has no direct representation of demand against price L4 (9–13 marks): for a sound explanation of the analysis and a clear understanding of the principles. A consideration of both the possible advantages and disadvantages of using indifference analysis should be presented L3 (7–8 marks): for an accurate reference to the question but with a more limited evaluation or with minor errors in the analysis L2 (5–6 marks): for a briefer explanation of the analysis and a more one- sided comment on the differences L1 (1–4 marks): for an answer that has some basic correct facts but includes irrelevancies and errors of theory
Q4 · Explain what determines the size of a firm
4 (a) Explain what determines the size of a firm. [12] (b) Consider the view that in the absence of government regulation there are no limits on the ability of a monopolist to charge whatever price it wishes. [13]
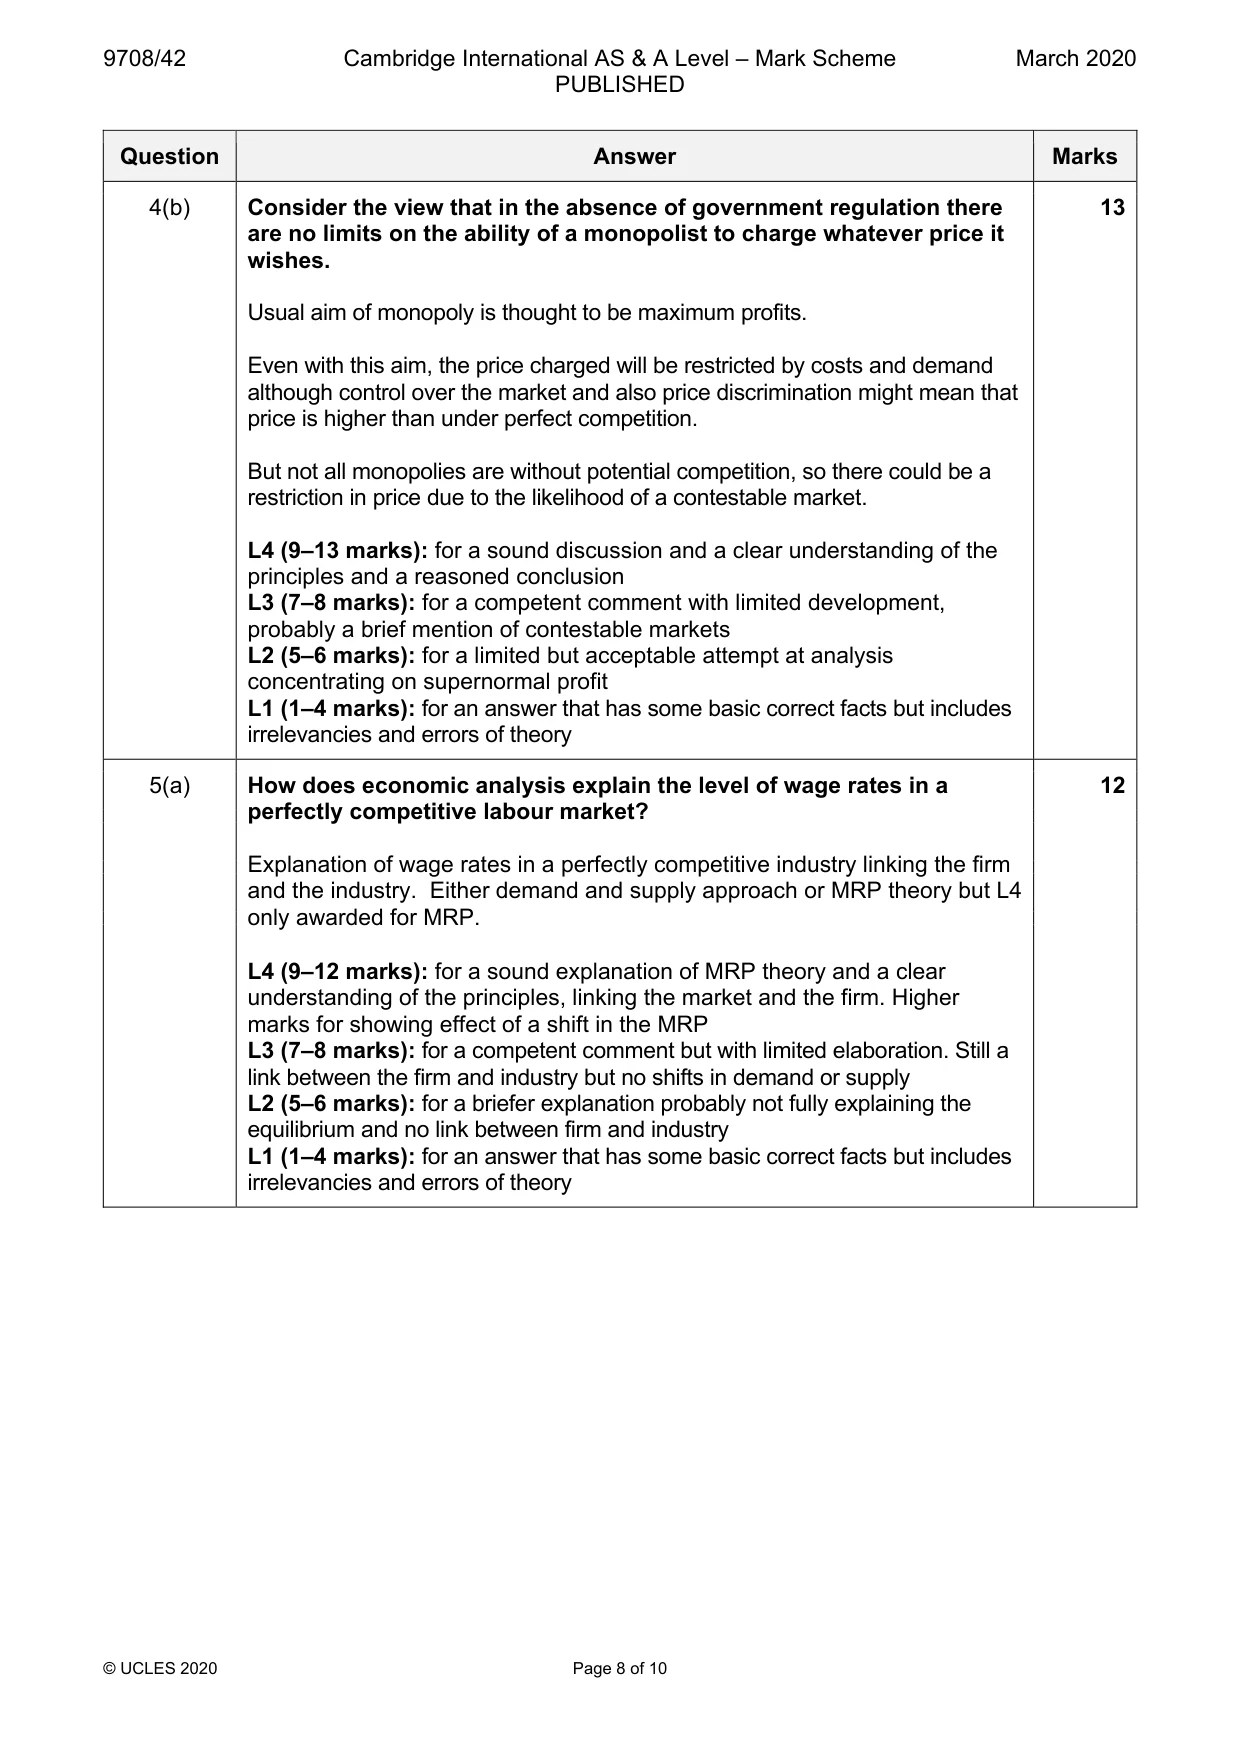
Mark scheme: 4(a) Explain what determines the size of a firm. 12 Explanation of factors determining size of firm • entrepreneurial skill and aims • managers and managerial ability • market size • availability of finance • nature of the business (availability of economies of scale) • availability of labour L4 (9–12 marks): for a sound description covering at least 4 reasons and a clear understanding of the principles L3 (7–8 marks): for a competent comment of at least 3 reasons, or a briefer comment or development of at least 4 reasons L2 (5–6 marks): for a competent comment of 2 reasons or a briefer comment and development of 3 reasons L1 (1–4 marks): for an answer that has some basic correct facts but includes irrelevancies and errors of theory 4(b) Consider the view that in the absence of government regulation there 13 are no limits on the ability of a monopolist to charge whatever price it wishes. Usual aim of monopoly is thought to be maximum profits. Even with this aim, the price charged will be restricted by costs and demand although control over the market and also price discrimination might mean that price is higher than under perfect competition. But not all monopolies are without potential competition, so there could be a restriction in price due to the likelihood of a contestable market. L4 (9–13 marks): for a sound discussion and a clear understanding of the principles and a reasoned conclusion L3 (7–8 marks): for a competent comment with limited development, probably a brief mention of contestable markets L2 (5–6 marks): for a limited but acceptable attempt at analysis concentrating on supernormal profit L1 (1–4 marks): for an answer that has some basic correct facts but includes irrelevancies and errors of theory
Q5 · How does economic analysis explain the level of wage rates in a perfectly competitive…
5 (a) How does economic analysis explain the level of wage rates in a perfectly competitive labour market? [12] (b) Discuss, with the aid of a diagram, the possible effects on the operation of an imperfectly competitive labour market of a government fixing a wage rate in this market. [13]
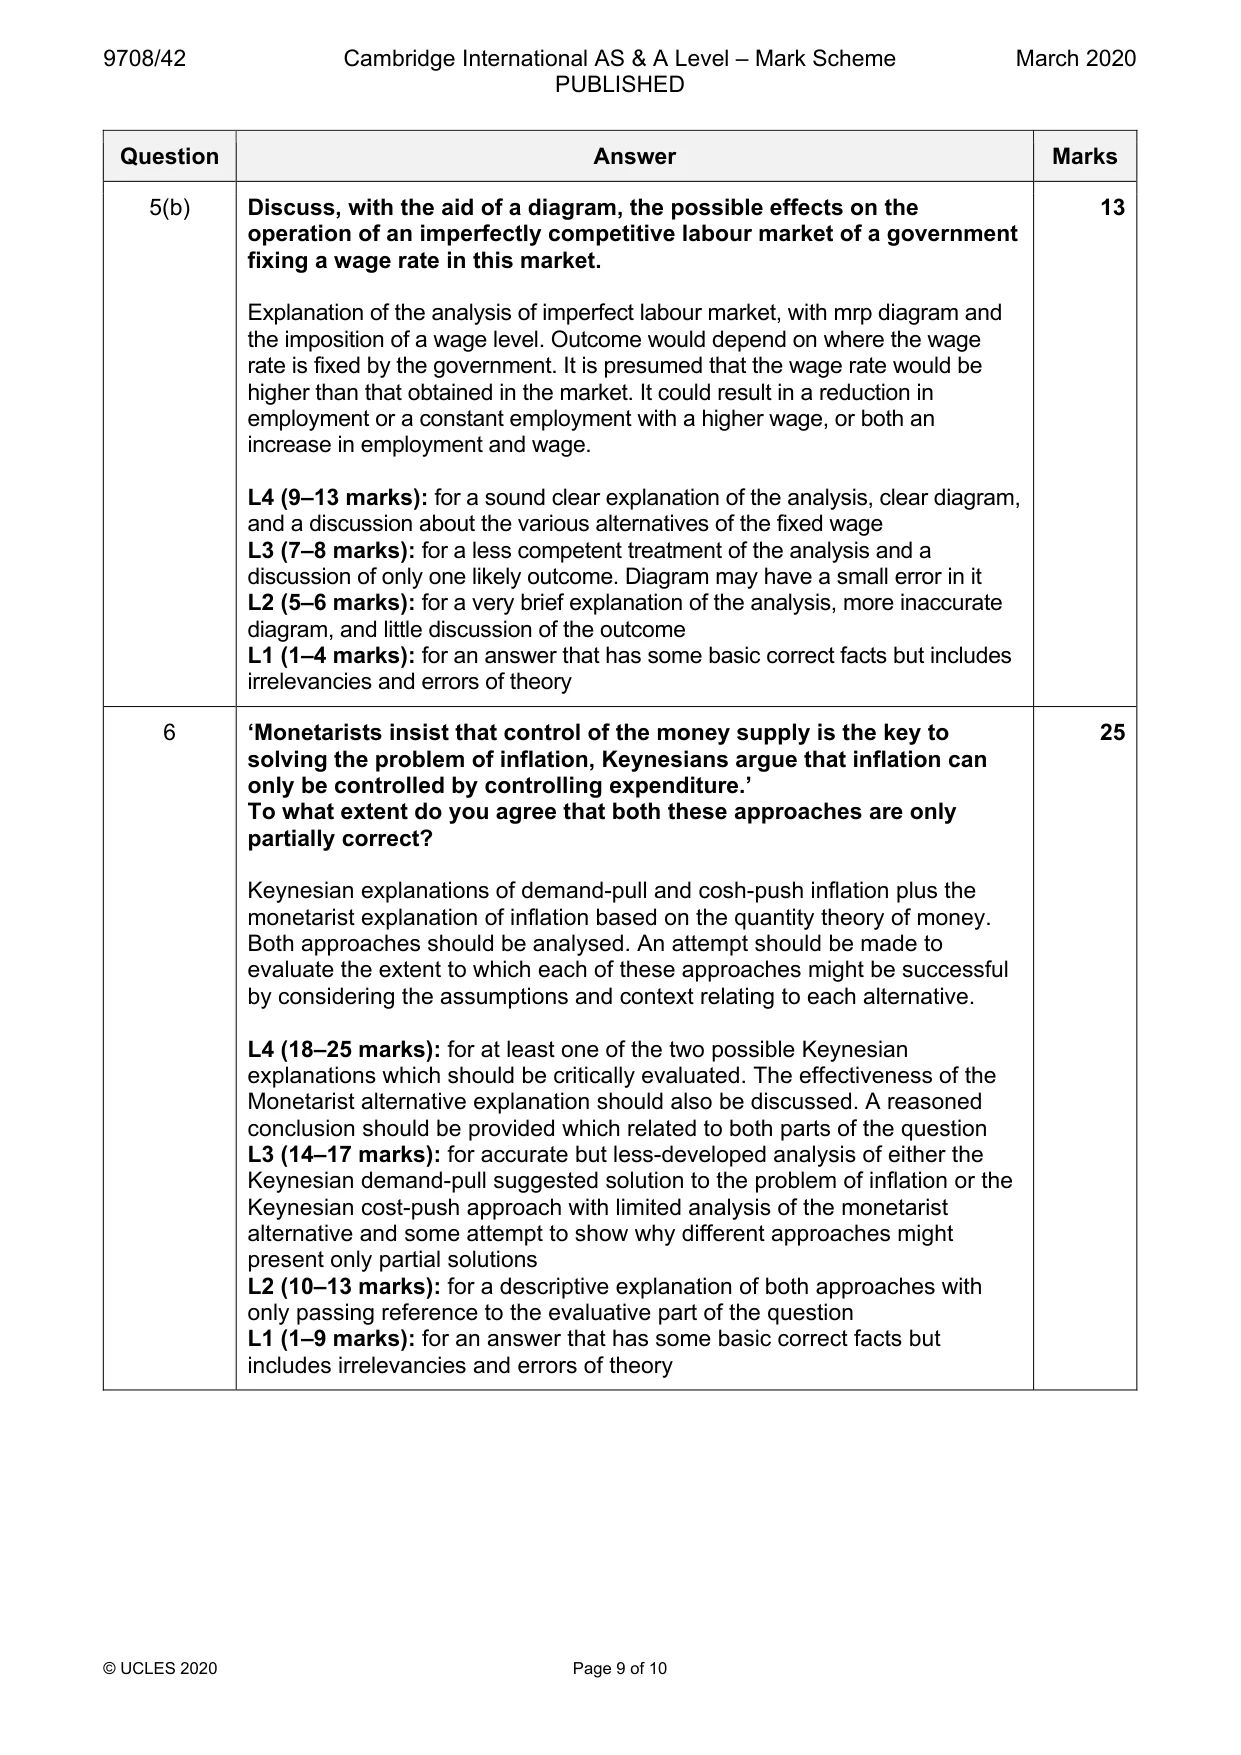
Mark scheme: 5(a) How does economic analysis explain the level of wage rates in a 12 perfectly competitive labour market? Explanation of wage rates in a perfectly competitive industry linking the firm and the industry. Either demand and supply approach or MRP theory but L4 only awarded for MRP. L4 (9–12 marks): for a sound explanation of MRP theory and a clear understanding of the principles, linking the market and the firm. Higher marks for showing effect of a shift in the MRP L3 (7–8 marks): for a competent comment but with limited elaboration. Still a link between the firm and industry but no shifts in demand or supply L2 (5–6 marks): for a briefer explanation probably not fully explaining the equilibrium and no link between firm and industry L1 (1–4 marks): for an answer that has some basic correct facts but includes irrelevancies and errors of theory 5(b) Discuss, with the aid of a diagram, the possible effects on the 13 operation of an imperfectly competitive labour market of a government fixing a wage rate in this market. Explanation of the analysis of imperfect labour market, with mrp diagram and the imposition of a wage level. Outcome would depend on where the wage rate is fixed by the government. It is presumed that the wage rate would be higher than that obtained in the market. It could result in a reduction in employment or a constant employment with a higher wage, or both an increase in employment and wage. L4 (9–13 marks): for a sound clear explanation of the analysis, clear diagram, and a discussion about the various alternatives of the fixed wage L3 (7–8 marks): for a less competent treatment of the analysis and a discussion of only one likely outcome. Diagram may have a small error in it L2 (5–6 marks): for a very brief explanation of the analysis, more inaccurate diagram, and little discussion of the outcome L1 (1–4 marks): for an answer that has some basic correct facts but includes irrelevancies and errors of theory
More questions on Labour market forces and government intervention
Q6 · ‘Monetarists insist that control of the money supply is the key to solving the problem of…
6 ‘Monetarists insist that control of the money supply is the key to solving the problem of inflation, Keynesians argue that inflation can only be controlled by controlling expenditure.’ To what extent do you agree that both these approaches are only partially correct? [25]
Mark scheme: 6 ‘Monetarists insist that control of the money supply is the key to 25 solving the problem of inflation, Keynesians argue that inflation can only be controlled by controlling expenditure.’ To what extent do you agree that both these approaches are only partially correct? Keynesian explanations of demand-pull and cosh-push inflation plus the monetarist explanation of inflation based on the quantity theory of money. Both approaches should be analysed. An attempt should be made to evaluate the extent to which each of these approaches might be successful by considering the assumptions and context relating to each alternative. L4 (18–25 marks): for at least one of the two possible Keynesian explanations which should be critically evaluated. The effectiveness of the Monetarist alternative explanation should also be discussed. A reasoned conclusion should be provided which related to both parts of the question L3 (14–17 marks): for accurate but less-developed analysis of either the Keynesian demand-pull suggested solution to the problem of inflation or the Keynesian cost-push approach with limited analysis of the monetarist alternative and some attempt to show why different approaches might present only partial solutions L2 (10–13 marks): for a descriptive explanation of both approaches with only passing reference to the evaluative part of the question L1 (1–9 marks): for an answer that has some basic correct facts but includes irrelevancies and errors of theory
More questions on Effectiveness of policy options to meet all macroeconomic objectives
Q7 · With the help of a diagram explain the Laffer Curve analysis and consider its link to…
7 (a) With the help of a diagram explain the Laffer Curve analysis and consider its link to supply- side policies. [12] (b) ‘Supply-side policies do not work when economies are in recession.’ How far do you agree with this statement? [13]
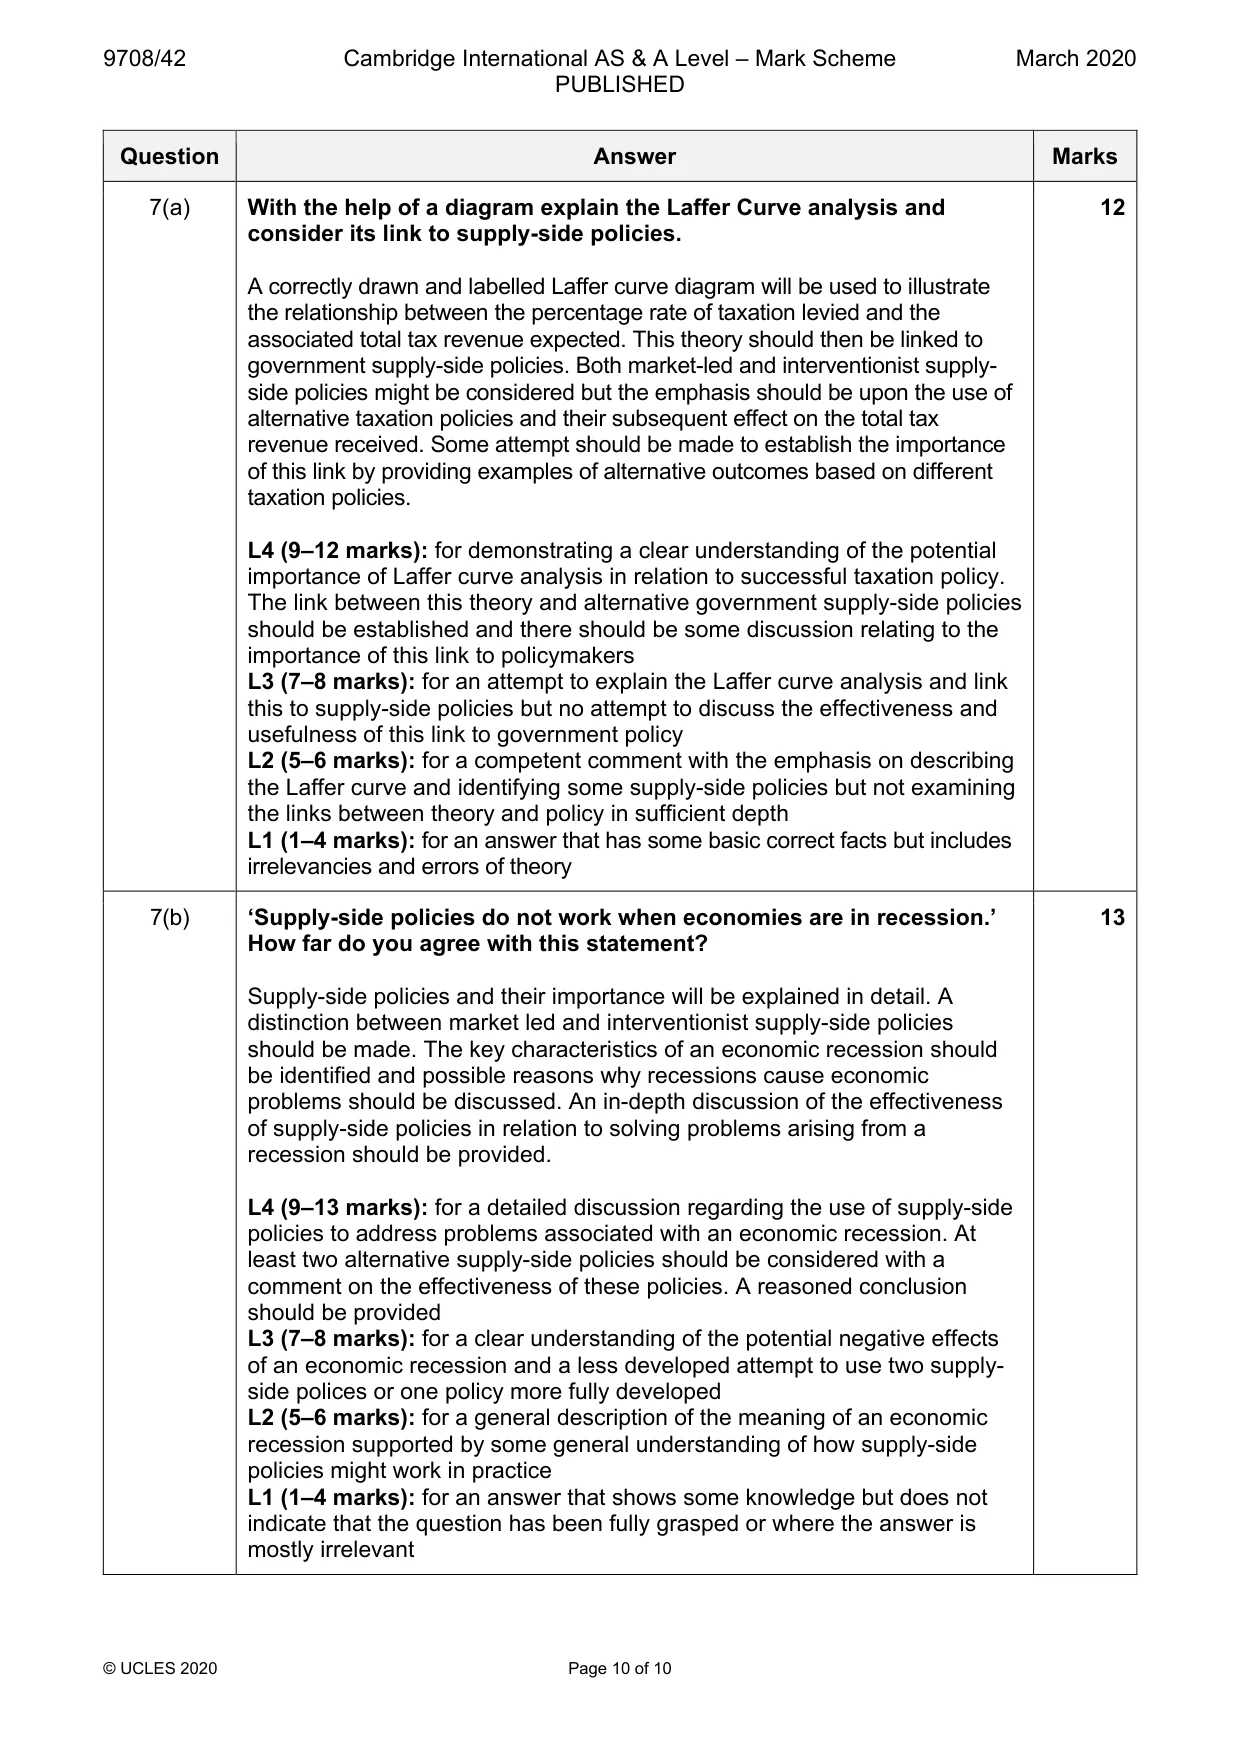
Mark scheme: 7(a) With the help of a diagram explain the Laffer Curve analysis and 12 consider its link to supply-side policies. A correctly drawn and labelled Laffer curve diagram will be used to illustrate the relationship between the percentage rate of taxation levied and the associated total tax revenue expected. This theory should then be linked to government supply-side policies. Both market-led and interventionist supply- side policies might be considered but the emphasis should be upon the use of alternative taxation policies and their subsequent effect on the total tax revenue received. Some attempt should be made to establish the importance of this link by providing examples of alternative outcomes based on different taxation policies. L4 (9–12 marks): for demonstrating a clear understanding of the potential importance of Laffer curve analysis in relation to successful taxation policy. The link between this theory and alternative government supply-side policies should be established and there should be some discussion relating to the importance of this link to policymakers L3 (7–8 marks): for an attempt to explain the Laffer curve analysis and link this to supply-side policies but no attempt to discuss the effectiveness and usefulness of this link to government policy L2 (5–6 marks): for a competent comment with the emphasis on describing the Laffer curve and identifying some supply-side policies but not examining the links between theory and policy in sufficient depth L1 (1–4 marks): for an answer that has some basic correct facts but includes irrelevancies and errors of theory 7(b) ‘Supply-side policies do not work when economies are in recession.’ 13 How far do you agree with this statement? Supply-side policies and their importance will be explained in detail. A distinction between market led and interventionist supply-side policies should be made. The key characteristics of an economic recession should be identified and possible reasons why recessions cause economic problems should be discussed. An in-depth discussion of the effectiveness of supply-side policies in relation to solving problems arising from a recession should be provided. L4 (9–13 marks): for a detailed discussion regarding the use of supply-side policies to address problems associated with an economic recession. At least two alternative supply-side policies should be considered with a comment on the effectiveness of these policies. A reasoned conclusion should be provided L3 (7–8 marks): for a clear understanding of the potential negative effects of an economic recession and a less developed attempt to use two supply- side polices or one policy more fully developed L2 (5–6 marks): for a general description of the meaning of an economic recession supported by some general understanding of how supply-side policies might work in practice L1 (1–4 marks): for an answer that shows some knowledge but does not indicate that the question has been fully grasped or where the answer is mostly irrelevant
What was in this paper
The subtopics covered by these 7 questions, and how many questions each got. Open one in a new tab to see every Cambridge question on it.
What you needed in this session
Cambridge’s own grade thresholds for 2020 Feb/March, Paper 4 · Variant 2. A higher threshold means an easier paper — the bar moves with how the cohort did.