Cambridge A Level Economics 9708 — 2020 Feb/March Paper 2 · Variant 2
9708/22/F/M/20 · 4 questions · 40 marks · ≈45 min
The question paper and its mark scheme, free to read here and free to download. This is Cambridge’s own paper, exactly as it was sat.
Question paper4 pages
Mark scheme8 pages
Answers below. Sit the paper first if you are practising.
Questions as text
Q1 · Trade war breaks out between the United States (US) and China 100 services 50 primary…
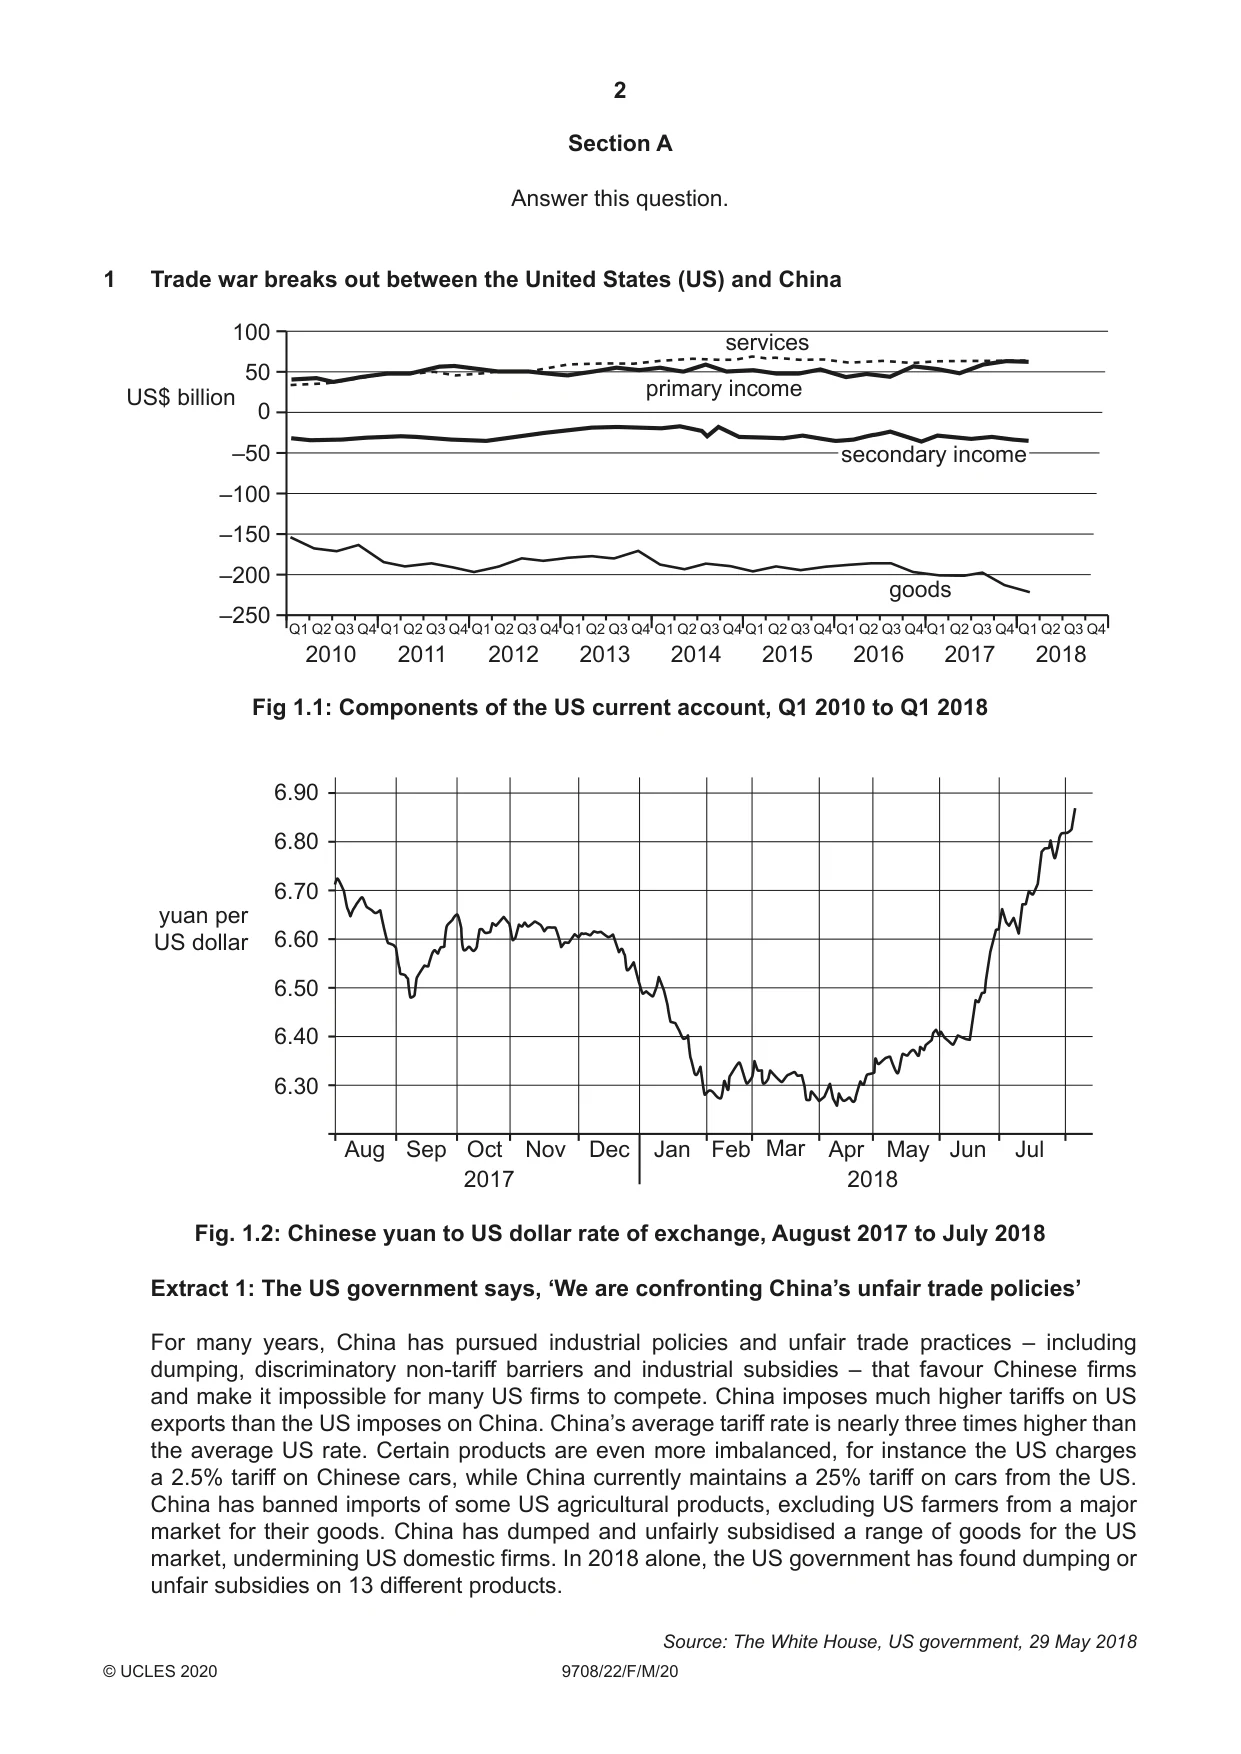
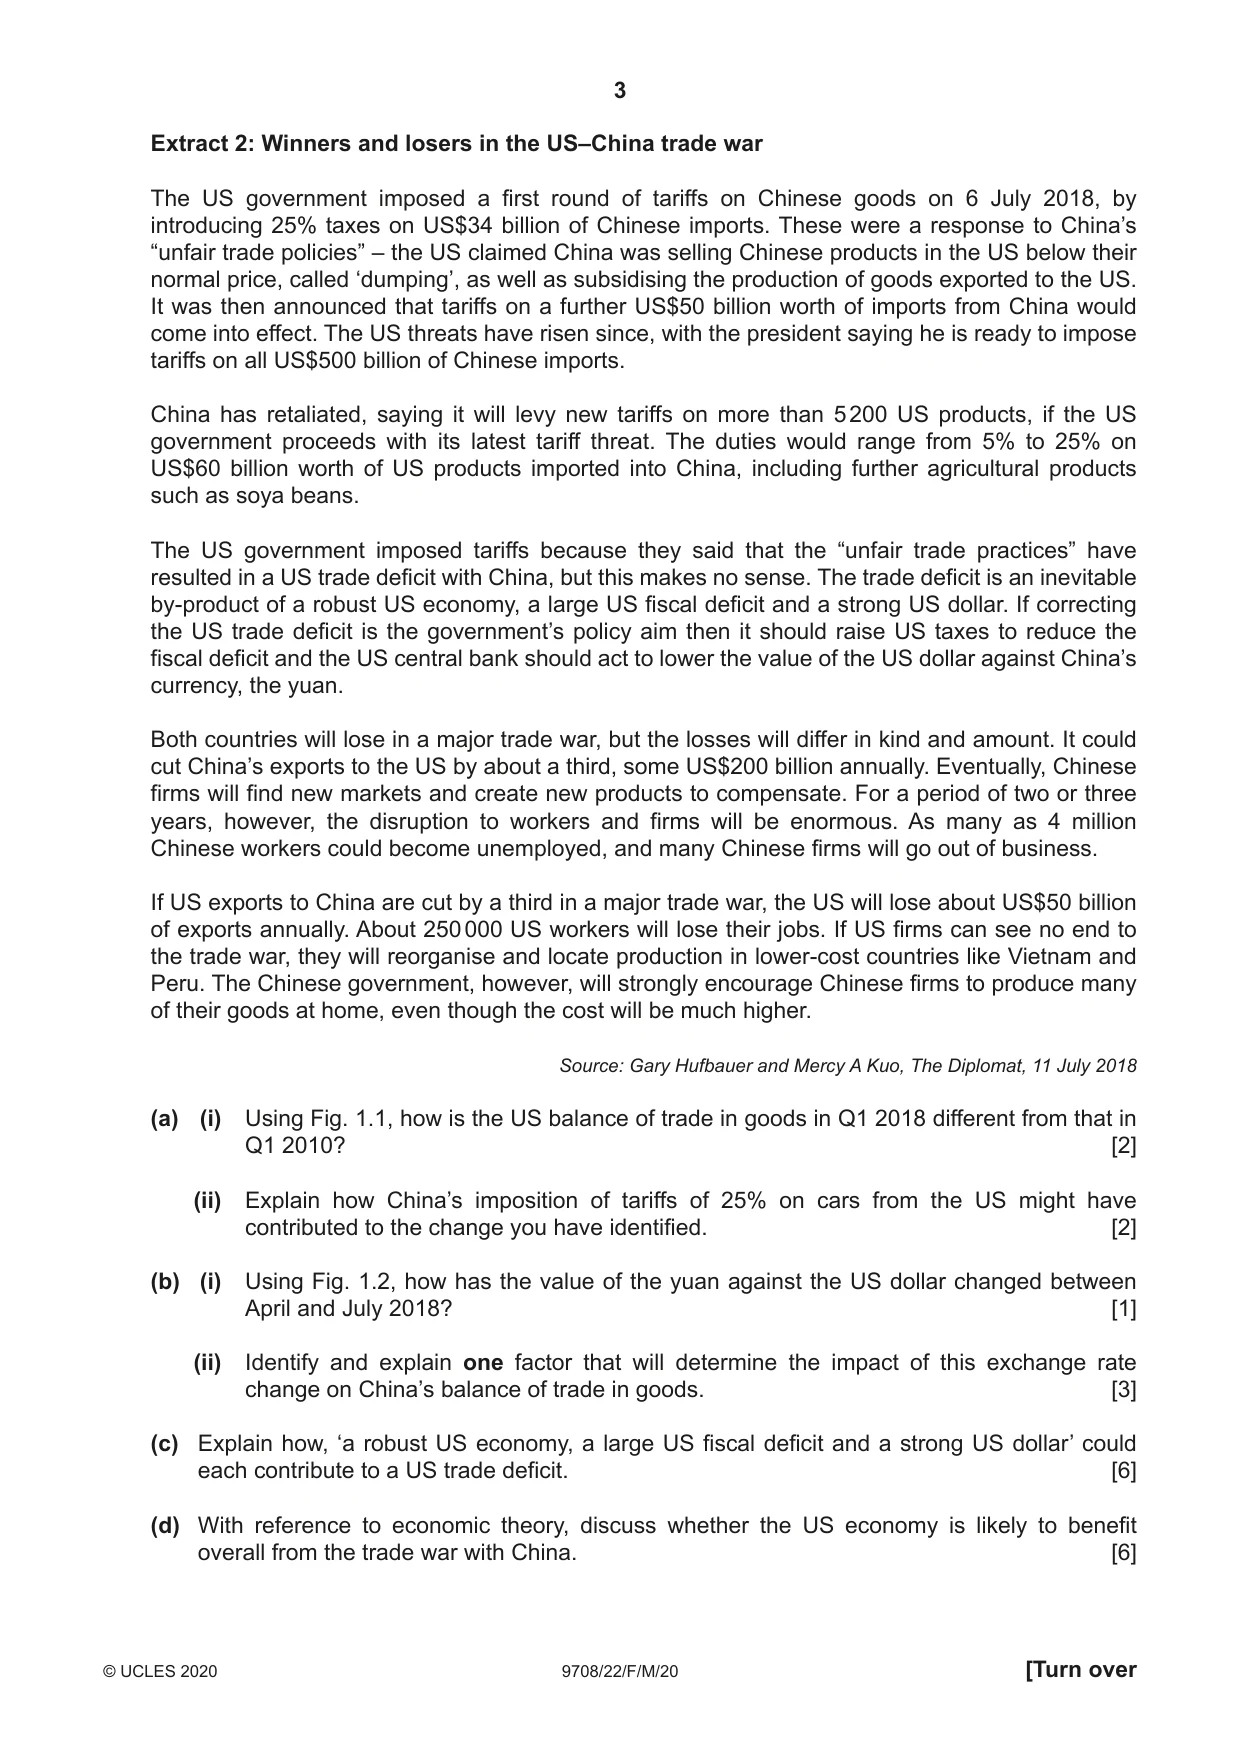
1 Trade war breaks out between the United States (US) and China 100 services 50 primary income US$ billion 0 –50 secondary income –100 –150 –200 goods –250 Q1 Q2 Q3 Q4 Q1 Q2 Q3 Q4 Q1 Q2 Q3 Q4 Q1 Q2 Q3 Q4 Q1 Q2 Q3 Q4 Q1 Q2 Q3 Q4 Q1 Q2 Q3 Q4 Q1 Q2 Q3 Q4 Q1 Q2 Q3 Q4 2010 2011 2012 2013 2014 2015 2016 2017 2018 Fig 1.1: Components of the US current account, Q1 2010 to Q1 2018 6.90 6.80 6.70 yuan per US dollar 6.60 6.50 6.40 6.30 Aug Sep Oct Nov Dec Jan Feb Mar Apr May Jun Jul 2017 2018 Fig. 1.2: Chinese yuan to US dollar rate of exchange, August 2017 to July 2018 Extract 1: The US government says, ‘We are confronting China’s unfair trade policies’ For many years, China has pursued industrial policies and unfair trade practices – including dumping, discriminatory non-tariff barriers and industrial subsidies – that favour Chinese firms and make it impossible for many US firms to compete. China imposes much higher tariffs on US exports than the US imposes on China. China’s average tariff rate is nearly three times higher than the average US rate. Certain products are even more imbalanced, for instance the US charges a 2.5% tariff on Chinese cars, while China currently maintains a 25% tariff on cars from the US. China has banned imports of some US agricultural products, excluding US farmers from a major market for their goods. China has dumped and unfairly subsidised a range of goods for the US market, undermining US domestic firms. In 2018 alone, the US government has found dumping or unfair subsidies on 13 different products. Source: The White House, US government, 29 May 2018 Extract 2: Winners and losers in the US–China trade war The US government imposed a first round of tariffs on Chinese goods on 6 July 2018, by introducing 25% taxes on US$34 billion of Chinese imports. These were a response to China’s “unfair trade policies” – the US claimed China was selling Chinese products in the US below their normal price, called ‘dumping’, as well as subsidising the production of goods exported to the US. It was then announced that tariffs on a further US$50 billion worth of imports from China would come into effect. The US threats have risen since, with the president saying he is ready to impose tariffs on all US$500 billion of Chinese imports. China has retaliated, saying it will levy new tariffs on more than 5 200 US products, if the US government proceeds with its latest tariff threat. The duties would range from 5% to 25% on US$60 billion worth of US products imported into China, including further agricultural products such as soya beans. The US government imposed tariffs because they said that the “unfair trade practices” have resulted in a US trade deficit with China, but this makes no sense. The trade deficit is an inevitable by-product of a robust US economy, a large US fiscal deficit and a strong US dollar. If correcting the US trade deficit is the government’s policy aim then it should raise US taxes to reduce the fiscal deficit and the US central bank should act to lower the value of the US dollar against China’s currency, the yuan. Both countries will lose in a major trade war, but the losses will differ in kind and amount. It could cut China’s exports to the US by about a third, some US$200 billion annually. Eventually, Chinese firms will find new markets and create new products to compensate. For a period of two or three years, however, the disruption to workers and firms will be enormous. As many as 4 million Chinese workers could become unemployed, and many Chinese firms will go out of business. If US exports to China are cut by a third in a major trade war, the US will lose about US$50 billion of exports annually. About 250 000 US workers will lose their jobs. If US firms can see no end to the trade war, they will reorganise and locate production in lower-cost countries like Vietnam and Peru. The Chinese government, however, will strongly encourage Chinese firms to produce many of their goods at home, even though the cost will be much higher. Source: Gary Hufbauer and Mercy A Kuo, The Diplomat, 11 July 2018 (a) (i) Using Fig. 1.1, how is the US balance of trade in goods in Q1 2018 different from that in Q1 2010? [2] (ii) Explain how China’s imposition of tariffs of 25% on cars from the US might have contributed to the change you have identified. [2] (b) (i) Using Fig. 1.2, how has the value of the yuan against the US dollar changed between April and July 2018? [1] (ii) Identify and explain one factor that will determine the impact of this exchange rate change on China’s balance of trade in goods. [3] (c) Explain how, ‘a robust US economy, a large US fiscal deficit and a strong US dollar’ could each contribute to a US trade deficit. [6] (d) With reference to economic theory, discuss whether the US economy is likely to benefit overall from the trade war with China. [6]
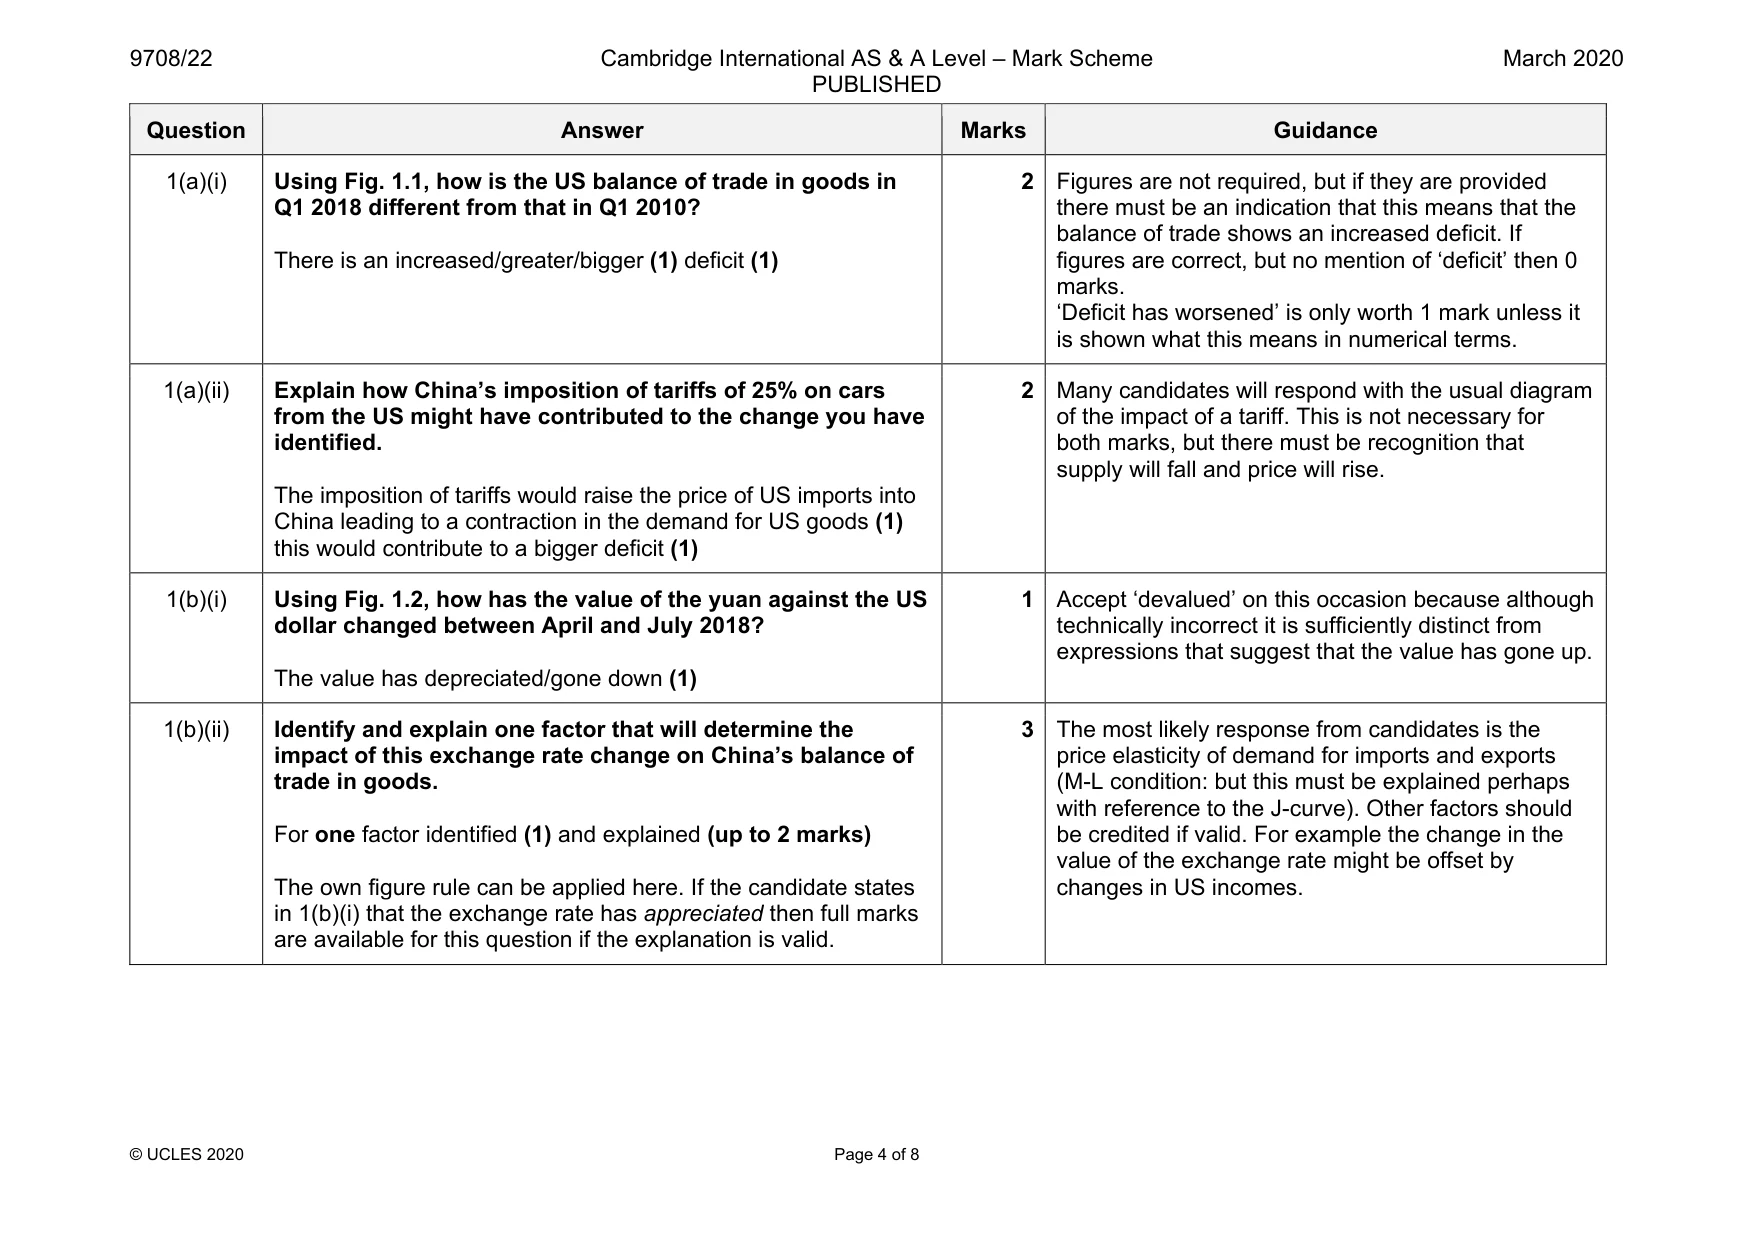
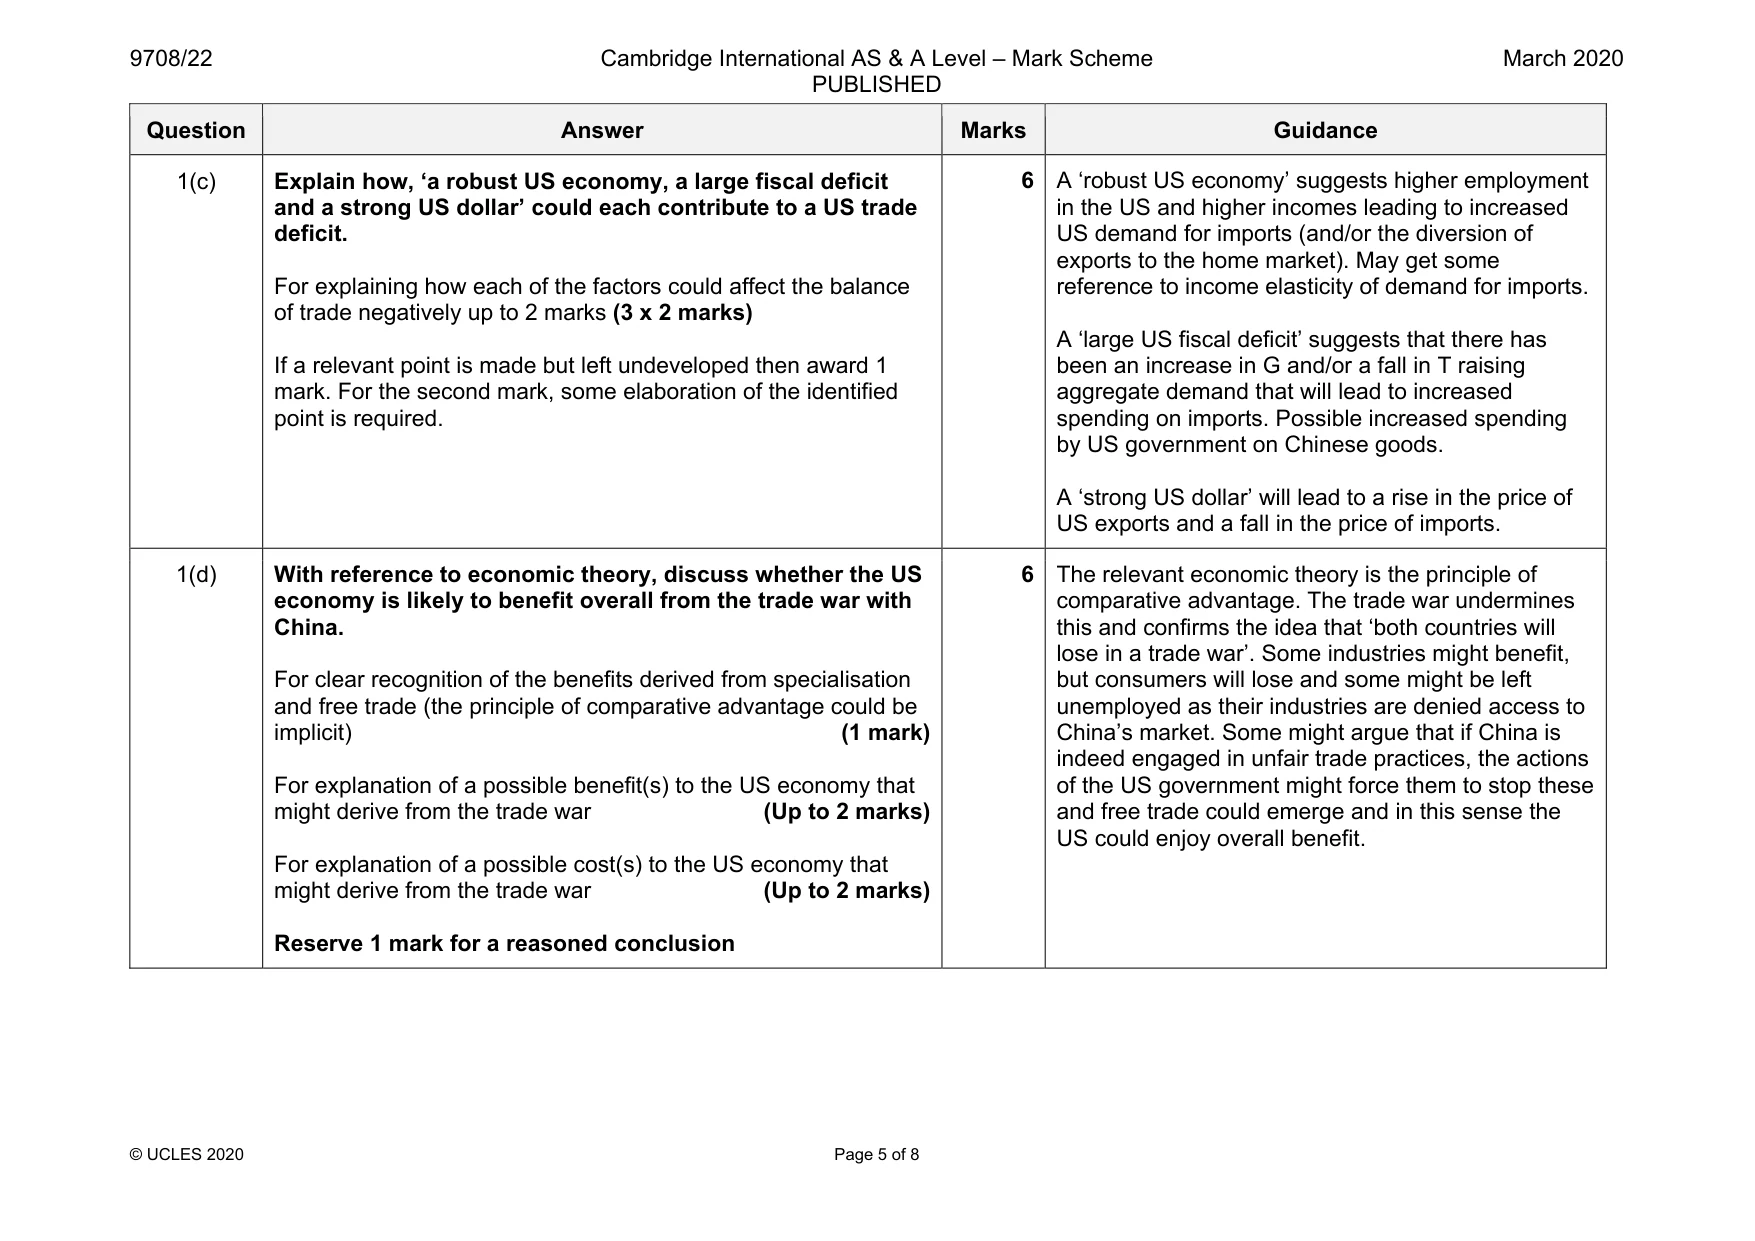
Mark scheme: 1(a)(i) Using Fig. 1.1, how is the US balance of trade in goods in Q1 2018 different from that in Q1 2010? There is an increased/greater/bigger (1) deficit (1) 2 Figures are not required, but if they are provided there must be an indication that this means that the balance of trade shows an increased deficit. If figures are correct, but no mention of ‘deficit’ then 0 marks. ‘Deficit has worsened’ is only worth 1 mark unless it is shown what this means in numerical terms. 1(a)(ii) Explain how China’s imposition of tariffs of 25% on cars from the US might have contributed to the change you have identified. The imposition of tariffs would raise the price of US imports into China leading to a contraction in the demand for US goods (1) this would contribute to a bigger deficit (1) 2 Many candidates will respond with the usual diagram of the impact of a tariff. This is not necessary for both marks, but there must be recognition that supply will fall and price will rise. 1(b)(i) Using Fig. 1.2, how has the value of the yuan against the US dollar changed between April and July 2018? The value has depreciated/gone down (1) 1 Accept ‘devalued’ on this occasion because although technically incorrect it is sufficiently distinct from expressions that suggest that the value has gone up. 1(b)(ii) Identify and explain one factor that will determine the impact of this exchange rate change on China’s balance of trade in goods. For one factor identified (1) and explained (up to 2 marks) The own figure rule can be applied here. If the candidate states in 1(b)(i) that the exchange rate has appreciated then full marks are available for this question if the explanation is valid. 3 The most likely response from candidates is the price elasticity of demand for imports and exports (M-L condition: but this must be explained perhaps with reference to the J-curve). Other factors should be credited if valid. For example the change in the value of the exchange rate might be offset by changes in US incomes. Question Answer Marks Guidance 1(c) Explain how, ‘a robust US economy, a large fiscal deficit and a strong US dollar’ could each contribute to a US trade deficit. For explaining how each of the factors could affect the balance of trade negatively up to 2 marks (3 x 2 marks) If a relevant point is made but left undeveloped then award 1 mark. For the second mark, some elaboration of the identified point is required. 6 A ‘robust US economy’ suggests higher employment in the US and higher incomes leading to increased US demand for imports (and/or the diversion of exports to the home market). May get some reference to income elasticity of demand for imports. A ‘large US fiscal deficit’ suggests that there has been an increase in G and/or a fall in T raising aggregate demand that will lead to increased spending on imports. Possible increased spending by US government on Chinese goods. A ‘strong US dollar’ will lead to a rise in the price of US exports and a fall in the price of imports. 1(d) With reference to economic theory, discuss whether the US economy is likely to benefit overall from the trade war with China. For clear recognition of the benefits derived from specialisation and free trade (the principle of comparative advantage could be implicit) (1 mark) For explanation of a possible benefit(s) to the US economy that might derive from the trade war (Up to 2 marks) For explanation of a possible cost(s) to the US economy that might derive from the trade war (Up to 2 marks) Reserve 1 mark for a reasoned conclusion 6 The relevant economic theory is the principle of comparative advantage. The trade war undermines this and confirms the idea that ‘both countries will lose in a trade war’. Some industries might benefit, but consumers will lose and some might be left unemployed as their industries are denied access to China’s market. Some might argue that if China is indeed engaged in unfair trade practices, the actions of the US government might force them to stop these and free trade could emerge and in this sense the US could enjoy overall benefit.
Q2 · Explain what determines the change in equilibrium price and equilibrium quantity of a…
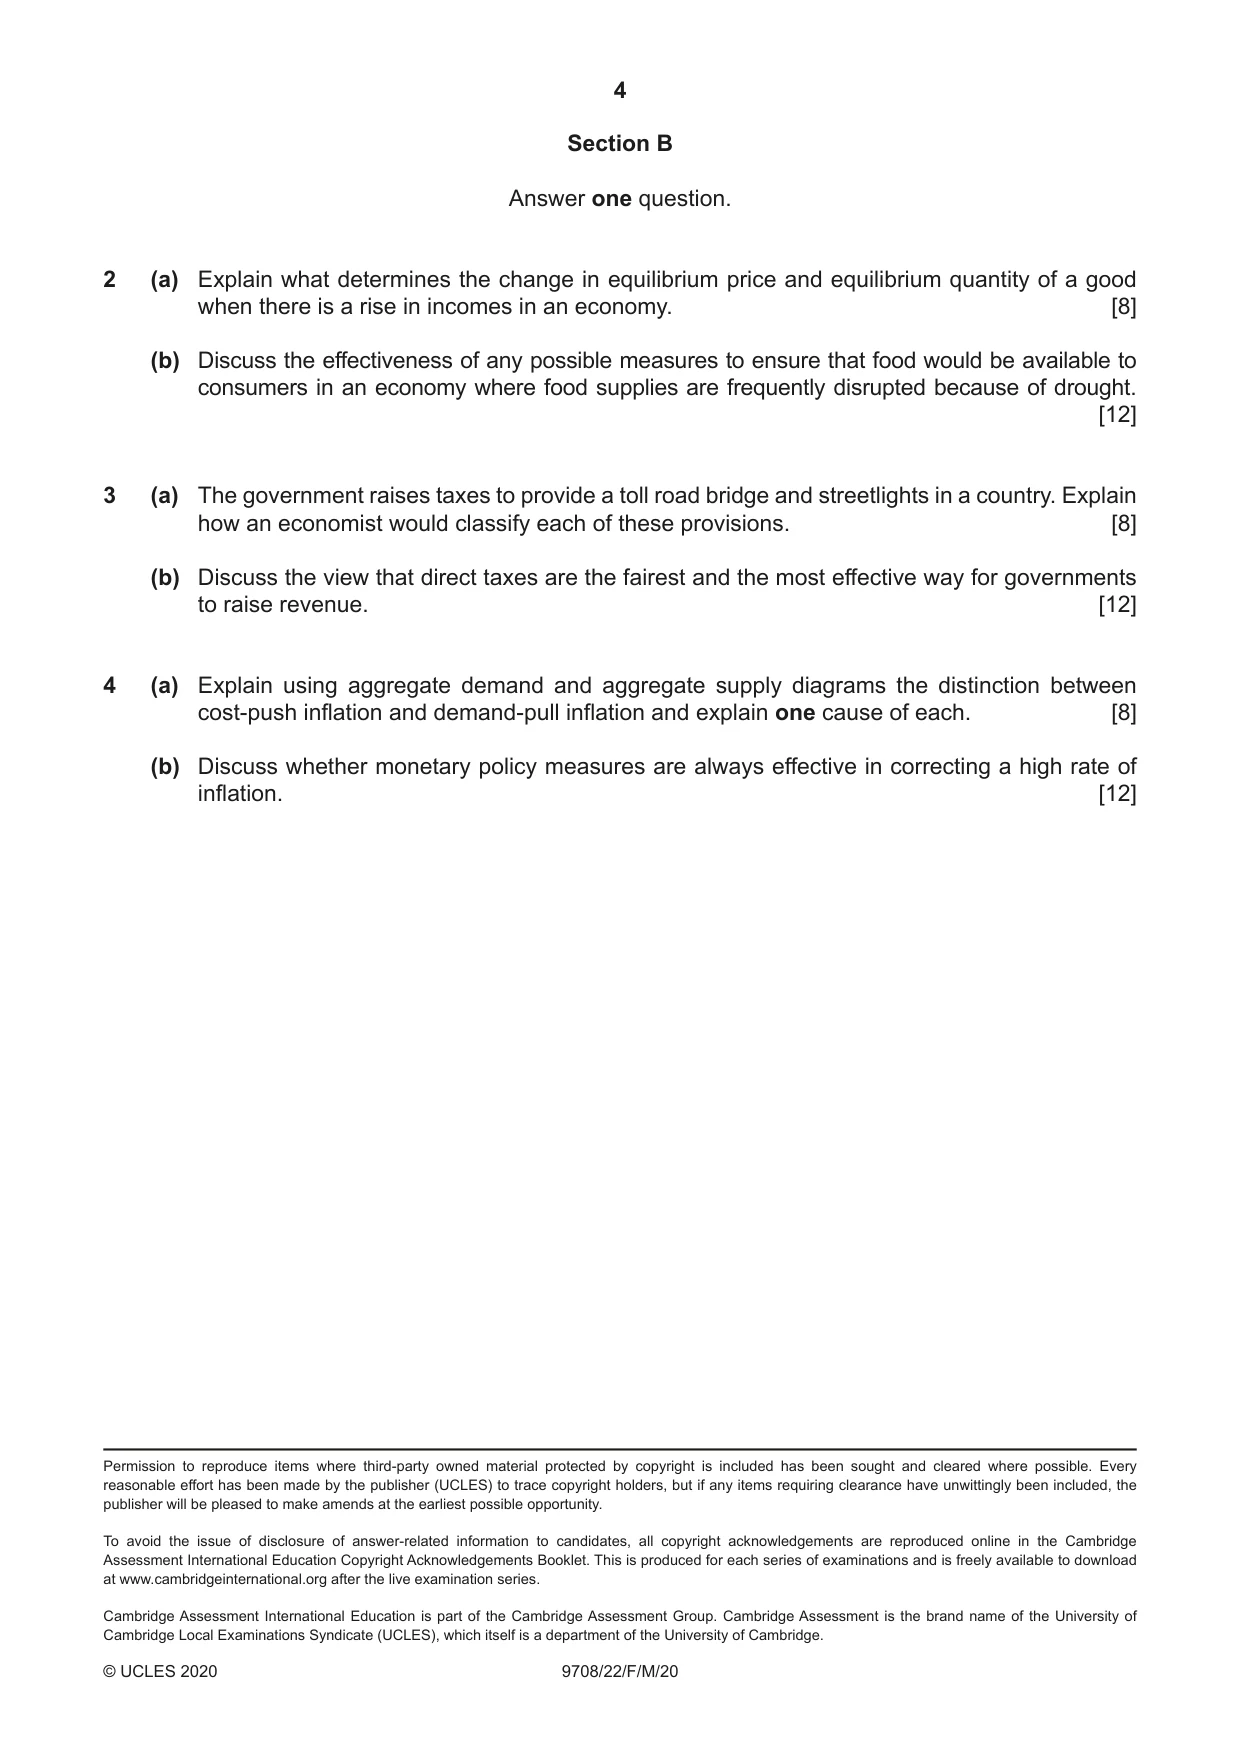
2 (a) Explain what determines the change in equilibrium price and equilibrium quantity of a good when there is a rise in incomes in an economy. [8] (b) Discuss the effectiveness of any possible measures to ensure that food would be available to consumers in an economy where food supplies are frequently disrupted because of drought. [12]
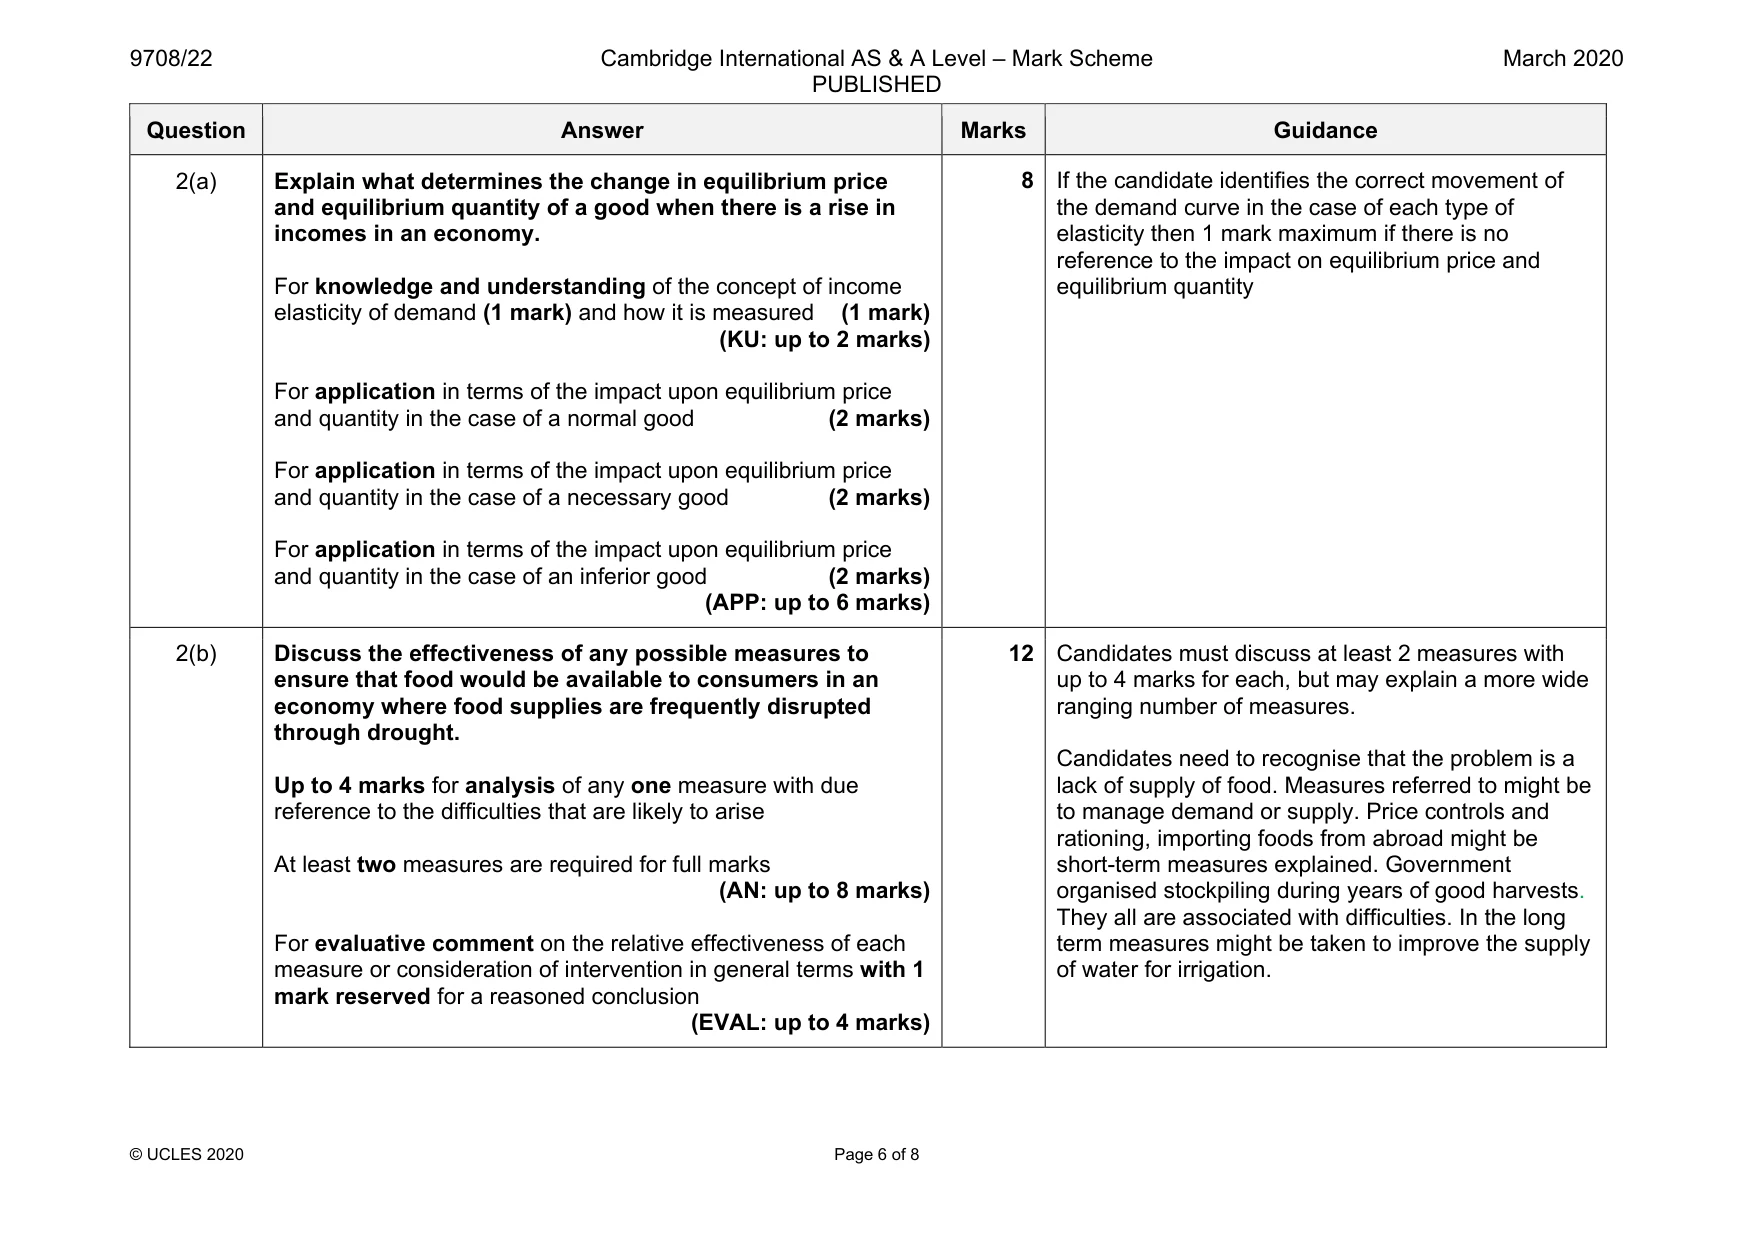
Mark scheme: 2(a) Explain what determines the change in equilibrium price and equilibrium quantity of a good when there is a rise in incomes in an economy. For knowledge and understanding of the concept of income elasticity of demand (1 mark) and how it is measured (1 mark) (KU: up to 2 marks) For application in terms of the impact upon equilibrium price and quantity in the case of a normal good (2 marks) For application in terms of the impact upon equilibrium price and quantity in the case of a necessary good (2 marks) For application in terms of the impact upon equilibrium price and quantity in the case of an inferior good (2 marks) (APP: up to 6 marks) the demand curve in the case of each type of elasticity then 1 mark maximum if there is no reference to the impact on equilibrium price and equilibrium quantity 2(b) Discuss the effectiveness of any possible measures to ensure that food would be available to consumers in an economy where food supplies are frequently disrupted through drought. Up to 4 marks for analysis of any one measure with due reference to the difficulties that are likely to arise At least two measures are required for full marks (AN: up to 8 marks) For evaluative comment on the relative effectiveness of each measure or consideration of intervention in general terms with 1 mark reserved for a reasoned conclusion (EVAL: up to 4 marks) 12 Candidates must discuss at least 2 measures with up to 4 marks for each, but may explain a more wide ranging number of measures. Candidates need to recognise that the problem is a lack of supply of food. Measures referred to might be to manage demand or supply. Price controls and rationing, importing foods from abroad might be short-term measures explained. Government organised stockpiling during years of good harvests. They all are associated with difficulties. In the long term measures might be taken to improve the supply of water for irrigation.
More questions on Methods and effects of government intervention in markets
Q3 · The government raises taxes to provide a toll road bridge and streetlights in a country
3 (a) The government raises taxes to provide a toll road bridge and streetlights in a country. Explain how an economist would classify each of these provisions. [8] (b) Discuss the view that direct taxes are the fairest and the most effective way for governments to raise revenue. [12]
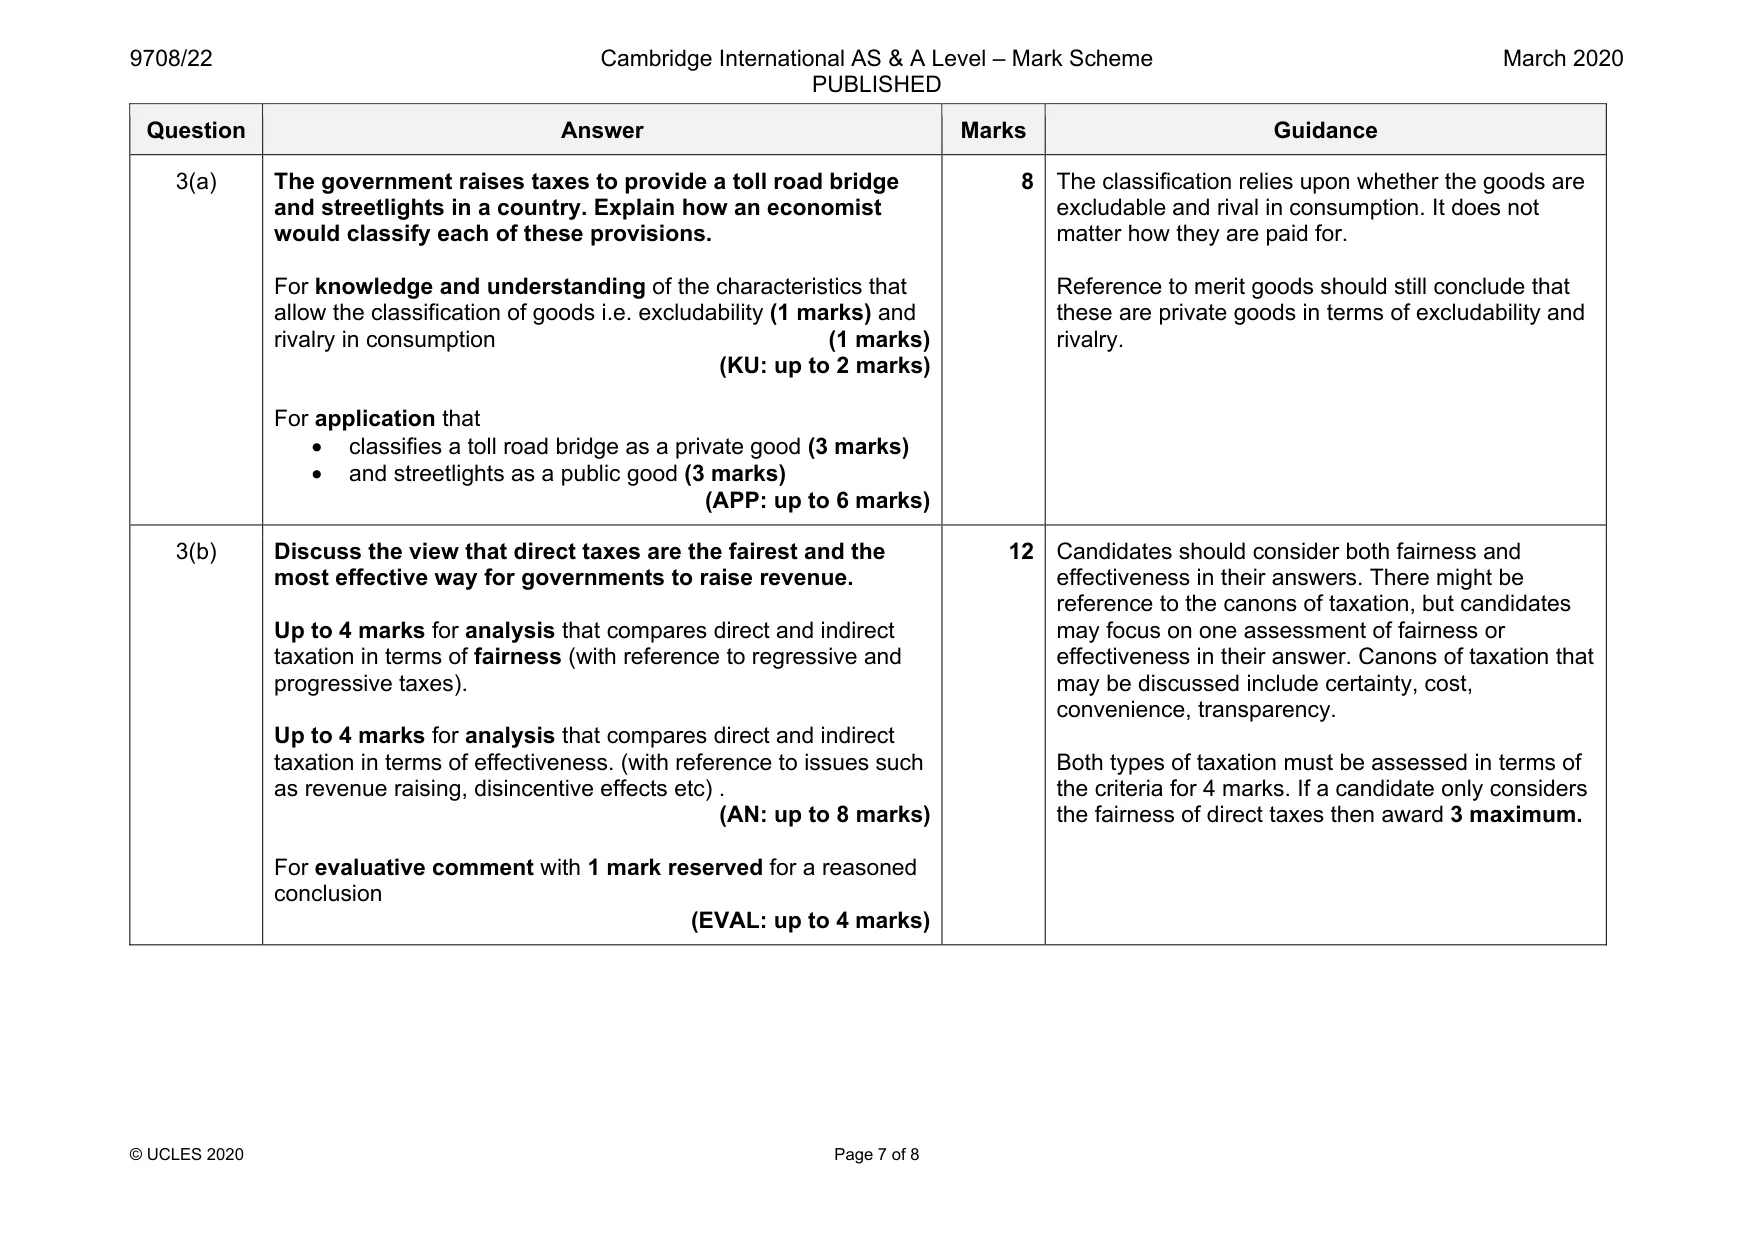
Mark scheme: 3(a) The government raises taxes to provide a toll road bridge and streetlights in a country. Explain how an economist would classify each of these provisions. For knowledge and understanding of the characteristics that allow the classification of goods i.e. excludability (1 marks) and rivalry in consumption (1 marks) (KU: up to 2 marks) For application that • classifies a toll road bridge as a private good (3 marks) • and streetlights as a public good (3 marks) (APP: up to 6 marks) 8 The classification relies upon whether the goods are excludable and rival in consumption. It does not matter how they are paid for. Reference to merit goods should still conclude that these are private goods in terms of excludability and rivalry. 3(b) Discuss the view that direct taxes are the fairest and the most effective way for governments to raise revenue. Up to 4 marks for analysis that compares direct and indirect taxation in terms of fairness (with reference to regressive and progressive taxes). Up to 4 marks for analysis that compares direct and indirect taxation in terms of effectiveness. (with reference to issues such as revenue raising, disincentive effects etc) . (AN: up to 8 marks) For evaluative comment with 1 mark reserved for a reasoned conclusion (EVAL: up to 4 marks) 12 Candidates should consider both fairness and effectiveness in their answers. There might be reference to the canons of taxation, but candidates may focus on one assessment of fairness or effectiveness in their answer. Canons of taxation that may be discussed include certainty, cost, convenience, transparency. Both types of taxation must be assessed in terms of the criteria for 4 marks. If a candidate only considers the fairness of direct taxes then award 3 maximum.
More questions on Equity and redistribution of income and wealth
Q4 · Explain using aggregate demand and aggregate supply diagrams the distinction between…
4 (a) Explain using aggregate demand and aggregate supply diagrams the distinction between cost-push inflation and demand-pull inflation and explain one cause of each. [8] (b) Discuss whether monetary policy measures are always effective in correcting a high rate of inflation. [12]
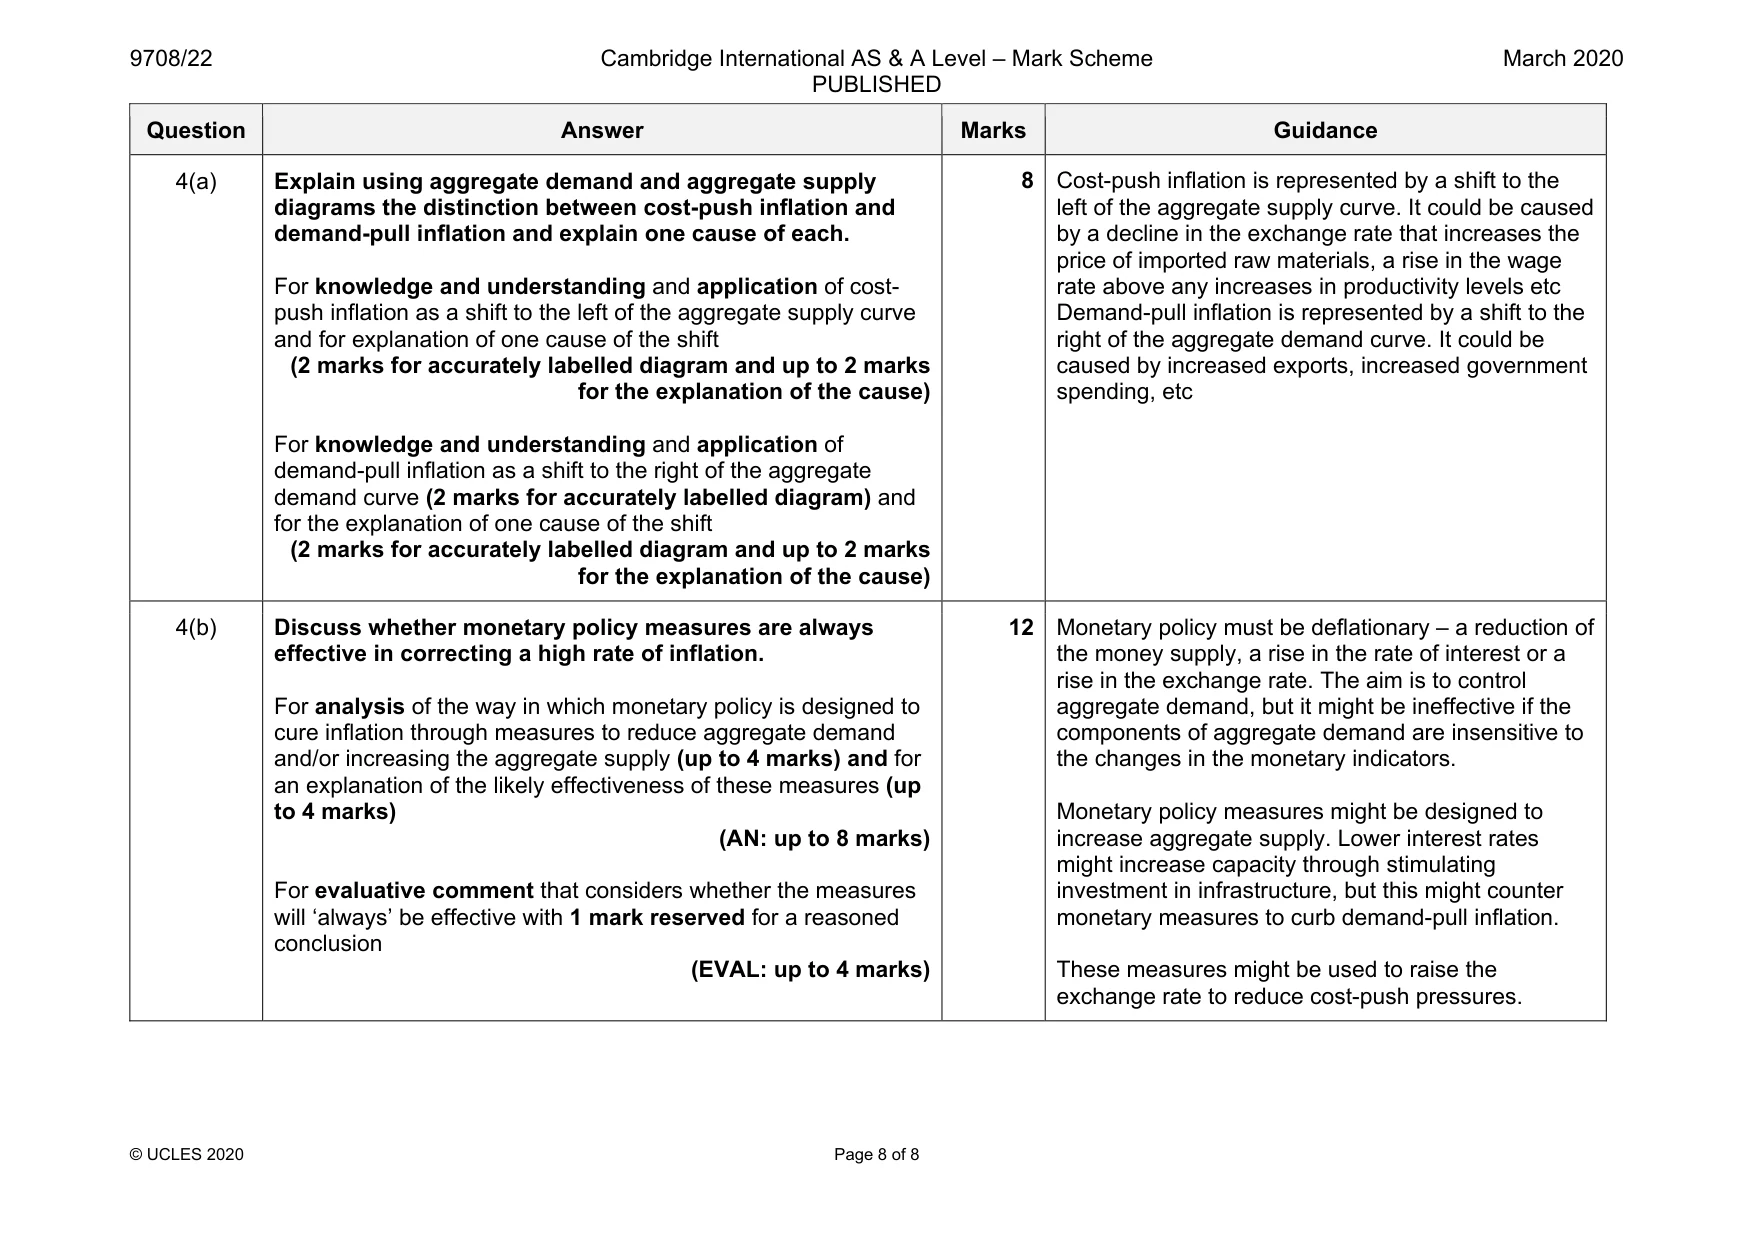
Mark scheme: 4(a) Explain using aggregate demand and aggregate supply diagrams the distinction between cost-push inflation and demand-pull inflation and explain one cause of each. For knowledge and understanding and application of cost- push inflation as a shift to the left of the aggregate supply curve and for explanation of one cause of the shift (2 marks for accurately labelled diagram and up to 2 marks for the explanation of the cause) For knowledge and understanding and application of demand-pull inflation as a shift to the right of the aggregate demand curve (2 marks for accurately labelled diagram) and for the explanation of one cause of the shift (2 marks for accurately labelled diagram and up to 2 marks for the explanation of the cause) left of the aggregate supply curve. It could be caused by a decline in the exchange rate that increases the price of imported raw materials, a rise in the wage rate above any increases in productivity levels etc Demand-pull inflation is represented by a shift to the right of the aggregate demand curve. It could be caused by increased exports, increased government spending, etc 4(b) Discuss whether monetary policy measures are always effective in correcting a high rate of inflation. For analysis of the way in which monetary policy is designed to cure inflation through measures to reduce aggregate demand and/or increasing the aggregate supply (up to 4 marks) and for an explanation of the likely effectiveness of these measures (up to 4 marks) (AN: up to 8 marks) For evaluative comment that considers whether the measures will ‘always’ be effective with 1 mark reserved for a reasoned conclusion (EVAL: up to 4 marks) 12 Monetary policy must be deflationary – a reduction of the money supply, a rise in the rate of interest or a rise in the exchange rate. The aim is to control aggregate demand, but it might be ineffective if the components of aggregate demand are insensitive to the changes in the monetary indicators. Monetary policy measures might be designed to increase aggregate supply. Lower interest rates might increase capacity through stimulating investment in infrastructure, but this might counter monetary measures to curb demand-pull inflation. These measures might be used to raise the exchange rate to reduce cost-push pressures.
What was in this paper
The subtopics covered by these 4 questions, and how many questions each got. Open one in a new tab to see every Cambridge question on it.
What you needed in this session
Cambridge’s own grade thresholds for 2020 Feb/March, Paper 2 · Variant 2. A higher threshold means an easier paper — the bar moves with how the cohort did.