Cambridge A Level Economics 9708 — 2019 Oct/Nov Paper 2 · Variant 1
9708/21/O/N/19 · 4 questions · 40 marks · ≈45 min
The question paper and its mark scheme, free to read here and free to download. This is Cambridge’s own paper, exactly as it was sat.
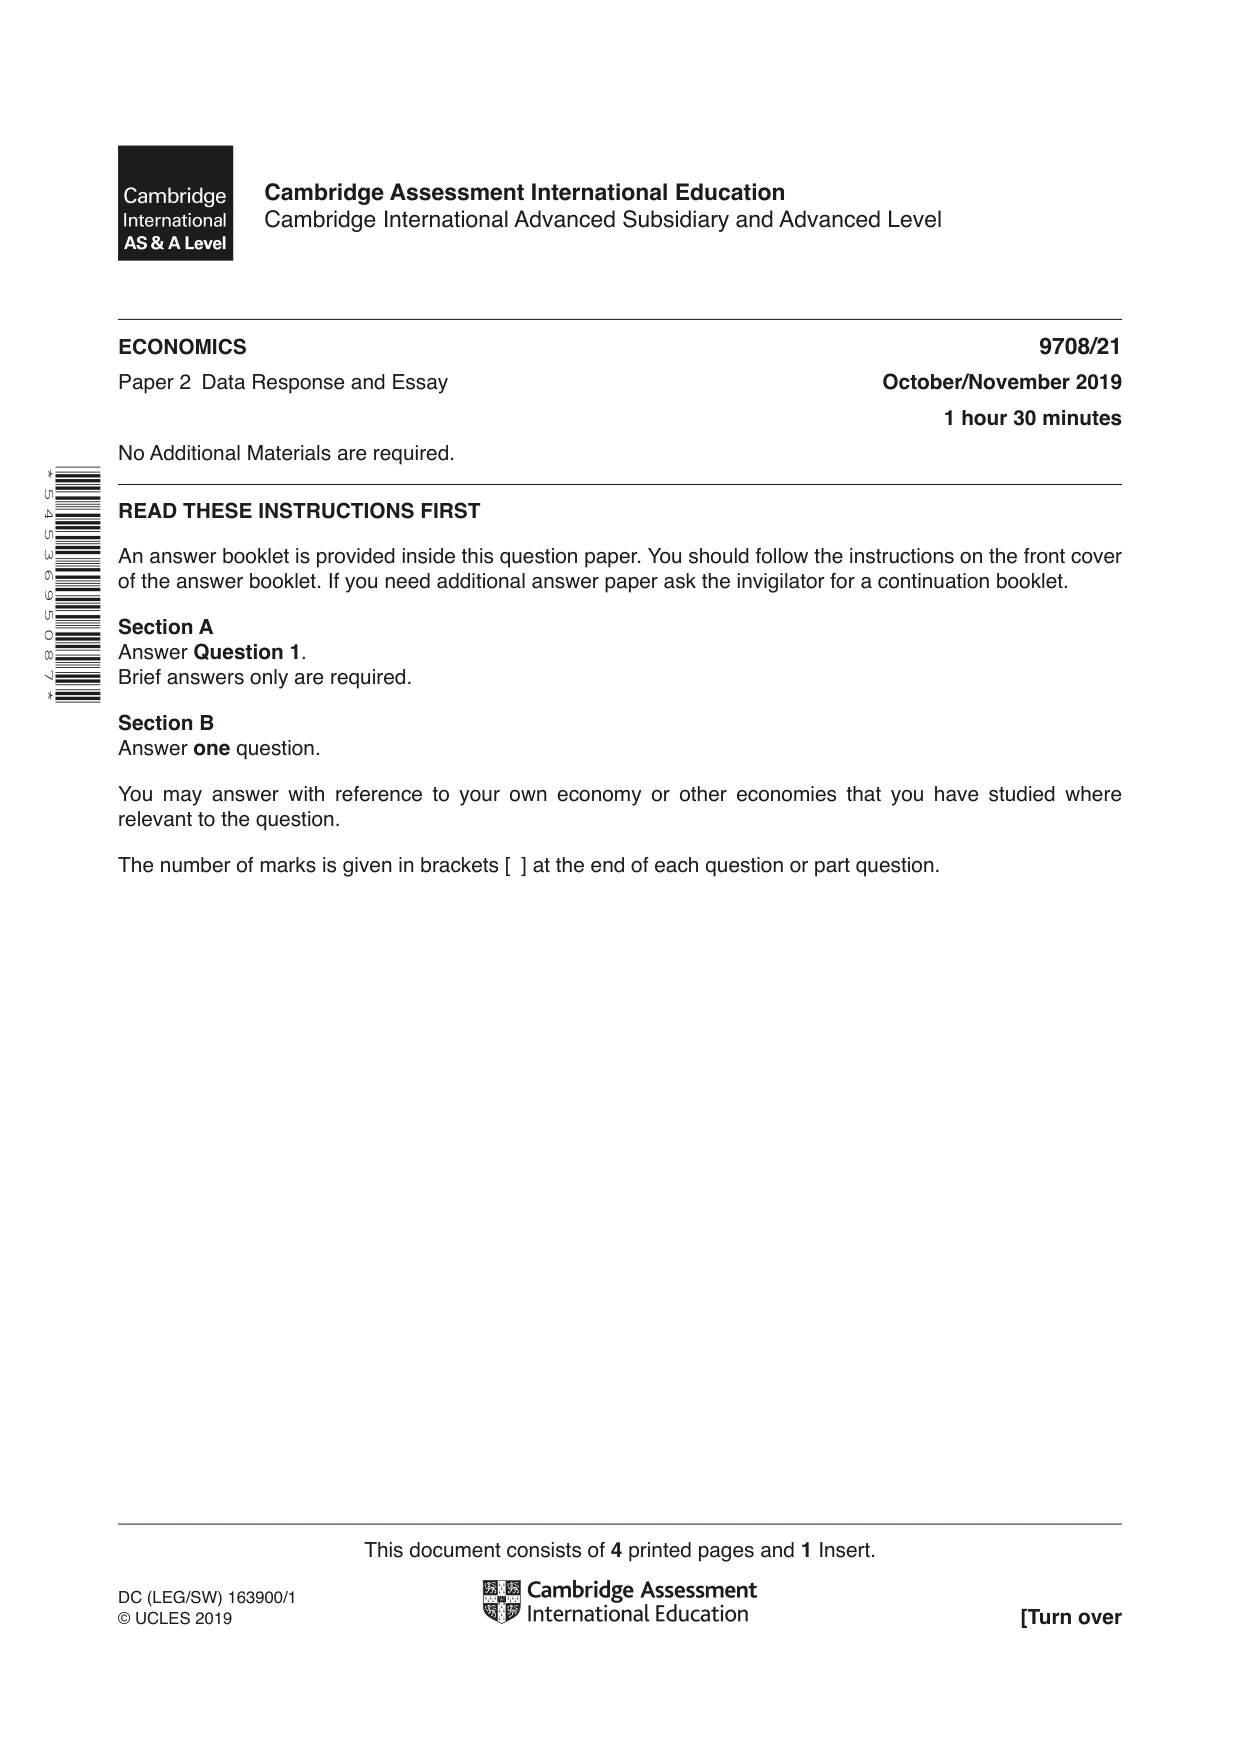
Question paper4 pages
Mark scheme12 pages
Answers below. Sit the paper first if you are practising.
Questions as text
Q1 · The impact of demonetisation in India India has a vast informal economy, where products…
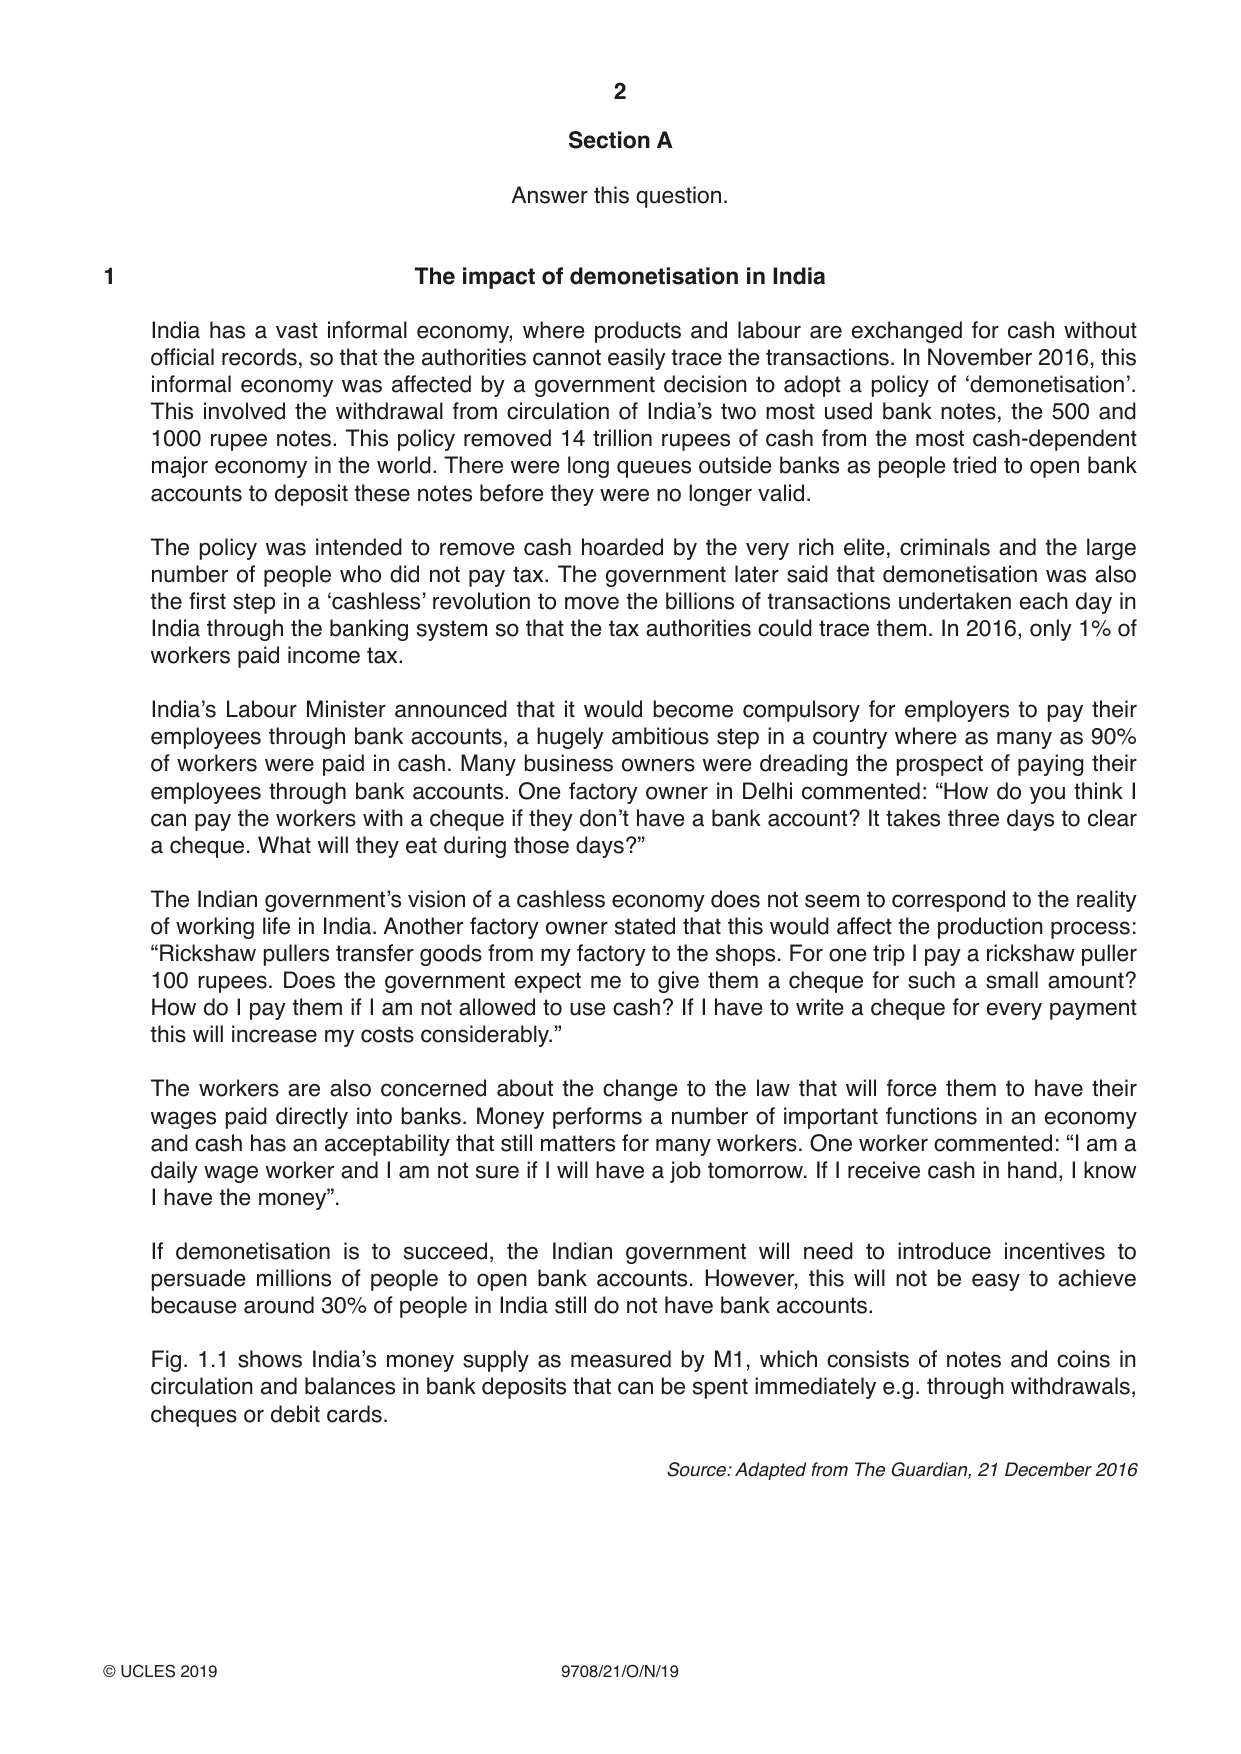
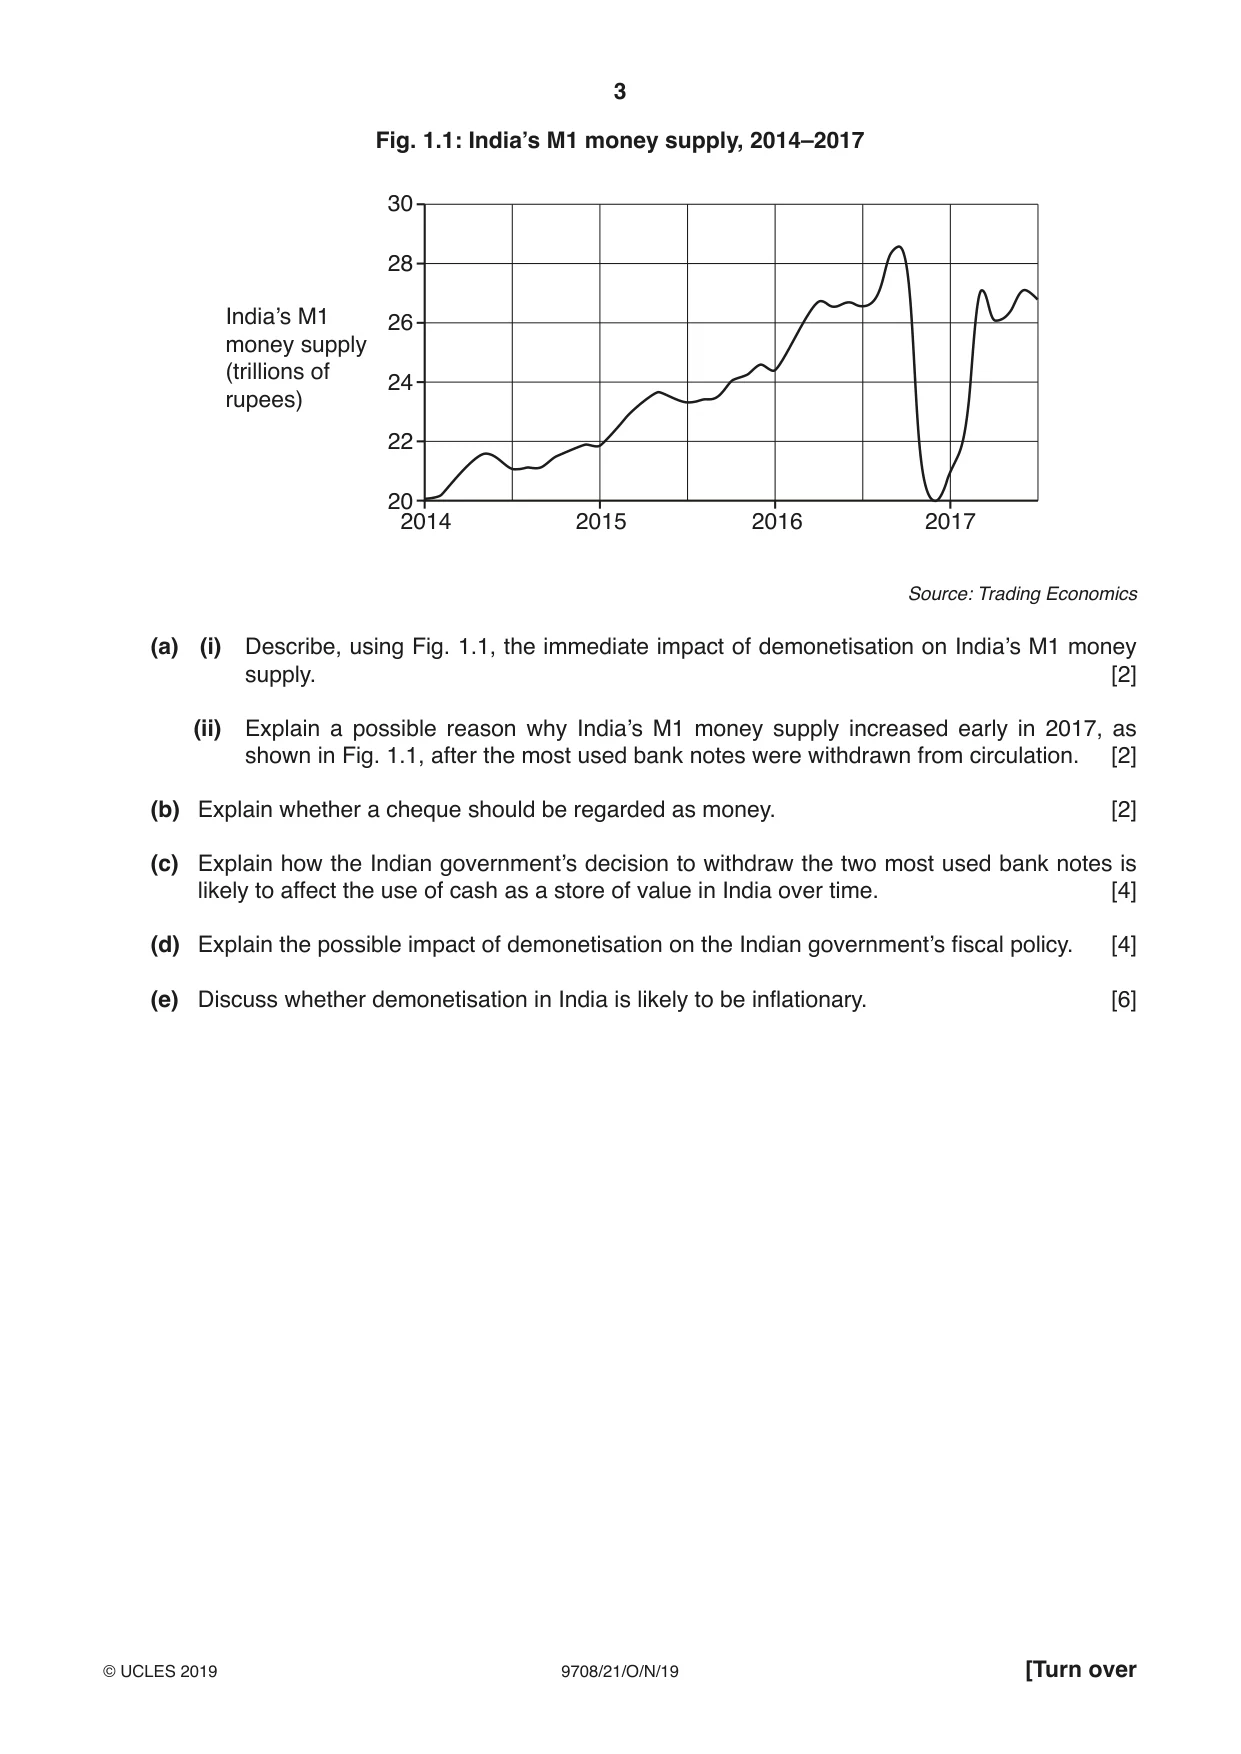
1 The impact of demonetisation in India India has a vast informal economy, where products and labour are exchanged for cash without official records, so that the authorities cannot easily trace the transactions. In November 2016, this informal economy was affected by a government decision to adopt a policy of ‘demonetisation’. This involved the withdrawal from circulation of India’s two most used bank notes, the 500 and 1000 rupee notes. This policy removed 14 trillion rupees of cash from the most cash-dependent major economy in the world. There were long queues outside banks as people tried to open bank accounts to deposit these notes before they were no longer valid. The policy was intended to remove cash hoarded by the very rich elite, criminals and the large number of people who did not pay tax. The government later said that demonetisation was also the first step in a ‘cashless’ revolution to move the billions of transactions undertaken each day in India through the banking system so that the tax authorities could trace them. In 2016, only 1% of workers paid income tax. India’s Labour Minister announced that it would become compulsory for employers to pay their employees through bank accounts, a hugely ambitious step in a country where as many as 90% of workers were paid in cash. Many business owners were dreading the prospect of paying their employees through bank accounts. One factory owner in Delhi commented: “How do you think I can pay the workers with a cheque if they don’t have a bank account? It takes three days to clear a cheque. What will they eat during those days?” The Indian government’s vision of a cashless economy does not seem to correspond to the reality of working life in India. Another factory owner stated that this would affect the production process: “Rickshaw pullers transfer goods from my factory to the shops. For one trip I pay a rickshaw puller 100 rupees. Does the government expect me to give them a cheque for such a small amount? How do I pay them if I am not allowed to use cash? If I have to write a cheque for every payment this will increase my costs considerably.” The workers are also concerned about the change to the law that will force them to have their wages paid directly into banks. Money performs a number of important functions in an economy and cash has an acceptability that still matters for many workers. One worker commented: “I am a daily wage worker and I am not sure if I will have a job tomorrow. If I receive cash in hand, I know I have the money”. If demonetisation is to succeed, the Indian government will need to introduce incentives to persuade millions of people to open bank accounts. However, this will not be easy to achieve because around 30% of people in India still do not have bank accounts. Fig. 1.1 shows India’s money supply as measured by M1, which consists of notes and coins in circulation and balances in bank deposits that can be spent immediately e.g. through withdrawals, cheques or debit cards. Source: Adapted from The Guardian, 21 December 2016 Fig. 1.1: India’s M1 money supply, 2014–2017 30 28 India’s M1 26 money supply (trillions of 24 rupees) 22 20 2014 2015 2016 2017 Source: Trading Economics (a) (i) Describe, using Fig. 1.1, the immediate impact of demonetisation on India’s M1 money supply. [2] (ii) Explain a possible reason why India’s M1 money supply increased early in 2017, as shown in Fig. 1.1, after the most used bank notes were withdrawn from circulation. [2] (b) Explain whether a cheque should be regarded as money. [2] (c) Explain how the Indian government’s decision to withdraw the two most used bank notes is likely to affect the use of cash as a store of value in India over time. [4] (d) Explain the possible impact of demonetisation on the Indian government’s fiscal policy. [4] (e) Discuss whether demonetisation in India is likely to be inflationary. [6]
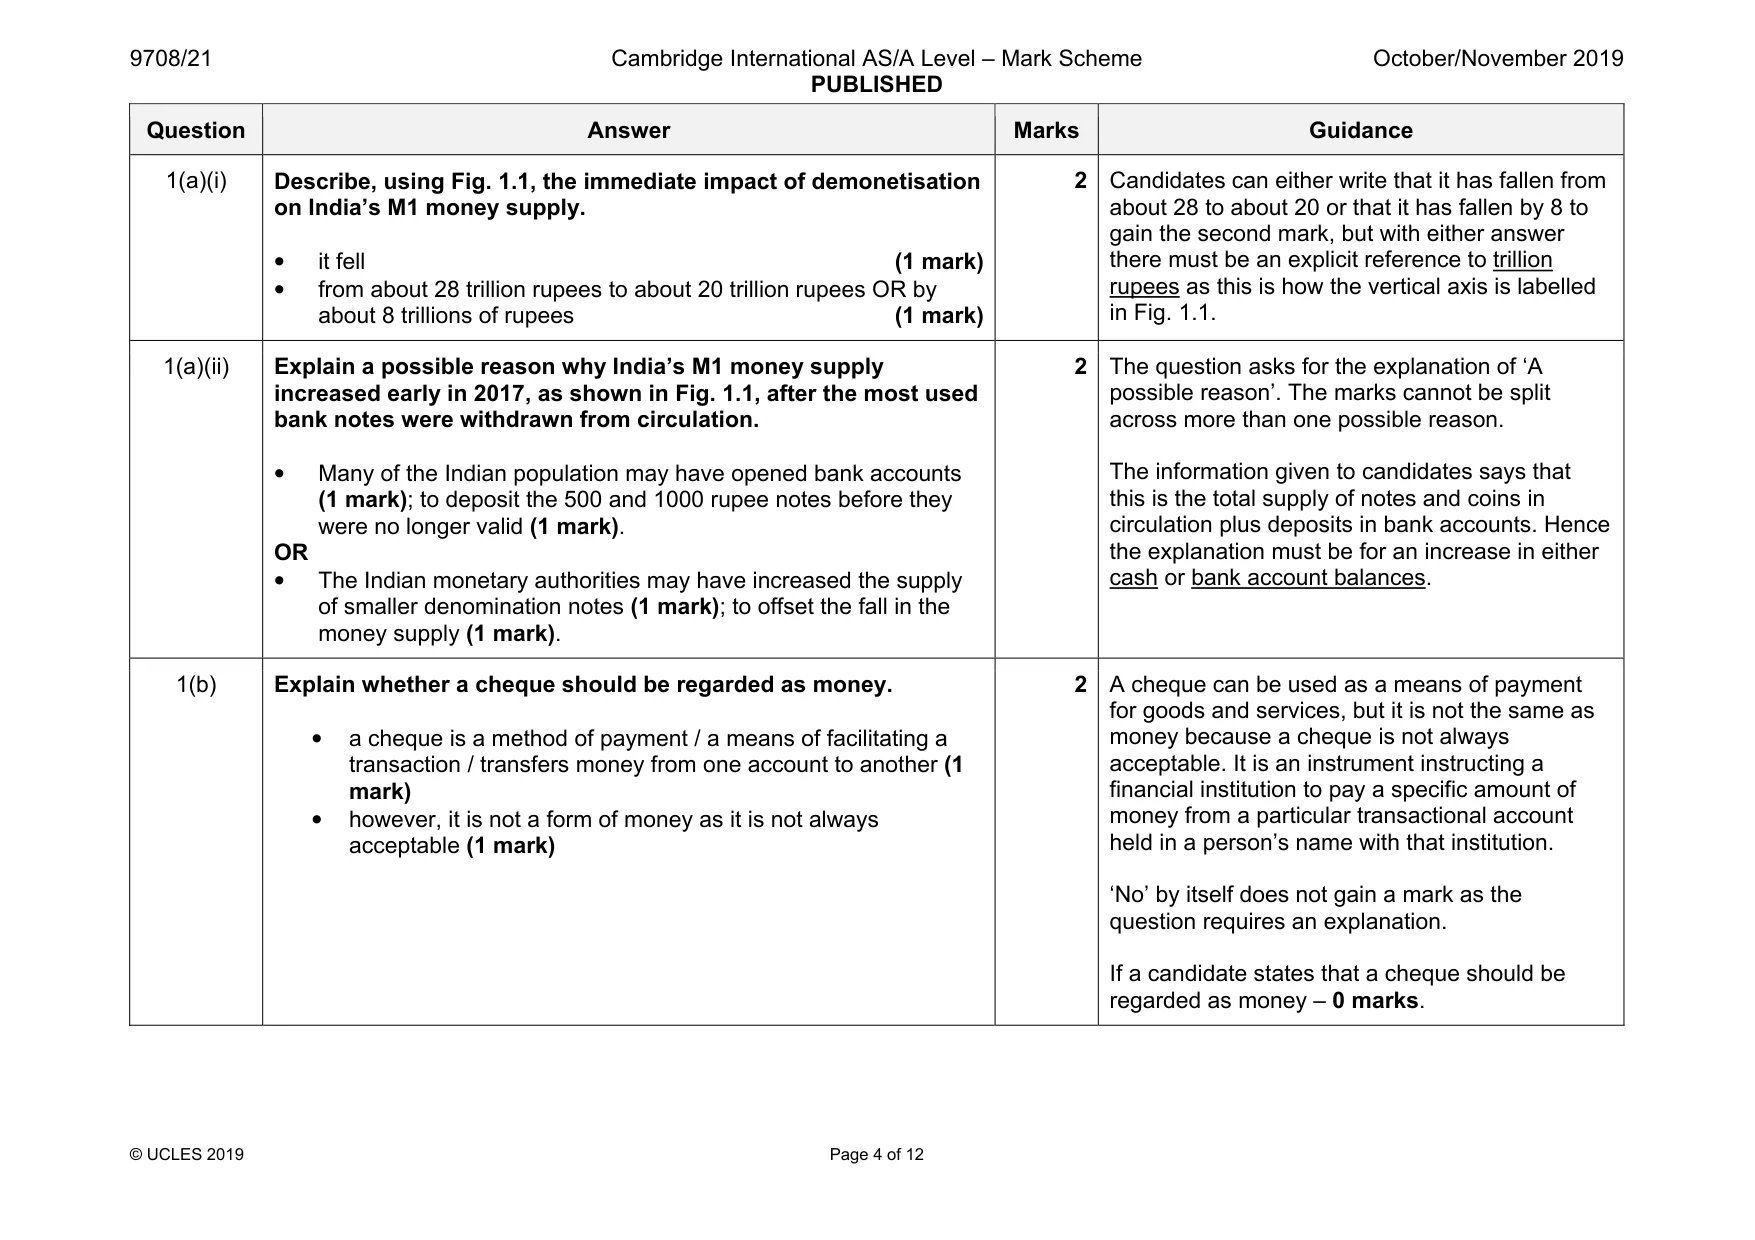
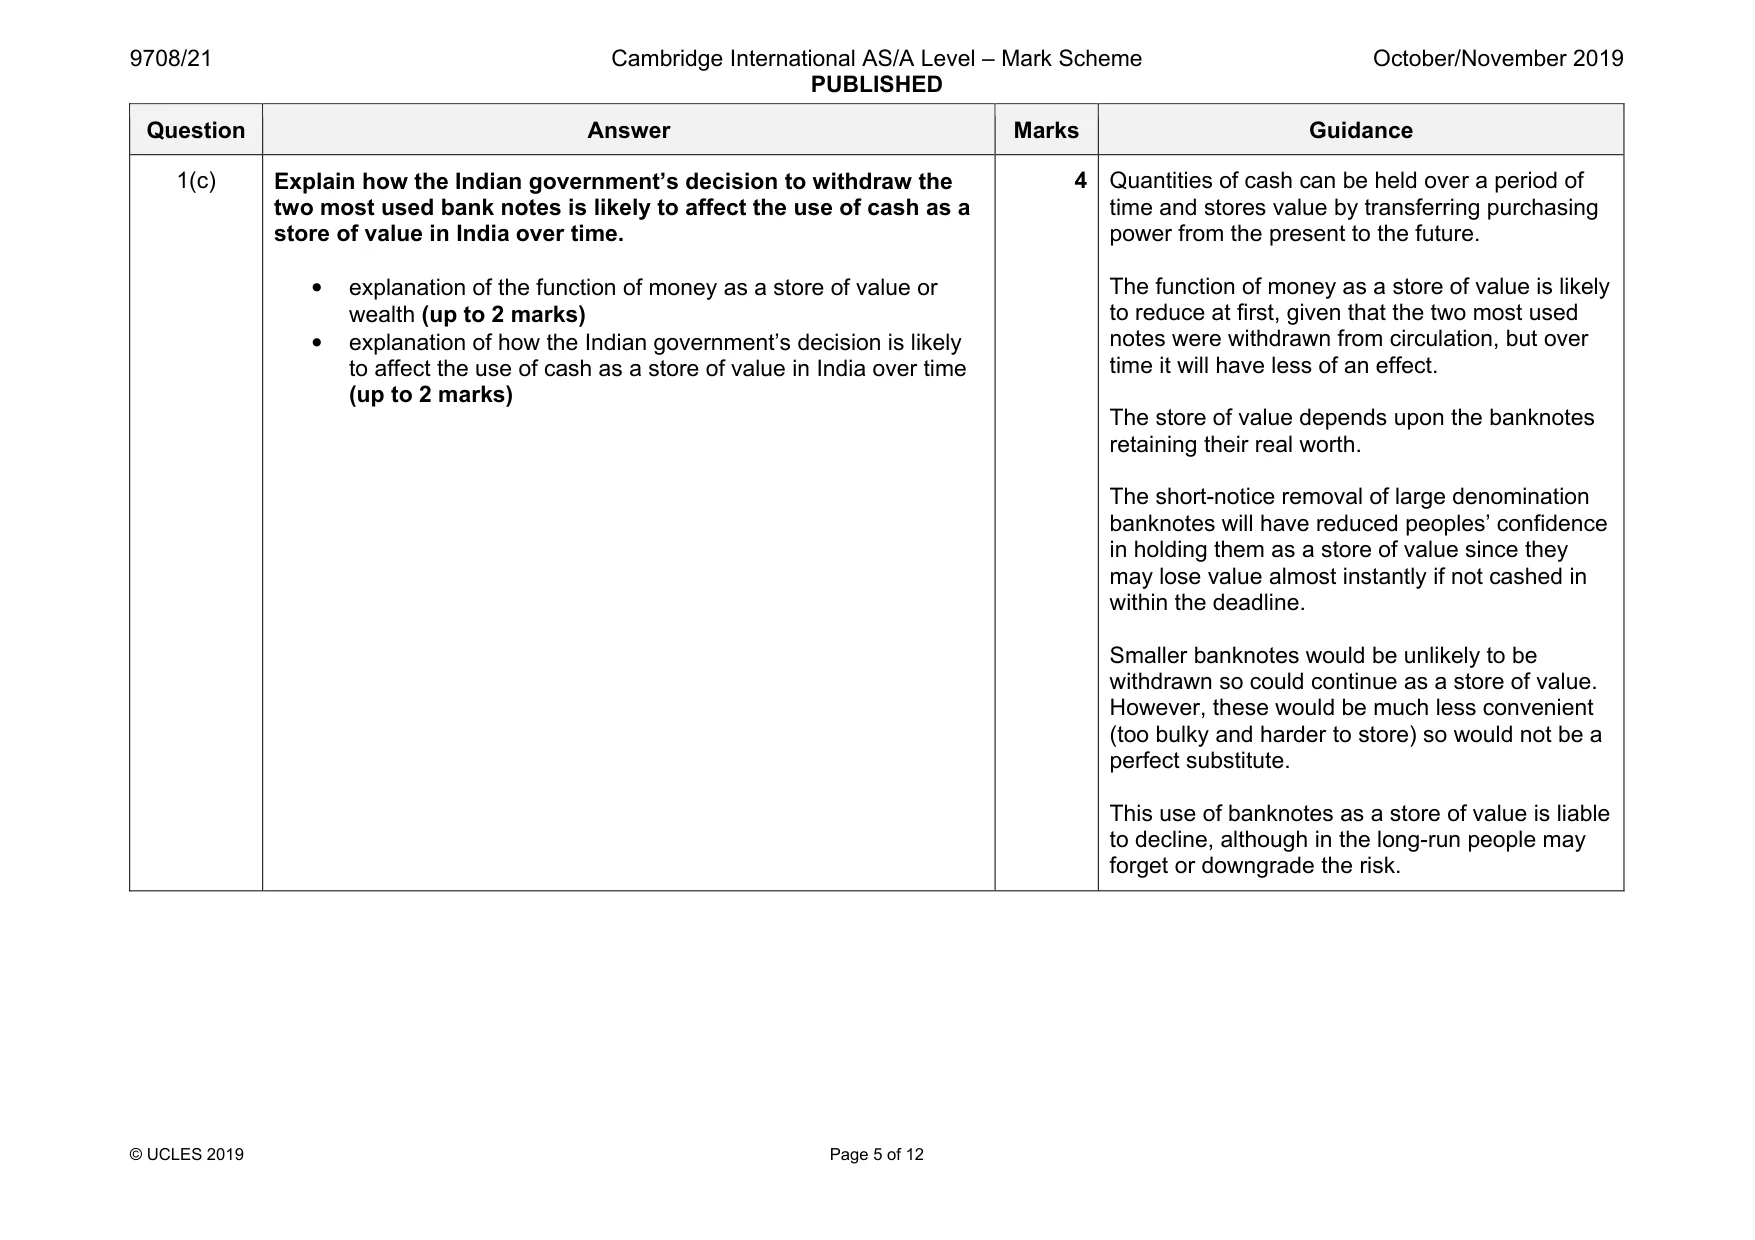
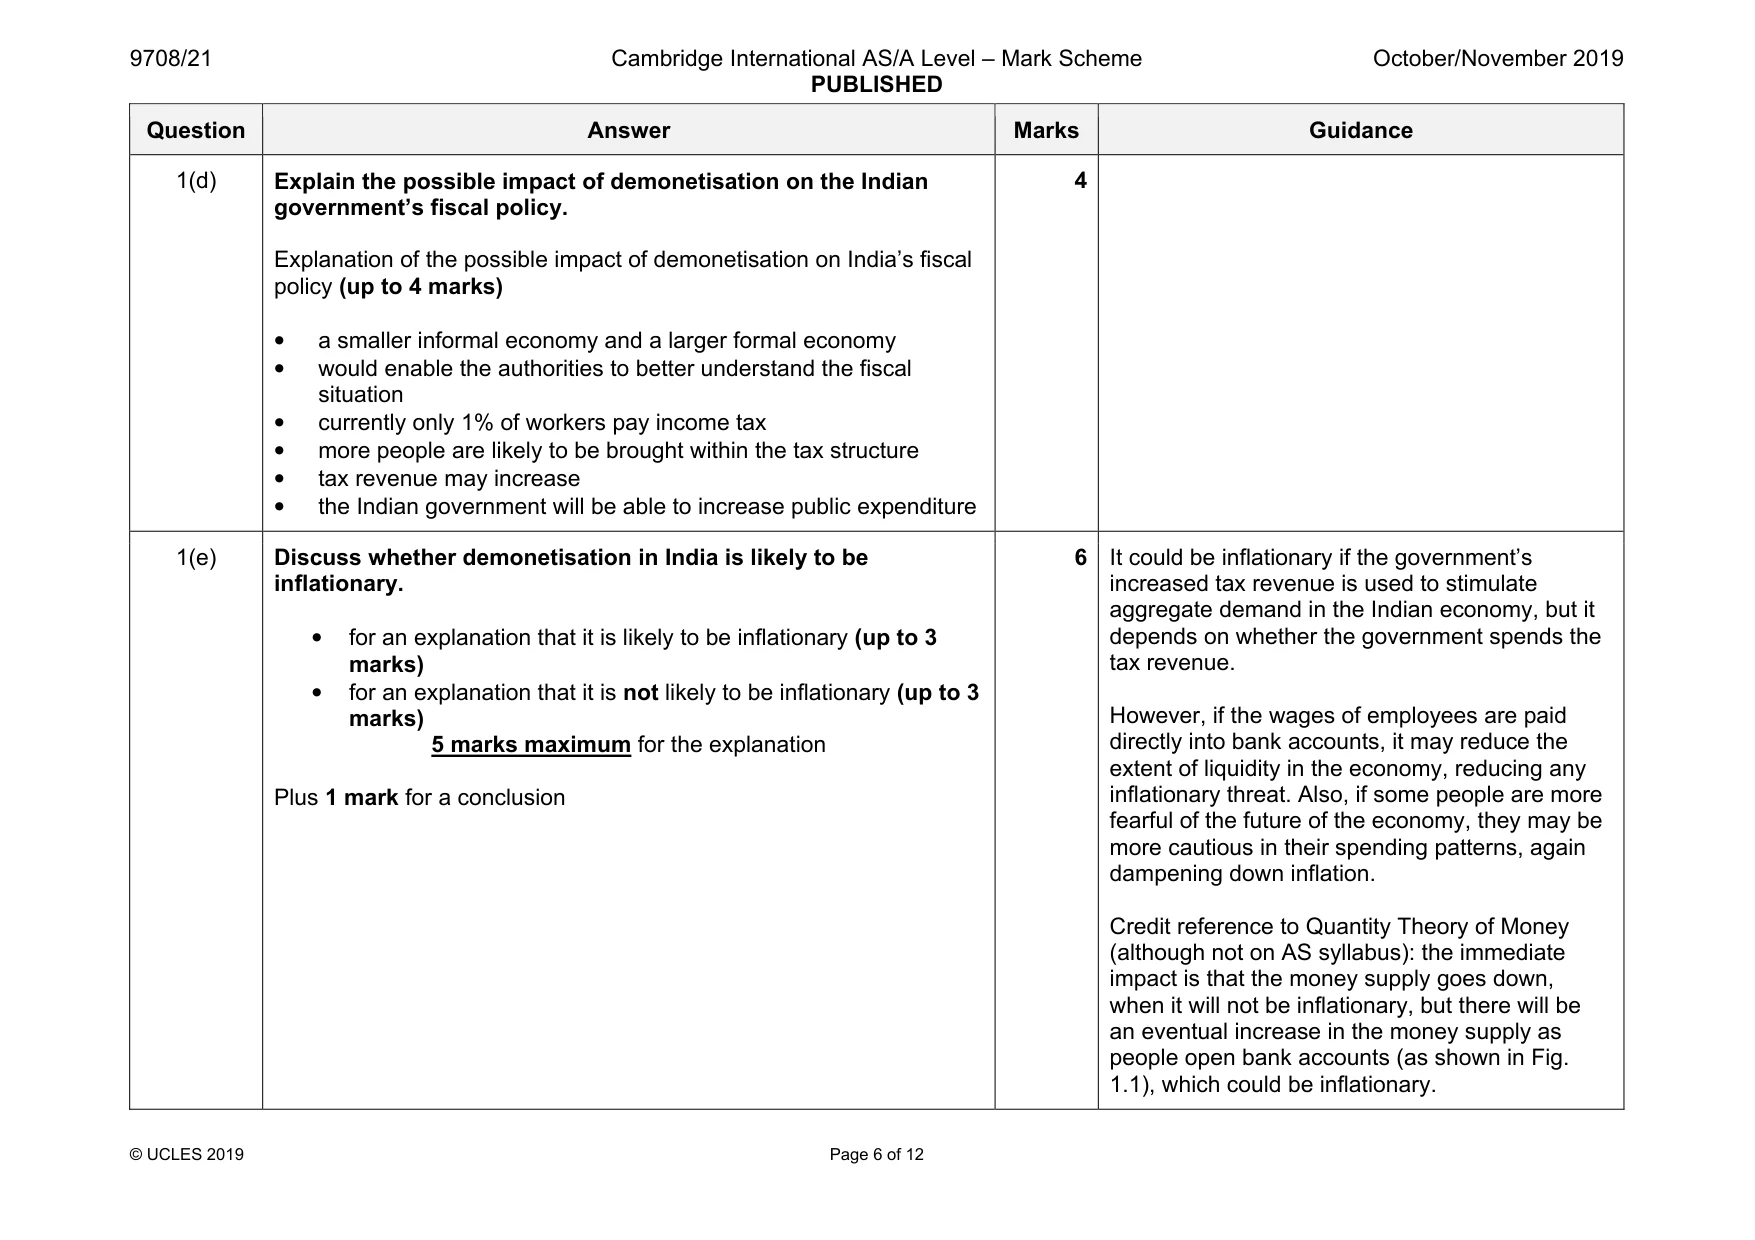
Mark scheme: 1(a)(i) Describe, using Fig. 1.1, the immediate impact of demonetisation on India’s M1 money supply. • it fell (1 mark) • from about 28 trillion rupees to about 20 trillion rupees OR by about 8 trillions of rupees (1 mark) 2 about 28 to about 20 or that it has fallen by 8 to gain the second mark, but with either answer there must be an explicit reference to trillion rupees as this is how the vertical axis is labelled in Fig. 1.1. 1(a)(ii) Explain a possible reason why India’s M1 money supply increased early in 2017, as shown in Fig. 1.1, after the most used bank notes were withdrawn from circulation. • Many of the Indian population may have opened bank accounts (1 mark); to deposit the 500 and 1000 rupee notes before they were no longer valid (1 mark). OR • The Indian monetary authorities may have increased the supply of smaller denomination notes (1 mark); to offset the fall in the money supply (1 mark). 2 The question asks for the explanation of ‘A possible reason’. The marks cannot be split across more than one possible reason. The information given to candidates says that this is the total supply of notes and coins in circulation plus deposits in bank accounts. Hence the explanation must be for an increase in either cash or bank account balances. 1(b) Explain whether a cheque should be regarded as money. • a cheque is a method of payment / a means of facilitating a transaction / transfers money from one account to another (1 mark) • however, it is not a form of money as it is not always acceptable (1 mark) 2 A cheque can be used as a means of payment for goods and services, but it is not the same as money because a cheque is not always acceptable. It is an instrument instructing a financial institution to pay a specific amount of money from a particular transactional account held in a person’s name with that institution. ‘No’ by itself does not gain a mark as the question requires an explanation. If a candidate states that a cheque should be regarded as money – 0 marks. Question Answer Marks Guidance 1(c) Explain how the Indian government’s decision to withdraw the two most used bank notes is likely to affect the use of cash as a store of value in India over time. • explanation of the function of money as a store of value or wealth (up to 2 marks) • explanation of how the Indian government’s decision is likely to affect the use of cash as a store of value in India over time (up to 2 marks) 4 Quantities of cash can be held over a period of time and stores value by transferring purchasing power from the present to the future. The function of money as a store of value is likely to reduce at first, given that the two most used notes were withdrawn from circulation, but over time it will have less of an effect. The store of value depends upon the banknotes retaining their real worth. The short-notice removal of large denomination banknotes will have reduced peoples’ confidence in holding them as a store of value since they may lose value almost instantly if not cashed in within the deadline. Smaller banknotes would be unlikely to be withdrawn so could continue as a store of value. However, these would be much less convenient (too bulky and harder to store) so would not be a perfect substitute. This use of banknotes as a store of value is liable to decline, although in the long-run people may forget or downgrade the risk. Question Answer Marks Guidance 1(d) Explain the possible impact of demonetisation on the Indian government’s fiscal policy. Explanation of the possible impact of demonetisation on India’s fiscal policy (up to 4 marks) • a smaller informal economy and a larger formal economy • would enable the authorities to better understand the fiscal situation • currently only 1% of workers pay income tax • more people are likely to be brought within the tax structure • tax revenue may increase • the Indian government will be able to increase public expenditure 4 1(e) Discuss whether demonetisation in India is likely to be inflationary. • for an explanation that it is likely to be inflationary (up to 3 marks) • for an explanation that it is not likely to be inflationary (up to 3 marks) 5 marks maximum for the explanation Plus 1 mark for a conclusion 6 It could be inflationary if the government’s increased tax revenue is used to stimulate aggregate demand in the Indian economy, but it depends on whether the government spends the tax revenue. However, if the wages of employees are paid directly into bank accounts, it may reduce the extent of liquidity in the economy, reducing any inflationary threat. Also, if some people are more fearful of the future of the economy, they may be more cautious in their spending patterns, again dampening down inflation. Credit reference to Quantity Theory of Money (although not on AS syllabus): the immediate impact is that the money supply goes down, when it will not be inflationary, but there will be an eventual increase in the money supply as people open bank accounts (as shown in Fig. 1.1), which could be inflationary. Question Answer Marks Guidance 2(a) Explain, with the help of a diagram, how a free market would react if a minimum price which had been set above the equilibrium is removed. For correct diagram: • axes correctly labelled: P/Q (1 mark) • market equilibrium shown (1 mark) (KU: up to 2 marks) • minimum price shown above equilibrium in diagram (1 mark) • reference to the existence of excess supply (1 mark) • explanation in terms of the process whereby a minimum price set above the equilibrium is removed. (up to 4 marks) (APP: up to 6 marks) • The guaranteed minimum price or price floor, set above the equilibrium, would be removed • This would lead to the excess supply disappearing • The market would revert to an equilibrium position, leading to a fall in price with an increased quantity traded • There would neither be an excess supply nor an excess demand in the free market: the quantity demanded will increase and the quantity supplied will reduce, so eliminating the excess • A market clearing position would be established • The impact on the producer revenue will depend on the elasticities of demand and supply • Consumer surplus will increase Question Answer Marks Guidance 2(b) Discuss, with the use of examples, the extent to which a supermarket could make use of the concept of income elasticity of demand in relation to the different types of goods being sold when there was an increase in consumer incomes. • analysis in relation to normal goods, using appropriate examples (up to 3 marks) • analysis in relation to inferior goods, using appropriate examples (up to 3 marks) • analysis in relation to necessity goods, using appropriate examples (up to 3 marks) (AN: up to 8 marks) • assessing the extent to which a supermarket could make use of the concept of income elasticity of demand in relation to the different types of goods being sold when there was an increase in consumer incomes (up to 3 marks); plus a concluding comment (1 mark) (EV: up to 4 marks) YED is the percentage change in the quantity demanded of a product divided by the percentage change in incomes. For a normal good, the YED will be positive for normal goods, i.e. as consumer incomes rise, the demand for products will rise. For an inferior good, the YED will be negative for inferior goods, i.e. as consumer incomes rise, the demand for products will fall. If there is an increase in consumer incomes, a supermarket is likely to stock more normal goods and fewer inferior goods. Necessity goods have a positive YED, but it is rather low, e.g. less than one (inelastic). If there is an increase in incomes, there is unlikely to be very much of an effect on supermarkets in terms of the stocking of necessity goods.
Q2 · Explain, with the help of a diagram, how a free market would react if a minimum price…
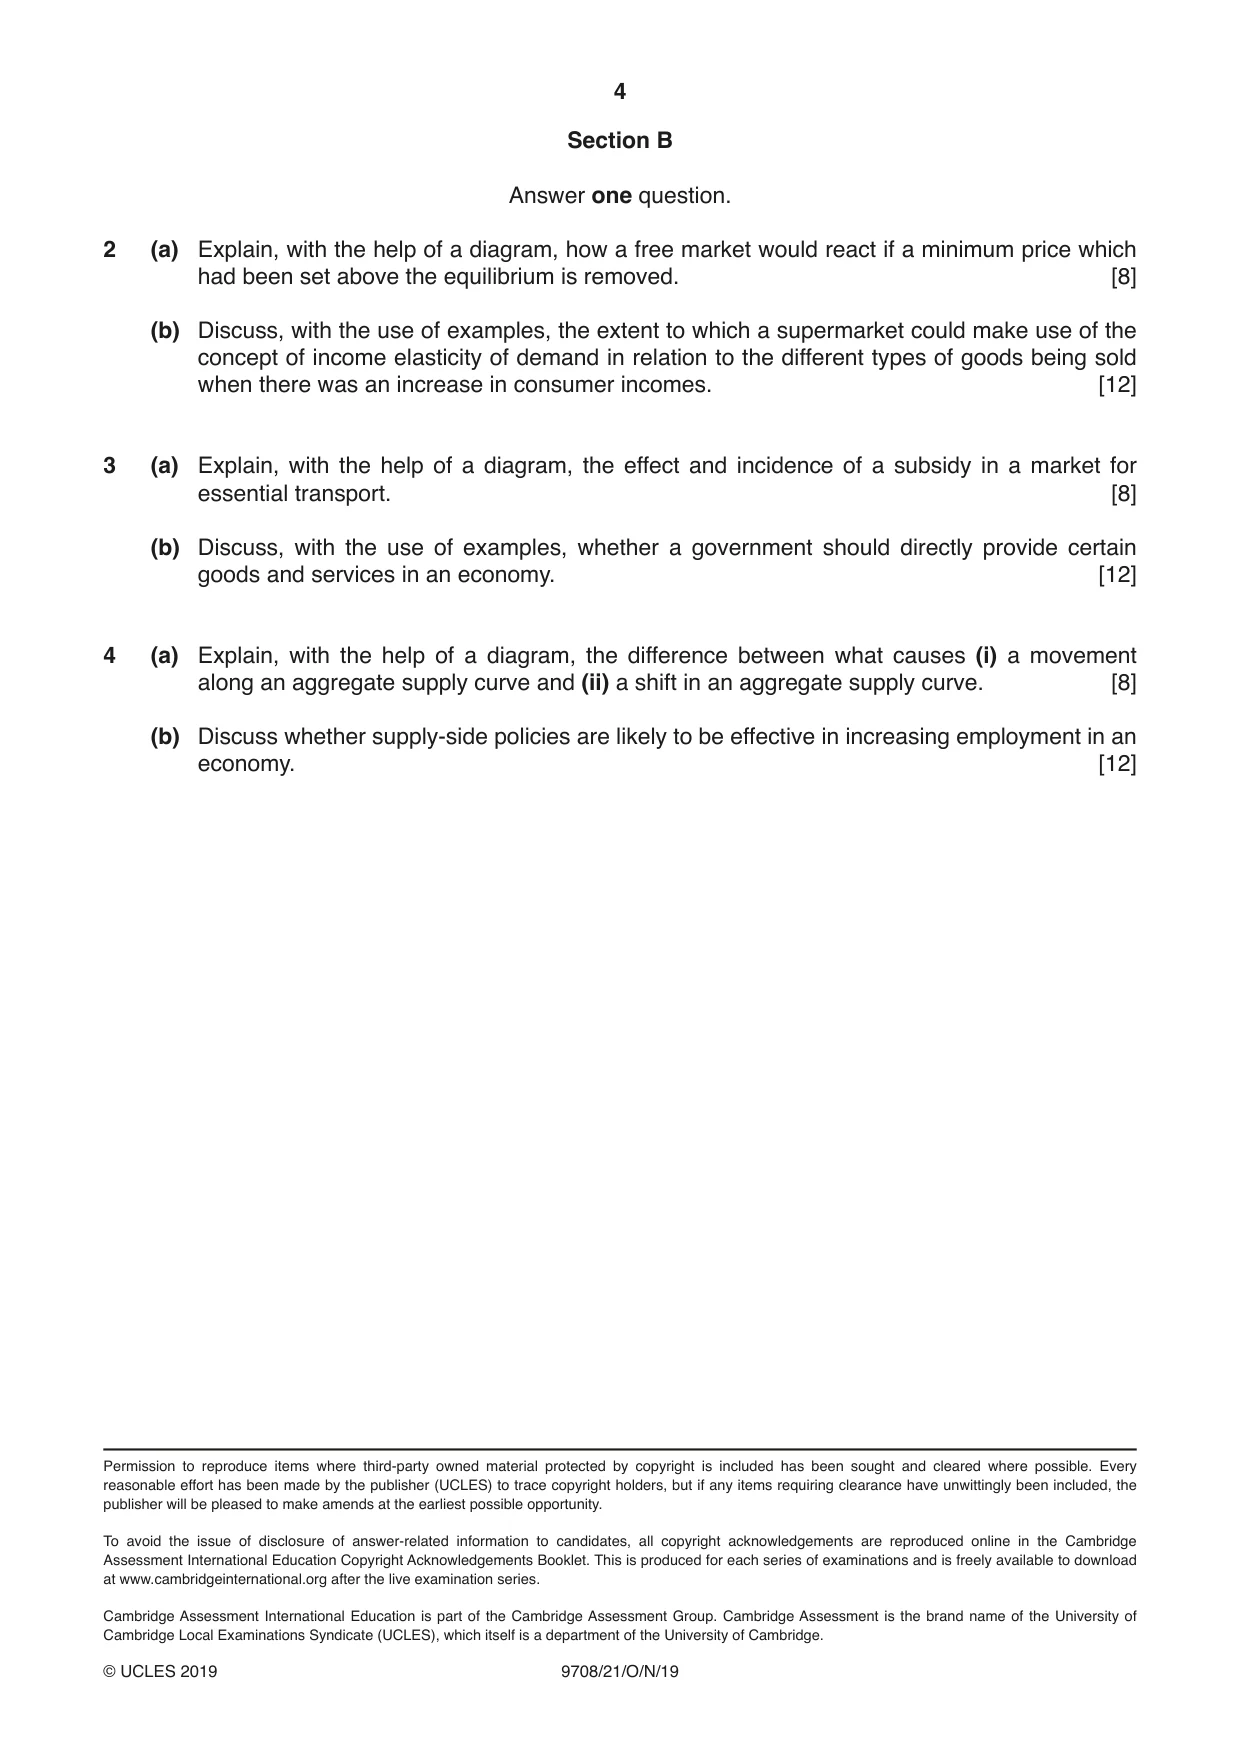
2 (a) Explain, with the help of a diagram, how a free market would react if a minimum price which had been set above the equilibrium is removed. [8] (b) Discuss, with the use of examples, the extent to which a supermarket could make use of the concept of income elasticity of demand in relation to the different types of goods being sold when there was an increase in consumer incomes. [12]
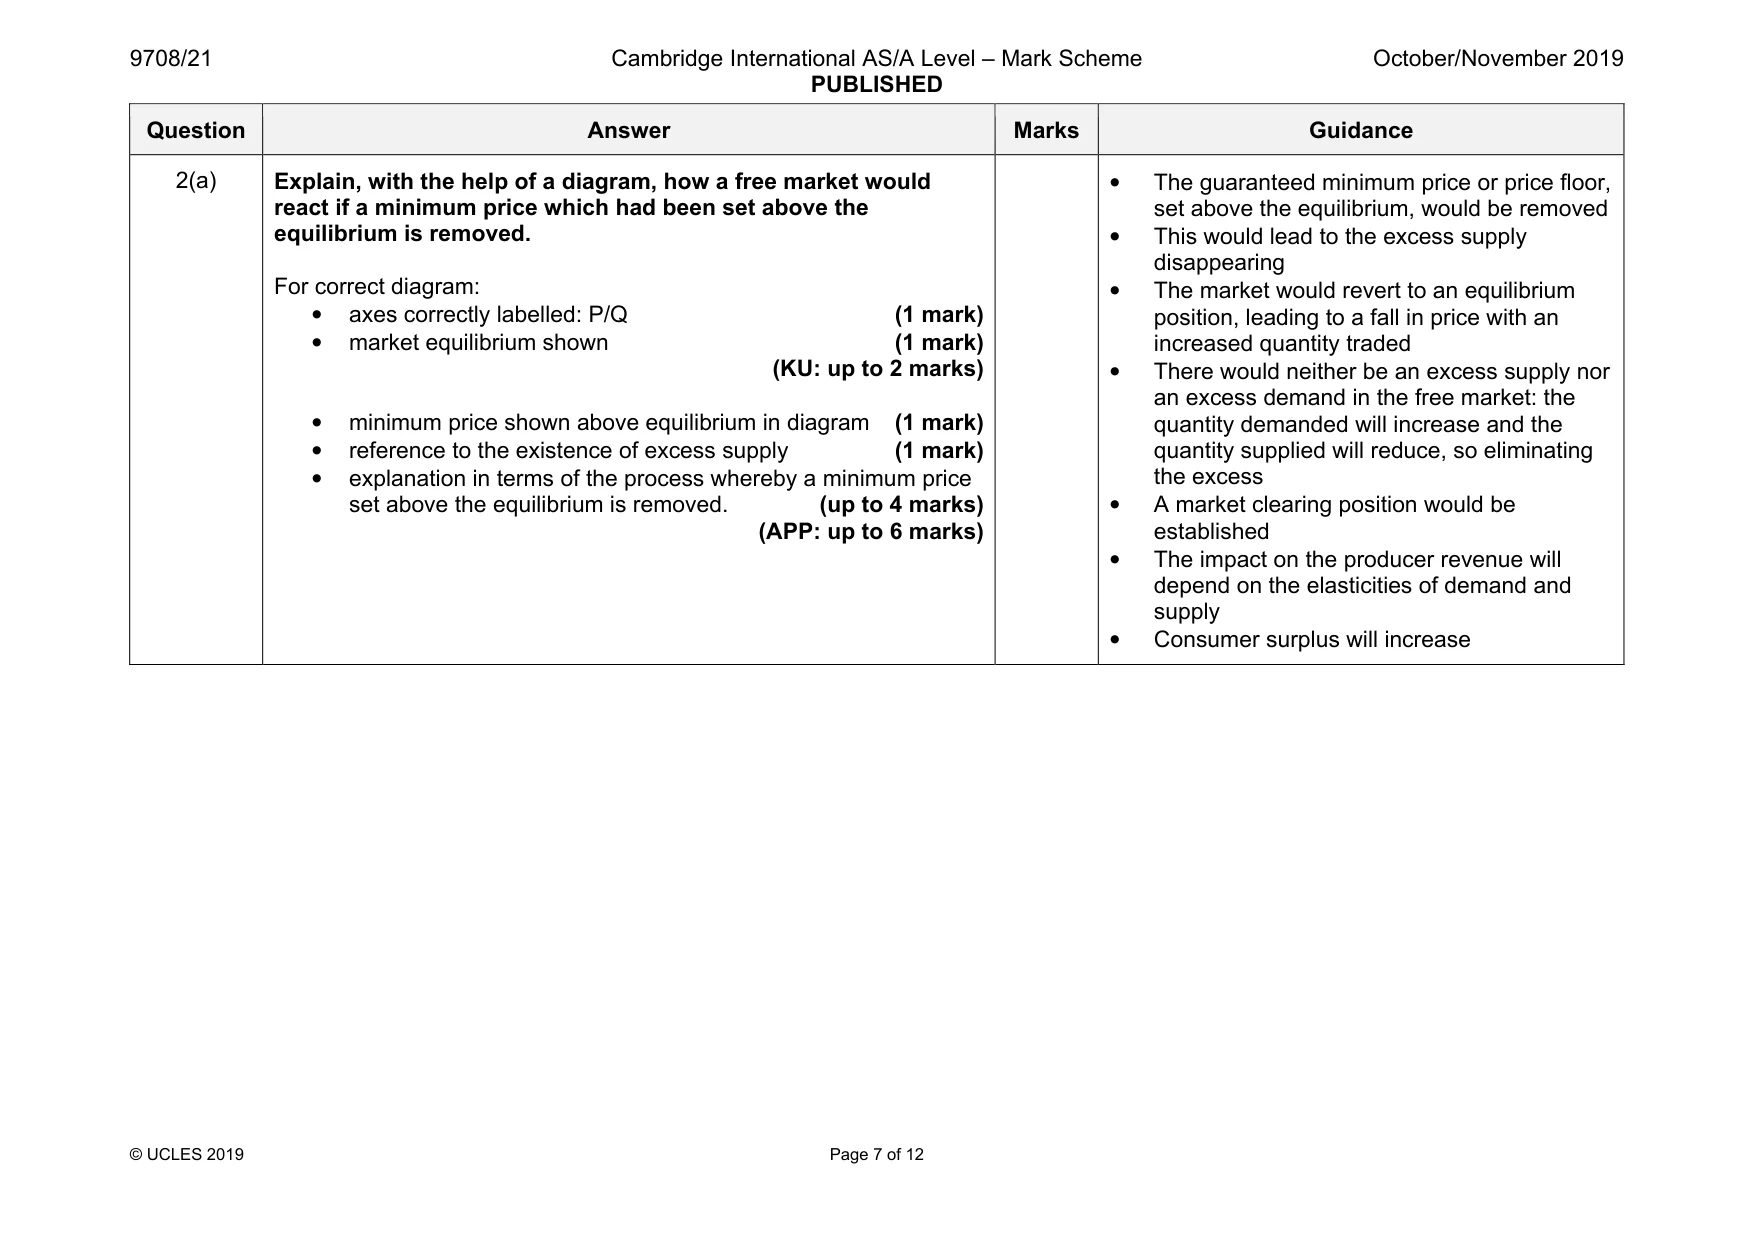
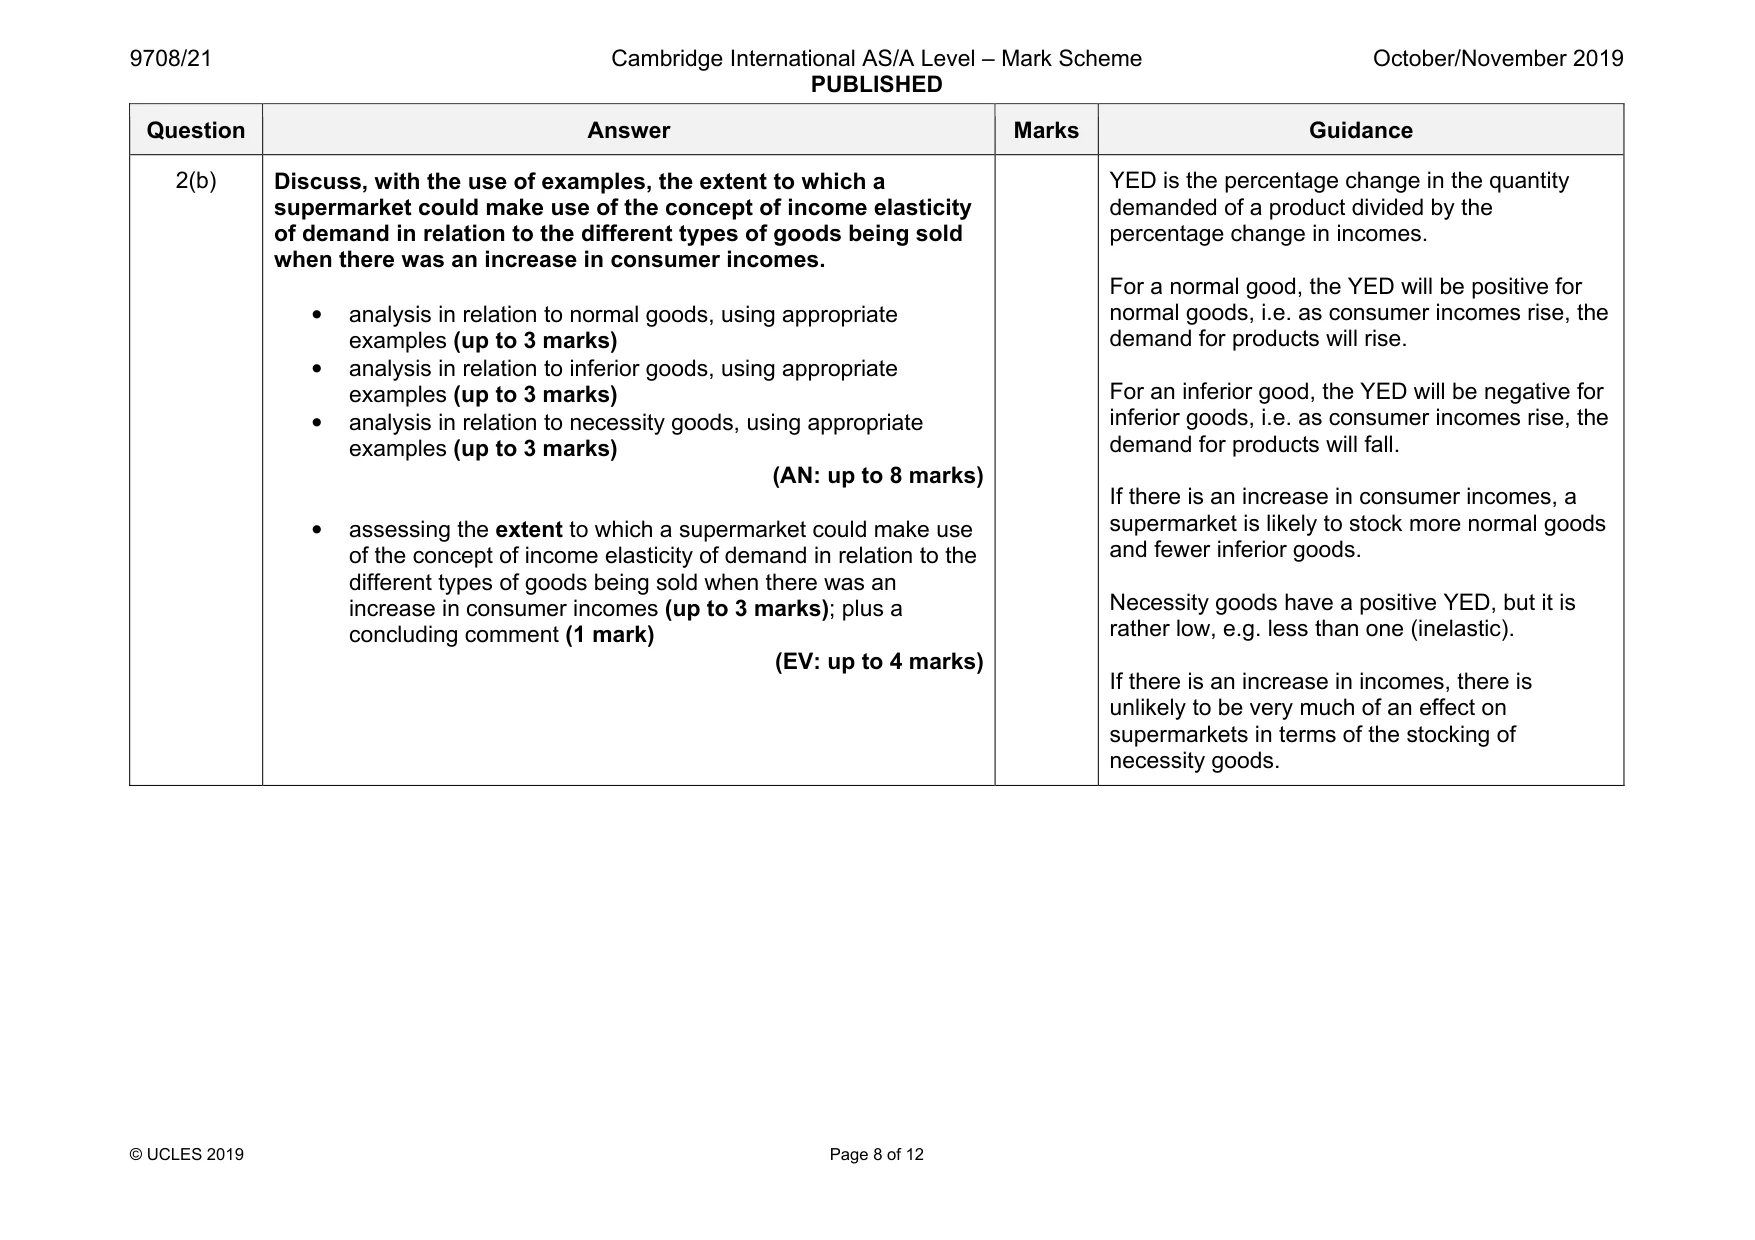
Mark scheme: 2(a) Explain, with the help of a diagram, how a free market would react if a minimum price which had been set above the equilibrium is removed. For correct diagram: • axes correctly labelled: P/Q (1 mark) • market equilibrium shown (1 mark) (KU: up to 2 marks) • minimum price shown above equilibrium in diagram (1 mark) • reference to the existence of excess supply (1 mark) • explanation in terms of the process whereby a minimum price set above the equilibrium is removed. (up to 4 marks) (APP: up to 6 marks) The guaranteed minimum price or price floor, set above the equilibrium, would be removed • This would lead to the excess supply disappearing • The market would revert to an equilibrium position, leading to a fall in price with an increased quantity traded • There would neither be an excess supply nor an excess demand in the free market: the quantity demanded will increase and the quantity supplied will reduce, so eliminating the excess • A market clearing position would be established • The impact on the producer revenue will depend on the elasticities of demand and supply • Consumer surplus will increase Question Answer Marks Guidance 2(b) Discuss, with the use of examples, the extent to which a supermarket could make use of the concept of income elasticity of demand in relation to the different types of goods being sold when there was an increase in consumer incomes. • analysis in relation to normal goods, using appropriate examples (up to 3 marks) • analysis in relation to inferior goods, using appropriate examples (up to 3 marks) • analysis in relation to necessity goods, using appropriate examples (up to 3 marks) (AN: up to 8 marks) • assessing the extent to which a supermarket could make use of the concept of income elasticity of demand in relation to the different types of goods being sold when there was an increase in consumer incomes (up to 3 marks); plus a concluding comment (1 mark) (EV: up to 4 marks) YED is the percentage change in the quantity demanded of a product divided by the percentage change in incomes. For a normal good, the YED will be positive for normal goods, i.e. as consumer incomes rise, the demand for products will rise. For an inferior good, the YED will be negative for inferior goods, i.e. as consumer incomes rise, the demand for products will fall. If there is an increase in consumer incomes, a supermarket is likely to stock more normal goods and fewer inferior goods. Necessity goods have a positive YED, but it is rather low, e.g. less than one (inelastic). If there is an increase in incomes, there is unlikely to be very much of an effect on supermarkets in terms of the stocking of necessity goods.
More questions on Price elasticity, income elasticity and cross elasticity of demand
Q3 · Explain, with the help of a diagram, the effect and incidence of a subsidy in a market…
3 (a) Explain, with the help of a diagram, the effect and incidence of a subsidy in a market for essential transport. [8] (b) Discuss, with the use of examples, whether a government should directly provide certain goods and services in an economy. [12]
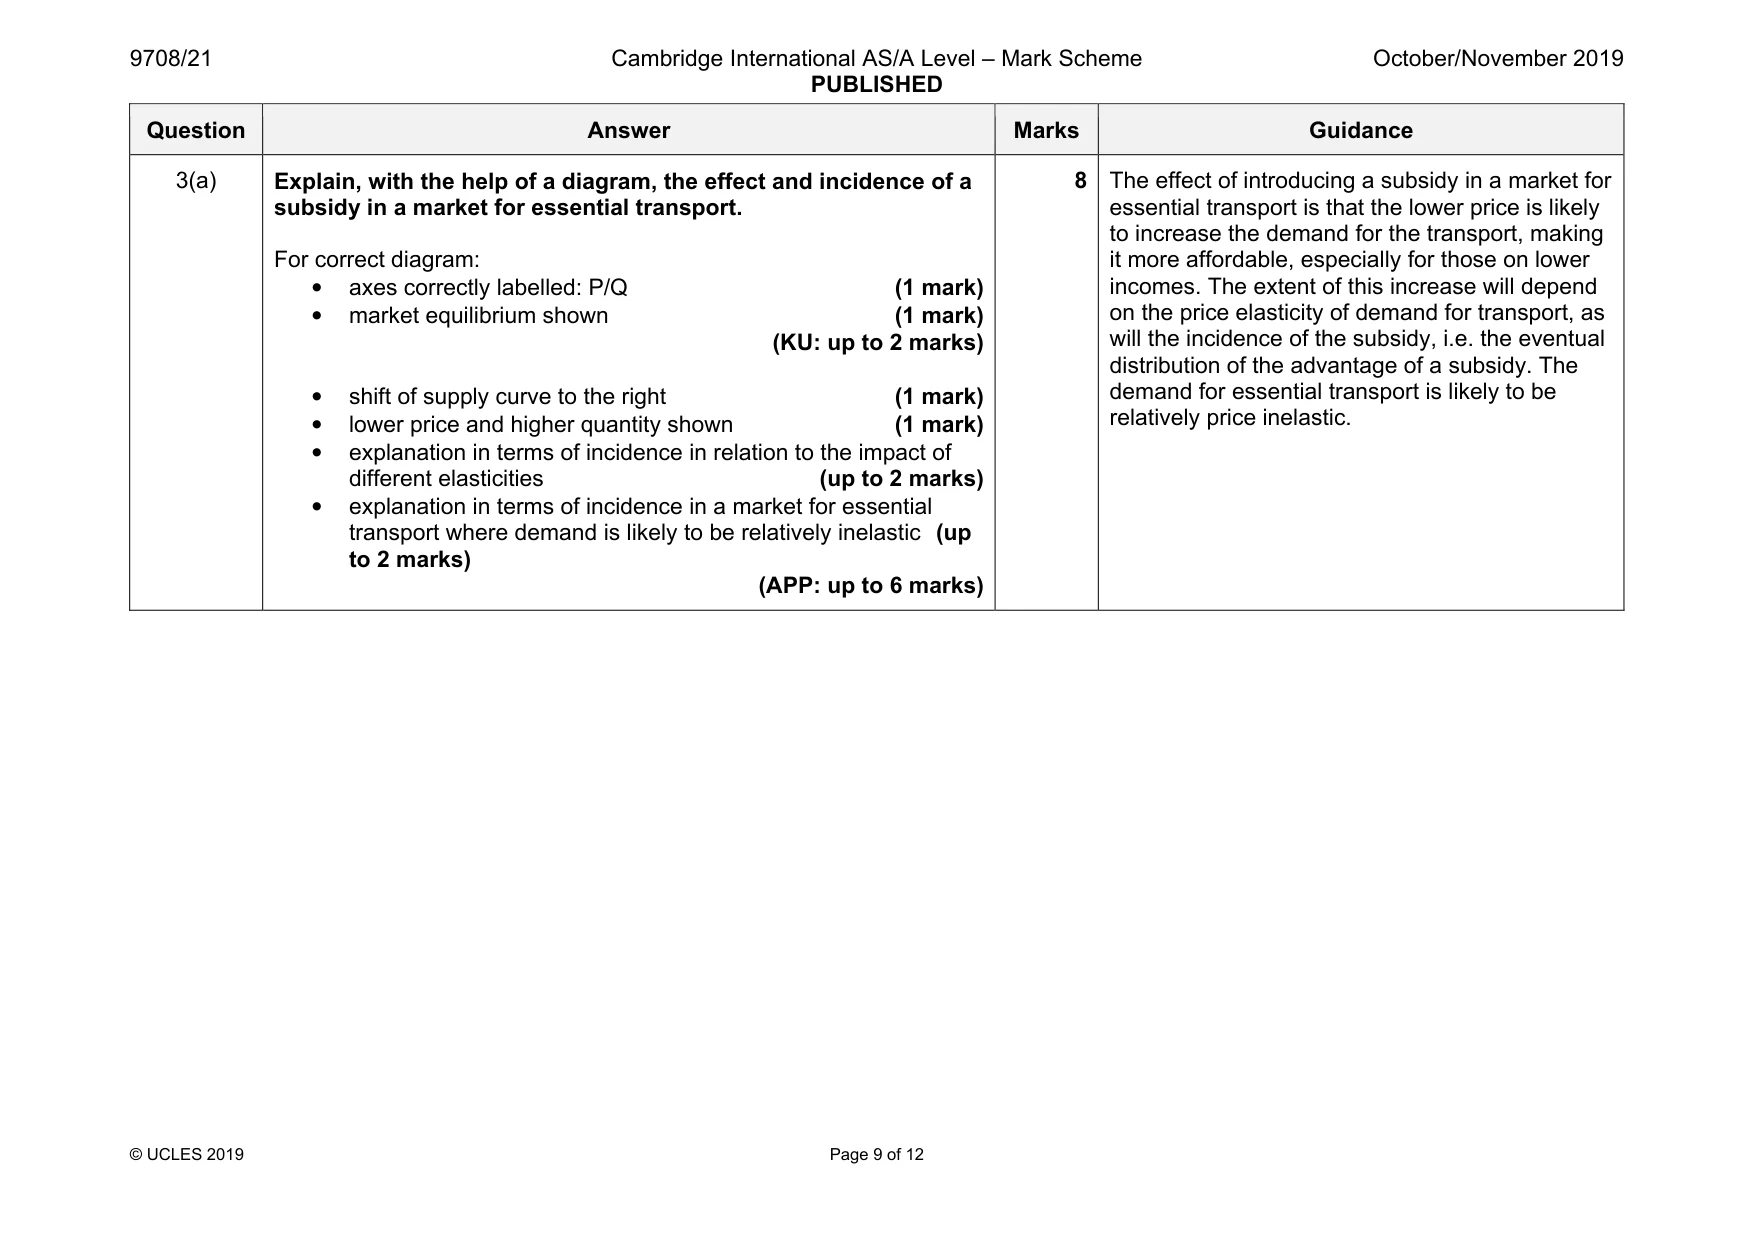
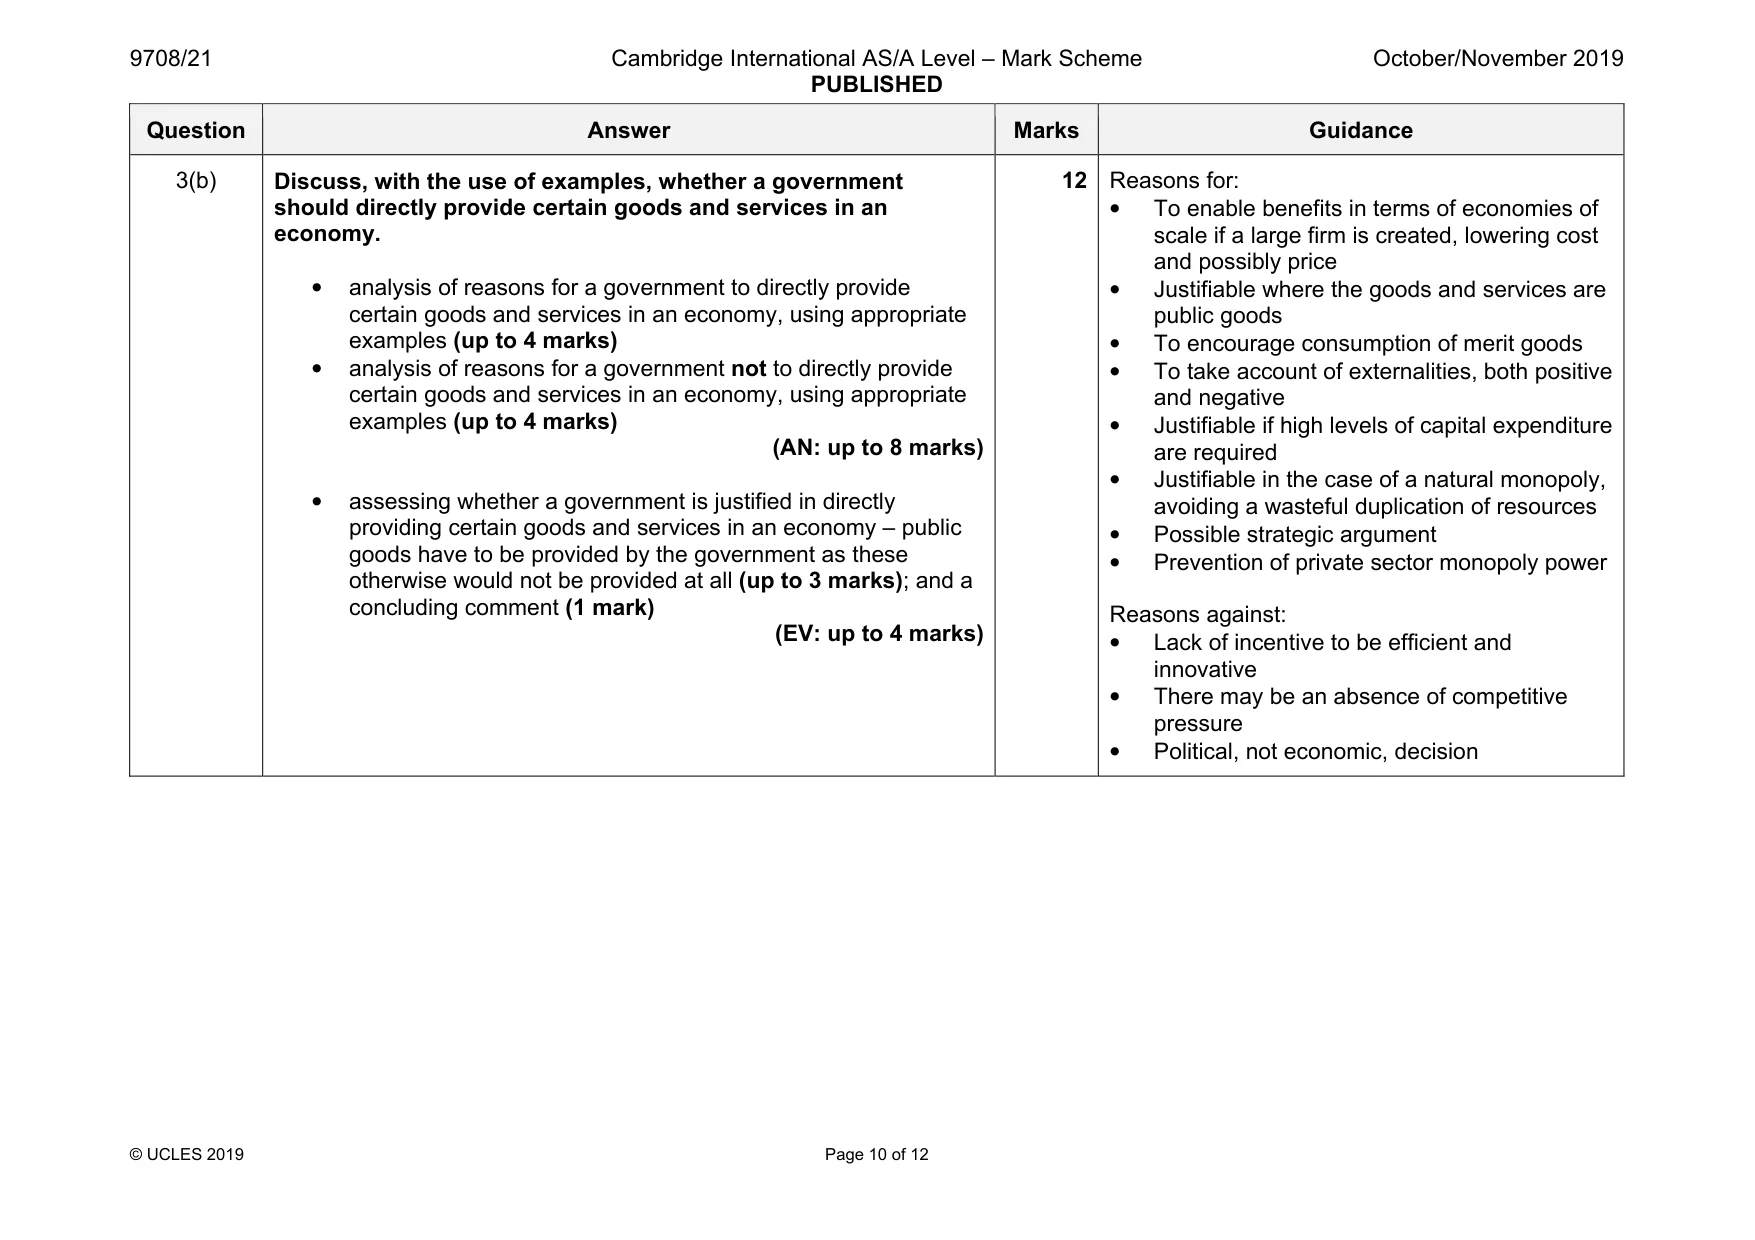
Mark scheme: 3(a) Explain, with the help of a diagram, the effect and incidence of a subsidy in a market for essential transport. For correct diagram: • axes correctly labelled: P/Q (1 mark) • market equilibrium shown (1 mark) (KU: up to 2 marks) • shift of supply curve to the right (1 mark) • lower price and higher quantity shown (1 mark) • explanation in terms of incidence in relation to the impact of different elasticities (up to 2 marks) • explanation in terms of incidence in a market for essential transport where demand is likely to be relatively inelastic (up to 2 marks) (APP: up to 6 marks) 8 essential transport is that the lower price is likely to increase the demand for the transport, making it more affordable, especially for those on lower incomes. The extent of this increase will depend on the price elasticity of demand for transport, as will the incidence of the subsidy, i.e. the eventual distribution of the advantage of a subsidy. The demand for essential transport is likely to be relatively price inelastic. Question Answer Marks Guidance 3(b) Discuss, with the use of examples, whether a government should directly provide certain goods and services in an economy. • analysis of reasons for a government to directly provide certain goods and services in an economy, using appropriate examples (up to 4 marks) • analysis of reasons for a government not to directly provide certain goods and services in an economy, using appropriate examples (up to 4 marks) (AN: up to 8 marks) • assessing whether a government is justified in directly providing certain goods and services in an economy – public goods have to be provided by the government as these otherwise would not be provided at all (up to 3 marks); and a concluding comment (1 mark) (EV: up to 4 marks) 12 Reasons for: • To enable benefits in terms of economies of scale if a large firm is created, lowering cost and possibly price • Justifiable where the goods and services are public goods • To encourage consumption of merit goods • To take account of externalities, both positive and negative • Justifiable if high levels of capital expenditure are required • Justifiable in the case of a natural monopoly, avoiding a wasteful duplication of resources • Possible strategic argument • Prevention of private sector monopoly power Reasons against: • Lack of incentive to be efficient and innovative • There may be an absence of competitive pressure • Political, not economic, decision
More questions on Resource allocation in different economic systems
Q4 · Explain, with the help of a diagram, the difference between what causes (i) a movement…
4 (a) Explain, with the help of a diagram, the difference between what causes (i) a movement along an aggregate supply curve and (ii) a shift in an aggregate supply curve. [8] (b) Discuss whether supply-side policies are likely to be effective in increasing employment in an economy. [12]
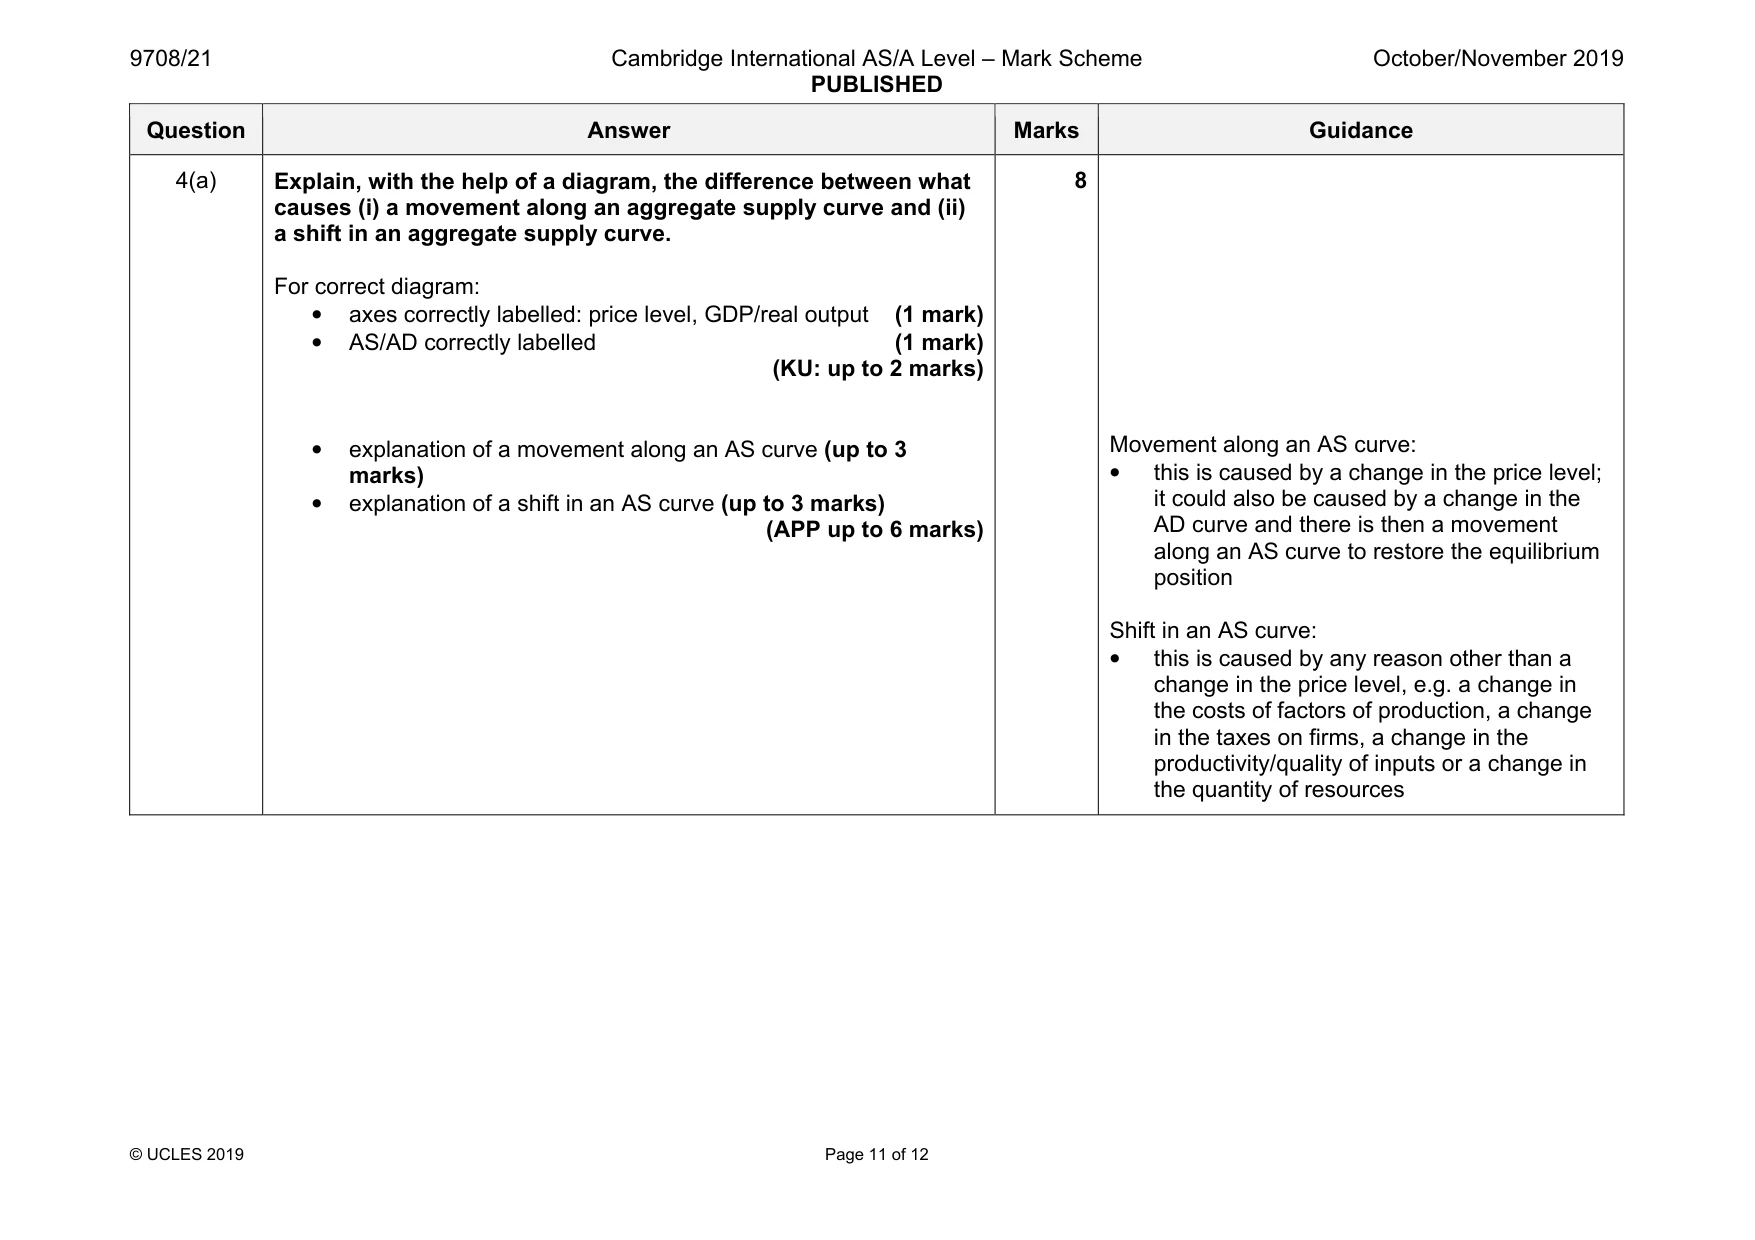
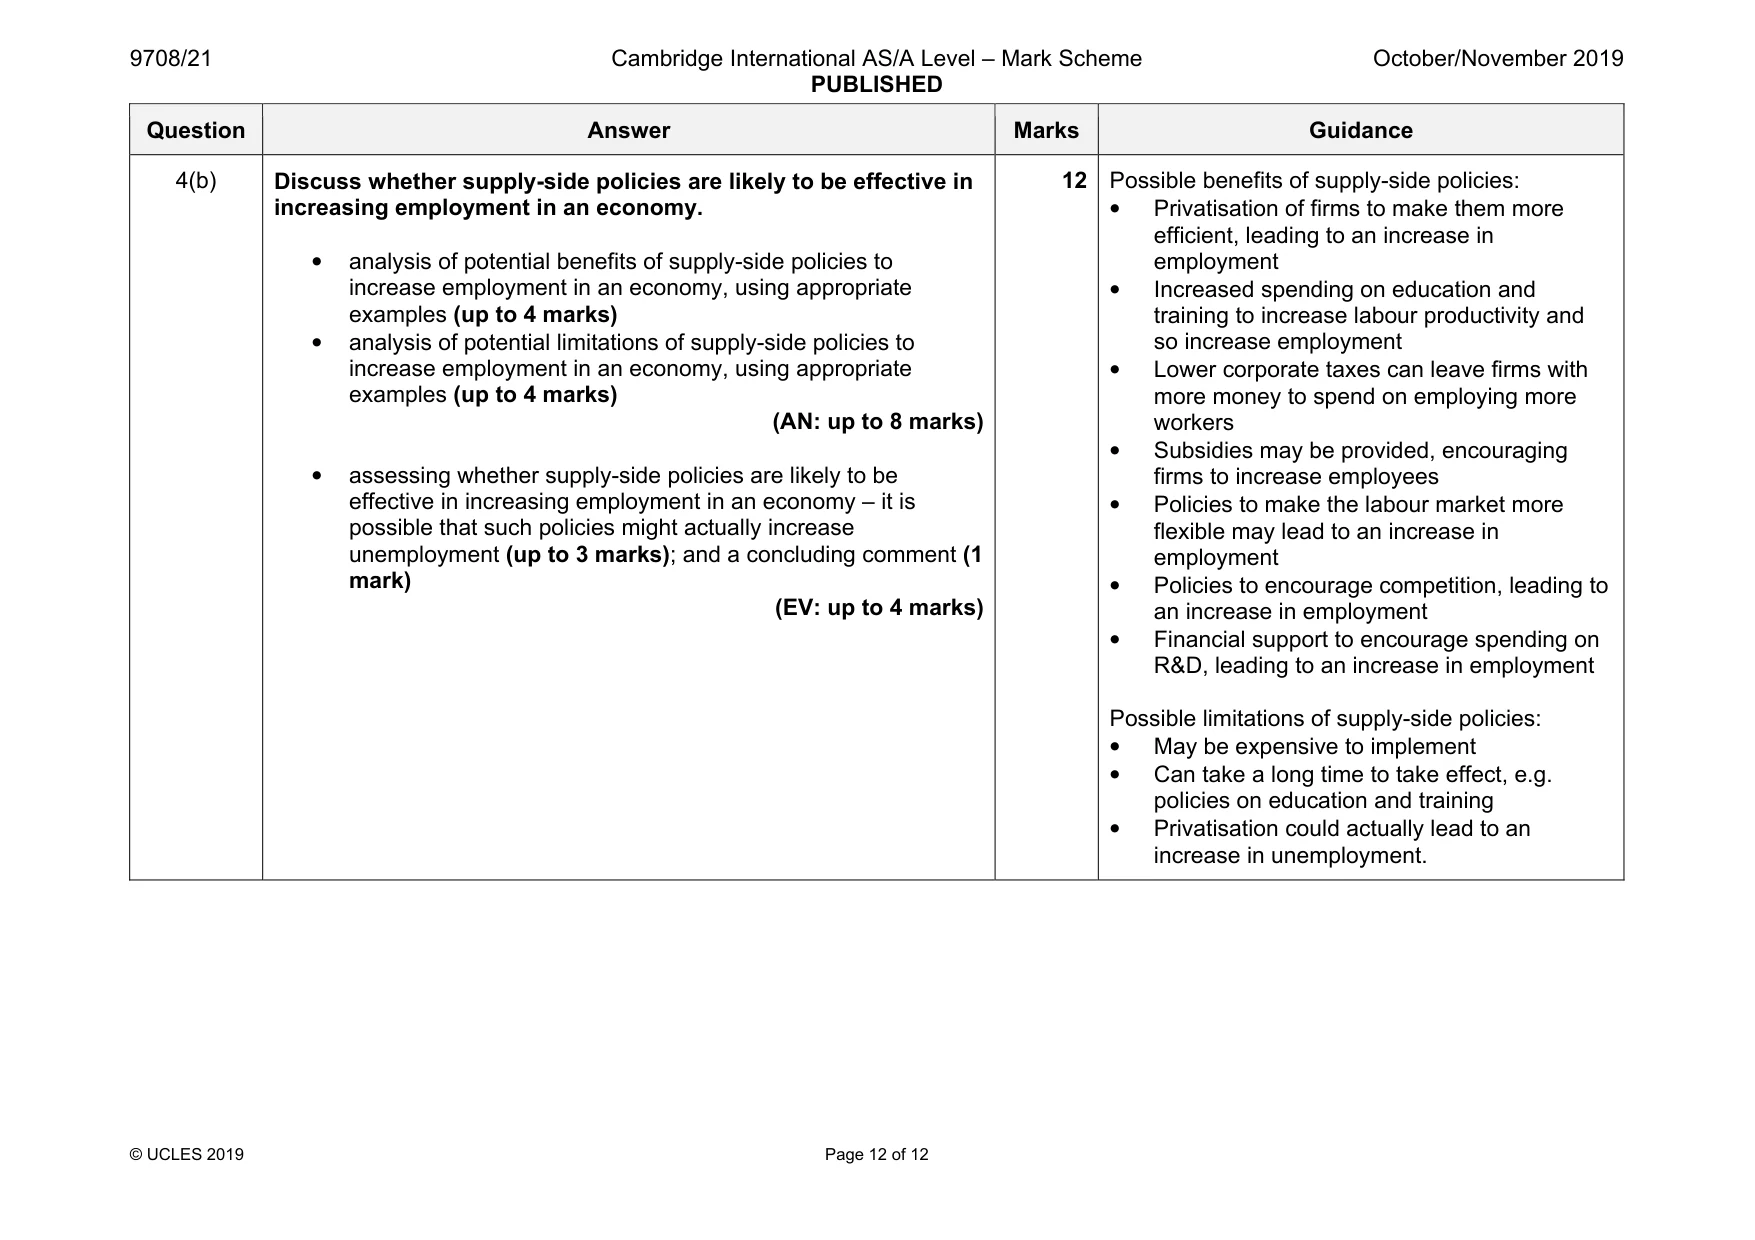
Mark scheme: 4(a) Explain, with the help of a diagram, the difference between what causes (i) a movement along an aggregate supply curve and (ii) a shift in an aggregate supply curve. For correct diagram: • axes correctly labelled: price level, GDP/real output (1 mark) • AS/AD correctly labelled (1 mark) (KU: up to 2 marks) • explanation of a movement along an AS curve (up to 3 marks) • explanation of a shift in an AS curve (up to 3 marks) (APP up to 6 marks) 8 Movement along an AS curve: • this is caused by a change in the price level; it could also be caused by a change in the AD curve and there is then a movement along an AS curve to restore the equilibrium position Shift in an AS curve: • this is caused by any reason other than a change in the price level, e.g. a change in the costs of factors of production, a change in the taxes on firms, a change in the productivity/quality of inputs or a change in the quantity of resources Question Answer Marks Guidance 4(b) Discuss whether supply-side policies are likely to be effective in increasing employment in an economy. • analysis of potential benefits of supply-side policies to increase employment in an economy, using appropriate examples (up to 4 marks) • analysis of potential limitations of supply-side policies to increase employment in an economy, using appropriate examples (up to 4 marks) (AN: up to 8 marks) • assessing whether supply-side policies are likely to be effective in increasing employment in an economy – it is possible that such policies might actually increase unemployment (up to 3 marks); and a concluding comment (1 mark) (EV: up to 4 marks) 12 Possible benefits of supply-side policies: • Privatisation of firms to make them more efficient, leading to an increase in employment • Increased spending on education and training to increase labour productivity and so increase employment • Lower corporate taxes can leave firms with more money to spend on employing more workers • Subsidies may be provided, encouraging firms to increase employees • Policies to make the labour market more flexible may lead to an increase in employment • Policies to encourage competition, leading to an increase in employment • Financial support to encourage spending on R&D, leading to an increase in employment Possible limitations of supply-side policies: • May be expensive to implement • Can take a long time to take effect, e.g. policies on education and training • Privatisation could actually lead to an increase in unemployment.
What was in this paper
The subtopics covered by these 4 questions, and how many questions each got. Open one in a new tab to see every Cambridge question on it.
What you needed in this session
Cambridge’s own grade thresholds for 2019 Oct/Nov, Paper 2 · Variant 1. A higher threshold means an easier paper — the bar moves with how the cohort did.