Cambridge A Level Economics 9708 — 2019 Feb/March Paper 4 · Variant 2
9708/42/F/M/19 · 7 questions · 70 marks · ≈79 min
The question paper and its mark scheme, free to read here and free to download. This is Cambridge’s own paper, exactly as it was sat.
Question paper4 pages
Mark scheme11 pages
Answers below. Sit the paper first if you are practising.




Questions as text
Q1 · Downturn in the growth of the world’s leading economies In February 2016 there were…
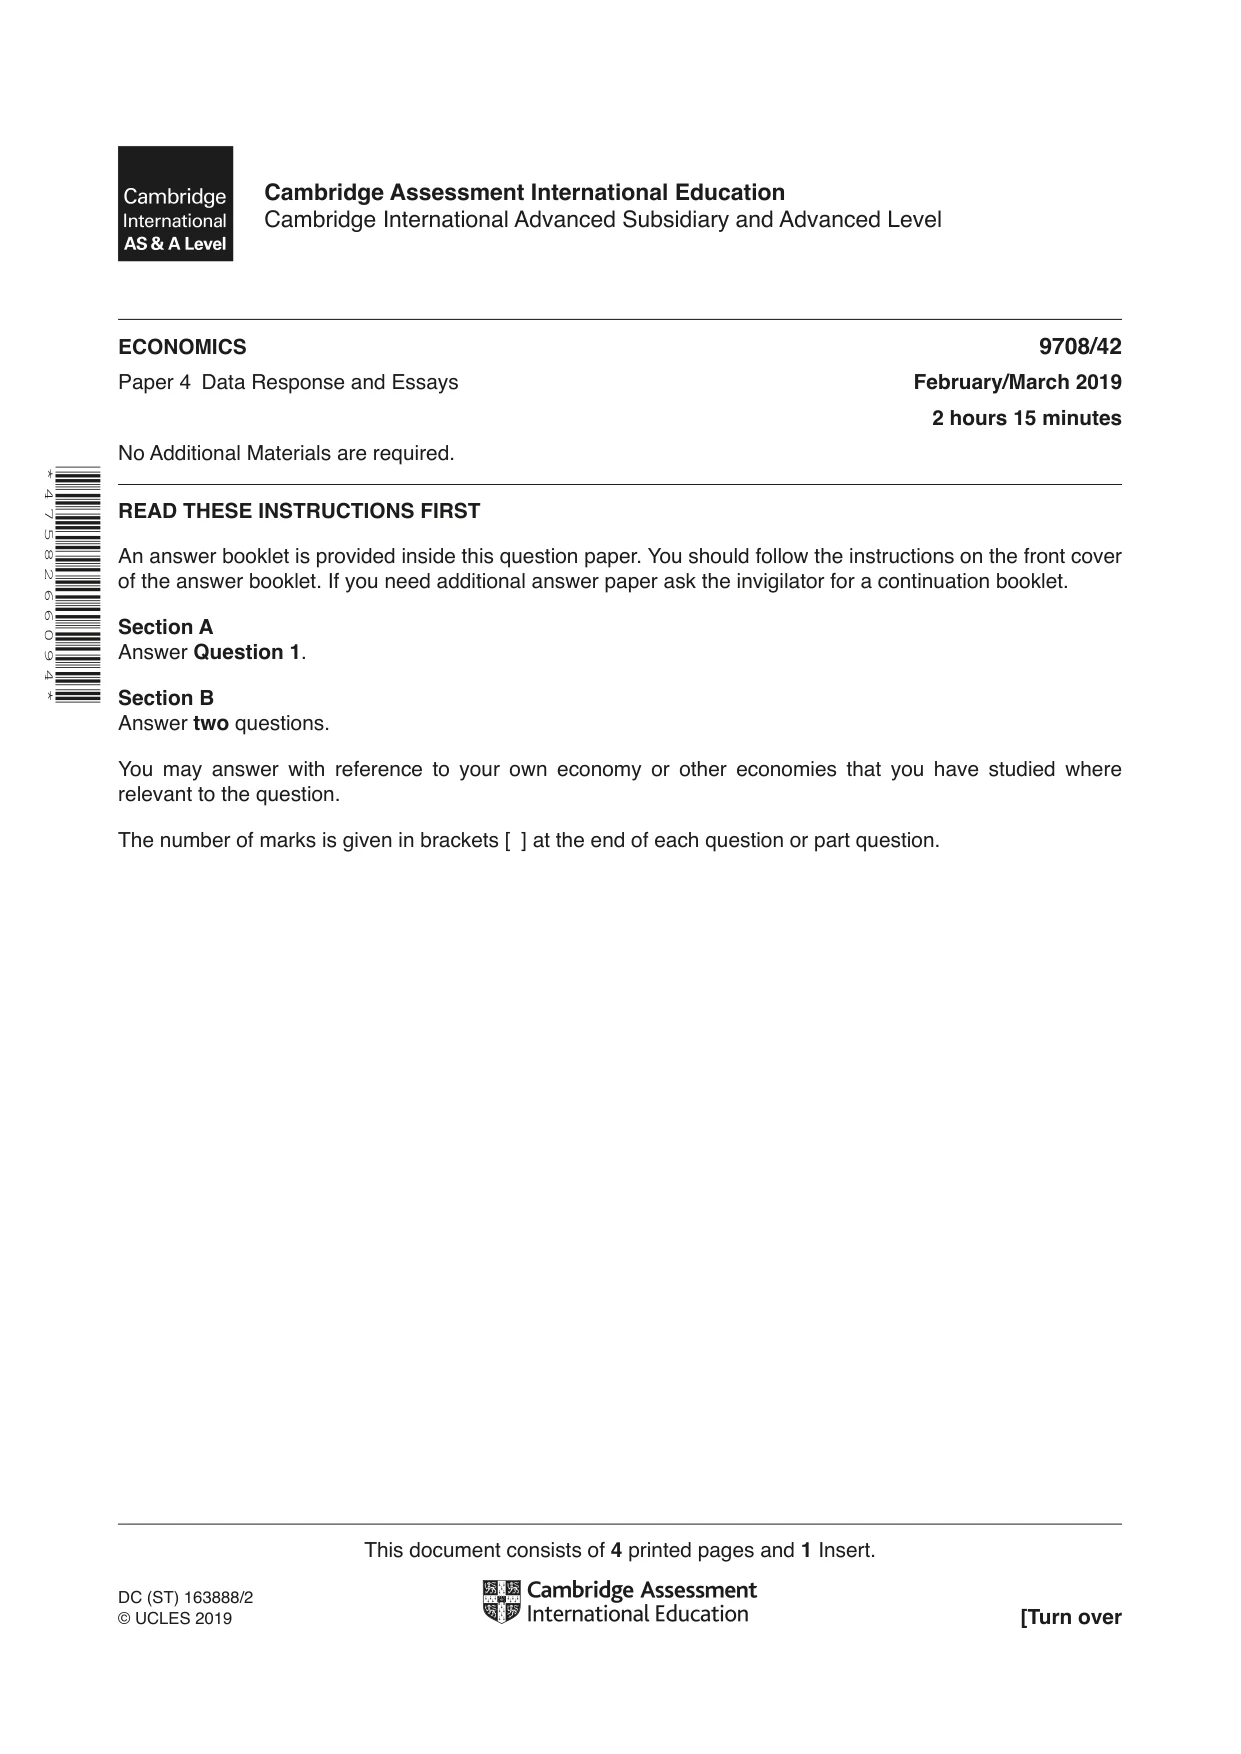
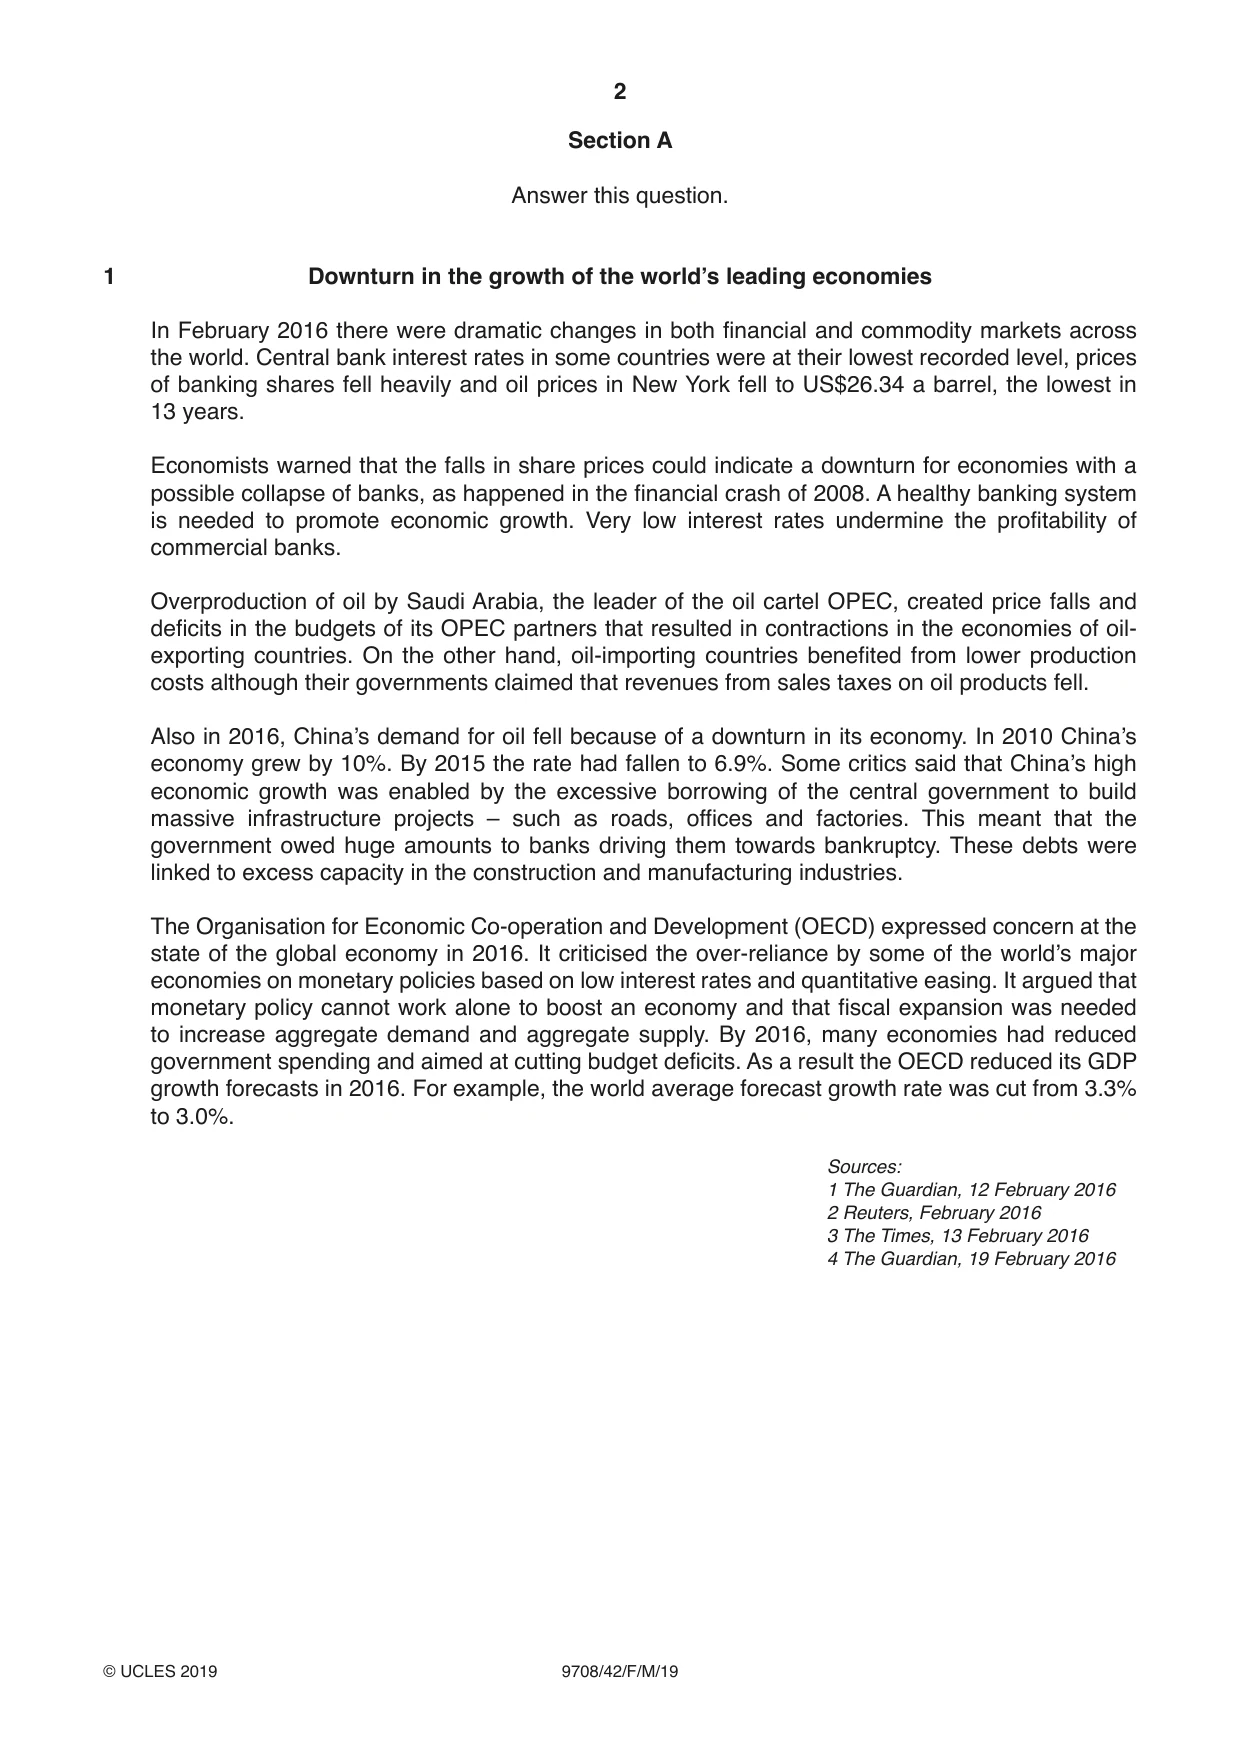
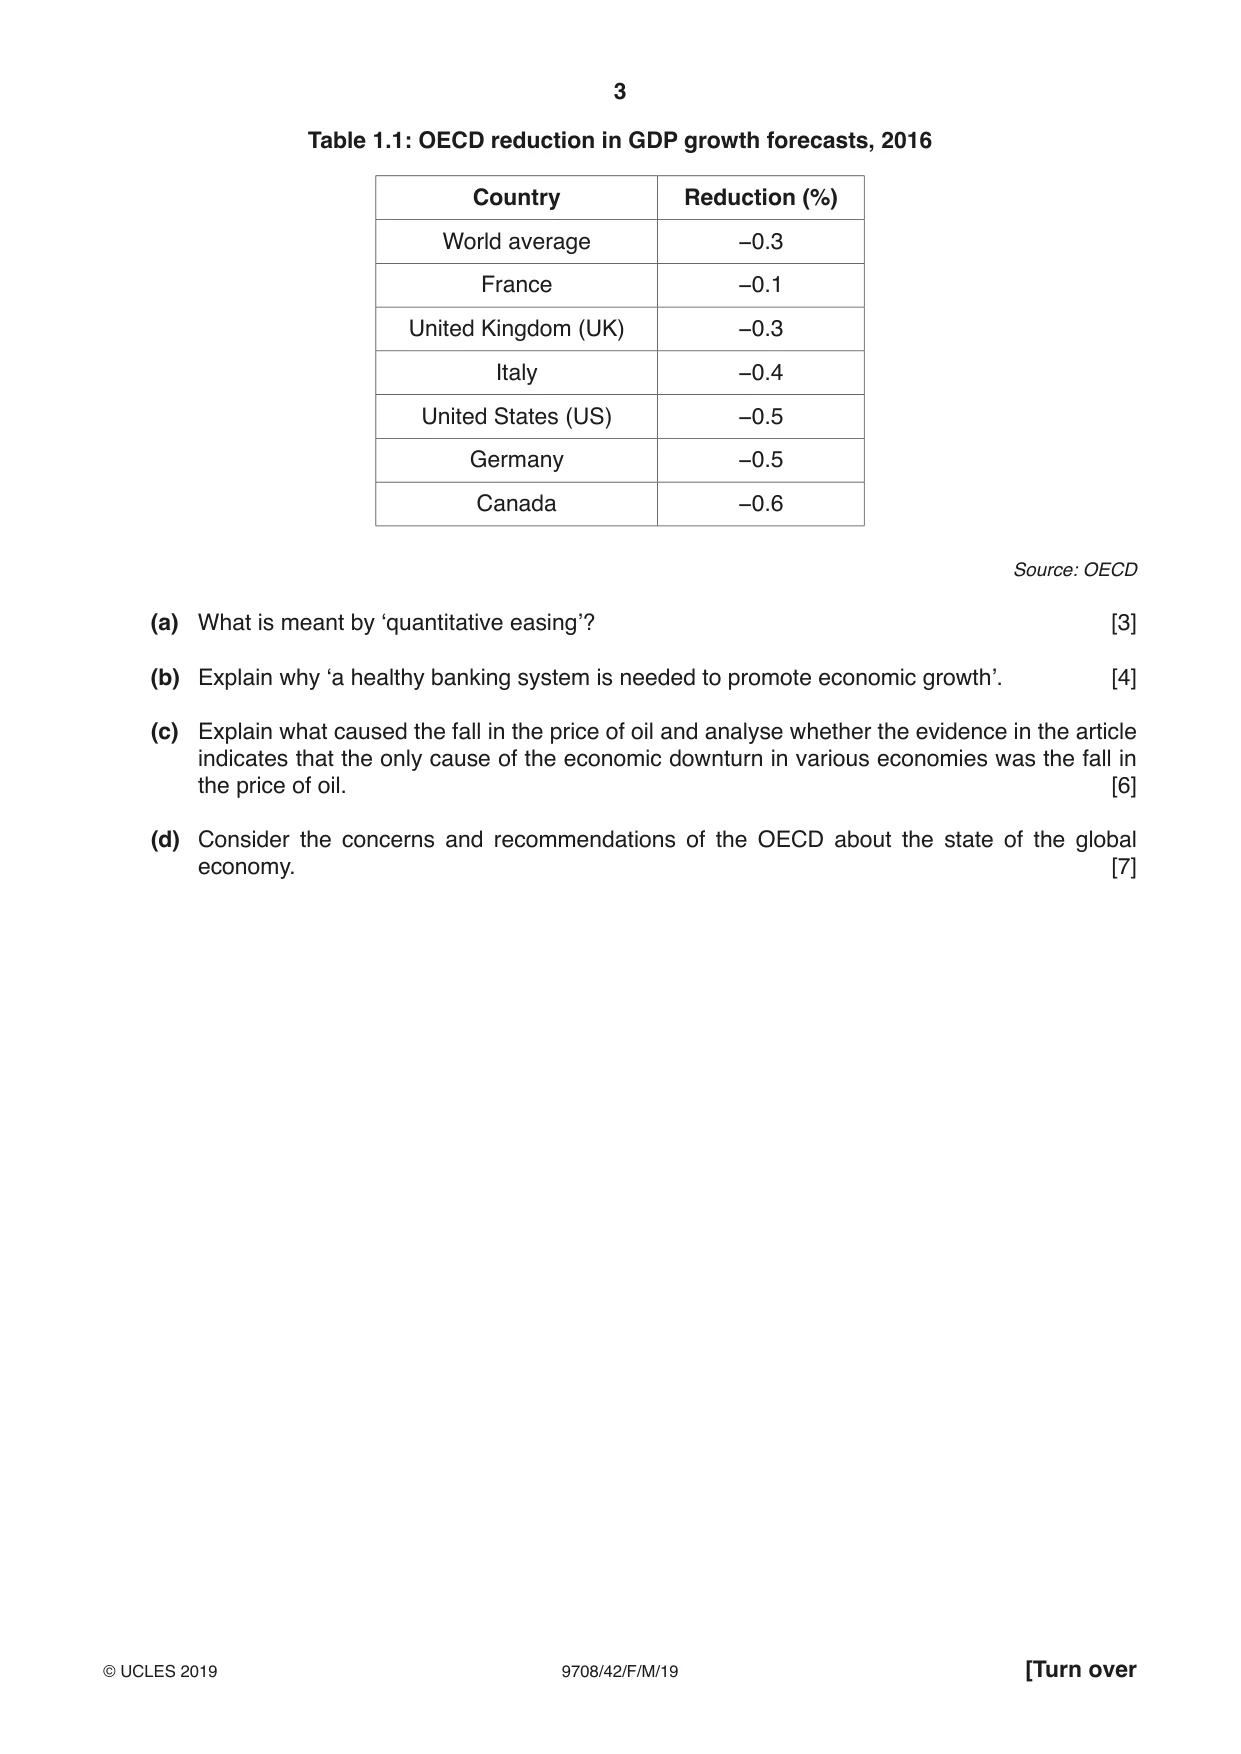
1 Downturn in the growth of the world’s leading economies In February 2016 there were dramatic changes in both financial and commodity markets across the world. Central bank interest rates in some countries were at their lowest recorded level, prices of banking shares fell heavily and oil prices in New York fell to US$26.34 a barrel, the lowest in 13 years. Economists warned that the falls in share prices could indicate a downturn for economies with a possible collapse of banks, as happened in the financial crash of 2008. A healthy banking system is needed to promote economic growth. Very low interest rates undermine the profitability of commercial banks. Overproduction of oil by Saudi Arabia, the leader of the oil cartel OPEC, created price falls and deficits in the budgets of its OPEC partners that resulted in contractions in the economies of oil- exporting countries. On the other hand, oil-importing countries benefited from lower production costs although their governments claimed that revenues from sales taxes on oil products fell. Also in 2016, China’s demand for oil fell because of a downturn in its economy. In 2010 China’s economy grew by 10%. By 2015 the rate had fallen to 6.9%. Some critics said that China’s high economic growth was enabled by the excessive borrowing of the central government to build massive infrastructure projects – such as roads, offices and factories. This meant that the government owed huge amounts to banks driving them towards bankruptcy. These debts were linked to excess capacity in the construction and manufacturing industries. The Organisation for Economic Co-operation and Development (OECD) expressed concern at the state of the global economy in 2016. It criticised the over-reliance by some of the world’s major economies on monetary policies based on low interest rates and quantitative easing. It argued that monetary policy cannot work alone to boost an economy and that fiscal expansion was needed to increase aggregate demand and aggregate supply. By 2016, many economies had reduced government spending and aimed at cutting budget deficits. As a result the OECD reduced its GDP growth forecasts in 2016. For example, the world average forecast growth rate was cut from 3.3% to 3.0%. Sources: 1 The Guardian, 12 February 2016 2 Reuters, February 2016 3 The Times, 13 February 2016 4 The Guardian, 19 February 2016 Table 1.1: OECD reduction in GDP growth forecasts, 2016 Country Reduction (%) World average −0.3 France −0.1 United Kingdom (UK) −0.3 Italy −0.4 United States (US) −0.5 Germany −0.5 Canada −0.6 Source: OECD (a) What is meant by ‘quantitative easing’? [3] (b) Explain why ‘a healthy banking system is needed to promote economic growth’. [4] (c) Explain what caused the fall in the price of oil and analyse whether the evidence in the article indicates that the only cause of the economic downturn in various economies was the fall in the price of oil. [6] (d) Consider the concerns and recommendations of the OECD about the state of the global economy. [7]
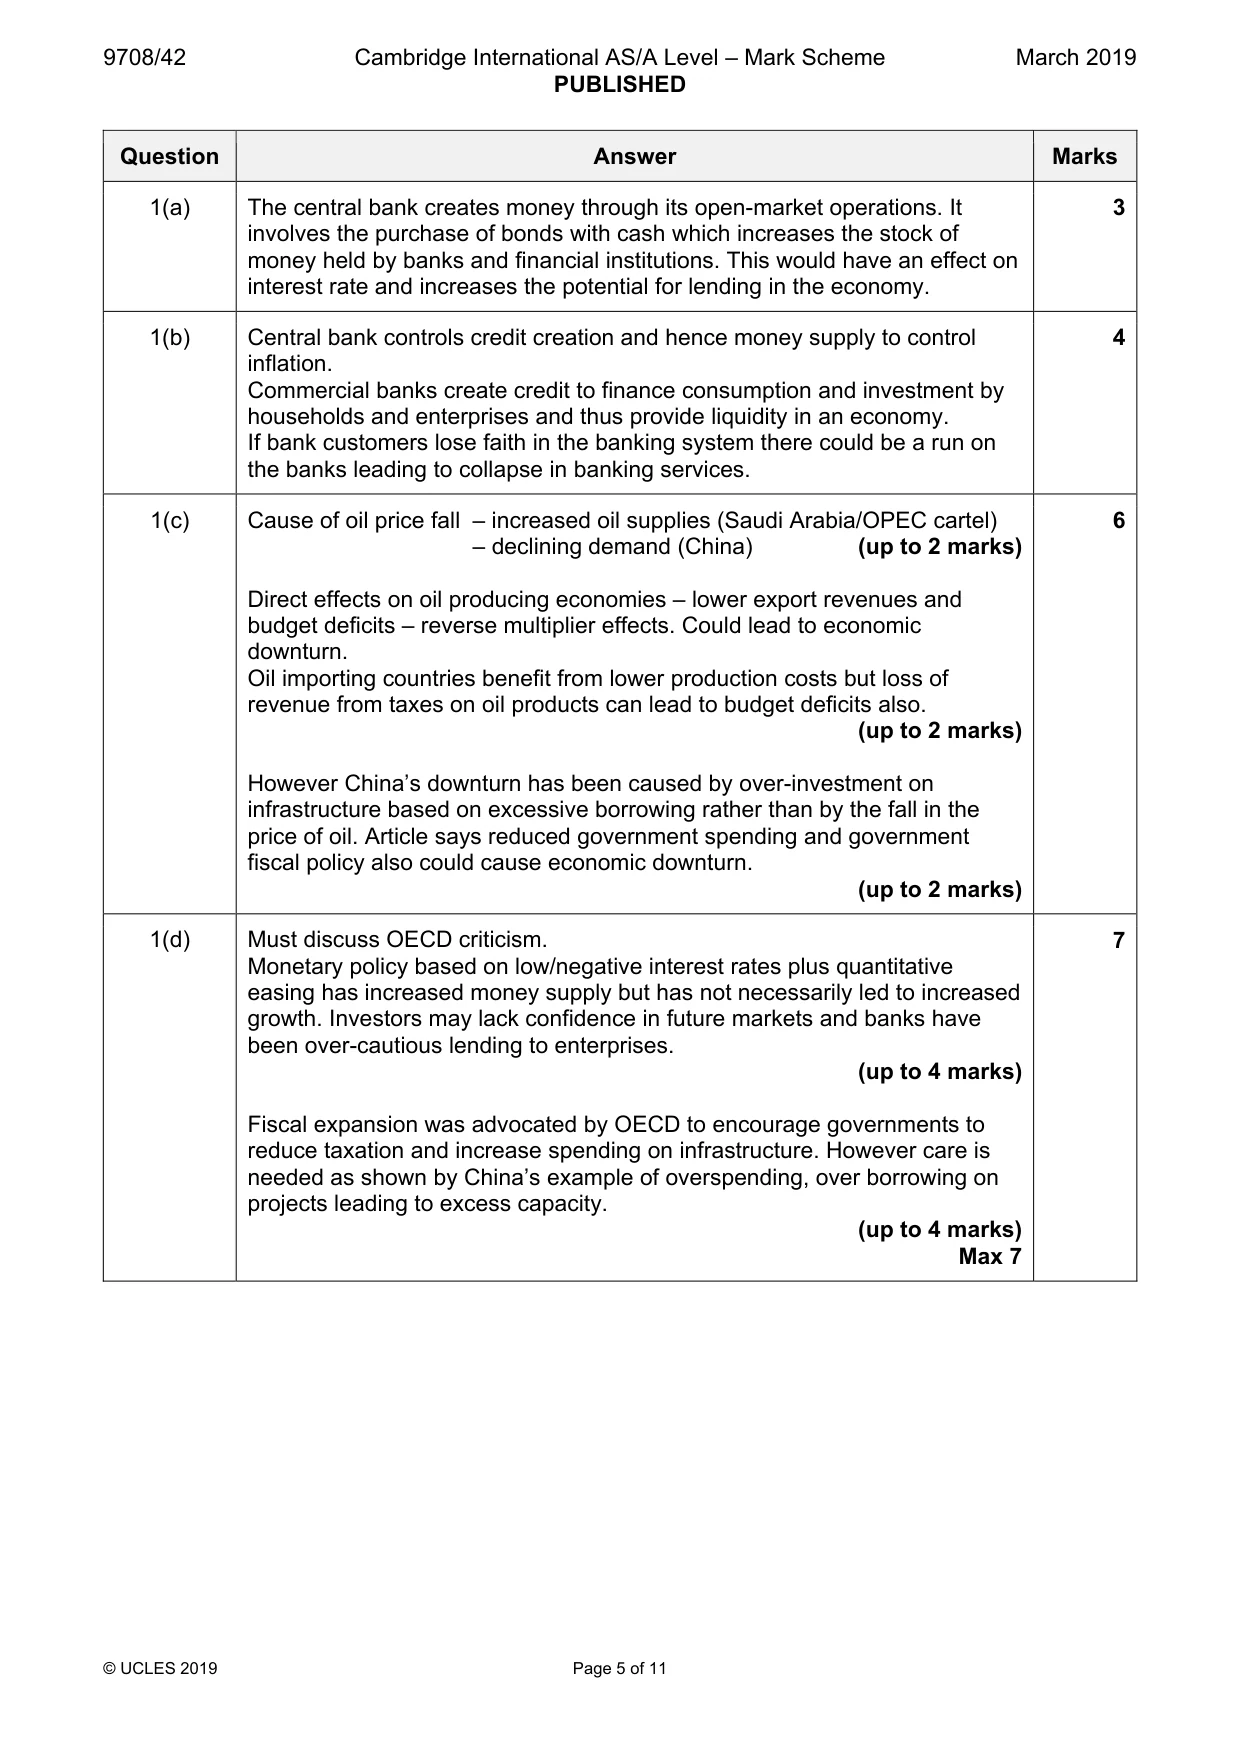
Mark scheme: Question Answer Marks 1(a) The central bank creates money through its open-market operations. It 3 involves the purchase of bonds with cash which increases the stock of money held by banks and financial institutions. This would have an effect on interest rate and increases the potential for lending in the economy. 1(b) Central bank controls credit creation and hence money supply to control 4 inflation. Commercial banks create credit to finance consumption and investment by households and enterprises and thus provide liquidity in an economy. If bank customers lose faith in the banking system there could be a run on the banks leading to collapse in banking services. 1(c) Cause of oil price fall – increased oil supplies (Saudi Arabia/OPEC cartel) 6 – declining demand (China) (up to 2 marks) Direct effects on oil producing economies – lower export revenues and budget deficits – reverse multiplier effects. Could lead to economic downturn. Oil importing countries benefit from lower production costs but loss of revenue from taxes on oil products can lead to budget deficits also. (up to 2 marks) However China’s downturn has been caused by over-investment on infrastructure based on excessive borrowing rather than by the fall in the price of oil. Article says reduced government spending and government fiscal policy also could cause economic downturn. (up to 2 marks) 1(d) Must discuss OECD criticism. 7 Monetary policy based on low/negative interest rates plus quantitative easing has increased money supply but has not necessarily led to increased growth. Investors may lack confidence in future markets and banks have been over-cautious lending to enterprises. (up to 4 marks) Fiscal expansion was advocated by OECD to encourage governments to reduce taxation and increase spending on infrastructure. However care is needed as shown by China’s example of overspending, over borrowing on projects leading to excess capacity. (up to 4 marks) Max 7
Q2 · ‘Governments should use whatever methods they can to regulate monopolies because they are…
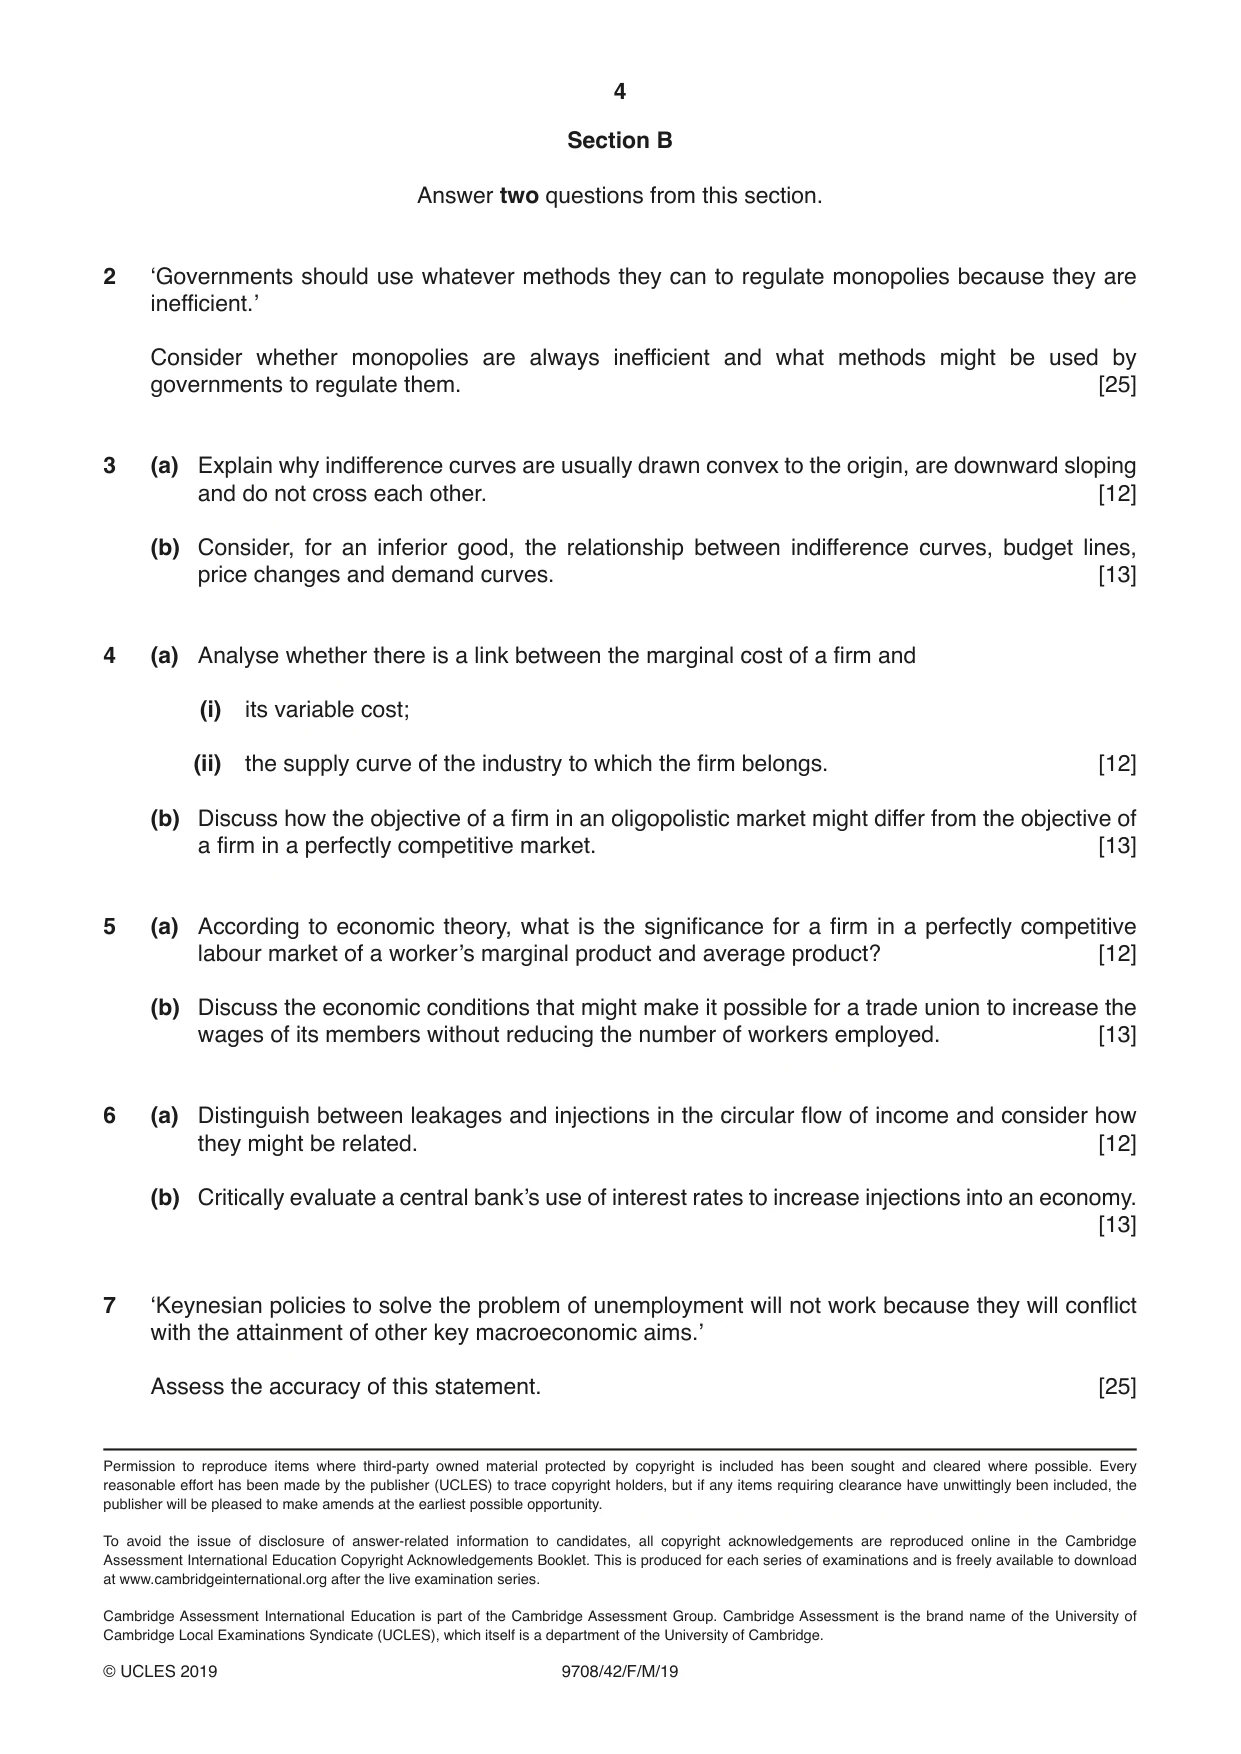
2 ‘Governments should use whatever methods they can to regulate monopolies because they are inefficient.’ Consider whether monopolies are always inefficient and what methods might be used by governments to regulate them. [25]
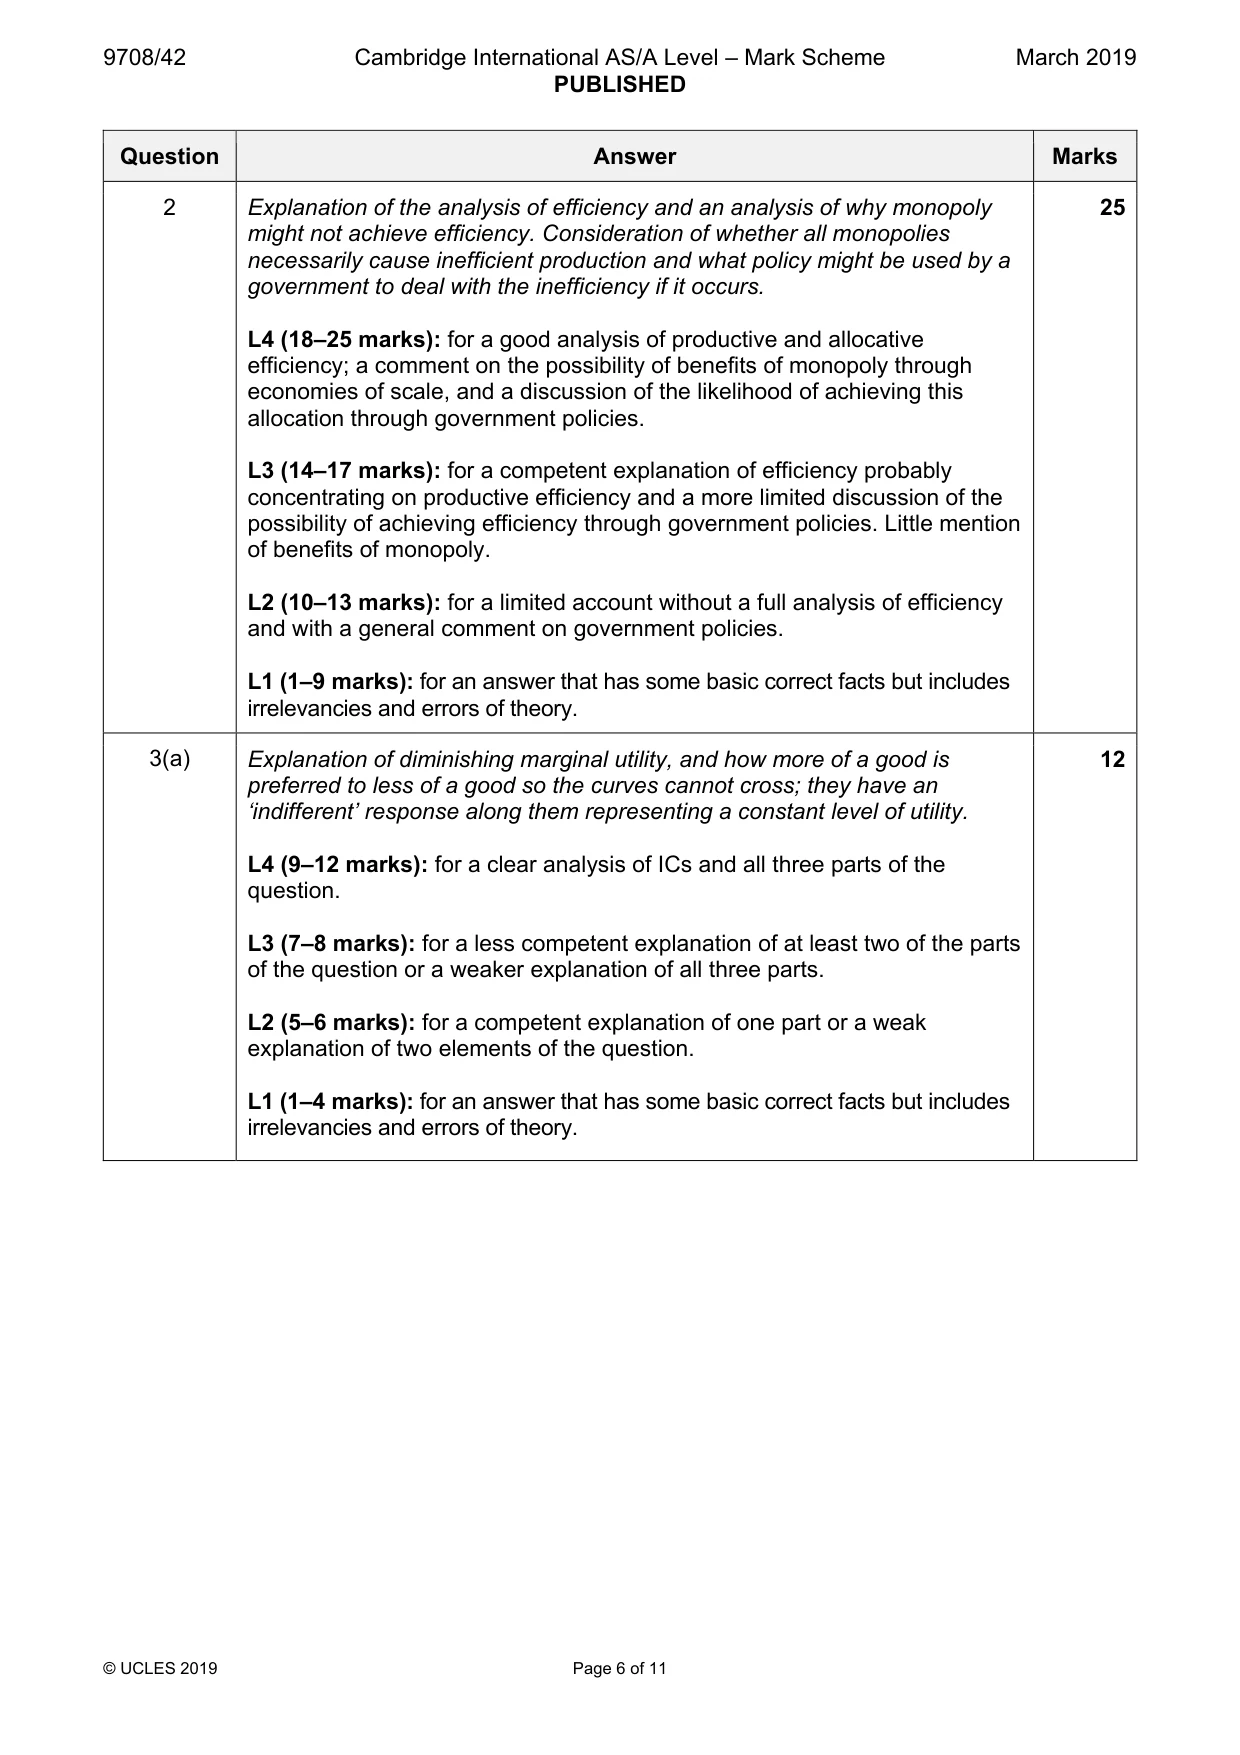
Mark scheme: 2 Explanation of the analysis of efficiency and an analysis of why monopoly 25 might not achieve efficiency. Consideration of whether all monopolies necessarily cause inefficient production and what policy might be used by a government to deal with the inefficiency if it occurs. L4 (18–25 marks): for a good analysis of productive and allocative efficiency; a comment on the possibility of benefits of monopoly through economies of scale, and a discussion of the likelihood of achieving this allocation through government policies. L3 (14–17 marks): for a competent explanation of efficiency probably concentrating on productive efficiency and a more limited discussion of the possibility of achieving efficiency through government policies. Little mention of benefits of monopoly. L2 (10–13 marks): for a limited account without a full analysis of efficiency and with a general comment on government policies. L1 (1–9 marks): for an answer that has some basic correct facts but includes irrelevancies and errors of theory.
Q3 · Explain why indifference curves are usually drawn convex to the origin, are downward…
3 (a) Explain why indifference curves are usually drawn convex to the origin, are downward sloping and do not cross each other. [12] (b) Consider, for an inferior good, the relationship between indifference curves, budget lines, price changes and demand curves. [13]
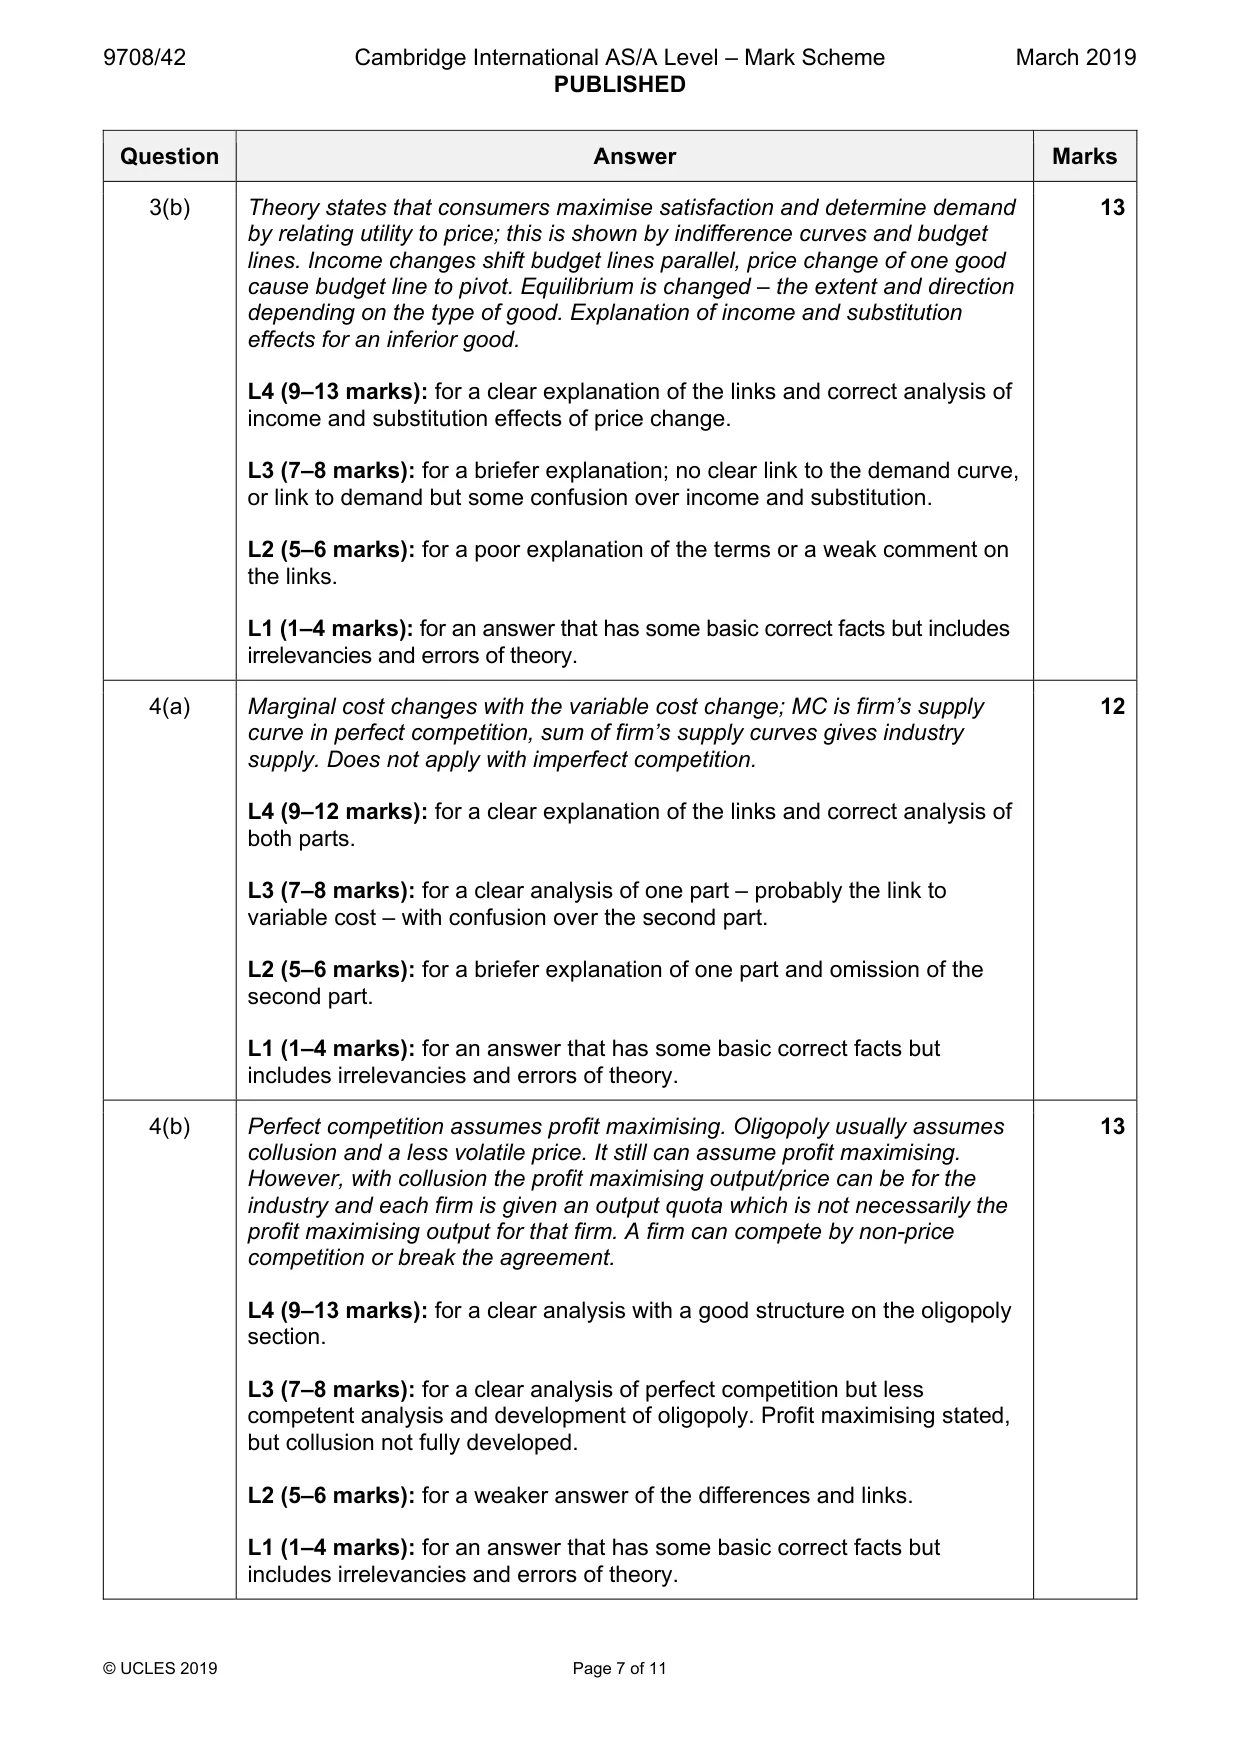
Mark scheme: 3(a) Explanation of diminishing marginal utility, and how more of a good is 12 preferred to less of a good so the curves cannot cross; they have an ‘indifferent’ response along them representing a constant level of utility. L4 (9–12 marks): for a clear analysis of ICs and all three parts of the question. L3 (7–8 marks): for a less competent explanation of at least two of the parts of the question or a weaker explanation of all three parts. L2 (5–6 marks): for a competent explanation of one part or a weak explanation of two elements of the question. L1 (1–4 marks): for an answer that has some basic correct facts but includes irrelevancies and errors of theory. 3(b) Theory states that consumers maximise satisfaction and determine demand 13 by relating utility to price; this is shown by indifference curves and budget lines. Income changes shift budget lines parallel, price change of one good cause budget line to pivot. Equilibrium is changed – the extent and direction depending on the type of good. Explanation of income and substitution effects for an inferior good. L4 (9–13 marks): for a clear explanation of the links and correct analysis of income and substitution effects of price change. L3 (7–8 marks): for a briefer explanation; no clear link to the demand curve, or link to demand but some confusion over income and substitution. L2 (5–6 marks): for a poor explanation of the terms or a weak comment on the links. L1 (1–4 marks): for an answer that has some basic correct facts but includes irrelevancies and errors of theory.
Q4 · Analyse whether there is a link between the marginal cost of a firm and (i) its variable…
4 (a) Analyse whether there is a link between the marginal cost of a firm and (i) its variable cost; (ii) the supply curve of the industry to which the firm belongs. [12] (b) Discuss how the objective of a firm in an oligopolistic market might differ from the objective of a firm in a perfectly competitive market. [13]
Mark scheme: 4(a) Marginal cost changes with the variable cost change; MC is firm’s supply 12 curve in perfect competition, sum of firm’s supply curves gives industry supply. Does not apply with imperfect competition. L4 (9–12 marks): for a clear explanation of the links and correct analysis of both parts. L3 (7–8 marks): for a clear analysis of one part – probably the link to variable cost – with confusion over the second part. L2 (5–6 marks): for a briefer explanation of one part and omission of the second part. L1 (1–4 marks): for an answer that has some basic correct facts but includes irrelevancies and errors of theory. 4(b) Perfect competition assumes profit maximising. Oligopoly usually assumes 13 collusion and a less volatile price. It still can assume profit maximising. However, with collusion the profit maximising output/price can be for the industry and each firm is given an output quota which is not necessarily the profit maximising output for that firm. A firm can compete by non-price competition or break the agreement. L4 (9–13 marks): for a clear analysis with a good structure on the oligopoly section. L3 (7–8 marks): for a clear analysis of perfect competition but less competent analysis and development of oligopoly. Profit maximising stated, but collusion not fully developed. L2 (5–6 marks): for a weaker answer of the differences and links. L1 (1–4 marks): for an answer that has some basic correct facts but includes irrelevancies and errors of theory.
Q5 · According to economic theory, what is the significance for a firm in a perfectly…
5 (a) According to economic theory, what is the significance for a firm in a perfectly competitive labour market of a worker’s marginal product and average product? [12] (b) Discuss the economic conditions that might make it possible for a trade union to increase the wages of its members without reducing the number of workers employed. [13]
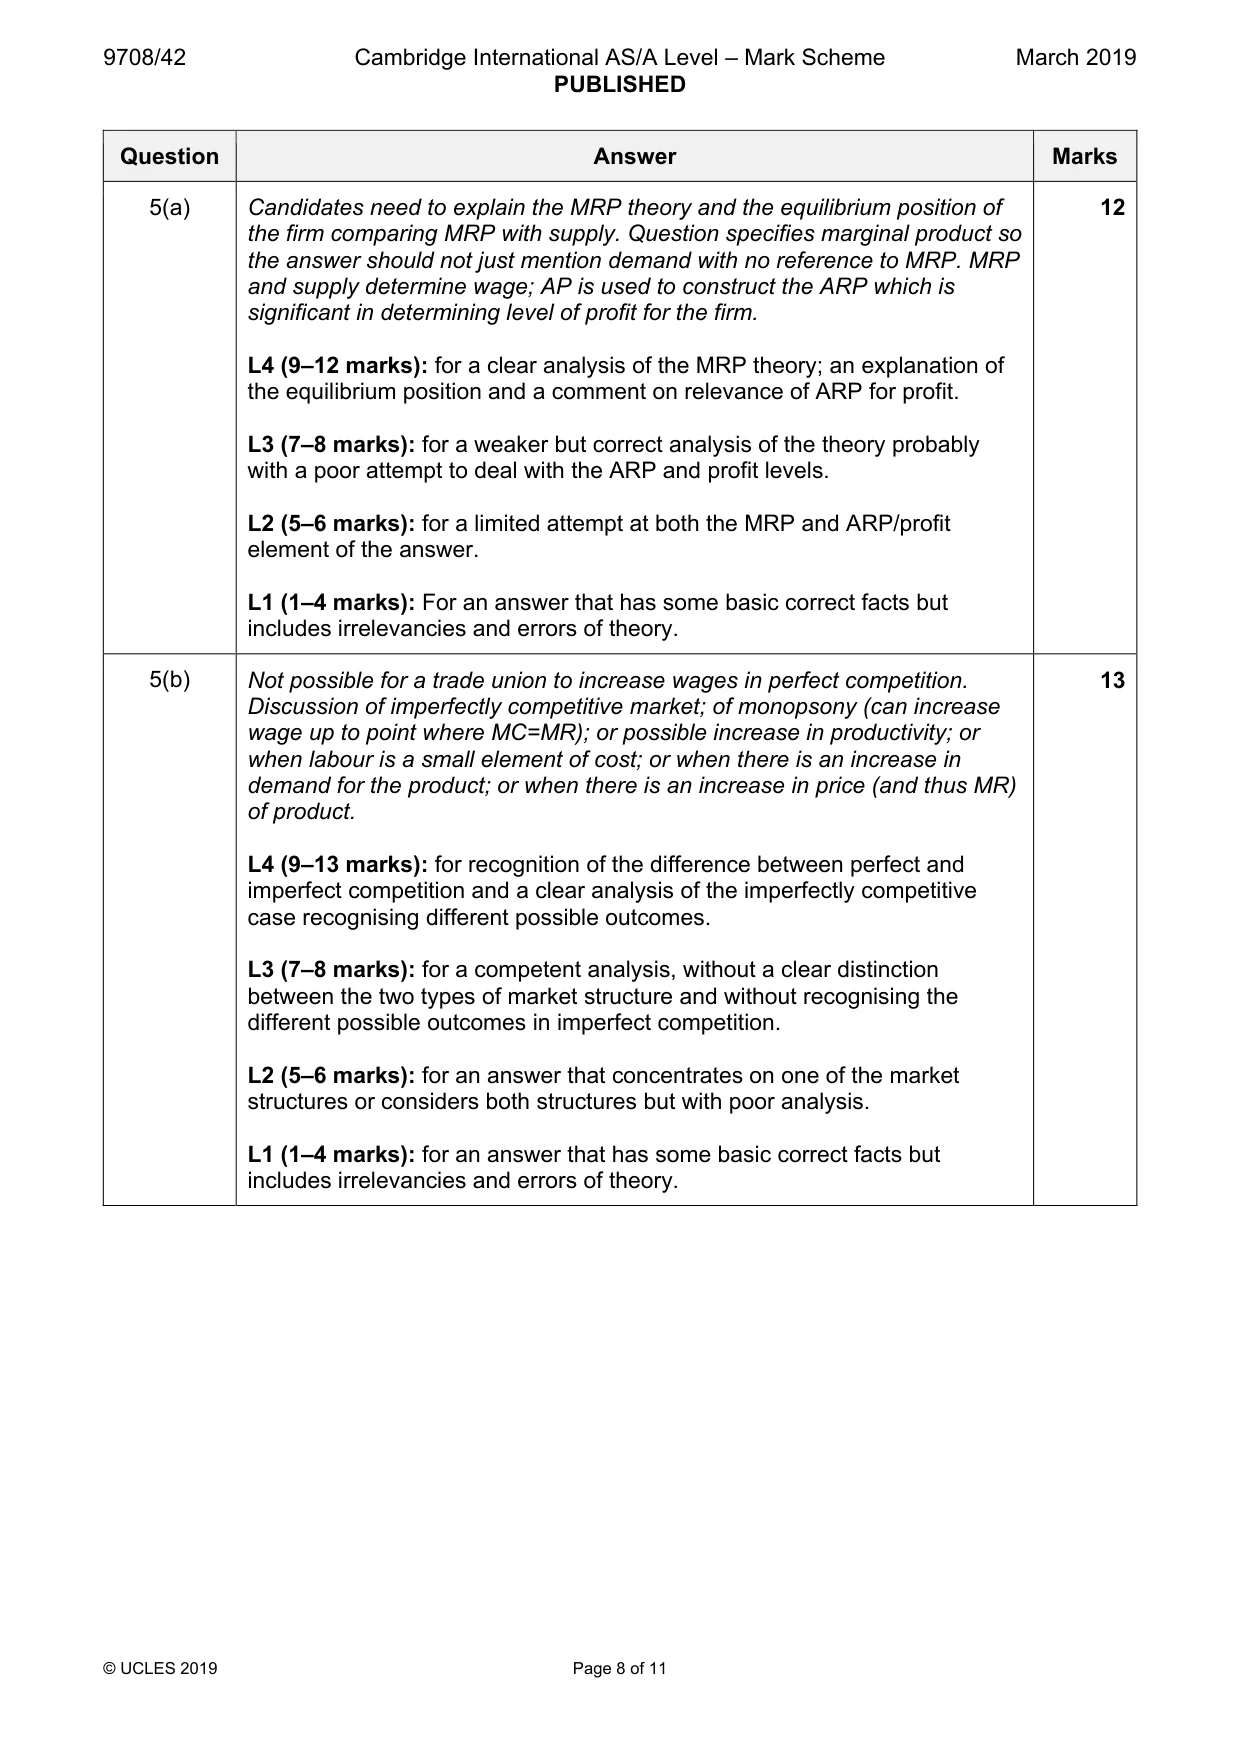
Mark scheme: 5(a) Candidates need to explain the MRP theory and the equilibrium position of 12 the firm comparing MRP with supply. Question specifies marginal product so the answer should not just mention demand with no reference to MRP. MRP and supply determine wage; AP is used to construct the ARP which is significant in determining level of profit for the firm. L4 (9–12 marks): for a clear analysis of the MRP theory; an explanation of the equilibrium position and a comment on relevance of ARP for profit. L3 (7–8 marks): for a weaker but correct analysis of the theory probably with a poor attempt to deal with the ARP and profit levels. L2 (5–6 marks): for a limited attempt at both the MRP and ARP/profit element of the answer. L1 (1–4 marks): For an answer that has some basic correct facts but includes irrelevancies and errors of theory. 5(b) Not possible for a trade union to increase wages in perfect competition. 13 Discussion of imperfectly competitive market; of monopsony (can increase wage up to point where MC=MR); or possible increase in productivity; or when labour is a small element of cost; or when there is an increase in demand for the product; or when there is an increase in price (and thus MR) of product. L4 (9–13 marks): for recognition of the difference between perfect and imperfect competition and a clear analysis of the imperfectly competitive case recognising different possible outcomes. L3 (7–8 marks): for a competent analysis, without a clear distinction between the two types of market structure and without recognising the different possible outcomes in imperfect competition. L2 (5–6 marks): for an answer that concentrates on one of the market structures or considers both structures but with poor analysis. L1 (1–4 marks): for an answer that has some basic correct facts but includes irrelevancies and errors of theory.
More questions on Labour market forces and government intervention
Q6 · Distinguish between leakages and injections in the circular flow of income and consider…
6 (a) Distinguish between leakages and injections in the circular flow of income and consider how they might be related. [12] (b) Critically evaluate a central bank’s use of interest rates to increase injections into an economy. [13]
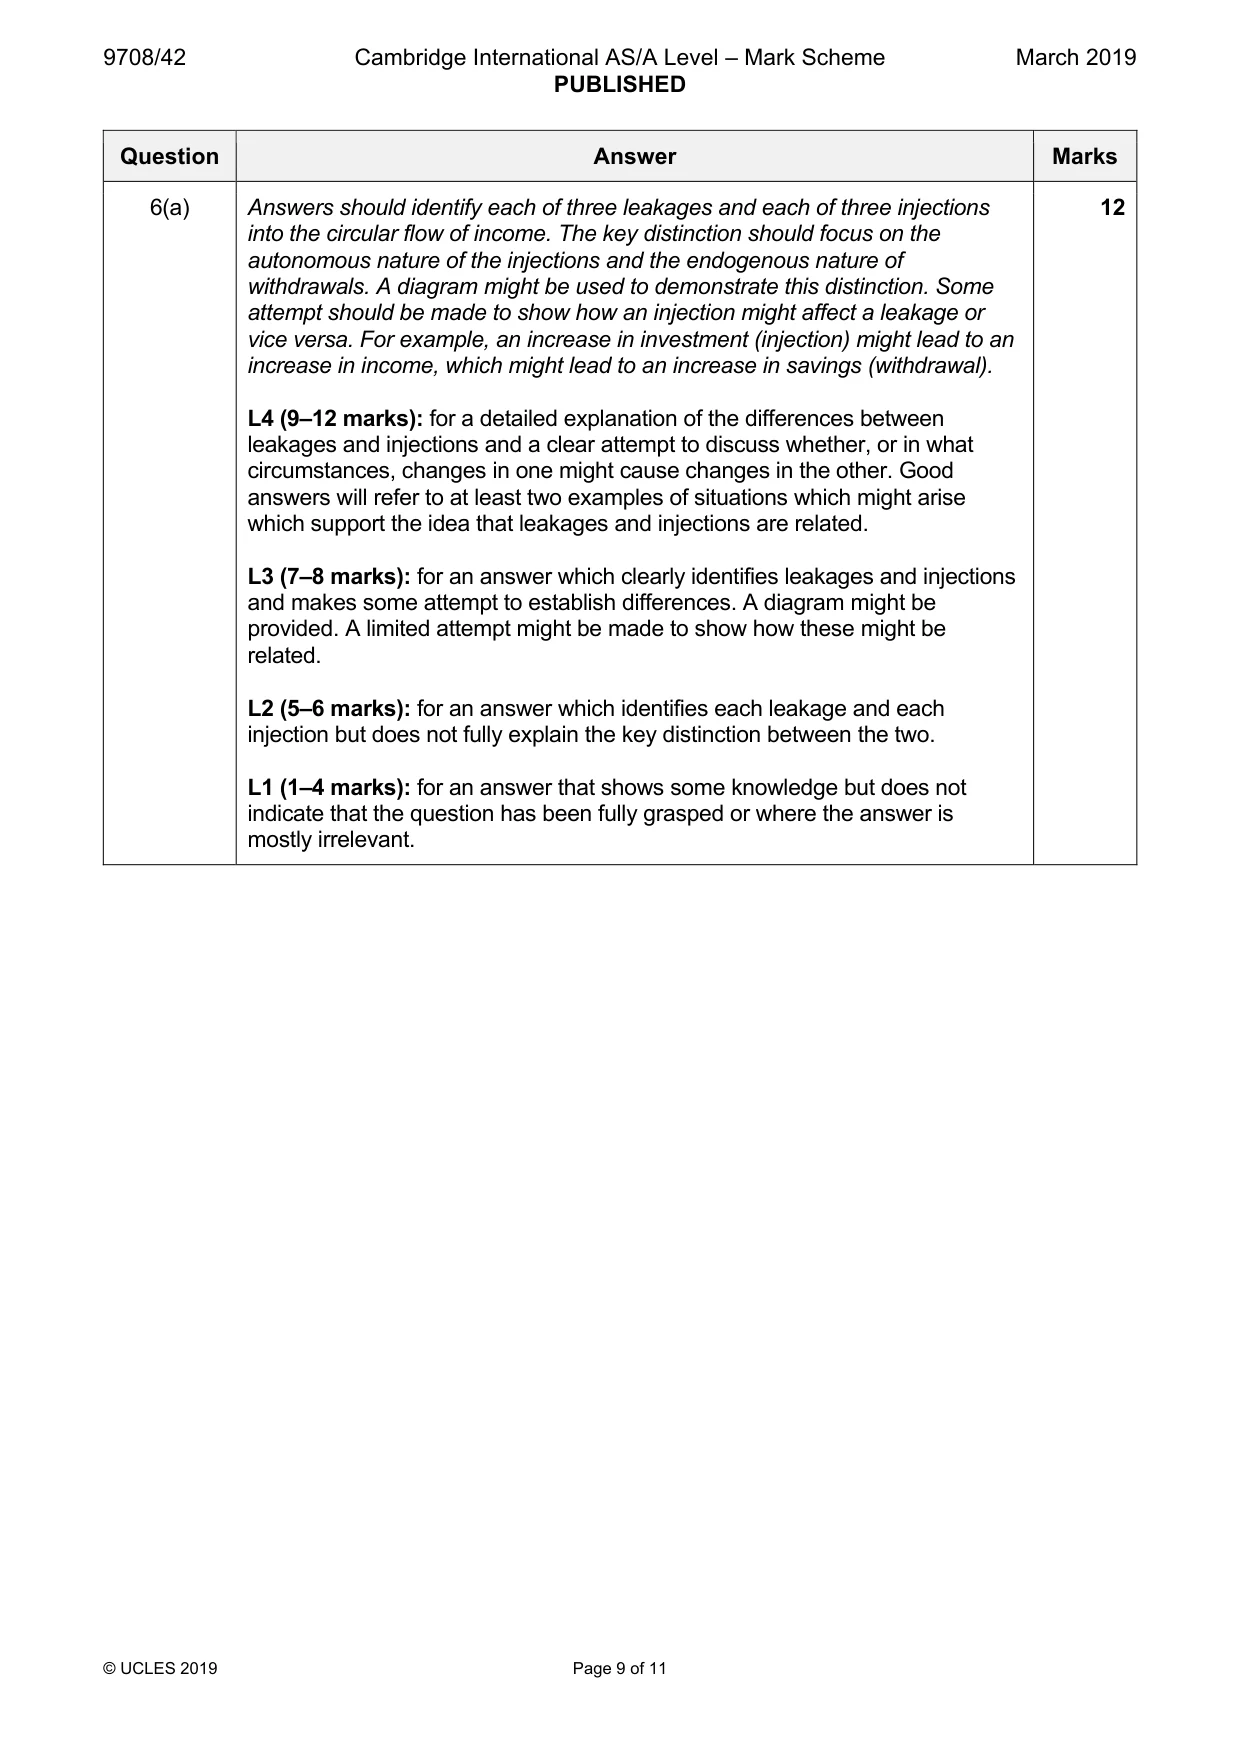
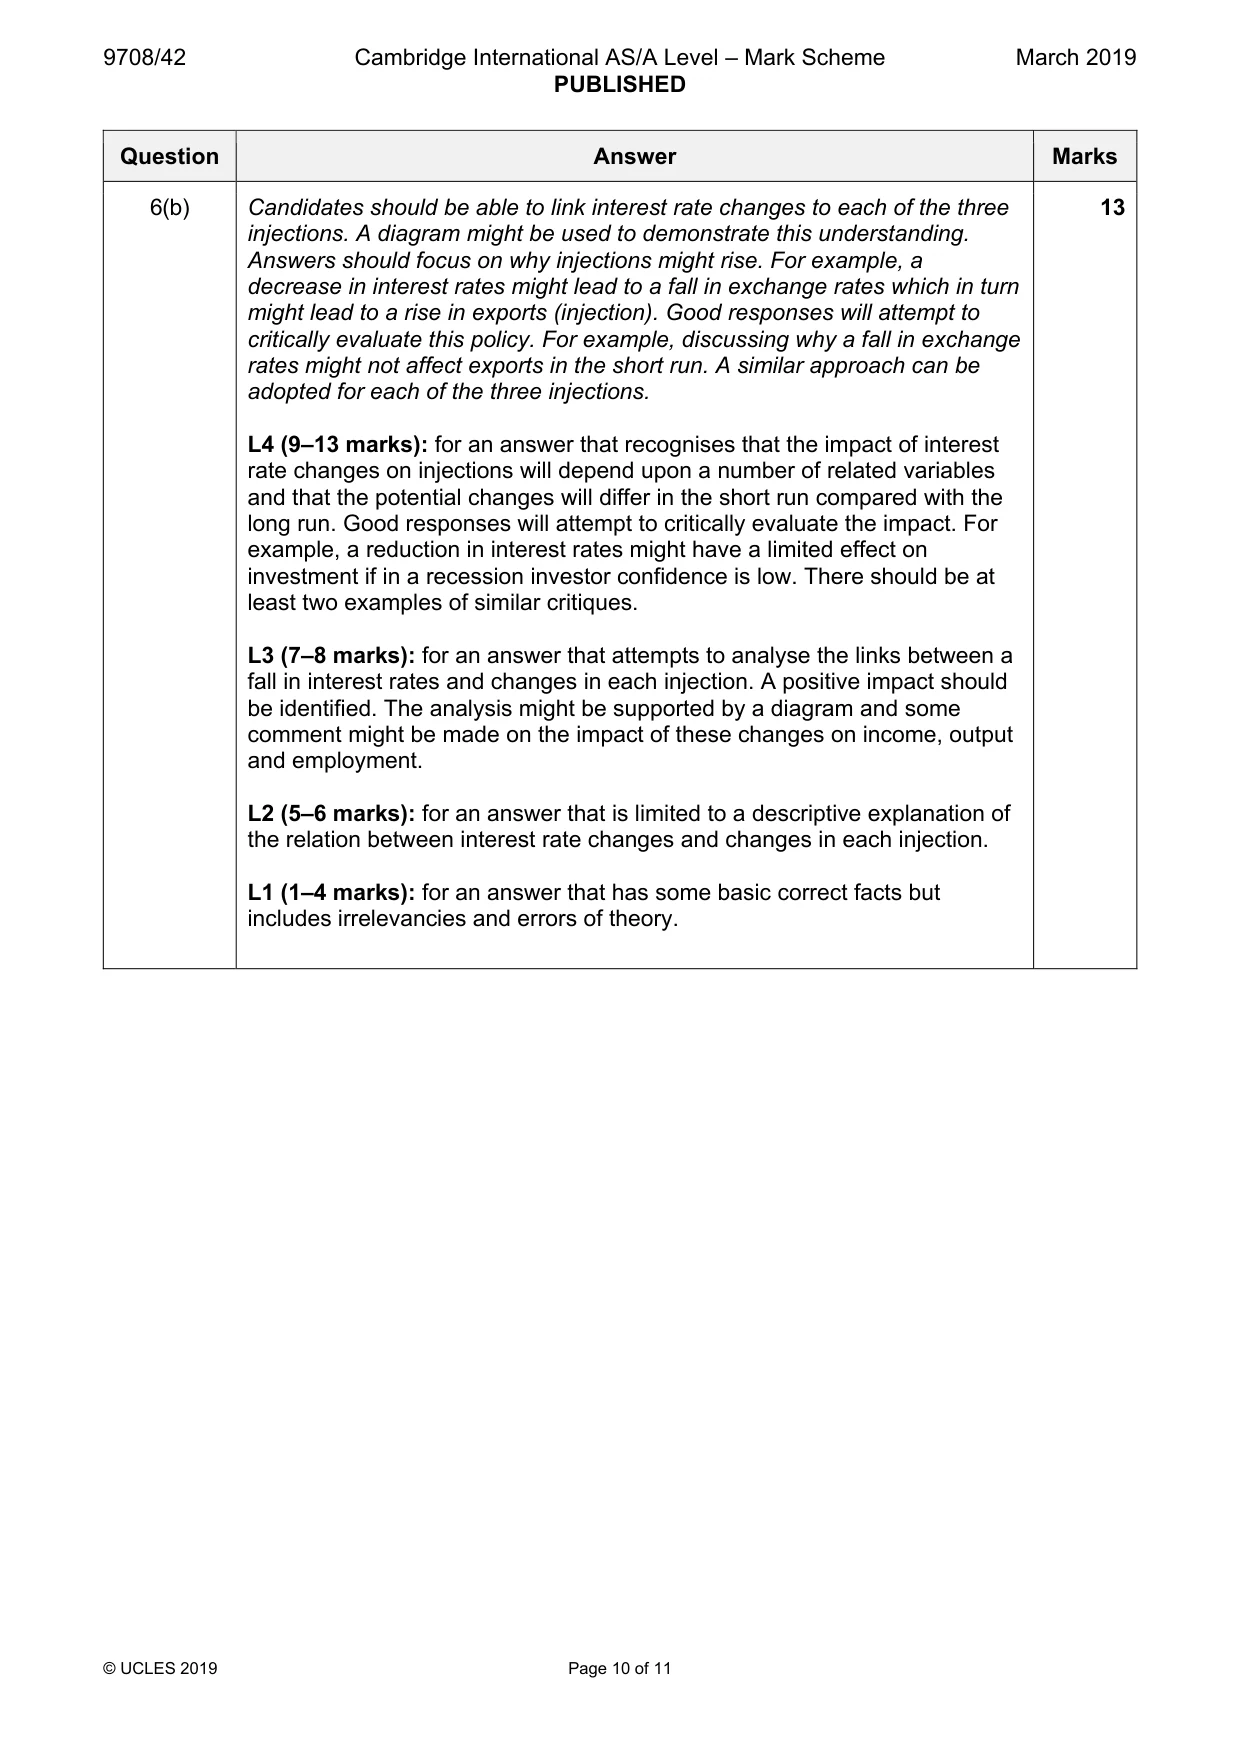
Mark scheme: 6(a) Answers should identify each of three leakages and each of three injections 12 into the circular flow of income. The key distinction should focus on the autonomous nature of the injections and the endogenous nature of withdrawals. A diagram might be used to demonstrate this distinction. Some attempt should be made to show how an injection might affect a leakage or vice versa. For example, an increase in investment (injection) might lead to an increase in income, which might lead to an increase in savings (withdrawal). L4 (9–12 marks): for a detailed explanation of the differences between leakages and injections and a clear attempt to discuss whether, or in what circumstances, changes in one might cause changes in the other. Good answers will refer to at least two examples of situations which might arise which support the idea that leakages and injections are related. L3 (7–8 marks): for an answer which clearly identifies leakages and injections and makes some attempt to establish differences. A diagram might be provided. A limited attempt might be made to show how these might be related. L2 (5–6 marks): for an answer which identifies each leakage and each injection but does not fully explain the key distinction between the two. L1 (1–4 marks): for an answer that shows some knowledge but does not indicate that the question has been fully grasped or where the answer is mostly irrelevant. 6(b) Candidates should be able to link interest rate changes to each of the three 13 injections. A diagram might be used to demonstrate this understanding. Answers should focus on why injections might rise. For example, a decrease in interest rates might lead to a fall in exchange rates which in turn might lead to a rise in exports (injection). Good responses will attempt to critically evaluate this policy. For example, discussing why a fall in exchange rates might not affect exports in the short run. A similar approach can be adopted for each of the three injections. L4 (9–13 marks): for an answer that recognises that the impact of interest rate changes on injections will depend upon a number of related variables and that the potential changes will differ in the short run compared with the long run. Good responses will attempt to critically evaluate the impact. For example, a reduction in interest rates might have a limited effect on investment if in a recession investor confidence is low. There should be at least two examples of similar critiques. L3 (7–8 marks): for an answer that attempts to analyse the links between a fall in interest rates and changes in each injection. A positive impact should be identified. The analysis might be supported by a diagram and some comment might be made on the impact of these changes on income, output and employment. L2 (5–6 marks): for an answer that is limited to a descriptive explanation of the relation between interest rate changes and changes in each injection. L1 (1–4 marks): for an answer that has some basic correct facts but includes irrelevancies and errors of theory.
Q7 · ‘Keynesian policies to solve the problem of unemployment will not work because they will…
7 ‘Keynesian policies to solve the problem of unemployment will not work because they will conflict with the attainment of other key macroeconomic aims.’ Assess the accuracy of this statement. [25]
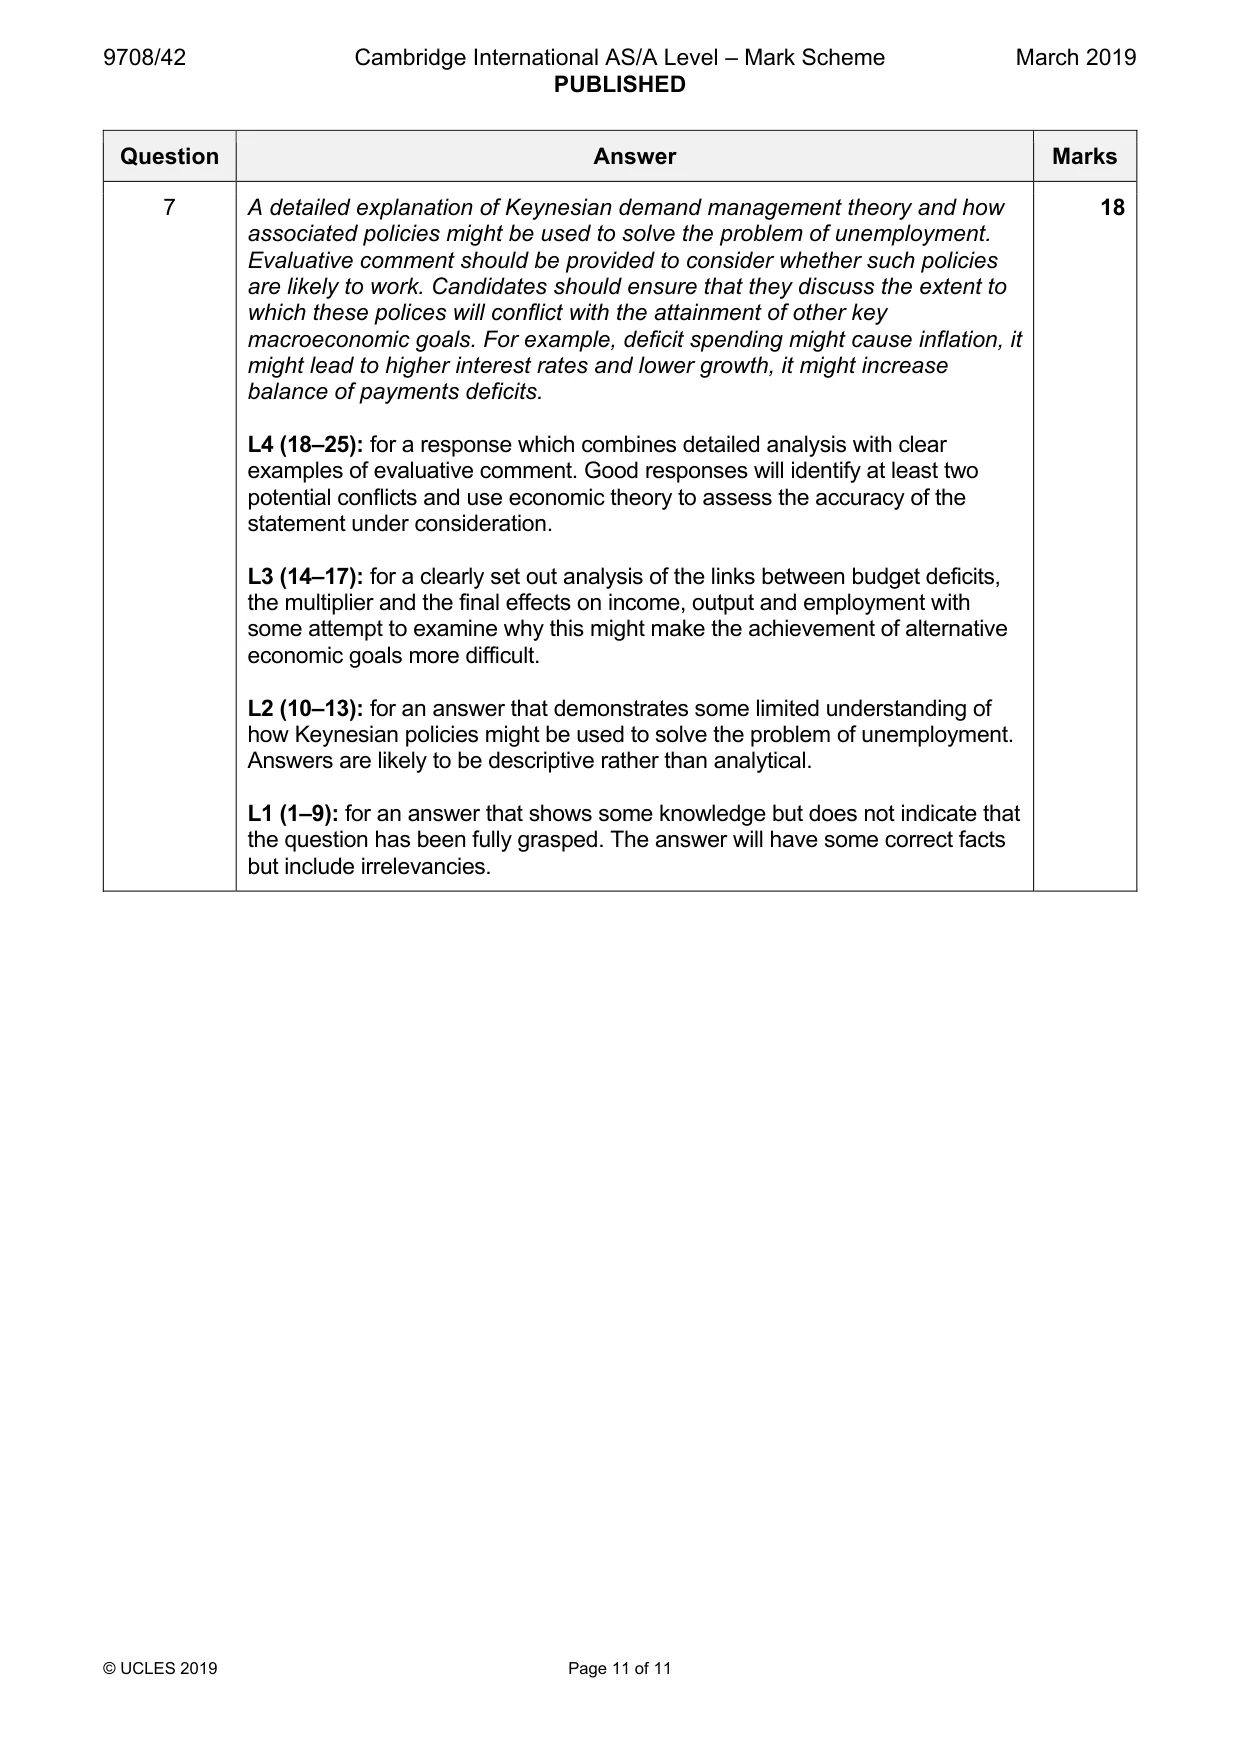
Mark scheme: 7 A detailed explanation of Keynesian demand management theory and how 18 associated policies might be used to solve the problem of unemployment. Evaluative comment should be provided to consider whether such policies are likely to work. Candidates should ensure that they discuss the extent to which these polices will conflict with the attainment of other key macroeconomic goals. For example, deficit spending might cause inflation, it might lead to higher interest rates and lower growth, it might increase balance of payments deficits. L4 (18–25): for a response which combines detailed analysis with clear examples of evaluative comment. Good responses will identify at least two potential conflicts and use economic theory to assess the accuracy of the statement under consideration. L3 (14–17): for a clearly set out analysis of the links between budget deficits, the multiplier and the final effects on income, output and employment with some attempt to examine why this might make the achievement of alternative economic goals more difficult. L2 (10–13): for an answer that demonstrates some limited understanding of how Keynesian policies might be used to solve the problem of unemployment. Answers are likely to be descriptive rather than analytical. L1 (1–9): for an answer that shows some knowledge but does not indicate that the question has been fully grasped. The answer will have some correct facts but include irrelevancies.
More questions on Effectiveness of policy options to meet all macroeconomic objectives
What was in this paper
The subtopics covered by these 7 questions, and how many questions each got. Open one in a new tab to see every Cambridge question on it.
What you needed in this session
Cambridge’s own grade thresholds for 2019 Feb/March, Paper 4 · Variant 2. A higher threshold means an easier paper — the bar moves with how the cohort did.