Cambridge A Level Economics 9708 — 2018 May/June Paper 2 · Variant 2
9708/22/M/J/18 · 4 questions · 40 marks · ≈45 min
The question paper and its mark scheme, free to read here and free to download. This is Cambridge’s own paper, exactly as it was sat.
Question paper4 pages
Mark scheme10 pages
Answers below. Sit the paper first if you are practising.
Questions as text
Q1 · Thai Economy’s Prospects Improve Table 1.1: Total expenditure in Thailand, by category…
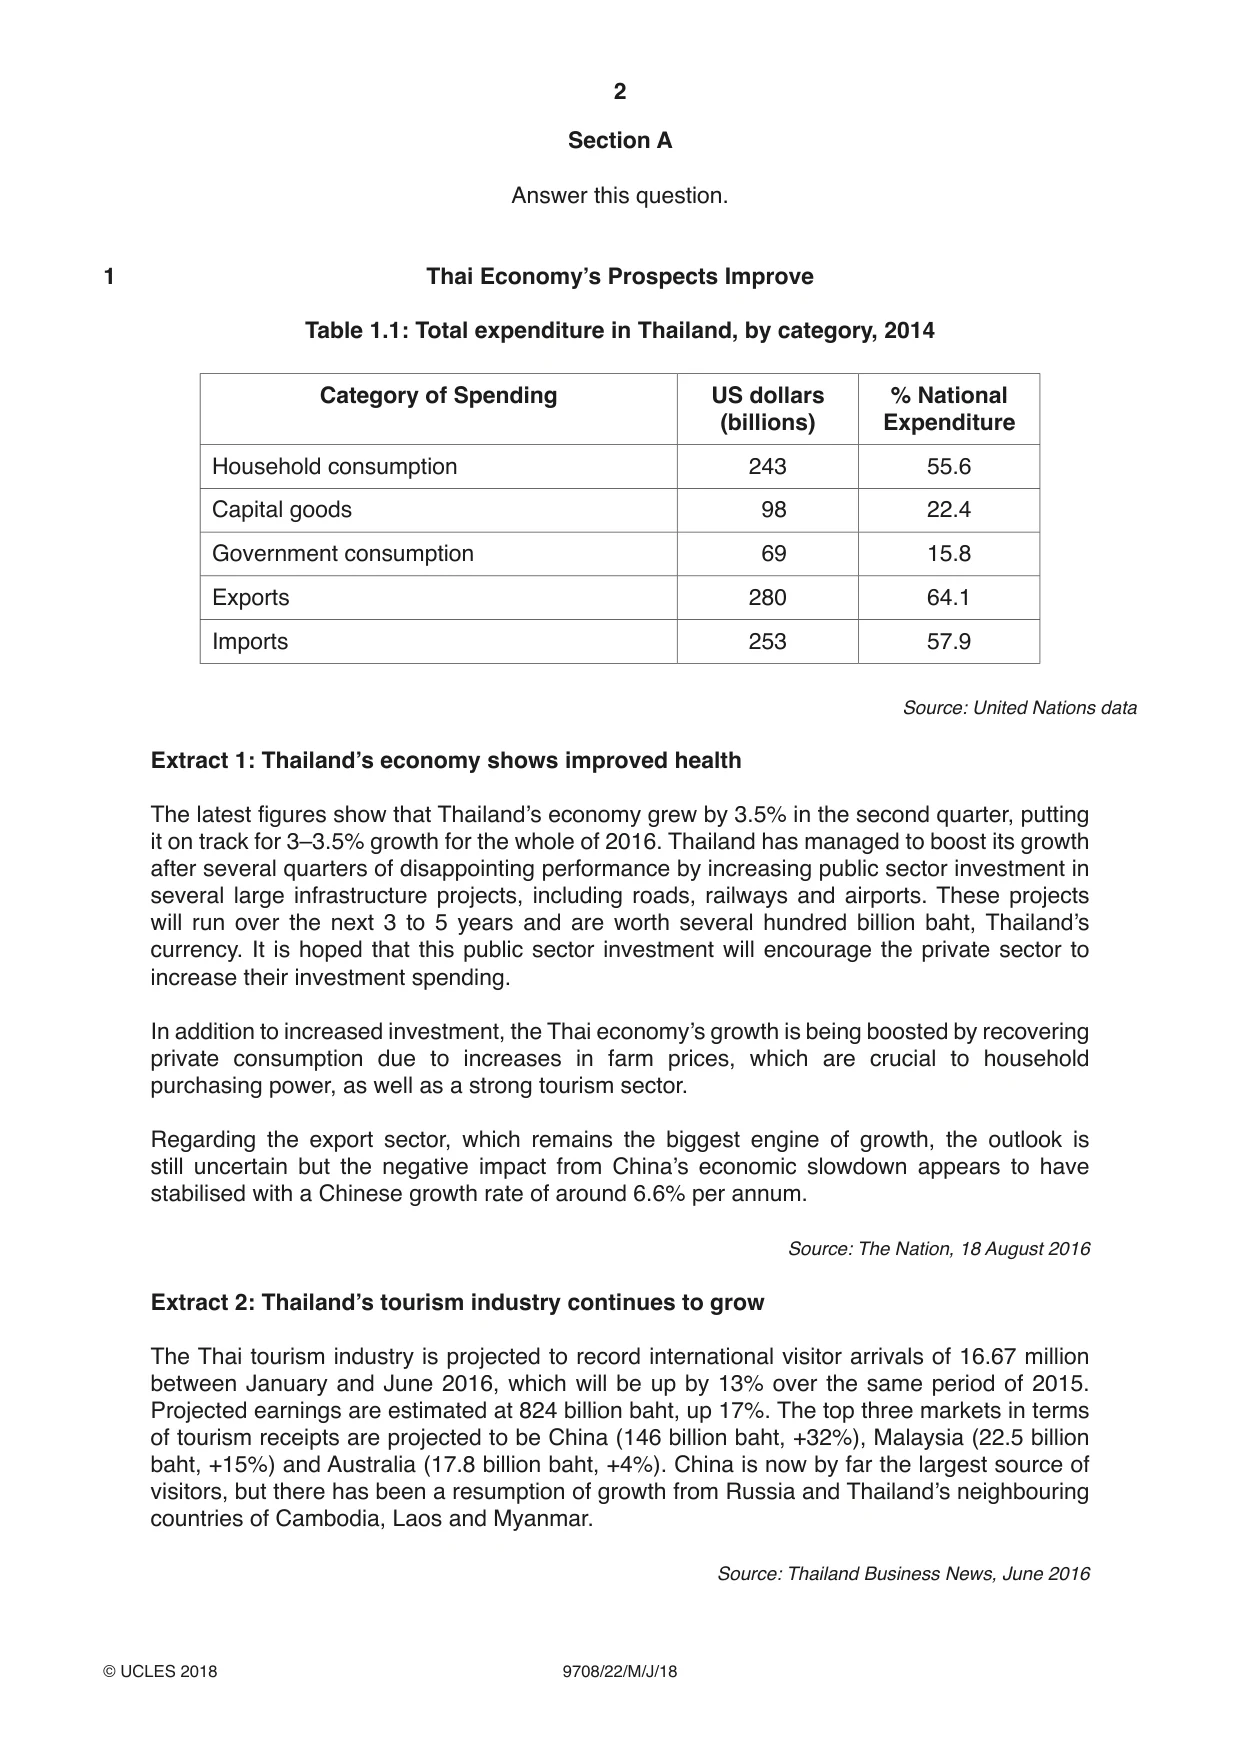
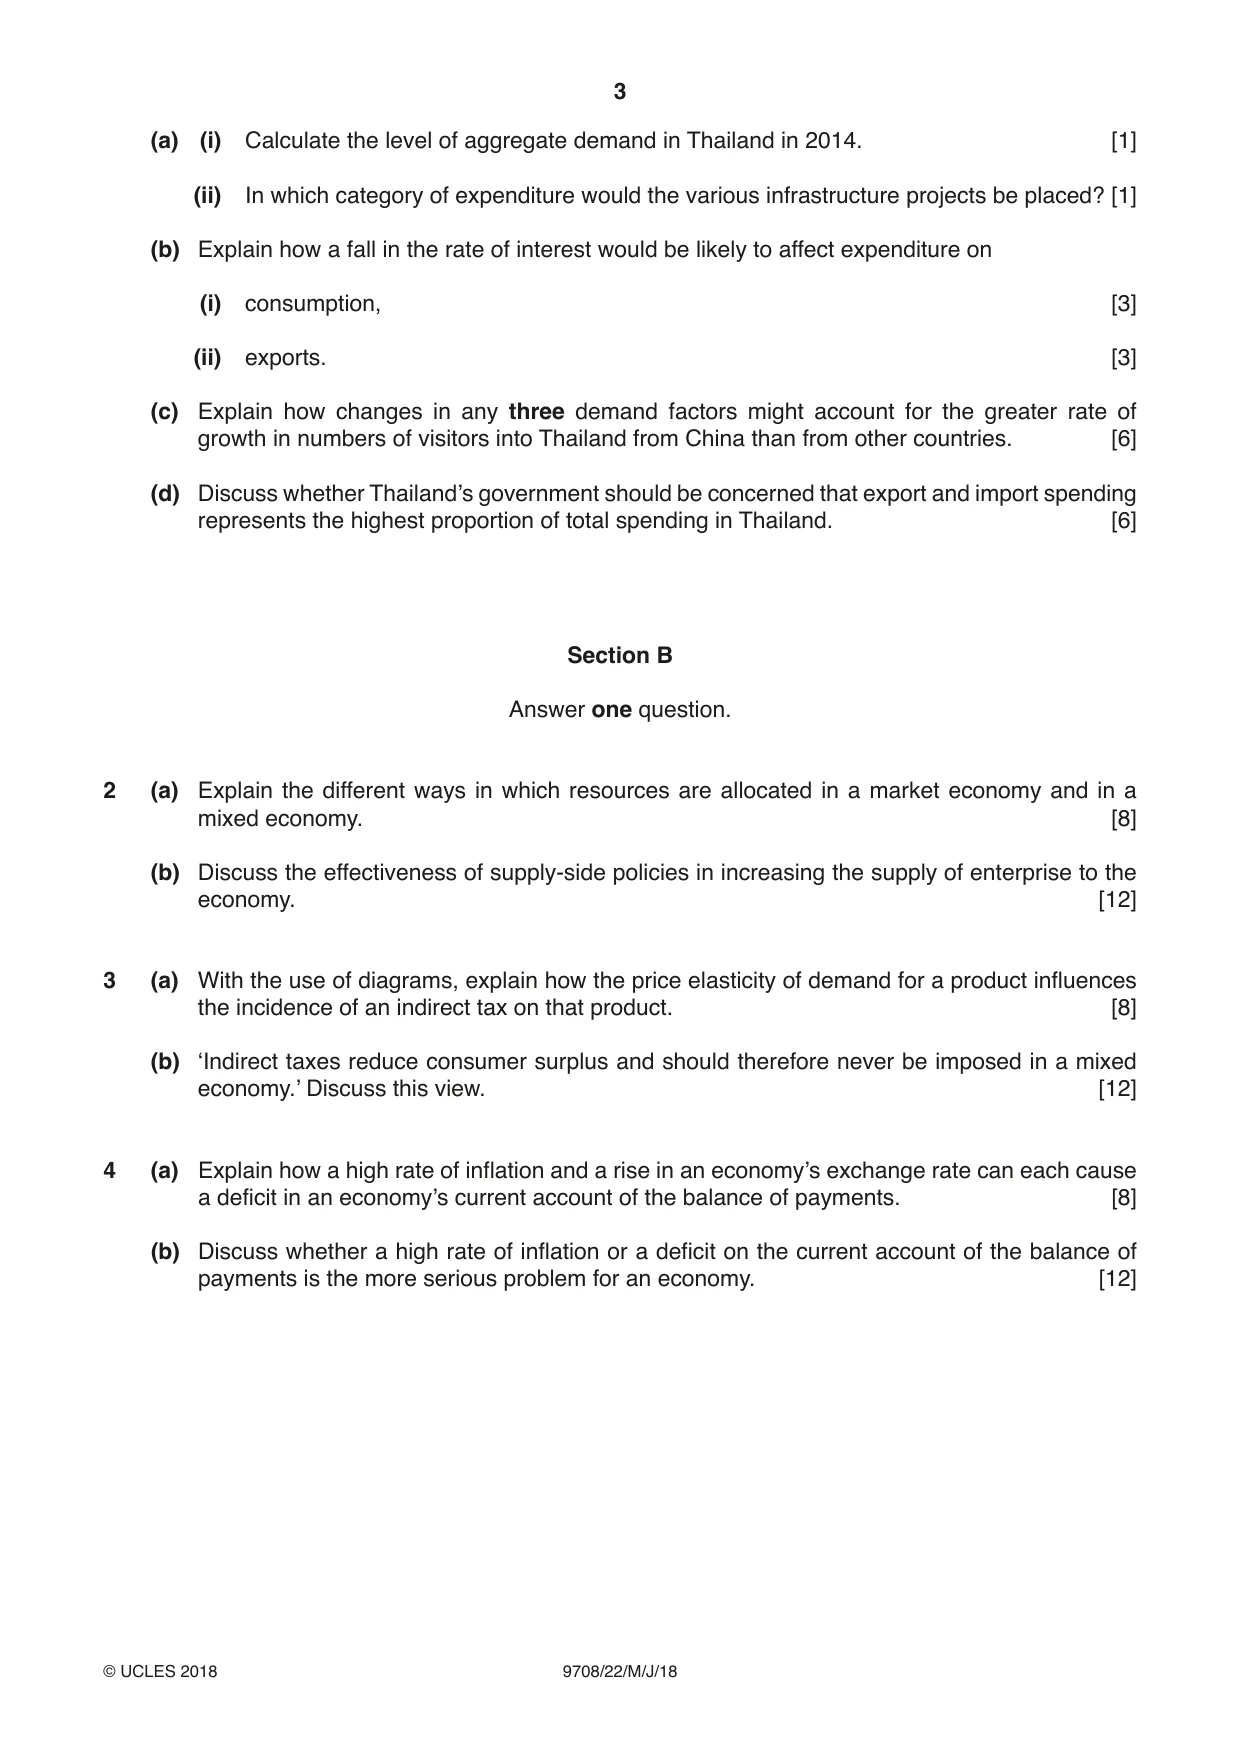
1 Thai Economy’s Prospects Improve Table 1.1: Total expenditure in Thailand, by category, 2014 Category of Spending US dollars % National (billions) Expenditure Household consumption 243 55.6 Capital goods 98 22.4 Government consumption 69 15.8 Exports 280 64.1 Imports 253 57.9 Source: United Nations data Extract 1: Thailand’s economy shows improved health The latest figures show that Thailand’s economy grew by 3.5% in the second quarter, putting it on track for 3–3.5% growth for the whole of 2016. Thailand has managed to boost its growth after several quarters of disappointing performance by increasing public sector investment in several large infrastructure projects, including roads, railways and airports. These projects will run over the next 3 to 5 years and are worth several hundred billion baht, Thailand’s currency. It is hoped that this public sector investment will encourage the private sector to increase their investment spending. In addition to increased investment, the Thai economy’s growth is being boosted by recovering private consumption due to increases in farm prices, which are crucial to household purchasing power, as well as a strong tourism sector. Regarding the export sector, which remains the biggest engine of growth, the outlook is still uncertain but the negative impact from China’s economic slowdown appears to have stabilised with a Chinese growth rate of around 6.6% per annum. Source: The Nation, 18 August 2016 Extract 2: Thailand’s tourism industry continues to grow The Thai tourism industry is projected to record international visitor arrivals of 16.67 million between January and June 2016, which will be up by 13% over the same period of 2015. Projected earnings are estimated at 824 billion baht, up 17%. The top three markets in terms of tourism receipts are projected to be China (146 billion baht, +32%), Malaysia (22.5 billion baht, +15%) and Australia (17.8 billion baht, +4%). China is now by far the largest source of visitors, but there has been a resumption of growth from Russia and Thailand’s neighbouring countries of Cambodia, Laos and Myanmar. Source: Thailand Business News, June 2016 (a) (i) Calculate the level of aggregate demand in Thailand in 2014. [1] (ii) In which category of expenditure would the various infrastructure projects be placed? [1] (b) Explain how a fall in the rate of interest would be likely to affect expenditure on (i) consumption, [3] (ii) exports. [3] (c) Explain how changes in any three demand factors might account for the greater rate of growth in numbers of visitors into Thailand from China than from other countries. [6] (d) Discuss whether Thailand’s government should be concerned that export and import spending represents the highest proportion of total spending in Thailand. [6]
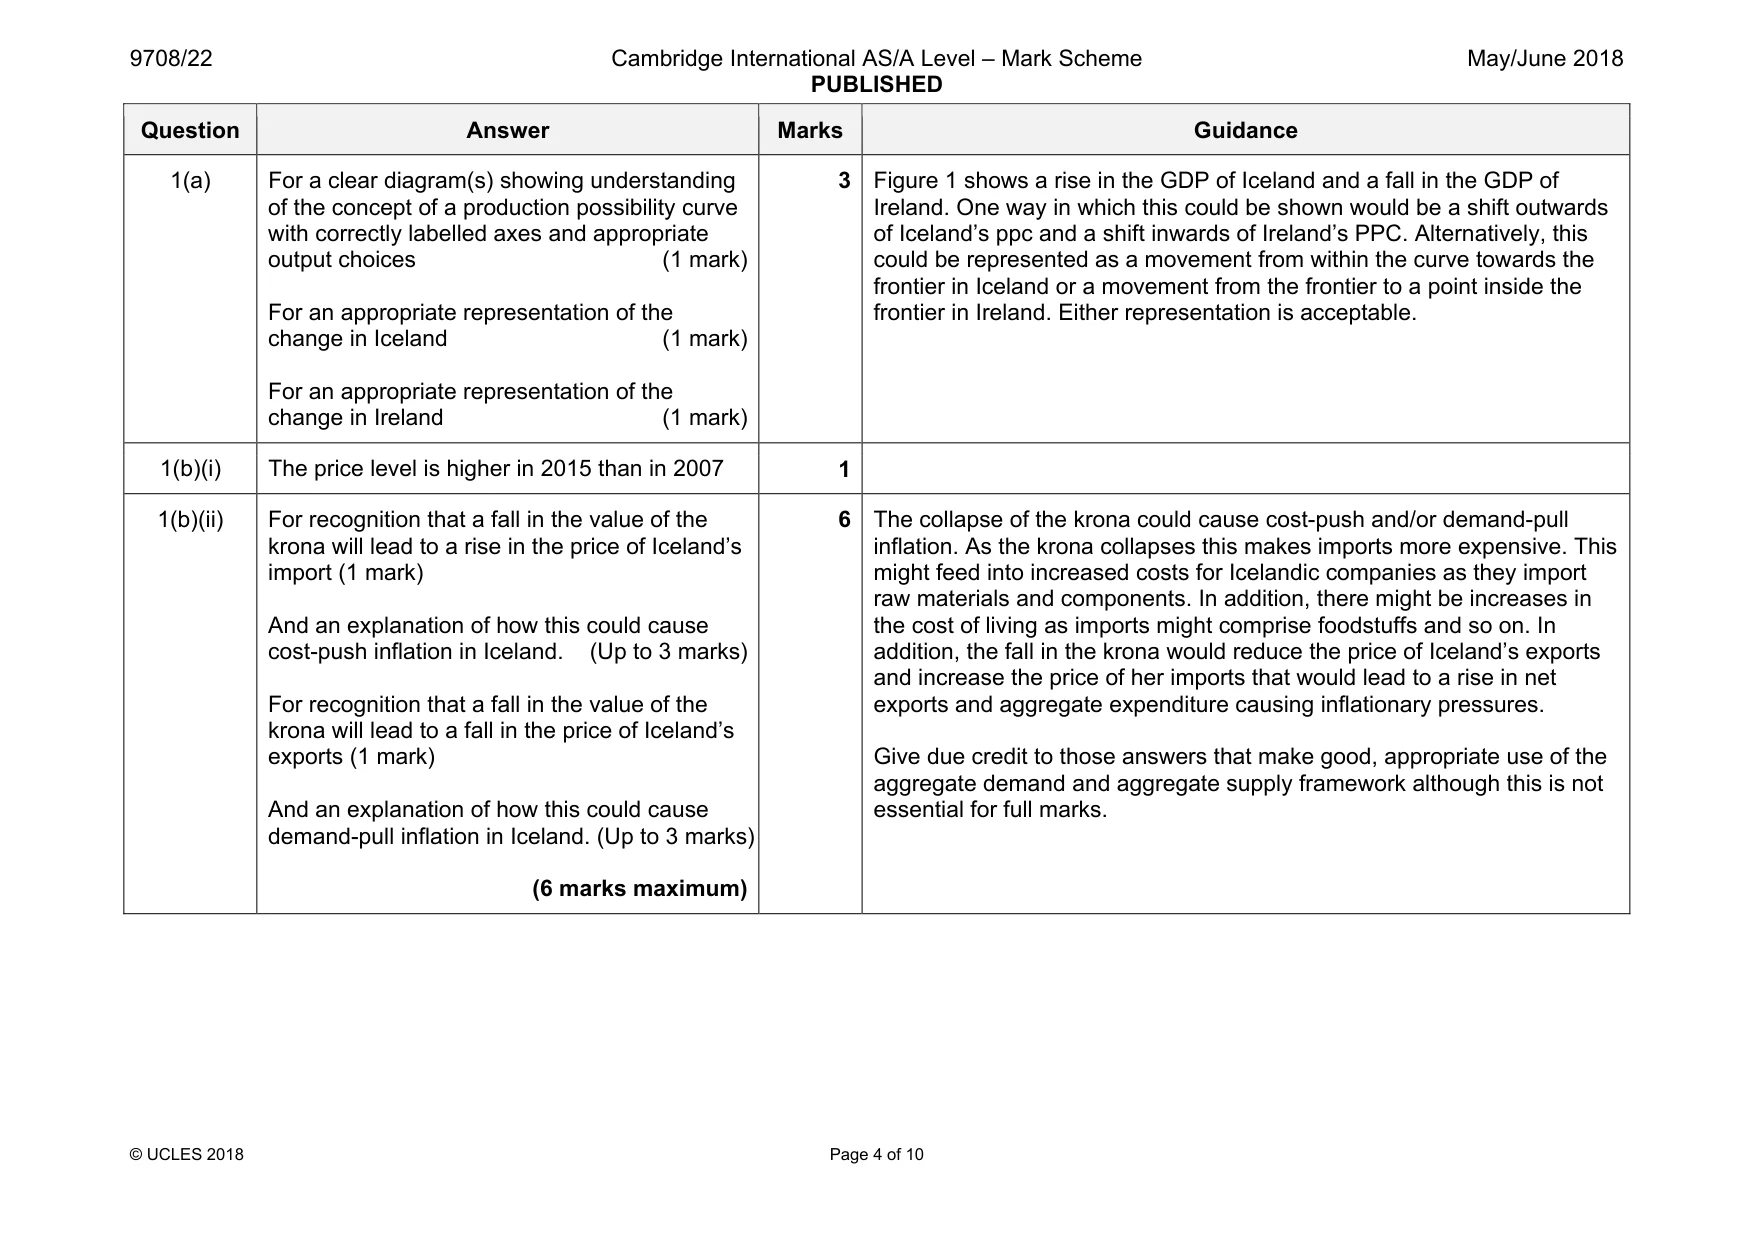
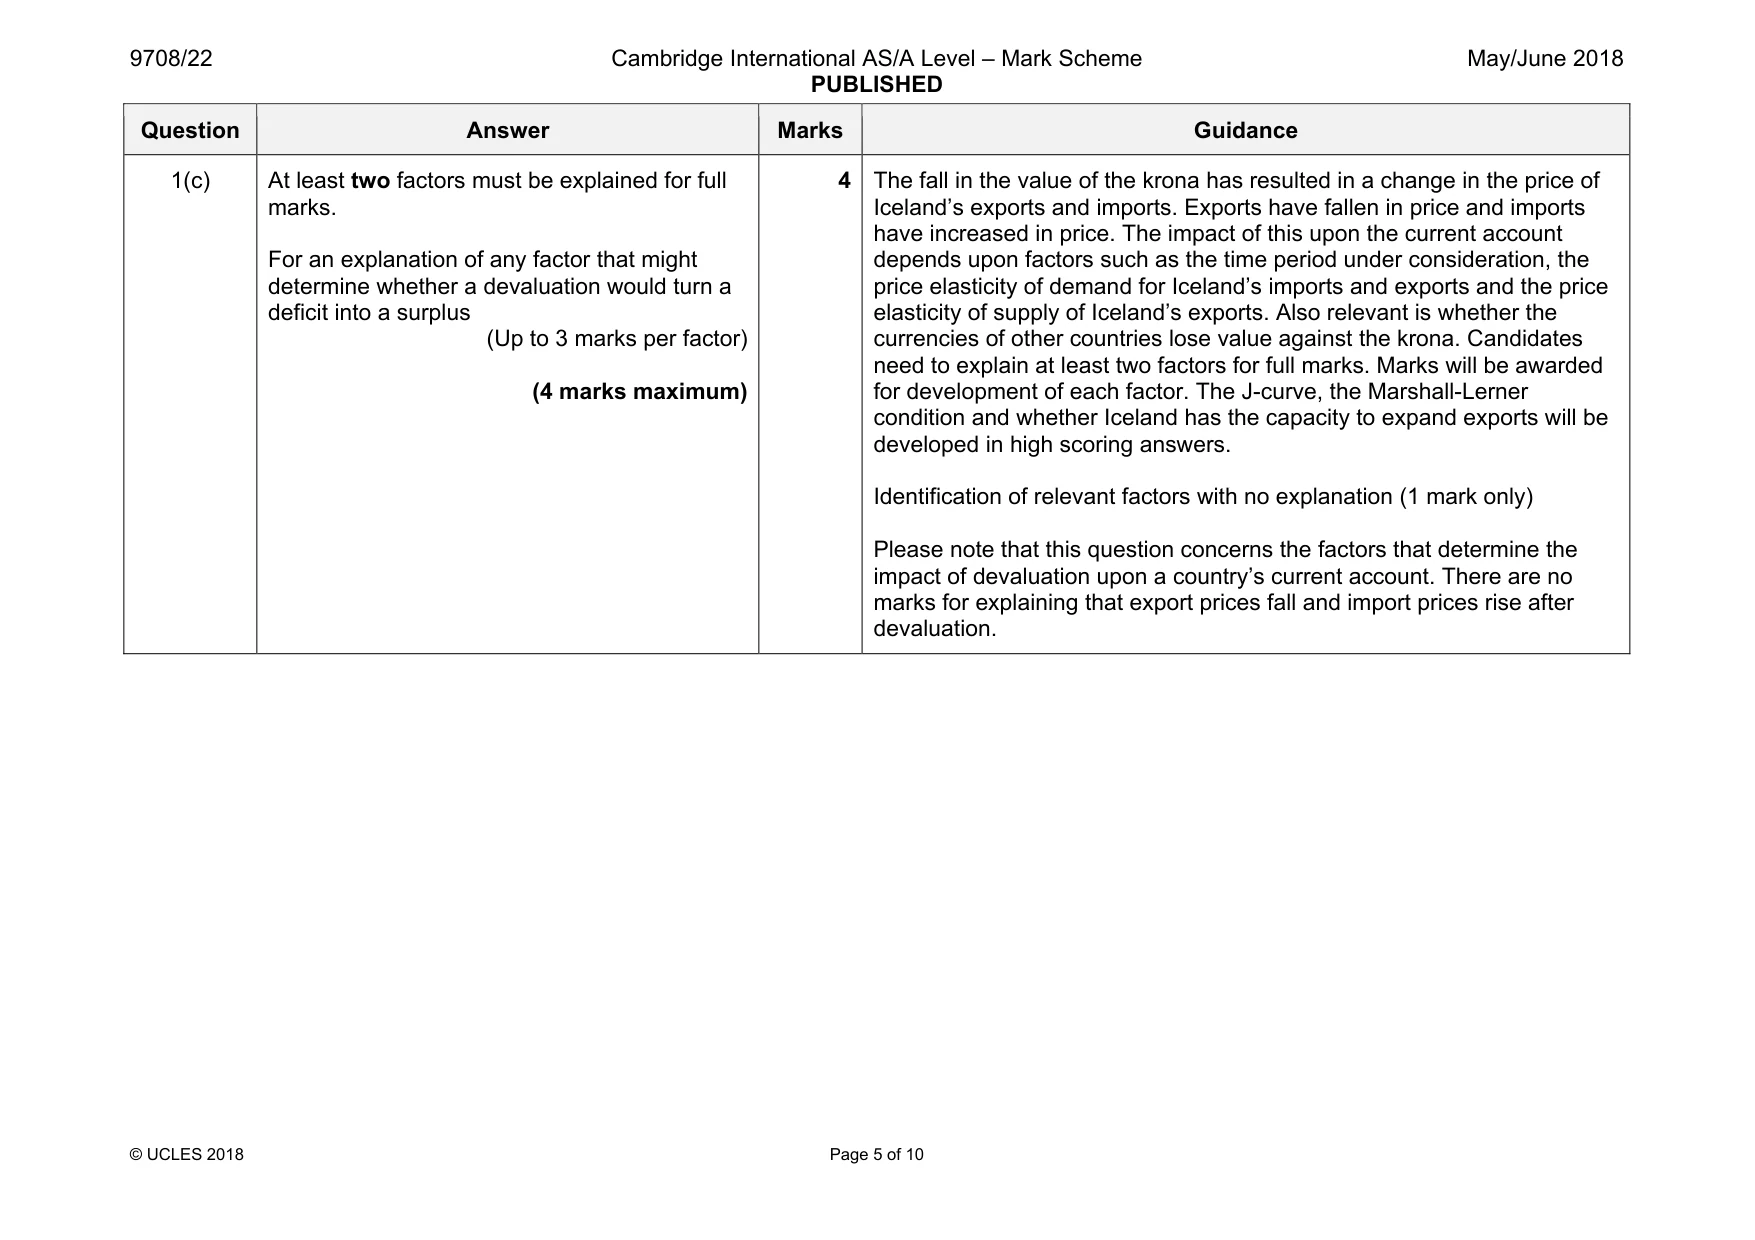
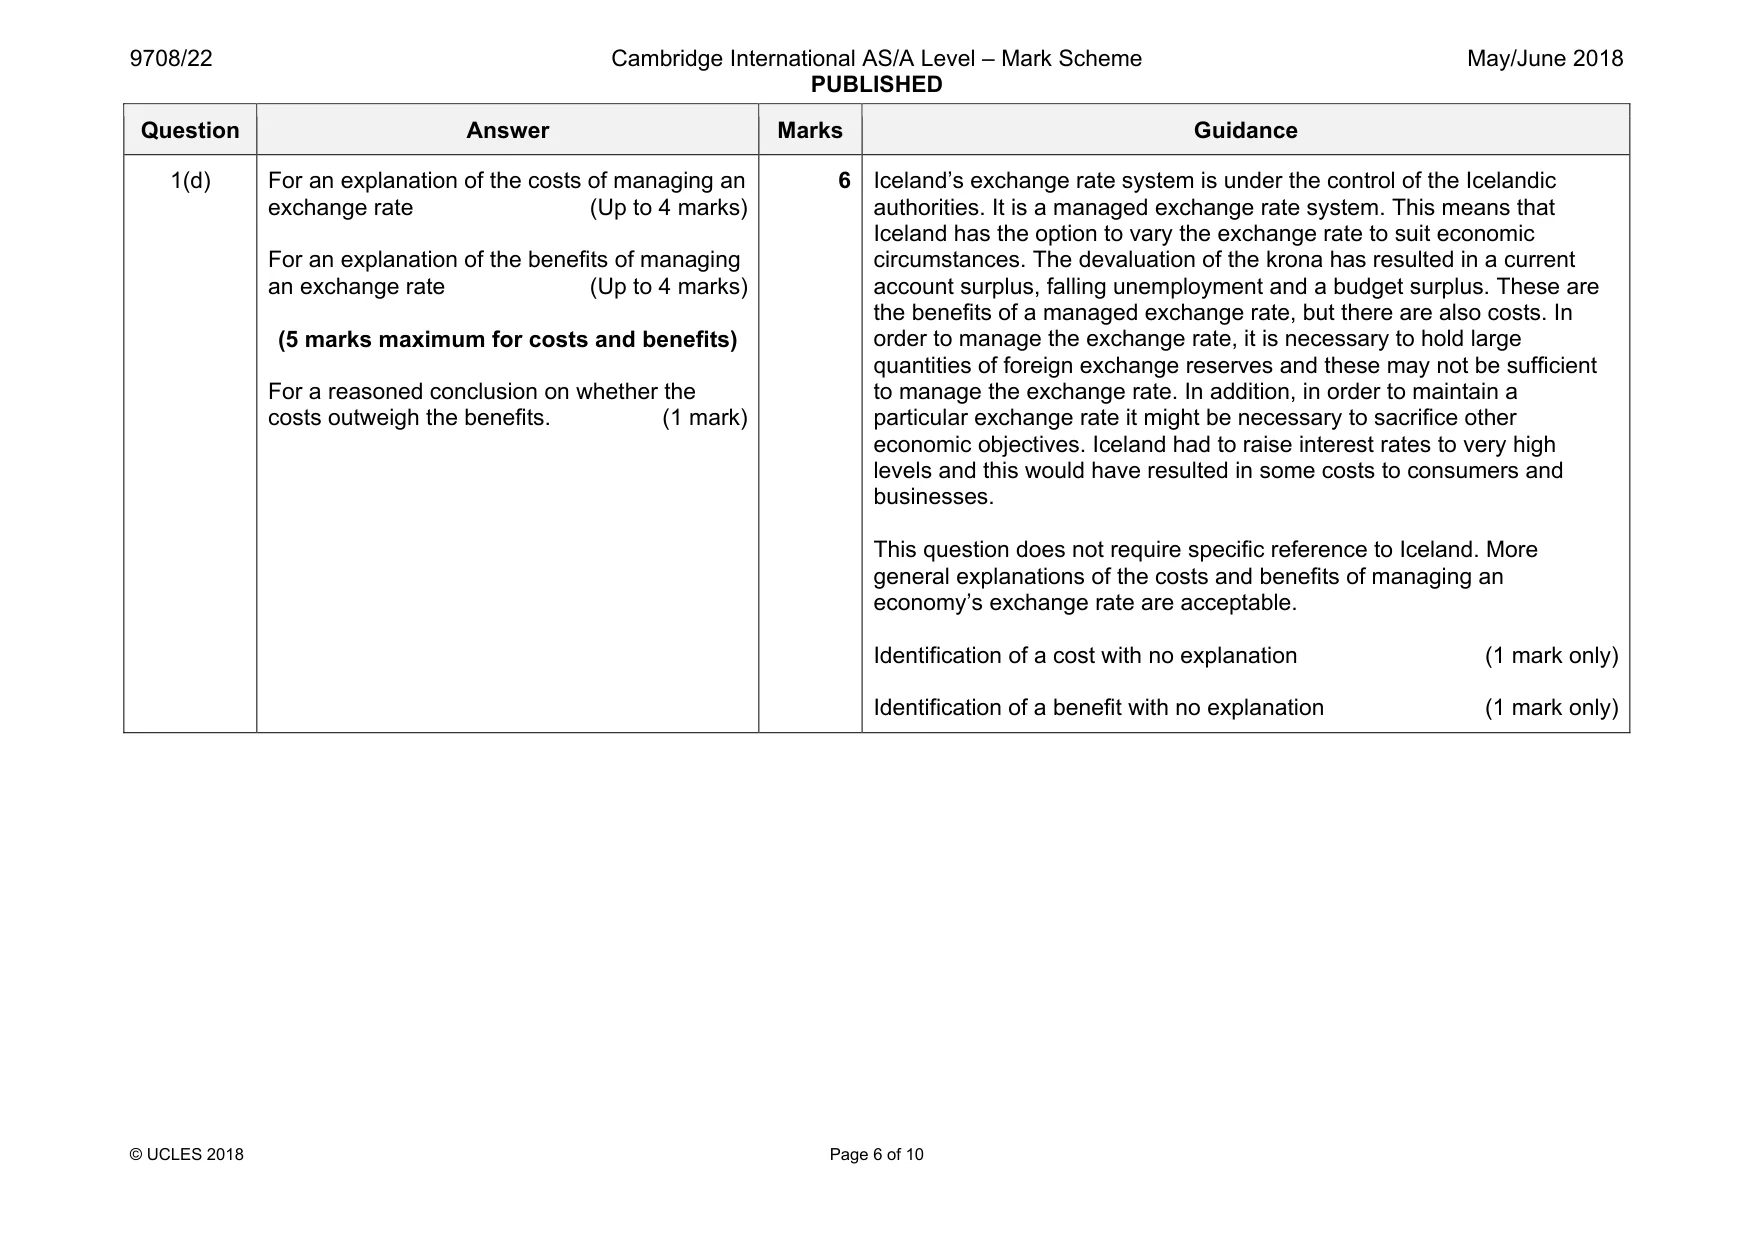
Mark scheme: 1(a) For a clear diagram(s) showing understanding of the concept of a production possibility curve with correctly labelled axes and appropriate output choices (1 mark) For an appropriate representation of the change in Iceland (1 mark) For an appropriate representation of the change in Ireland (1 mark) 3 Ireland. One way in which this could be shown would be a shift outwards of Iceland’s ppc and a shift inwards of Ireland’s PPC. Alternatively, this could be represented as a movement from within the curve towards the frontier in Iceland or a movement from the frontier to a point inside the frontier in Ireland. Either representation is acceptable. 1(b)(i) The price level is higher in 2015 than in 2007 1 1(b)(ii) For recognition that a fall in the value of the krona will lead to a rise in the price of Iceland’s import (1 mark) And an explanation of how this could cause cost-push inflation in Iceland. (Up to 3 marks) For recognition that a fall in the value of the krona will lead to a fall in the price of Iceland’s exports (1 mark) And an explanation of how this could cause demand-pull inflation in Iceland. (Up to 3 marks) (6 marks maximum) 6 The collapse of the krona could cause cost-push and/or demand-pull inflation. As the krona collapses this makes imports more expensive. This might feed into increased costs for Icelandic companies as they import raw materials and components. In addition, there might be increases in the cost of living as imports might comprise foodstuffs and so on. In addition, the fall in the krona would reduce the price of Iceland’s exports and increase the price of her imports that would lead to a rise in net exports and aggregate expenditure causing inflationary pressures. Give due credit to those answers that make good, appropriate use of the aggregate demand and aggregate supply framework although this is not essential for full marks. Question Answer Marks Guidance 1(c) At least two factors must be explained for full marks. For an explanation of any factor that might determine whether a devaluation would turn a deficit into a surplus (Up to 3 marks per factor) (4 marks maximum) 4 The fall in the value of the krona has resulted in a change in the price of Iceland’s exports and imports. Exports have fallen in price and imports have increased in price. The impact of this upon the current account depends upon factors such as the time period under consideration, the price elasticity of demand for Iceland’s imports and exports and the price elasticity of supply of Iceland’s exports. Also relevant is whether the currencies of other countries lose value against the krona. Candidates need to explain at least two factors for full marks. Marks will be awarded for development of each factor. The J-curve, the Marshall-Lerner condition and whether Iceland has the capacity to expand exports will be developed in high scoring answers. Identification of relevant factors with no explanation (1 mark only) Please note that this question concerns the factors that determine the impact of devaluation upon a country’s current account. There are no marks for explaining that export prices fall and import prices rise after devaluation. Question Answer Marks Guidance 1(d) For an explanation of the costs of managing an exchange rate (Up to 4 marks) For an explanation of the benefits of managing an exchange rate (Up to 4 marks) (5 marks maximum for costs and benefits) For a reasoned conclusion on whether the costs outweigh the benefits. (1 mark) 6 Iceland’s exchange rate system is under the control of the Icelandic authorities. It is a managed exchange rate system. This means that Iceland has the option to vary the exchange rate to suit economic circumstances. The devaluation of the krona has resulted in a current account surplus, falling unemployment and a budget surplus. These are the benefits of a managed exchange rate, but there are also costs. In order to manage the exchange rate, it is necessary to hold large quantities of foreign exchange reserves and these may not be sufficient to manage the exchange rate. In addition, in order to maintain a particular exchange rate it might be necessary to sacrifice other economic objectives. Iceland had to raise interest rates to very high levels and this would have resulted in some costs to consumers and businesses. This question does not require specific reference to Iceland. More general explanations of the costs and benefits of managing an economy’s exchange rate are acceptable. Identification of a cost with no explanation (1 mark only) Identification of a benefit with no explanation (1 mark only)
More questions on Aggregate Demand and Aggregate Supply analysis
Q2 · Explain the different ways in which resources are allocated in a market economy and in a…
2 (a) Explain the different ways in which resources are allocated in a market economy and in a mixed economy. [8] (b) Discuss the effectiveness of supply-side policies in increasing the supply of enterprise to the economy. [12]
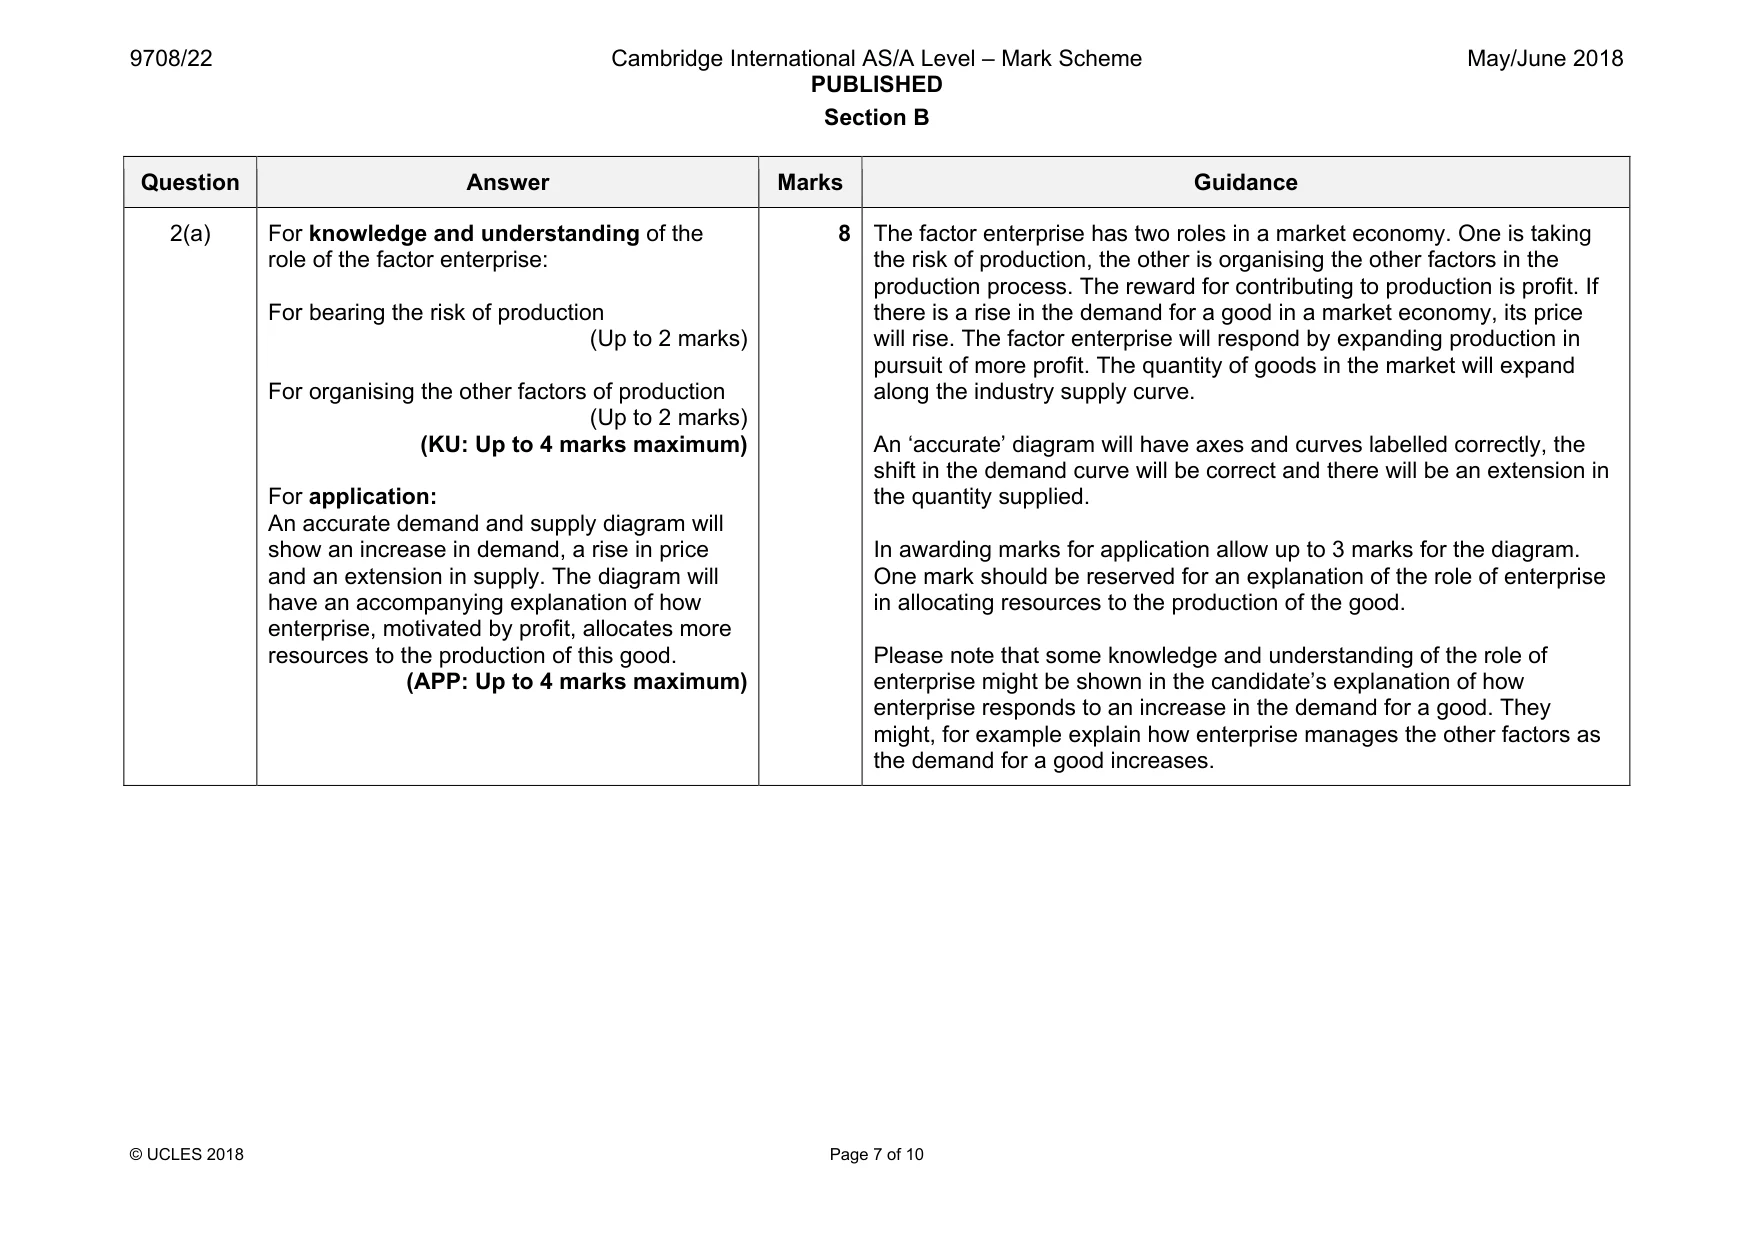
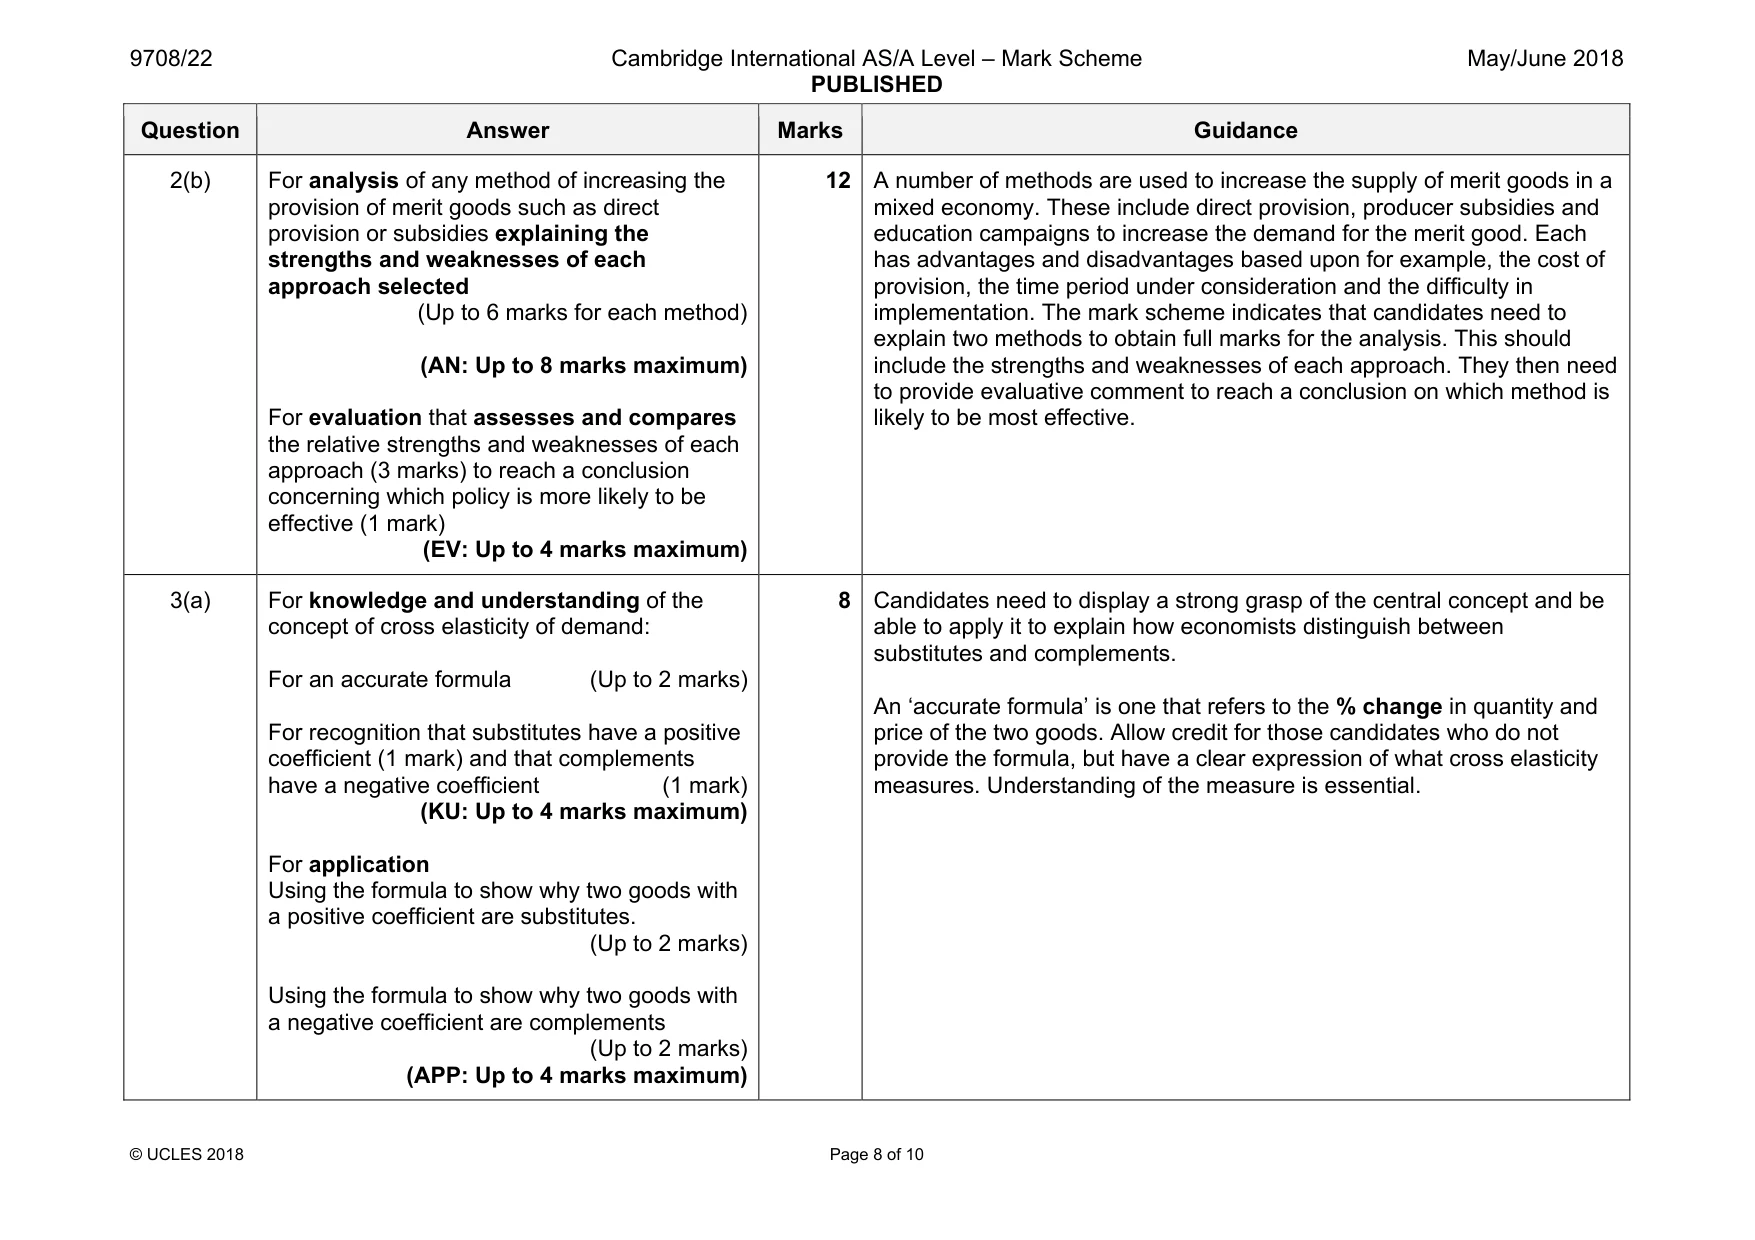
Mark scheme: 2(a) For knowledge and understanding of the role of the factor enterprise: For bearing the risk of production (Up to 2 marks) For organising the other factors of production (Up to 2 marks) (KU: Up to 4 marks maximum) For application: An accurate demand and supply diagram will show an increase in demand, a rise in price and an extension in supply. The diagram will have an accompanying explanation of how enterprise, motivated by profit, allocates more resources to the production of this good. (APP: Up to 4 marks maximum) 8 the risk of production, the other is organising the other factors in the production process. The reward for contributing to production is profit. If there is a rise in the demand for a good in a market economy, its price will rise. The factor enterprise will respond by expanding production in pursuit of more profit. The quantity of goods in the market will expand along the industry supply curve. An ‘accurate’ diagram will have axes and curves labelled correctly, the shift in the demand curve will be correct and there will be an extension in the quantity supplied. In awarding marks for application allow up to 3 marks for the diagram. One mark should be reserved for an explanation of the role of enterprise in allocating resources to the production of the good. Please note that some knowledge and understanding of the role of enterprise might be shown in the candidate’s explanation of how enterprise responds to an increase in the demand for a good. They might, for example explain how enterprise manages the other factors as the demand for a good increases. Question Answer Marks Guidance 2(b) For analysis of any method of increasing the provision of merit goods such as direct provision or subsidies explaining the strengths and weaknesses of each approach selected (Up to 6 marks for each method) (AN: Up to 8 marks maximum) For evaluation that assesses and compares the relative strengths and weaknesses of each approach (3 marks) to reach a conclusion concerning which policy is more likely to be effective (1 mark) (EV: Up to 4 marks maximum) 12 A number of methods are used to increase the supply of merit goods in a mixed economy. These include direct provision, producer subsidies and education campaigns to increase the demand for the merit good. Each has advantages and disadvantages based upon for example, the cost of provision, the time period under consideration and the difficulty in implementation. The mark scheme indicates that candidates need to explain two methods to obtain full marks for the analysis. This should include the strengths and weaknesses of each approach. They then need to provide evaluative comment to reach a conclusion on which method is likely to be most effective. Candidates need to display a strong grasp of the central concept and be
Q3 · With the use of diagrams, explain how the price elasticity of demand for a product…
3 (a) With the use of diagrams, explain how the price elasticity of demand for a product influences the incidence of an indirect tax on that product. [8] (b) ‘Indirect taxes reduce consumer surplus and should therefore never be imposed in a mixed economy.’ Discuss this view. [12]
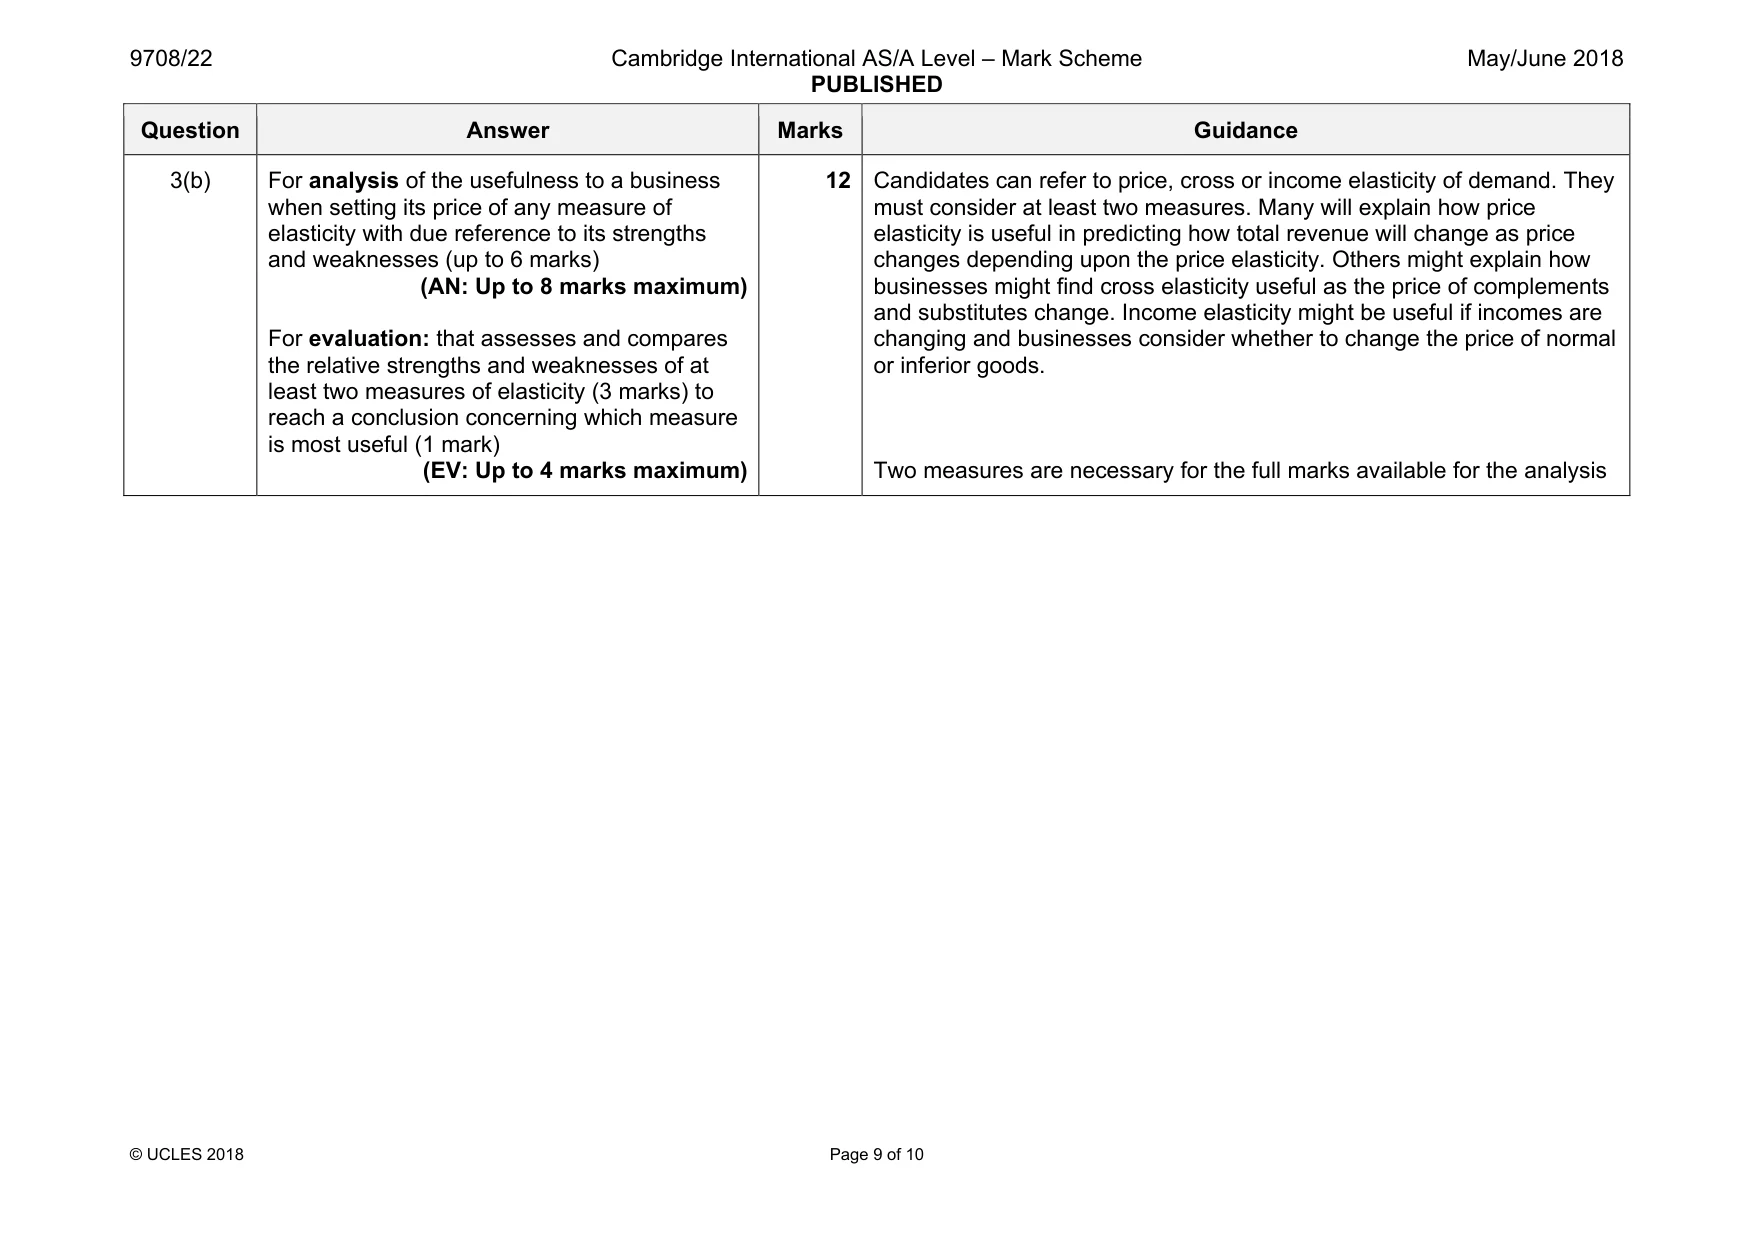
Mark scheme: 3(a) For knowledge and understanding of the concept of cross elasticity of demand: For an accurate formula (Up to 2 marks) For recognition that substitutes have a positive coefficient (1 mark) and that complements have a negative coefficient (1 mark) (KU: Up to 4 marks maximum) For application Using the formula to show why two goods with a positive coefficient are substitutes. (Up to 2 marks) Using the formula to show why two goods with a negative coefficient are complements (Up to 2 marks) (APP: Up to 4 marks maximum) 8 able to apply it to explain how economists distinguish between substitutes and complements. An ‘accurate formula’ is one that refers to the % change in quantity and price of the two goods. Allow credit for those candidates who do not provide the formula, but have a clear expression of what cross elasticity measures. Understanding of the measure is essential. Question Answer Marks Guidance 3(b) For analysis of the usefulness to a business when setting its price of any measure of elasticity with due reference to its strengths and weaknesses (up to 6 marks) (AN: Up to 8 marks maximum) For evaluation: that assesses and compares the relative strengths and weaknesses of at least two measures of elasticity (3 marks) to reach a conclusion concerning which measure is most useful (1 mark) (EV: Up to 4 marks maximum) 12 Candidates can refer to price, cross or income elasticity of demand. They must consider at least two measures. Many will explain how price elasticity is useful in predicting how total revenue will change as price changes depending upon the price elasticity. Others might explain how businesses might find cross elasticity useful as the price of complements and substitutes change. Income elasticity might be useful if incomes are changing and businesses consider whether to change the price of normal or inferior goods. Two measures are necessary for the full marks available for the analysis
More questions on Methods and effects of government intervention in markets
Q4 · Explain how a high rate of inflation and a rise in an economy’s exchange rate can each…
4 (a) Explain how a high rate of inflation and a rise in an economy’s exchange rate can each cause a deficit in an economy’s current account of the balance of payments. [8] (b) Discuss whether a high rate of inflation or a deficit on the current account of the balance of payments is the more serious problem for an economy. [12]
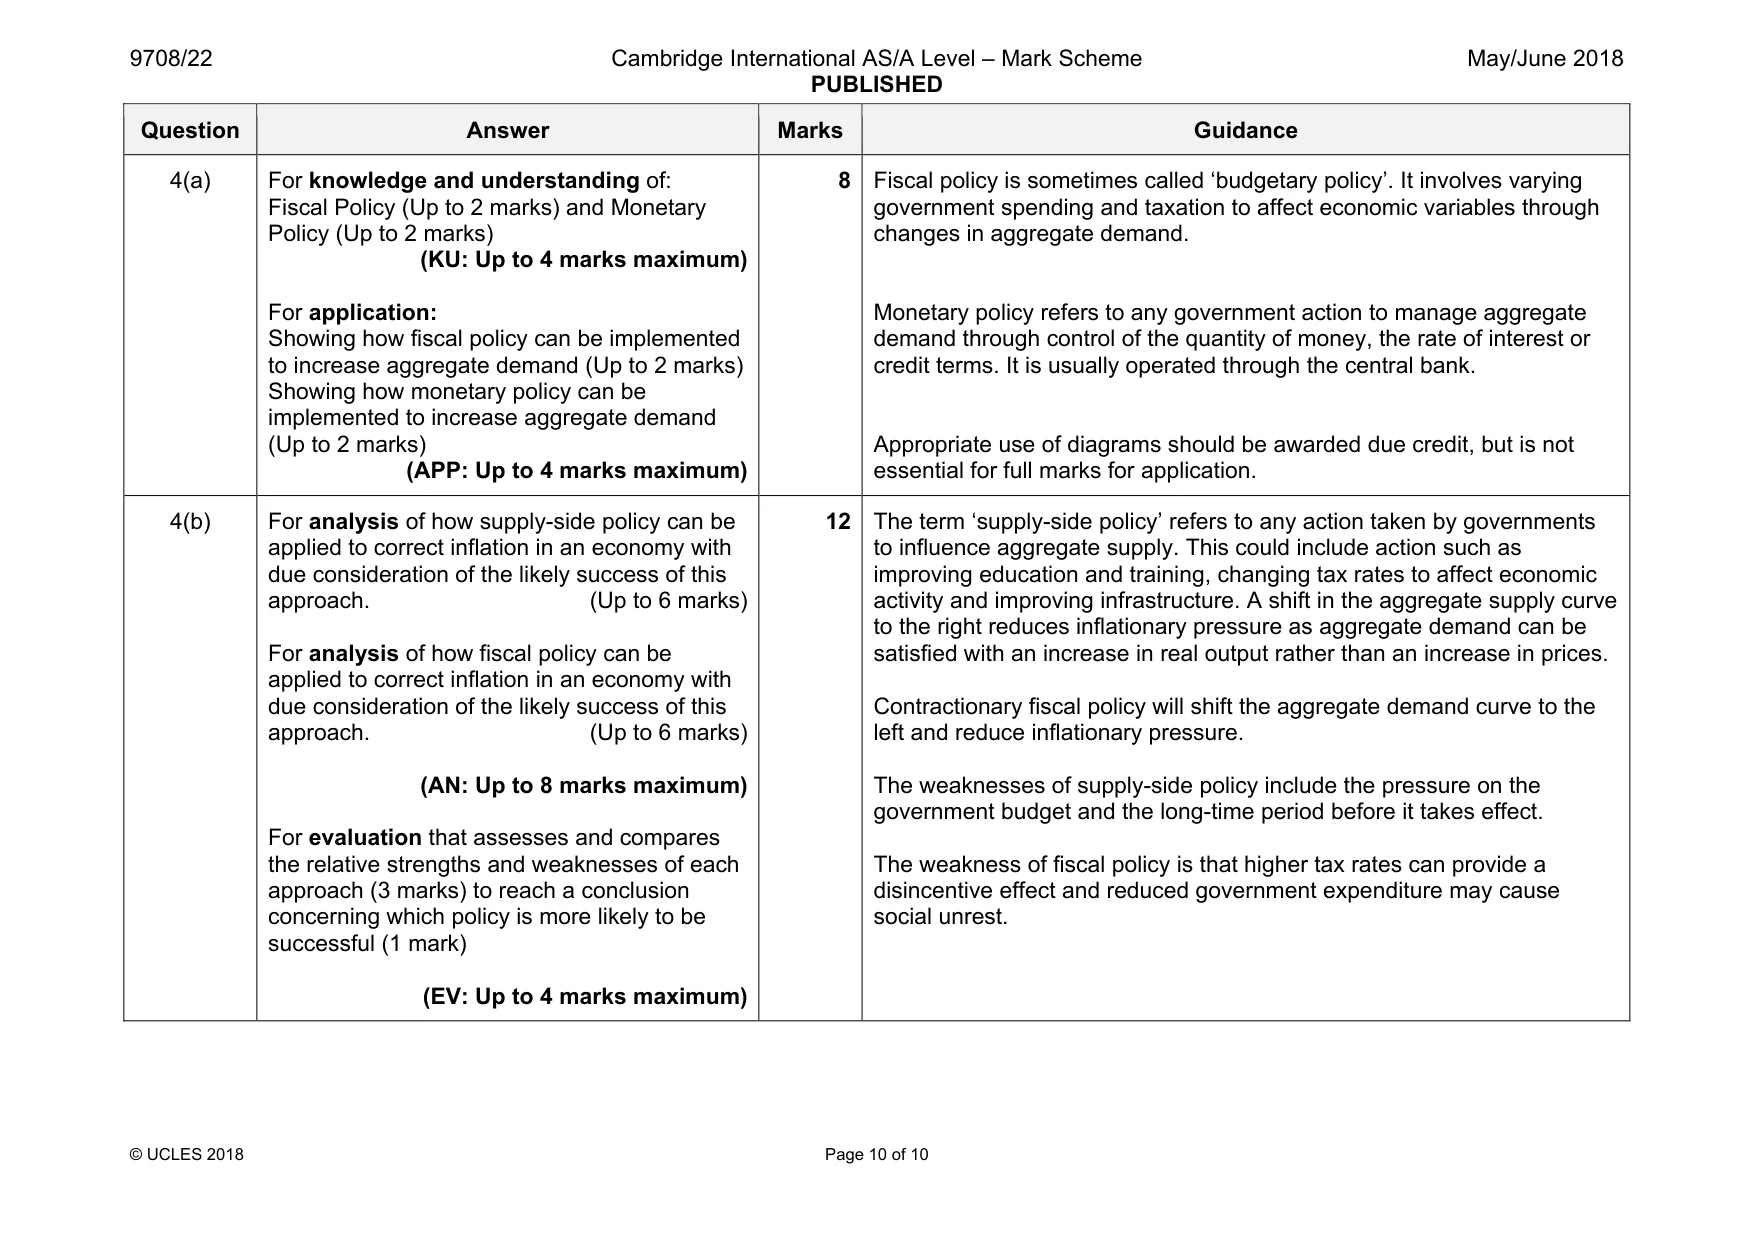
Mark scheme: 4(a) For knowledge and understanding of: Fiscal Policy (Up to 2 marks) and Monetary Policy (Up to 2 marks) (KU: Up to 4 marks maximum) For application: Showing how fiscal policy can be implemented to increase aggregate demand (Up to 2 marks) Showing how monetary policy can be implemented to increase aggregate demand (Up to 2 marks) (APP: Up to 4 marks maximum) 8 government spending and taxation to affect economic variables through changes in aggregate demand. Monetary policy refers to any government action to manage aggregate demand through control of the quantity of money, the rate of interest or credit terms. It is usually operated through the central bank. Appropriate use of diagrams should be awarded due credit, but is not essential for full marks for application. 4(b) For analysis of how supply-side policy can be applied to correct inflation in an economy with due consideration of the likely success of this approach. (Up to 6 marks) For analysis of how fiscal policy can be applied to correct inflation in an economy with due consideration of the likely success of this approach. (Up to 6 marks) (AN: Up to 8 marks maximum) For evaluation that assesses and compares the relative strengths and weaknesses of each approach (3 marks) to reach a conclusion concerning which policy is more likely to be successful (1 mark) (EV: Up to 4 marks maximum) 12 The term ‘supply-side policy’ refers to any action taken by governments to influence aggregate supply. This could include action such as improving education and training, changing tax rates to affect economic activity and improving infrastructure. A shift in the aggregate supply curve to the right reduces inflationary pressure as aggregate demand can be satisfied with an increase in real output rather than an increase in prices. Contractionary fiscal policy will shift the aggregate demand curve to the left and reduce inflationary pressure. The weaknesses of supply-side policy include the pressure on the government budget and the long-time period before it takes effect. The weakness of fiscal policy is that higher tax rates can provide a disincentive effect and reduced government expenditure may cause social unrest.
More questions on Links between macroeconomic problems and their interrelatedness
What was in this paper
The subtopics covered by these 4 questions, and how many questions each got. Open one in a new tab to see every Cambridge question on it.
What you needed in this session
Cambridge’s own grade thresholds for 2018 May/June, Paper 2 · Variant 2. A higher threshold means an easier paper — the bar moves with how the cohort did.