Cambridge A Level Economics 9708 — 2014 Oct/Nov Paper 2 · Variant 3
9708/23/O/N/14 · 40 marks · ≈45 min
The question paper and its mark scheme, free to read here and free to download. This is Cambridge’s own paper, exactly as it was sat.
Question paper4 pages
Mark scheme6 pages
Answers below. Sit the paper first if you are practising.
Paper as text
Question paper, page 1
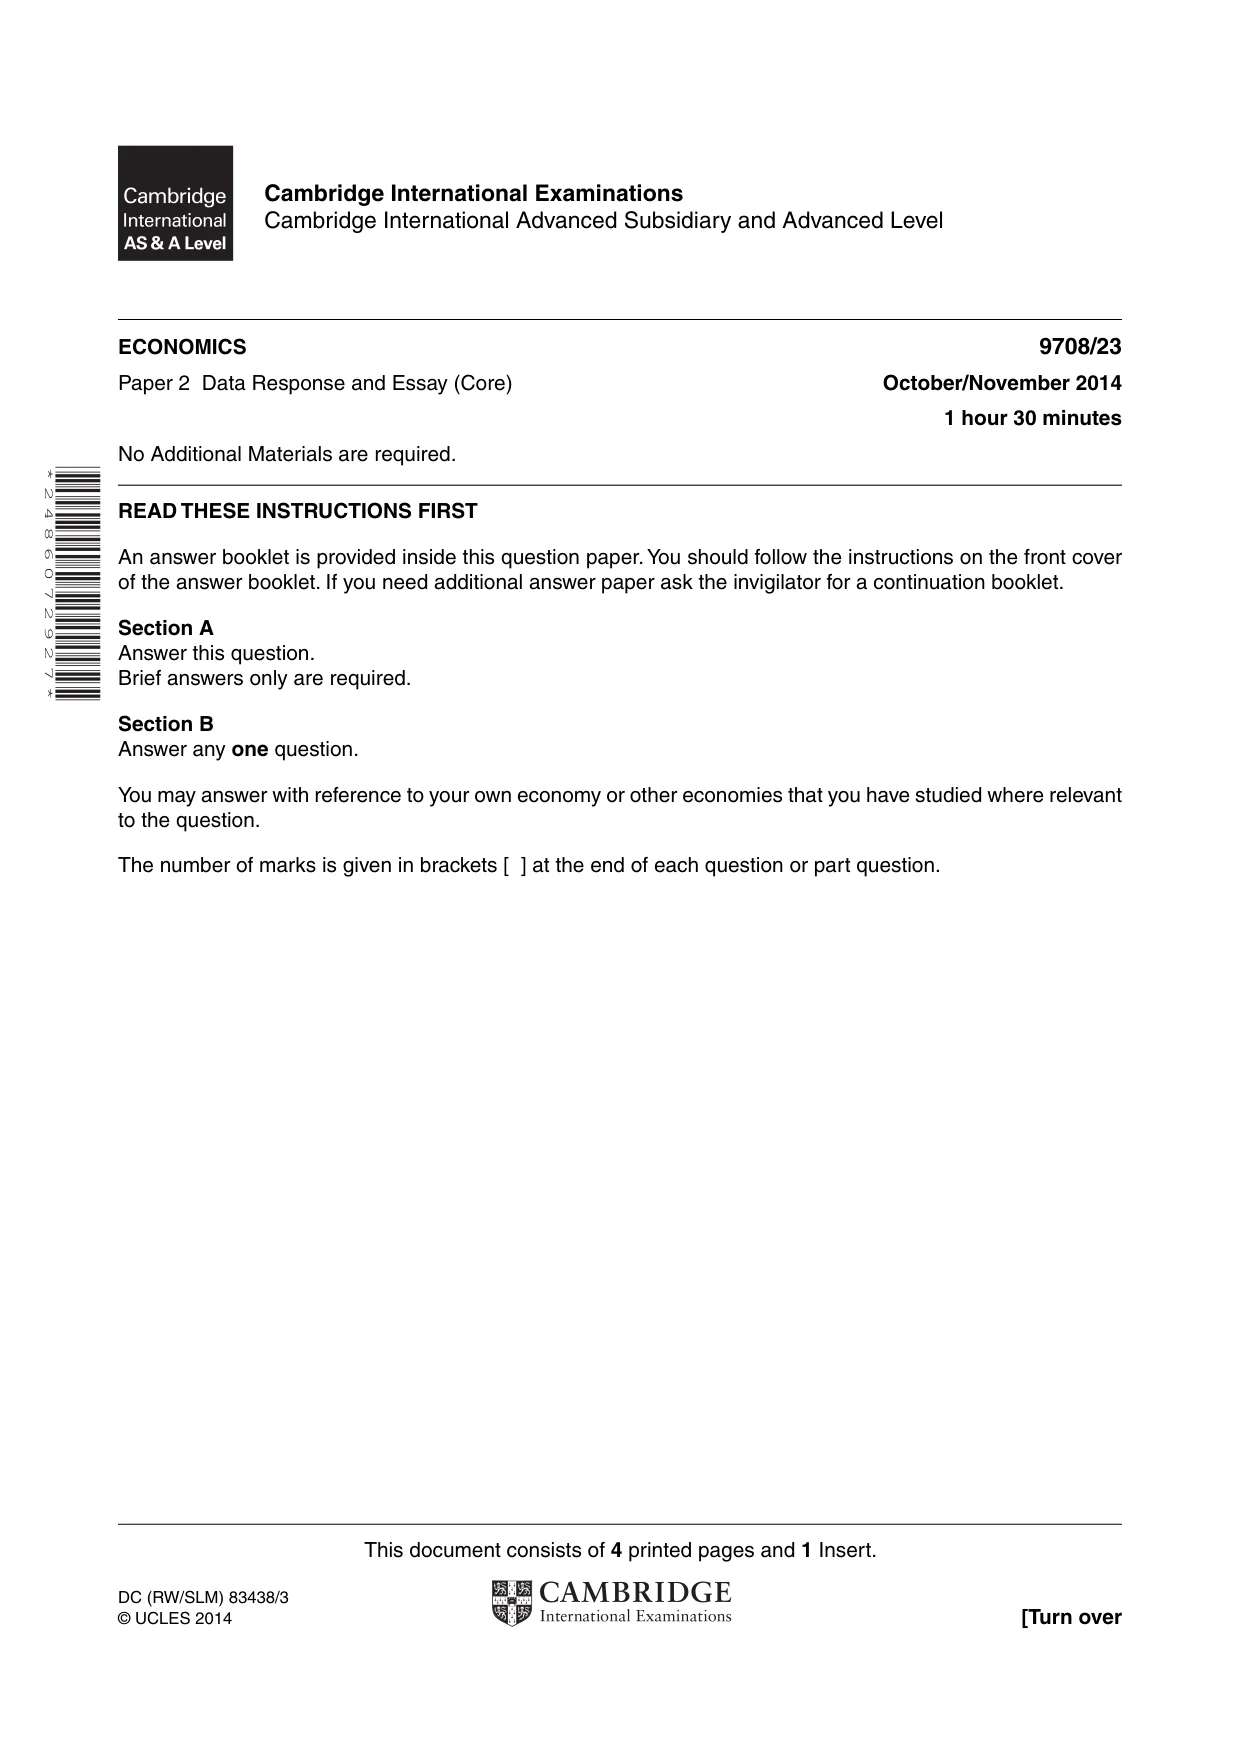
This document consists of 4 printed pages and 1 Insert. DC (RW/SLM) 83438/3 © UCLES 2014 [Turn over Cambridge International Examinations Cambridge International Advanced Subsidiary and Advanced Level * 2 4 8 6 0 7 2 9 2 7 * ECONOMICS 9708/23 Paper 2 Data Response and Essay (Core) October/November 2014 1 hour 30 minutes No Additional Materials are required. READ THESE INSTRUCTIONS FIRST An answer booklet is provided inside this question paper. You should follow the instructions on the front cover of the answer booklet. If you need additional answer paper ask the invigilator for a continuation booklet. Section A Answer this question. Brief answers only are required. Section B Answer any one question. You may answer with reference to your own economy or other economies that you have studied where relevant to the question. The number of marks is given in brackets [ ] at the end of each question or part question.
Question paper, page 2
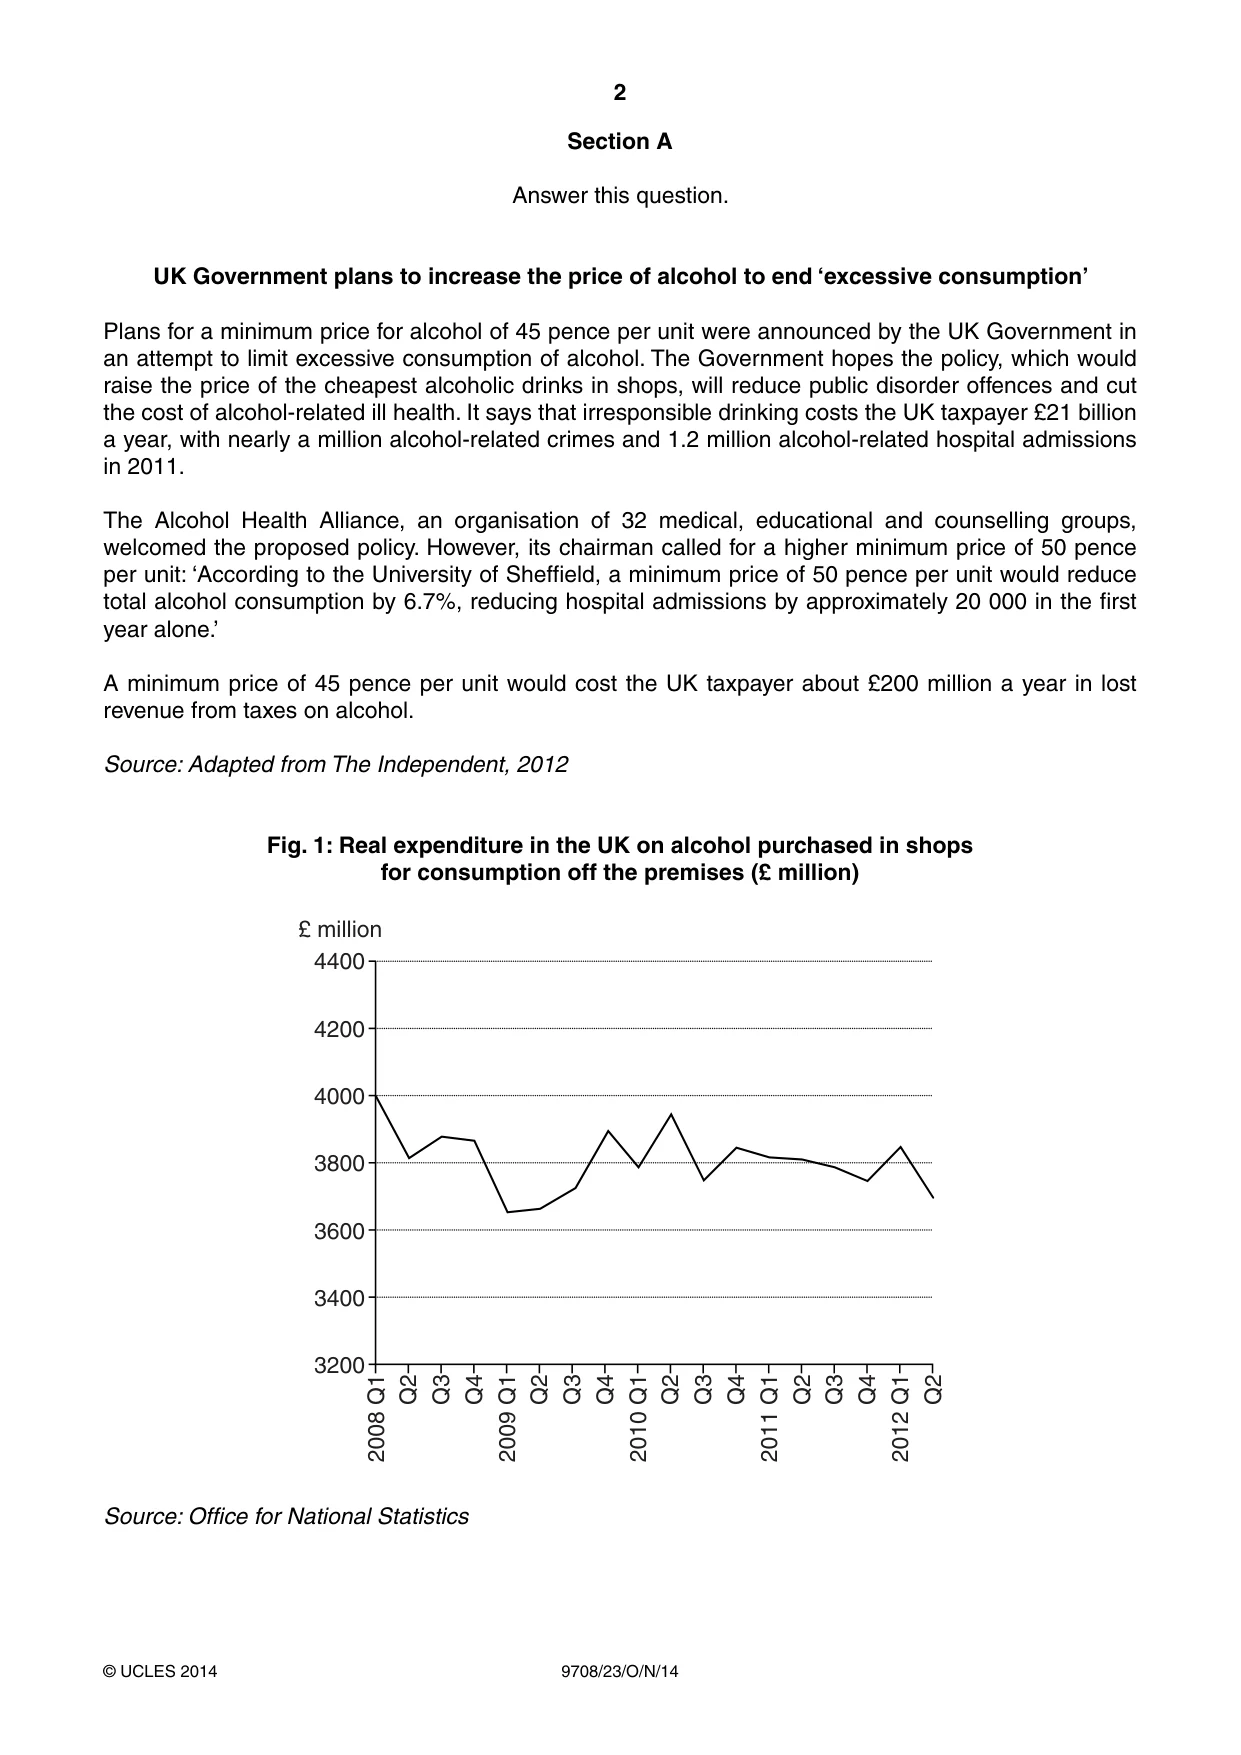
2 9708/23/O/N/14 © UCLES 2014 Section A Answer this question. UK Government plans to increase the price of alcohol to end ‘excessive consumption’ Plans for a minimum price for alcohol of 45 pence per unit were announced by the UK Government in an attempt to limit excessive consumption of alcohol. The Government hopes the policy, which would raise the price of the cheapest alcoholic drinks in shops, will reduce public disorder offences and cut the cost of alcohol-related ill health. It says that irresponsible drinking costs the UK taxpayer £21 billion a year, with nearly a million alcohol-related crimes and 1.2 million alcohol-related hospital admissions in 2011. The Alcohol Health Alliance, an organisation of 32 medical, educational and counselling groups, welcomed the proposed policy. However, its chairman called for a higher minimum price of 50 pence per unit: ‘According to the University of Sheffield, a minimum price of 50 pence per unit would reduce total alcohol consumption by 6.7%, reducing hospital admissions by approximately 20 000 in the first year alone.’ A minimum price of 45 pence per unit would cost the UK taxpayer about £200 million a year in lost revenue from taxes on alcohol. Source: Adapted from The Independent, 2012 Fig. 1: Real expenditure in the UK on alcohol purchased in shops for consumption off the premises (£ million) 3200 3400 3600 3800 2008 Q1 Q2 Q3 Q4 2009 Q1 Q2 Q3 Q4 2010 Q1 Q2 Q3 Q4 2011 Q1 Q2 Q3 Q4 2012 Q1 Q2 4000 4200 4400 £ million Source: Office for National Statistics
Question paper, page 3
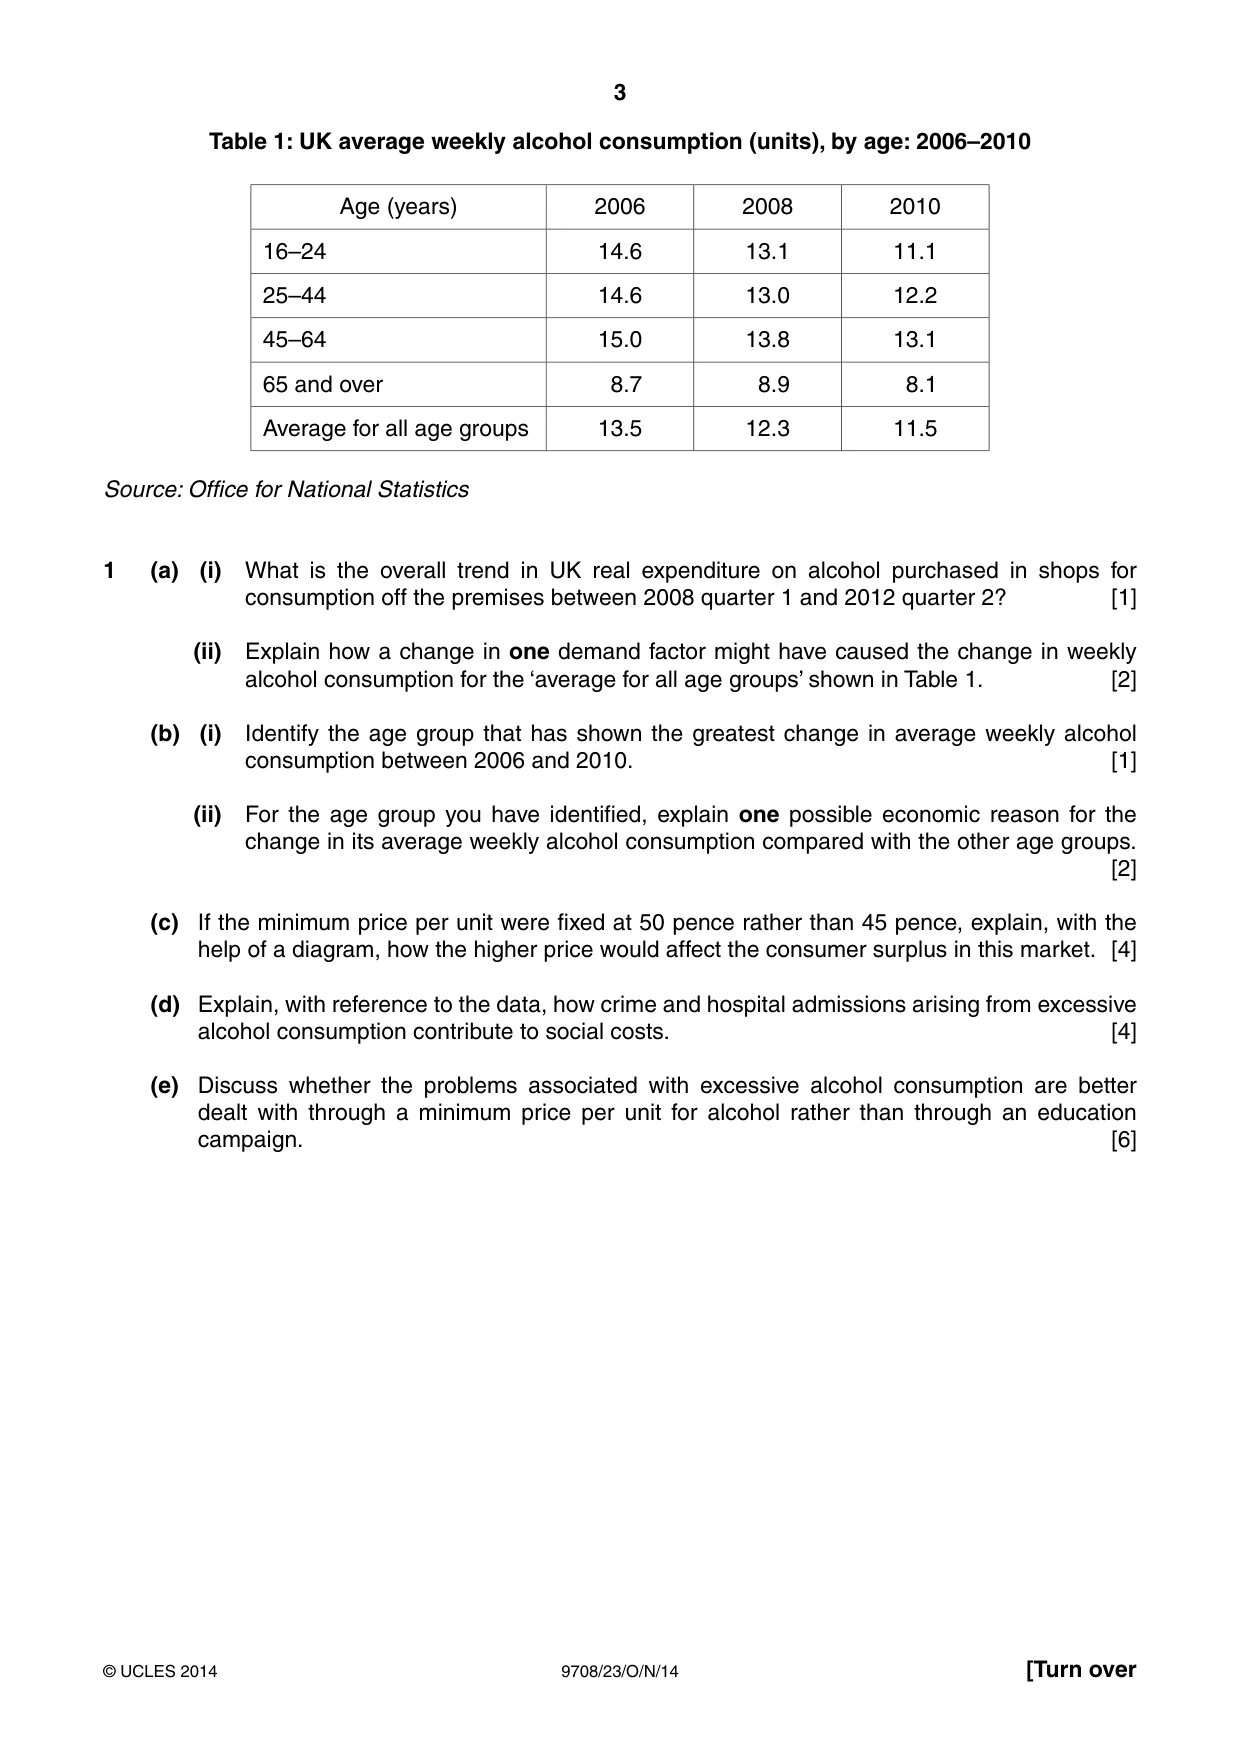
3 9708/23/O/N/14 © UCLES 2014 [Turn over Table 1: UK average weekly alcohol consumption (units), by age: 2006–2010 Age (years) 2006 2008 2010 16–24 14.6 13.1 11.1 25–44 14.6 13.0 12.2 45–64 15.0 13.8 13.1 65 and over 8.7 8.9 8.1 Average for all age groups 13.5 12.3 11.5 Source: Office for National Statistics 1 (a) (i) What is the overall trend in UK real expenditure on alcohol purchased in shops for consumption off the premises between 2008 quarter 1 and 2012 quarter 2? [1] (ii) Explain how a change in one demand factor might have caused the change in weekly alcohol consumption for the ‘average for all age groups’ shown in Table 1. [2] (b) (i) Identify the age group that has shown the greatest change in average weekly alcohol consumption between 2006 and 2010. [1] (ii) For the age group you have identified, explain one possible economic reason for the change in its average weekly alcohol consumption compared with the other age groups. [2] (c) If the minimum price per unit were fixed at 50 pence rather than 45 pence, explain, with the help of a diagram, how the higher price would affect the consumer surplus in this market. [4] (d) Explain, with reference to the data, how crime and hospital admissions arising from excessive alcohol consumption contribute to social costs. [4] (e) Discuss whether the problems associated with excessive alcohol consumption are better dealt with through a minimum price per unit for alcohol rather than through an education campaign. [6]
Question paper, page 4
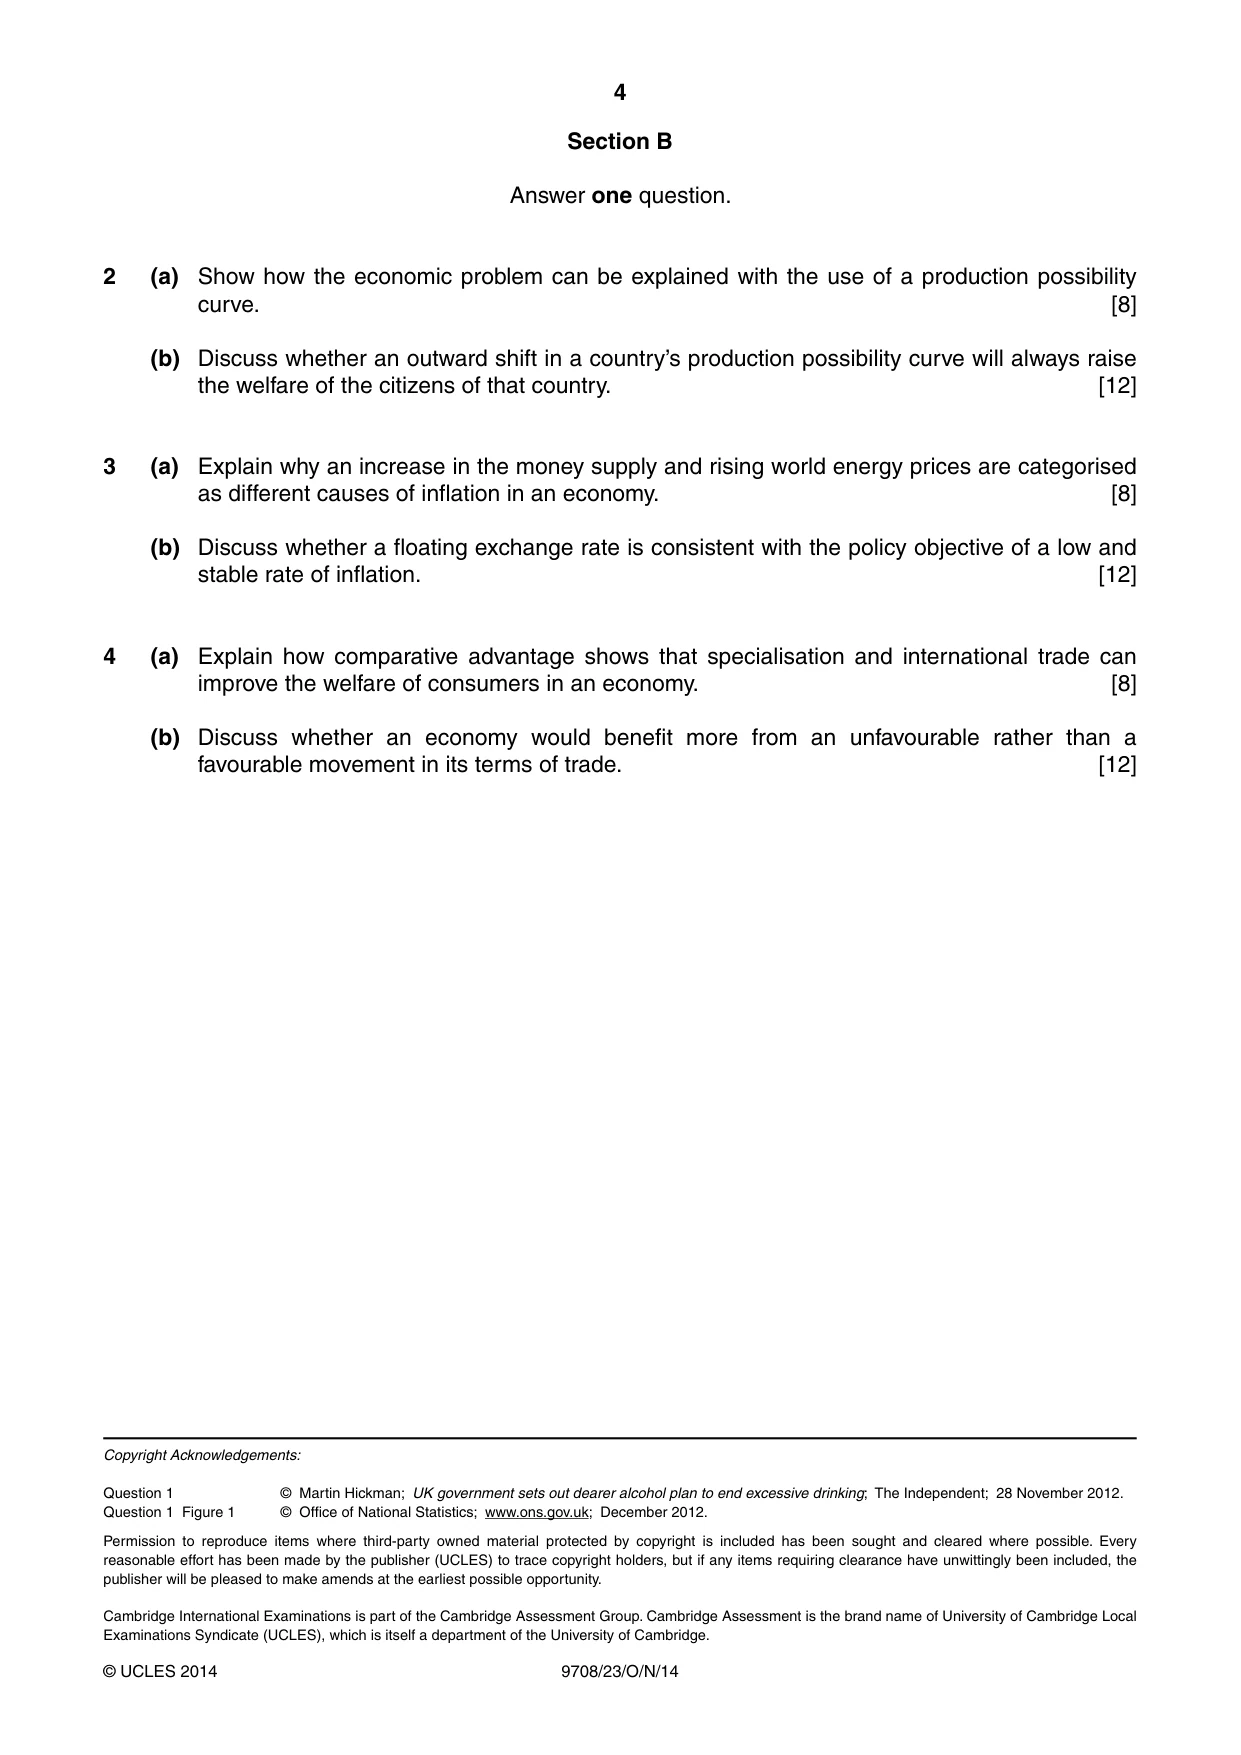
4 9708/23/O/N/14 © UCLES 2014 Section B Answer one question. 2 (a) Show how the economic problem can be explained with the use of a production possibility curve. [8] (b) Discuss whether an outward shift in a country’s production possibility curve will always raise the welfare of the citizens of that country. [12] 3 (a) Explain why an increase in the money supply and rising world energy prices are categorised as different causes of inflation in an economy. [8] (b) Discuss whether a floating exchange rate is consistent with the policy objective of a low and stable rate of inflation. [12] 4 (a) Explain how comparative advantage shows that specialisation and international trade can improve the welfare of consumers in an economy. [8] (b) Discuss whether an economy would benefit more from an unfavourable rather than a favourable movement in its terms of trade. [12] Copyright Acknowledgements: Question 1 Question 1 Figure 1 © Martin Hickman; UK government sets out dearer alcohol plan to end excessive drinking; The Independent; 28 November 2012. © Office of National Statistics; www.ons.gov.uk; December 2012. Permission to reproduce items where third-party owned material protected by copyright is included has been sought and cleared where possible. Every reasonable effort has been made by the publisher (UCLES) to trace copyright holders, but if any items requiring clearance have unwittingly been included, the publisher will be pleased to make amends at the earliest possible opportunity. Cambridge International Examinations is part of the Cambridge Assessment Group. Cambridge Assessment is the brand name of University of Cambridge Local Examinations Syndicate (UCLES), which is itself a department of the University of Cambridge.
Mark scheme, page 1
® IGCSE is the registered trademark of Cambridge International Examinations. CAMBRIDGE INTERNATIONAL EXAMINATIONS Cambridge International Advanced Subsidiary and Advanced Level MARK SCHEME for the October/November 2014 series 9708 ECONOMICS 9708/23 Paper 2 (Data Response and Essay – Core), maximum raw mark 40 This mark scheme is published as an aid to teachers and candidates, to indicate the requirements of the examination. It shows the basis on which Examiners were instructed to award marks. It does not indicate the details of the discussions that took place at an Examiners’ meeting before marking began, which would have considered the acceptability of alternative answers. Mark schemes should be read in conjunction with the question paper and the Principal Examiner Report for Teachers. Cambridge will not enter into discussions about these mark schemes. Cambridge is publishing the mark schemes for the October/November 2014 series for most Cambridge IGCSE®, Cambridge International A and AS Level components and some Cambridge O Level components.
Mark scheme, page 2
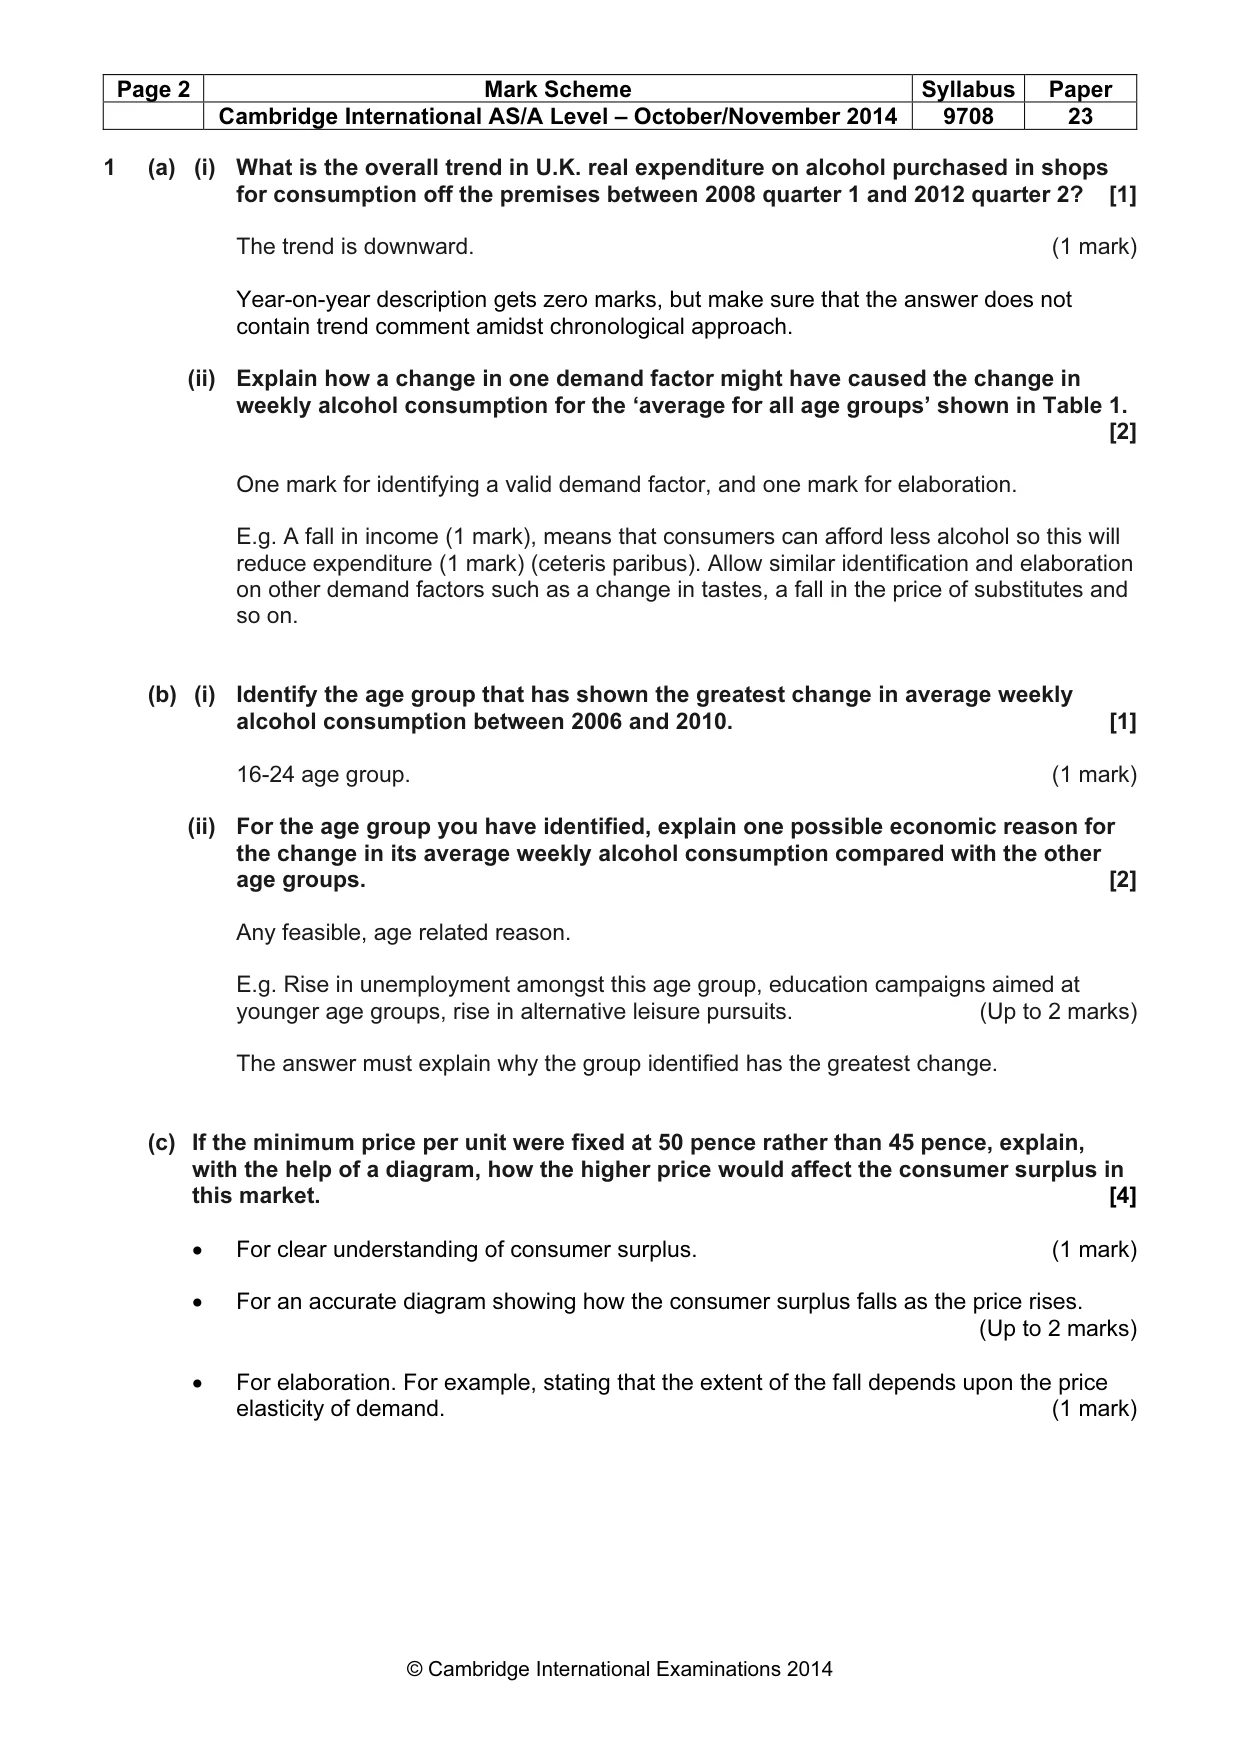
Page 2 Mark Scheme Syllabus Paper Cambridge International AS/A Level – October/November 2014 9708 23 © Cambridge International Examinations 2014 1 (a) (i) What is the overall trend in U.K. real expenditure on alcohol purchased in shops for consumption off the premises between 2008 quarter 1 and 2012 quarter 2? [1] The trend is downward. (1 mark) Year-on-year description gets zero marks, but make sure that the answer does not contain trend comment amidst chronological approach. (ii) Explain how a change in one demand factor might have caused the change in weekly alcohol consumption for the ‘average for all age groups’ shown in Table 1. [2] One mark for identifying a valid demand factor, and one mark for elaboration. E.g. A fall in income (1 mark), means that consumers can afford less alcohol so this will reduce expenditure (1 mark) (ceteris paribus). Allow similar identification and elaboration on other demand factors such as a change in tastes, a fall in the price of substitutes and so on. (b) (i) Identify the age group that has shown the greatest change in average weekly alcohol consumption between 2006 and 2010. [1] 16-24 age group. (1 mark) (ii) For the age group you have identified, explain one possible economic reason for the change in its average weekly alcohol consumption compared with the other age groups. [2] Any feasible, age related reason. E.g. Rise in unemployment amongst this age group, education campaigns aimed at younger age groups, rise in alternative leisure pursuits. (Up to 2 marks) The answer must explain why the group identified has the greatest change. (c) If the minimum price per unit were fixed at 50 pence rather than 45 pence, explain, with the help of a diagram, how the higher price would affect the consumer surplus in this market. [4] • For clear understanding of consumer surplus. (1 mark) • For an accurate diagram showing how the consumer surplus falls as the price rises. (Up to 2 marks) • For elaboration. For example, stating that the extent of the fall depends upon the price elasticity of demand. (1 mark)
Mark scheme, page 3
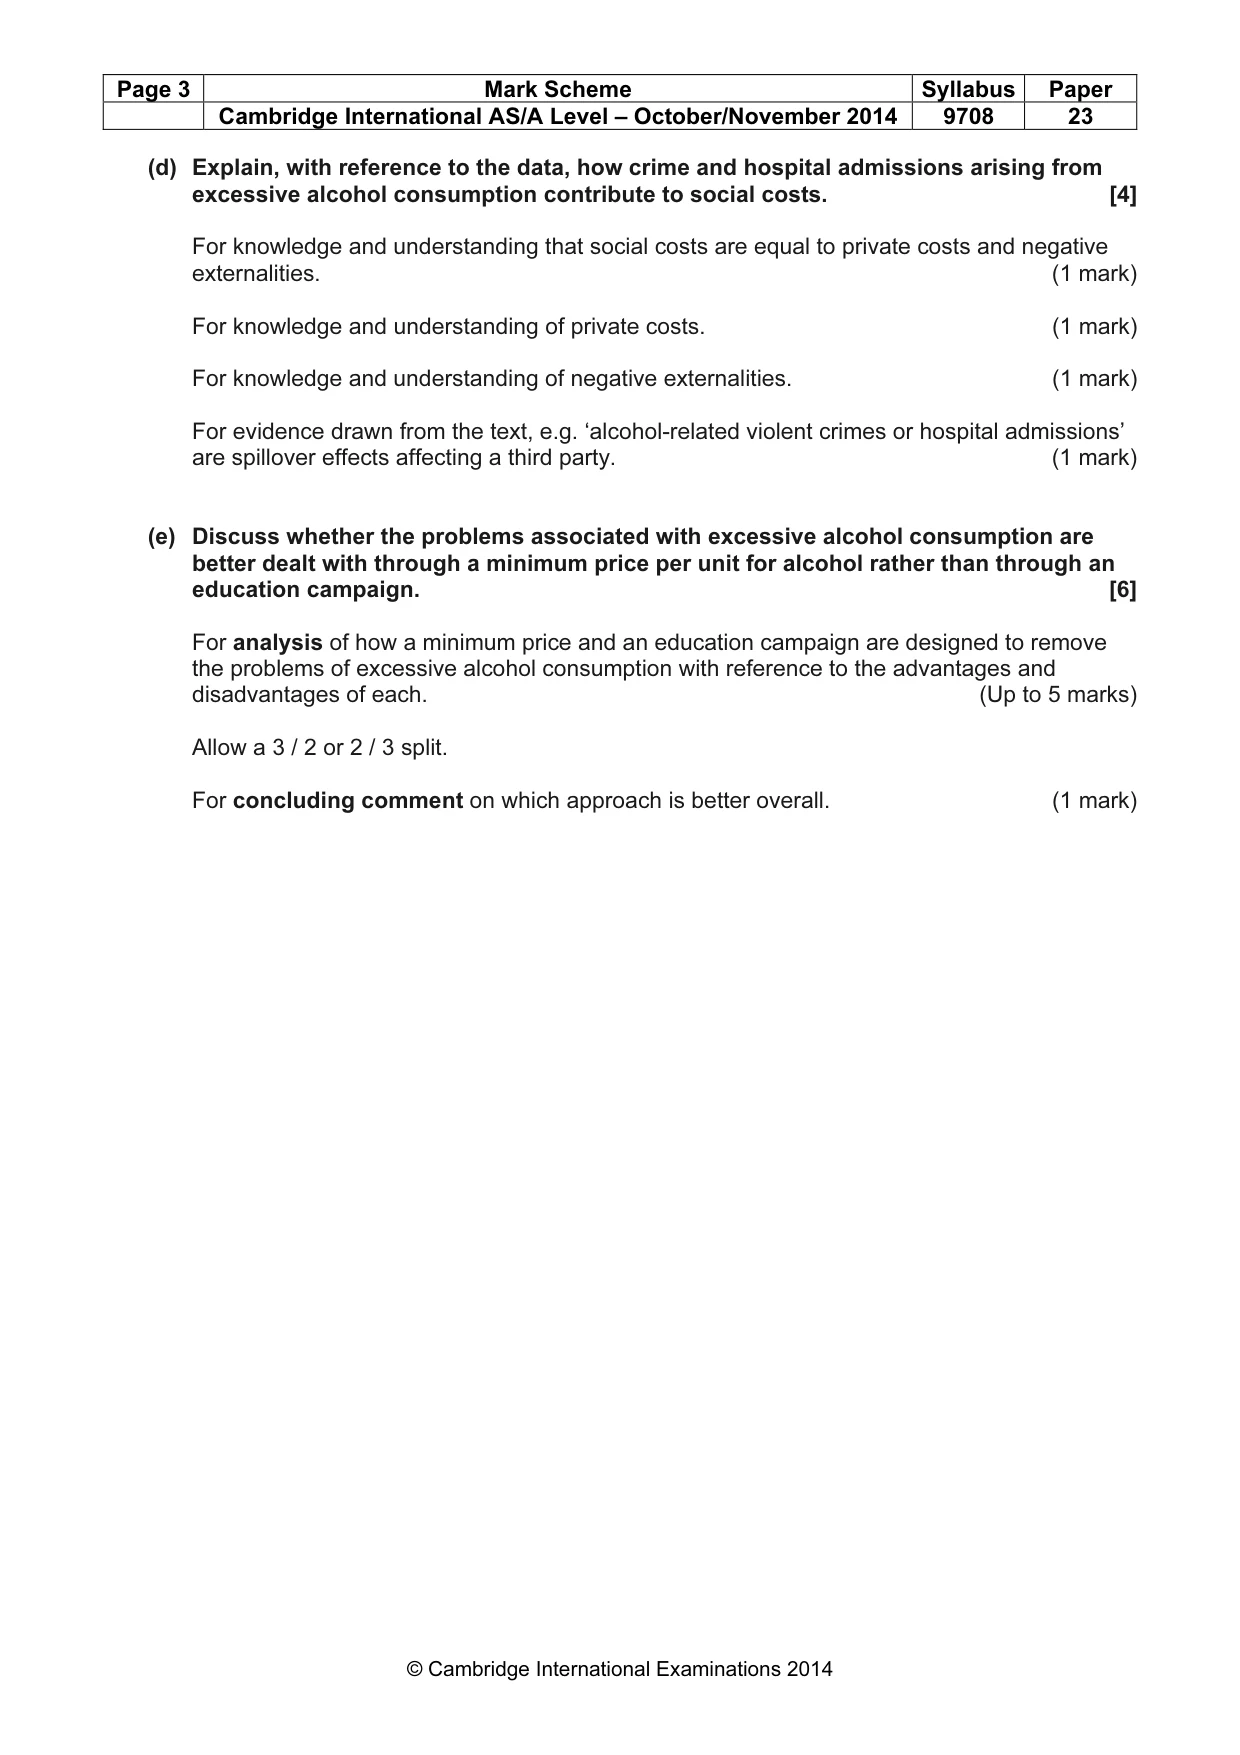
Page 3 Mark Scheme Syllabus Paper Cambridge International AS/A Level – October/November 2014 9708 23 © Cambridge International Examinations 2014 (d) Explain, with reference to the data, how crime and hospital admissions arising from excessive alcohol consumption contribute to social costs. [4] For knowledge and understanding that social costs are equal to private costs and negative externalities. (1 mark) For knowledge and understanding of private costs. (1 mark) For knowledge and understanding of negative externalities. (1 mark) For evidence drawn from the text, e.g. ‘alcohol-related violent crimes or hospital admissions’ are spillover effects affecting a third party. (1 mark) (e) Discuss whether the problems associated with excessive alcohol consumption are better dealt with through a minimum price per unit for alcohol rather than through an education campaign. [6] For analysis of how a minimum price and an education campaign are designed to remove the problems of excessive alcohol consumption with reference to the advantages and disadvantages of each. (Up to 5 marks) Allow a 3 / 2 or 2 / 3 split. For concluding comment on which approach is better overall. (1 mark)
Mark scheme, page 4
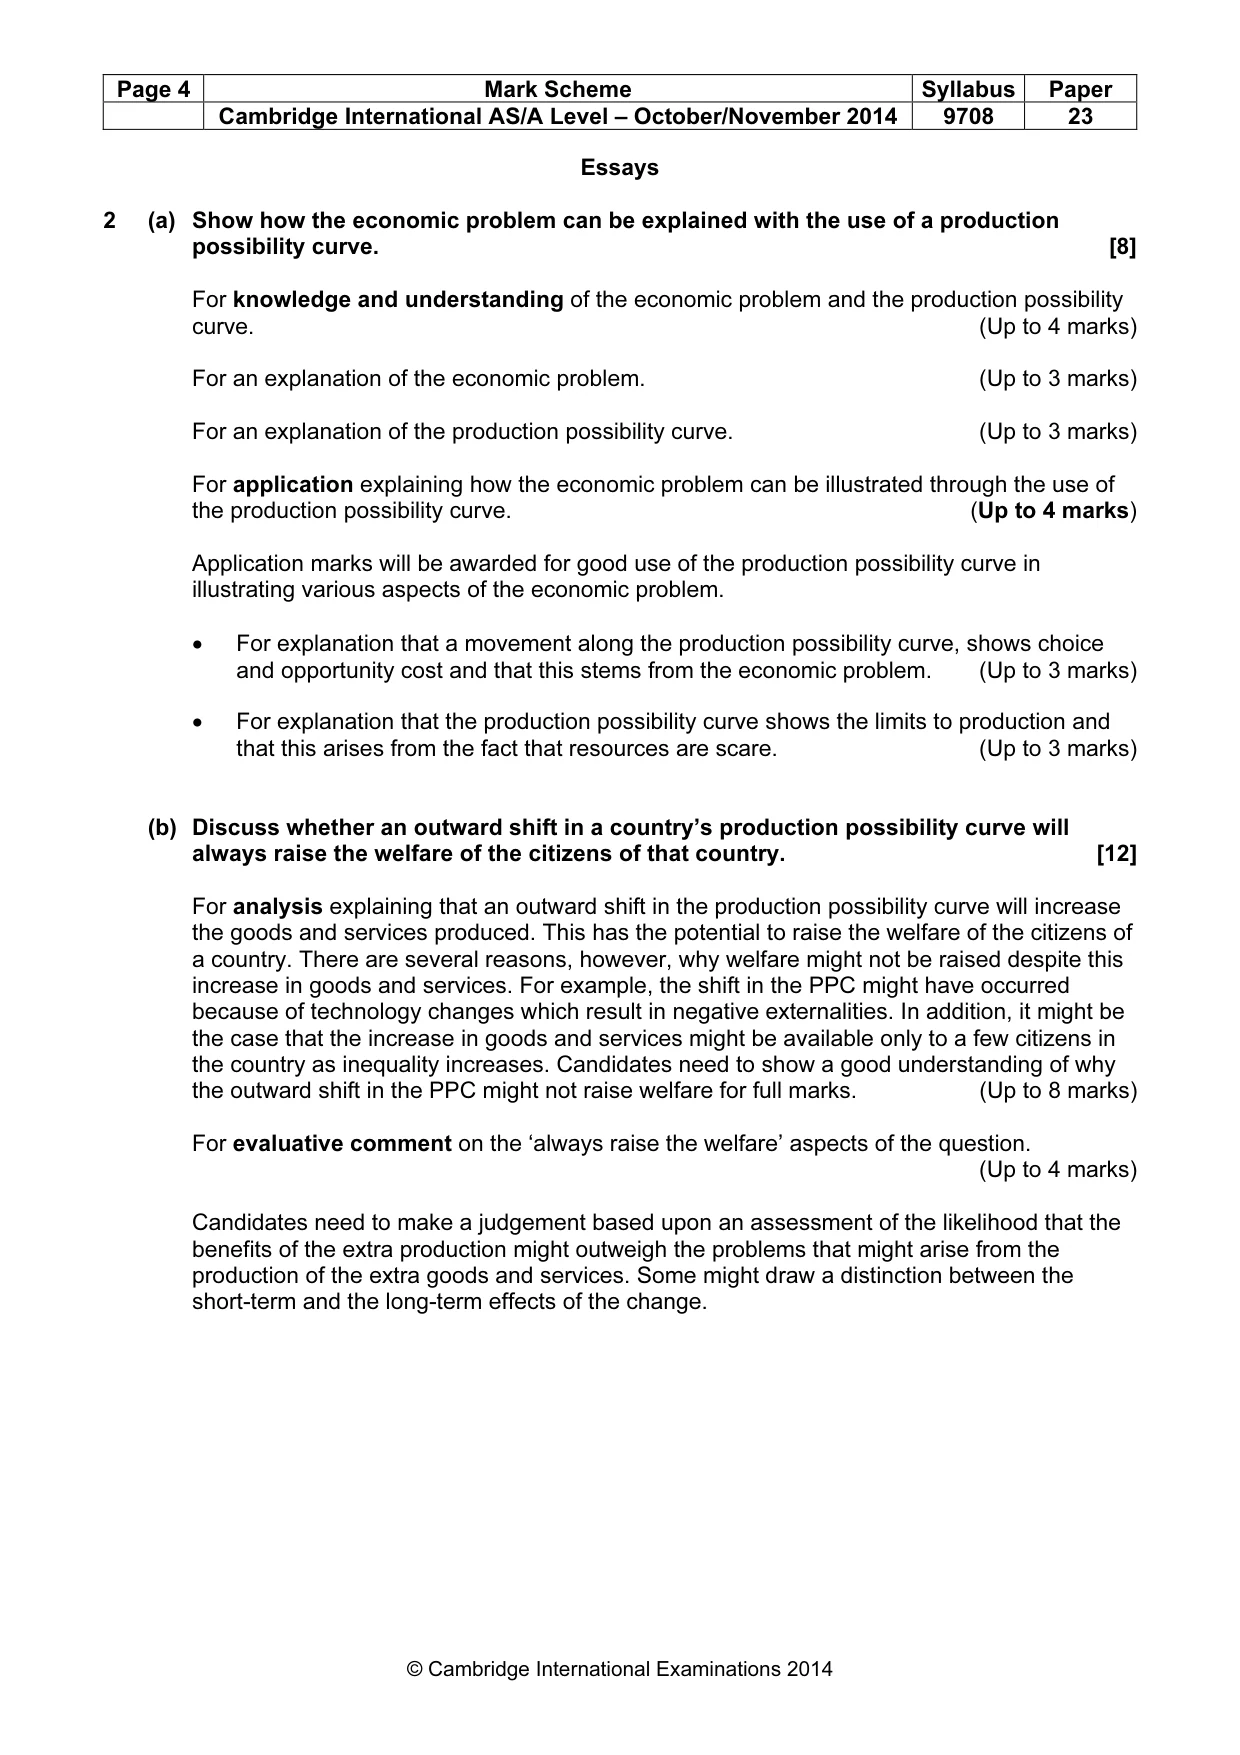
Page 4 Mark Scheme Syllabus Paper Cambridge International AS/A Level – October/November 2014 9708 23 © Cambridge International Examinations 2014 Essays 2 (a) Show how the economic problem can be explained with the use of a production possibility curve. [8] For knowledge and understanding of the economic problem and the production possibility curve. (Up to 4 marks) For an explanation of the economic problem. (Up to 3 marks) For an explanation of the production possibility curve. (Up to 3 marks) For application explaining how the economic problem can be illustrated through the use of the production possibility curve. (Up to 4 marks) Application marks will be awarded for good use of the production possibility curve in illustrating various aspects of the economic problem. • For explanation that a movement along the production possibility curve, shows choice and opportunity cost and that this stems from the economic problem. (Up to 3 marks) • For explanation that the production possibility curve shows the limits to production and that this arises from the fact that resources are scare. (Up to 3 marks) (b) Discuss whether an outward shift in a country’s production possibility curve will always raise the welfare of the citizens of that country. [12] For analysis explaining that an outward shift in the production possibility curve will increase the goods and services produced. This has the potential to raise the welfare of the citizens of a country. There are several reasons, however, why welfare might not be raised despite this increase in goods and services. For example, the shift in the PPC might have occurred because of technology changes which result in negative externalities. In addition, it might be the case that the increase in goods and services might be available only to a few citizens in the country as inequality increases. Candidates need to show a good understanding of why the outward shift in the PPC might not raise welfare for full marks. (Up to 8 marks) For evaluative comment on the ‘always raise the welfare’ aspects of the question. (Up to 4 marks) Candidates need to make a judgement based upon an assessment of the likelihood that the benefits of the extra production might outweigh the problems that might arise from the production of the extra goods and services. Some might draw a distinction between the short-term and the long-term effects of the change.
Mark scheme, page 5
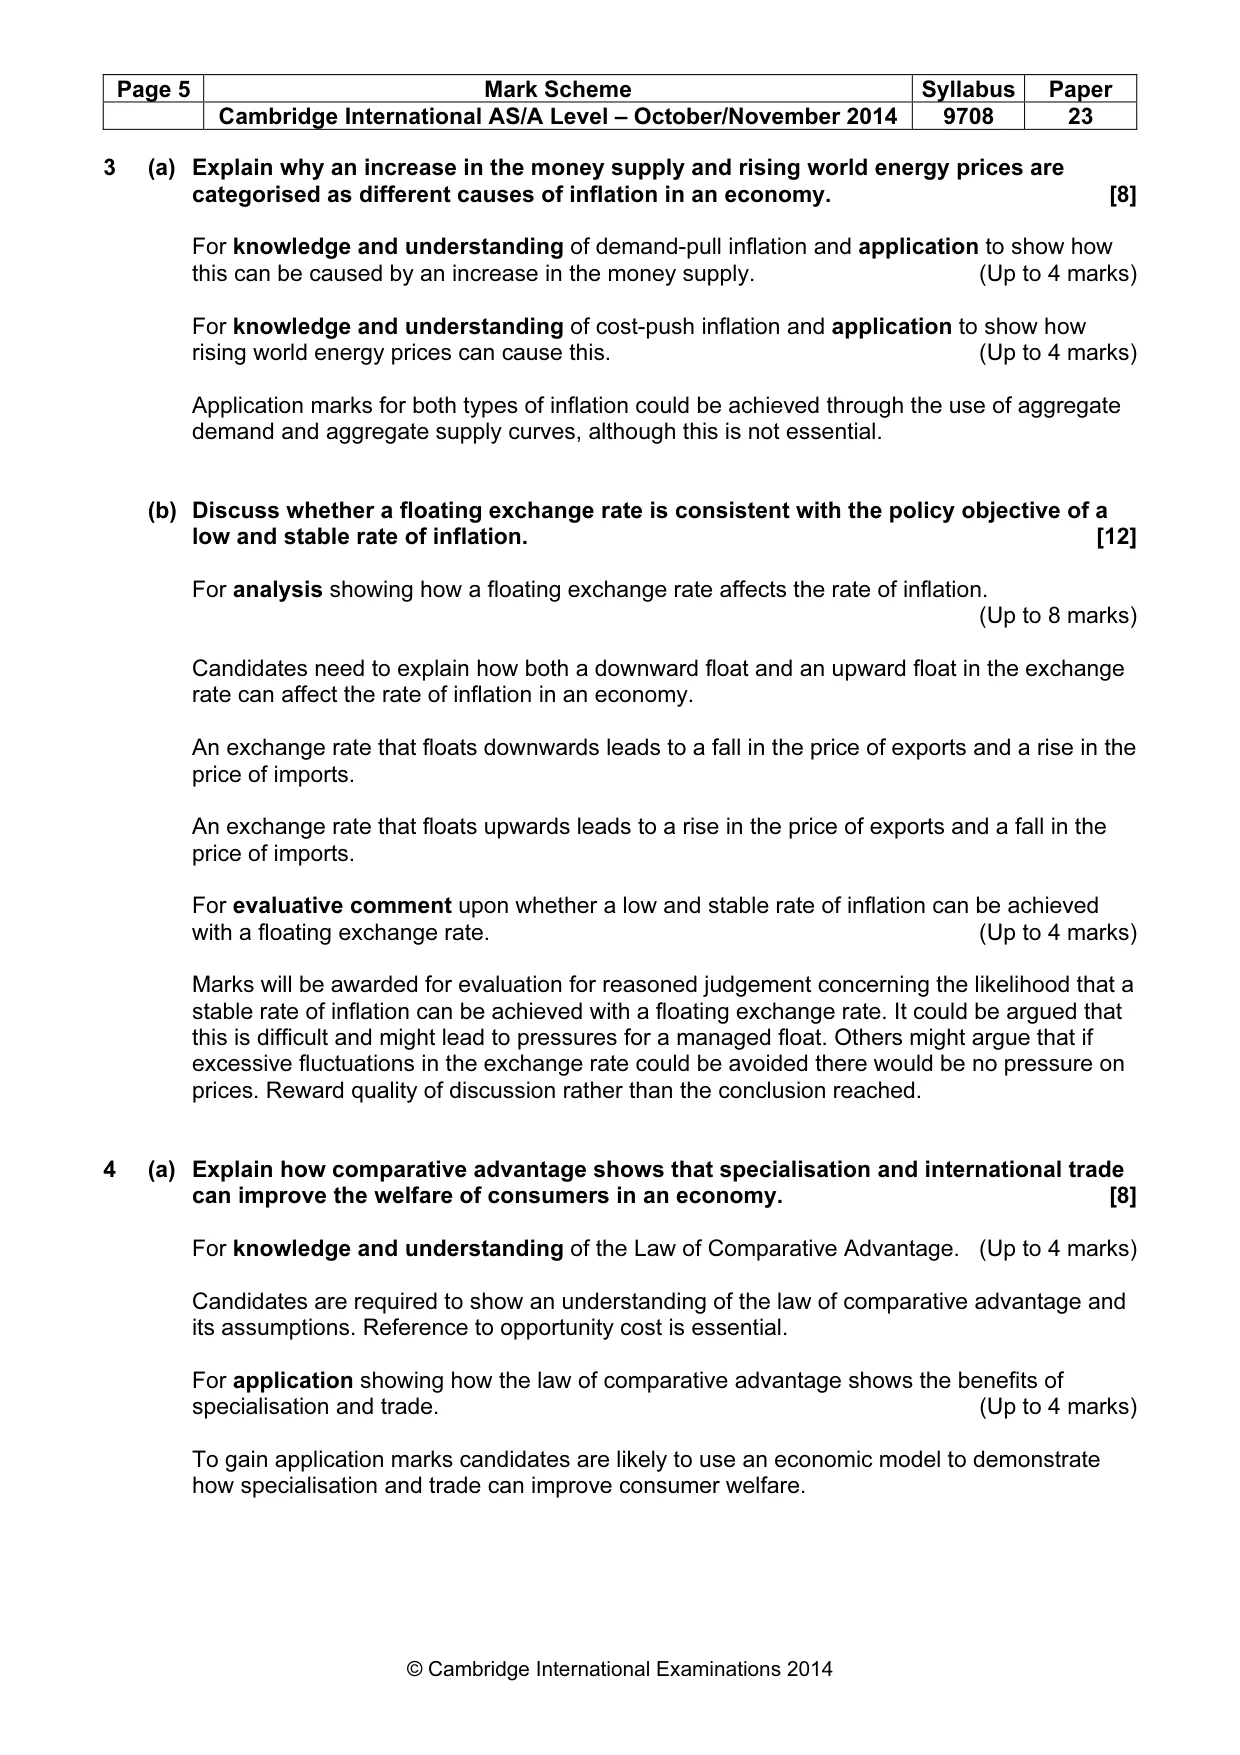
Page 5 Mark Scheme Syllabus Paper Cambridge International AS/A Level – October/November 2014 9708 23 © Cambridge International Examinations 2014 3 (a) Explain why an increase in the money supply and rising world energy prices are categorised as different causes of inflation in an economy. [8] For knowledge and understanding of demand-pull inflation and application to show how this can be caused by an increase in the money supply. (Up to 4 marks) For knowledge and understanding of cost-push inflation and application to show how rising world energy prices can cause this. (Up to 4 marks) Application marks for both types of inflation could be achieved through the use of aggregate demand and aggregate supply curves, although this is not essential. (b) Discuss whether a floating exchange rate is consistent with the policy objective of a low and stable rate of inflation. [12] For analysis showing how a floating exchange rate affects the rate of inflation. (Up to 8 marks) Candidates need to explain how both a downward float and an upward float in the exchange rate can affect the rate of inflation in an economy. An exchange rate that floats downwards leads to a fall in the price of exports and a rise in the price of imports. An exchange rate that floats upwards leads to a rise in the price of exports and a fall in the price of imports. For evaluative comment upon whether a low and stable rate of inflation can be achieved with a floating exchange rate. (Up to 4 marks) Marks will be awarded for evaluation for reasoned judgement concerning the likelihood that a stable rate of inflation can be achieved with a floating exchange rate. It could be argued that this is difficult and might lead to pressures for a managed float. Others might argue that if excessive fluctuations in the exchange rate could be avoided there would be no pressure on prices. Reward quality of discussion rather than the conclusion reached. 4 (a) Explain how comparative advantage shows that specialisation and international trade can improve the welfare of consumers in an economy. [8] For knowledge and understanding of the Law of Comparative Advantage. (Up to 4 marks) Candidates are required to show an understanding of the law of comparative advantage and its assumptions. Reference to opportunity cost is essential. For application showing how the law of comparative advantage shows the benefits of specialisation and trade. (Up to 4 marks) To gain application marks candidates are likely to use an economic model to demonstrate how specialisation and trade can improve consumer welfare.
Mark scheme, page 6
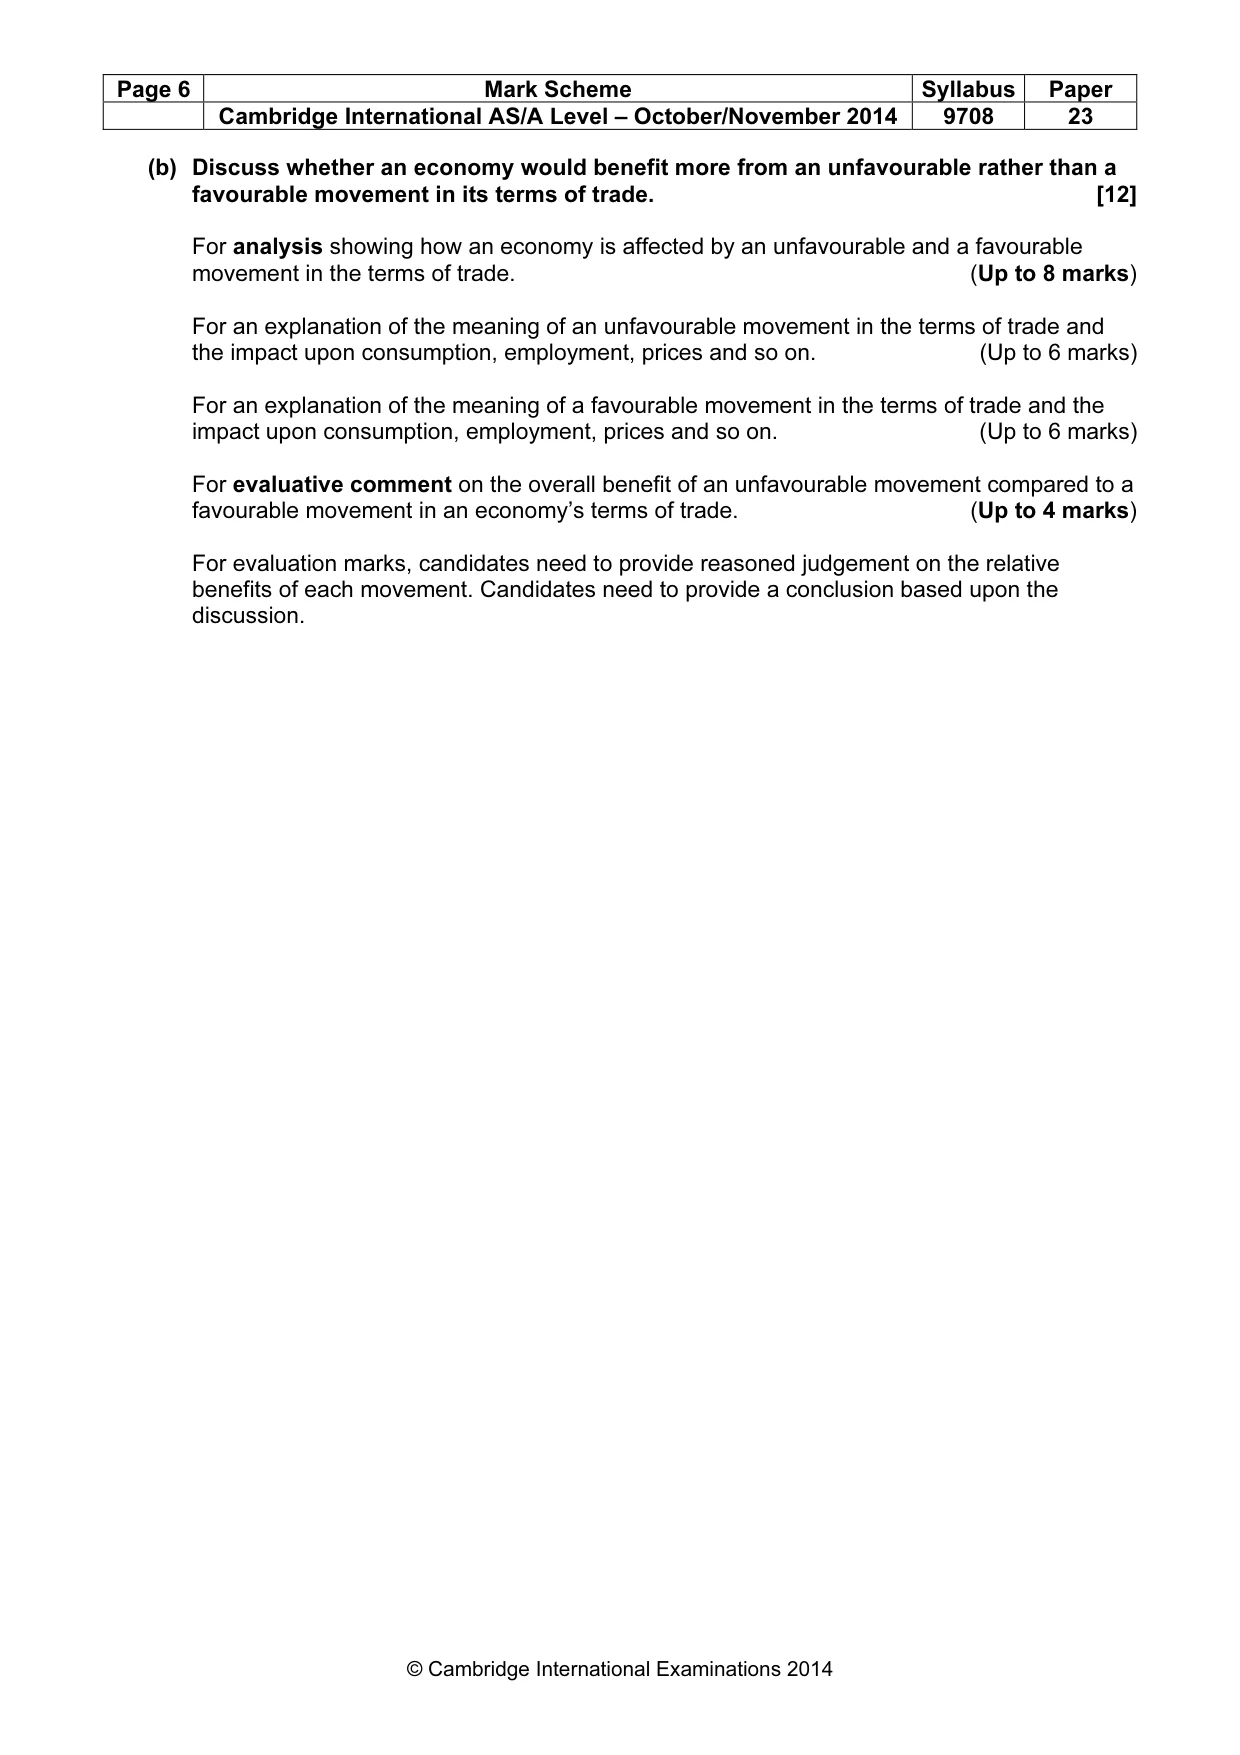
Page 6 Mark Scheme Syllabus Paper Cambridge International AS/A Level – October/November 2014 9708 23 © Cambridge International Examinations 2014 (b) Discuss whether an economy would benefit more from an unfavourable rather than a favourable movement in its terms of trade. [12] For analysis showing how an economy is affected by an unfavourable and a favourable movement in the terms of trade. (Up to 8 marks) For an explanation of the meaning of an unfavourable movement in the terms of trade and the impact upon consumption, employment, prices and so on. (Up to 6 marks) For an explanation of the meaning of a favourable movement in the terms of trade and the impact upon consumption, employment, prices and so on. (Up to 6 marks) For evaluative comment on the overall benefit of an unfavourable movement compared to a favourable movement in an economy’s terms of trade. (Up to 4 marks) For evaluation marks, candidates need to provide reasoned judgement on the relative benefits of each movement. Candidates need to provide a conclusion based upon the discussion.
What you needed in this session
Cambridge’s own grade thresholds for 2014 Oct/Nov, Paper 2 · Variant 3. A higher threshold means an easier paper — the bar moves with how the cohort did.