Cambridge A Level Economics 9708 — 2002 May/June Paper 2 · Variant 1
9708/21/M/J/02
The question paper and its mark scheme, free to read here and free to download. This is Cambridge’s own paper, exactly as it was sat.
Question paper4 pages

Mark scheme4 pages
Answers below. Sit the paper first if you are practising.
Paper as text
Question paper, page 1
This question paper consists of 4 printed pages. SB (SLC/SLC) S09565/3 © CIE 2002 [Turn over CAMBRIDGE INTERNATIONAL EXAMINATIONS General Certificate of Education Advanced Subsidiary Level and Advanced Level ECONOMICS 9708/2 PAPER 2 Data Response and Essay (Core) MAY/JUNE SESSION 2002 1 hour 30 minutes Additional materials: Answer paper TIME 1 hour 30 minutes INSTRUCTIONS TO CANDIDATES Write your name, Centre number and candidate number in the spaces provided on the answer paper/ answer booklet. Answer two questions. Write your answers on the separate answer paper provided. If you use more than one sheet of paper, fasten the sheets together. Section A Answer this question. Section B Answer any one question. INFORMATION FOR CANDIDATES The questions in this paper carry equal marks. The number of marks is given in brackets [ ] at the end of each part question. You may answer with reference to your own economy or other economies that you have studied where relevant to the question.
Question paper, page 2
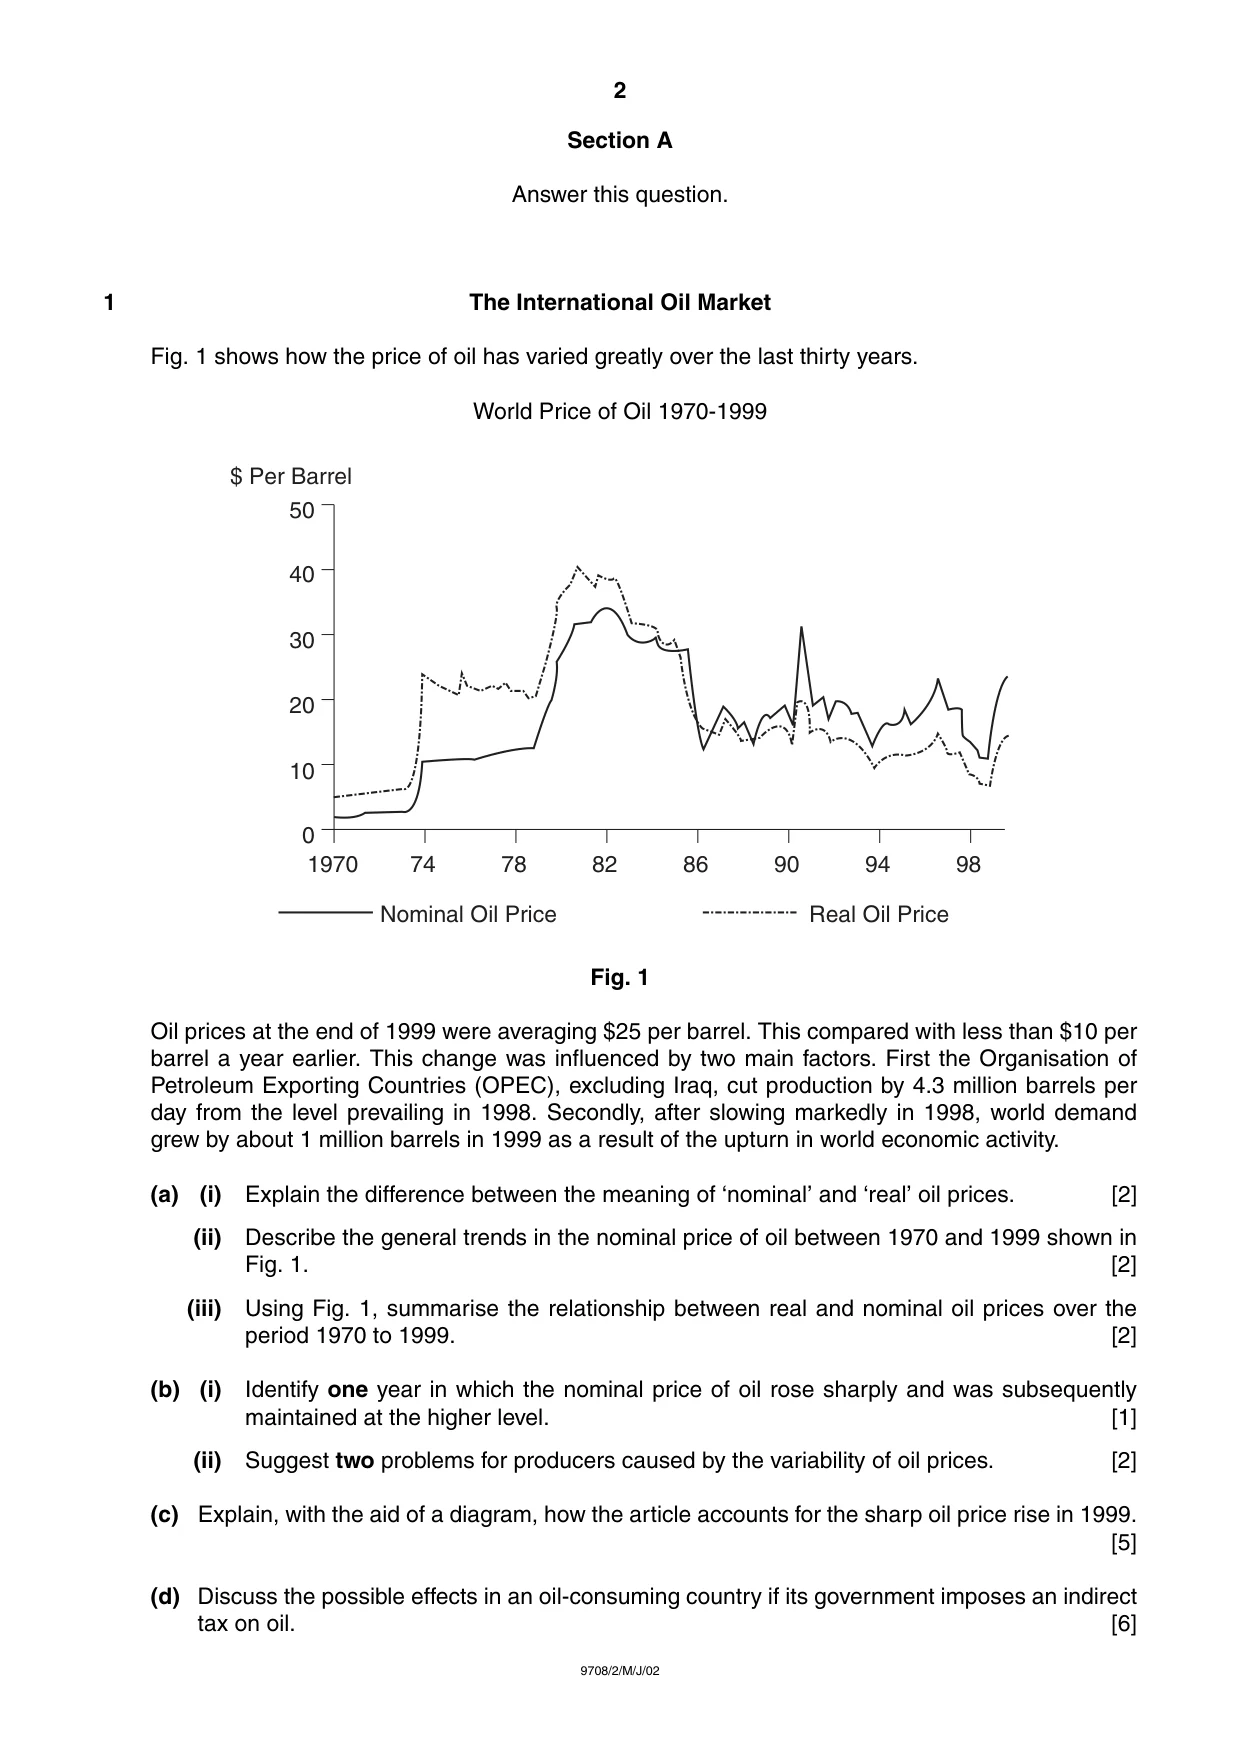
2 9708/2/M/J/02 Section A Answer this question. 1 The International Oil Market Fig. 1 shows how the price of oil has varied greatly over the last thirty years. World Price of Oil 1970-1999 Fig. 1 Oil prices at the end of 1999 were averaging $25 per barrel. This compared with less than $10 per barrel a year earlier. This change was influenced by two main factors. First the Organisation of Petroleum Exporting Countries (OPEC), excluding Iraq, cut production by 4.3 million barrels per day from the level prevailing in 1998. Secondly, after slowing markedly in 1998, world demand grew by about 1 million barrels in 1999 as a result of the upturn in world economic activity. (a) (i) Explain the difference between the meaning of ‘nominal’ and ‘real’ oil prices. [2] (ii) Describe the general trends in the nominal price of oil between 1970 and 1999 shown in Fig. 1. [2] (iii) Using Fig. 1, summarise the relationship between real and nominal oil prices over the period 1970 to 1999. [2] (b) (i) Identify one year in which the nominal price of oil rose sharply and was subsequently maintained at the higher level. [1] (ii) Suggest two problems for producers caused by the variability of oil prices. [2] (c) Explain, with the aid of a diagram, how the article accounts for the sharp oil price rise in 1999. [5] (d) Discuss the possible effects in an oil-consuming country if its government imposes an indirect tax on oil. [6] 50 40 30 20 10 0 1970 74 78 82 86 90 94 98 $ Per Barrel Nominal Oil Price Real Oil Price
Question paper, page 3
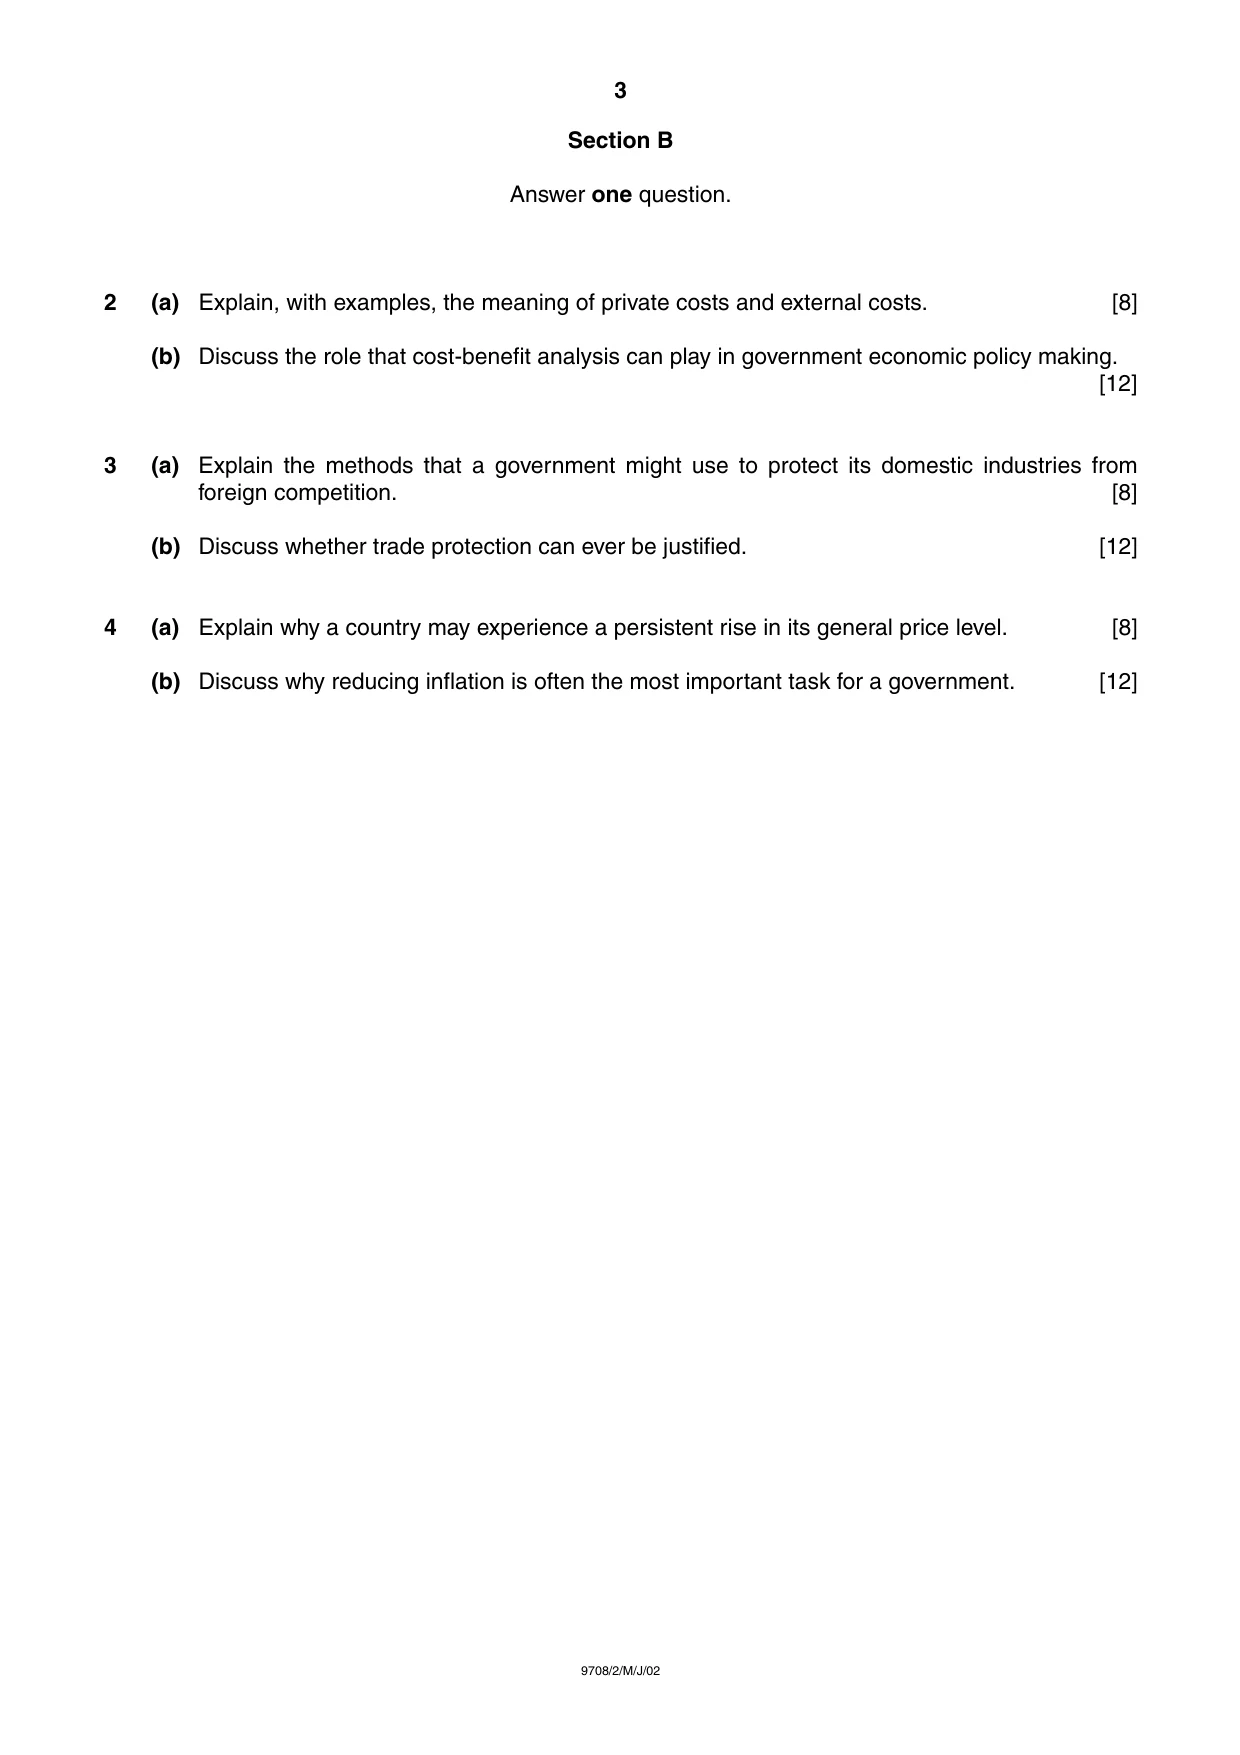
3 9708/2/M/J/02 Section B Answer one question. 2 (a) Explain, with examples, the meaning of private costs and external costs. [8] (b) Discuss the role that cost-benefit analysis can play in government economic policy making. [12] 3 (a) Explain the methods that a government might use to protect its domestic industries from foreign competition. [8] (b) Discuss whether trade protection can ever be justified. [12] 4 (a) Explain why a country may experience a persistent rise in its general price level. [8] (b) Discuss why reducing inflation is often the most important task for a government. [12]
Question paper, page 4
4 9708/2/M/J/02 Copyright Acknowledgement: Question 1 Fig. 1 from Barclays Economic Review, first quarter 2000, page 13, Barclays Bank
Mark scheme, page 1
CAMBRIDGE INTERNATIONAL EXAMINATIONS JUNE 2002 GCE Advanced Subsidiary Level SYLLABUS/COMPONENT :9708 /2 ECONOMICS (DATA RESPONSE AND ESSAY (CORE)) 4 Universiry of CAMBRIDGE SP Local Examinations Syndicate
Mark scheme, page 2
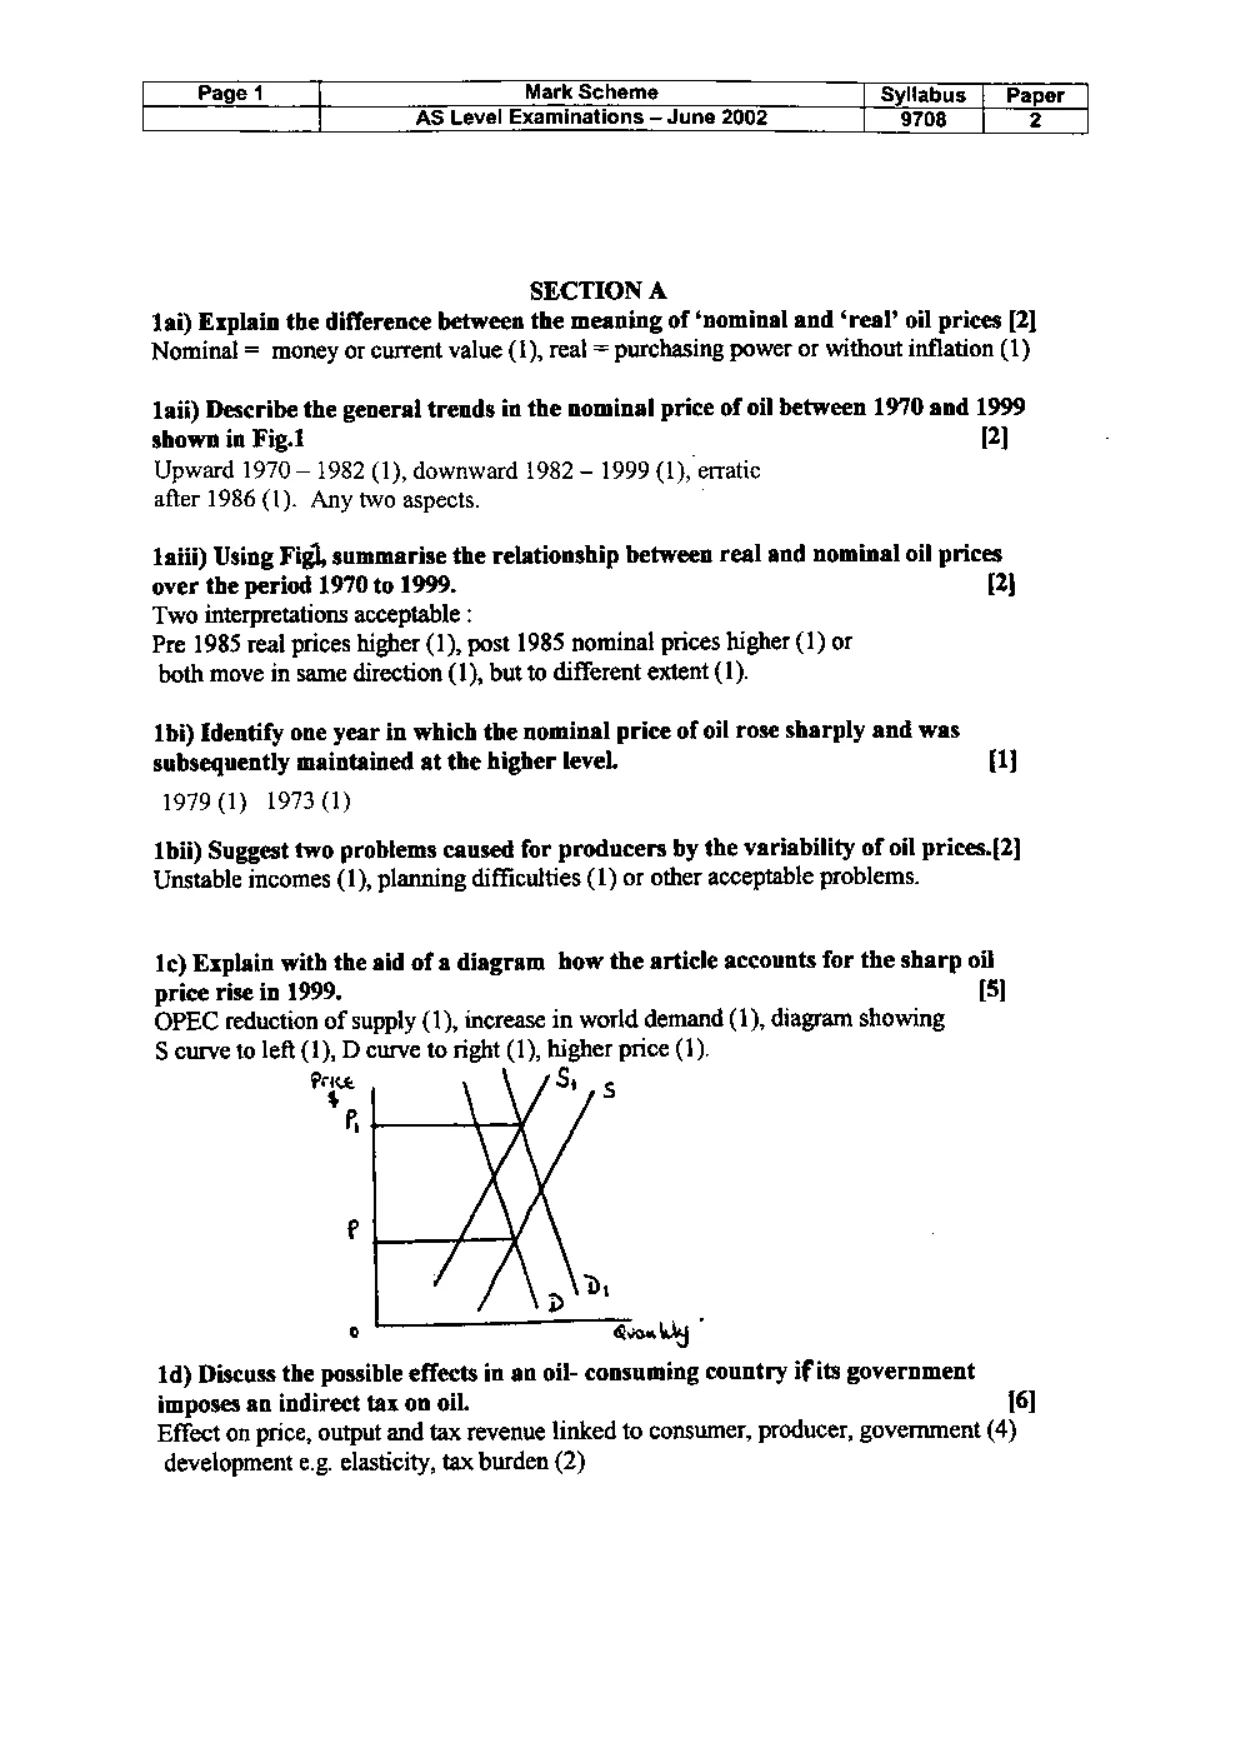
Page 1 =e Mark Scheme | Syltabus | Paper | AS Level Examinations — June 2002 [9708 2 SECTION A ai) Explain the difference between the meaning of ‘nominal and ‘real’ oil prices [2] Nominal = money or current value (1), real = purchasing power or without inflation (1) laii) Describe the general trends in the nominal price of oil between 1970 and 1999 shown in Fig.t [2] Upward 1970 — 1982 (1), downward 1982 - 1999 (1), erratic after 1986 (1). Any two aspects. taiii) Using Figl, summarise the relationship between real and nominal oil prices over the period 1970 to 1999. [2) Two interpretations acceptable : Pre 1985 real prices higher (1), post 1985 nominal prices higher (1) or both move in same direction (1), but to different extent (1). 1bi) Identify one year in which the nominal price of oil rose sharply and was subsequently maintained at the higher level. 193} 1979 (1) 1973 (1) 1bii) Suggest two problems caused for producers by the variability of oil prices.{2] Unstable incomes (1), planning difficulties (1) or other acceptable problems. 1c) Explain with the aid of a diagram how the article accounts for the sharp oil price rise in 1999, [5] OPEC reduction of supply (1), increase in world demand (1), diagram showing S curve to left (1), D curve to right (1), higher price (1). S$ Pipe s if e ° Qian bey . 1d) Discuss the possible effects in an oil- consuming country ifits government imposes an indirect tax on oil. 16] Effect on price, output and tax revenue linked to consumer, producer, government (4) development e.g. elasticity, tax burden (2)
Mark scheme, page 3
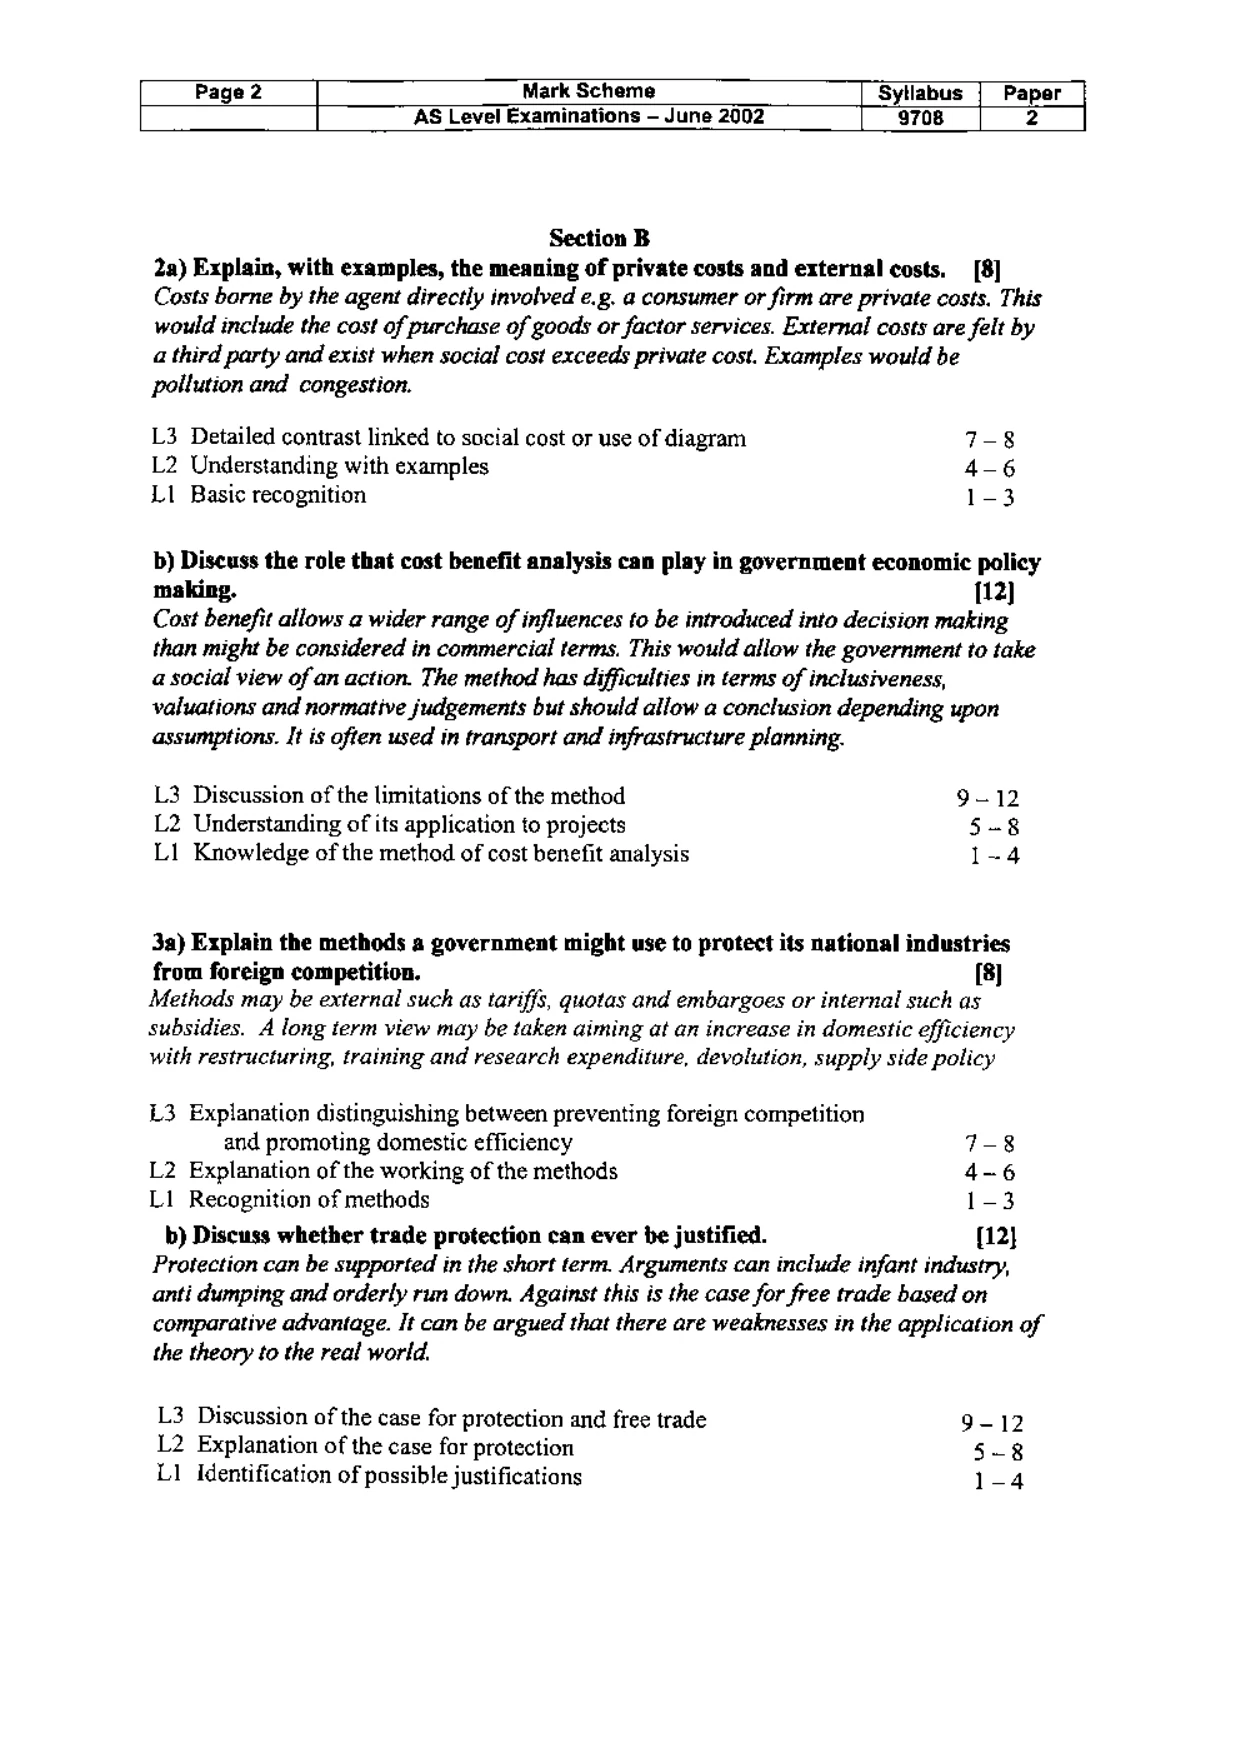
Page 2 Mark Scheme | Sytlabus | Paper AS Level Examinations — June 2002 [9708 2 Section B 2a) Explain, with examples, the meaning of private costs and external costs. [8] Costs borne by the agent directly involved e.g. a consumer or firm are private costs. This would include the cost of purchase of goods or factor services. External costs are felt by a third party and exist when social cost exceeds private cost. Examples would be pollution and congestion. L3 Detailed contrast linked to social cost or use of diagram L2 Understanding with examples LI Basic recognition -pH i} we oo b) Discuss the role that cost benefit analysis can play in government economic policy making. [12] Cost benefit allows a wider range of influences to be introduced into decision making than might be considered in commercial terms. This would allow the government to take a social view of an action. The method has difficulties in terms of inclusiveness, valuations and normative judgements but should allow a conclusion depending upon assumptions. It is often used in transport and infrastructure planning. L3 Discussion of the limitations of the method 9-12 L2 Understanding of its application to projects 5-8 LI Knowledge of the method of cost benefit analysis 1-4 3a) Explain the methods a government might use to protect its national industries from foreign competition. [8] Methods may be external such as tariffs, quotas and embargoes or internal such as subsidies. A long term view may be taken aiming at an increase in domestic efficiency with restructuring, training and research expenditure, devolution, supply side policy L3 Explanation distinguishing between preventing foreign competition and promoting domestic efficiency L2 Explanation of the working of the methods L1 Recognition of methods b) Discuss whether trade protection can ever be justified. {12} Protection can be supported in the short term. Arguments can include infant industry, anti dumping and orderly run down. Against this is the case for free trade based on comparative advantage. It can be argued that there are weaknesses in the application of the theory to the real world. —-f 6 Wa oo L3 Discussion of the case for protection and free trade 9-12 L2 Explanation of the case for protection 5-8 L1 Identification of possible justifications 1-4
Mark scheme, page 4
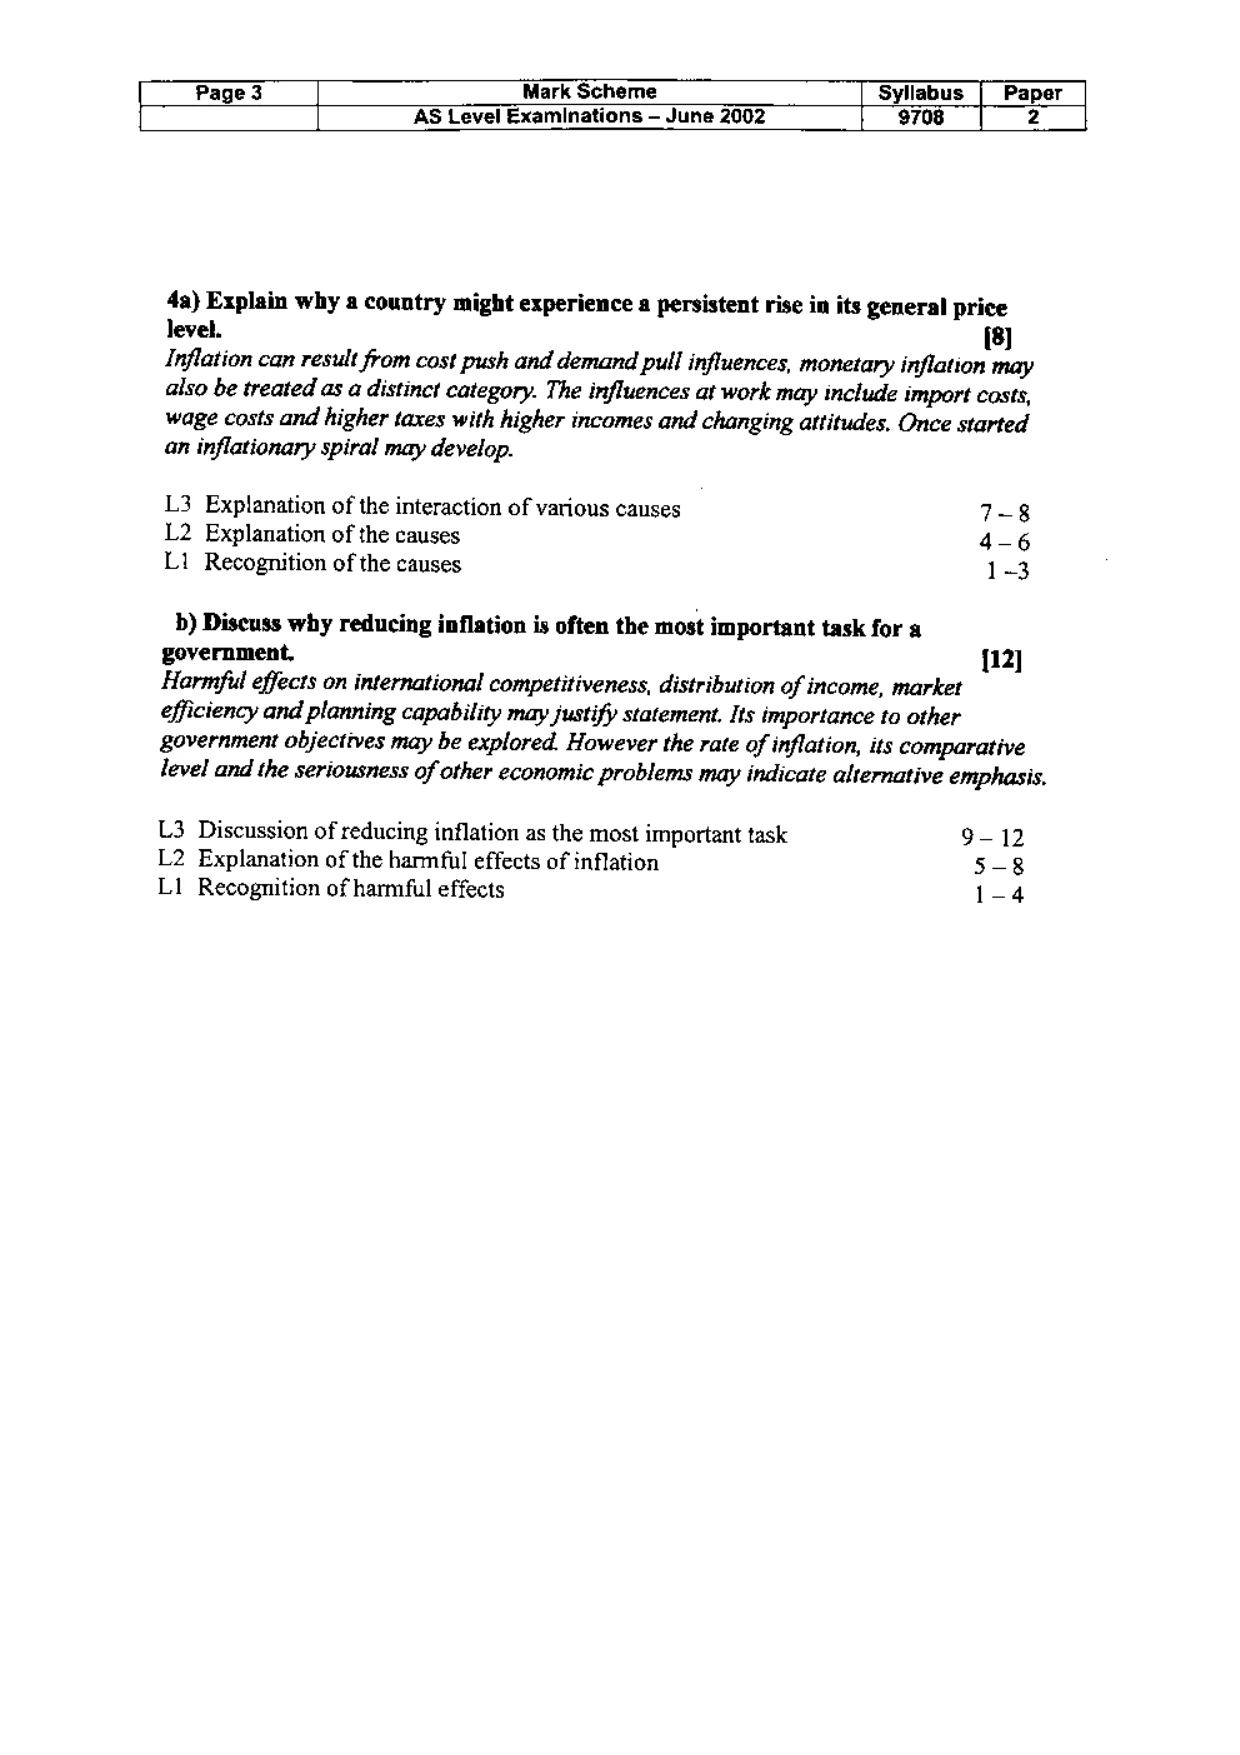
Page 3 Mark Scheme Syllabus [| Paper AS Level Examinations — June 2002 9708 [2 4a) Explain why a country might experience a persistent rise in its general price level. (8) Inflation can result from cost push and demand pull influences, monetary inflation may also be treated as a distinct category. The influences at work may include import costs, wage costs and higher taxes with higher incomes and changing attitudes, Once started an inflationary spiral may develop. L3 Explanation of the interaction of various causes L2 Explanation of the causes L1 Recognition of the causes n.hn~ I WG a0 b) Discuss why reducing inflation is often the most important task for a government. {12] Harmful effects on international competitiveness, distribution of income, market efficiency and planning capability may justify statement. Its importance to other government objectives may be explored. However the rate of inflation, its comparative level and the seriousness of other economic problems may indicate alternative emphasis. L3 Discussion of reducing inflation as the most important task 9-12 L2 Explanation of the harmful effects of inflation 5-8 L1 Recognition of harmful effects 1-4