Cambridge A Level Chemistry 9701 — 2020 Feb/March Paper 5 · Variant 2
9701/52/F/M/20 · 2 questions · 30 marks · ≈34 min
The question paper and its mark scheme, free to read here and free to download. This is Cambridge’s own paper, exactly as it was sat.
Question paper8 pages
Mark scheme8 pages
Answers below. Sit the paper first if you are practising.
Questions as text
Q1 · Brass is an alloy of copper and zinc
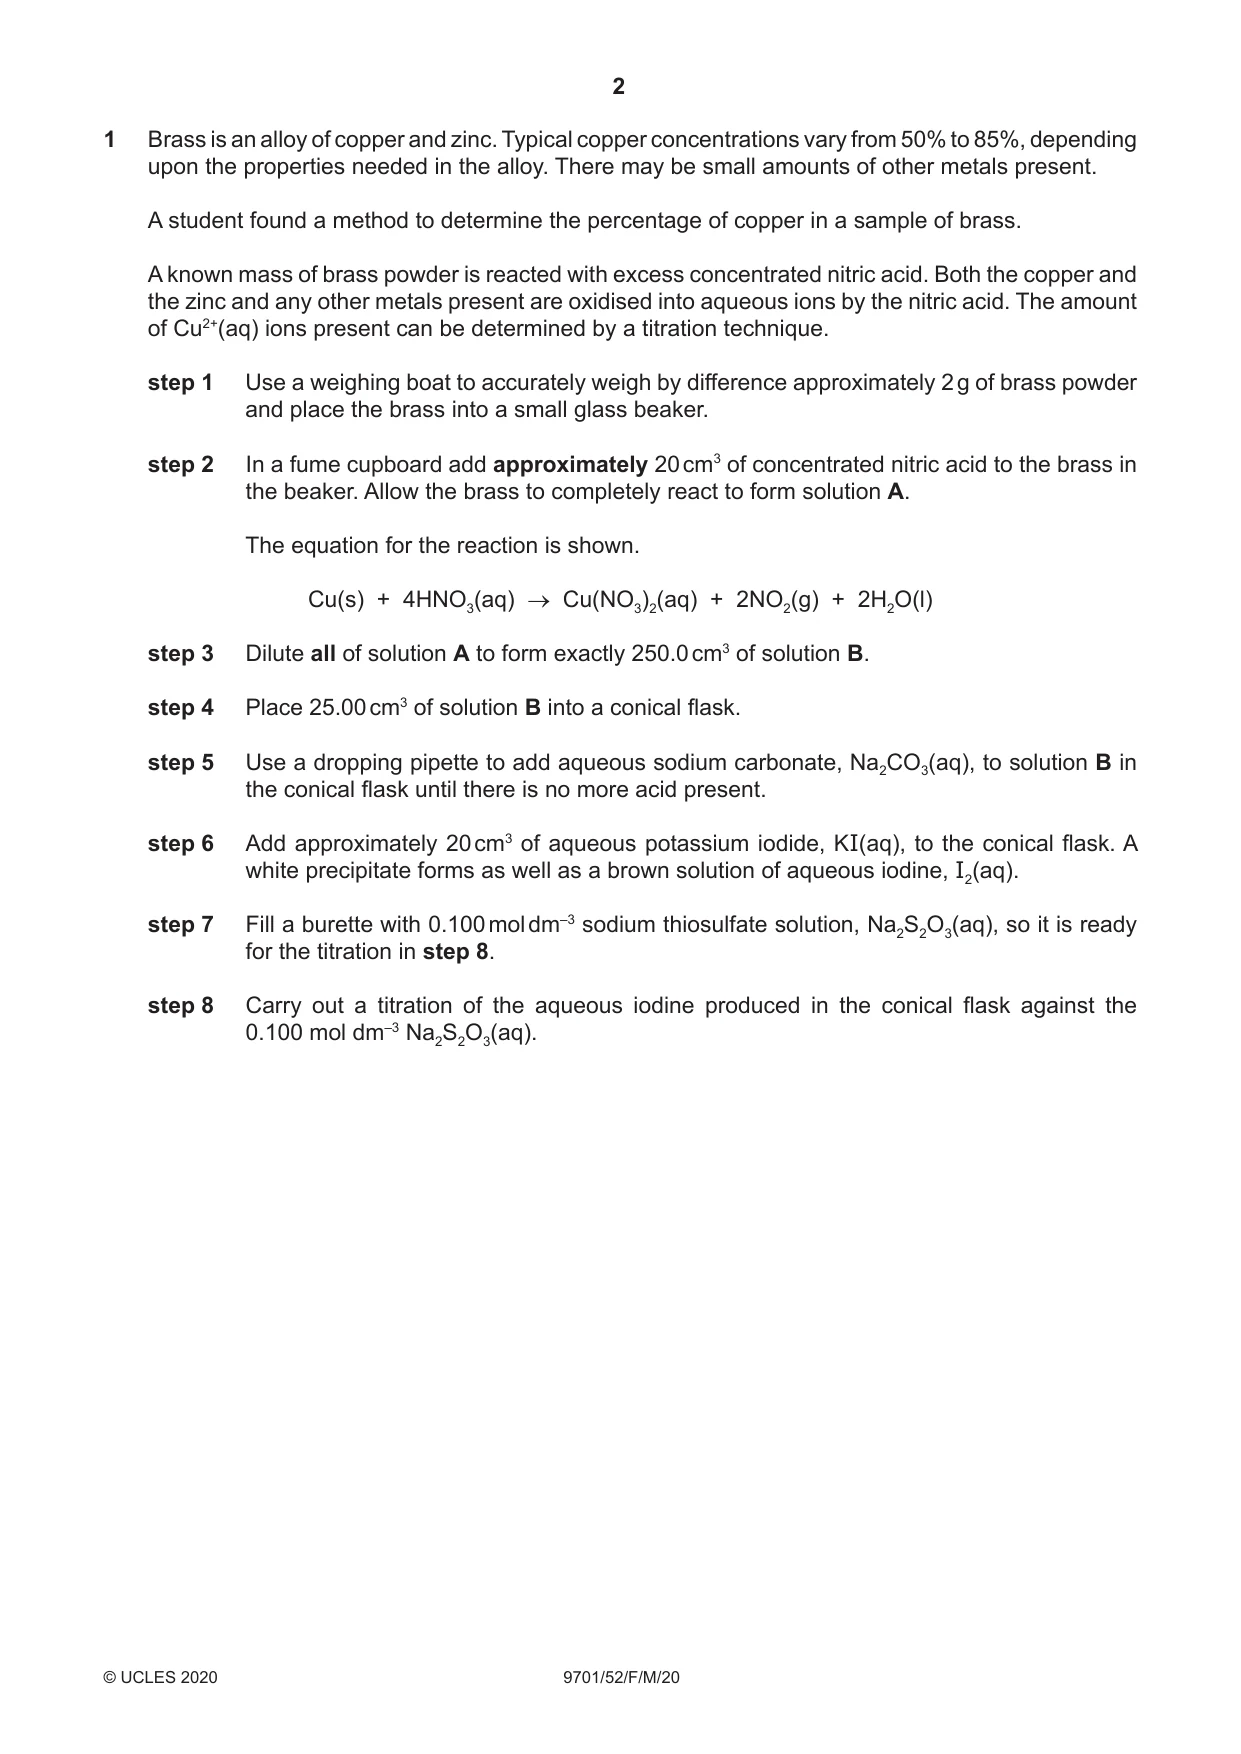
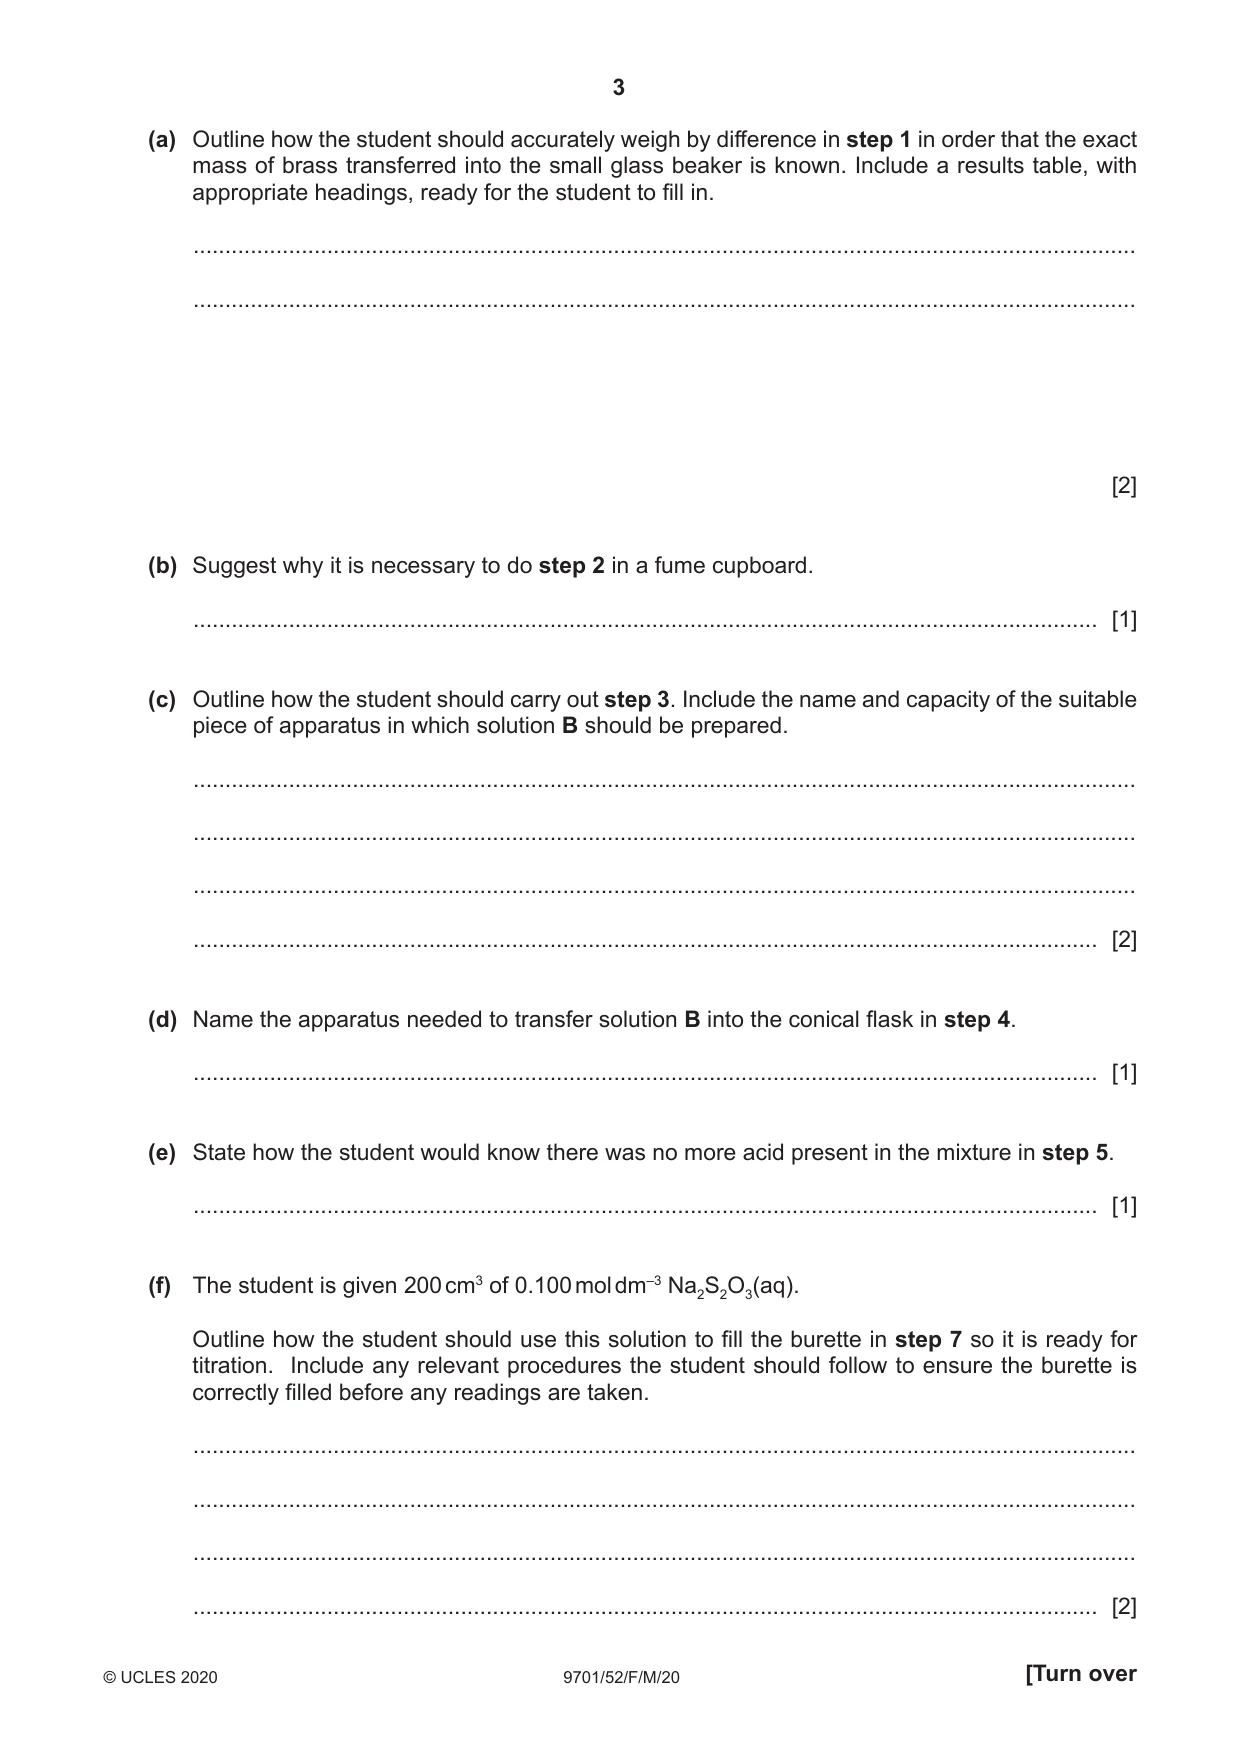
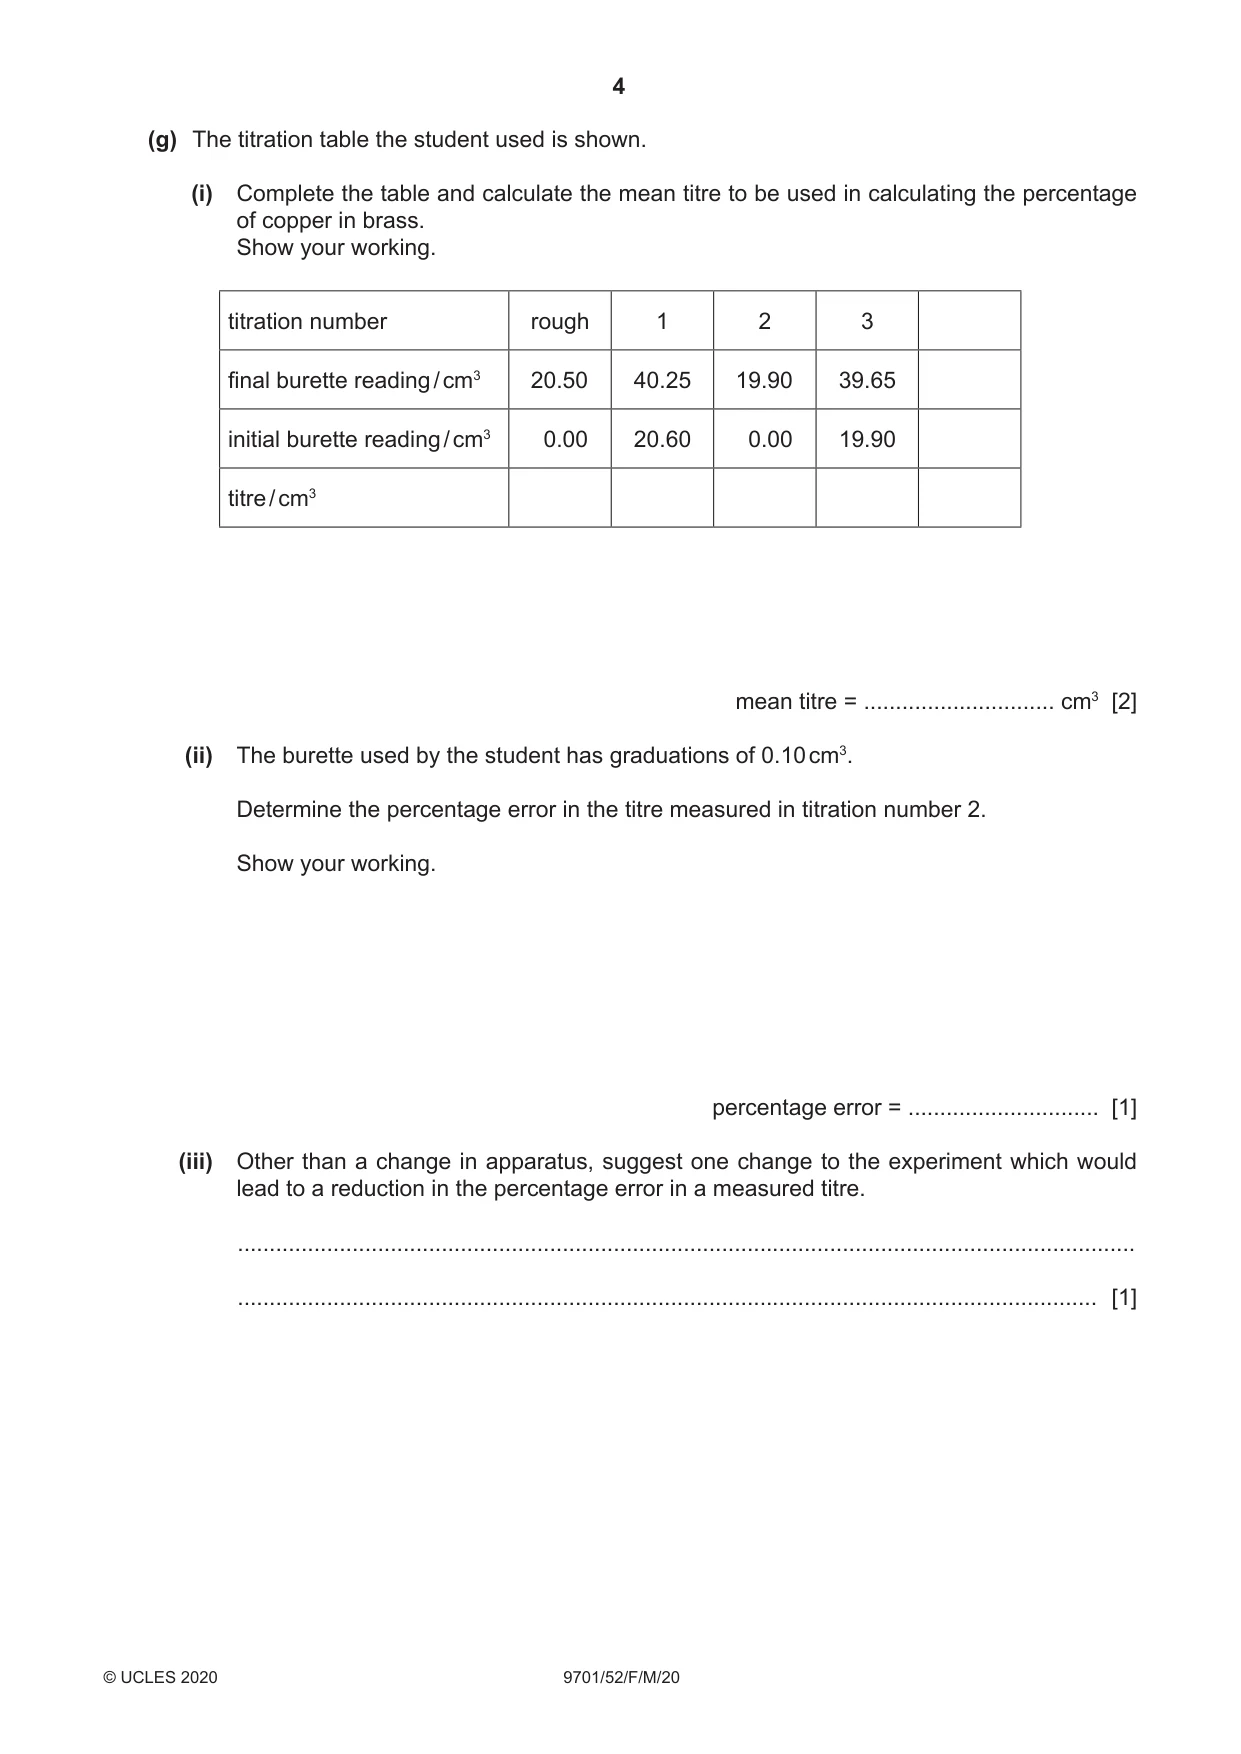
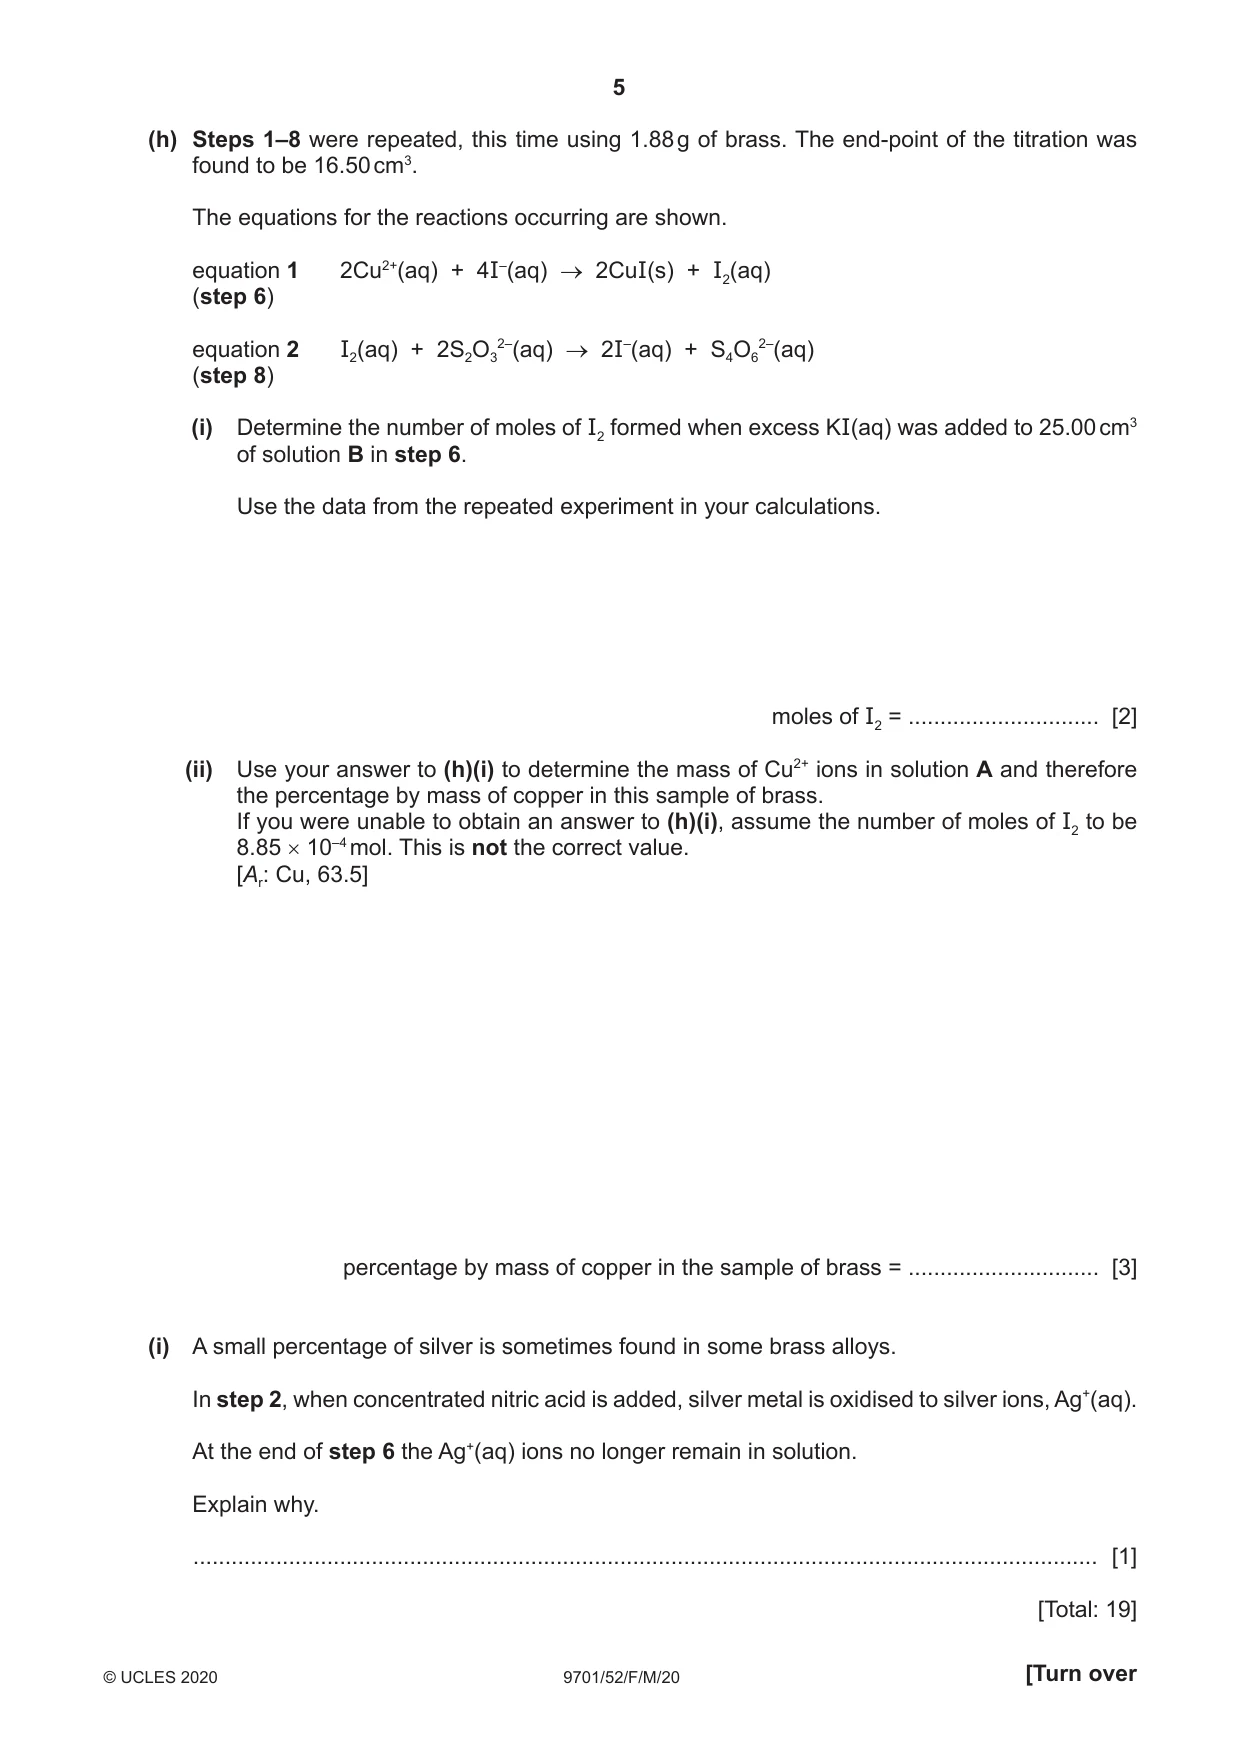
1 Brass is an alloy of copper and zinc. Typical copper concentrations vary from 50% to 85%, depending upon the properties needed in the alloy. There may be small amounts of other metals present. A student found a method to determine the percentage of copper in a sample of brass. A known mass of brass powder is reacted with excess concentrated nitric acid. Both the copper and the zinc and any other metals present are oxidised into aqueous ions by the nitric acid. The amount of Cu2+(aq) ions present can be determined by a titration technique. step 1 Use a weighing boat to accurately weigh by difference approximately 2 g of brass powder and place the brass into a small glass beaker. step 2 In a fume cupboard add approximately 20 cm3 of concentrated nitric acid to the brass in the beaker. Allow the brass to completely react to form solution A. The equation for the reaction is shown. Cu(s) + 4HNO3(aq) → Cu(NO3)2(aq) + 2NO2(g) + 2H2O(l) step 3 Dilute all of solution A to form exactly 250.0 cm3 of solution B. step 4 Place 25.00 cm3 of solution B into a conical flask. step 5 Use a dropping pipette to add aqueous sodium carbonate, Na2CO3(aq), to solution B in the conical flask until there is no more acid present. step 6 Add approximately 20 cm3 of aqueous potassium iodide, KI(aq), to the conical flask. A white precipitate forms as well as a brown solution of aqueous iodine, I2(aq). step 7 Fill a burette with 0.100 mol dm–3 sodium thiosulfate solution, Na2S2O3(aq), so it is ready for the titration in step 8. step 8 Carry out a titration of the aqueous iodine produced in the conical flask against the 0.100 mol dm–3 Na2S2O3(aq). (a) Outline how the student should accurately weigh by difference in step 1 in order that the exact mass of brass transferred into the small glass beaker is known. Include a results table, with appropriate headings, ready for the student to fill in. .................................................................................................................................................... .................................................................................................................................................... [2] (b) Suggest why it is necessary to do step 2 in a fume cupboard. .............................................................................................................................................. [1] (c) Outline how the student should carry out step 3. Include the name and capacity of the suitable piece of apparatus in which solution B should be prepared. .................................................................................................................................................... .................................................................................................................................................... .................................................................................................................................................... .............................................................................................................................................. [2] (d) Name the apparatus needed to transfer solution B into the conical flask in step 4. .............................................................................................................................................. [1] (e) State how the student would know there was no more acid present in the mixture in step 5. .............................................................................................................................................. [1] (f) The student is given 200 cm3 of 0.100 mol dm–3 Na2S2O3(aq). Outline how the student should use this solution to fill the burette in step 7 so it is ready for titration. Include any relevant procedures the student should follow to ensure the burette is correctly filled before any readings are taken. .................................................................................................................................................... .................................................................................................................................................... .................................................................................................................................................... .............................................................................................................................................. [2] (g) The titration table the student used is shown. (i) Complete the table and calculate the mean titre to be used in calculating the percentage of copper in brass. Show your working. titration number rough 1 2 3 final burette reading / cm3 20.50 40.25 19.90 39.65 initial burette reading / cm3 0.00 20.60 0.00 19.90 titre / cm3 mean titre = .............................. cm3 [2] (ii) The burette used by the student has graduations of 0.10 cm3. Determine the percentage error in the titre measured in titration number 2. Show your working. percentage error = .............................. [1] (iii) Other than a change in apparatus, suggest one change to the experiment which would lead to a reduction in the percentage error in a measured titre. ............................................................................................................................................. ....................................................................................................................................... [1] (h) Steps 1–8 were repeated, this time using 1.88 g of brass. The end-point of the titration was found to be 16.50 cm3. The equations for the reactions occurring are shown. equation 1 2Cu2+(aq) + 4I–(aq) → 2CuI(s) + I2(aq) (step 6) equation 2 I2(aq) + 2S2O32–(aq) → 2I–(aq) + S4O62–(aq) (step 8) (i) Determine the number of moles of I2 formed when excess KI(aq) was added to 25.00 cm3 of solution B in step 6. Use the data from the repeated experiment in your calculations. moles of I2 = .............................. [2] (ii) Use your answer to (h)(i) to determine the mass of Cu2+ ions in solution A and therefore the percentage by mass of copper in this sample of brass. If you were unable to obtain an answer to (h)(i), assume the number of moles of I2 to be 8.85 × 10⁻⁴ mol. This is not the correct value. [Ar: Cu, 63.5] percentage by mass of copper in the sample of brass = .............................. [3] (i) A small percentage of silver is sometimes found in some brass alloys. In step 2, when concentrated nitric acid is added, silver metal is oxidised to silver ions, Ag+(aq). At the end of step 6 the Ag+(aq) ions no longer remain in solution. Explain why. .............................................................................................................................................. [1] [Total: 19]
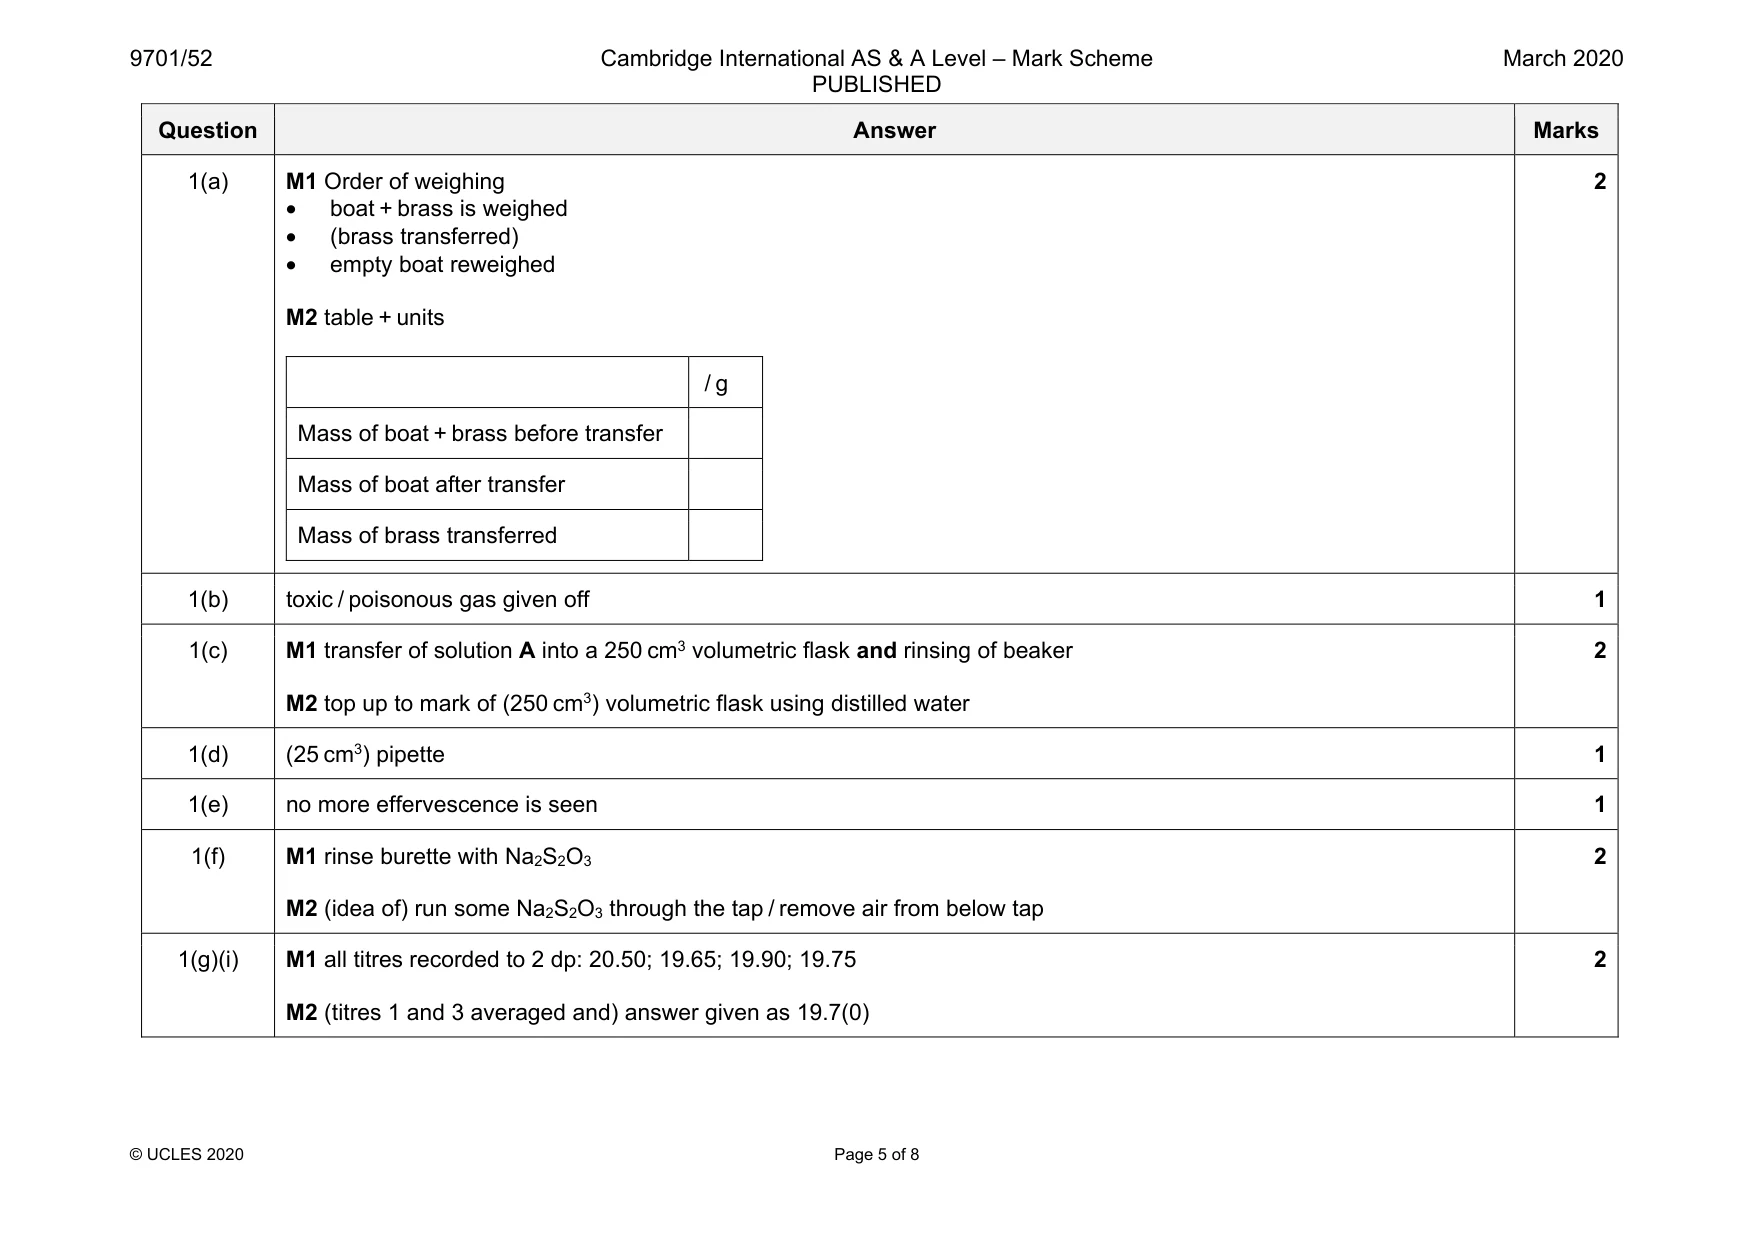
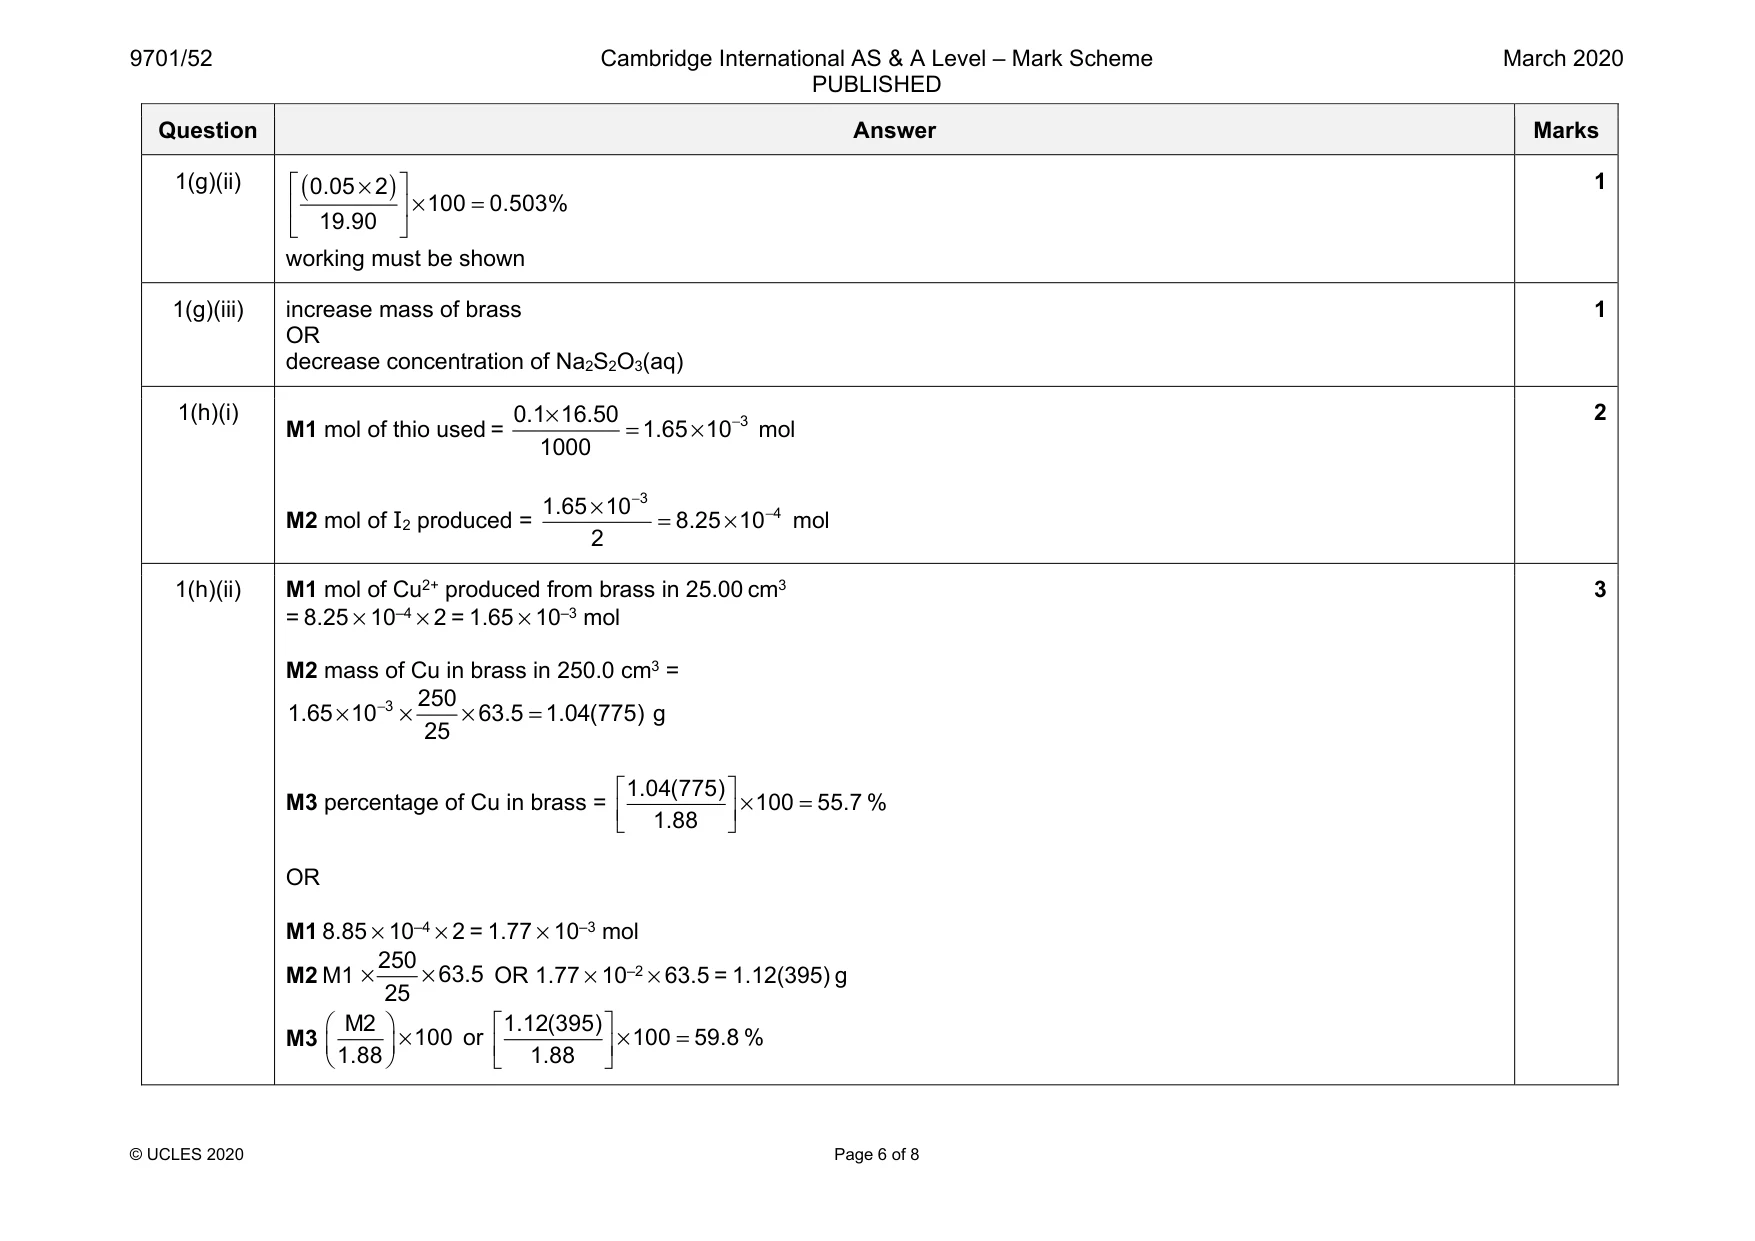
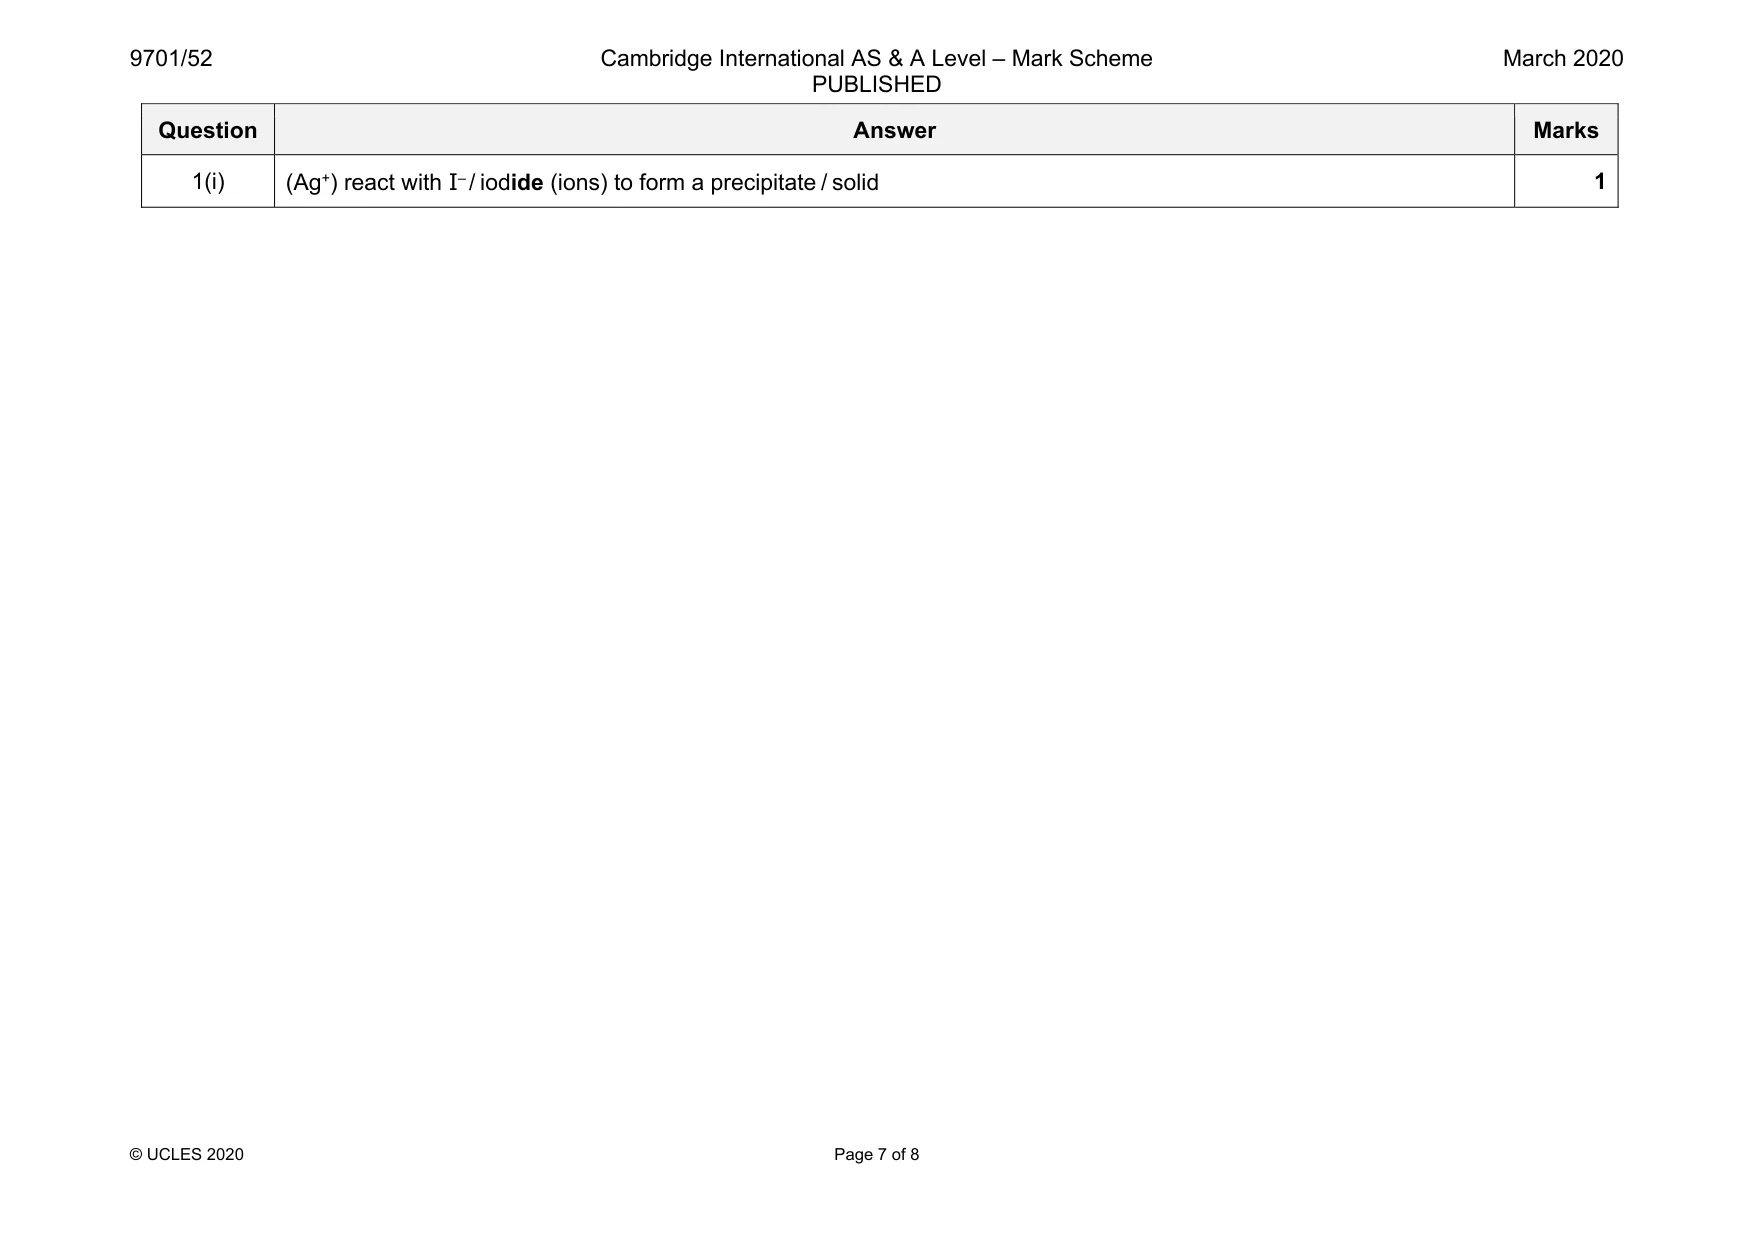
Mark scheme: 1(a) M1 Order of weighing • boat + brass is weighed • (brass transferred) • empty boat reweighed M2 table + units / g Mass of boat + brass before transfer Mass of boat after transfer Mass of brass transferred 2 1(b) toxic / poisonous gas given off 1 1(c) M1 transfer of solution A into a 250 cm3 volumetric flask and rinsing of beaker M2 top up to mark of (250 cm3) volumetric flask using distilled water 2 1(d) (25 cm3) pipette 1 1(e) no more effervescence is seen 1 1(f) M1 rinse burette with Na2S2O3 M2 (idea of) run some Na2S2O3 through the tap / remove air from below tap 2 1(g)(i) M1 all titres recorded to 2 dp: 20.50; 19.65; 19.90; 19.75 M2 (titres 1 and 3 averaged and) answer given as 19.7(0) 2 Question Answer Marks 1(g)(ii) ( ) 0.05 2 100 0.503% 19.90 × × = working must be shown 1 1(g)(iii) increase mass of brass OR decrease concentration of Na2S2O3(aq) 1 1(h)(i) M1 mol of thio used = 3 0.1 16.50 1.65 10 1000 − × = × mol M2 mol of I2 produced = 3 4 1.65 10 8.25 10 2 − − × = × mol 2 1(h)(ii) M1 mol of Cu2+ produced from brass in 25.00 cm3 = 8.25 × 10–4 × 2 = 1.65 × 10⁻³ mol M2 mass of Cu in brass in 250.0 cm3 = 3 250 1.65 10 63.5 1.04(775) 25 − × × × = g M3 percentage of Cu in brass = 1.04(775) 100 55.7 1.88 × = % OR M1 8.85 × 10–4 × 2 = 1.77 × 10⁻³ mol M2 M1 250 63.5 25 × × OR 1.77 × 10–2 × 63.5 = 1.12(395) g M3 M2 100 1.88 × or 1.12(395) 100 59.8 1.88 × = % 3 Question Answer Marks 1(i) (Ag+) react with I– / iodide (ions) to form a precipitate / solid 1
More questions on Reacting masses and volumes (of solutions and gases)
Q2 · The activation energy, Ea, of the reaction between aqueous manganate(VII) ions…
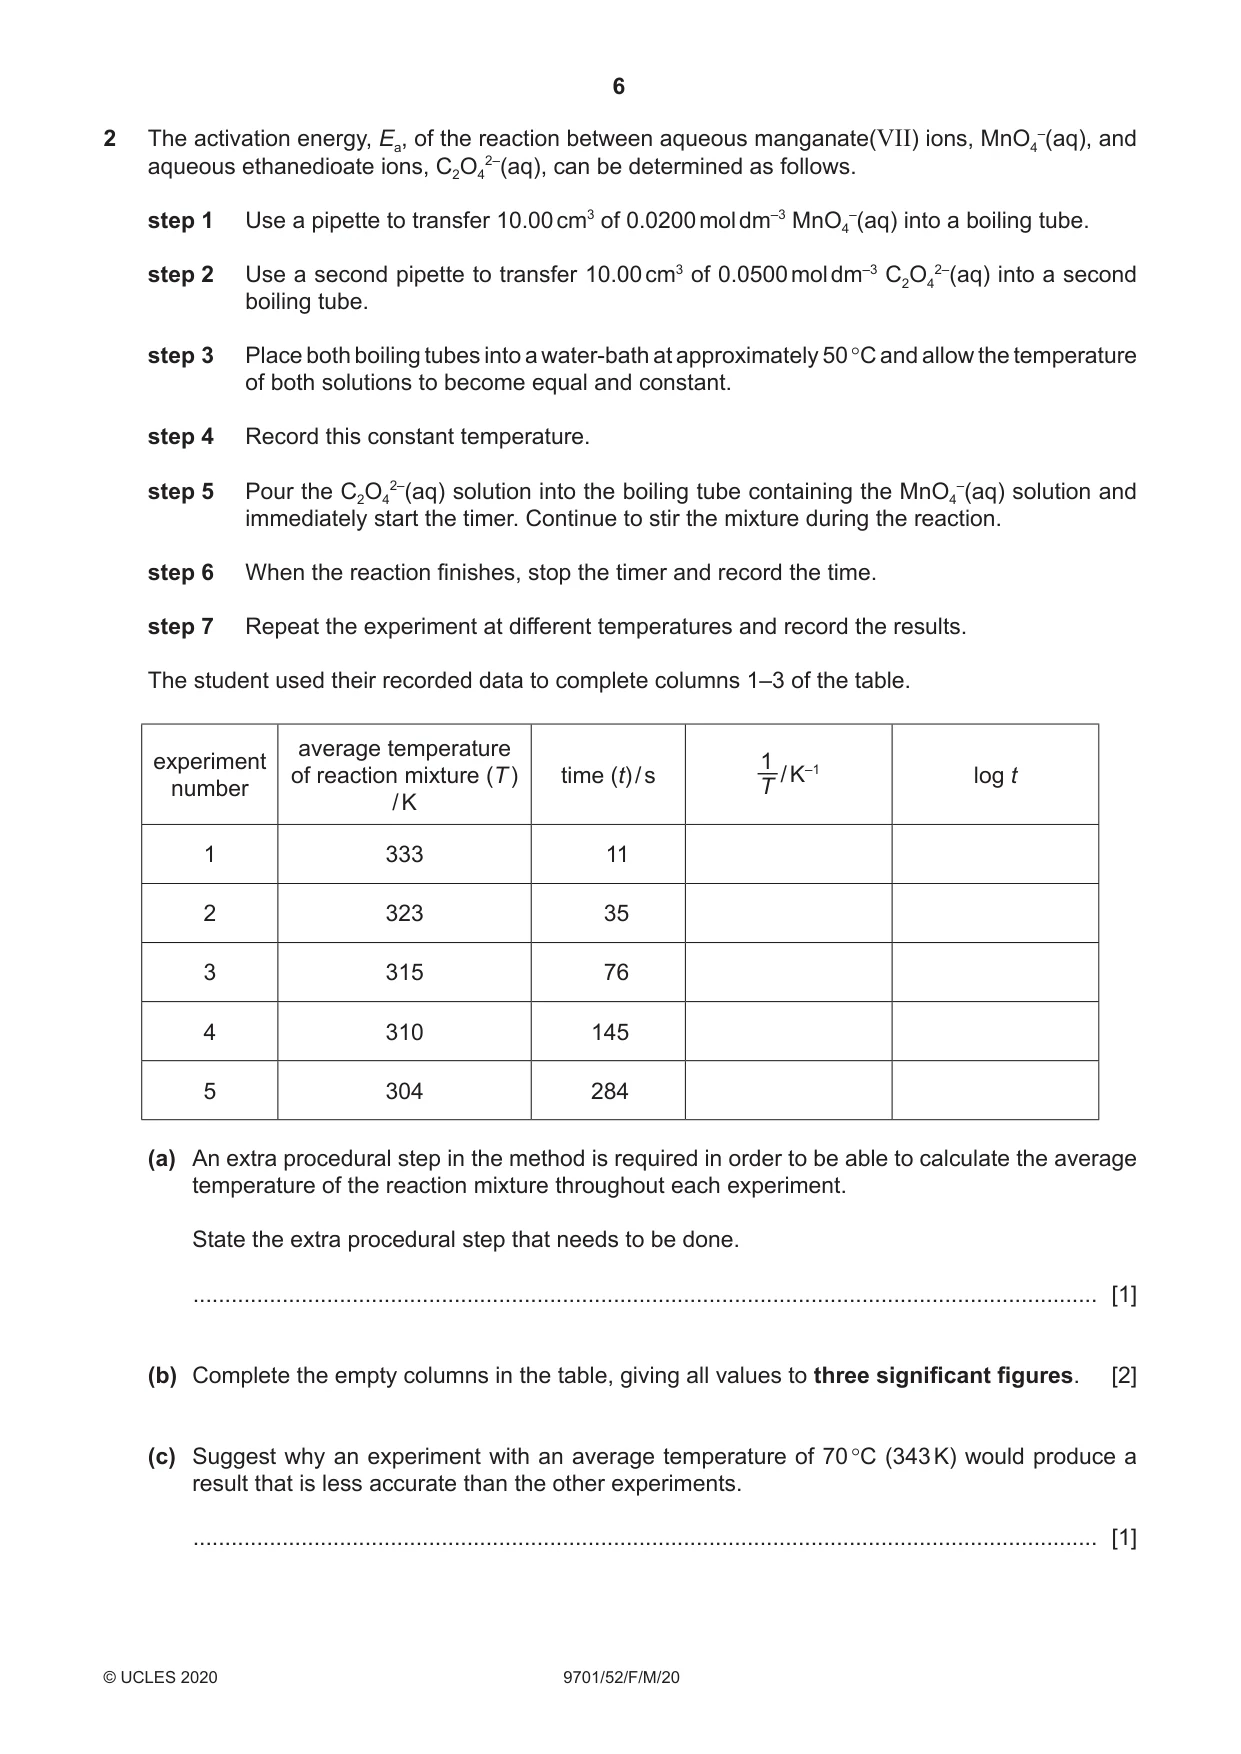
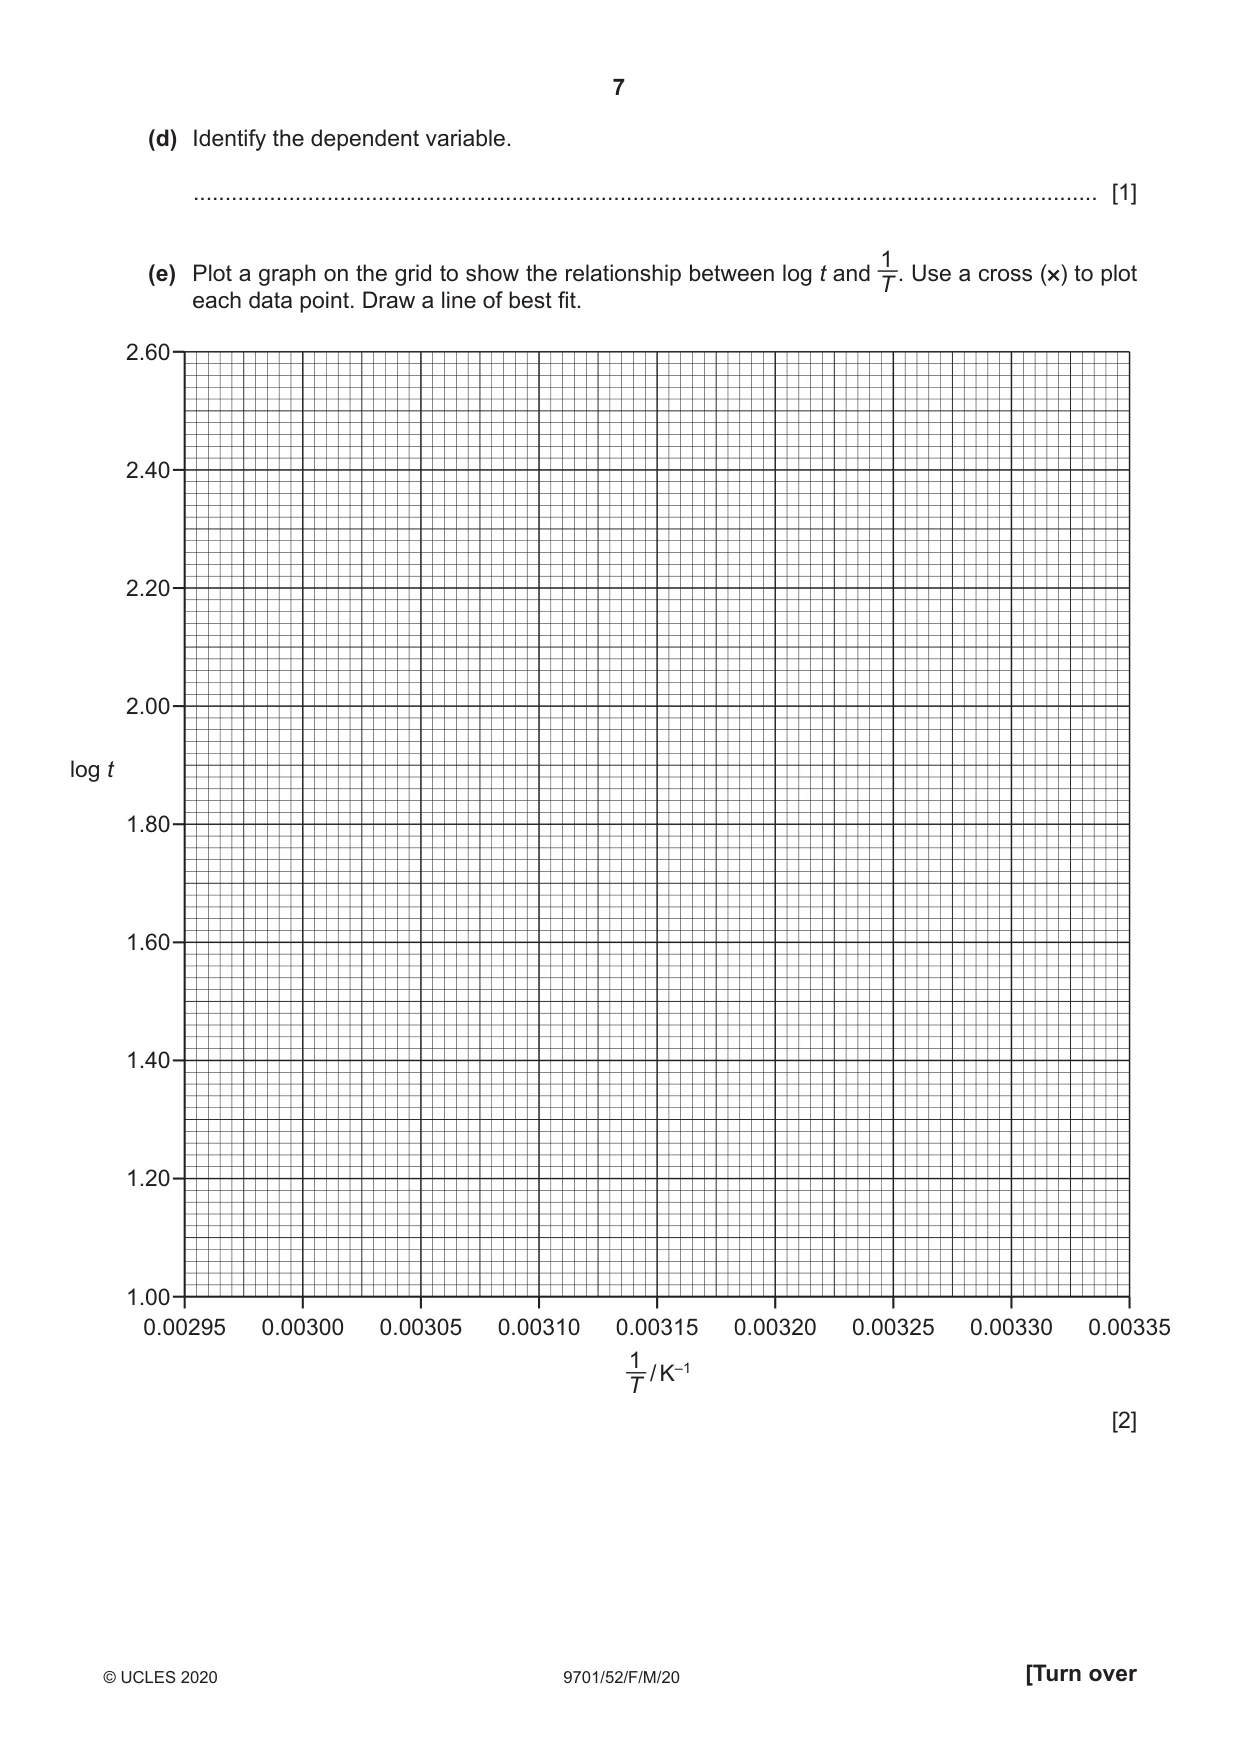
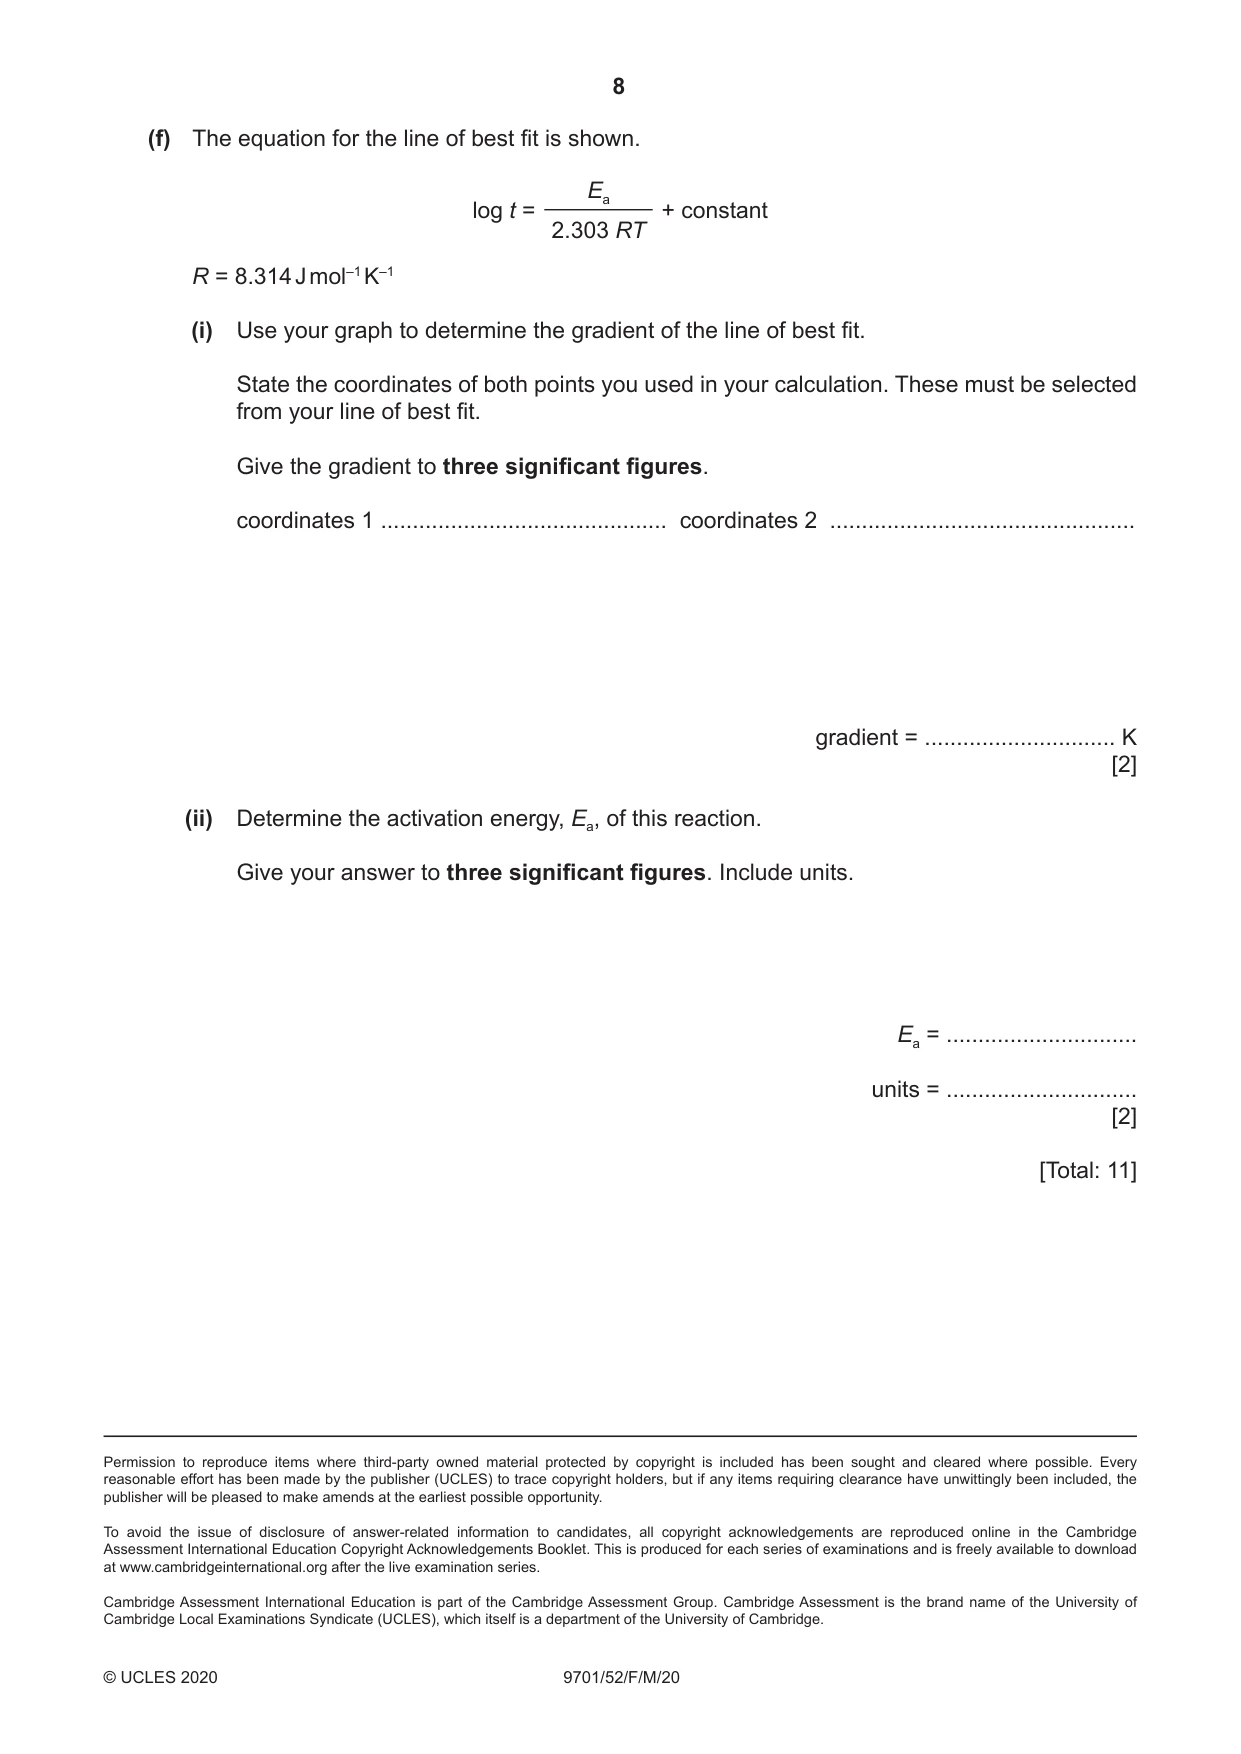
2 The activation energy, Ea, of the reaction between aqueous manganate(VII) ions, MnO4–(aq), and aqueous ethanedioate ions, C2O42–(aq), can be determined as follows. step 1 Use a pipette to transfer 10.00 cm3 of 0.0200 mol dm–3 MnO4–(aq) into a boiling tube. step 2 Use a second pipette to transfer 10.00 cm3 of 0.0500 mol dm–3 C2O42–(aq) into a second boiling tube. step 3 Place both boiling tubes into a water-bath at approximately 50 °C and allow the temperature of both solutions to become equal and constant. step 4 Record this constant temperature. step 5 Pour the C2O42–(aq) solution into the boiling tube containing the MnO4–(aq) solution and immediately start the timer. Continue to stir the mixture during the reaction. step 6 When the reaction finishes, stop the timer and record the time. step 7 Repeat the experiment at different temperatures and record the results. The student used their recorded data to complete columns 1–3 of the table. average temperature experiment 1 of reaction mixture (T ) time (t) / s / K–1 log t number T / K 1 333 11 2 323 35 3 315 76 4 310 145 5 304 284 (a) An extra procedural step in the method is required in order to be able to calculate the average temperature of the reaction mixture throughout each experiment. State the extra procedural step that needs to be done. .............................................................................................................................................. [1] (b) Complete the empty columns in the table, giving all values to three significant figures. [2] (c) Suggest why an experiment with an average temperature of 70 °C (343 K) would produce a result that is less accurate than the other experiments. .............................................................................................................................................. [1] (d) Identify the dependent variable. .............................................................................................................................................. [1] 1 (e) Plot a graph on the grid to show the relationship between log t and . Use a cross (×) to plot T each data point. Draw a line of best fit. 2.60 2.40 2.20 2.00 log t 1.80 1.60 1.40 1.20 1.00 0.00295 0.00300 0.00305 0.00310 0.00315 0.00320 0.00325 0.00330 0.00335 1 / K–1 T [2] (f) The equation for the line of best fit is shown. Ea log t = + constant 2.303 RT R = 8.314 J mol–1 K–1 (i) Use your graph to determine the gradient of the line of best fit. State the coordinates of both points you used in your calculation. These must be selected from your line of best fit. Give the gradient to three significant figures. coordinates 1 ............................................. coordinates 2 ................................................. gradient = .............................. K [2] (ii) Determine the activation energy, Ea, of this reaction. Give your answer to three significant figures. Include units. Ea = .............................. units = .............................. [2] [Total: 11]
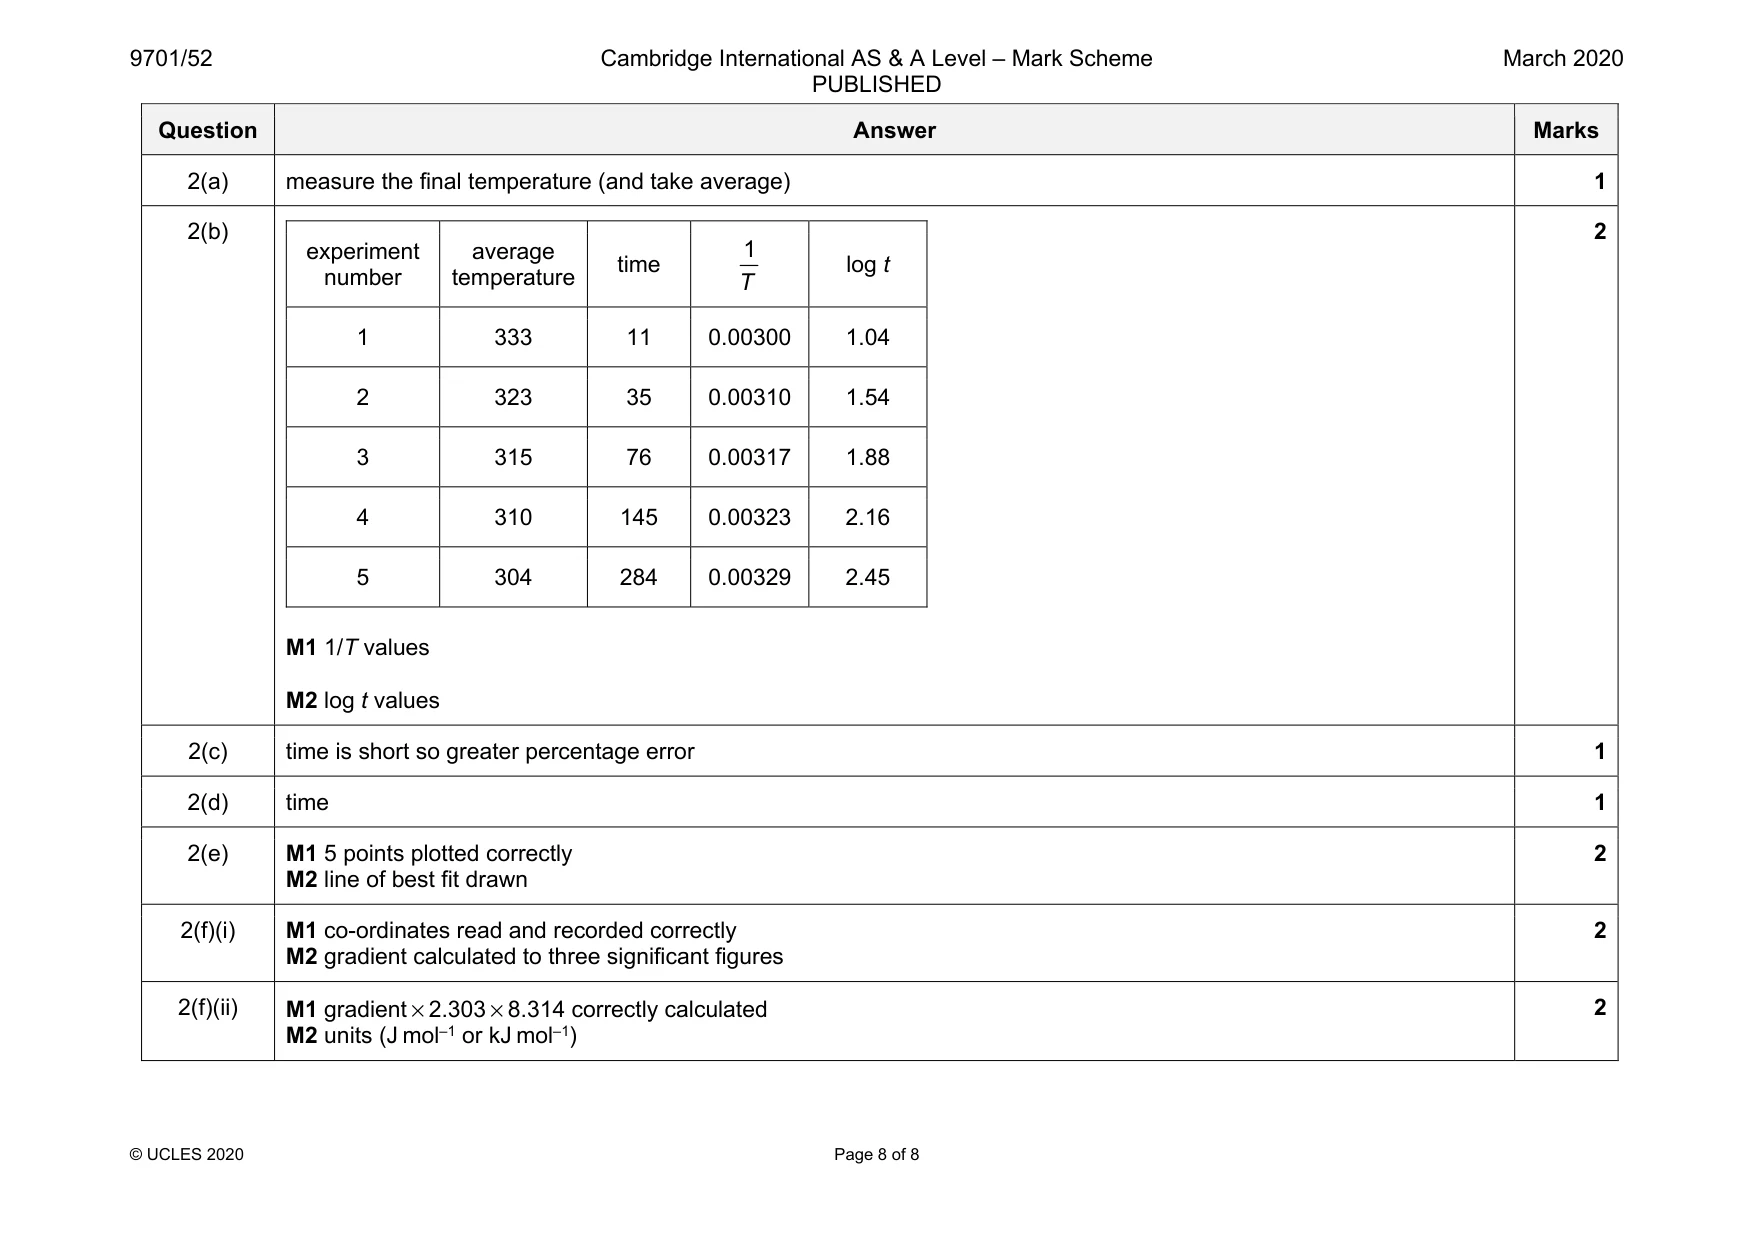
Mark scheme: 2(a) measure the final temperature (and take average) 1 2(b) experiment number average temperature time 1 T log t 1 333 11 0.00300 1.04 2 323 35 0.00310 1.54 3 315 76 0.00317 1.88 4 310 145 0.00323 2.16 5 304 284 0.00329 2.45 M1 1/T values M2 log t values 2 2(c) time is short so greater percentage error 1 2(d) time 1 2(e) M1 5 points plotted correctly M2 line of best fit drawn 2 2(f)(i) M1 co-ordinates read and recorded correctly M2 gradient calculated to three significant figures 2 2(f)(ii) M1 gradient × 2.303 × 8.314 correctly calculated M2 units (J mol–1 or kJ mol–1) 2
What was in this paper
The subtopics covered by these 2 questions, and how many questions each got. Open one in a new tab to see every Cambridge question on it.
What you needed in this session
Cambridge’s own grade thresholds for 2020 Feb/March, Paper 5 · Variant 2. A higher threshold means an easier paper — the bar moves with how the cohort did.