Cambridge A Level Biology 9700 — 2023 Oct/Nov Paper 5 · Variant 2
9700/52/O/N/23 · 2 questions · 30 marks · ≈34 min
The question paper and its mark scheme, free to read here and free to download. This is Cambridge’s own paper, exactly as it was sat.
Question paper16 pages




Mark scheme12 pages
Answers below. Sit the paper first if you are practising.
Questions as text
Q1 · Rocky shore ecosystems are found in some coastal regions
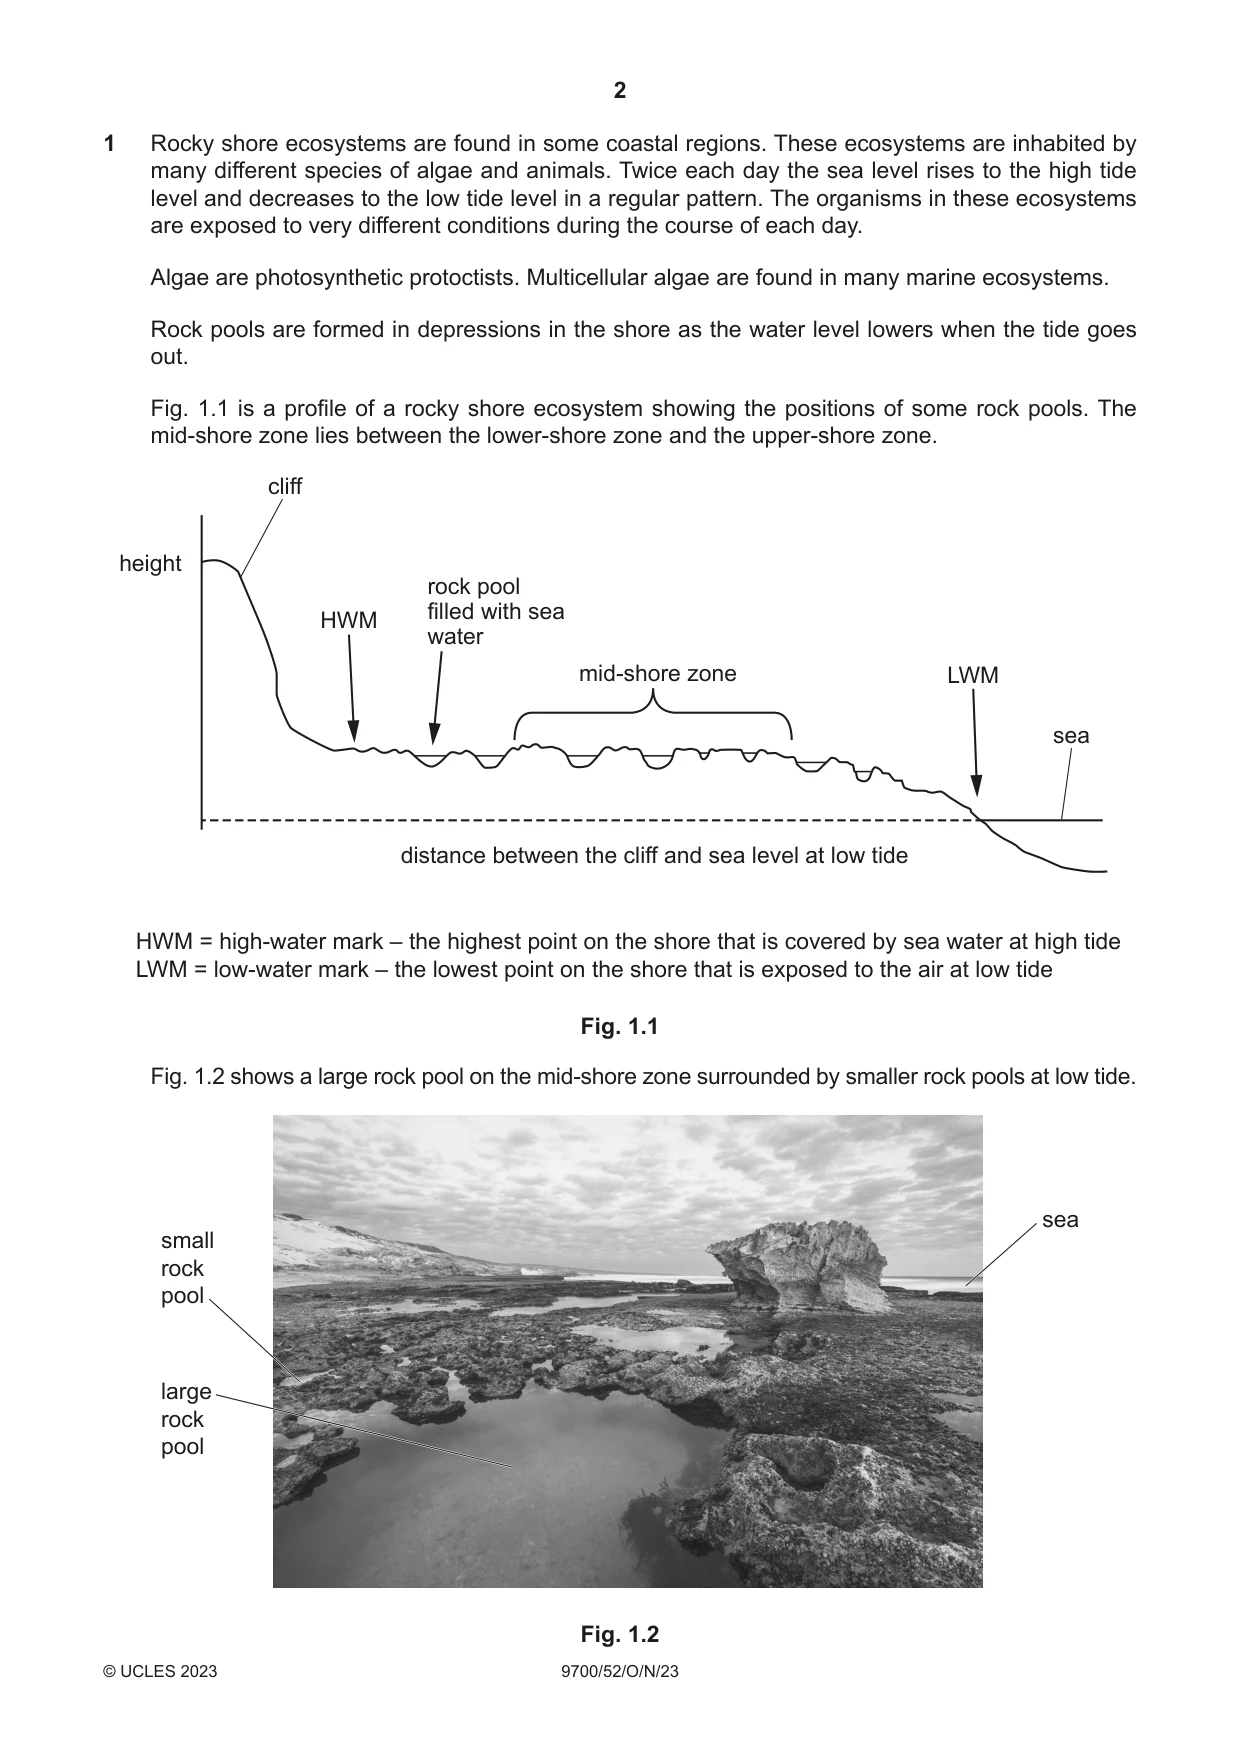
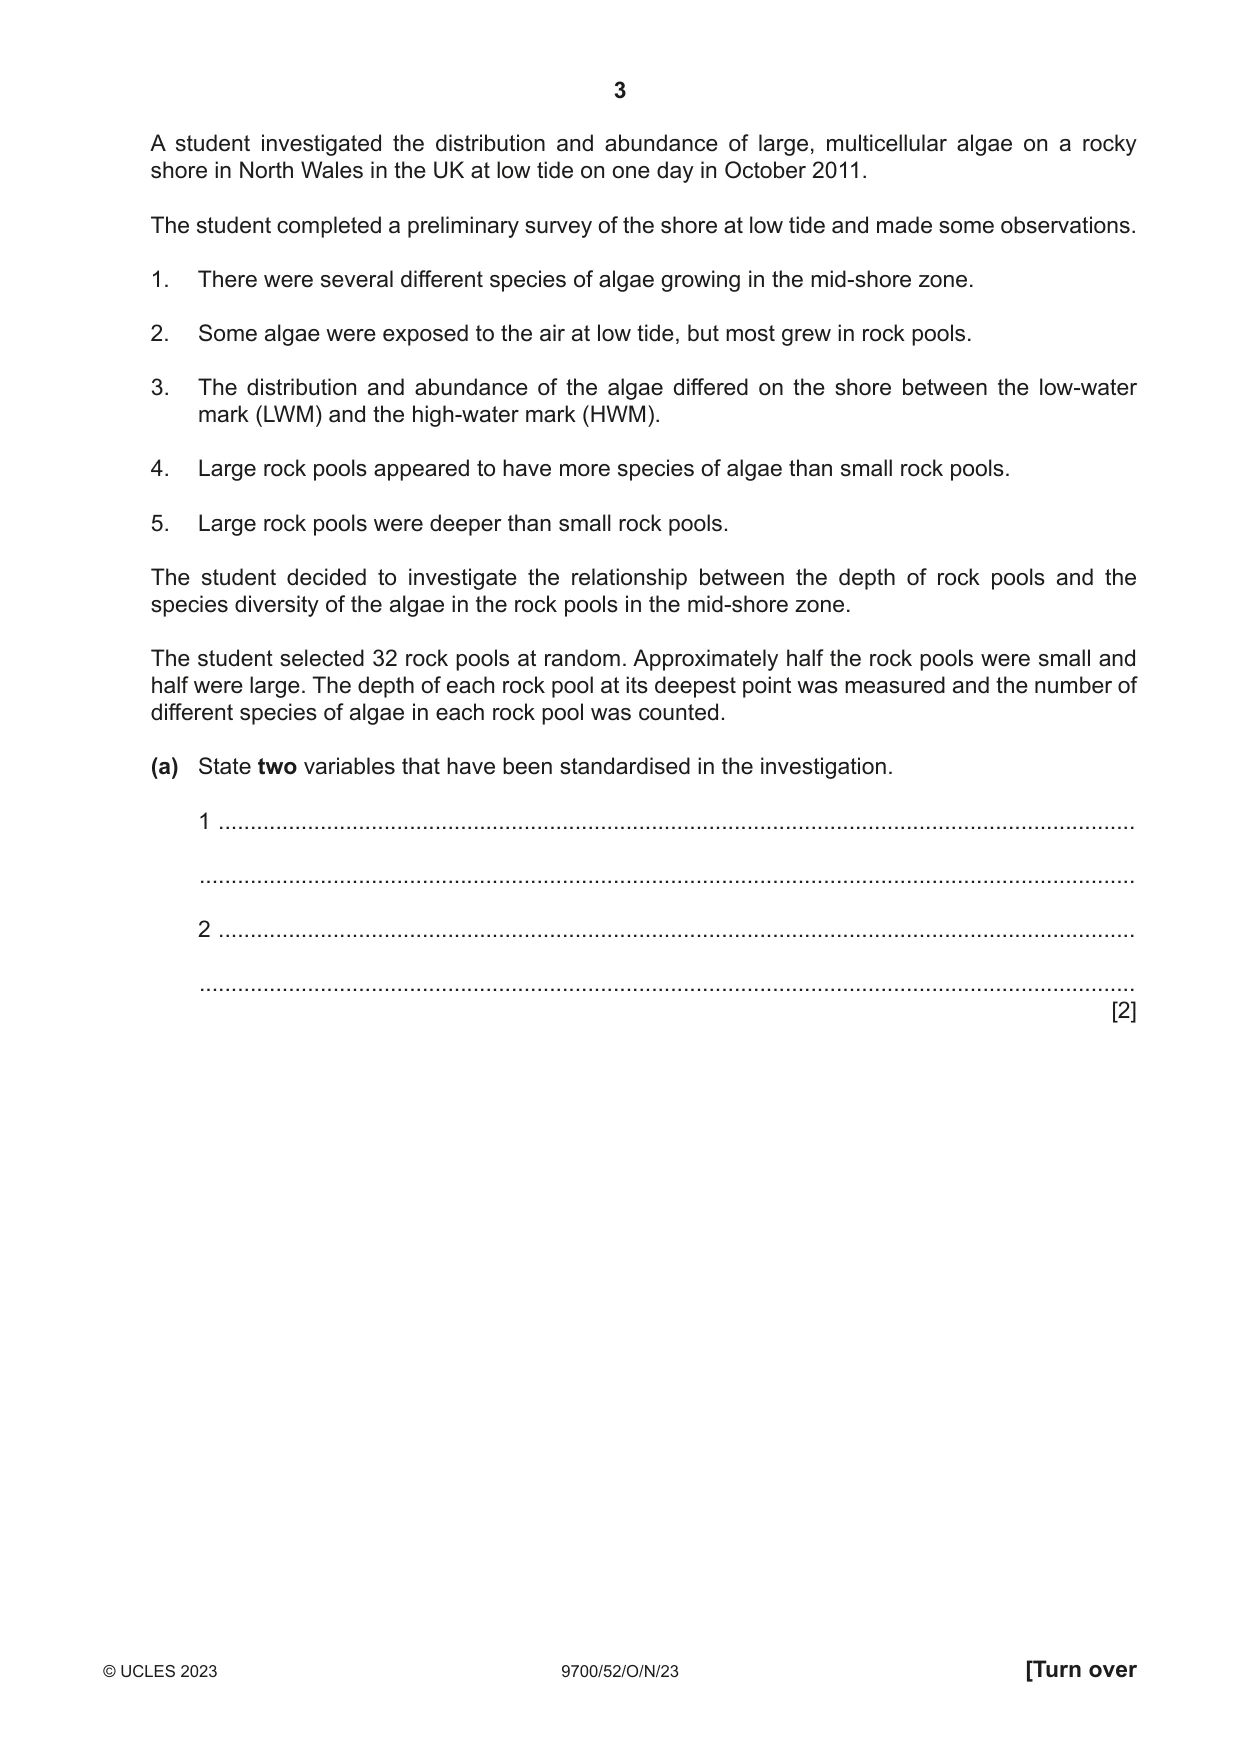
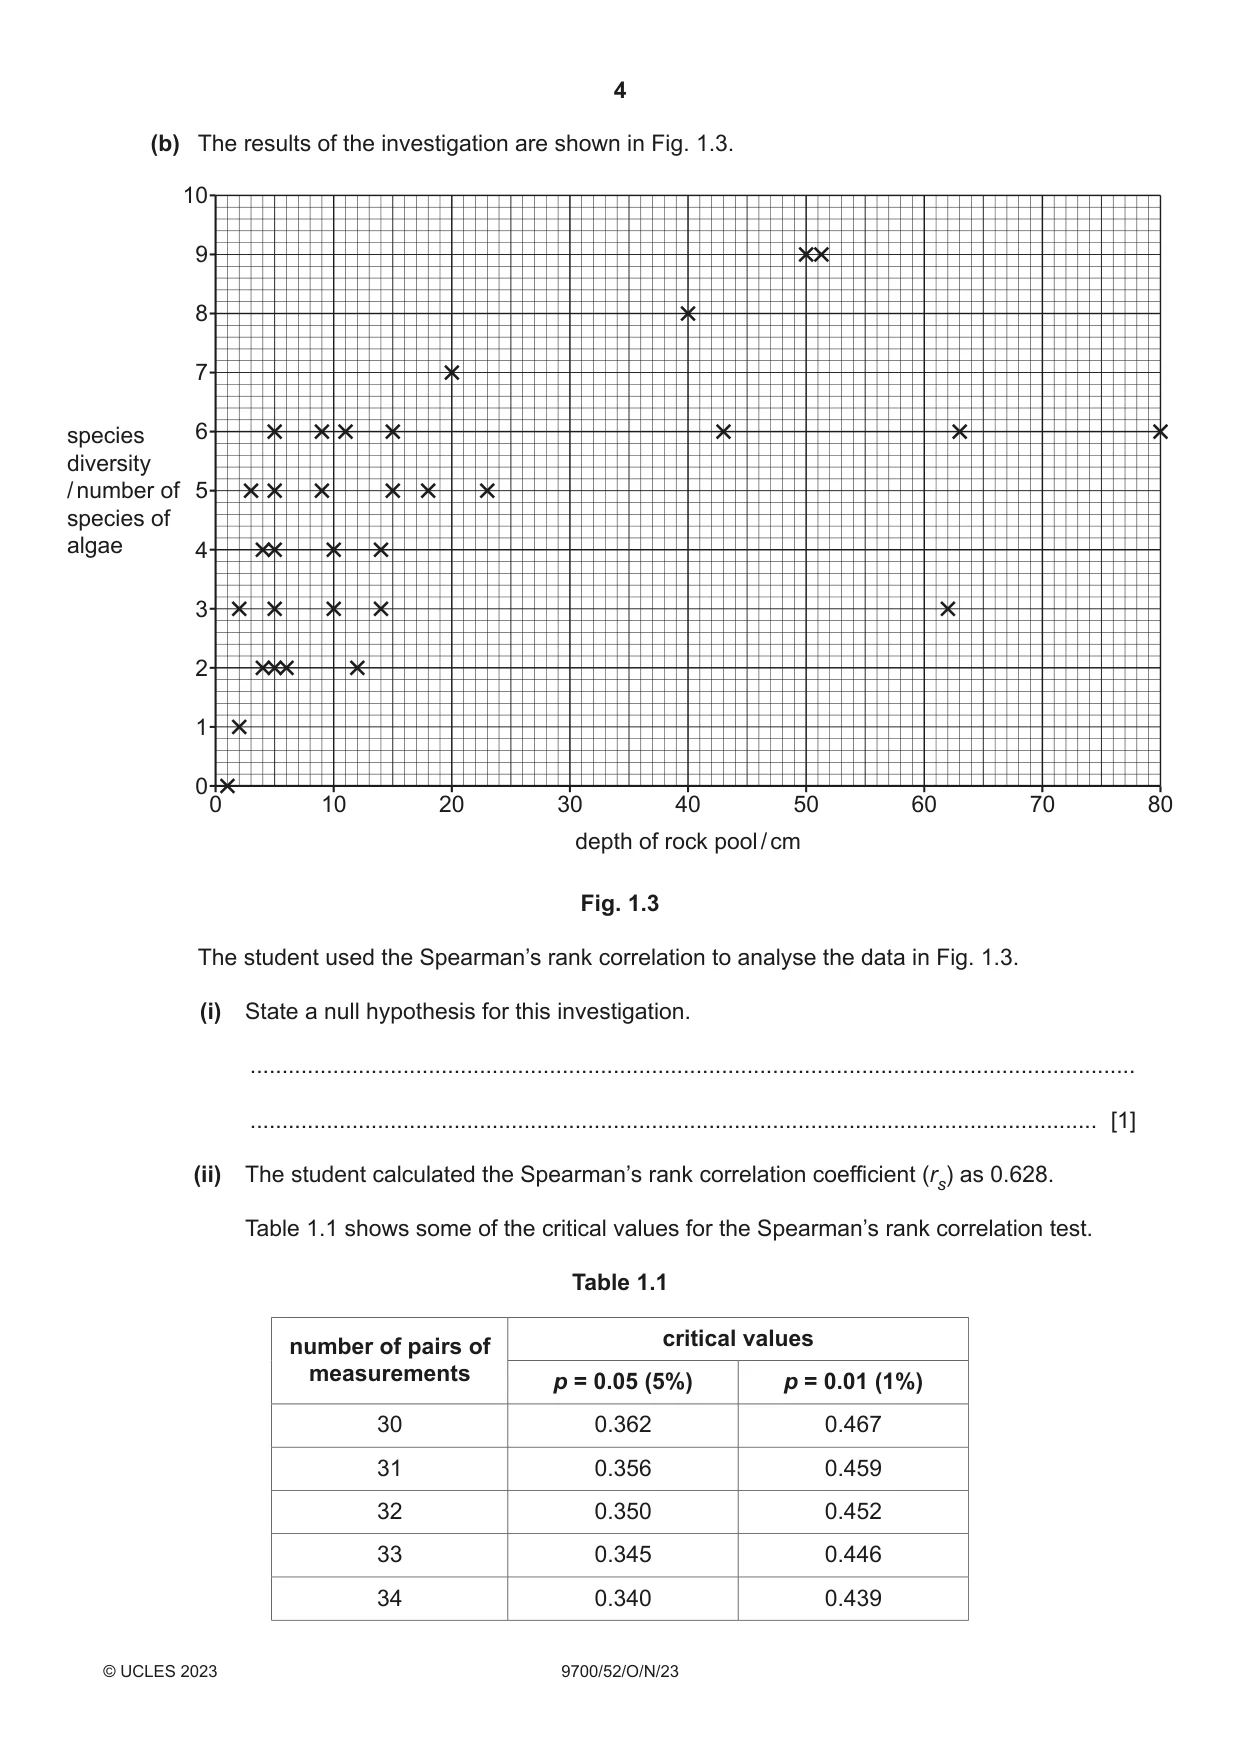
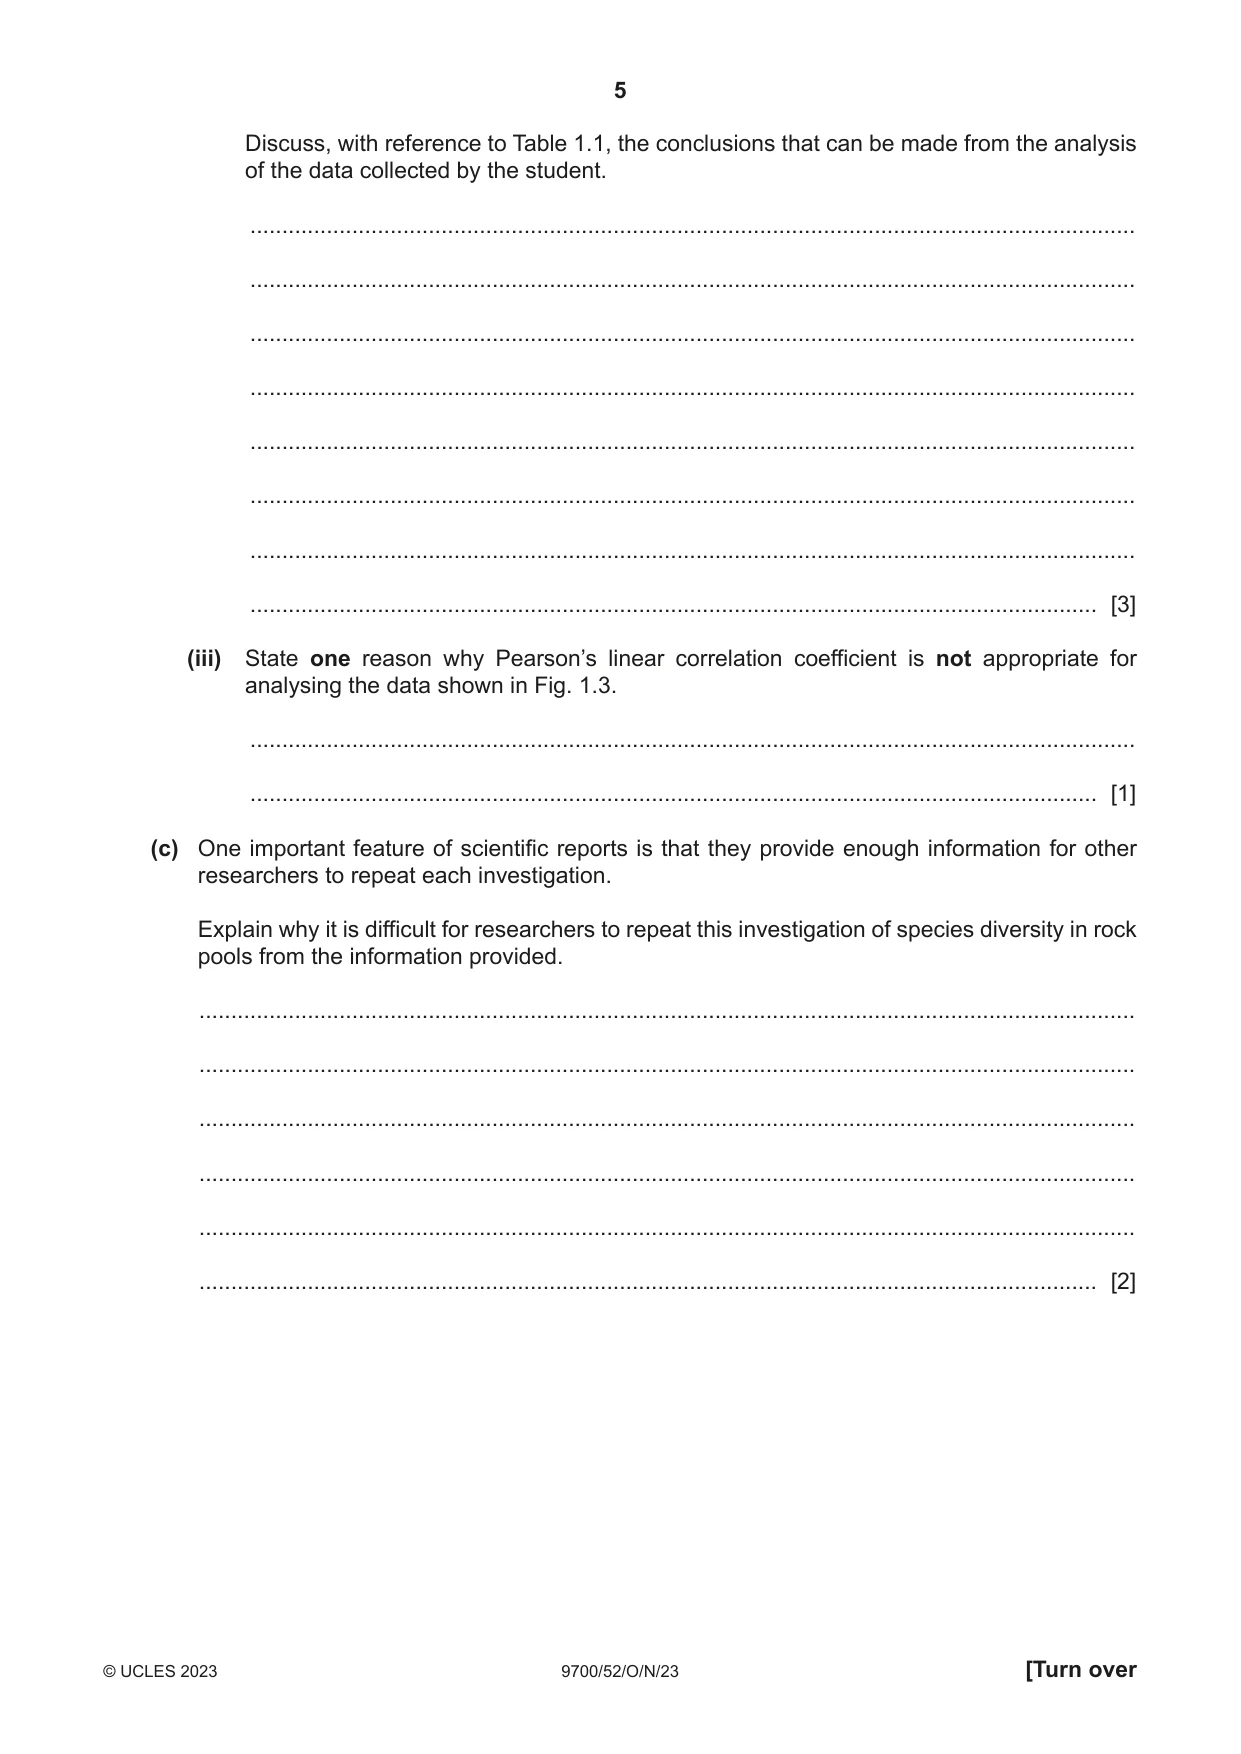
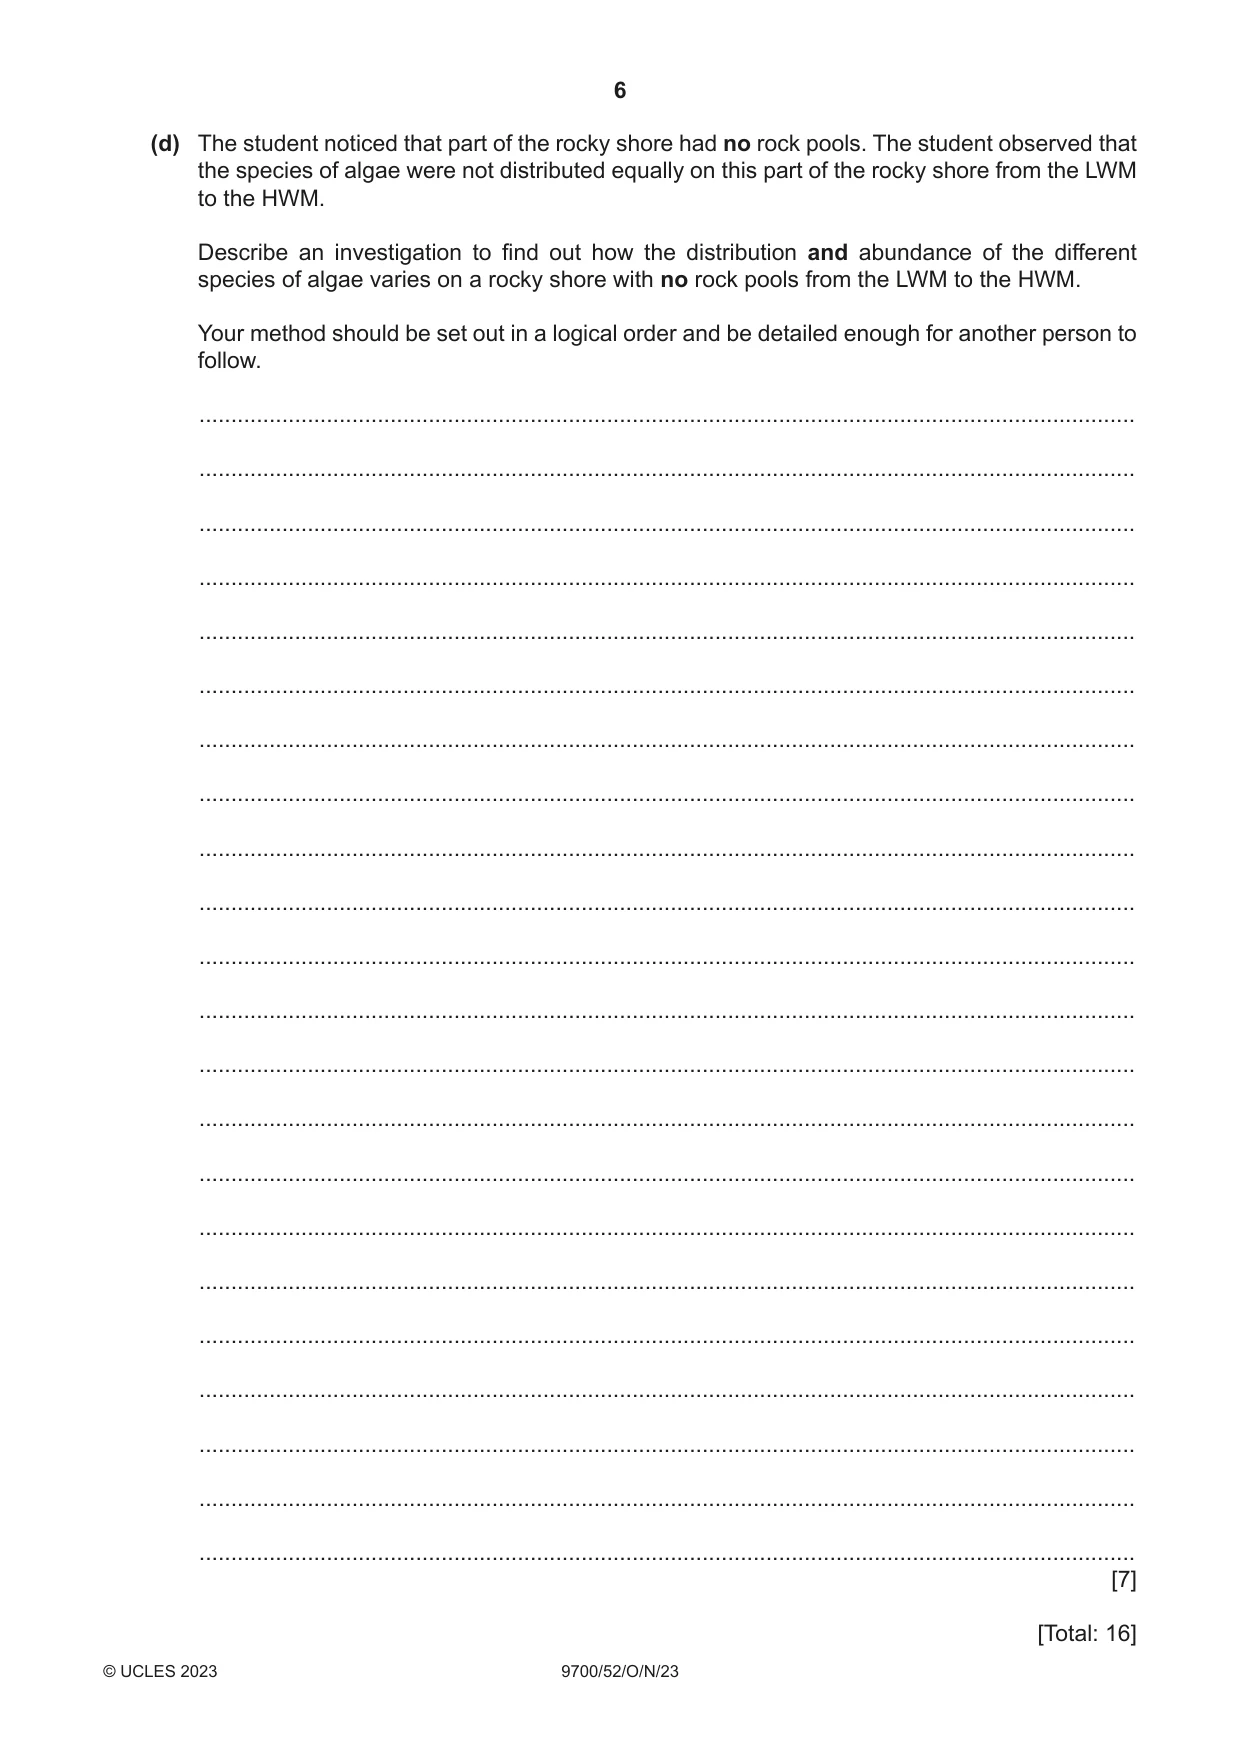
1 Rocky shore ecosystems are found in some coastal regions. These ecosystems are inhabited by many different species of algae and animals. Twice each day the sea level rises to the high tide level and decreases to the low tide level in a regular pattern. The organisms in these ecosystems are exposed to very different conditions during the course of each day. Algae are photosynthetic protoctists. Multicellular algae are found in many marine ecosystems. Rock pools are formed in depressions in the shore as the water level lowers when the tide goes out. Fig. 1.1 is a profile of a rocky shore ecosystem showing the positions of some rock pools. The mid-shore zone lies between the lower-shore zone and the upper-shore zone. cliff height rock pool filled with sea HWM water mid-shore zone LWM sea distance between the cliff and sea level at low tide HWM = high-water mark – the highest point on the shore that is covered by sea water at high tide LWM = low-water mark – the lowest point on the shore that is exposed to the air at low tide Fig. 1.1 Fig. 1.2 shows a large rock pool on the mid-shore zone surrounded by smaller rock pools at low tide. sea small rock pool large rock pool Fig. 1.2 A student investigated the distribution and abundance of large, multicellular algae on a rocky shore in North Wales in the UK at low tide on one day in October 2011. The student completed a preliminary survey of the shore at low tide and made some observations. 1. There were several different species of algae growing in the mid-shore zone. 2. Some algae were exposed to the air at low tide, but most grew in rock pools. 3. The distribution and abundance of the algae differed on the shore between the low-water mark (LWM) and the high-water mark (HWM). 4. Large rock pools appeared to have more species of algae than small rock pools. 5. Large rock pools were deeper than small rock pools. The student decided to investigate the relationship between the depth of rock pools and the species diversity of the algae in the rock pools in the mid-shore zone. The student selected 32 rock pools at random. Approximately half the rock pools were small and half were large. The depth of each rock pool at its deepest point was measured and the number of different species of algae in each rock pool was counted. (a) State two variables that have been standardised in the investigation. 1 ................................................................................................................................................ ................................................................................................................................................... 2 ................................................................................................................................................ ................................................................................................................................................... [2] (b) The results of the investigation are shown in Fig. 1.3. 10 9 8 7 species 6 diversity / number of 5 species of algae 4 3 2 1 0 0 10 20 30 40 50 60 70 80 depth of rock pool / cm Fig. 1.3 The student used the Spearman’s rank correlation to analyse the data in Fig. 1.3. (i) State a null hypothesis for this investigation. ........................................................................................................................................... ..................................................................................................................................... [1] (ii) The student calculated the Spearman’s rank correlation coefficient (rs) as 0.628. Table 1.1 shows some of the critical values for the Spearman’s rank correlation test. Table 1.1 critical values number of pairs of measurements p = 0.05 (5%) p = 0.01 (1%) 30 0.362 0.467 31 0.356 0.459 32 0.350 0.452 33 0.345 0.446 34 0.340 0.439 Discuss, with reference to Table 1.1, the conclusions that can be made from the analysis of the data collected by the student. ........................................................................................................................................... ........................................................................................................................................... ........................................................................................................................................... ........................................................................................................................................... ........................................................................................................................................... ........................................................................................................................................... ........................................................................................................................................... ..................................................................................................................................... [3] (iii) State one reason why Pearson’s linear correlation coefficient is not appropriate for analysing the data shown in Fig. 1.3. ........................................................................................................................................... ..................................................................................................................................... [1] (c) One important feature of scientific reports is that they provide enough information for other researchers to repeat each investigation. Explain why it is difficult for researchers to repeat this investigation of species diversity in rock pools from the information provided. ................................................................................................................................................... ................................................................................................................................................... ................................................................................................................................................... ................................................................................................................................................... ................................................................................................................................................... ............................................................................................................................................. [2] (d) The student noticed that part of the rocky shore had no rock pools. The student observed that the species of algae were not distributed equally on this part of the rocky shore from the LWM to the HWM. Describe an investigation to find out how the distribution and abundance of the different species of algae varies on a rocky shore with no rock pools from the LWM to the HWM. Your method should be set out in a logical order and be detailed enough for another person to follow. ................................................................................................................................................... ................................................................................................................................................... ................................................................................................................................................... ................................................................................................................................................... ................................................................................................................................................... ................................................................................................................................................... ................................................................................................................................................... ................................................................................................................................................... ................................................................................................................................................... ................................................................................................................................................... ................................................................................................................................................... ................................................................................................................................................... ................................................................................................................................................... ................................................................................................................................................... ................................................................................................................................................... ................................................................................................................................................... ................................................................................................................................................... ................................................................................................................................................... ................................................................................................................................................... ................................................................................................................................................... ................................................................................................................................................... ................................................................................................................................................... [7] [Total: 16]
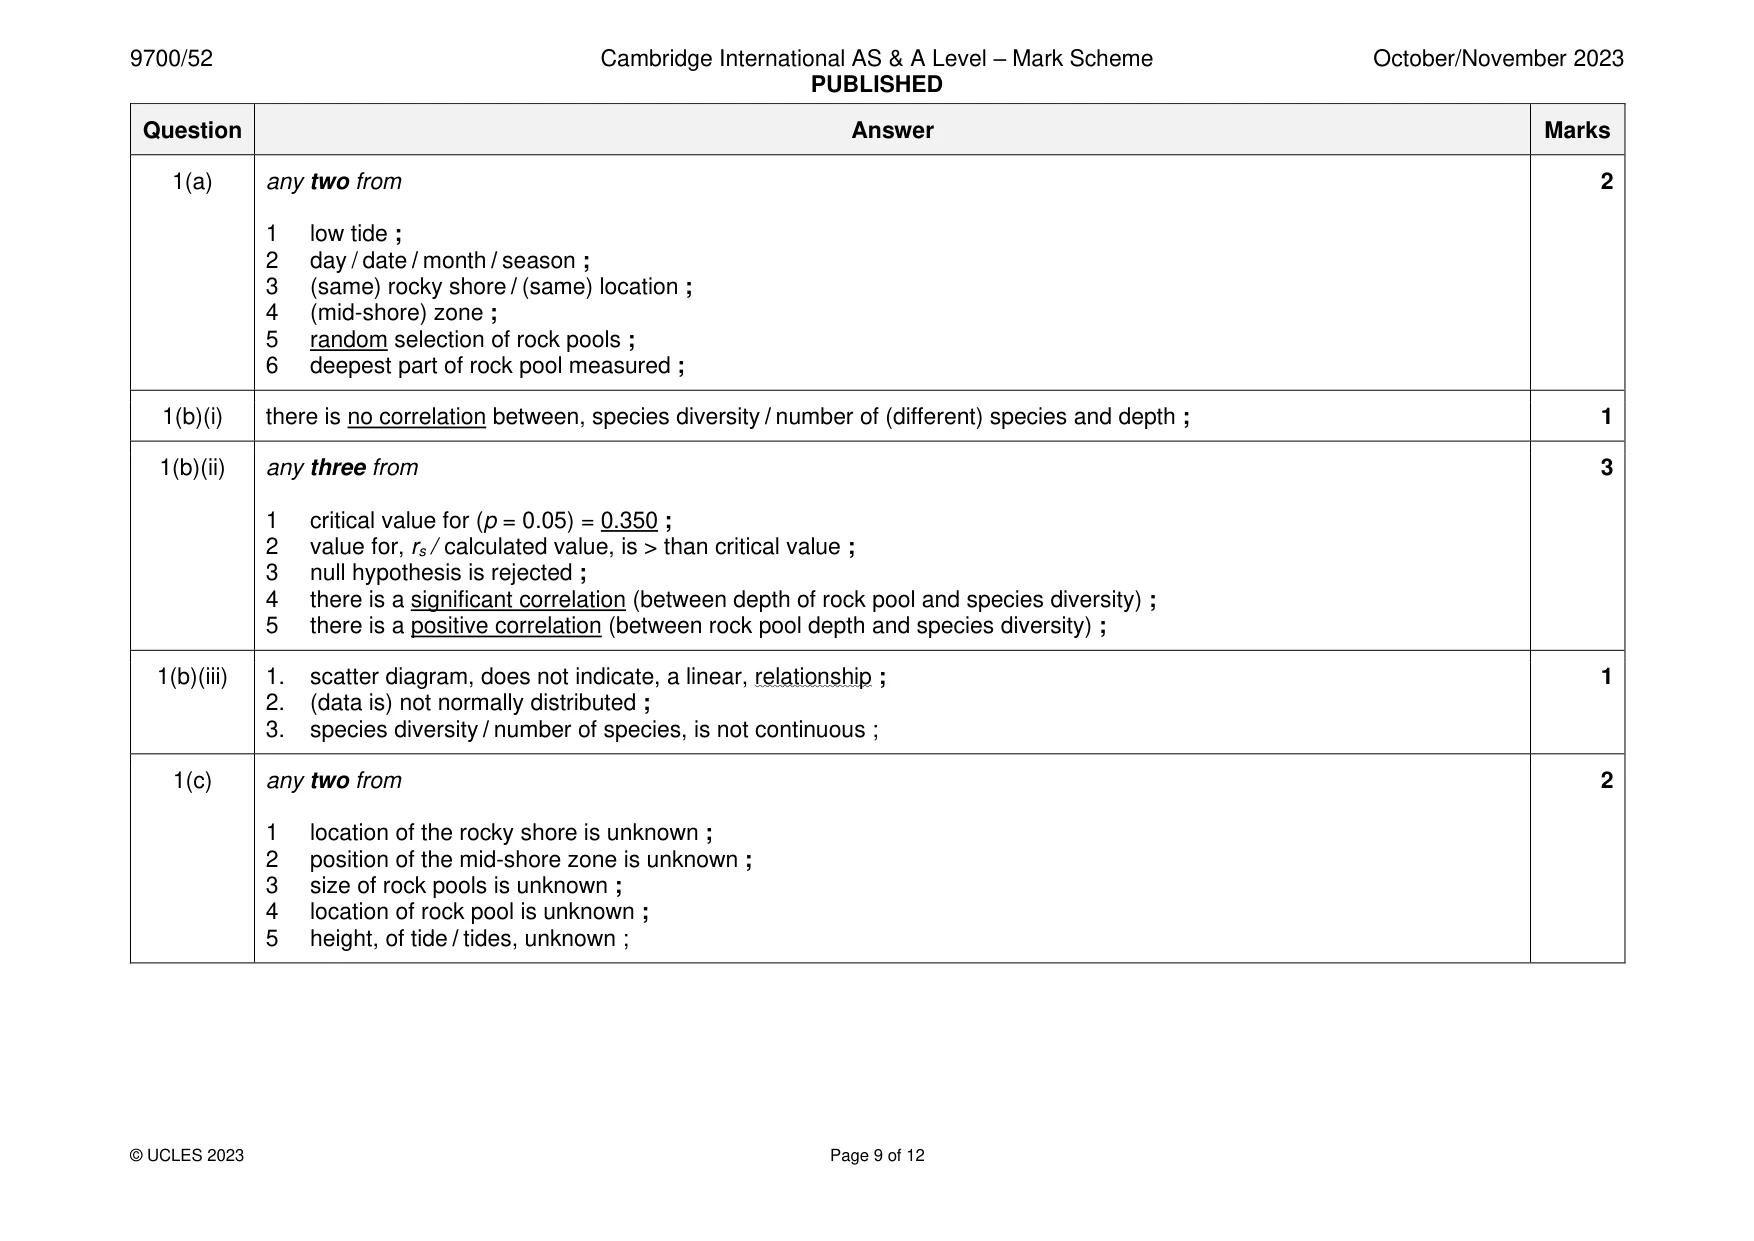
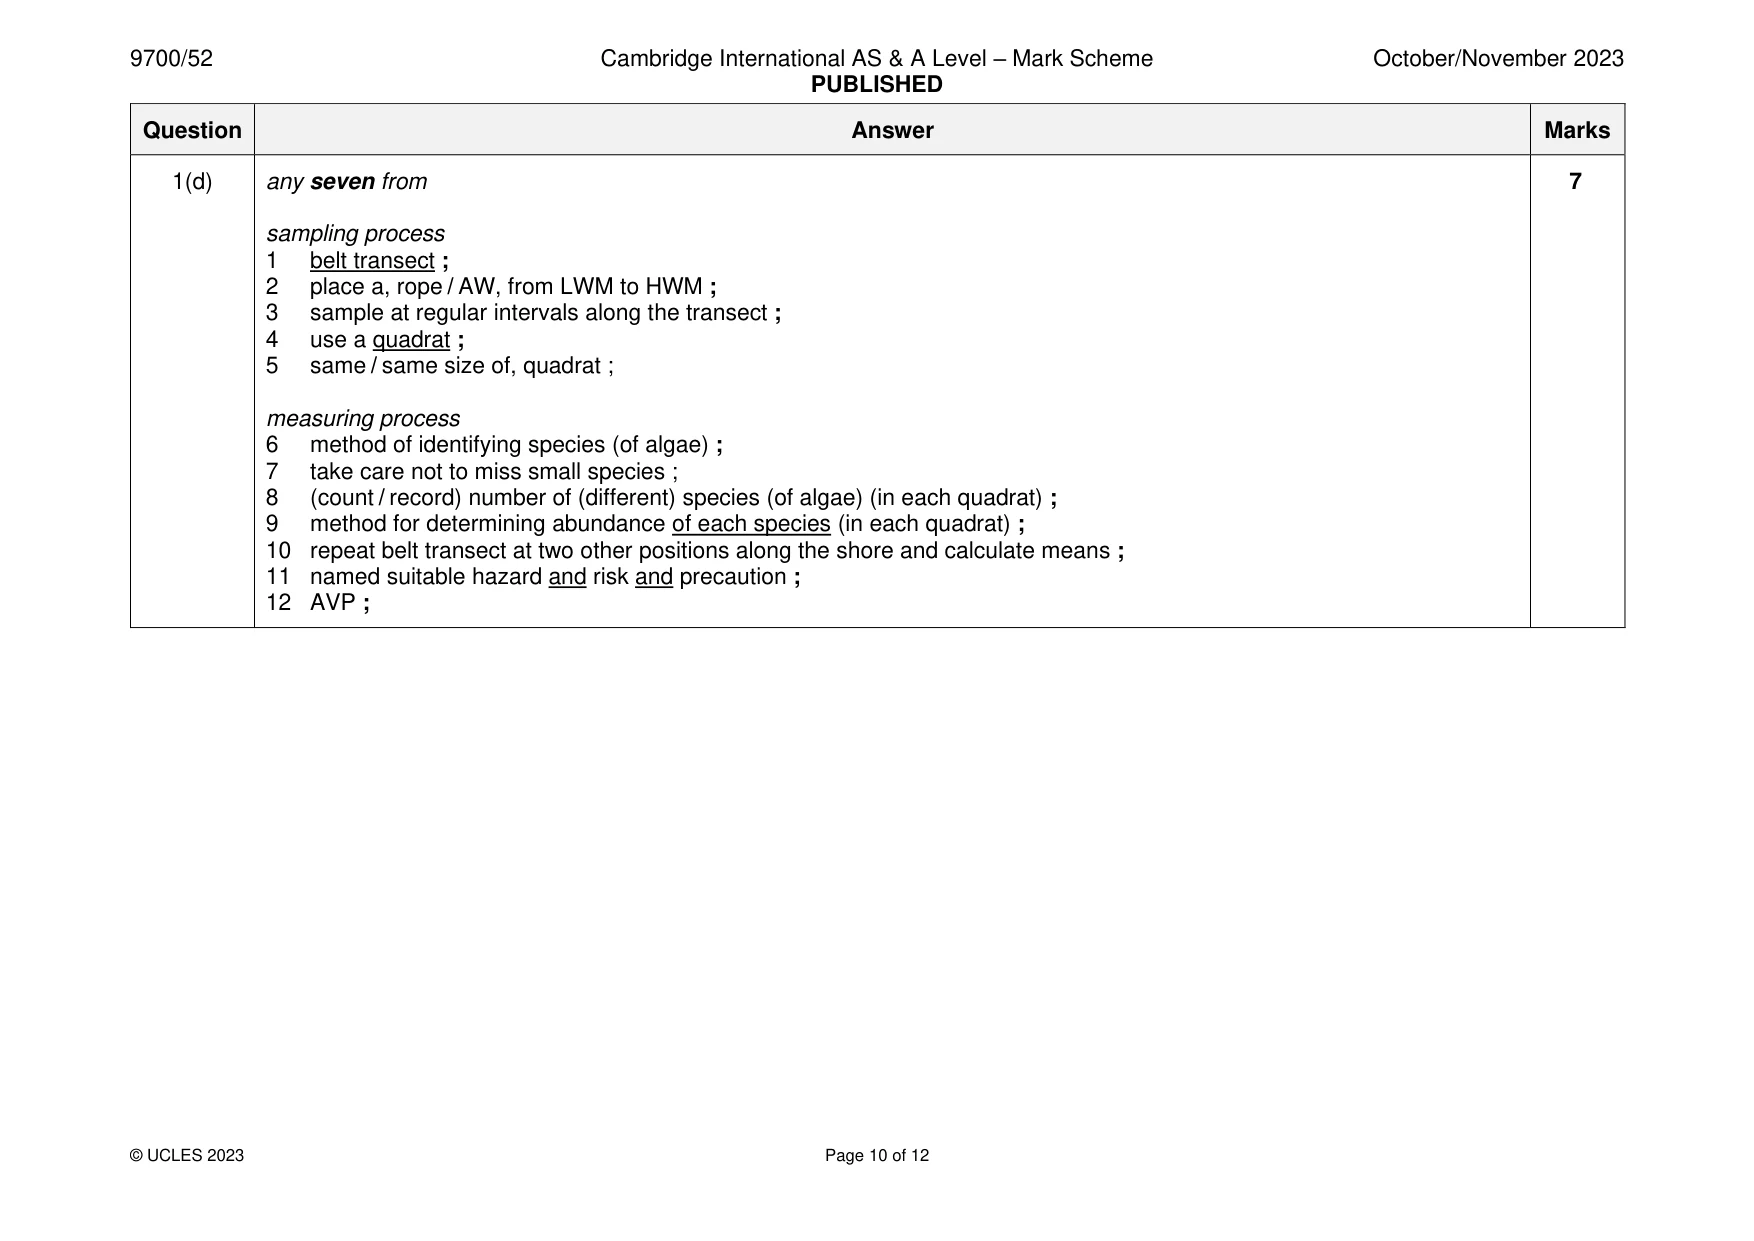
Mark scheme: Question Answer Marks 1(a) any two from 2 1 low tide ; 2 day / date / month / season ; 3 (same) rocky shore / (same) location ; 4 (mid-shore) zone ; 5 random selection of rock pools ; 6 deepest part of rock pool measured ; 1(b)(i) there is no correlation between, species diversity / number of (different) species and depth ; 1 1(b)(ii) any three from 3 1 critical value for (p = 0.05) = 0.350 ; 2 value for, rs / calculated value, is > than critical value ; 3 null hypothesis is rejected ; 4 there is a significant correlation (between depth of rock pool and species diversity) ; 5 there is a positive correlation (between rock pool depth and species diversity) ; 1(b)(iii) 1. scatter diagram, does not indicate, a linear, relationship ; 1 2. (data is) not normally distributed ; 3. species diversity / number of species, is not continuous ; 1(c) any two from 2 1 location of the rocky shore is unknown ; 2 position of the mid-shore zone is unknown ; 3 size of rock pools is unknown ; 4 location of rock pool is unknown ; 5 height, of tide / tides, unknown ; 1(d) any seven from 7 sampling process 1 belt transect ; 2 place a, rope / AW, from LWM to HWM ; 3 sample at regular intervals along the transect ; 4 use a quadrat ; 5 same / same size of, quadrat ; measuring process 6 method of identifying species (of algae) ; 7 take care not to miss small species ; 8 (count / record) number of (different) species (of algae) (in each quadrat) ; 9 method for determining abundance of each species (in each quadrat) ; 10 repeat belt transect at two other positions along the shore and calculate means ; 11 named suitable hazard and risk and precaution ; 12 AVP ;
Q2 · Abscisic acid (ABA) is a plant hormone that influences the growth and development of…
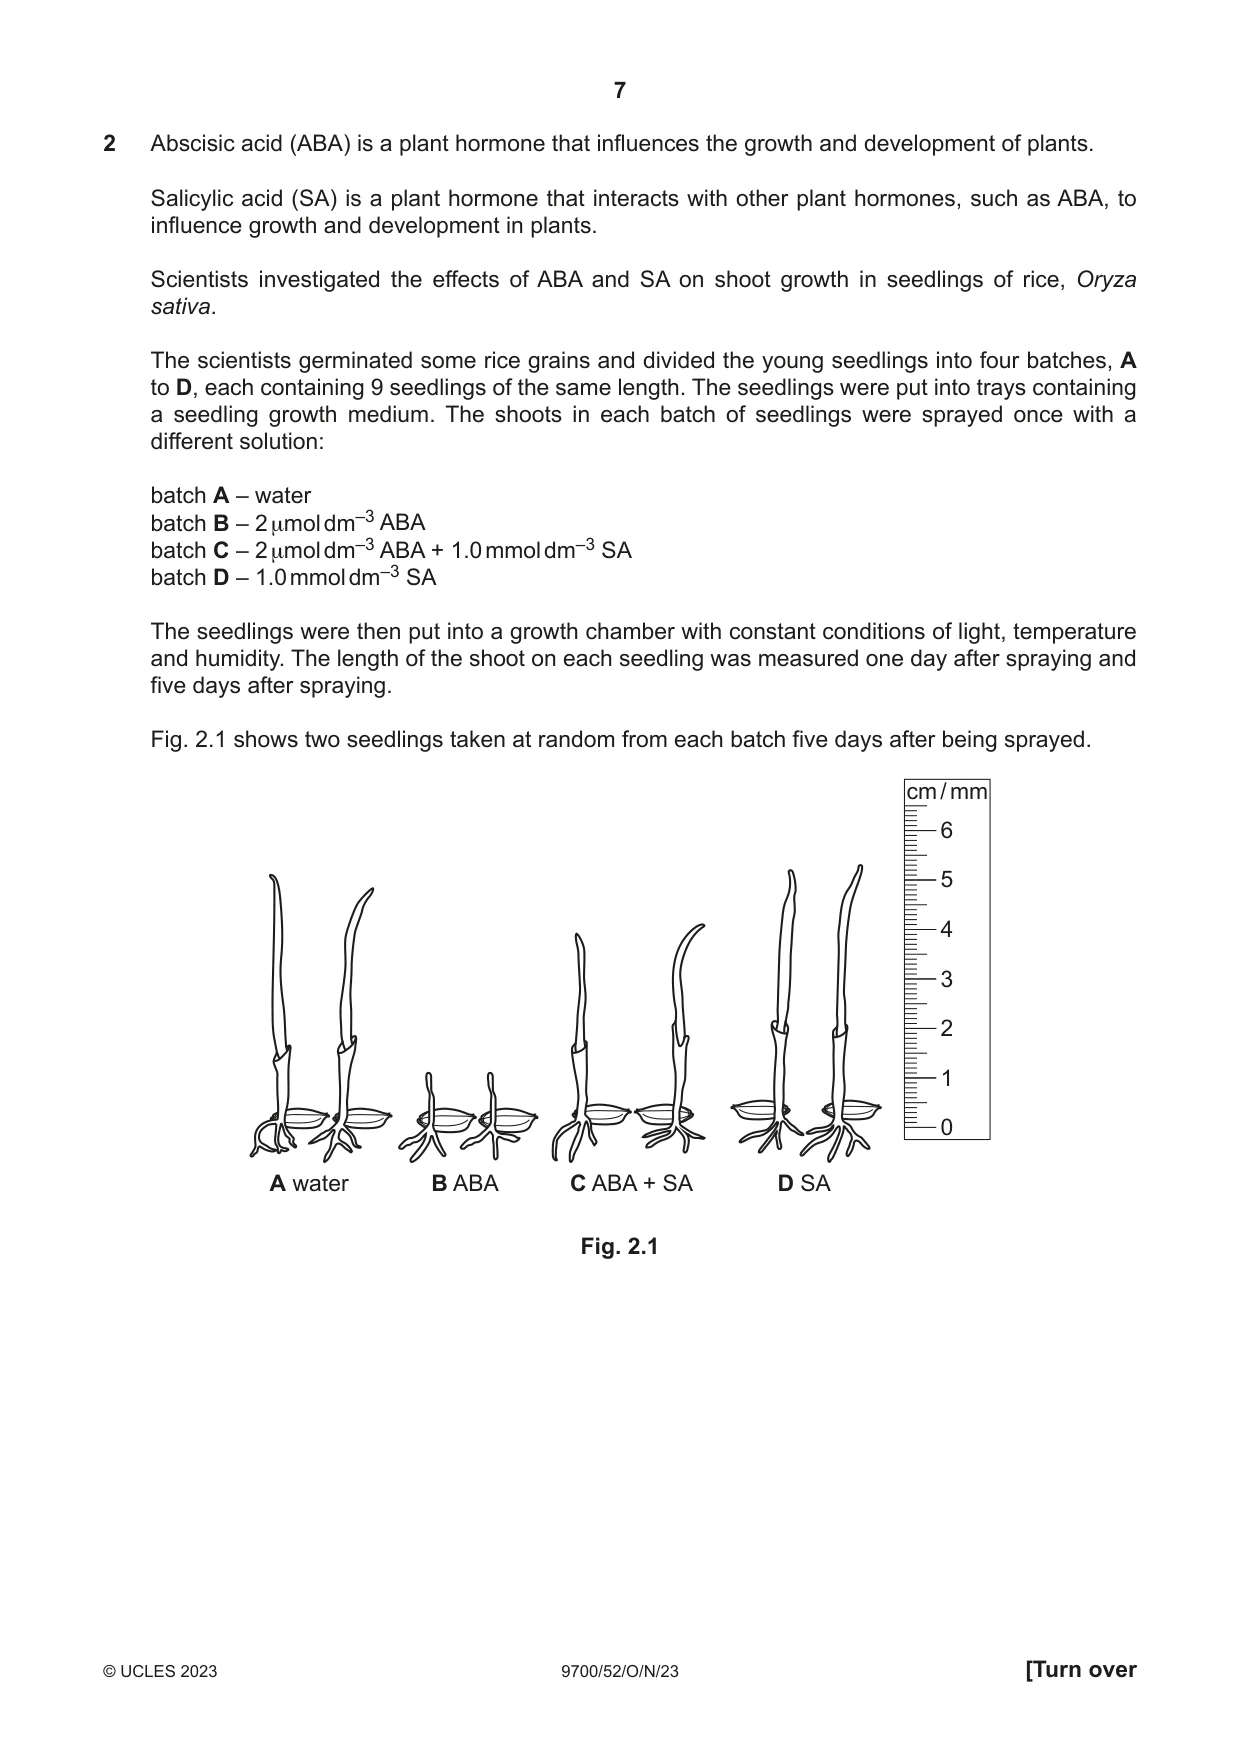
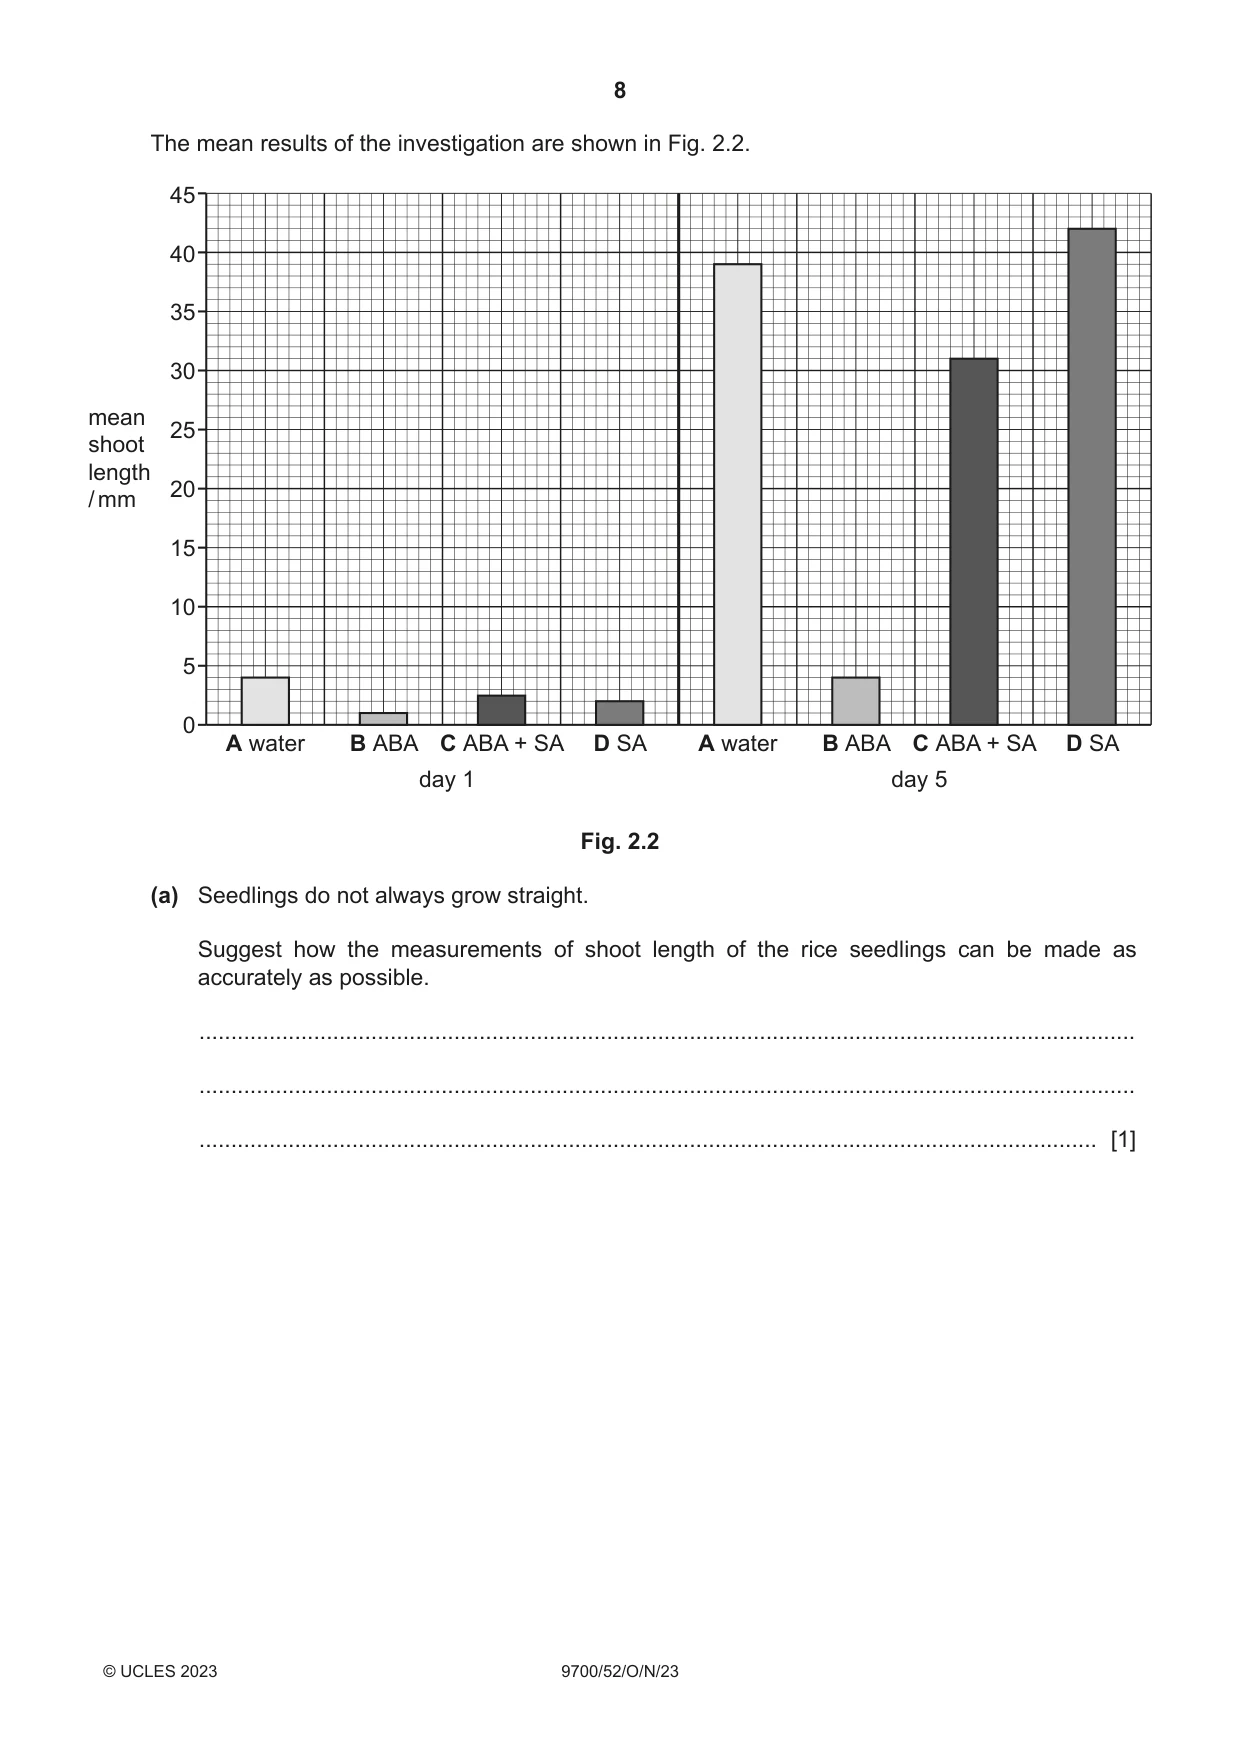
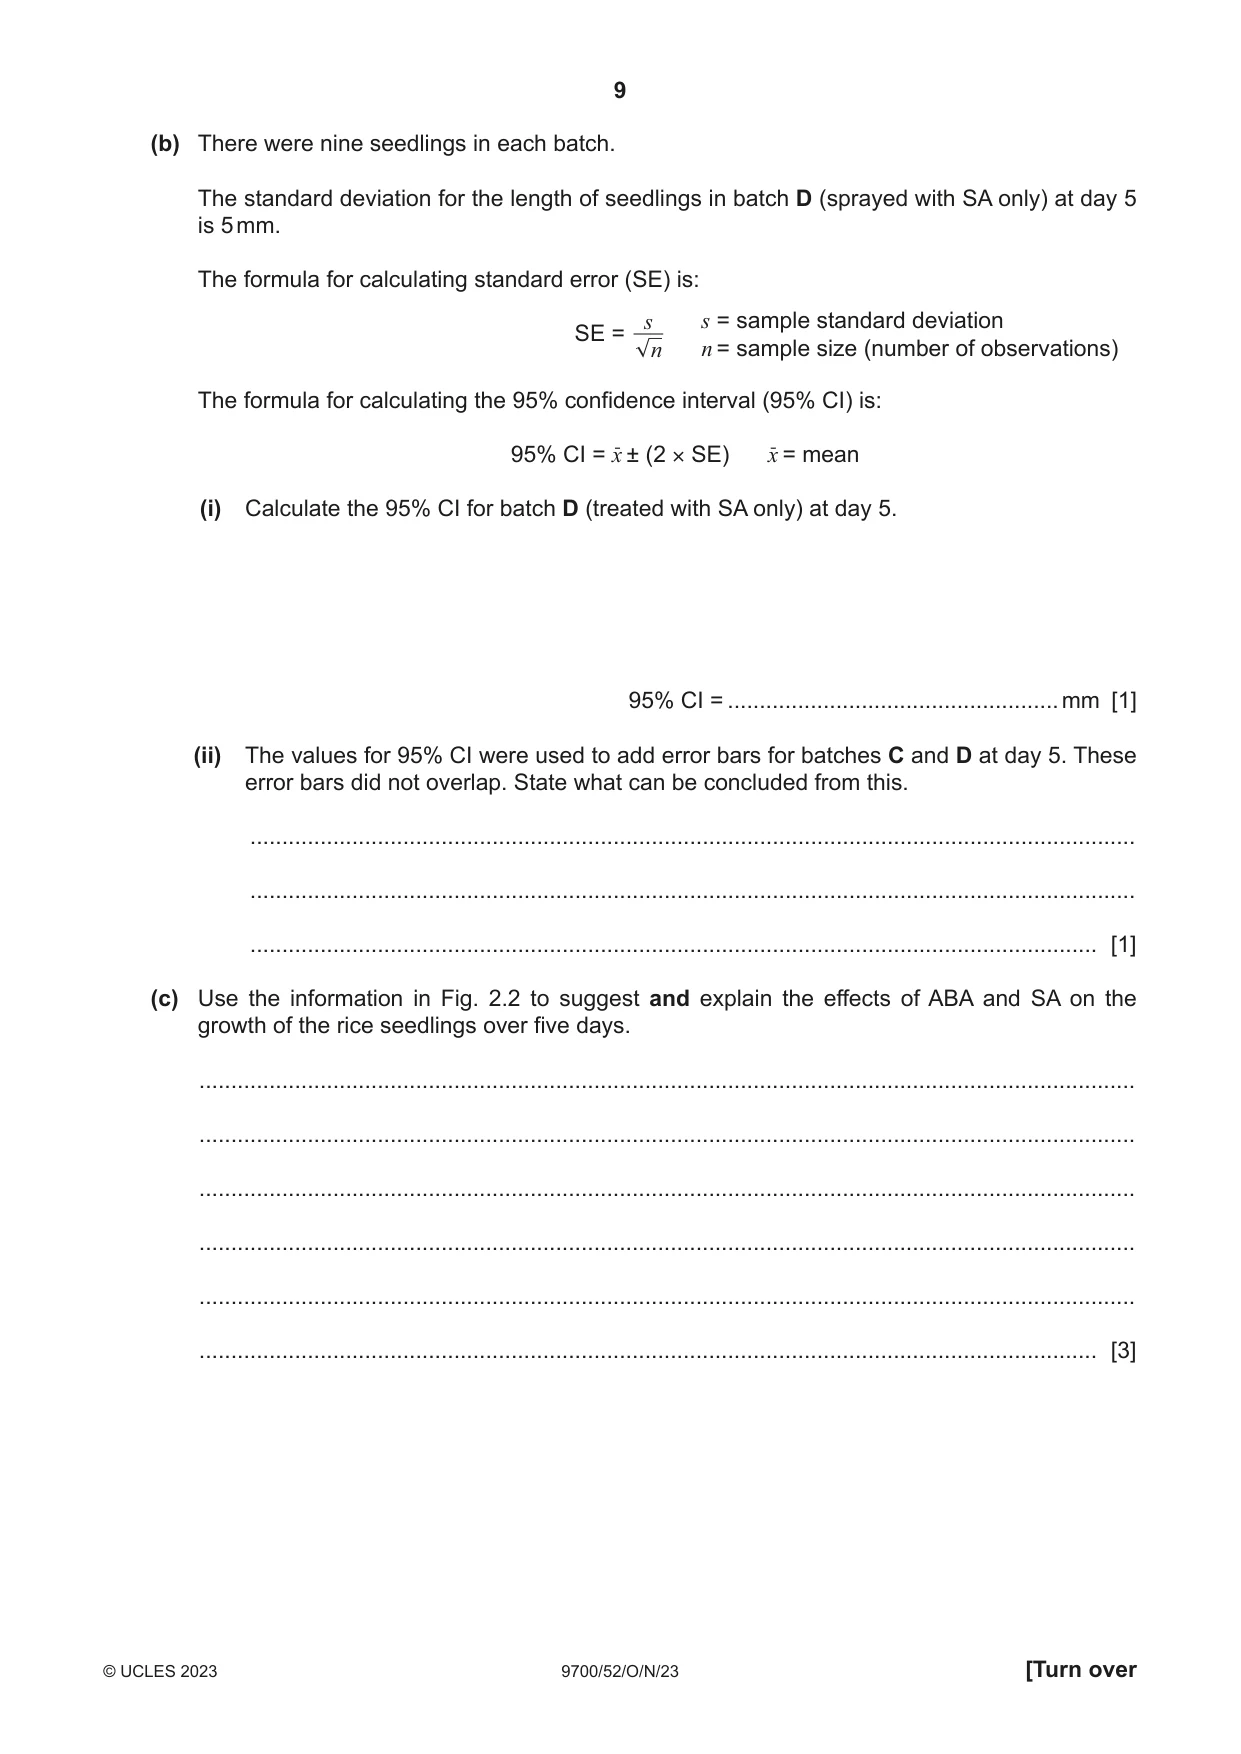
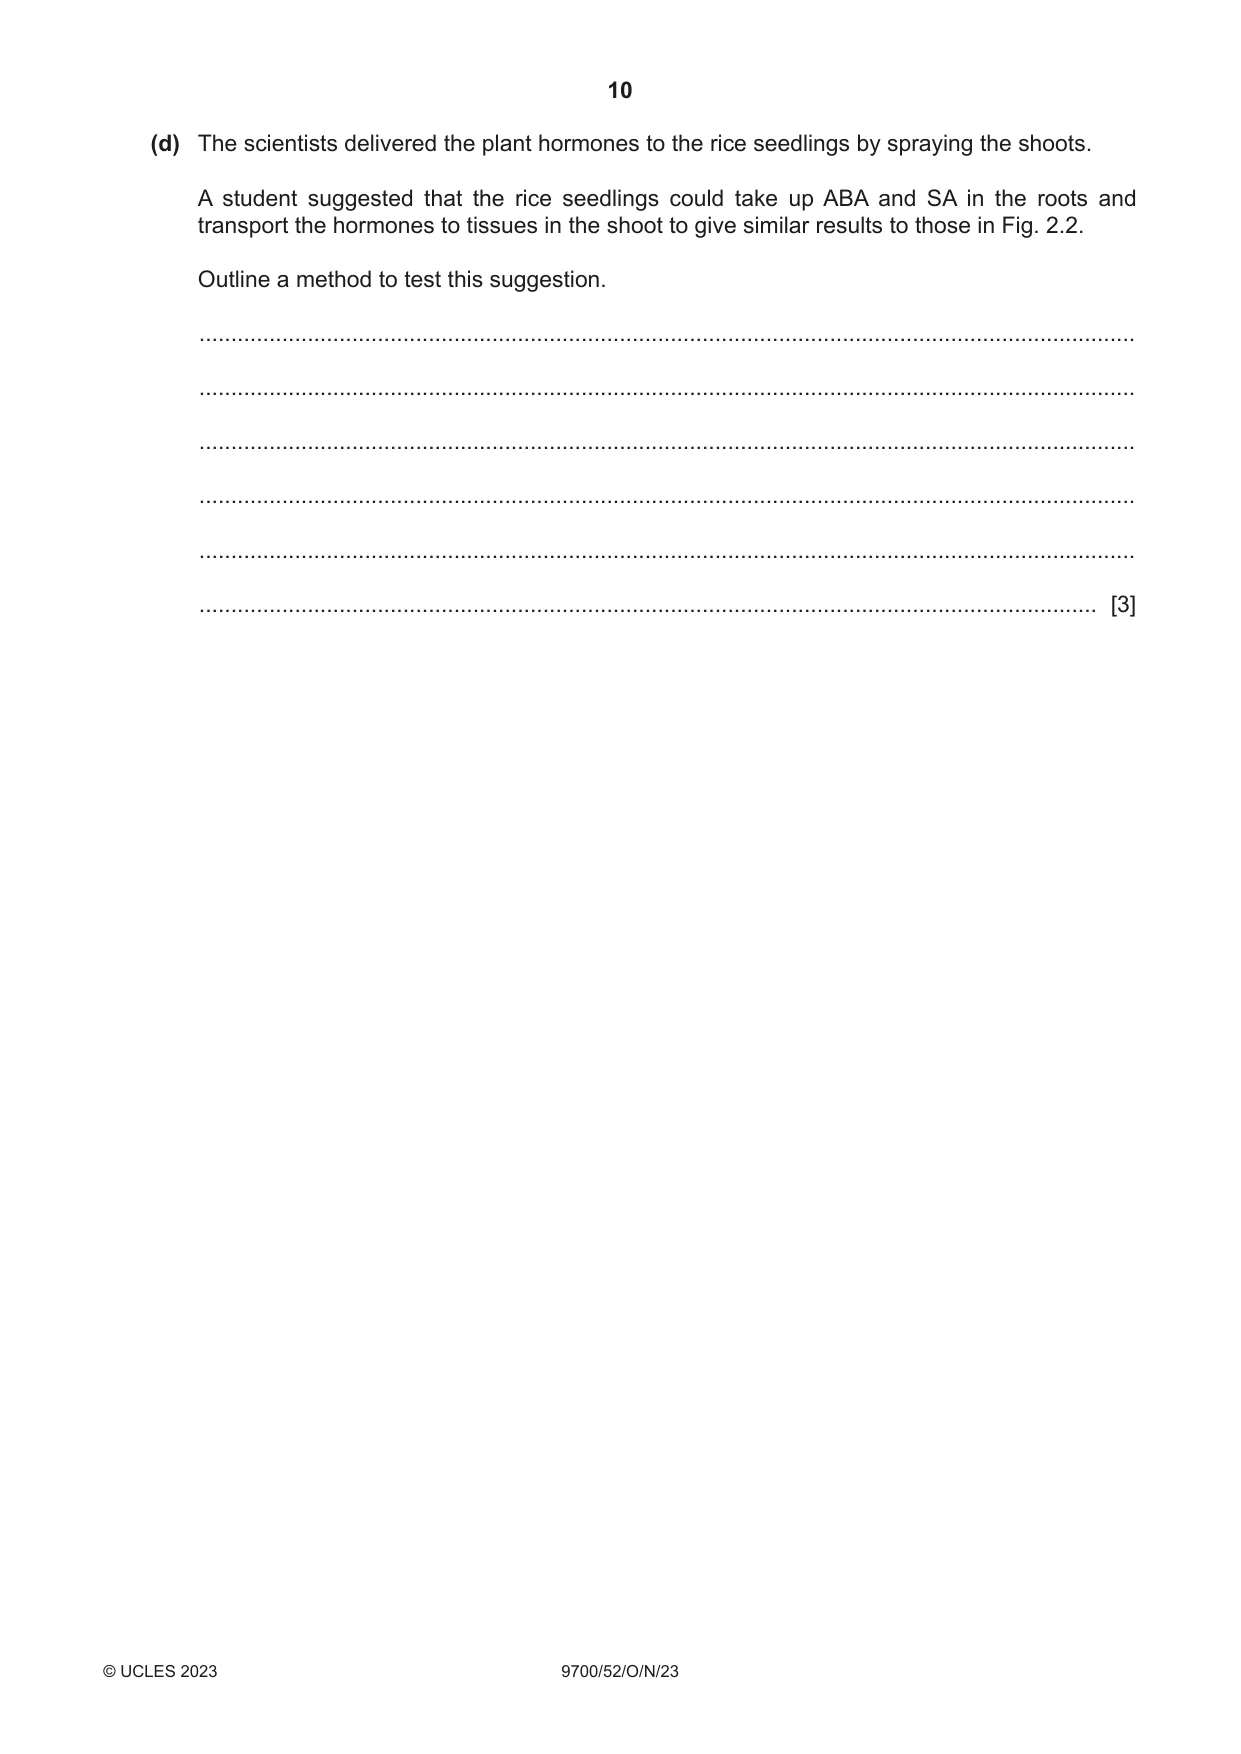
2 Abscisic acid (ABA) is a plant hormone that influences the growth and development of plants. Salicylic acid (SA) is a plant hormone that interacts with other plant hormones, such as ABA, to influence growth and development in plants. Scientists investigated the effects of ABA and SA on shoot growth in seedlings of rice, Oryza sativa. The scientists germinated some rice grains and divided the young seedlings into four batches, A to D, each containing 9 seedlings of the same length. The seedlings were put into trays containing a seedling growth medium. The shoots in each batch of seedlings were sprayed once with a different solution: batch A – water batch B – 2 μmol dm–3 ABA batch C – 2 μmol dm–3 ABA + 1.0 mmol dm–3 SA batch D – 1.0 mmol dm–3 SA The seedlings were then put into a growth chamber with constant conditions of light, temperature and humidity. The length of the shoot on each seedling was measured one day after spraying and five days after spraying. Fig. 2.1 shows two seedlings taken at random from each batch five days after being sprayed. cm / mm 6 5 4 3 2 1 0 A water B ABA C ABA + SA D SA Fig. 2.1 The mean results of the investigation are shown in Fig. 2.2. 45 40 35 30 mean 25shoot length 20/ mm 15 10 5 0 A water B ABA C ABA + SA D SA A water B ABA C ABA + SA D SA day 1 day 5 Fig. 2.2 (a) Seedlings do not always grow straight. Suggest how the measurements of shoot length of the rice seedlings can be made as accurately as possible. ................................................................................................................................................... ................................................................................................................................................... ............................................................................................................................................. [1] (b) There were nine seedlings in each batch. The standard deviation for the length of seedlings in batch D (sprayed with SA only) at day 5 is 5 mm. The formula for calculating standard error (SE) is: s s = sample standard deviation SE = n n = sample size (number of observations) The formula for calculating the 95% confidence interval (95% CI) is: 95% CI = x˗ ± (2 × SE) x˗ = mean (i) Calculate the 95% CI for batch D (treated with SA only) at day 5. 95% CI = .................................................... mm [1] (ii) The values for 95% CI were used to add error bars for batches C and D at day 5. These error bars did not overlap. State what can be concluded from this. ........................................................................................................................................... ........................................................................................................................................... ..................................................................................................................................... [1] (c) Use the information in Fig. 2.2 to suggest and explain the effects of ABA and SA on the growth of the rice seedlings over five days. ................................................................................................................................................... ................................................................................................................................................... ................................................................................................................................................... ................................................................................................................................................... ................................................................................................................................................... ............................................................................................................................................. [3]
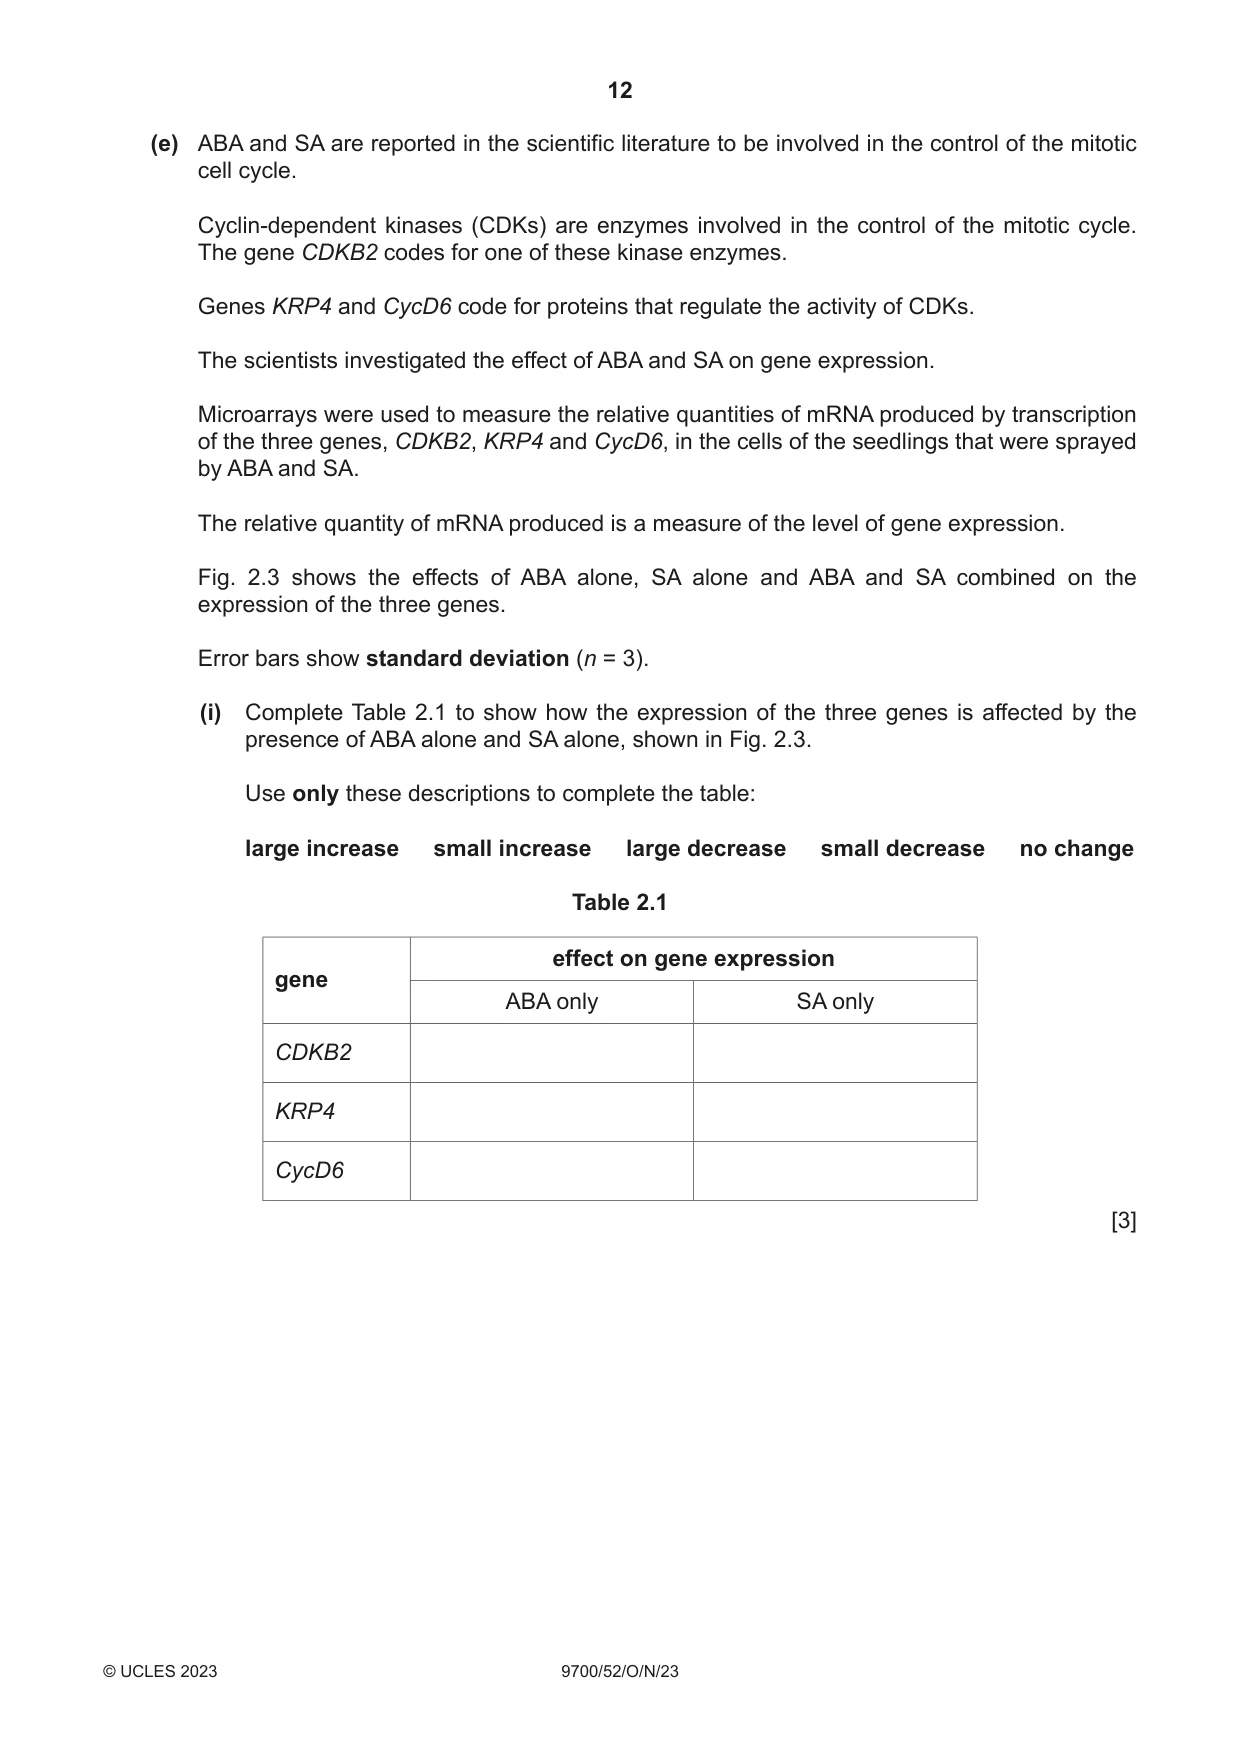
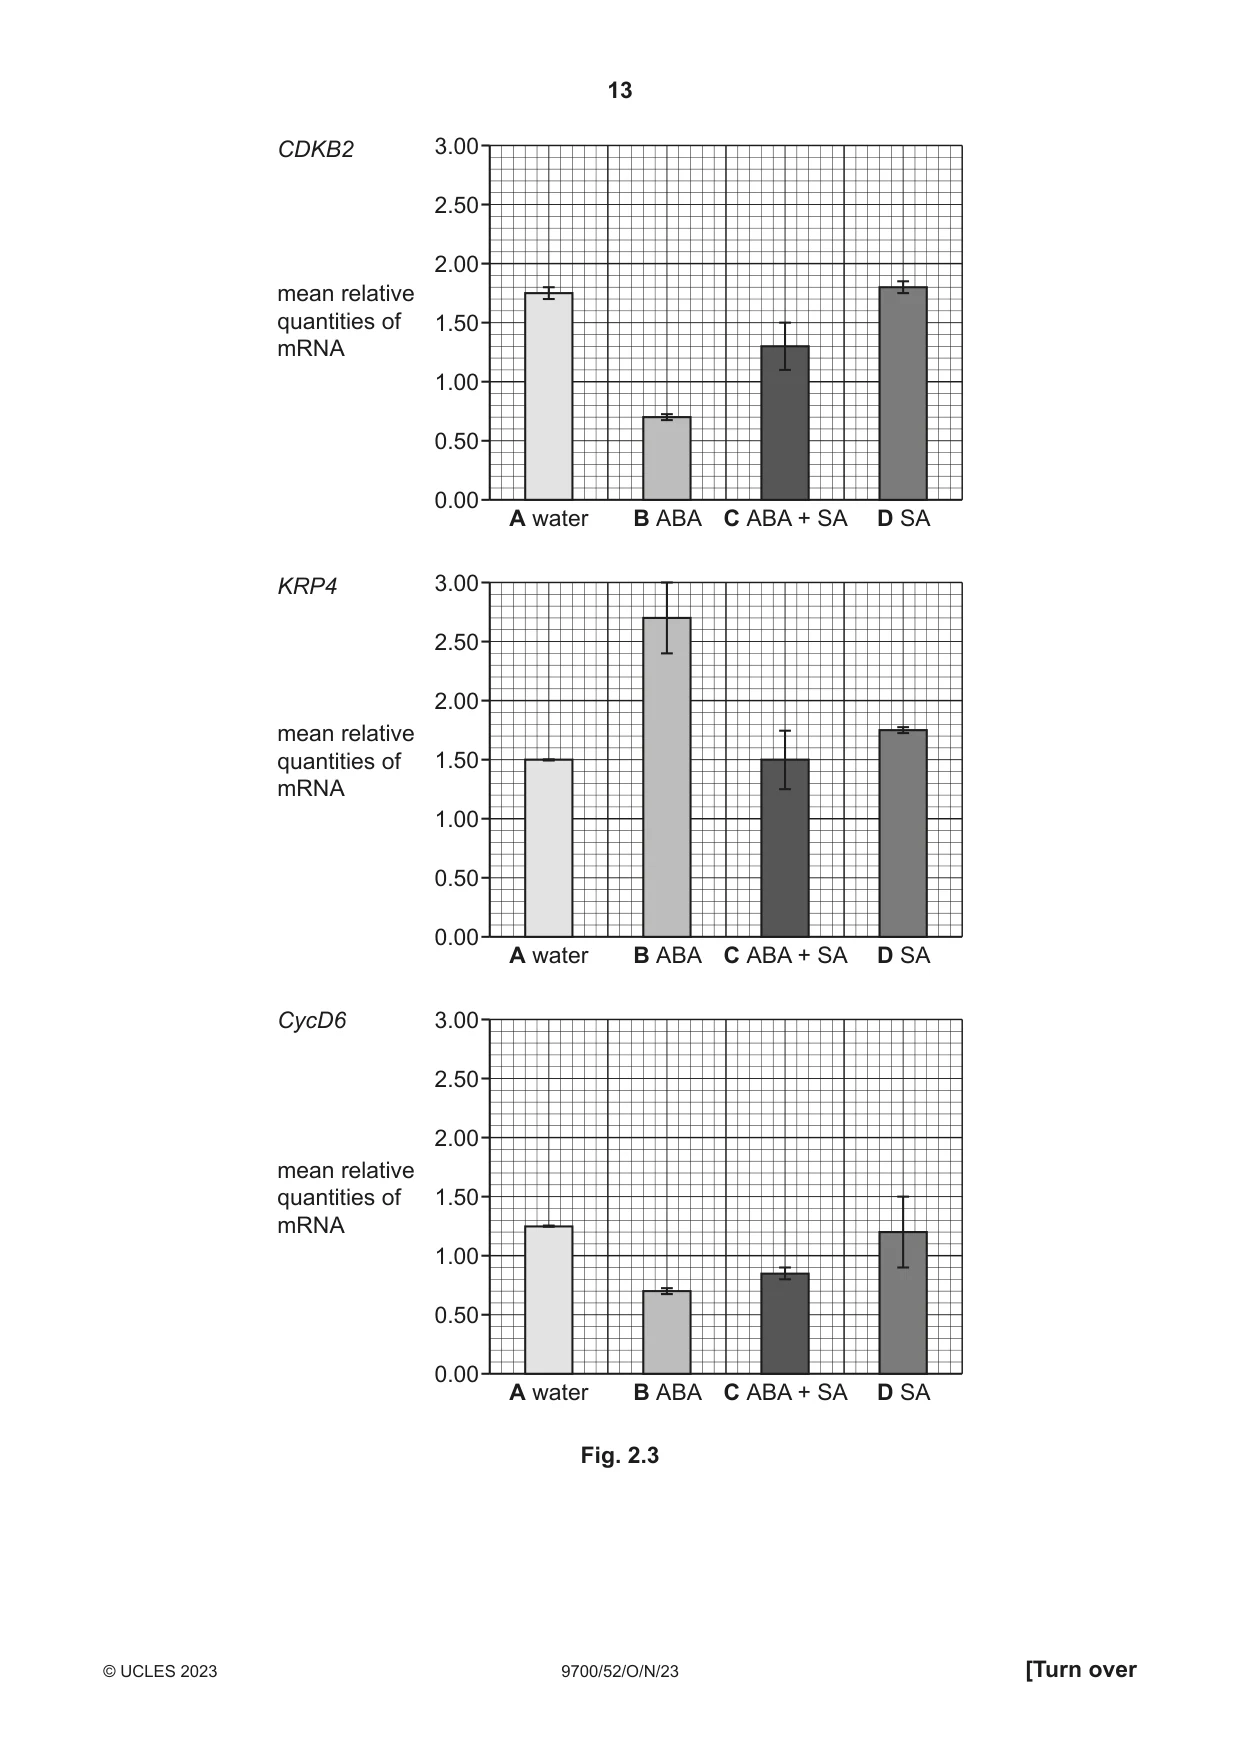
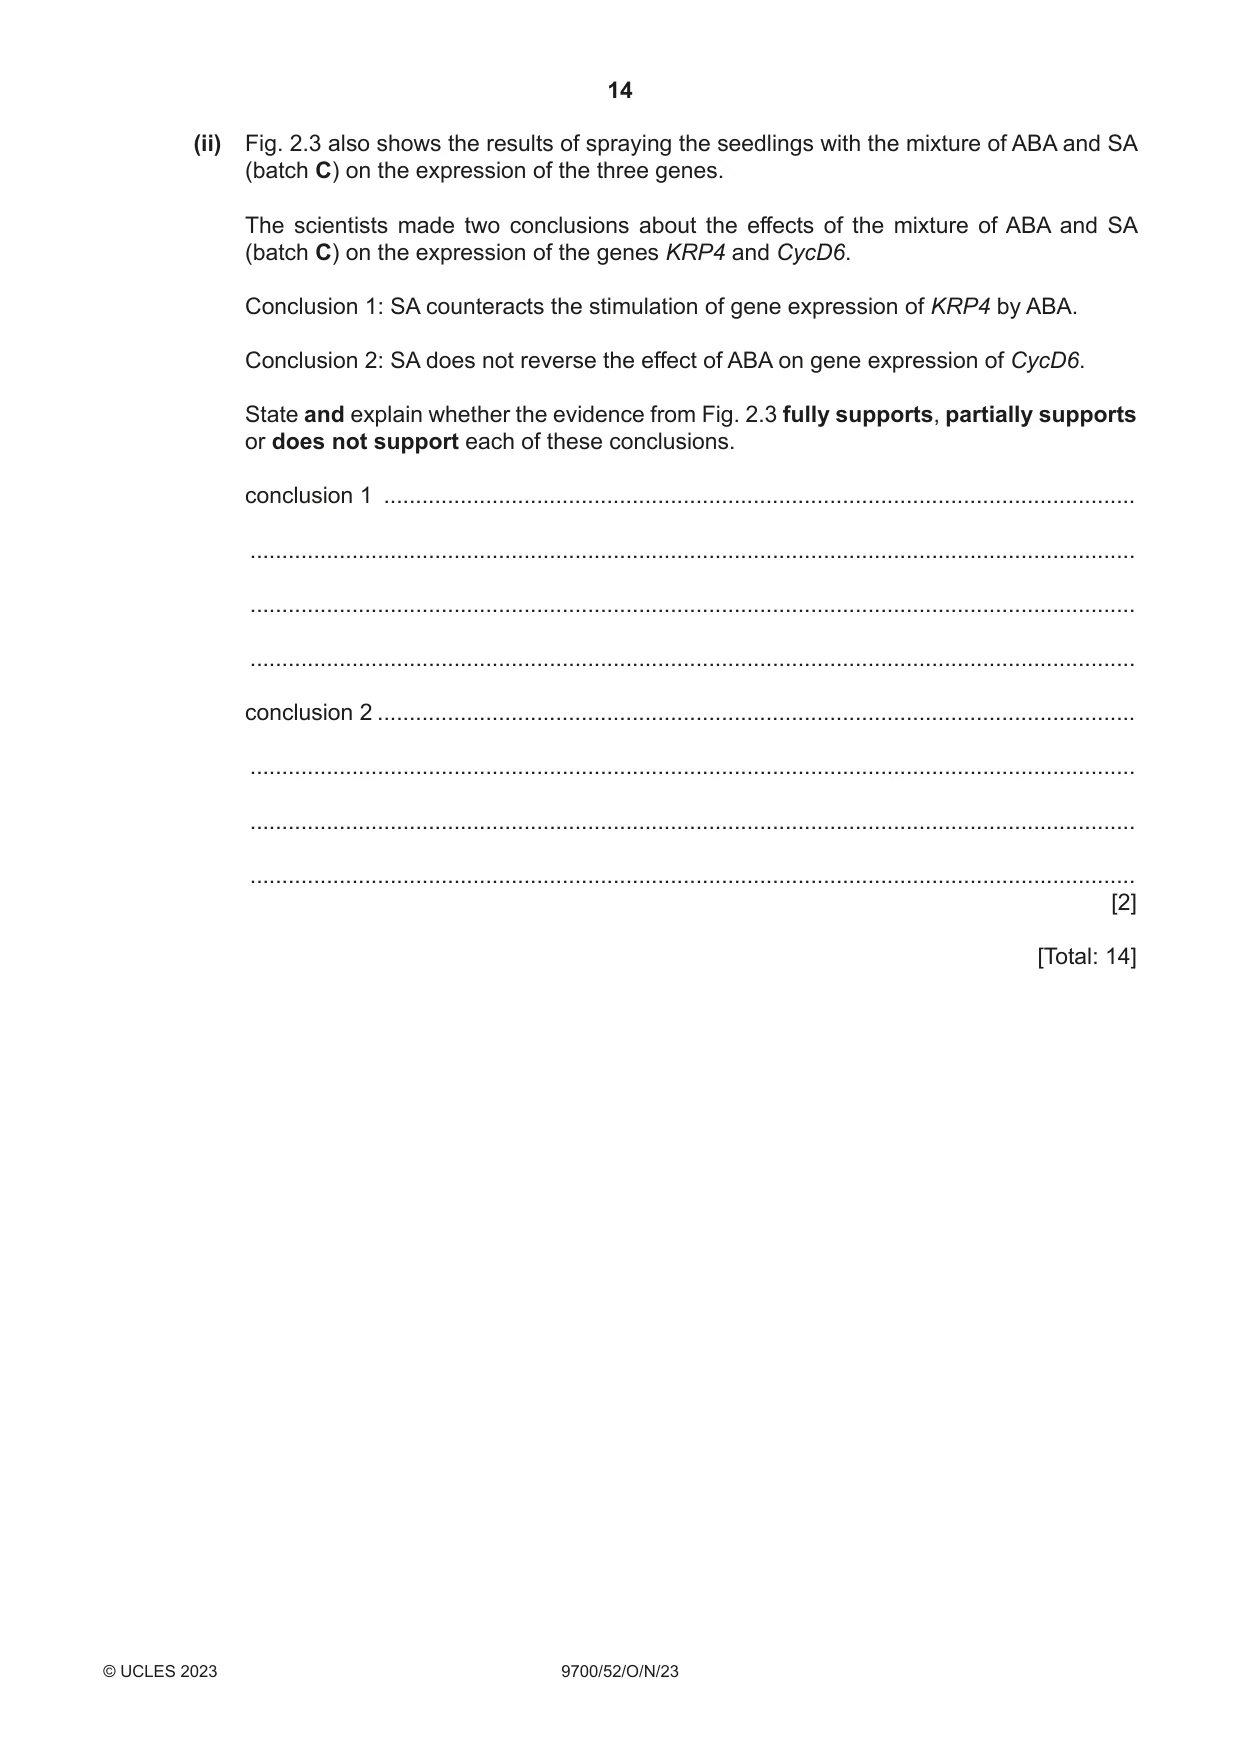
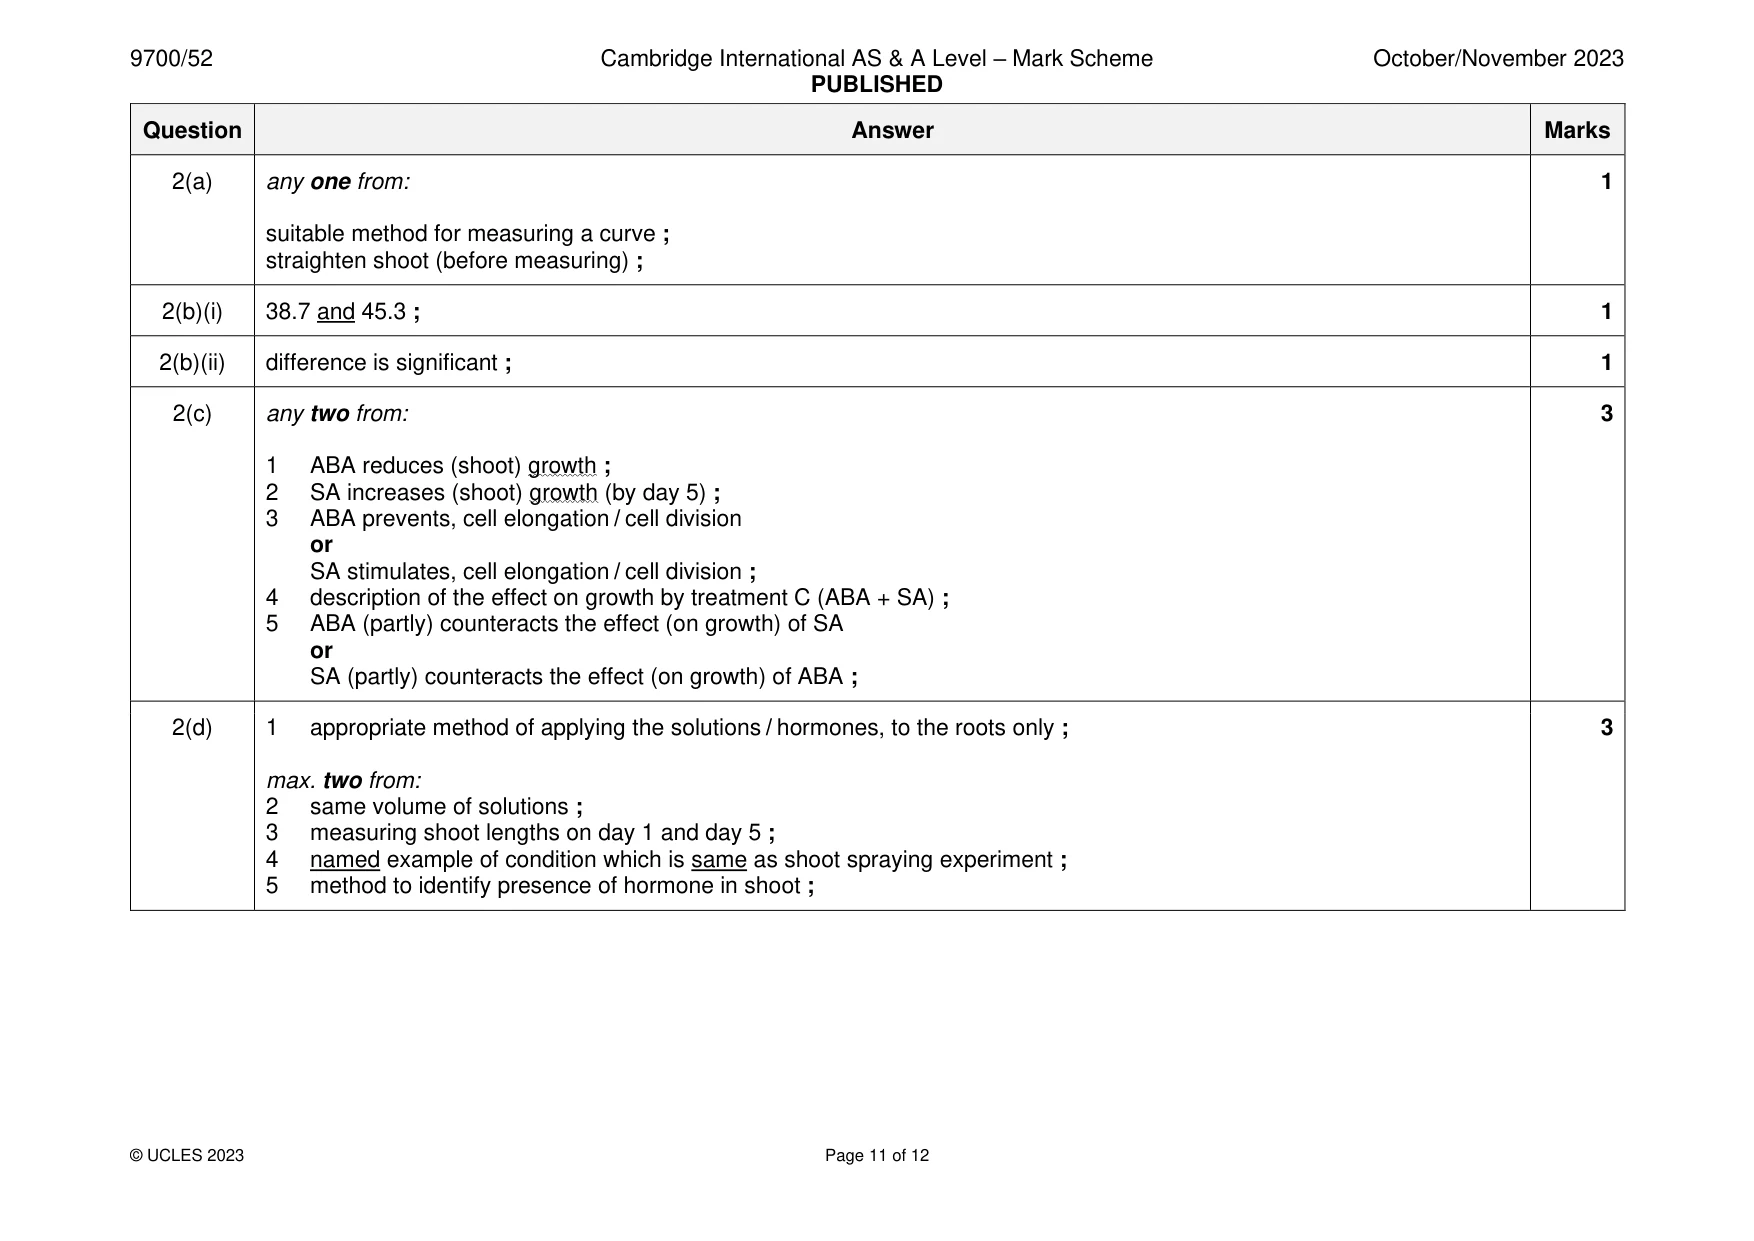
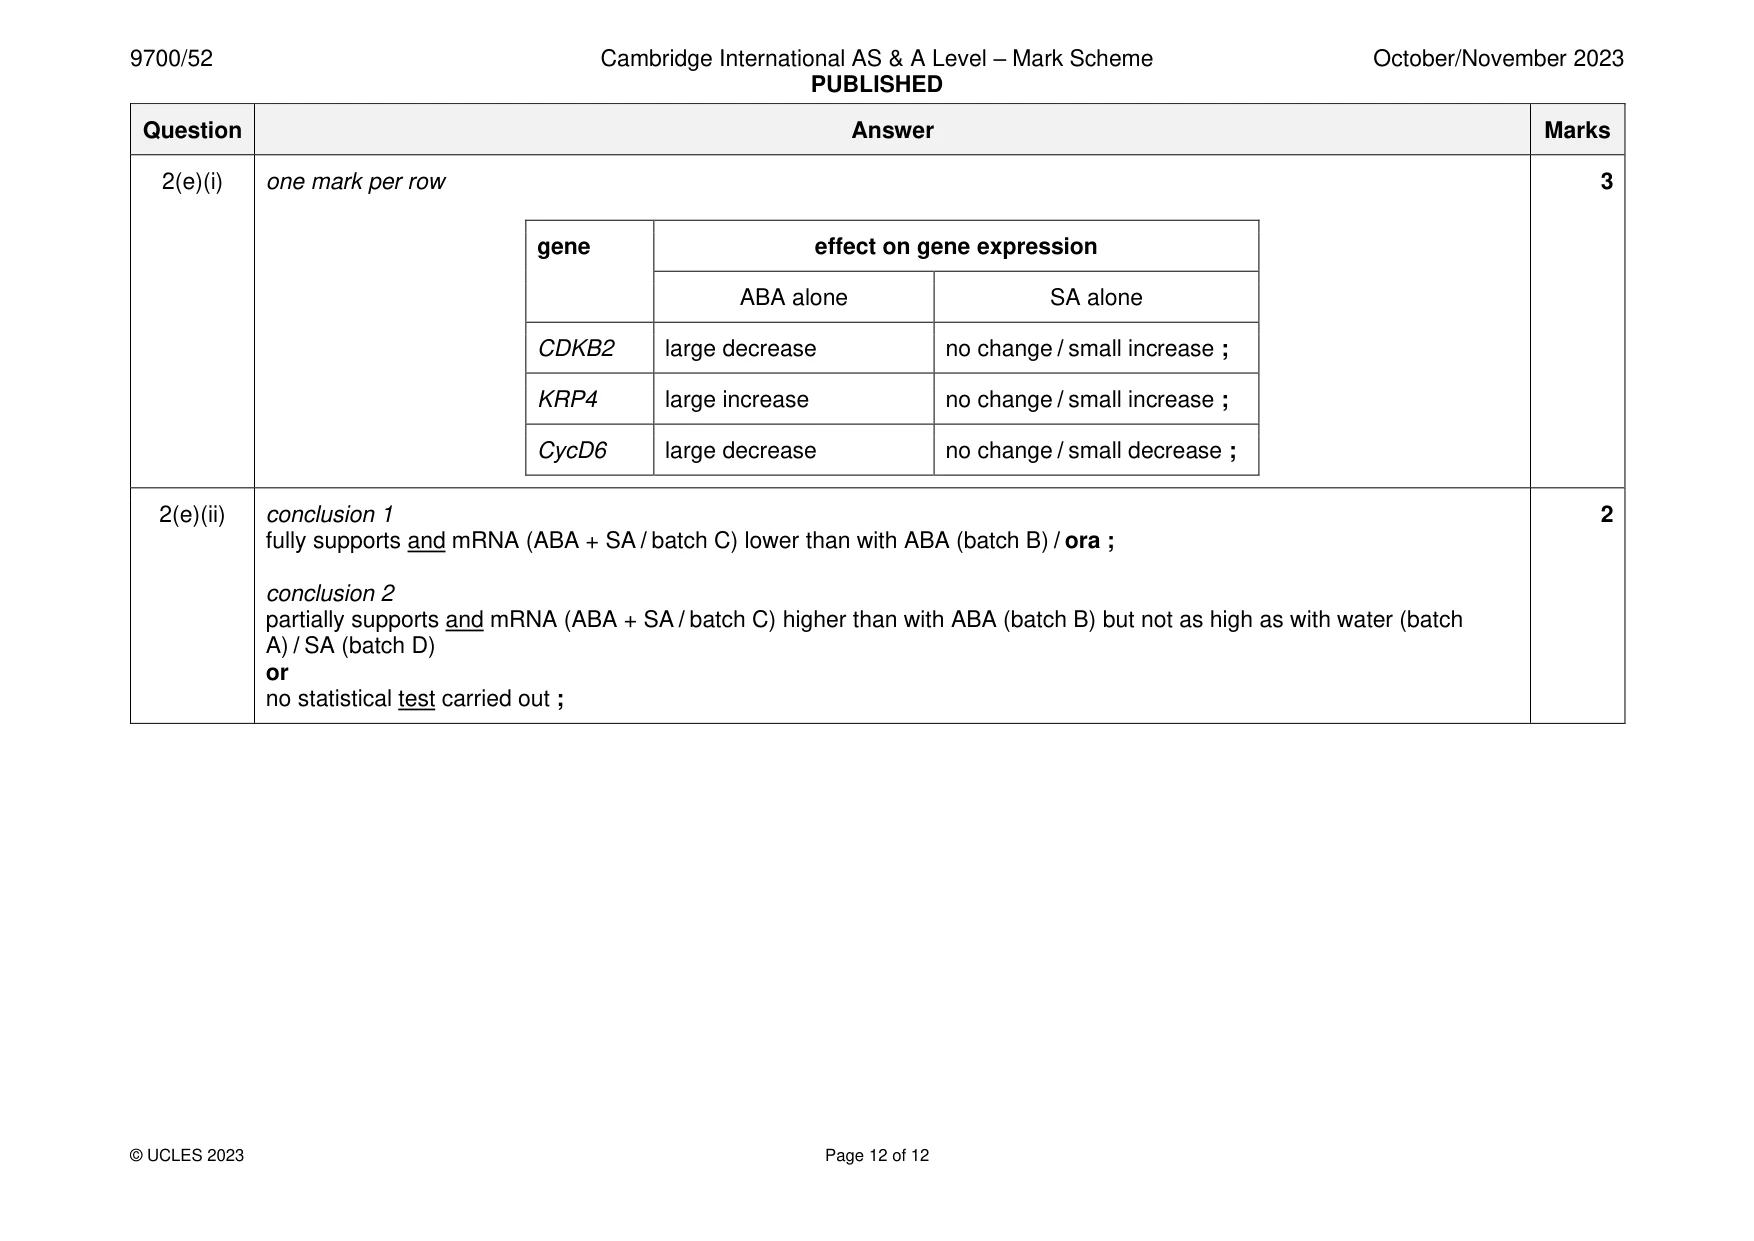
Mark scheme: 2(a) any one from: 1 suitable method for measuring a curve ; straighten shoot (before measuring) ; 2(b)(i) 38.7 and 45.3 ; 1 2(b)(ii) difference is significant ; 1 2(c) any two from: 3 1 ABA reduces (shoot) growth ; 2 SA increases (shoot) growth (by day 5) ; 3 ABA prevents, cell elongation / cell division or SA stimulates, cell elongation / cell division ; 4 description of the effect on growth by treatment C (ABA + SA) ; 5 ABA (partly) counteracts the effect (on growth) of SA or SA (partly) counteracts the effect (on growth) of ABA ; 2(d) 1 appropriate method of applying the solutions / hormones, to the roots only ; 3 max. two from: 2 same volume of solutions ; 3 measuring shoot lengths on day 1 and day 5 ; 4 named example of condition which is same as shoot spraying experiment ; 5 method to identify presence of hormone in shoot ; 2(e)(i) one mark per row 3 gene effect on gene expression ABA alone SA alone CDKB2 large decrease no change / small increase ; KRP4 large increase no change / small increase ; CycD6 large decrease no change / small decrease ; 2(e)(ii) conclusion 1 2 fully supports and mRNA (ABA + SA / batch C) lower than with ABA (batch B) / ora ; conclusion 2 partially supports and mRNA (ABA + SA / batch C) higher than with ABA (batch B) but not as high as with water (batch A) / SA (batch D) or no statistical test carried out ;
What was in this paper
The subtopics covered by these 2 questions, and how many questions each got. Open one in a new tab to see every Cambridge question on it.
What you needed in this session
Cambridge’s own grade thresholds for 2023 Oct/Nov, Paper 5 · Variant 2. A higher threshold means an easier paper — the bar moves with how the cohort did.