Cambridge A Level Biology 9700 — 2021 May/June Paper 3 · Variant 1
9700/31/M/J/21 · 2 questions · 40 marks · ≈45 min
The question paper and its mark scheme, free to read here and free to download. This is Cambridge’s own paper, exactly as it was sat.
Question paper20 pages


Mark scheme7 pages
Answers below. Sit the paper first if you are practising.
Questions as text
Q1 · Plant cells contain the enzyme catalase which catalyses the breakdown of hydrogen…
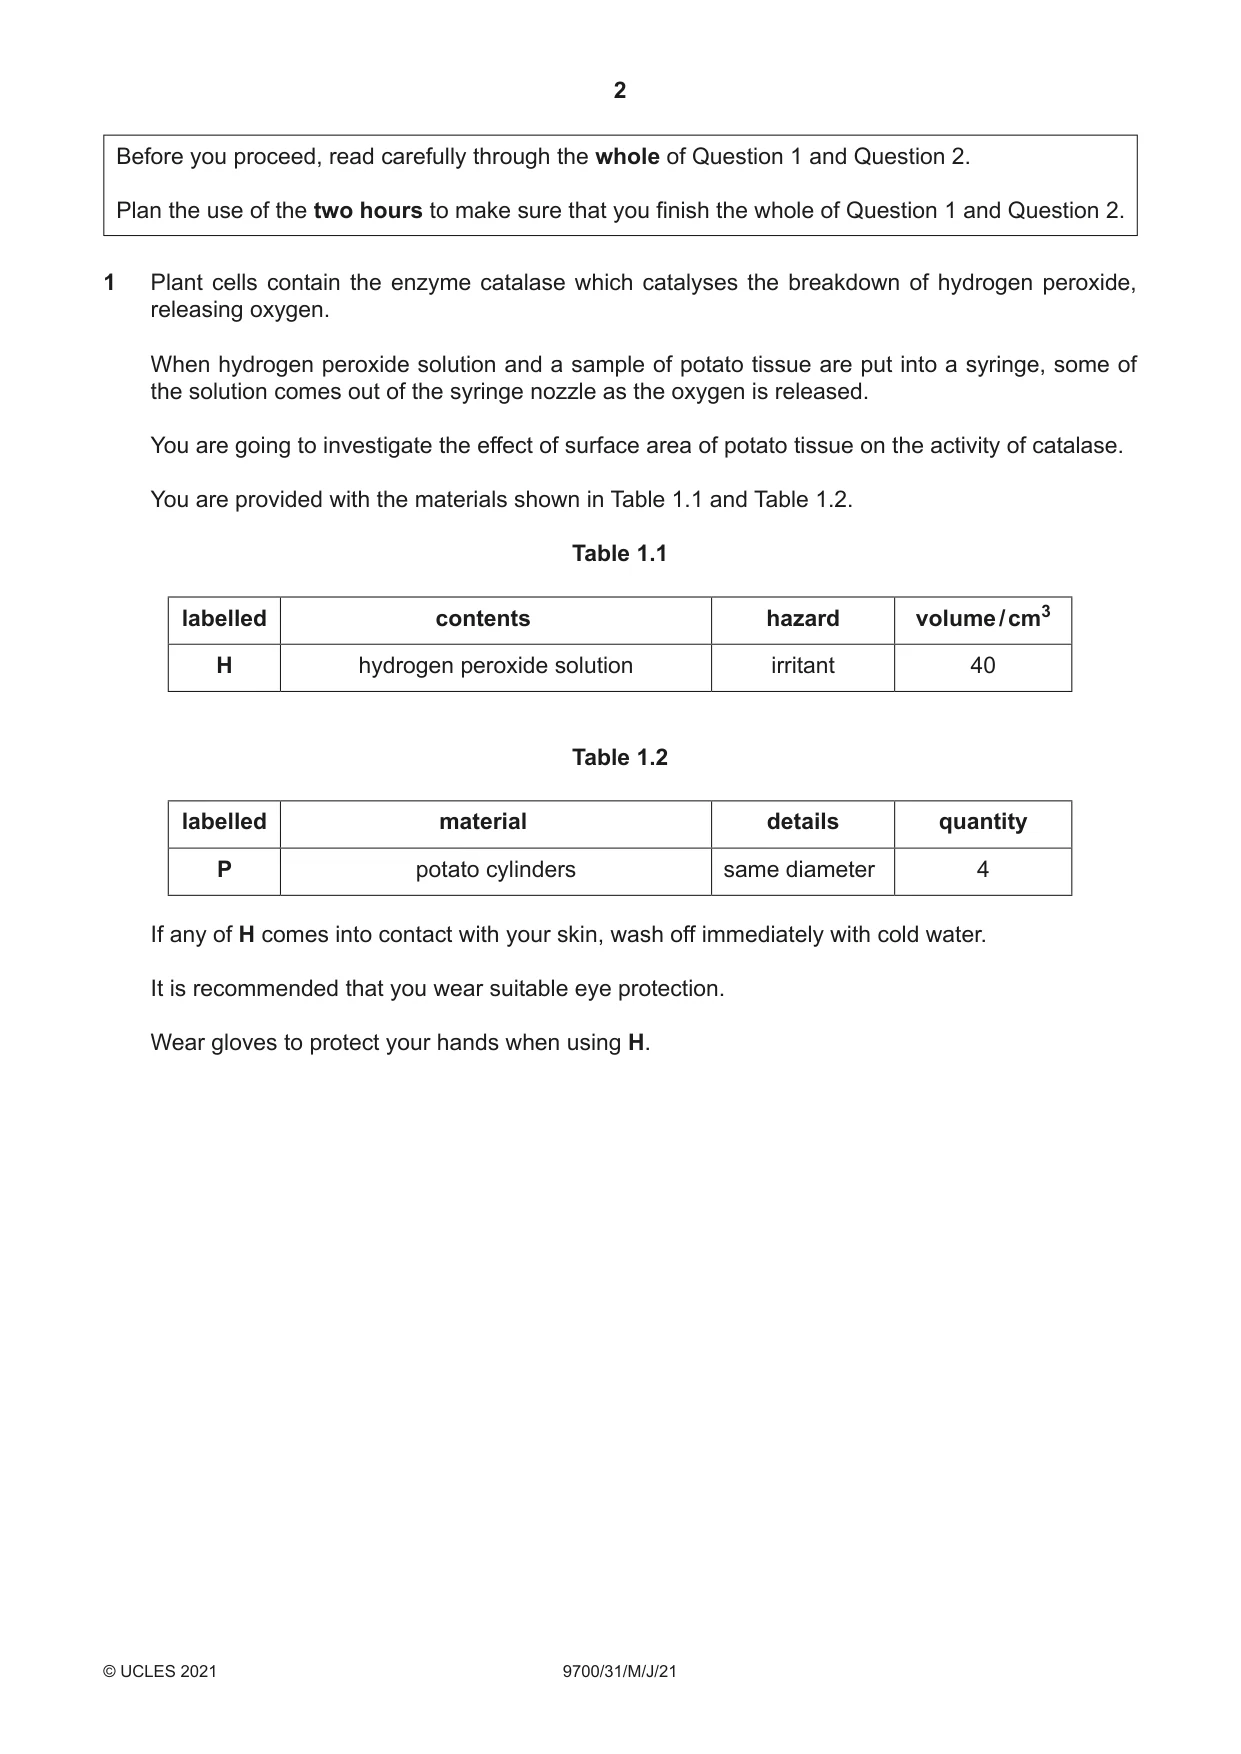
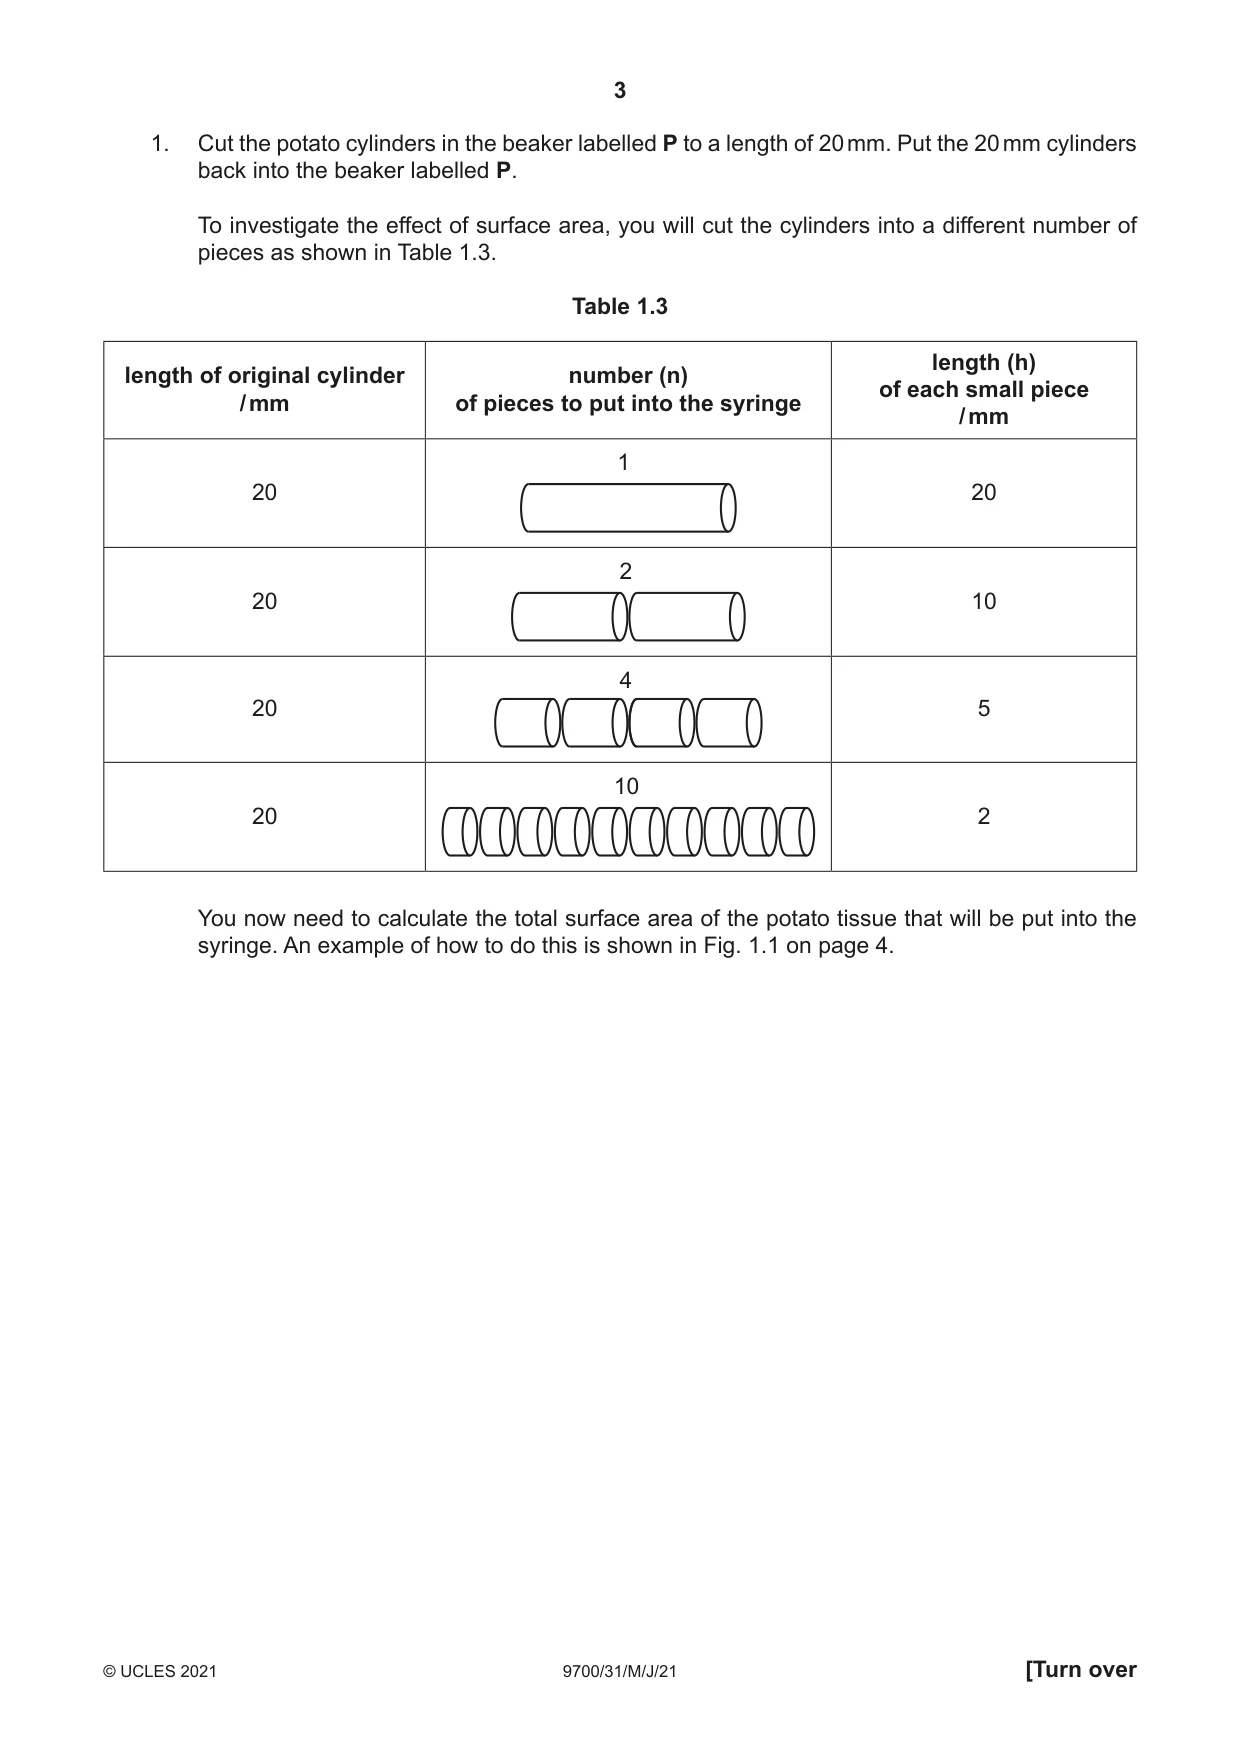
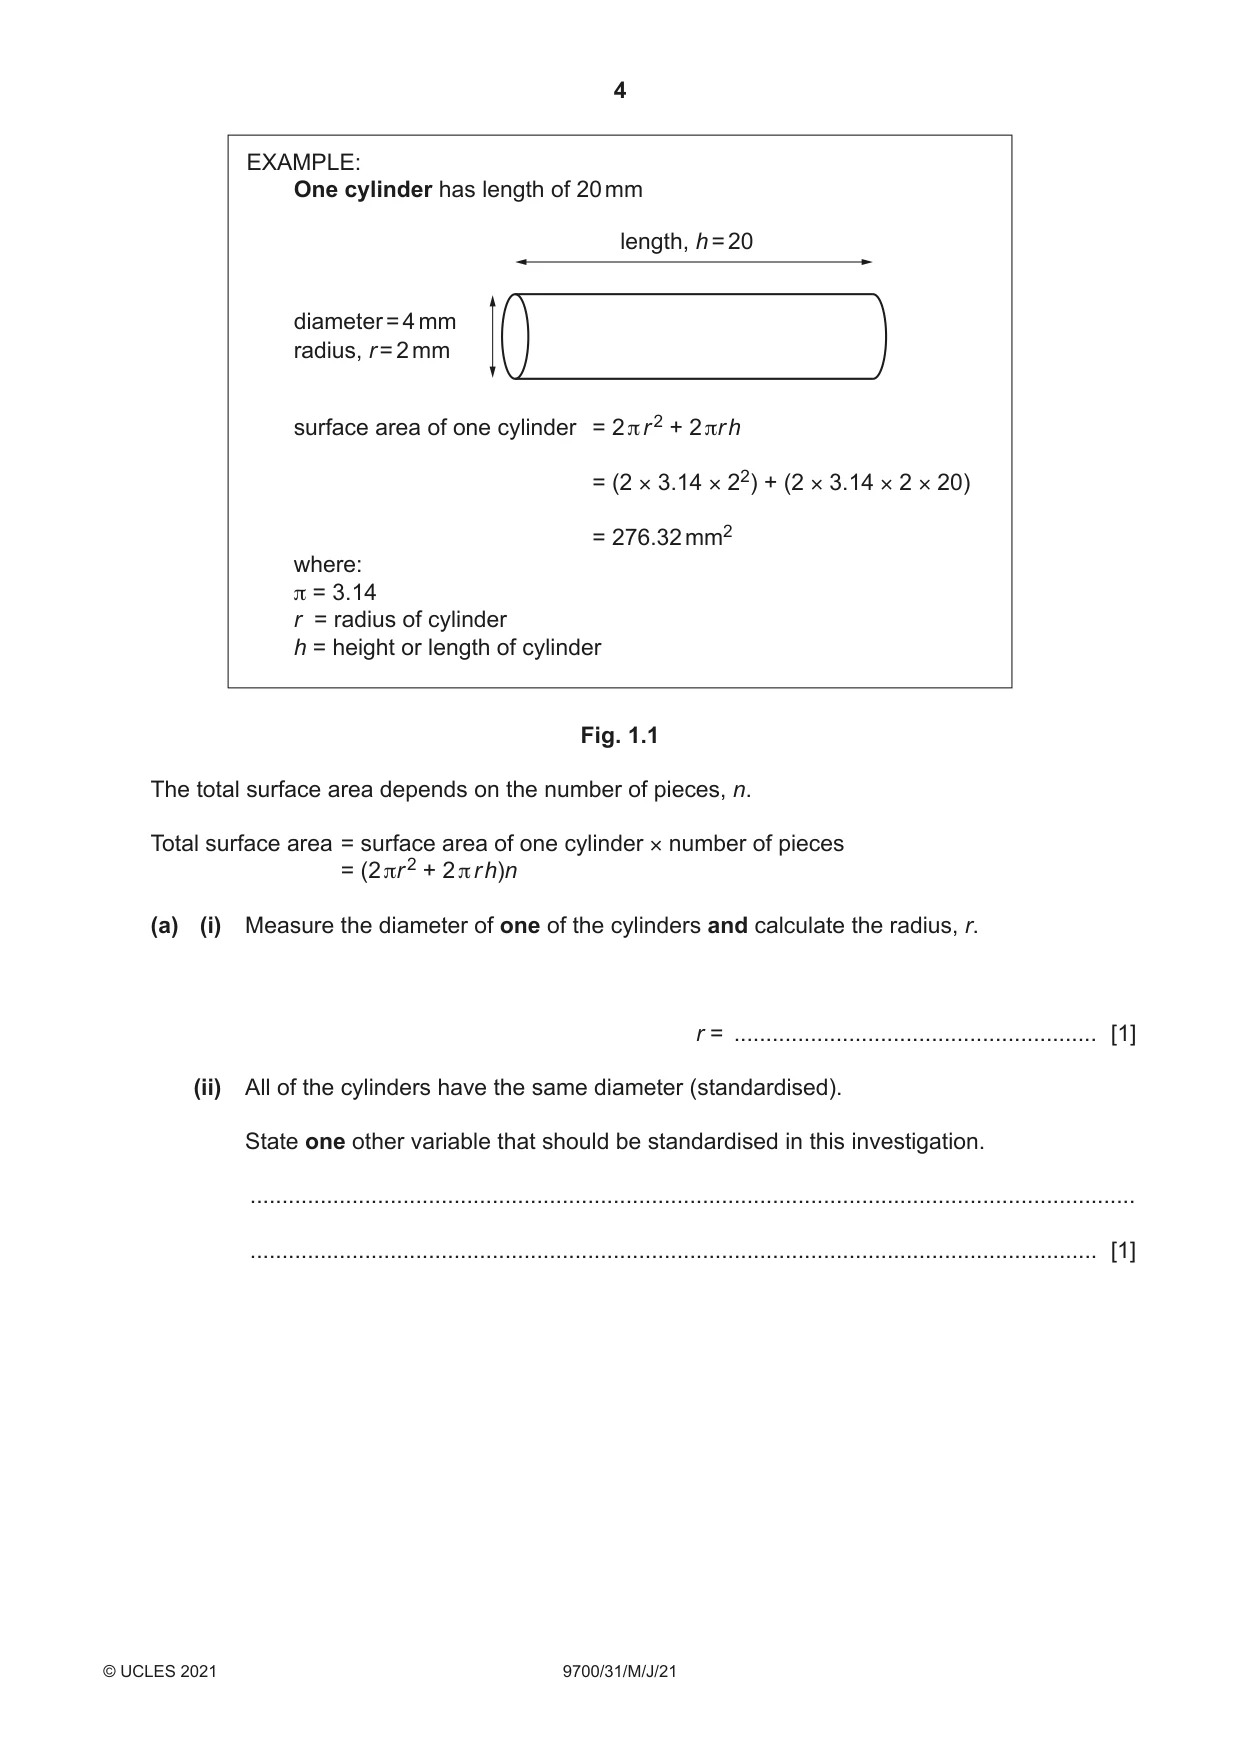
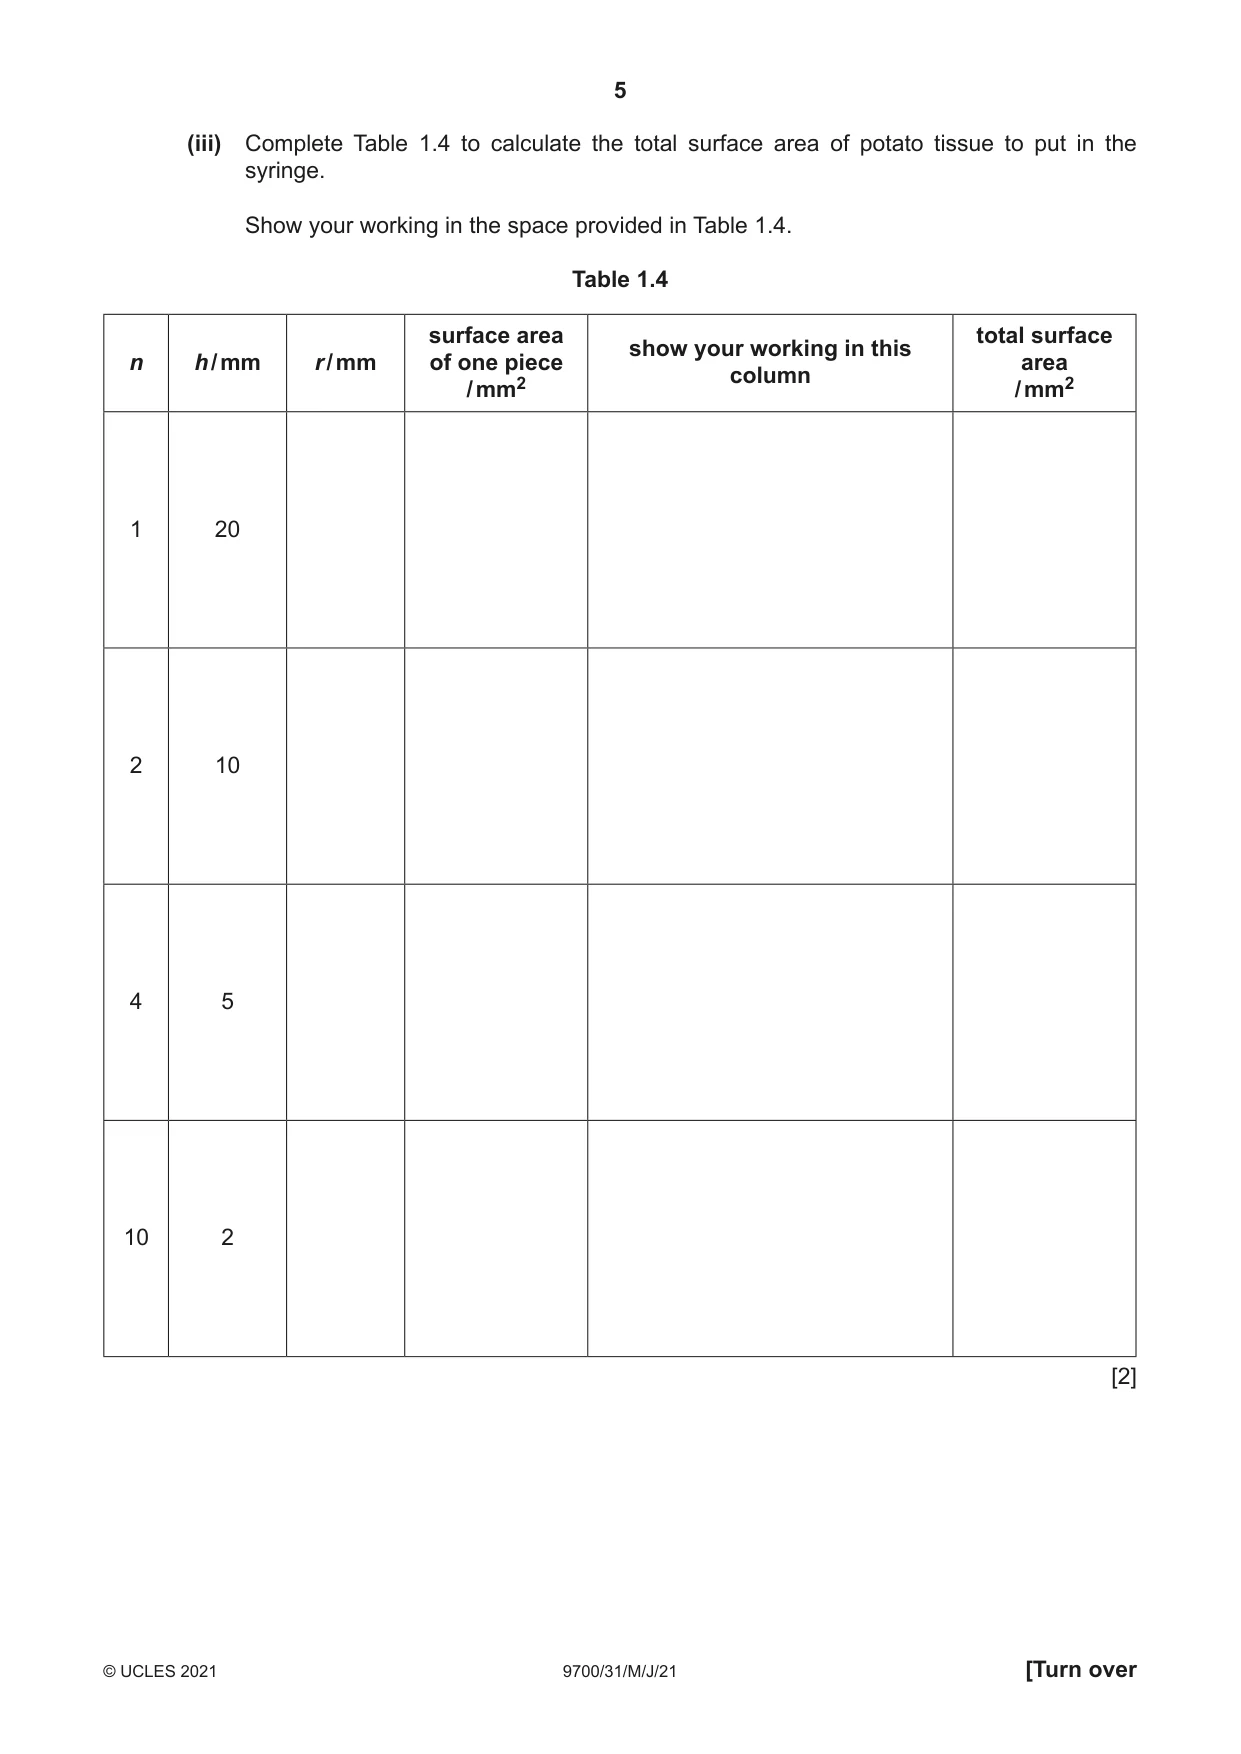
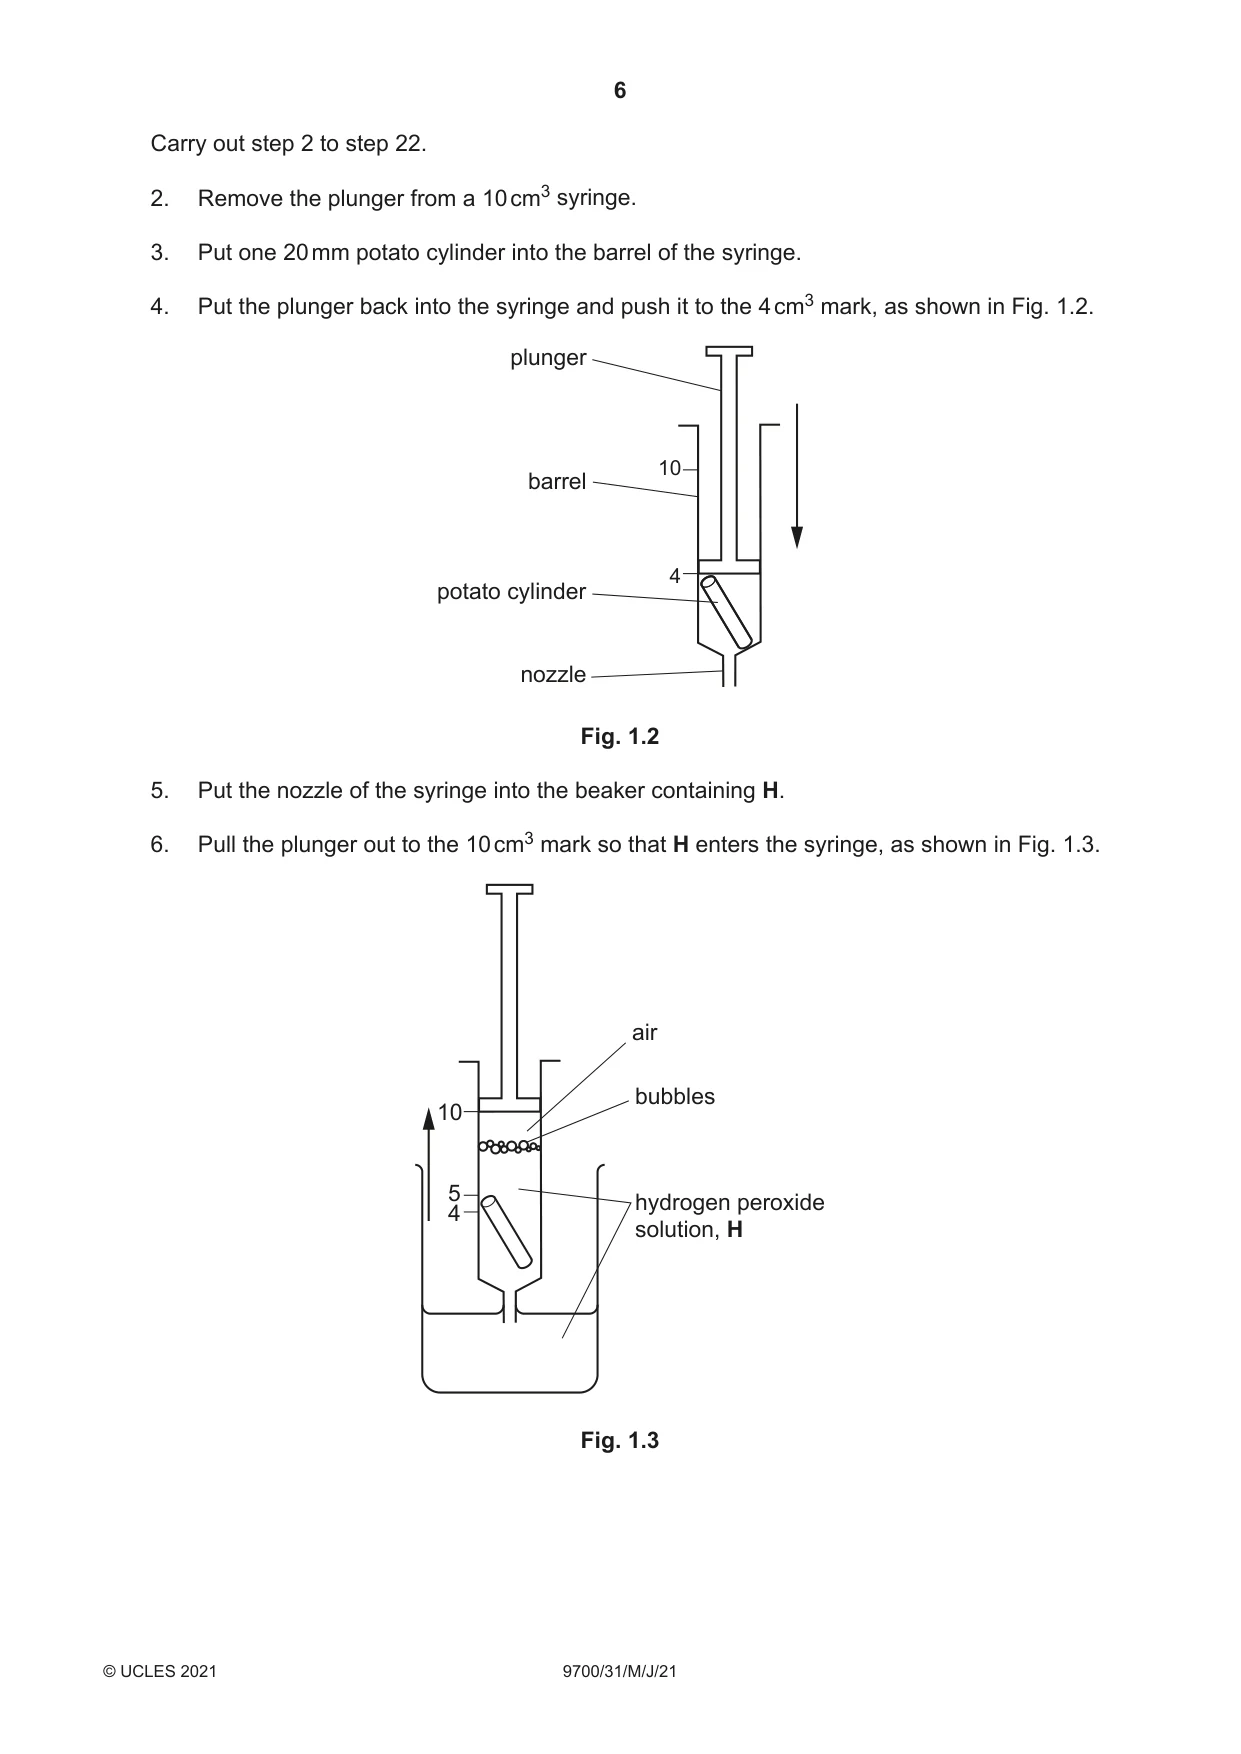
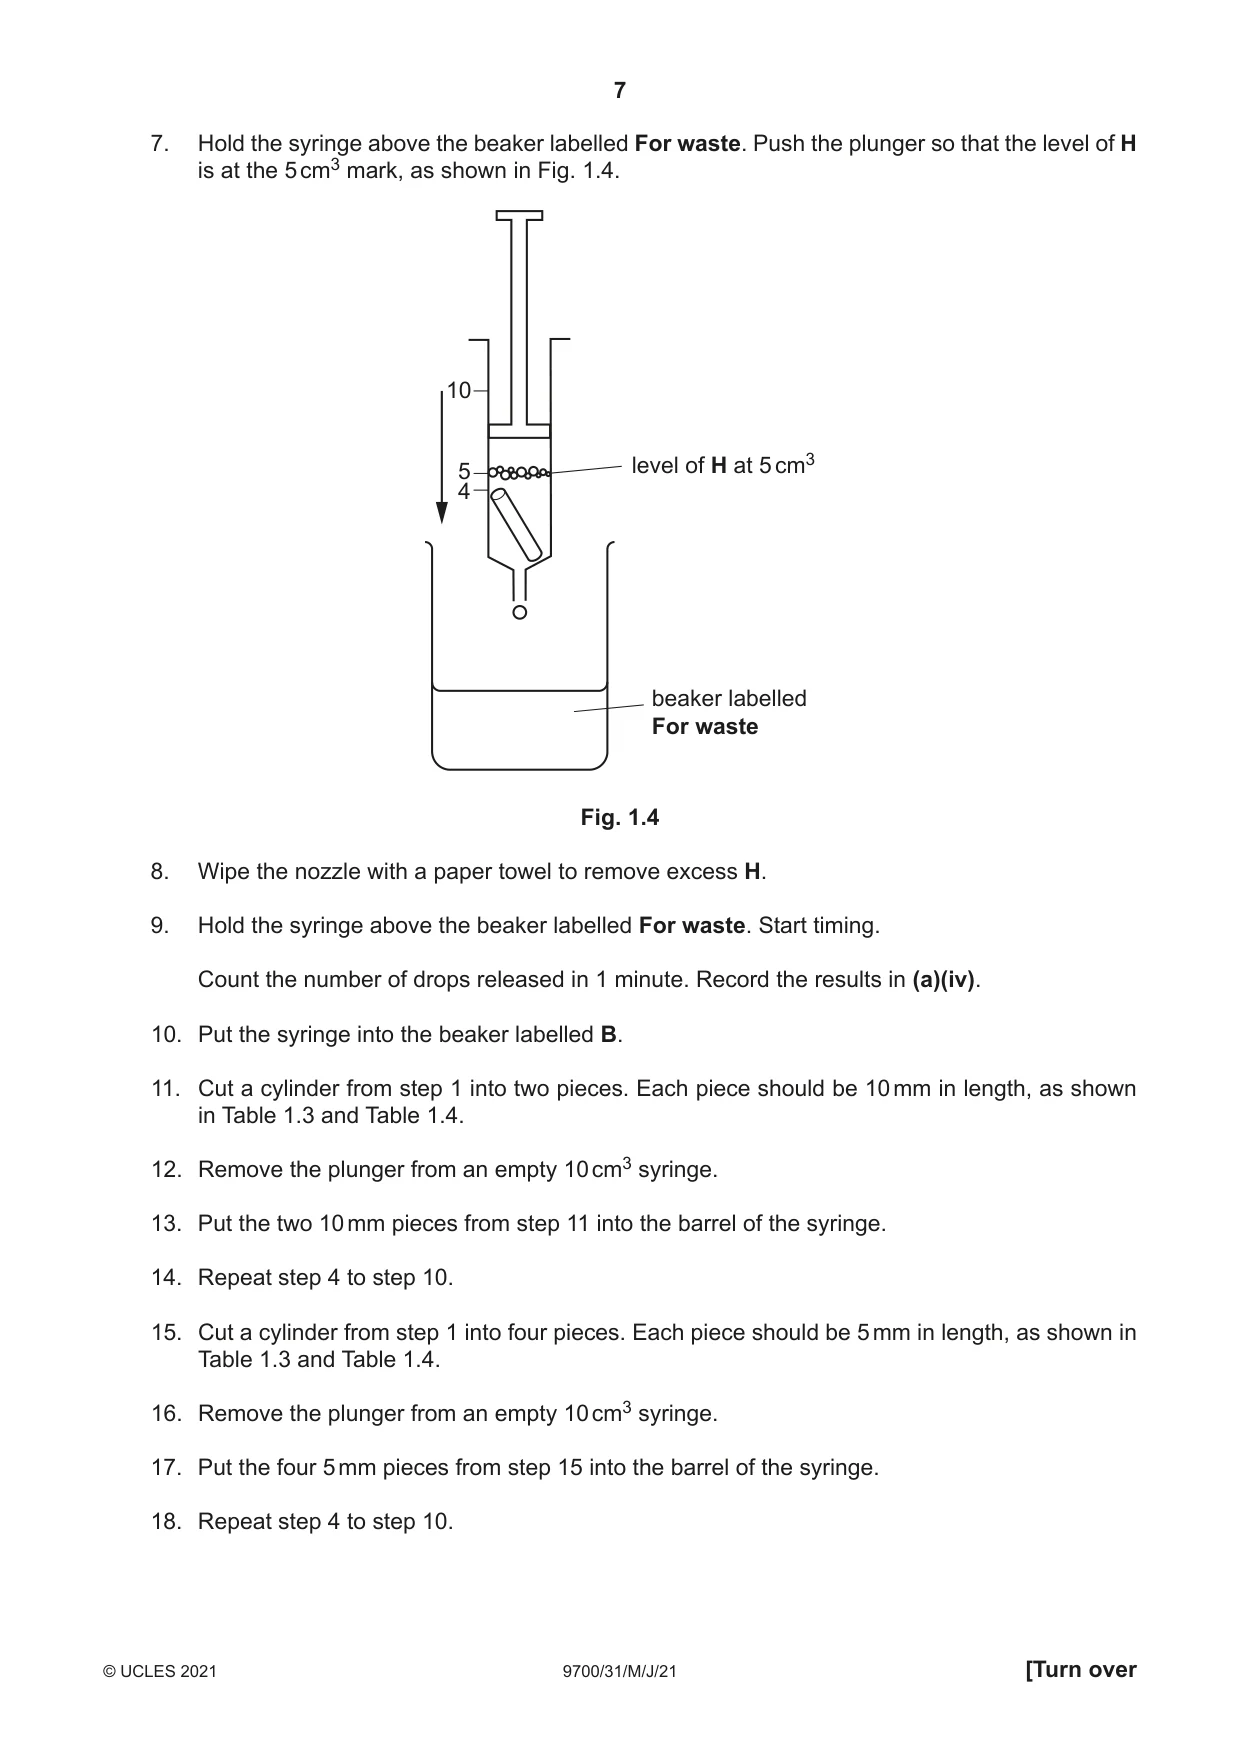
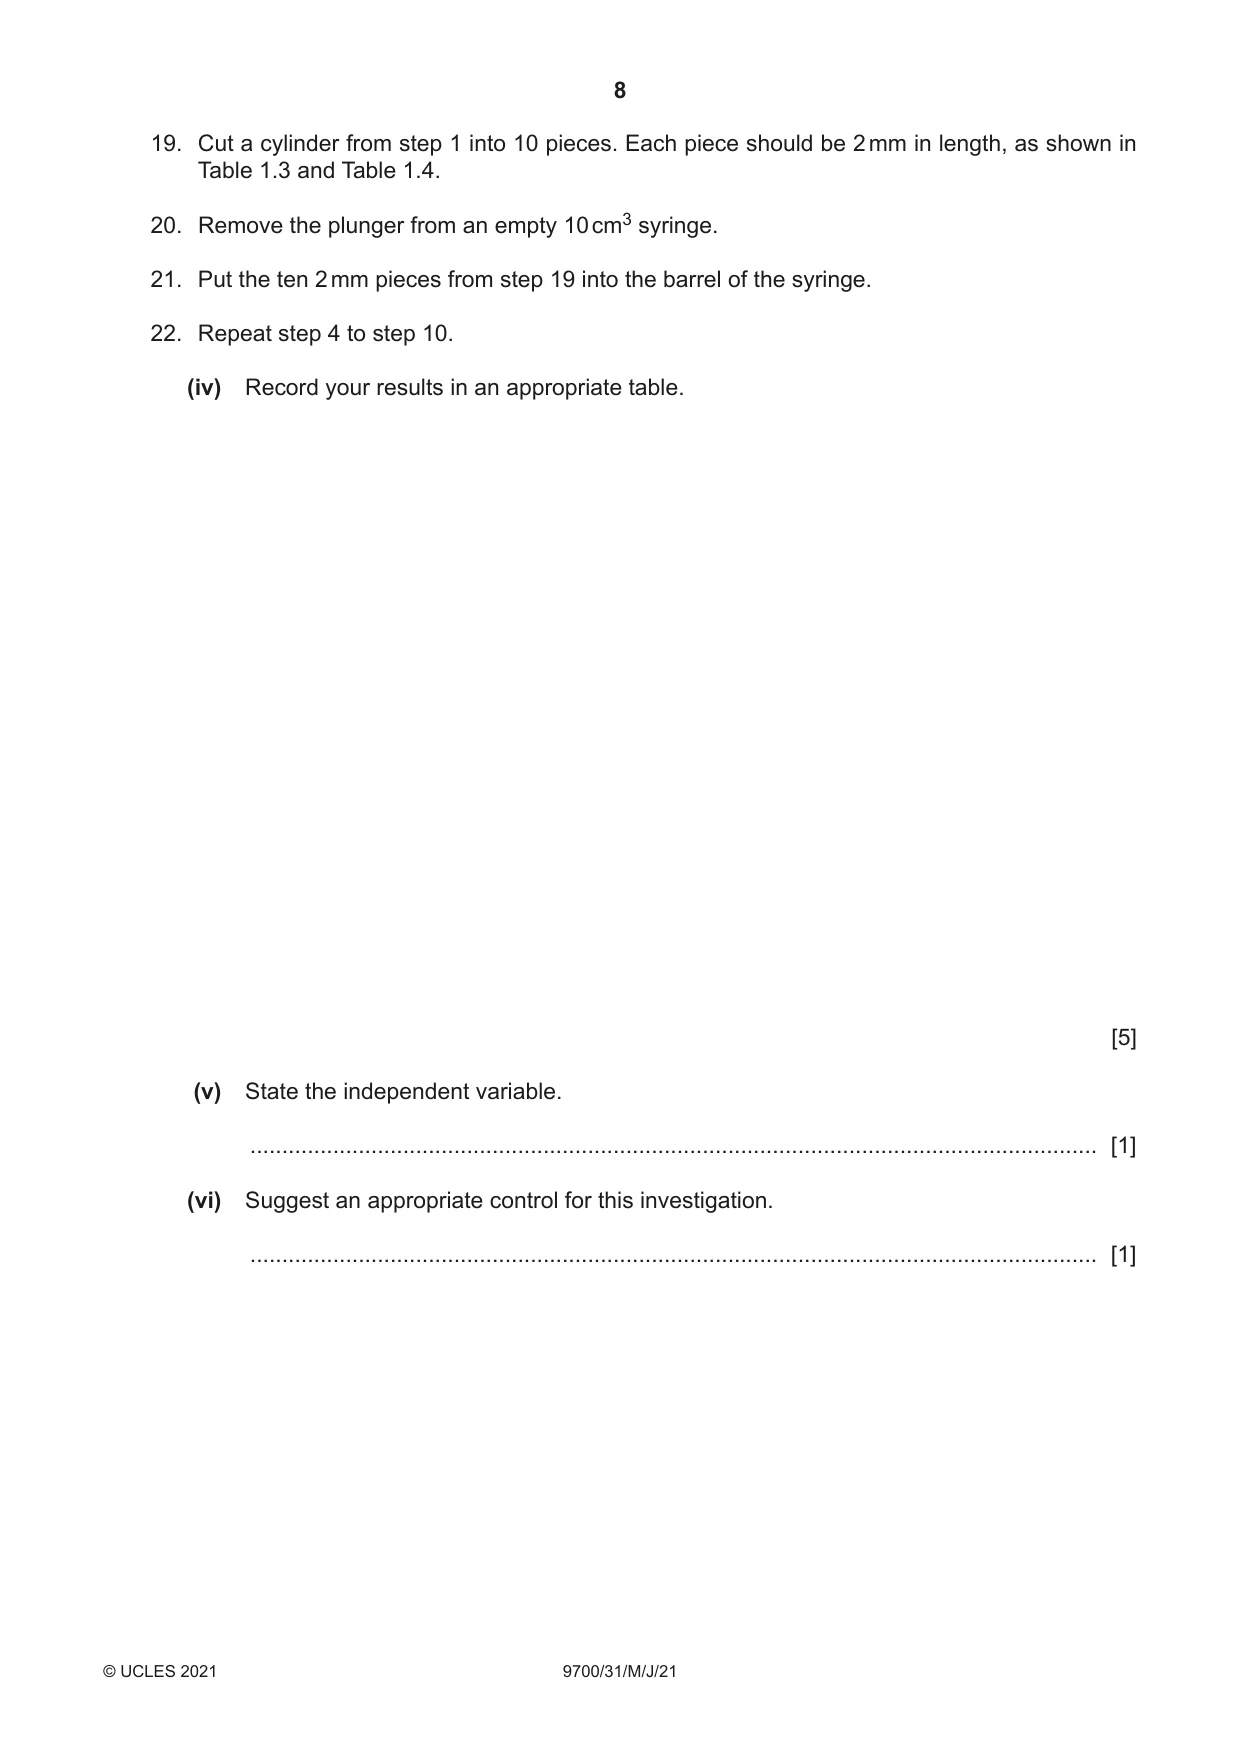
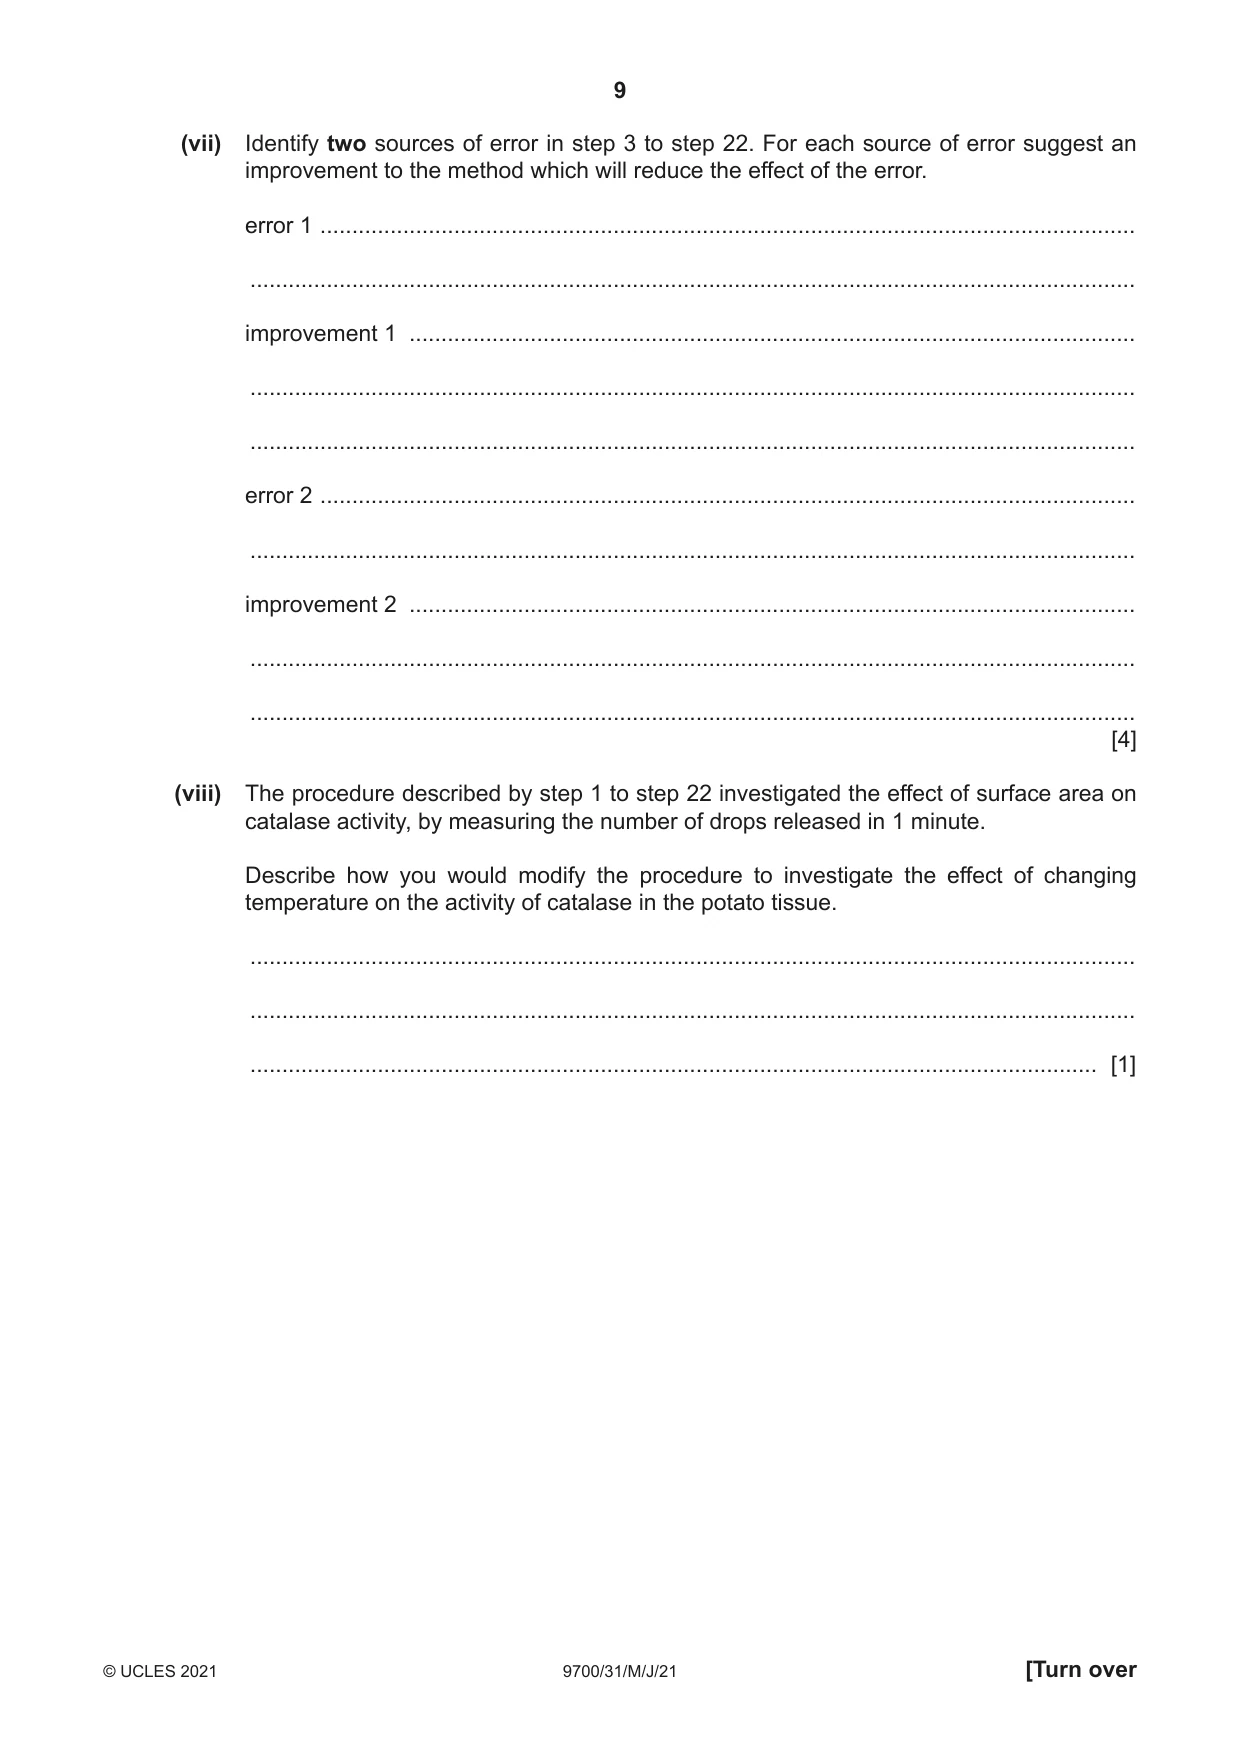
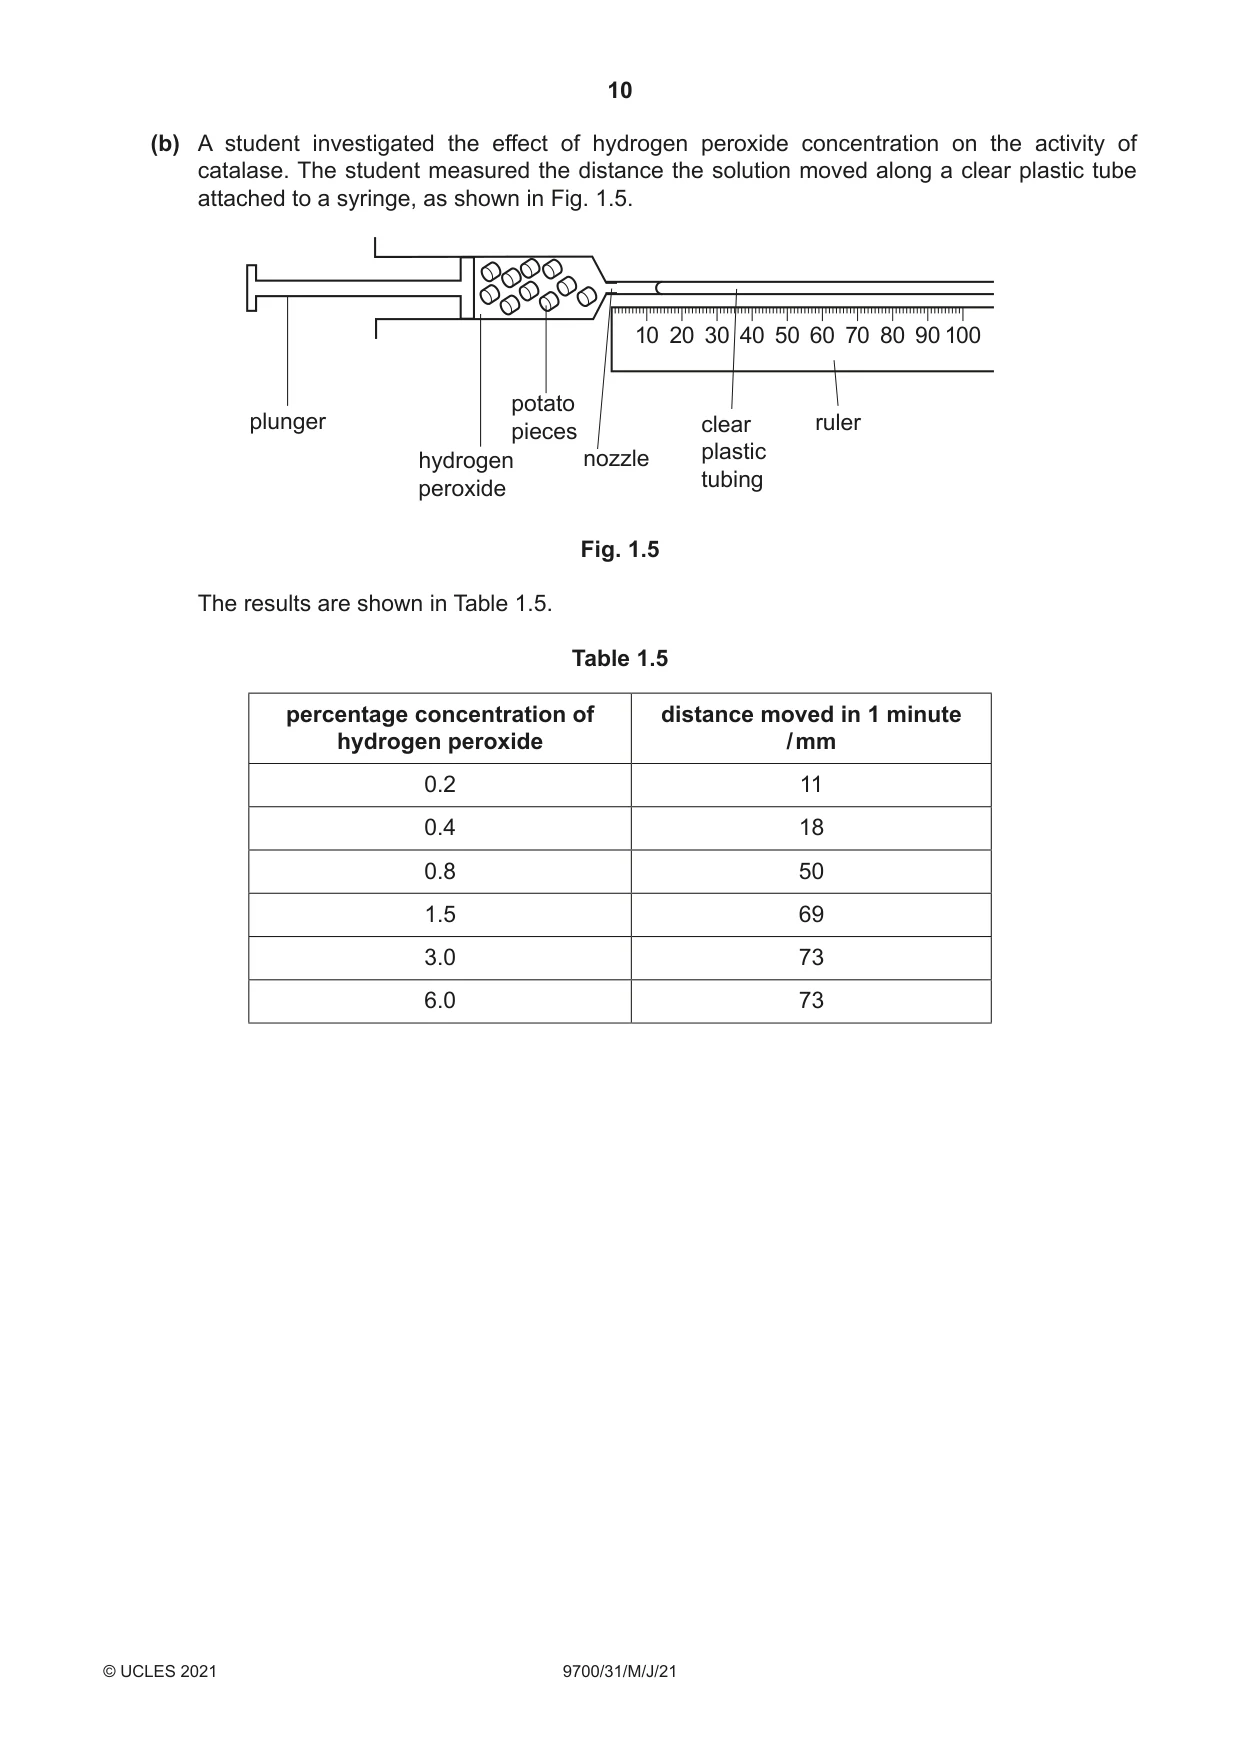
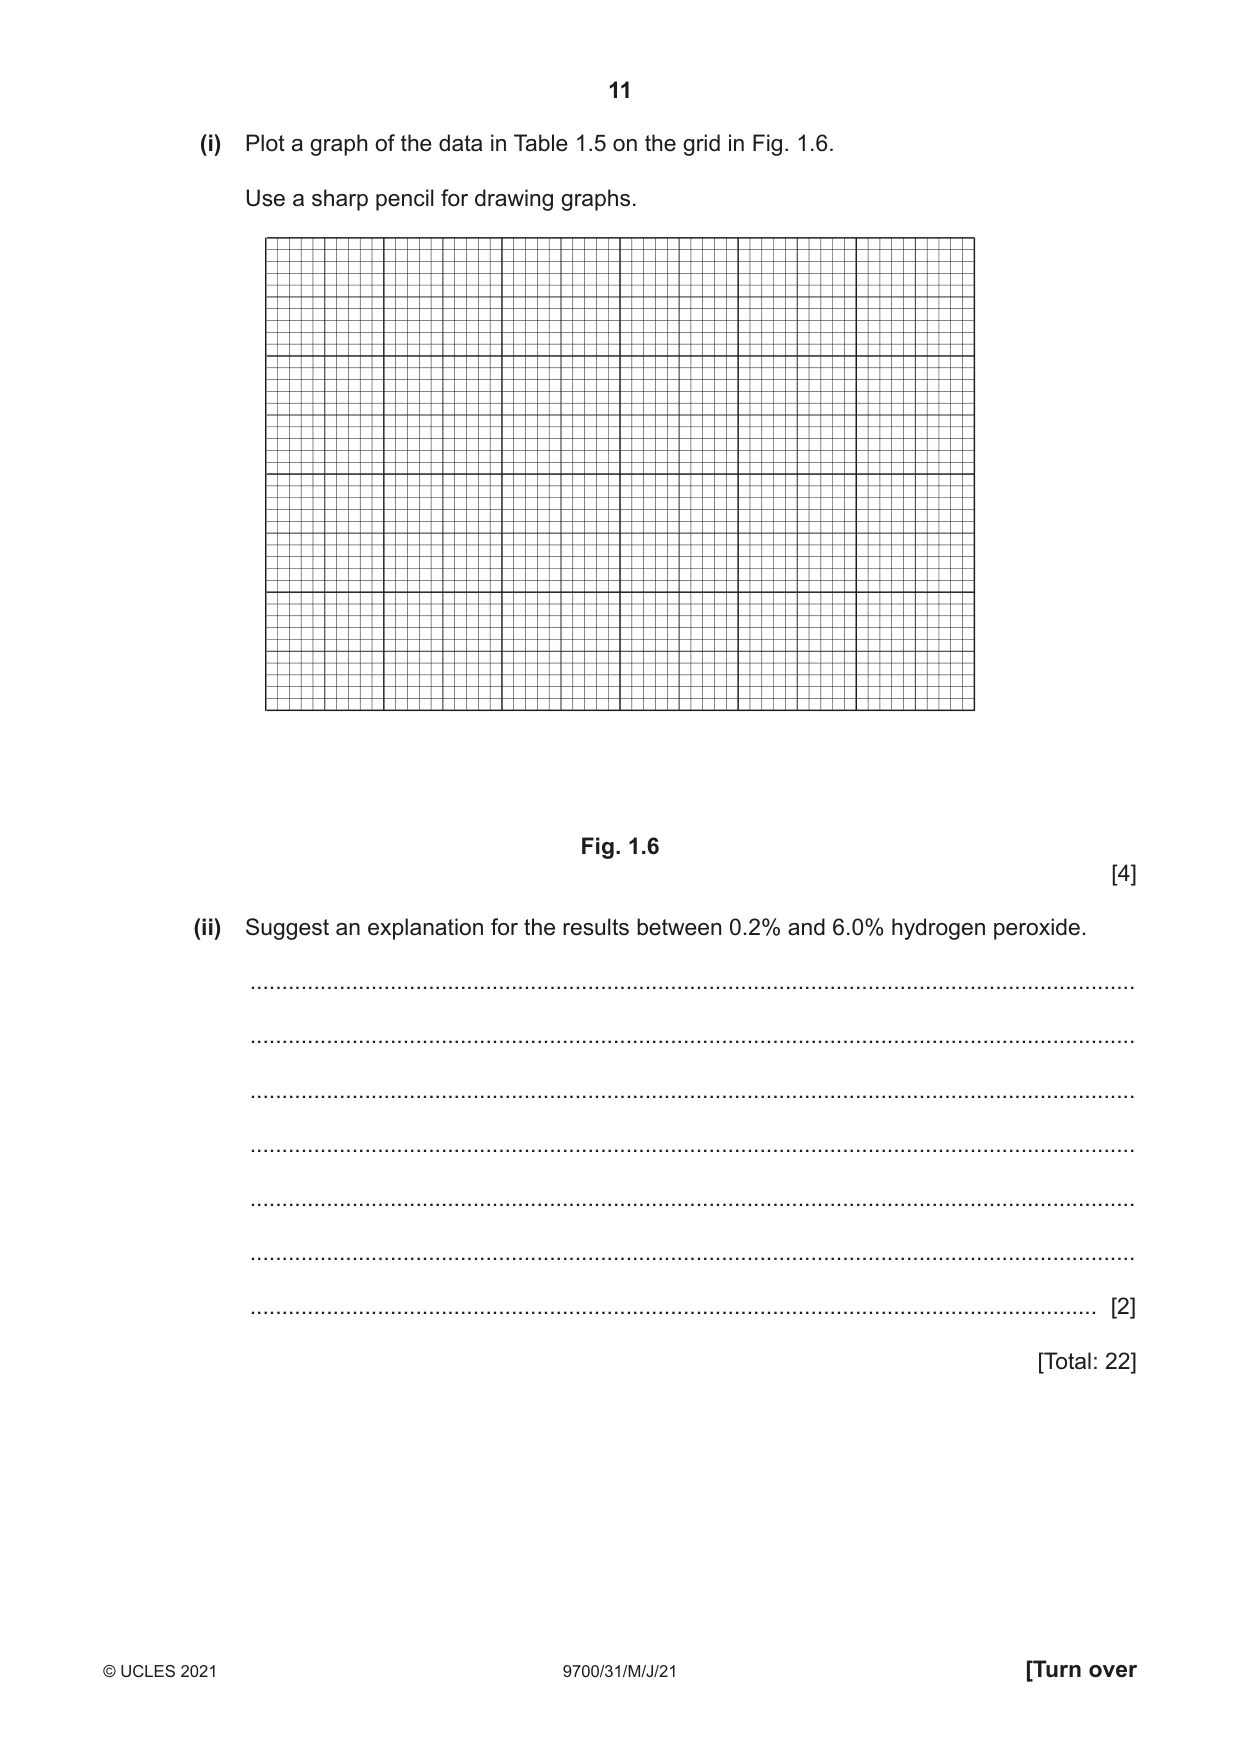
1 Plant cells contain the enzyme catalase which catalyses the breakdown of hydrogen peroxide, releasing oxygen. When hydrogen peroxide solution and a sample of potato tissue are put into a syringe, some of the solution comes out of the syringe nozzle as the oxygen is released. You are going to investigate the effect of surface area of potato tissue on the activity of catalase. You are provided with the materials shown in Table 1.1 and Table 1.2. Table 1.1 labelled contents hazard volume / cm3 H hydrogen peroxide solution irritant 40 Table 1.2 labelled material details quantity P potato cylinders same diameter 4 If any of H comes into contact with your skin, wash off immediately with cold water. It is recommended that you wear suitable eye protection. Wear gloves to protect your hands when using H. 1. Cut the potato cylinders in the beaker labelled P to a length of 20 mm. Put the 20 mm cylinders back into the beaker labelled P. To investigate the effect of surface area, you will cut the cylinders into a different number of pieces as shown in Table 1.3. Table 1.3 length (h)length of original cylinder number (n) of each small piece / mm of pieces to put into the syringe / mm 1 20 20 2 20 10 4 20 5 10 20 2 You now need to calculate the total surface area of the potato tissue that will be put into the syringe. An example of how to do this is shown in Fig. 1.1 on page 4. EXAMPLE: One cylinder has length of 20 mm length, h = 20 diameter = 4 mm radius, r = 2 mm surface area of one cylinder = 2 π r 2 + 2 πr h = (2 × 3.14 × 22) + (2 × 3.14 × 2 × 20) = 276.32 mm2 where: π = 3.14 r = radius of cylinder h = height or length of cylinder Fig. 1.1 The total surface area depends on the number of pieces, n. Total surface area = surface area of one cylinder × number of pieces = (2 πr 2 + 2 π r h)n (a) (i) Measure the diameter of one of the cylinders and calculate the radius, r. r = ......................................................... [1] (ii) All of the cylinders have the same diameter (standardised). State one other variable that should be standardised in this investigation. ........................................................................................................................................... ..................................................................................................................................... [1] (iii) Complete Table 1.4 to calculate the total surface area of potato tissue to put in the syringe. Show your working in the space provided in Table 1.4. Table 1.4 surface area total surface show your working in thisn h / mm r / mm of one piece area column / mm2 / mm2 1 20 2 10 4 5 10 2 [2] Carry out step 2 to step 22. 2. Remove the plunger from a 10 cm3 syringe. 3. Put one 20 mm potato cylinder into the barrel of the syringe. 4. Put the plunger back into the syringe and push it to the 4 cm3 mark, as shown in Fig. 1.2. plunger 10 barrel 4 potato cylinder nozzle Fig. 1.2 5. Put the nozzle of the syringe into the beaker containing H. 6. Pull the plunger out to the 10 cm3 mark so that H enters the syringe, as shown in Fig. 1.3. air bubbles 10 5 hydrogen peroxide 4 solution, H Fig. 1.3 7. Hold the syringe above the beaker labelled For waste. Push the plunger so that the level of H is at the 5 cm3 mark, as shown in Fig. 1.4. 10 5 level of H at 5 cm3 4 beaker labelled For waste Fig. 1.4 8. Wipe the nozzle with a paper towel to remove excess H. 9. Hold the syringe above the beaker labelled For waste. Start timing. Count the number of drops released in 1 minute. Record the results in (a)(iv). 10. Put the syringe into the beaker labelled B. 11. Cut a cylinder from step 1 into two pieces. Each piece should be 10 mm in length, as shown in Table 1.3 and Table 1.4. 12. Remove the plunger from an empty 10 cm3 syringe. 13. Put the two 10 mm pieces from step 11 into the barrel of the syringe. 14. Repeat step 4 to step 10. 15. Cut a cylinder from step 1 into four pieces. Each piece should be 5 mm in length, as shown in Table 1.3 and Table 1.4. 16. Remove the plunger from an empty 10 cm3 syringe. 17. Put the four 5 mm pieces from step 15 into the barrel of the syringe. 18. Repeat step 4 to step 10. 19. Cut a cylinder from step 1 into 10 pieces. Each piece should be 2 mm in length, as shown in Table 1.3 and Table 1.4. 20. Remove the plunger from an empty 10 cm3 syringe. 21. Put the ten 2 mm pieces from step 19 into the barrel of the syringe. 22. Repeat step 4 to step 10. (iv) Record your results in an appropriate table. [5] (v) State the independent variable. ..................................................................................................................................... [1] (vi) Suggest an appropriate control for this investigation. ..................................................................................................................................... [1] (vii) Identify two sources of error in step 3 to step 22. For each source of error suggest an improvement to the method which will reduce the effect of the error. error 1 ................................................................................................................................ ........................................................................................................................................... improvement 1 .................................................................................................................. ........................................................................................................................................... ........................................................................................................................................... error 2 ................................................................................................................................ ........................................................................................................................................... improvement 2 .................................................................................................................. ........................................................................................................................................... ........................................................................................................................................... [4] (viii) The procedure described by step 1 to step 22 investigated the effect of surface area on catalase activity, by measuring the number of drops released in 1 minute. Describe how you would modify the procedure to investigate the effect of changing temperature on the activity of catalase in the potato tissue. ........................................................................................................................................... ........................................................................................................................................... ..................................................................................................................................... [1] (b) A student investigated the effect of hydrogen peroxide concentration on the activity of catalase. The student measured the distance the solution moved along a clear plastic tube attached to a syringe, as shown in Fig. 1.5. 10 20 30 40 50 60 70 80 90 100 potato plunger clear ruler pieces plastic hydrogen nozzle tubing peroxide Fig. 1.5 The results are shown in Table 1.5. Table 1.5 percentage concentration of distance moved in 1 minute hydrogen peroxide / mm 0.2 11 0.4 18 0.8 50 1.5 69 3.0 73 6.0 73 (i) Plot a graph of the data in Table 1.5 on the grid in Fig. 1.6. Use a sharp pencil for drawing graphs. Fig. 1.6 [4] (ii) Suggest an explanation for the results between 0.2% and 6.0% hydrogen peroxide. ........................................................................................................................................... ........................................................................................................................................... ........................................................................................................................................... ........................................................................................................................................... ........................................................................................................................................... ........................................................................................................................................... ..................................................................................................................................... [2] [Total: 22]
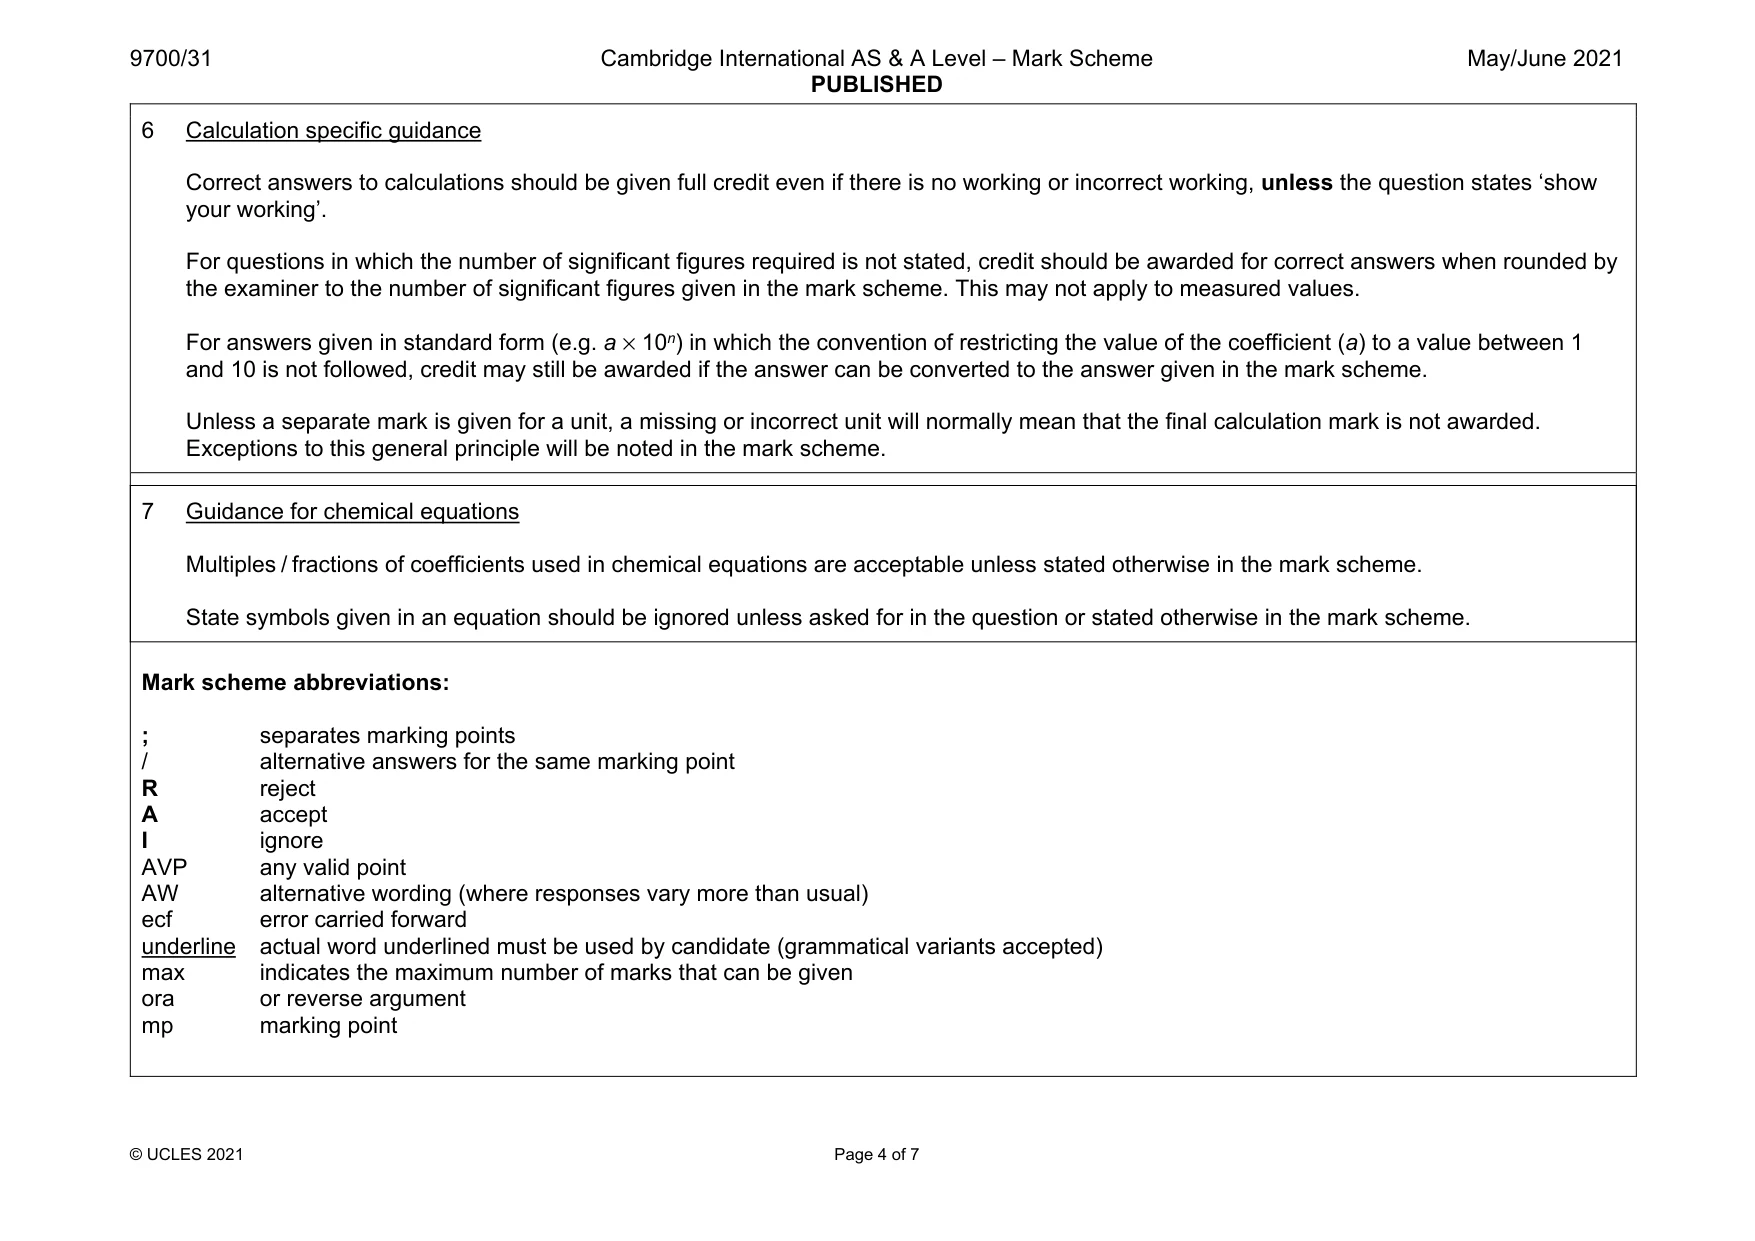
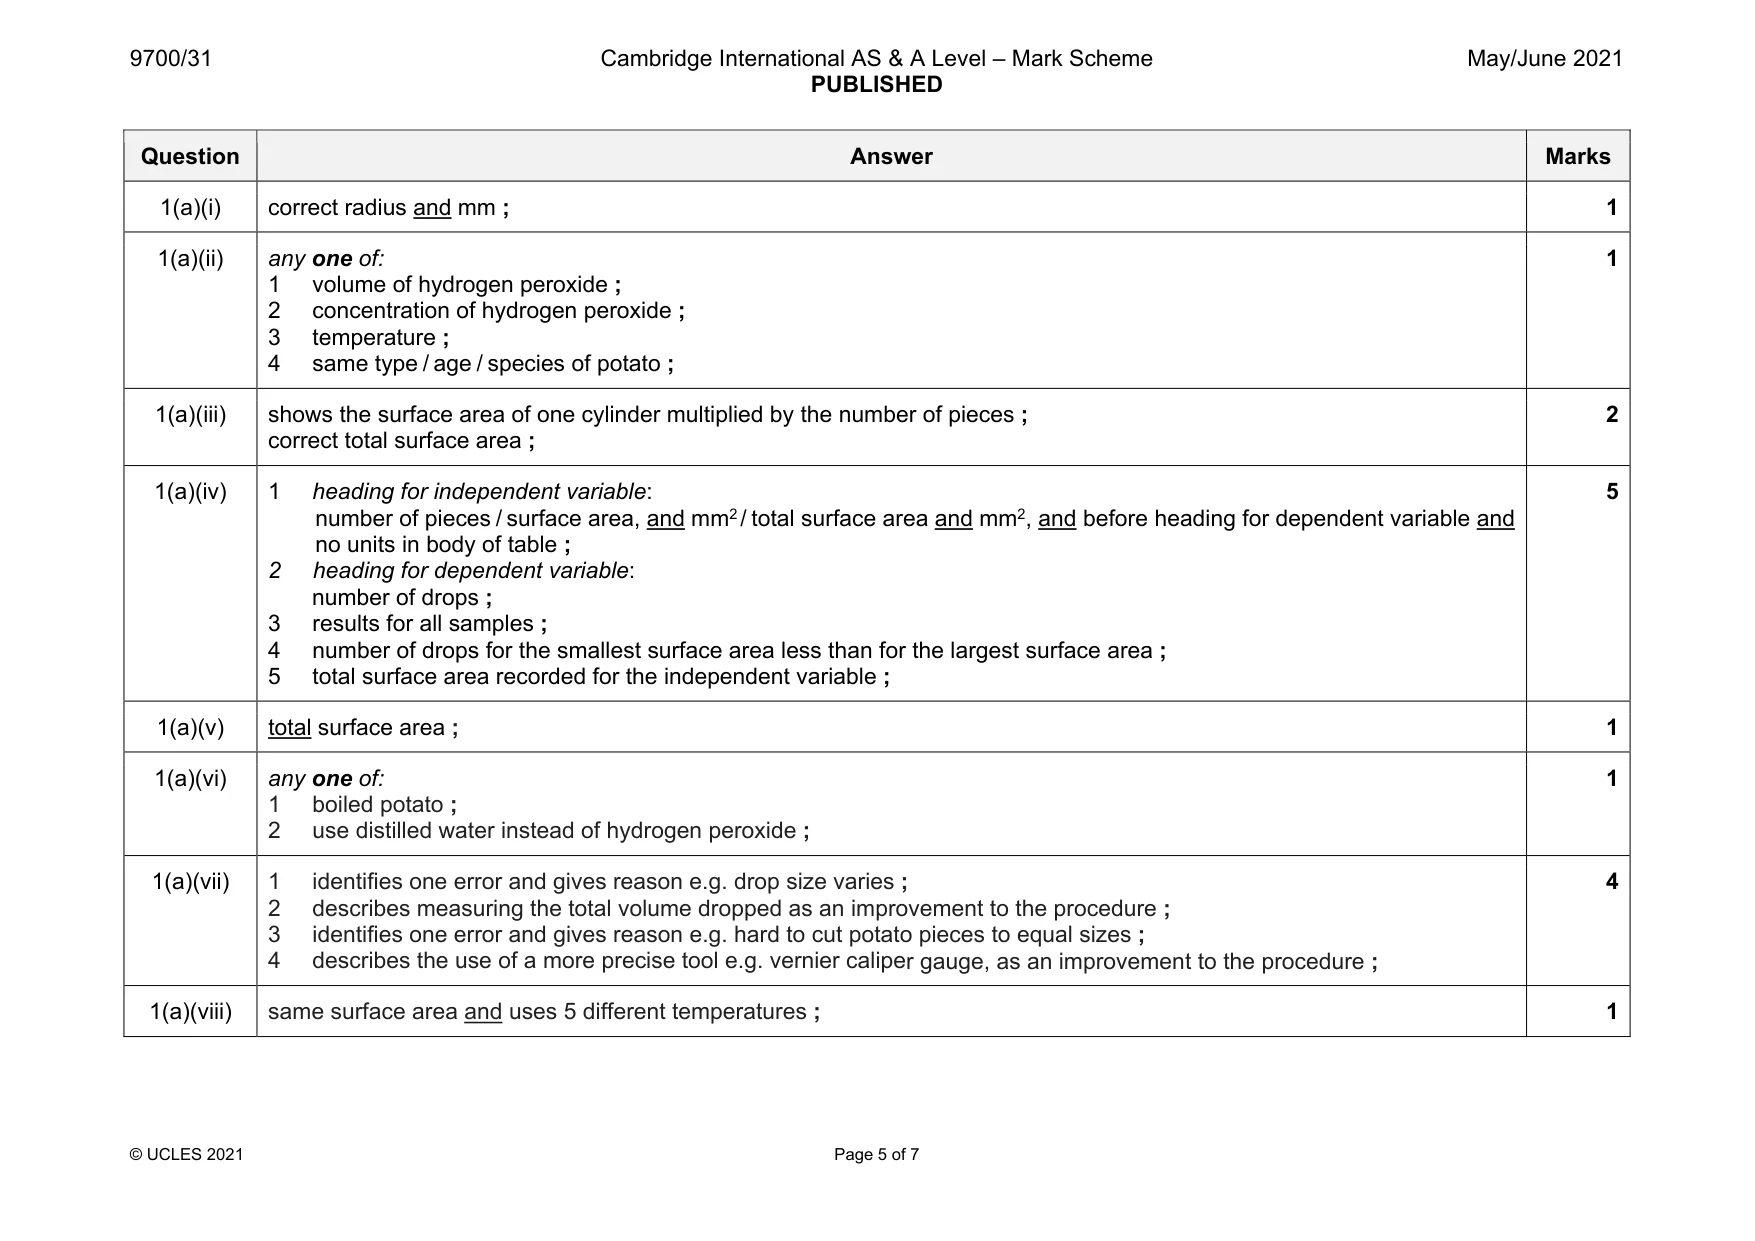
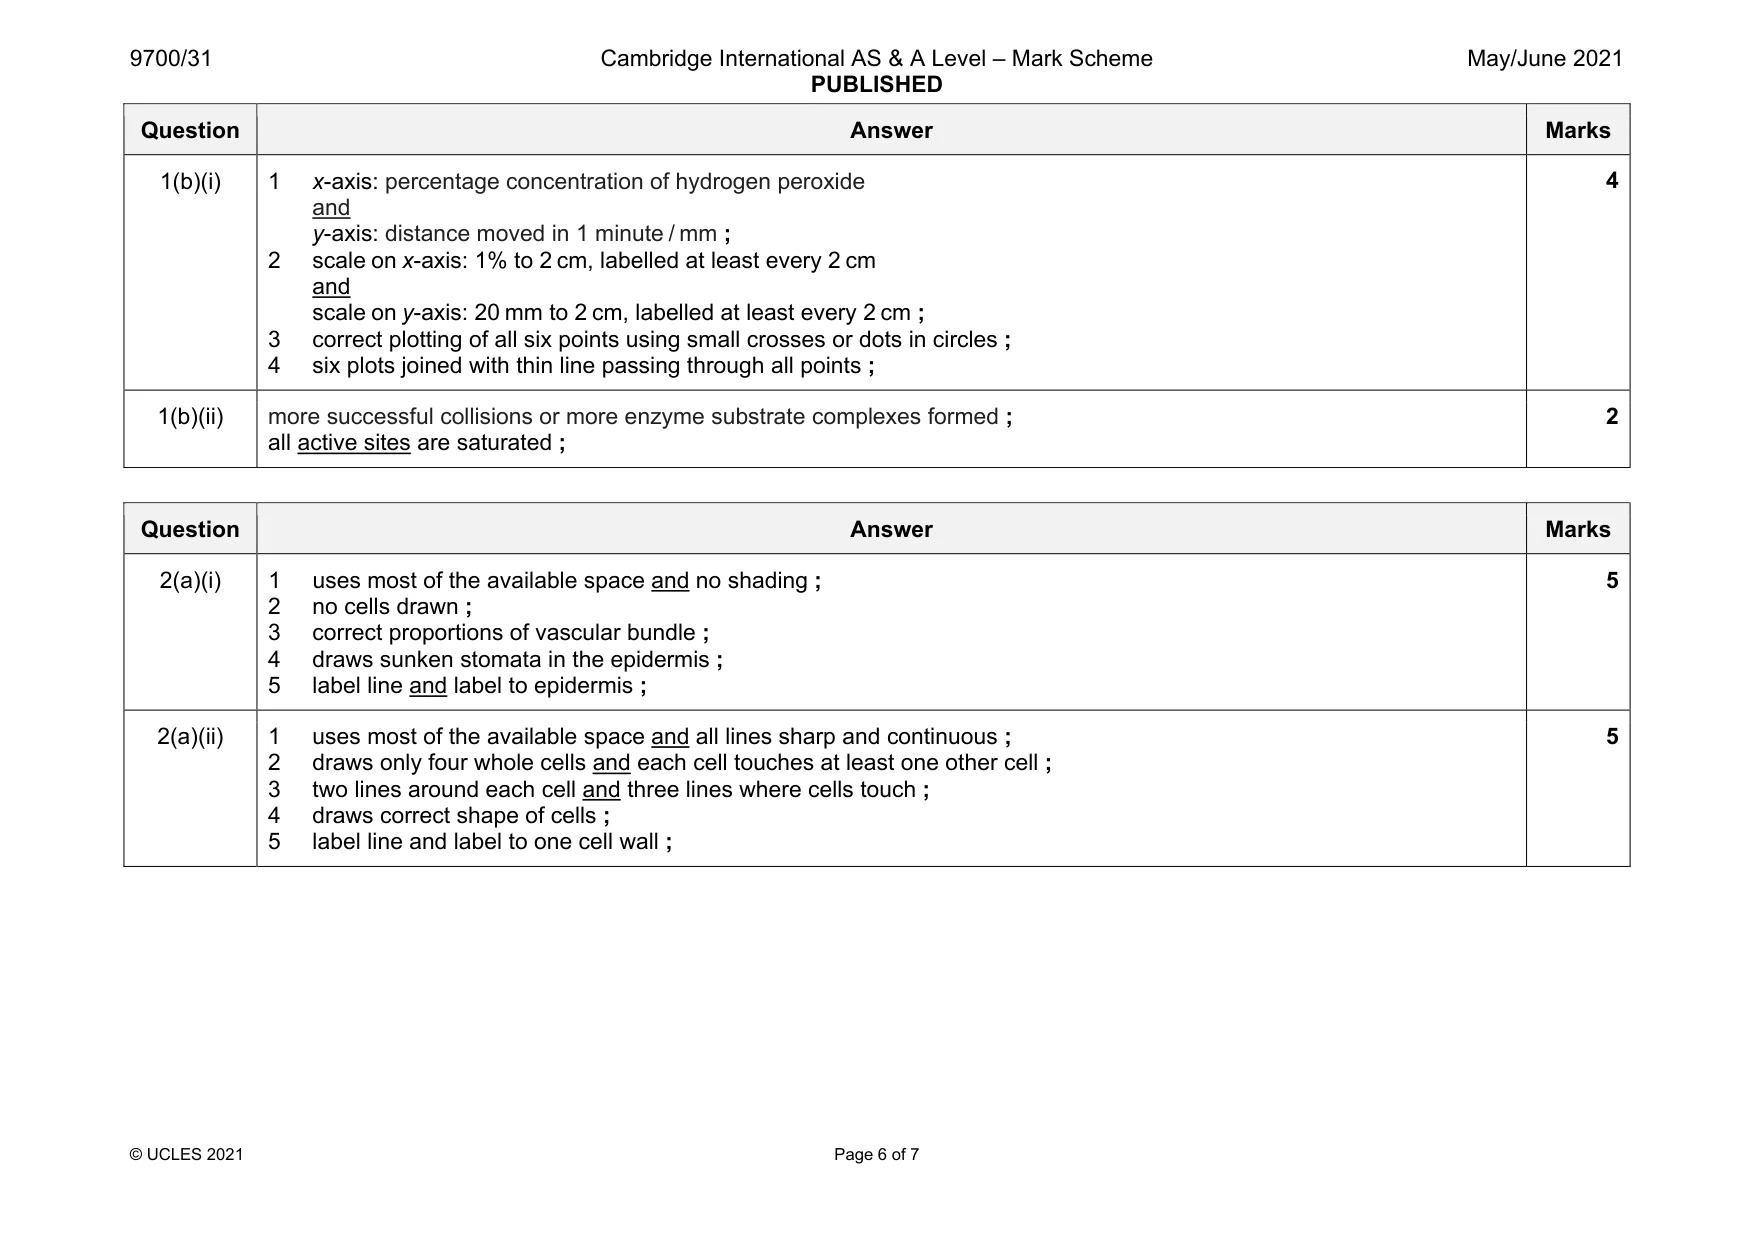
Mark scheme: 1(a)(i) correct radius and mm ; 1 1(a)(ii) any one of: 1 volume of hydrogen peroxide ; 2 concentration of hydrogen peroxide ; 3 temperature ; 4 same type / age / species of potato ; 1 1(a)(iii) shows the surface area of one cylinder multiplied by the number of pieces ; correct total surface area ; 2 1(a)(iv) 1 heading for independent variable: number of pieces / surface area, and mm2 / total surface area and mm2, and before heading for dependent variable and no units in body of table ; 2 heading for dependent variable: number of drops ; 3 results for all samples ; 4 number of drops for the smallest surface area less than for the largest surface area ; 5 total surface area recorded for the independent variable ; 5 1(a)(v) total surface area ; 1 1(a)(vi) any one of: 1 boiled potato ; 2 use distilled water instead of hydrogen peroxide ; 1 1(a)(vii) 1 identifies one error and gives reason e.g. drop size varies ; 2 describes measuring the total volume dropped as an improvement to the procedure ; 3 identifies one error and gives reason e.g. hard to cut potato pieces to equal sizes ; 4 describes the use of a more precise tool e.g. vernier caliper gauge, as an improvement to the procedure ; 4 1(a)(viii) same surface area and uses 5 different temperatures ; 1 Question Answer Marks 1(b)(i) 1 x-axis: percentage concentration of hydrogen peroxide and y-axis: distance moved in 1 minute / mm ; 2 scale on x-axis: 1% to 2 cm, labelled at least every 2 cm and scale on y-axis: 20 mm to 2 cm, labelled at least every 2 cm ; 3 correct plotting of all six points using small crosses or dots in circles ; 4 six plots joined with thin line passing through all points ; 4 1(b)(ii) more successful collisions or more enzyme substrate complexes formed ; all active sites are saturated ; 2
Q2 · J1 is a slide of a stained transverse section through a plant leaf
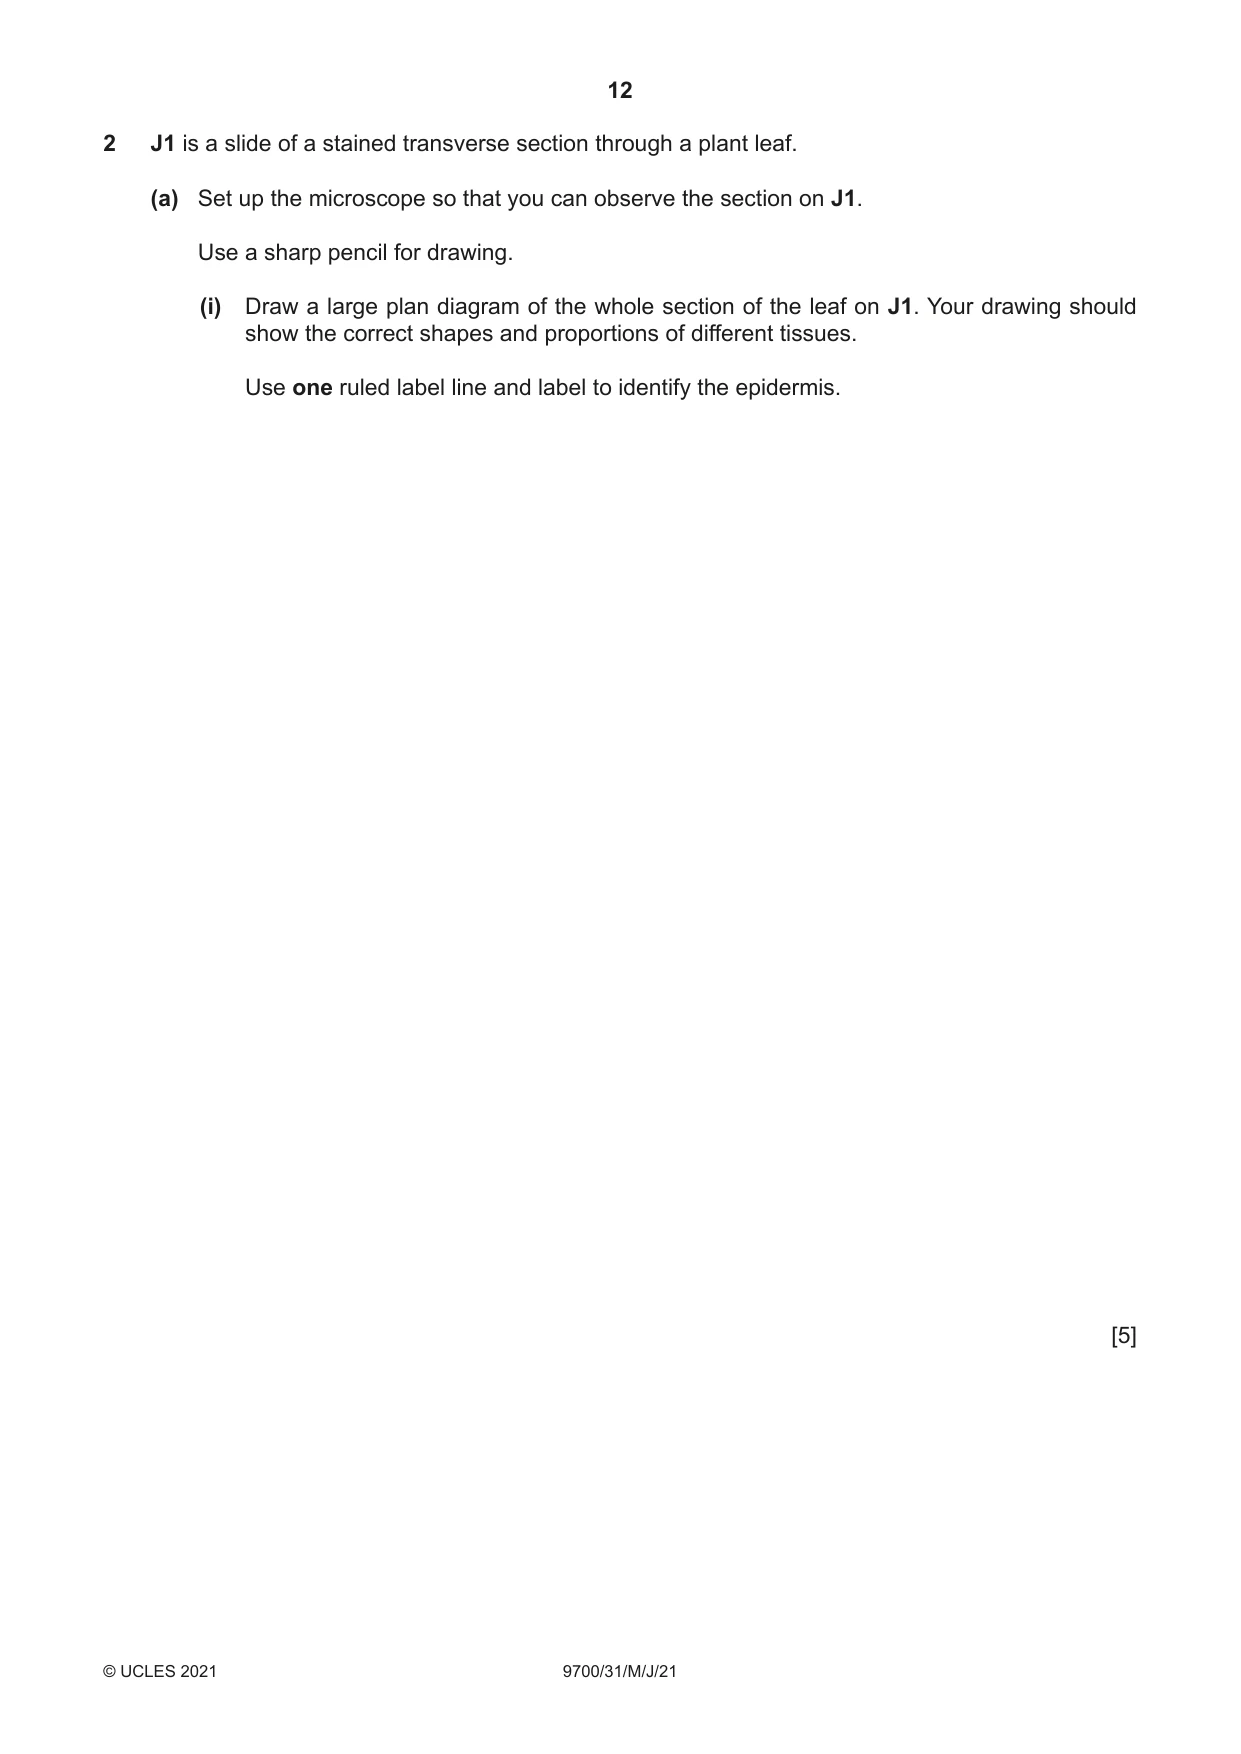
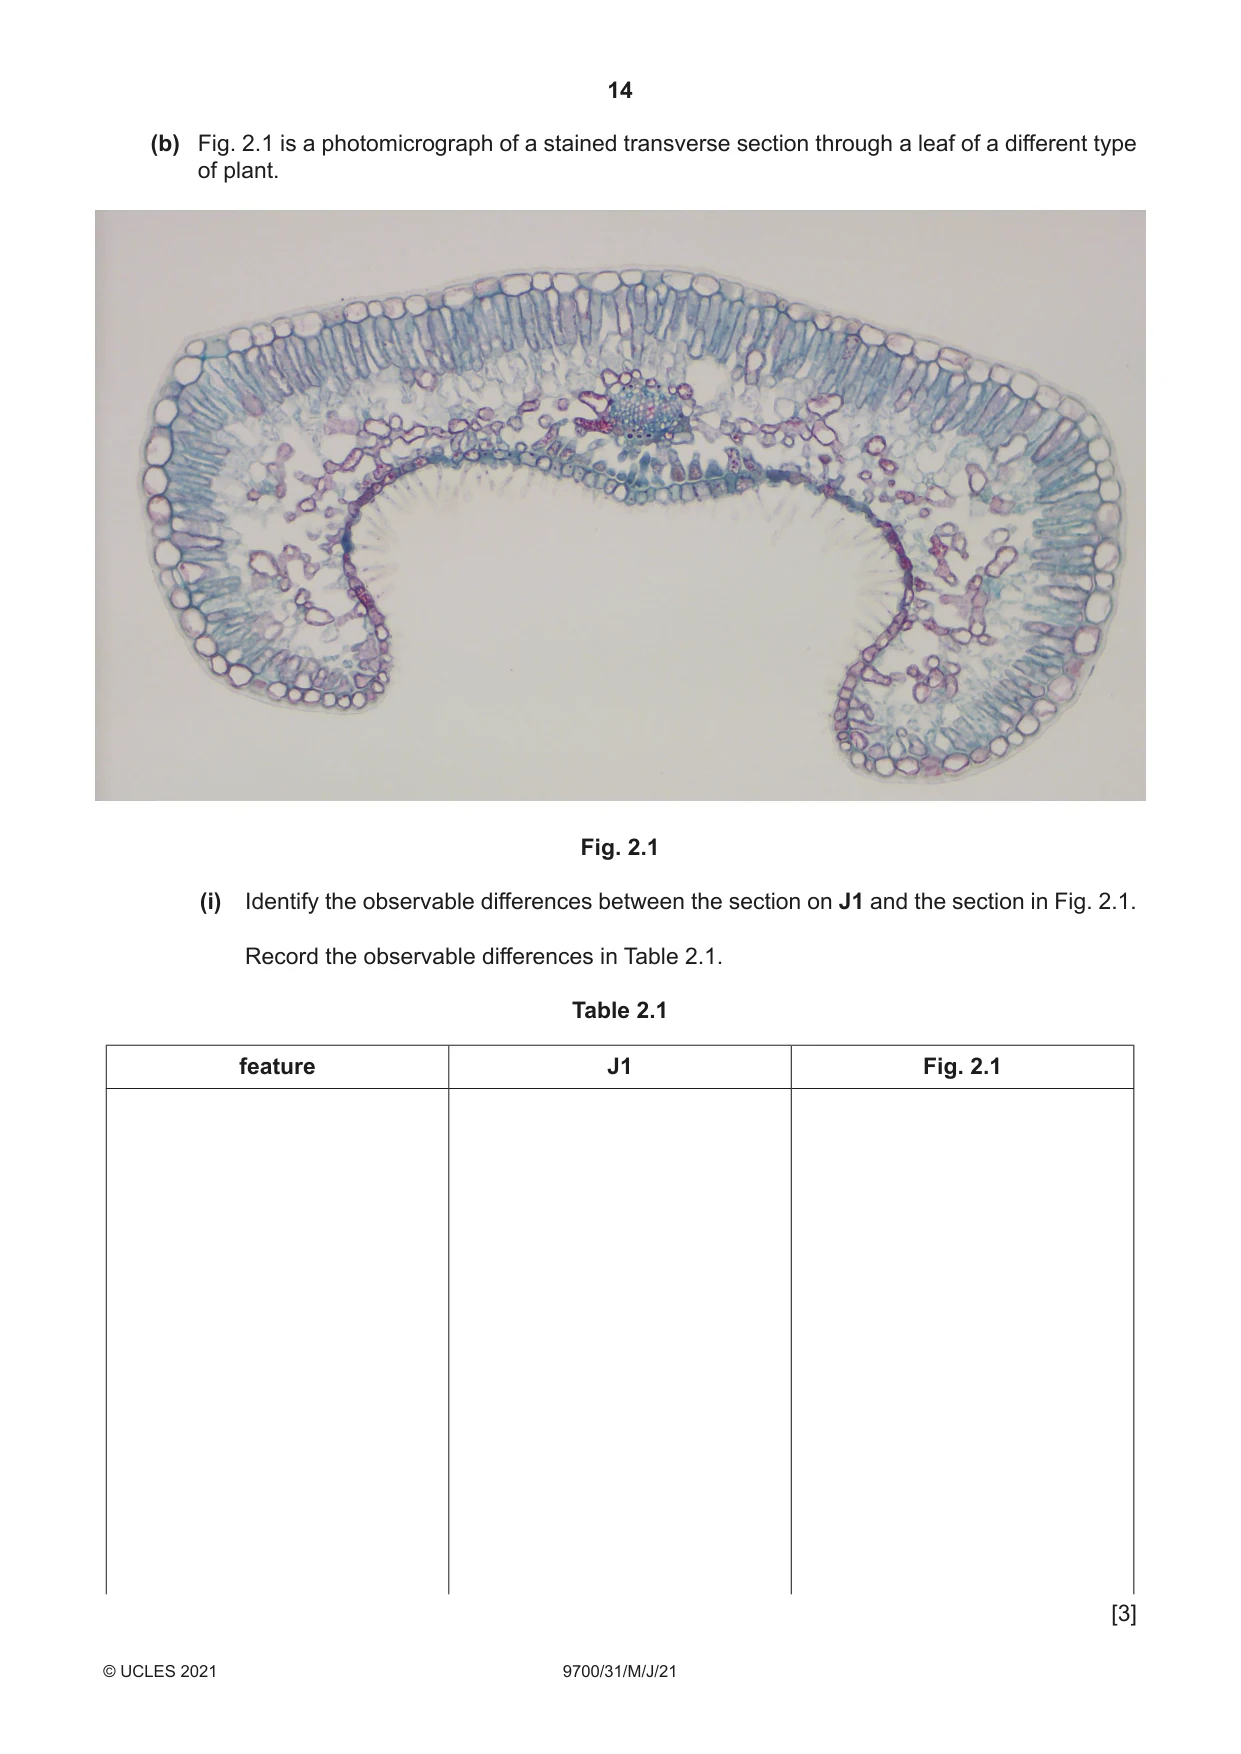
2 J1 is a slide of a stained transverse section through a plant leaf. (a) Set up the microscope so that you can observe the section on J1. Use a sharp pencil for drawing. (i) Draw a large plan diagram of the whole section of the leaf on J1. Your drawing should show the correct shapes and proportions of different tissues. Use one ruled label line and label to identify the epidermis. [5] (ii) Observe the ring of cells surrounding the vascular tissue in the centre of the section on J1. Select a line of four adjacent cells that make up this tissue. Each cell that you draw must touch at least one of the other cells. • Make a large drawing of this line of four cells. • Use one ruled label line and label to identify the cell wall of one cell. [5] (b) Fig. 2.1 is a photomicrograph of a stained transverse section through a leaf of a different type of plant. Fig. 2.1 (i) Identify the observable differences between the section on J1 and the section in Fig. 2.1. Record the observable differences in Table 2.1. Table 2.1 feature J1 Fig. 2.1 [3]
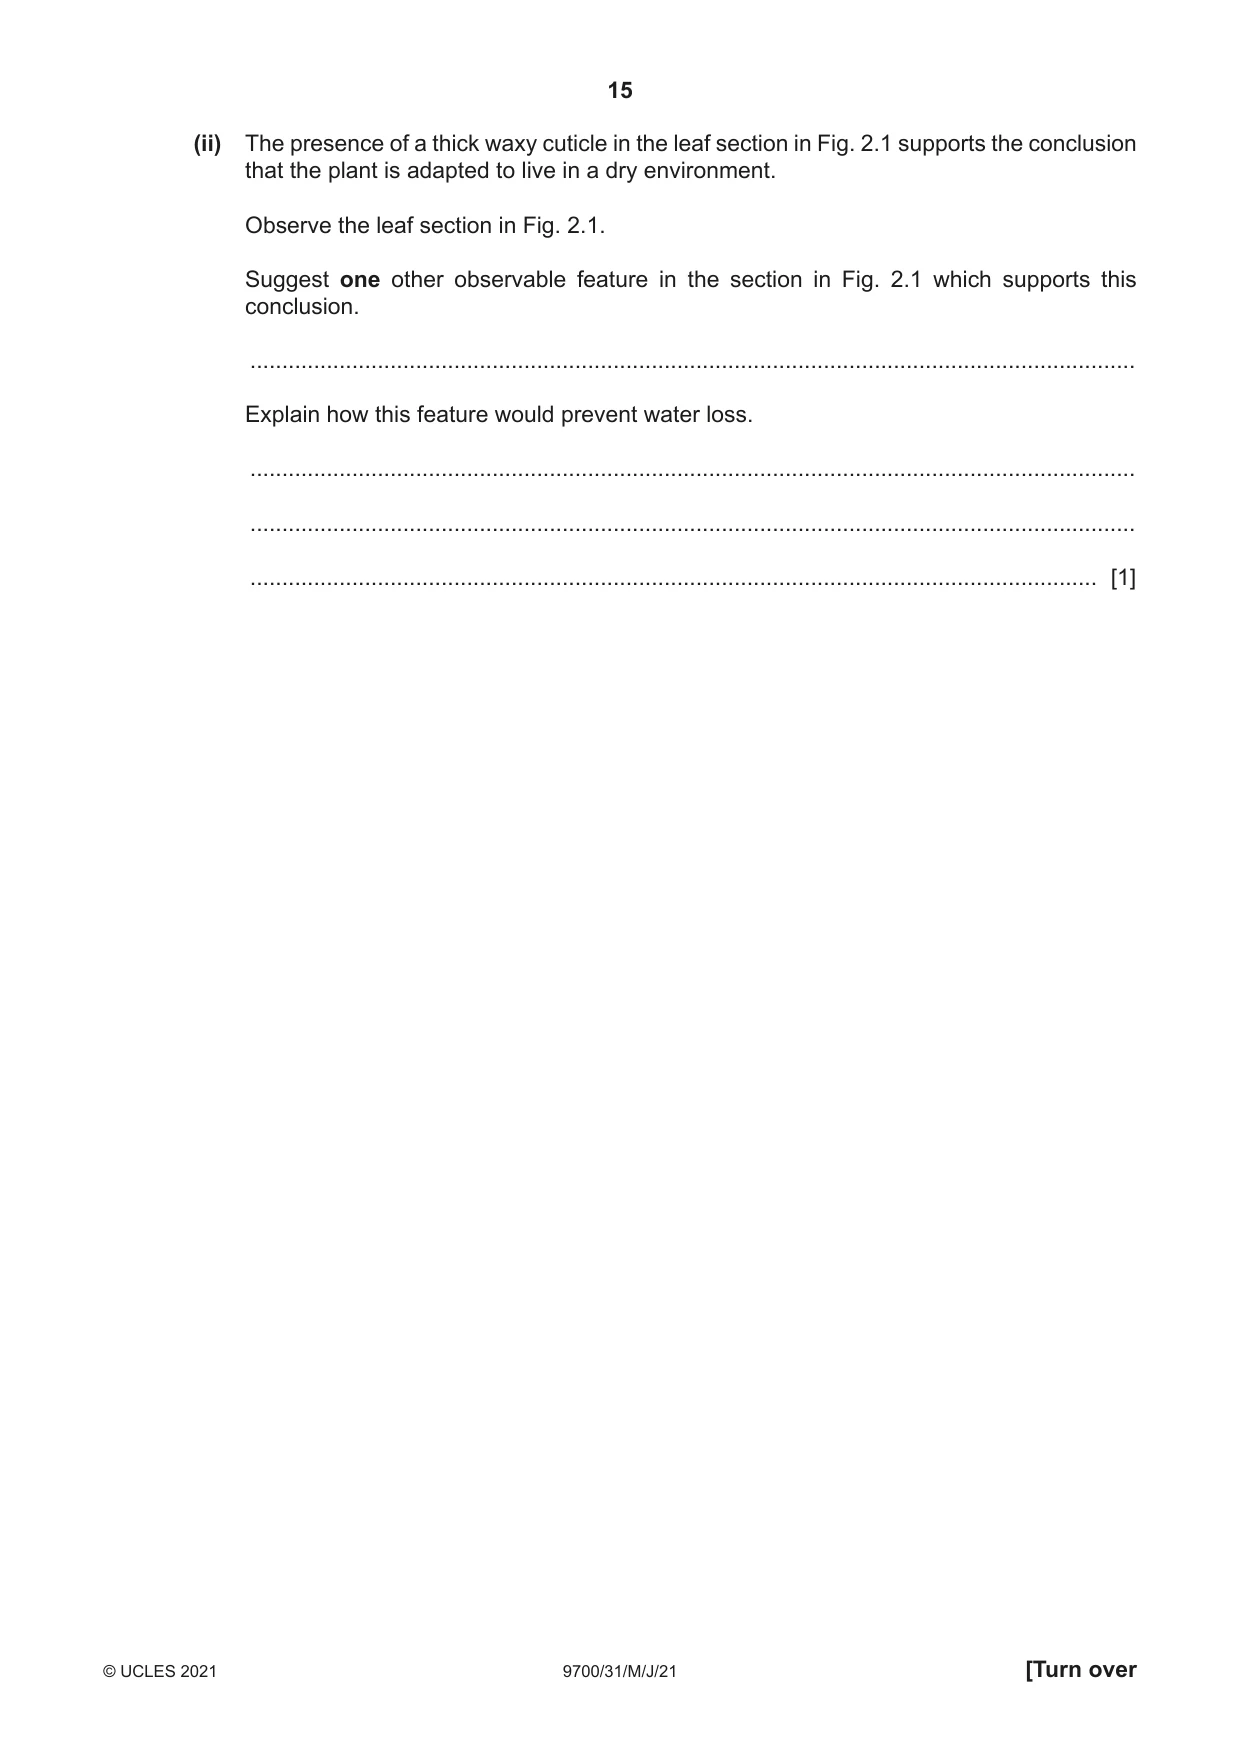
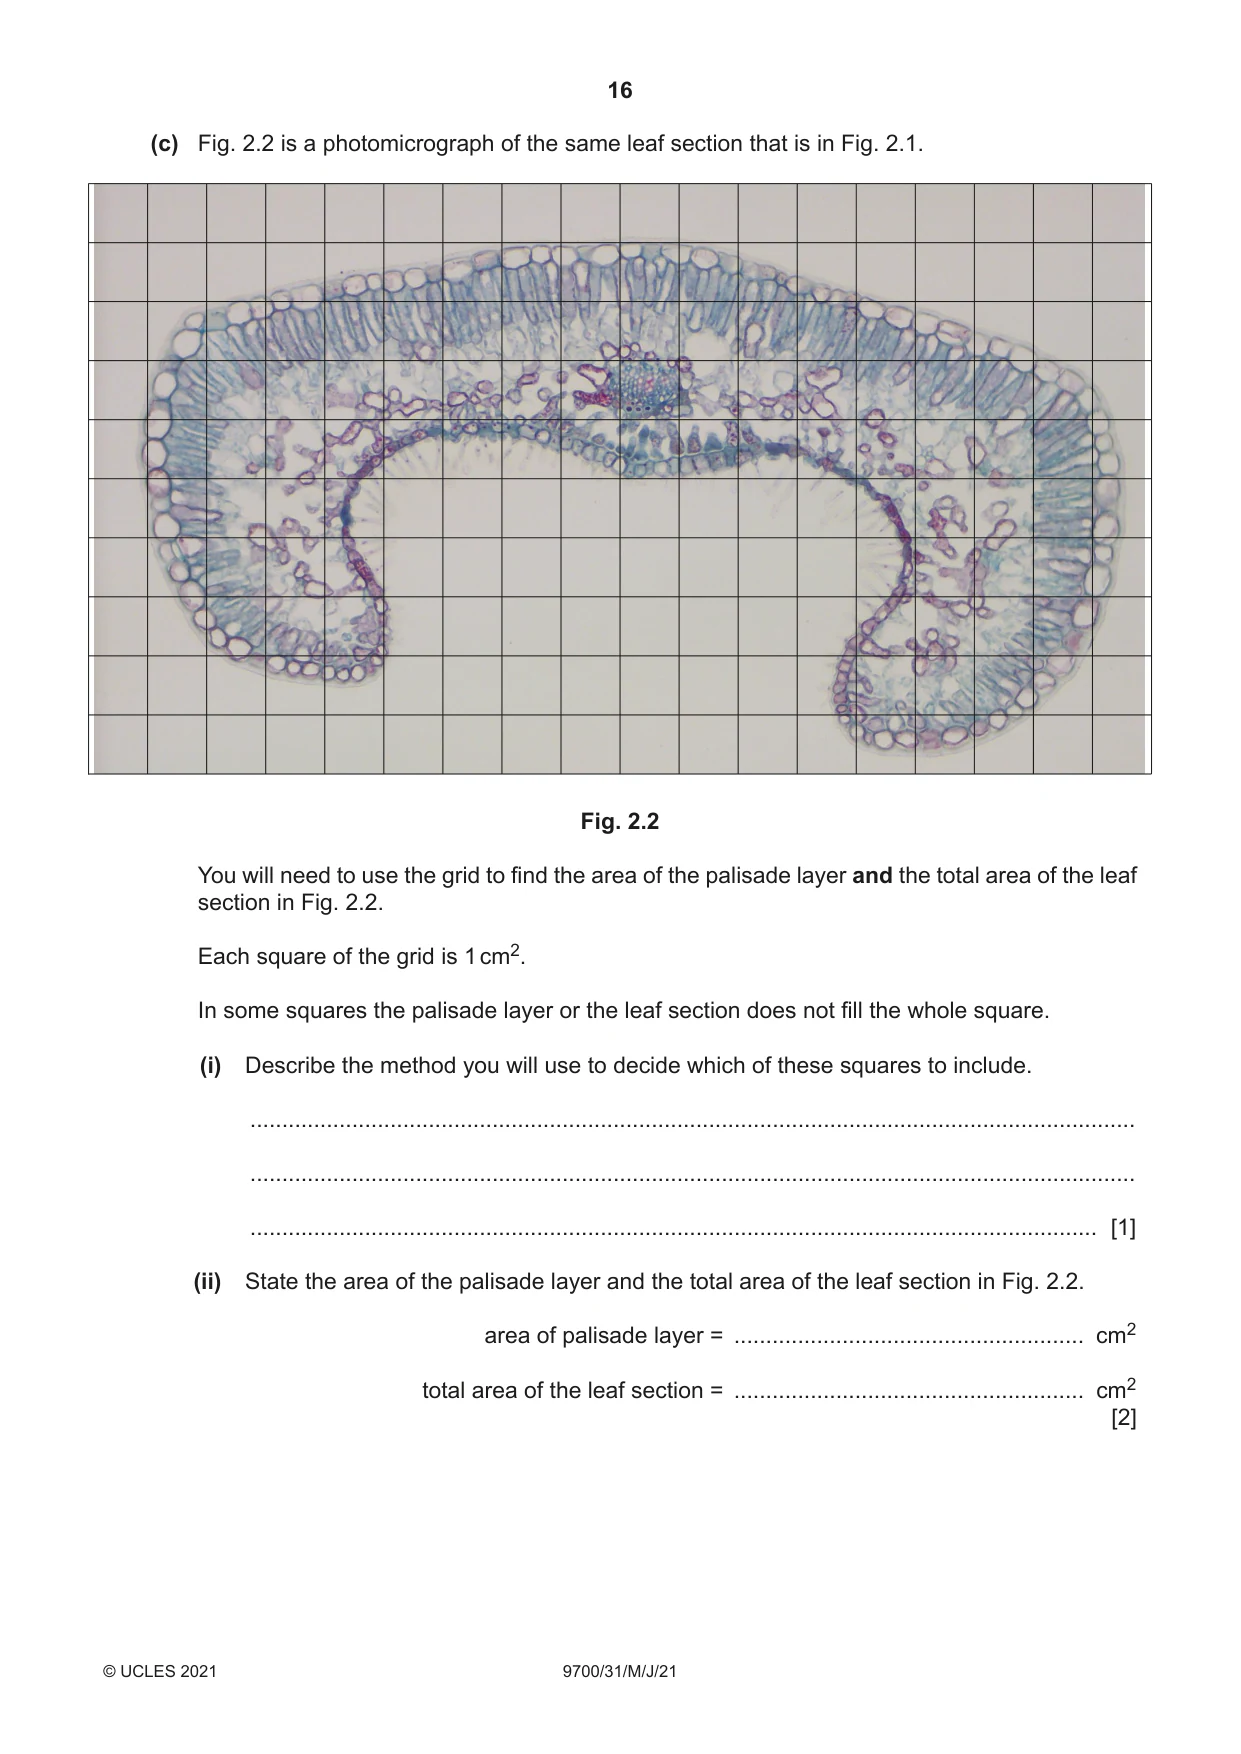
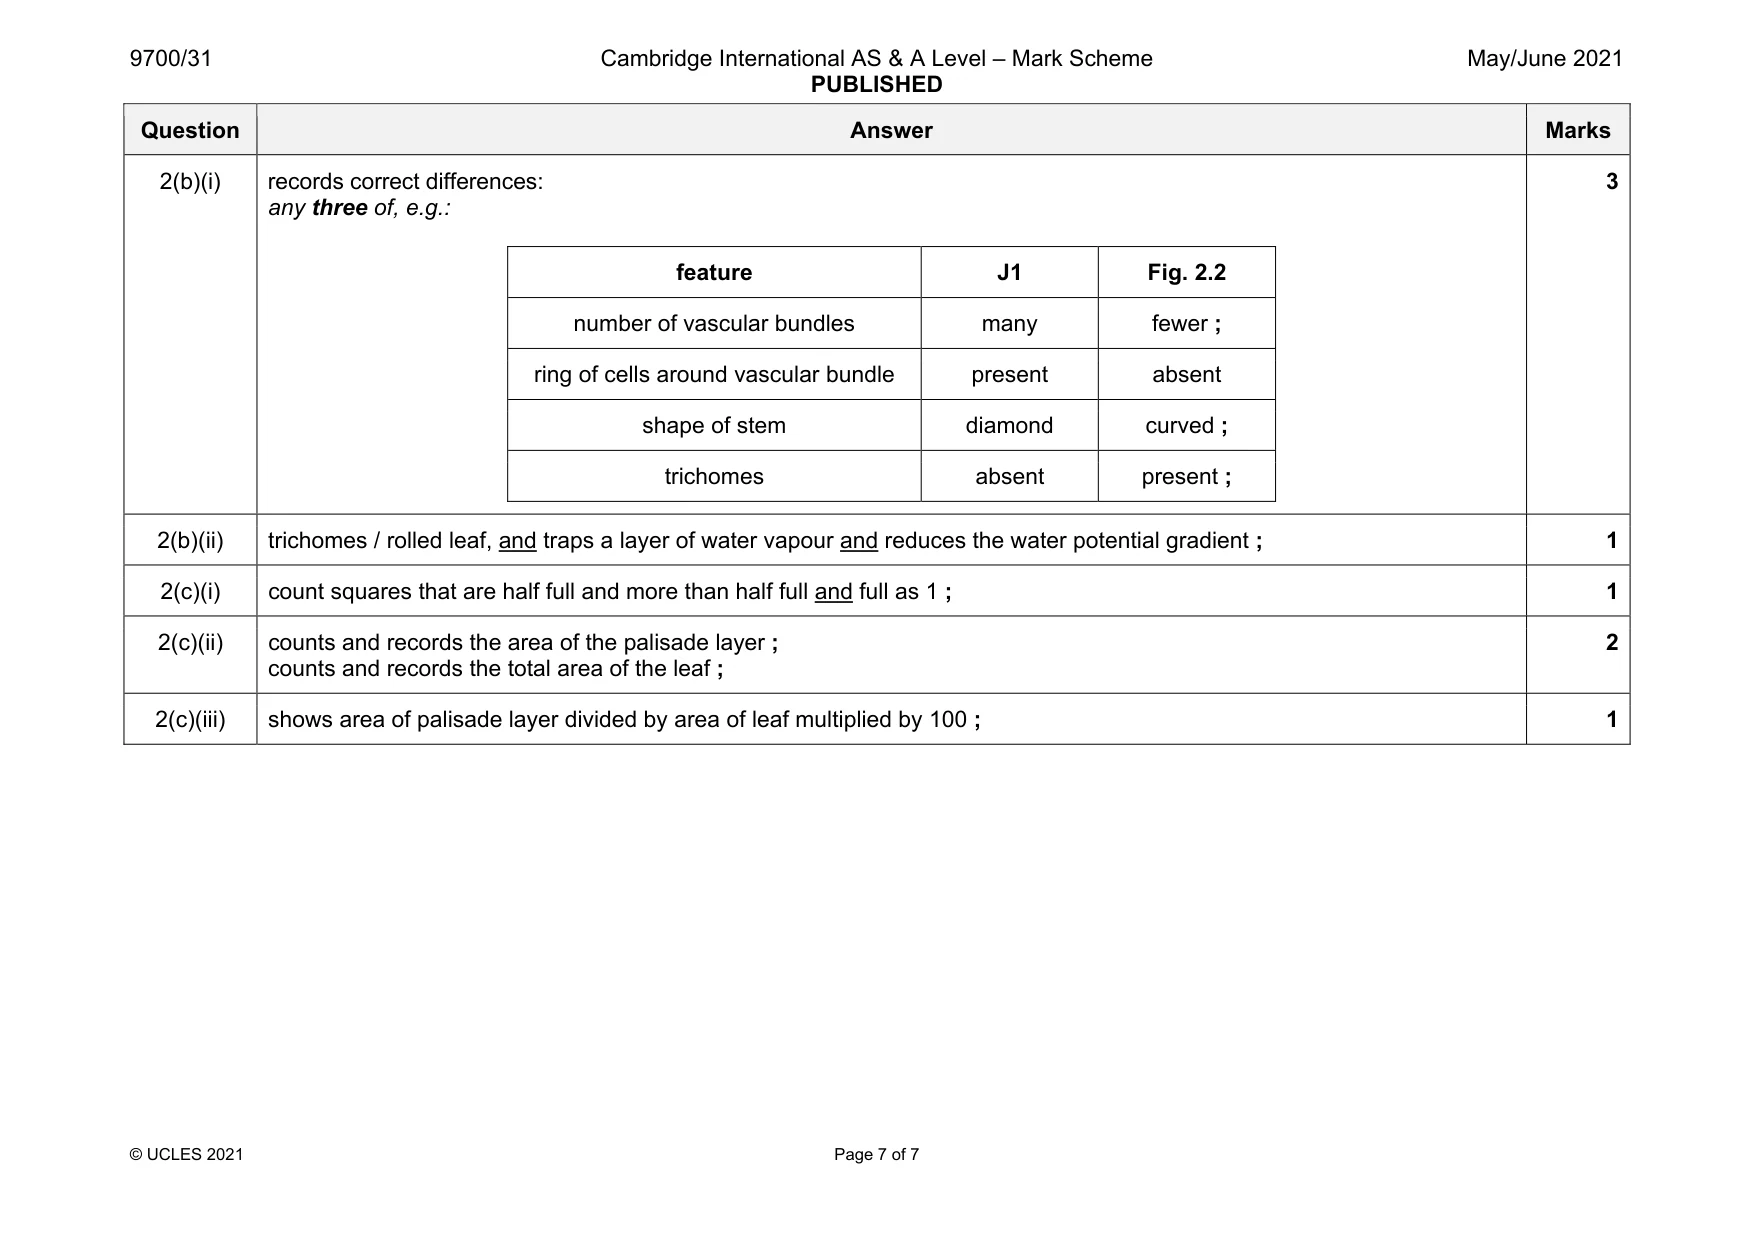
Mark scheme: 2(a)(i) 1 uses most of the available space and no shading ; 2 no cells drawn ; 3 correct proportions of vascular bundle ; 4 draws sunken stomata in the epidermis ; 5 label line and label to epidermis ; 5 2(a)(ii) 1 uses most of the available space and all lines sharp and continuous ; 2 draws only four whole cells and each cell touches at least one other cell ; 3 two lines around each cell and three lines where cells touch ; 4 draws correct shape of cells ; 5 label line and label to one cell wall ; 5 Question Answer Marks 2(b)(i) records correct differences: any three of, e.g.: feature J1 Fig. 2.2 number of vascular bundles many fewer ; ring of cells around vascular bundle present absent shape of stem diamond curved ; trichomes absent present ; 3 2(b)(ii) trichomes / rolled leaf, and traps a layer of water vapour and reduces the water potential gradient ; 1 2(c)(i) count squares that are half full and more than half full and full as 1 ; 1 2(c)(ii) counts and records the area of the palisade layer ; counts and records the total area of the leaf ; 2 2(c)(iii) shows area of palisade layer divided by area of leaf multiplied by 100 ; 1
What was in this paper
The subtopics covered by these 2 questions, and how many questions each got. Open one in a new tab to see every Cambridge question on it.
What you needed in this session
Cambridge’s own grade thresholds for 2021 May/June, Paper 3 · Variant 1. A higher threshold means an easier paper — the bar moves with how the cohort did.