Cambridge A Level Biology 9700 — 2023 May/June Paper 5 · Variant 2
9700/52/M/J/23 · 3 questions · 30 marks · ≈34 min
The question paper and its mark scheme, free to read here and free to download. This is Cambridge’s own paper, exactly as it was sat.
Question paper12 pages


Mark scheme13 pages
Answers below. Sit the paper first if you are practising.


Questions as text
Q1 · Polyphenol oxidase is an enzyme involved in the browning of fruit
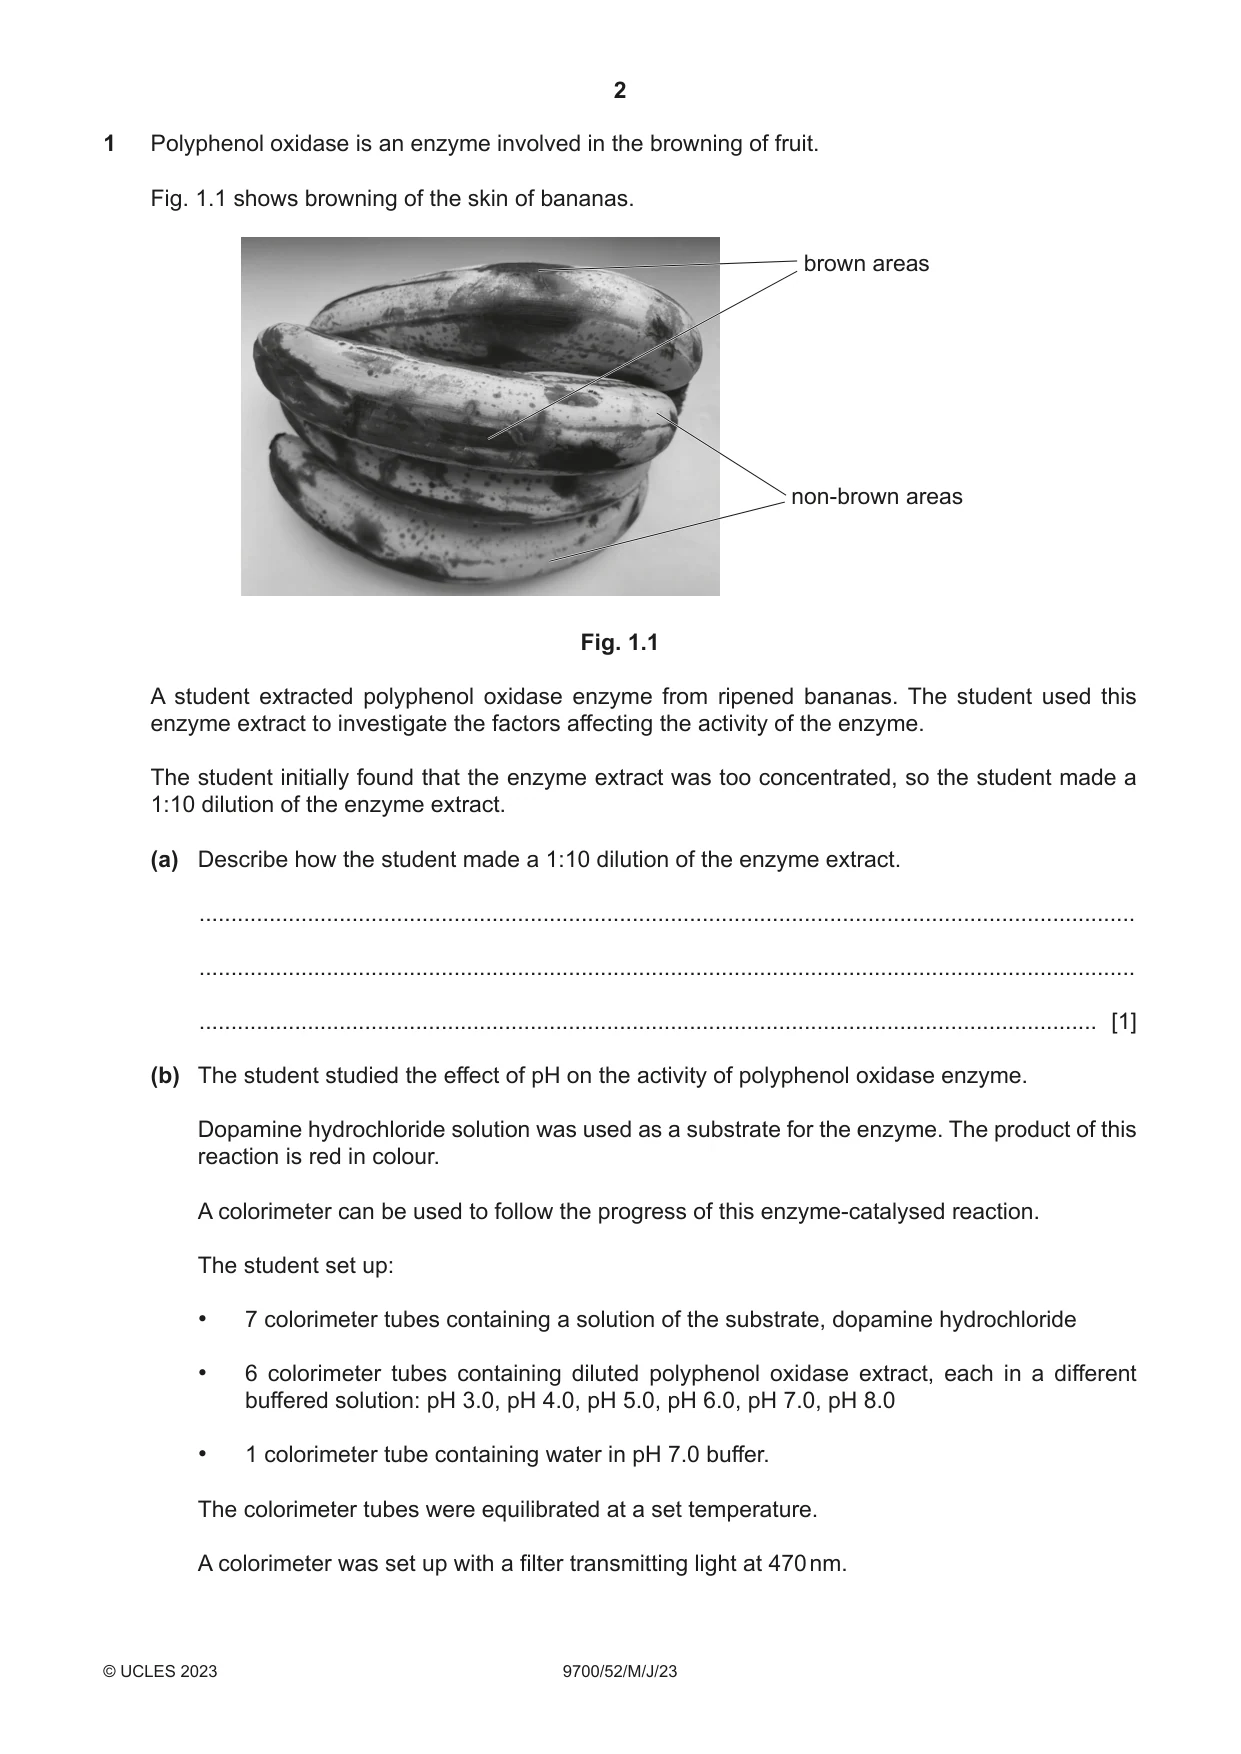
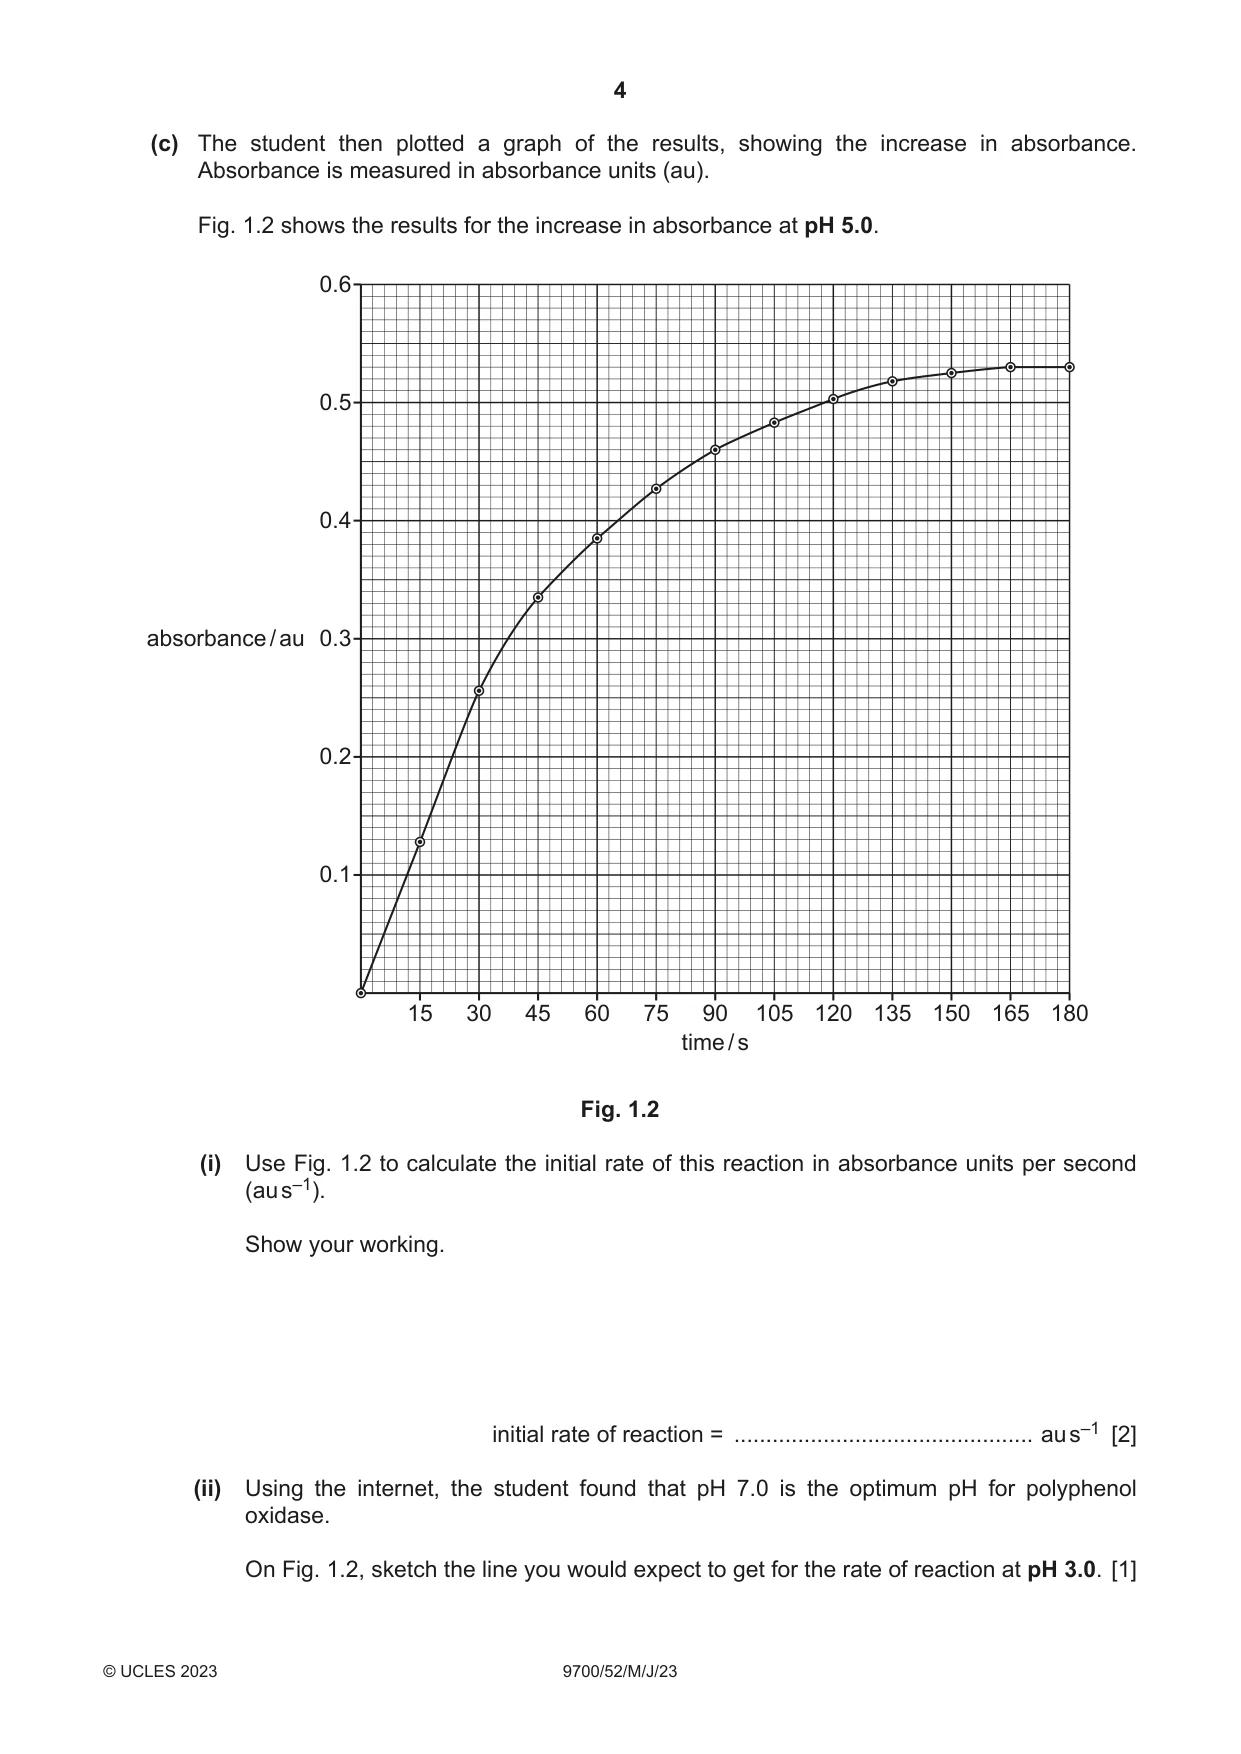
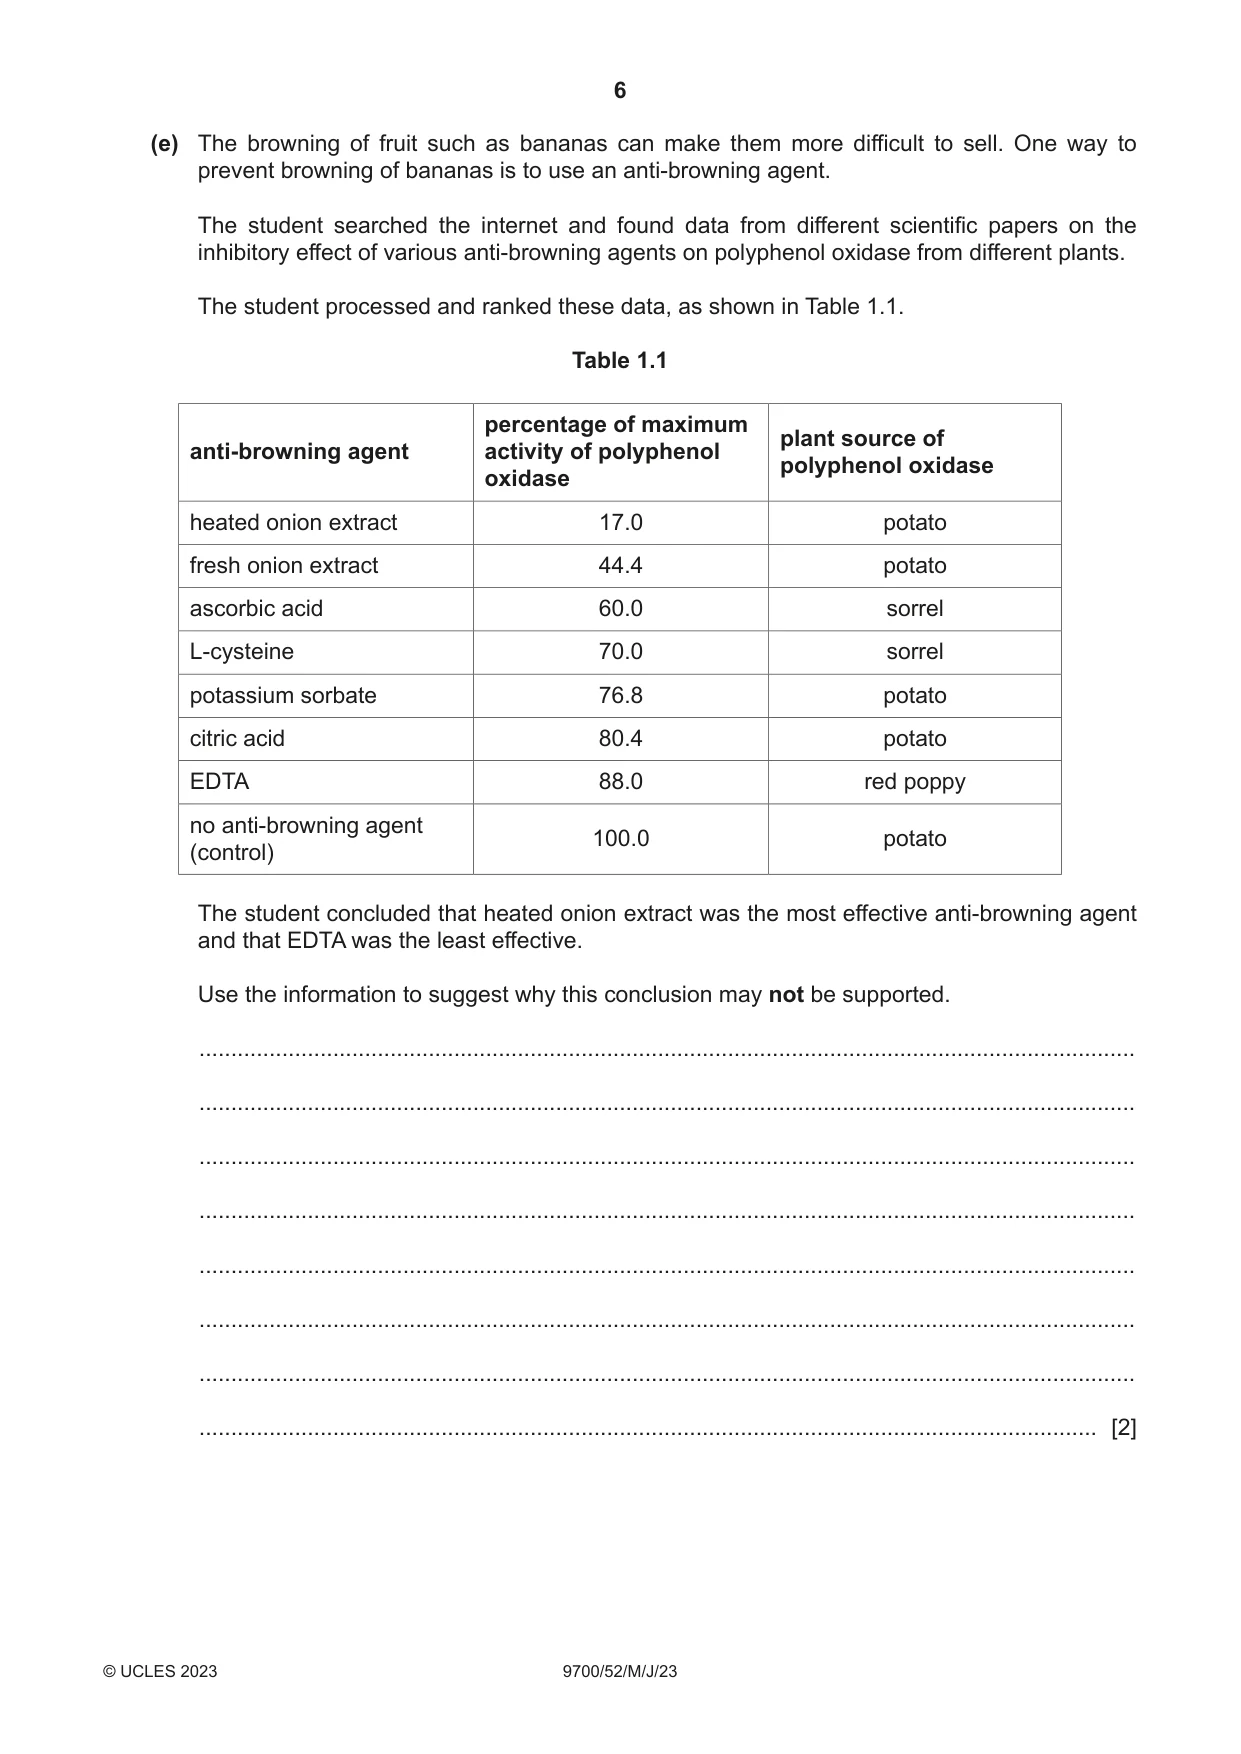
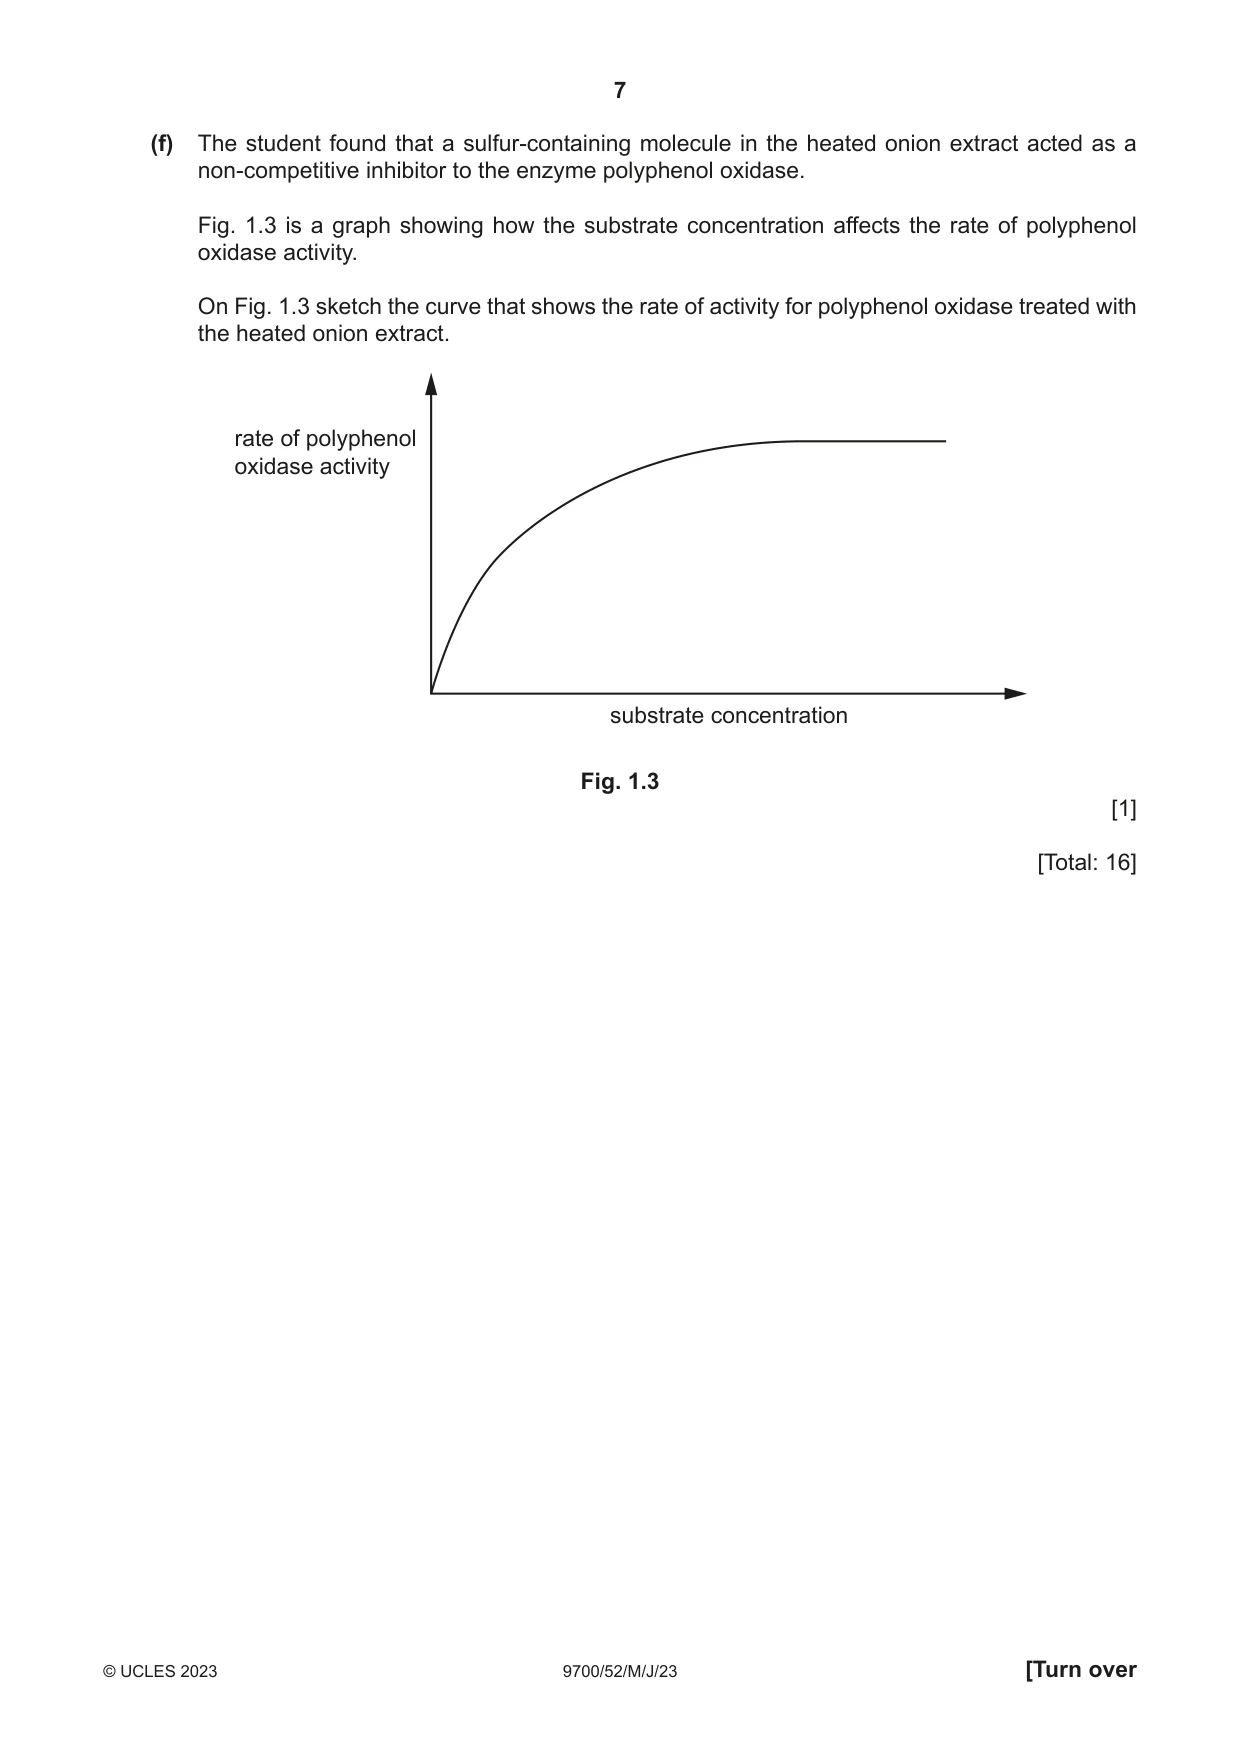
1 Polyphenol oxidase is an enzyme involved in the browning of fruit. Fig. 1.1 shows browning of the skin of bananas. brown areas non-brown areas Fig. 1.1 A student extracted polyphenol oxidase enzyme from ripened bananas. The student used this enzyme extract to investigate the factors affecting the activity of the enzyme. The student initially found that the enzyme extract was too concentrated, so the student made a 1:10 dilution of the enzyme extract. (a) Describe how the student made a 1:10 dilution of the enzyme extract. ................................................................................................................................................... ................................................................................................................................................... ............................................................................................................................................. [1] (b) The student studied the effect of pH on the activity of polyphenol oxidase enzyme. Dopamine hydrochloride solution was used as a substrate for the enzyme. The product of this reaction is red in colour. A colorimeter can be used to follow the progress of this enzyme-catalysed reaction. The student set up: • 7 colorimeter tubes containing a solution of the substrate, dopamine hydrochloride • 6 colorimeter tubes containing diluted polyphenol oxidase extract, each in a different buffered solution: pH 3.0, pH 4.0, pH 5.0, pH 6.0, pH 7.0, pH 8.0 • 1 colorimeter tube containing water in pH 7.0 buffer. The colorimeter tubes were equilibrated at a set temperature. A colorimeter was set up with a filter transmitting light at 470 nm. At time 0 seconds, the substrate solution and the polyphenol oxidase solution at pH 3.0 were mixed in one colorimeter tube. The colorimeter tube was then immediately put into the colorimeter. The absorbance was measured at 15 second intervals over the first three minutes of the reaction. The procedure was repeated for the remaining buffered solutions and the water at pH 7.0. (i) Identify the independent variable in this experiment. ........................................................................................................................................... ..................................................................................................................................... [1] (ii) Identify one variable that the student has standardised. ........................................................................................................................................... ........................................................................................................................................... ..................................................................................................................................... [1] (c) The student then plotted a graph of the results, showing the increase in absorbance. Absorbance is measured in absorbance units (au). Fig. 1.2 shows the results for the increase in absorbance at pH 5.0. 0.6 0.5 0.4 absorbance / au 0.3 0.2 0.1 15 30 45 60 75 90 105 120 135 150 165 180 time / s Fig. 1.2 (i) Use Fig. 1.2 to calculate the initial rate of this reaction in absorbance units per second (au s–1). Show your working. initial rate of reaction = ............................................... au s–1 [2] (ii) Using the internet, the student found that pH 7.0 is the optimum pH for polyphenol oxidase. On Fig. 1.2, sketch the line you would expect to get for the rate of reaction at pH 3.0. [1] (d) The student wanted to determine the effect of the concentration of the substrate, dopamine hydrochloride solution, on the rate of the enzyme-catalysed reaction. The student was provided with a stock solution of 0.2% dopamine hydrochloride solution and the diluted enzyme extract prepared in (a). Describe a method the student could use to collect the data that is needed to determine the effect of the concentration of dopamine hydrochloride solution on the rate of the enzyme-catalysed reaction. Your method should be set out in a logical order and be detailed enough to let another person follow it. ................................................................................................................................................... ................................................................................................................................................... ................................................................................................................................................... ................................................................................................................................................... ................................................................................................................................................... ................................................................................................................................................... ................................................................................................................................................... ................................................................................................................................................... ................................................................................................................................................... ................................................................................................................................................... ................................................................................................................................................... ................................................................................................................................................... ................................................................................................................................................... ................................................................................................................................................... ................................................................................................................................................... ................................................................................................................................................... ................................................................................................................................................... ................................................................................................................................................... ................................................................................................................................................... ................................................................................................................................................... ................................................................................................................................................... ............................................................................................................................................. [7] (e) The browning of fruit such as bananas can make them more difficult to sell. One way to prevent browning of bananas is to use an anti-browning agent. The student searched the internet and found data from different scientific papers on the inhibitory effect of various anti-browning agents on polyphenol oxidase from different plants. The student processed and ranked these data, as shown in Table 1.1. Table 1.1 percentage of maximum plant source of anti-browning agent activity of polyphenol polyphenol oxidase oxidase heated onion extract 17.0 potato fresh onion extract 44.4 potato ascorbic acid 60.0 sorrel L-cysteine 70.0 sorrel potassium sorbate 76.8 potato citric acid 80.4 potato EDTA 88.0 red poppy no anti-browning agent 100.0 potato (control) The student concluded that heated onion extract was the most effective anti-browning agent and that EDTA was the least effective. Use the information to suggest why this conclusion may not be supported. ................................................................................................................................................... ................................................................................................................................................... ................................................................................................................................................... ................................................................................................................................................... ................................................................................................................................................... ................................................................................................................................................... ................................................................................................................................................... ............................................................................................................................................. [2] (f) The student found that a sulfur-containing molecule in the heated onion extract acted as a non-competitive inhibitor to the enzyme polyphenol oxidase. Fig. 1.3 is a graph showing how the substrate concentration affects the rate of polyphenol oxidase activity. On Fig. 1.3 sketch the curve that shows the rate of activity for polyphenol oxidase treated with the heated onion extract. rate of polyphenol oxidase activity substrate concentration Fig. 1.3 [1] [Total: 16]
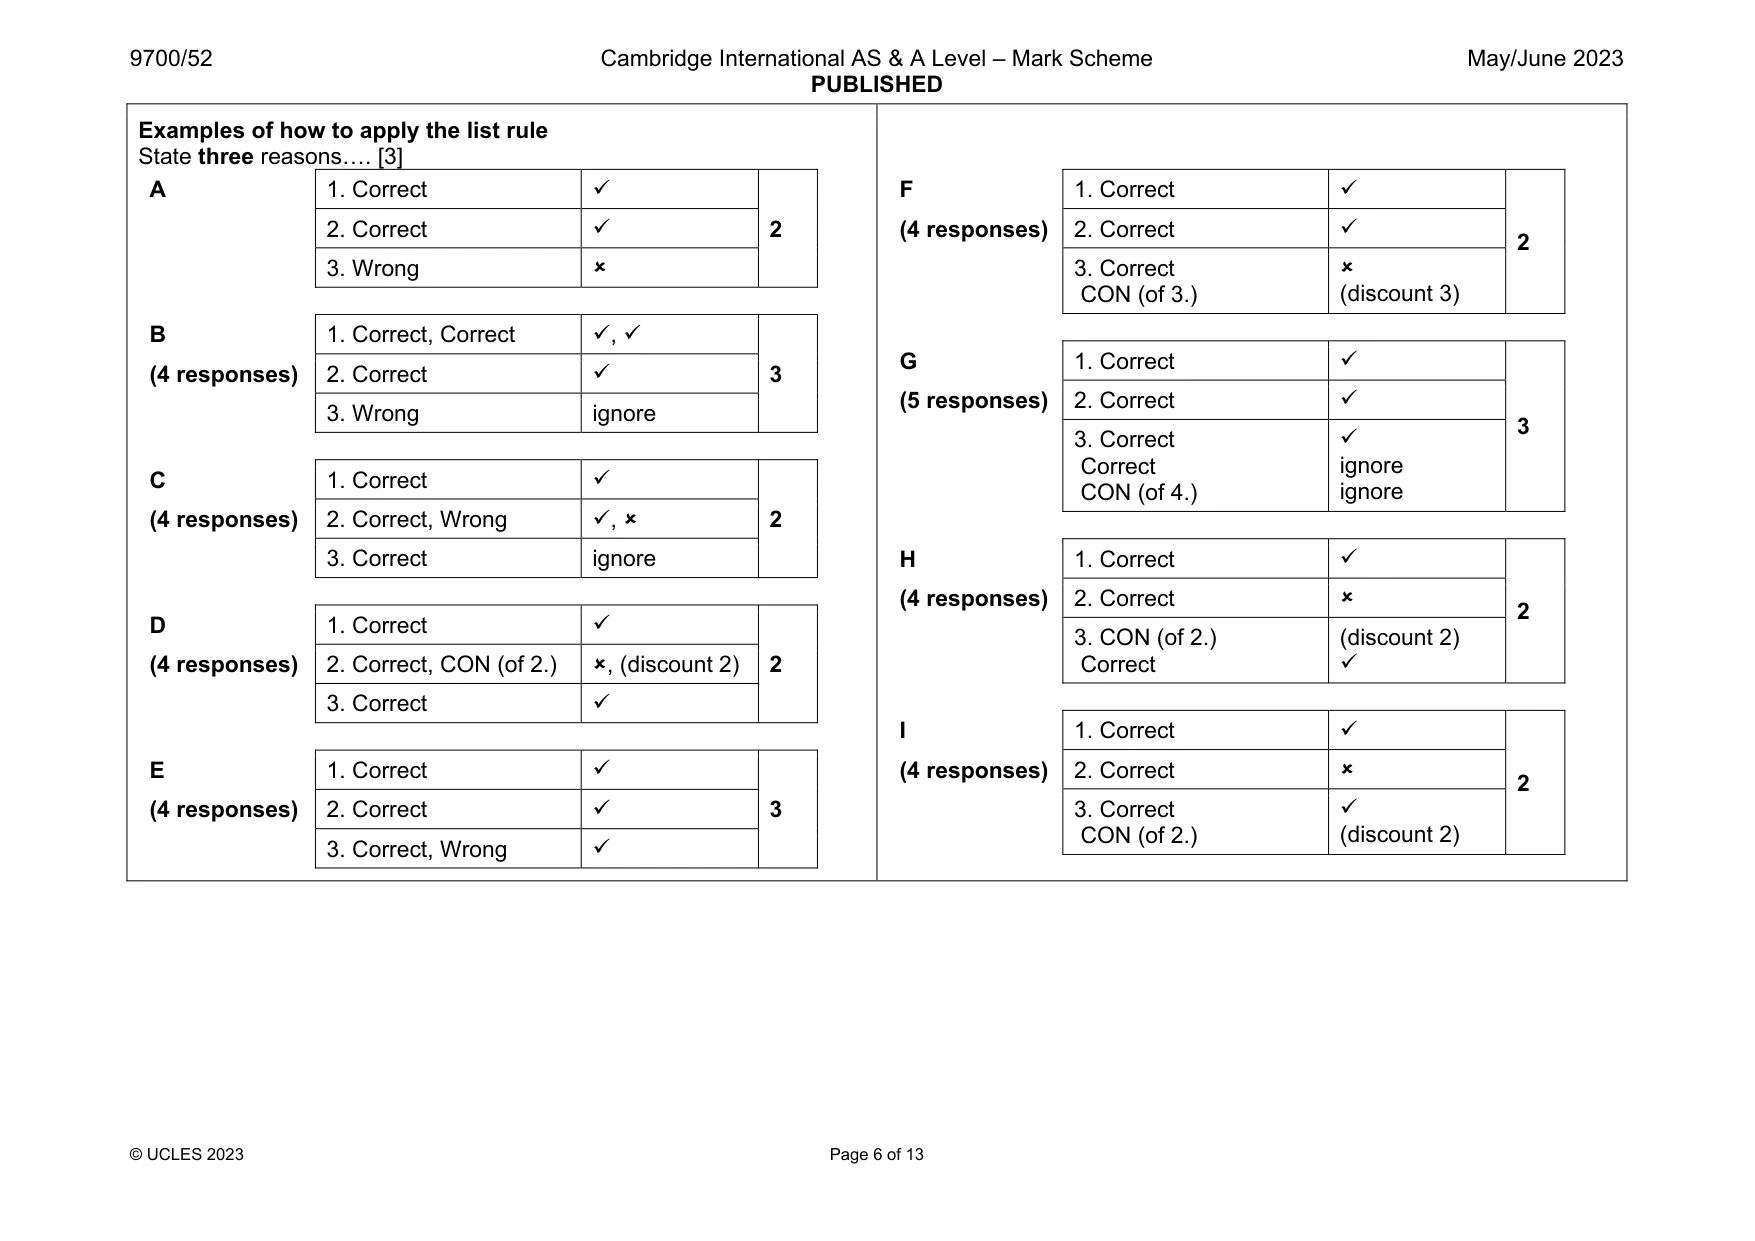
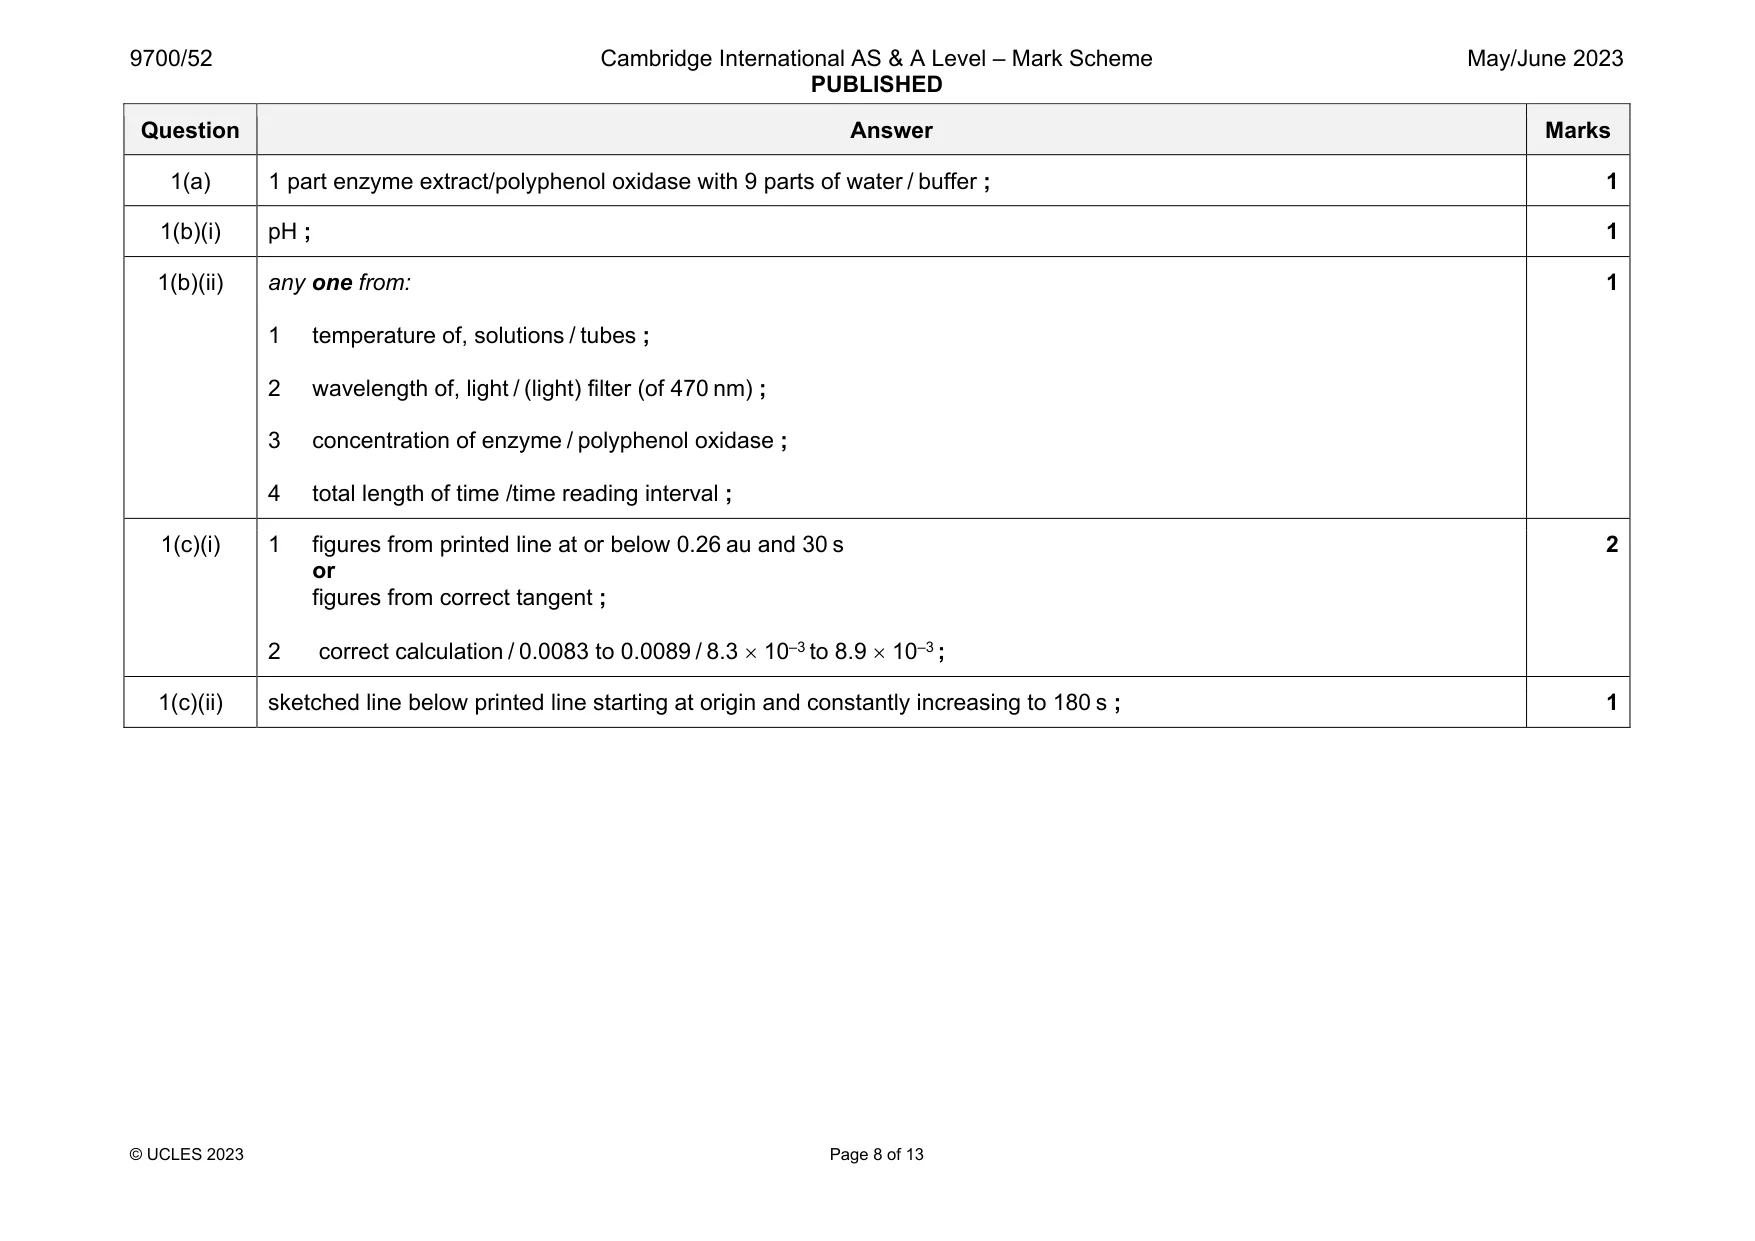
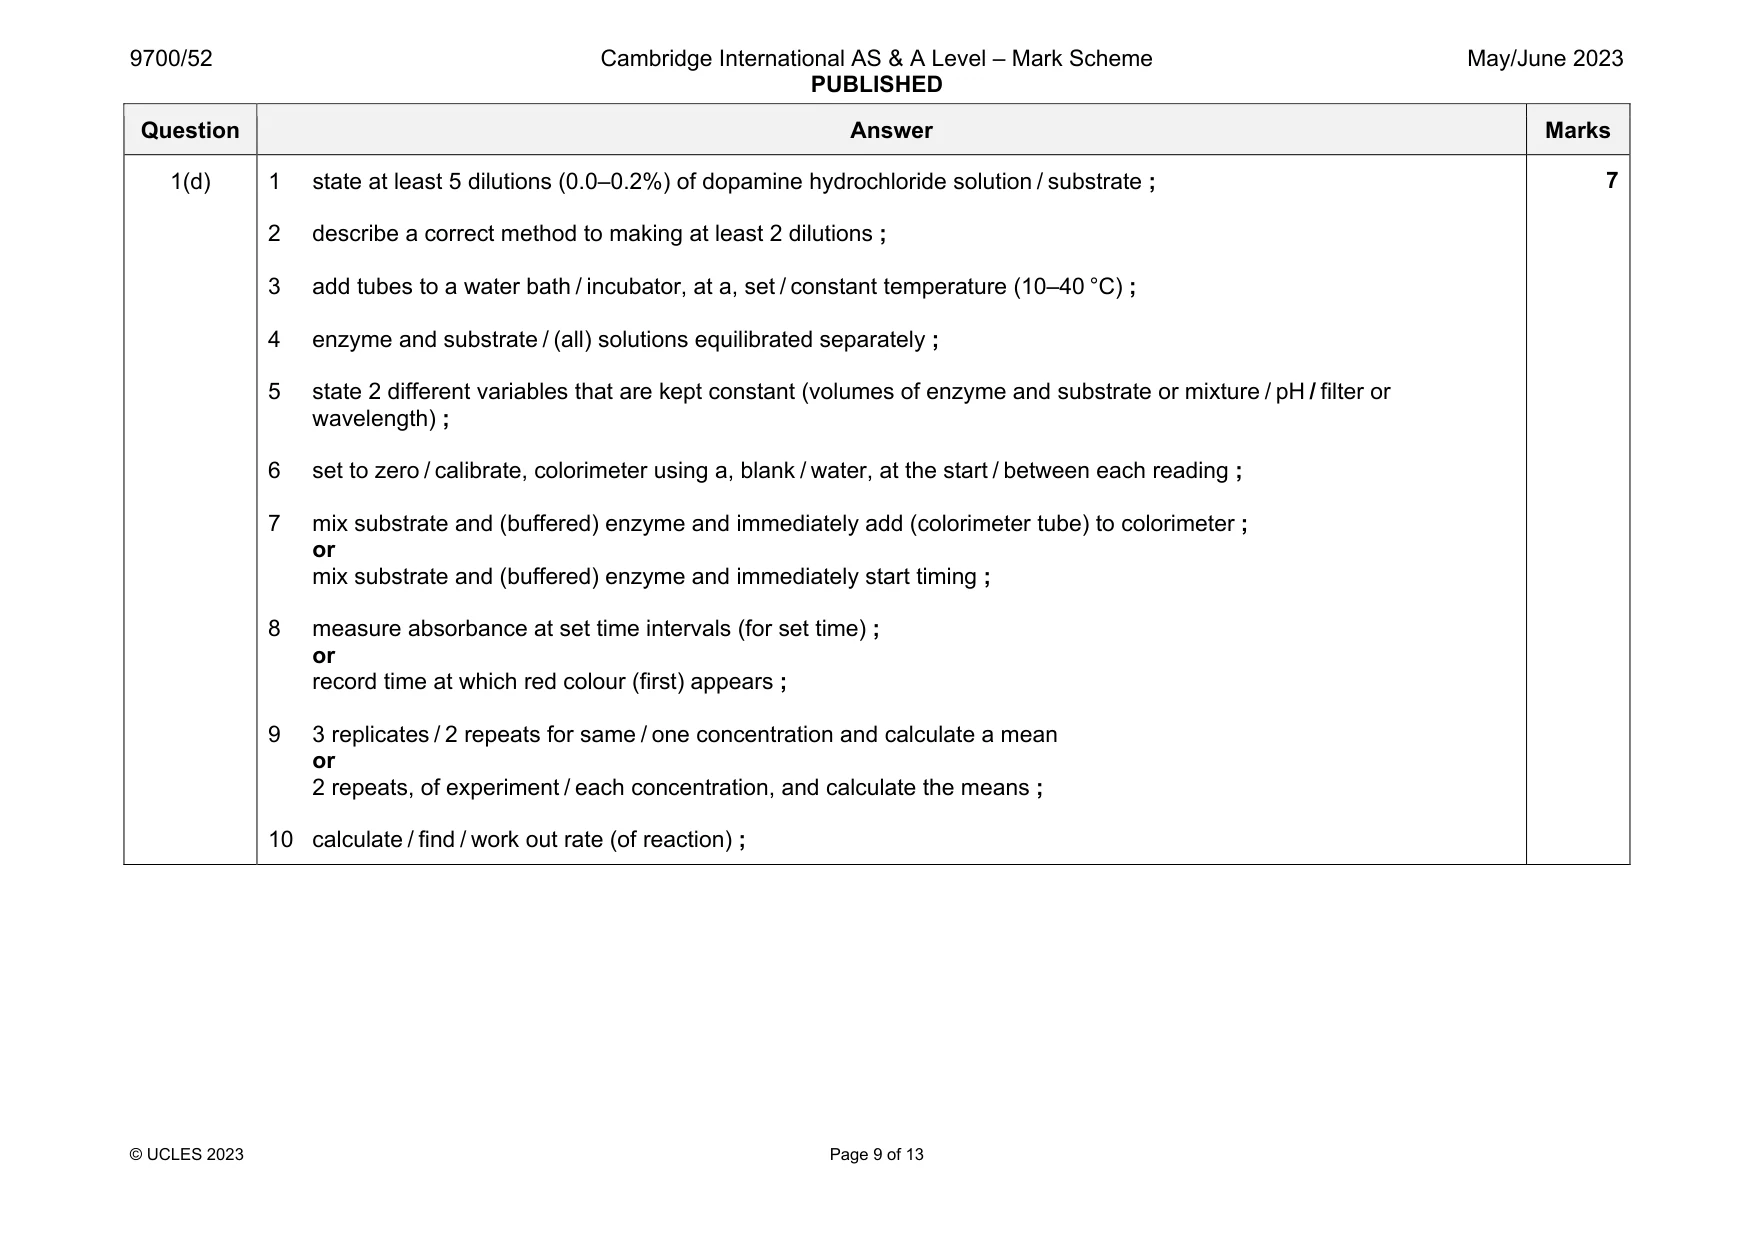
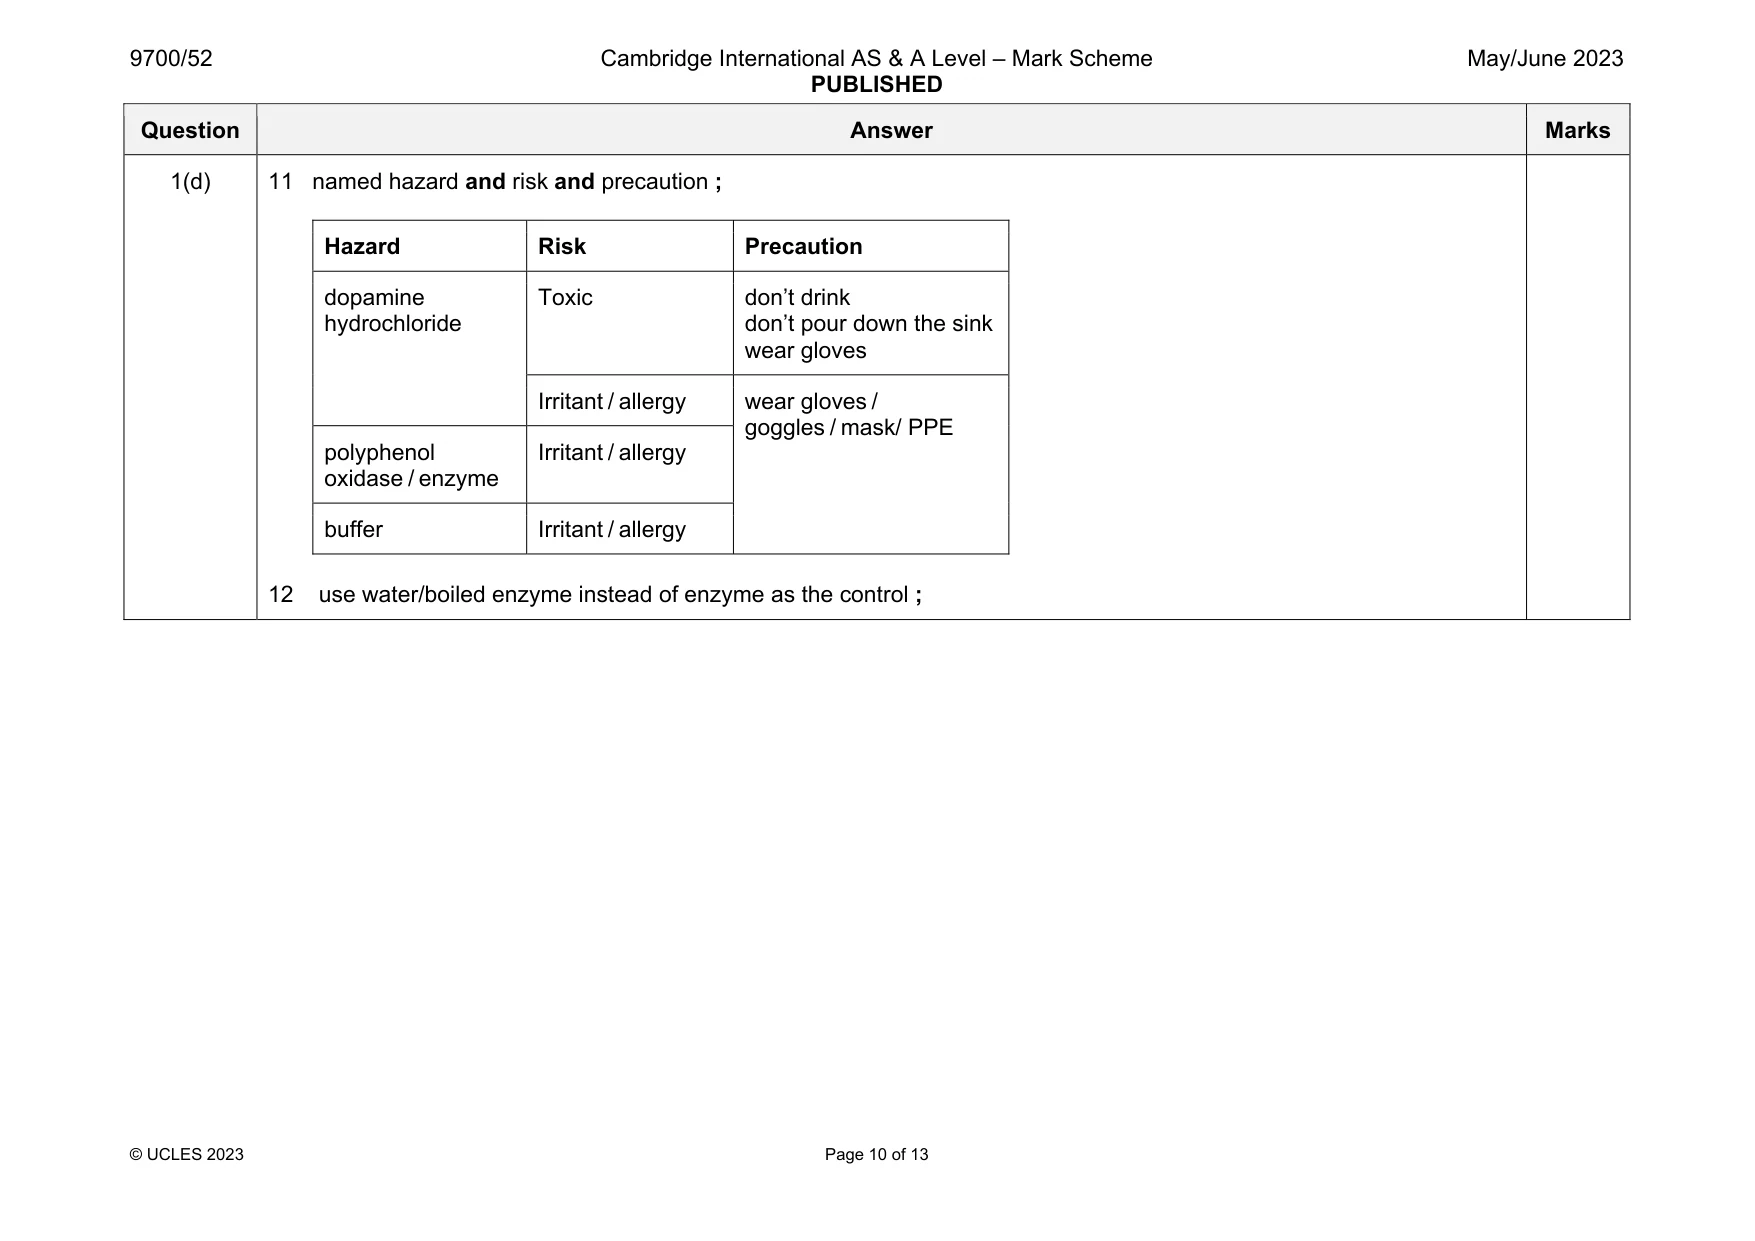
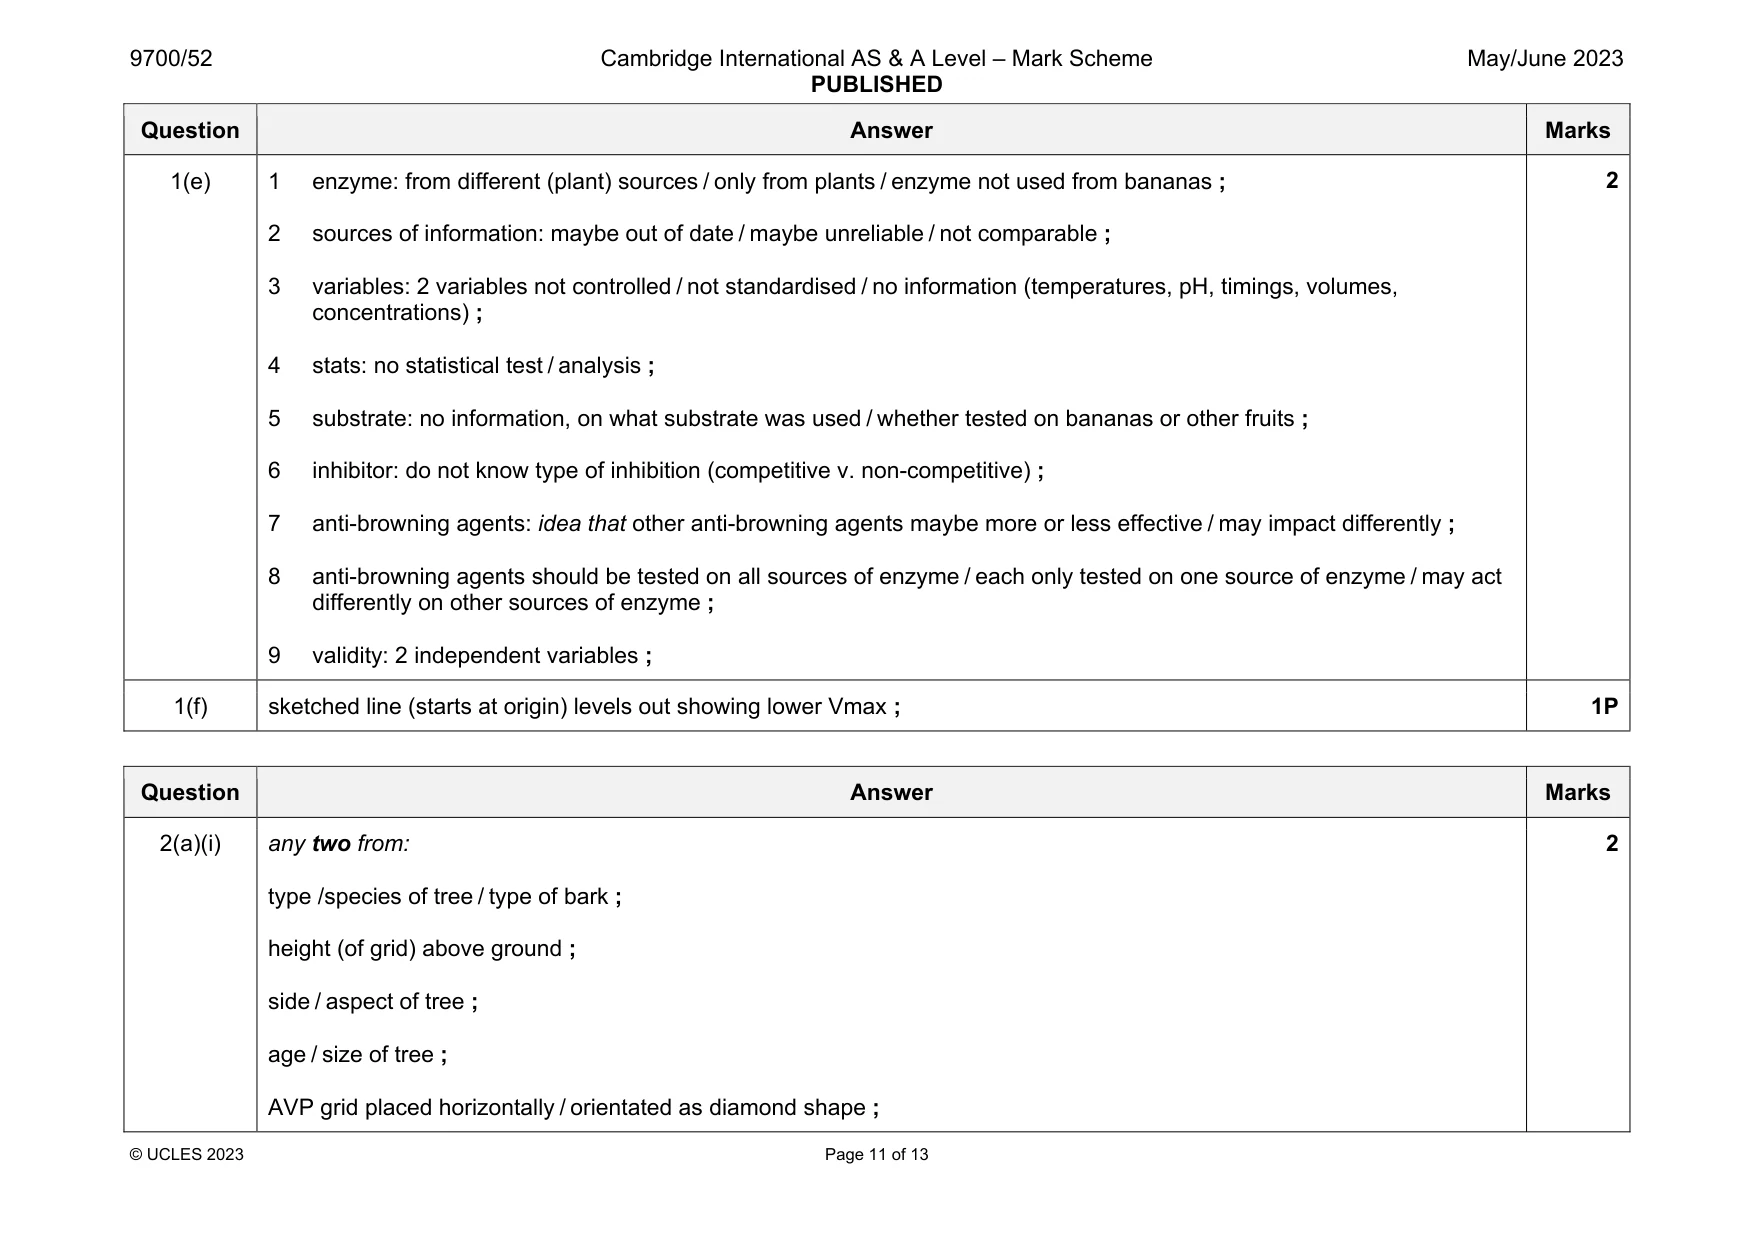
Mark scheme: 1(a) 1 part enzyme extract/polyphenol oxidase with 9 parts of water / buffer ; 1 1(b)(i) pH ; 1 1(b)(ii) any one from: 1 temperature of, solutions / tubes ; 2 wavelength of, light / (light) filter (of 470 nm) ; 3 concentration of enzyme / polyphenol oxidase ; 4 total length of time /time reading interval ; 1 1(c)(i) 1 figures from printed line at or below 0.26 au and 30 s or figures from correct tangent ; 2 correct calculation / 0.0083 to 0.0089 / 8.3 10–3 to 8.9 10–3 ; 2 1(c)(ii) sketched line below printed line starting at origin and constantly increasing to 180 s ; 1 Question Answer Marks 1(d) 1 state at least 5 dilutions (0.0–0.2%) of dopamine hydrochloride solution / substrate ; 2 describe a correct method to making at least 2 dilutions ; 3 add tubes to a water bath / incubator, at a, set / constant temperature (10–40 °C) ; 4 enzyme and substrate / (all) solutions equilibrated separately ; 5 state 2 different variables that are kept constant (volumes of enzyme and substrate or mixture / pH / filter or wavelength) ; 6 set to zero / calibrate, colorimeter using a, blank / water, at the start / between each reading ; 7 mix substrate and (buffered) enzyme and immediately add (colorimeter tube) to colorimeter ; or mix substrate and (buffered) enzyme and immediately start timing ; 8 measure absorbance at set time intervals (for set time) ; or record time at which red colour (first) appears ; 9 3 replicates / 2 repeats for same / one concentration and calculate a mean or 2 repeats, of experiment / each concentration, and calculate the means ; 10 calculate / find / work out rate (of reaction) ; 7 Question Answer Marks 1(d) 11 named hazard and risk and precaution ; Hazard Risk Precaution dopamine hydrochloride Toxic don’t drink don’t pour down the sink wear gloves Irritant / allergy wear gloves / goggles / mask/ PPE polyphenol oxidase / enzyme Irritant / allergy buffer Irritant / allergy 12 use water/boiled enzyme instead of enzyme as the control ; Question Answer Marks 1(e) 1 enzyme: from different (plant) sources / only from plants / enzyme not used from bananas ; 2 sources of information: maybe out of date / maybe unreliable / not comparable ; 3 variables: 2 variables not controlled / not standardised / no information (temperatures, pH, timings, volumes, concentrations) ; 4 stats: no statistical test / analysis ; 5 substrate: no information, on what substrate was used / whether tested on bananas or other fruits ; 6 inhibitor: do not know type of inhibition (competitive v. non-competitive) ; 7 anti-browning agents: idea that other anti-browning agents maybe more or less effective / may impact differently ; 8 anti-browning agents should be tested on all sources of enzyme / each only tested on one source of enzyme / may act differently on other sources of enzyme ; 9 validity: 2 independent variables ; 2 1(f) sketched line (starts at origin) levels out showing lower Vmax ; 1P
Q2 · Air pollution due to motor vehicles is an environmental issue that needs constant…
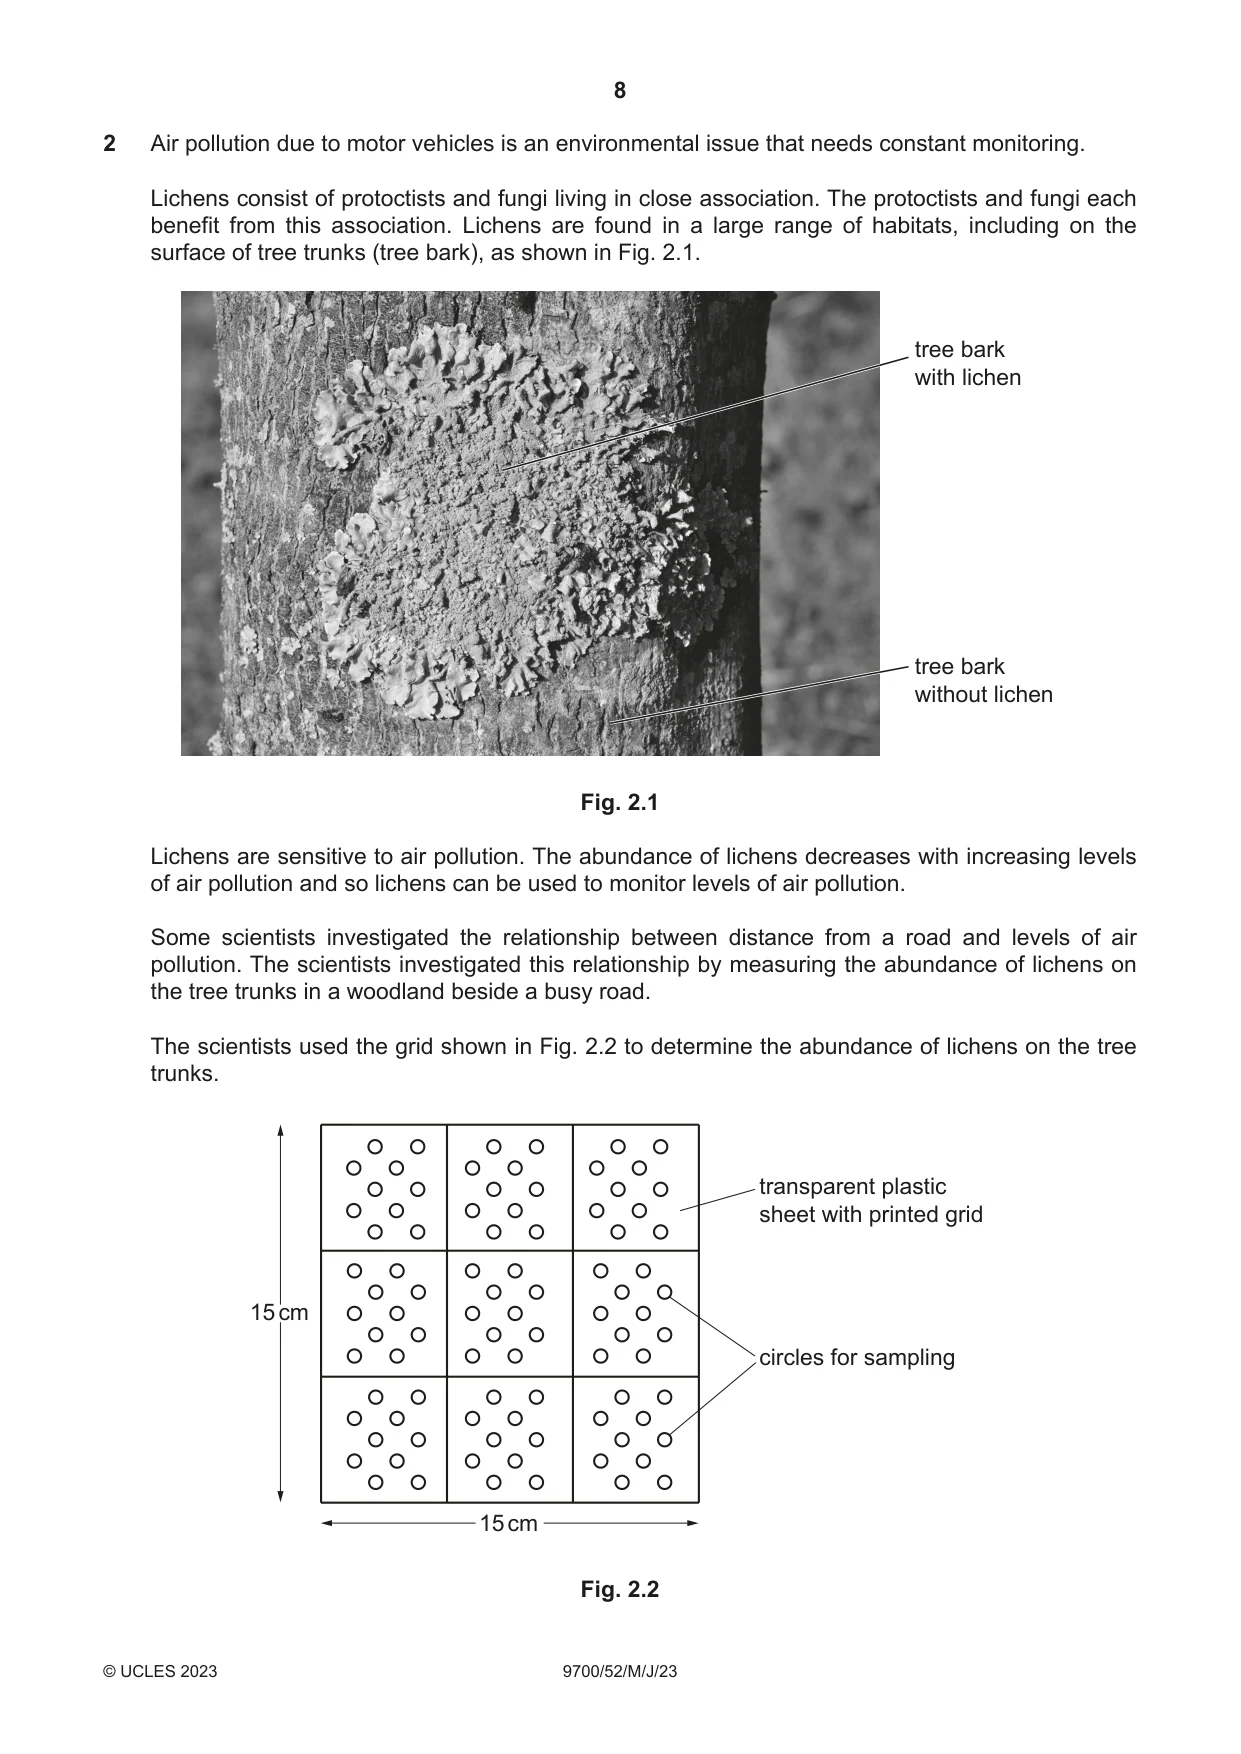
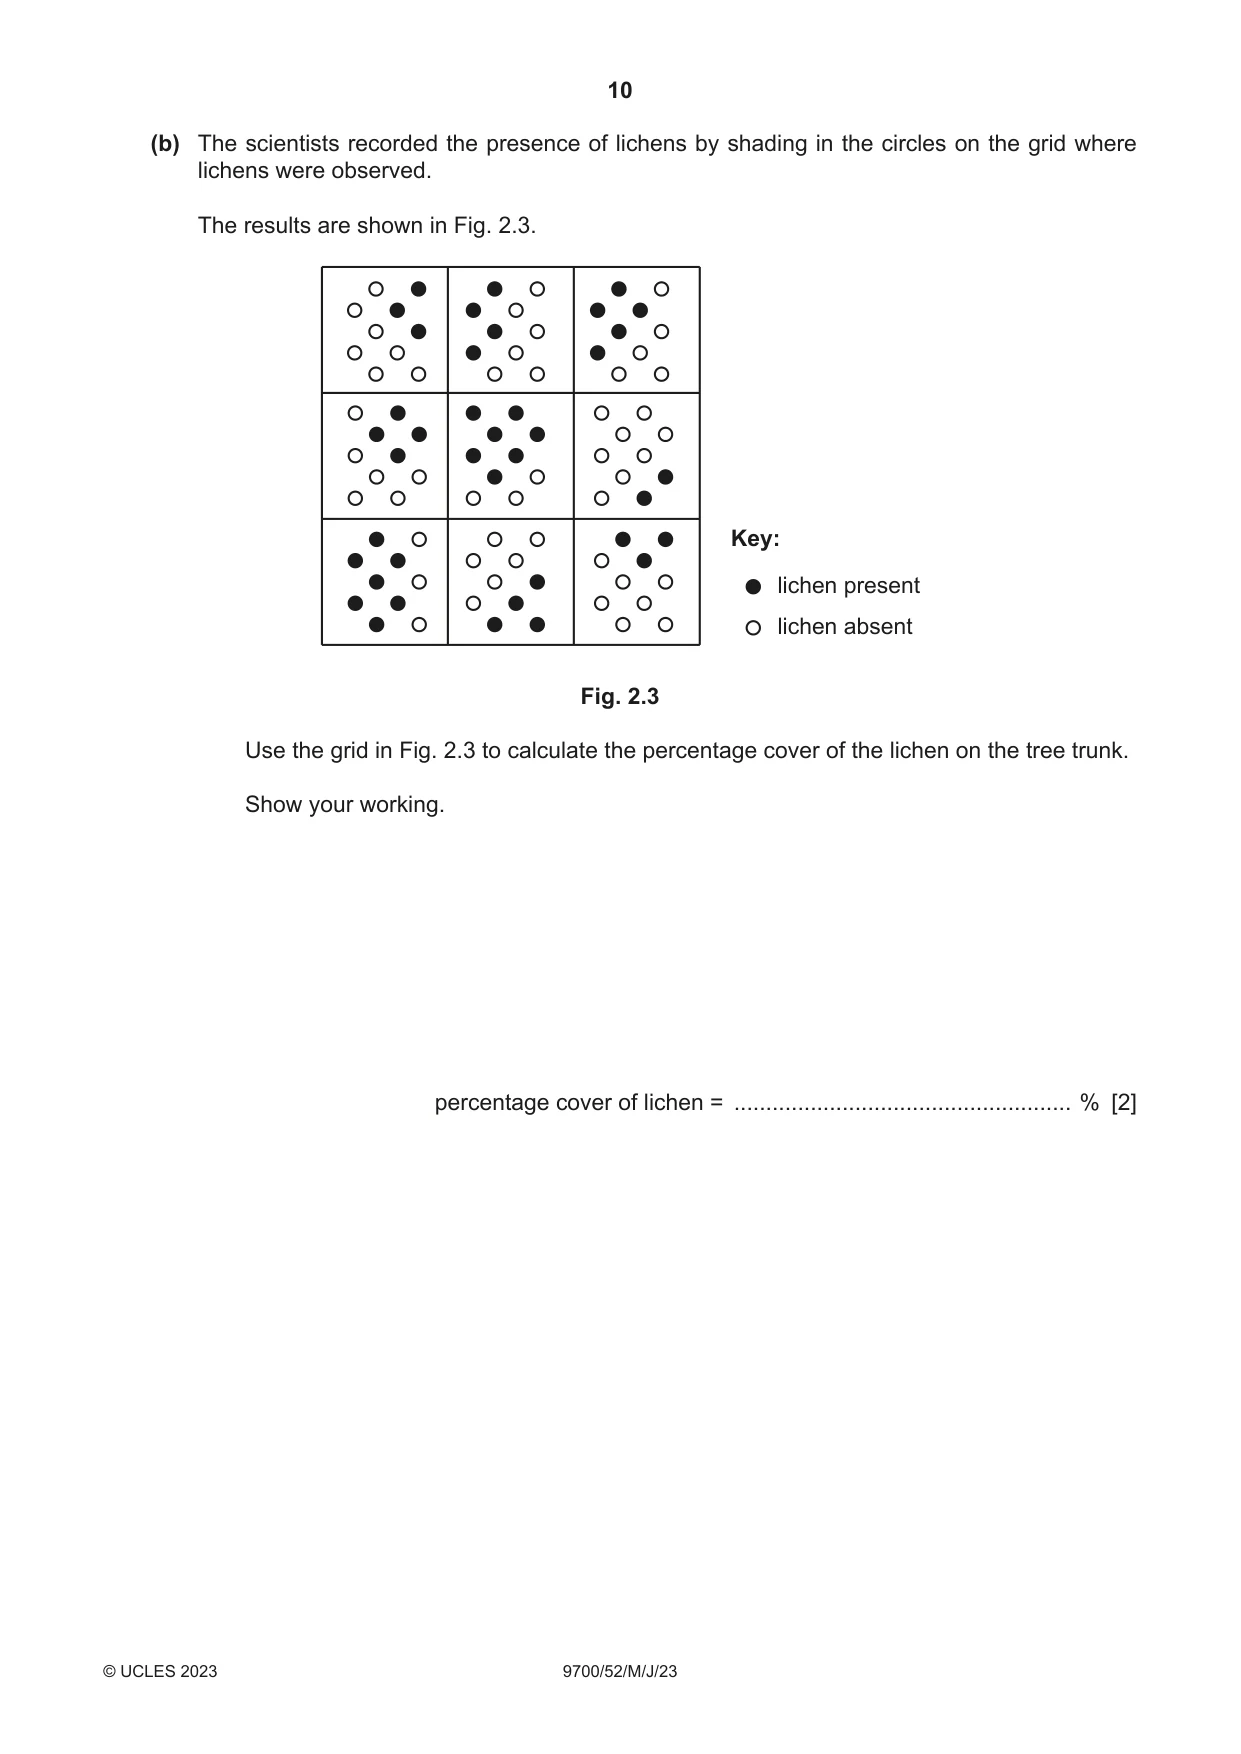
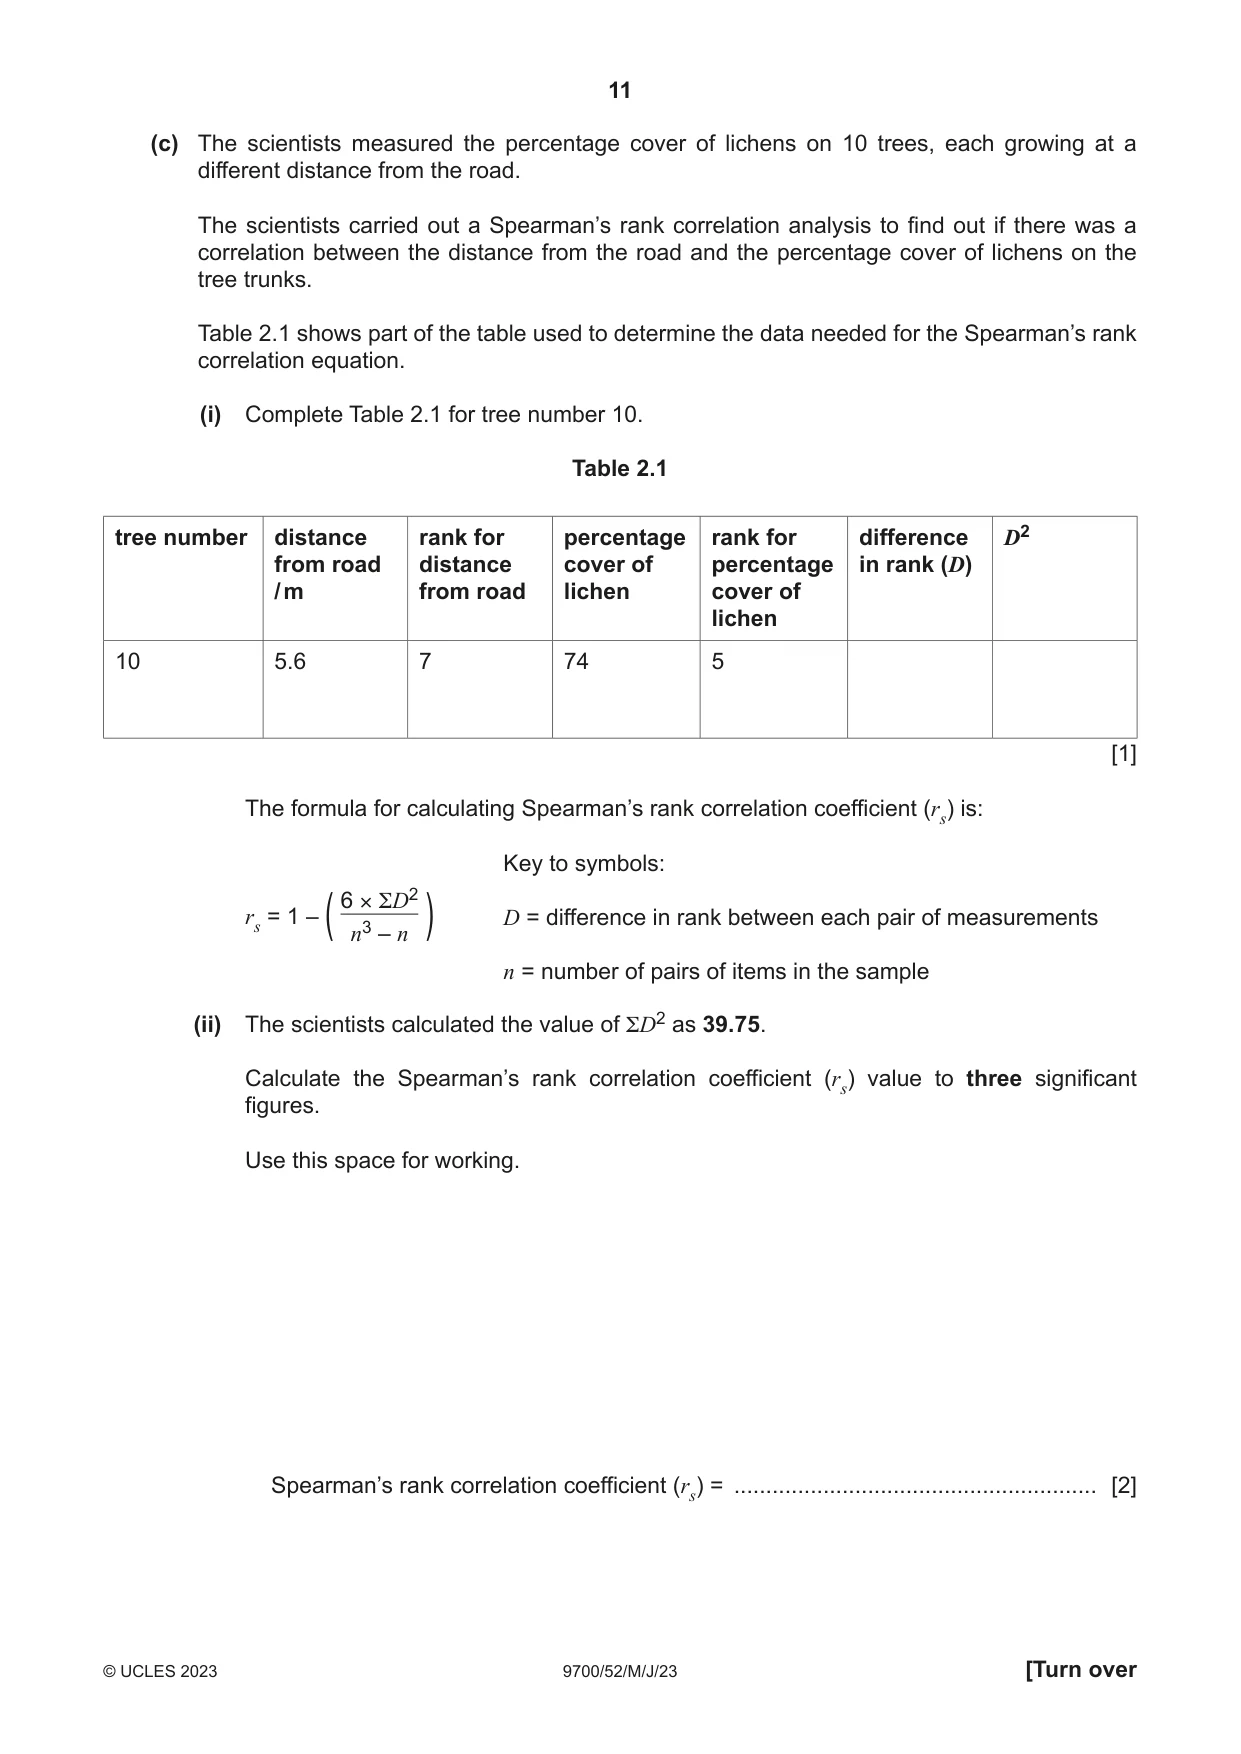
2 Air pollution due to motor vehicles is an environmental issue that needs constant monitoring. Lichens consist of protoctists and fungi living in close association. The protoctists and fungi each benefit from this association. Lichens are found in a large range of habitats, including on the surface of tree trunks (tree bark), as shown in Fig. 2.1. tree bark with lichen tree bark without lichen Fig. 2.1 Lichens are sensitive to air pollution. The abundance of lichens decreases with increasing levels of air pollution and so lichens can be used to monitor levels of air pollution. Some scientists investigated the relationship between distance from a road and levels of air pollution. The scientists investigated this relationship by measuring the abundance of lichens on the tree trunks in a woodland beside a busy road. The scientists used the grid shown in Fig. 2.2 to determine the abundance of lichens on the tree trunks. transparent plastic sheet with printed grid 15 cm circles for sampling 15 cm Fig. 2.2 For each tree sampled, the scientists: • placed the grid against the tree trunk • counted the number of circles that contained lichen • used the number of circles that contained lichen to calculate the percentage cover of lichen on the tree • measured the distance from the tree to the road. (a) (i) State two variables that the scientists should standardise in this investigation. ........................................................................................................................................... ........................................................................................................................................... ........................................................................................................................................... ........................................................................................................................................... ..................................................................................................................................... [2] (ii) State one risk and the safety precaution that the scientists should take when measuring the abundance of the lichens on the tree trunks. ........................................................................................................................................... ........................................................................................................................................... ........................................................................................................................................... ........................................................................................................................................... ..................................................................................................................................... [2] (b) The scientists recorded the presence of lichens by shading in the circles on the grid where lichens were observed. The results are shown in Fig. 2.3. Key: lichen present lichen absent Fig. 2.3 Use the grid in Fig. 2.3 to calculate the percentage cover of the lichen on the tree trunk. Show your working. percentage cover of lichen = ..................................................... % [2] (c) The scientists measured the percentage cover of lichens on 10 trees, each growing at a different distance from the road. The scientists carried out a Spearman’s rank correlation analysis to find out if there was a correlation between the distance from the road and the percentage cover of lichens on the tree trunks. Table 2.1 shows part of the table used to determine the data needed for the Spearman’s rank correlation equation. (i) Complete Table 2.1 for tree number 10. Table 2.1 tree number distance rank for percentage rank for difference D2 from road distance cover of percentage in rank (D) / m from road lichen cover of lichen
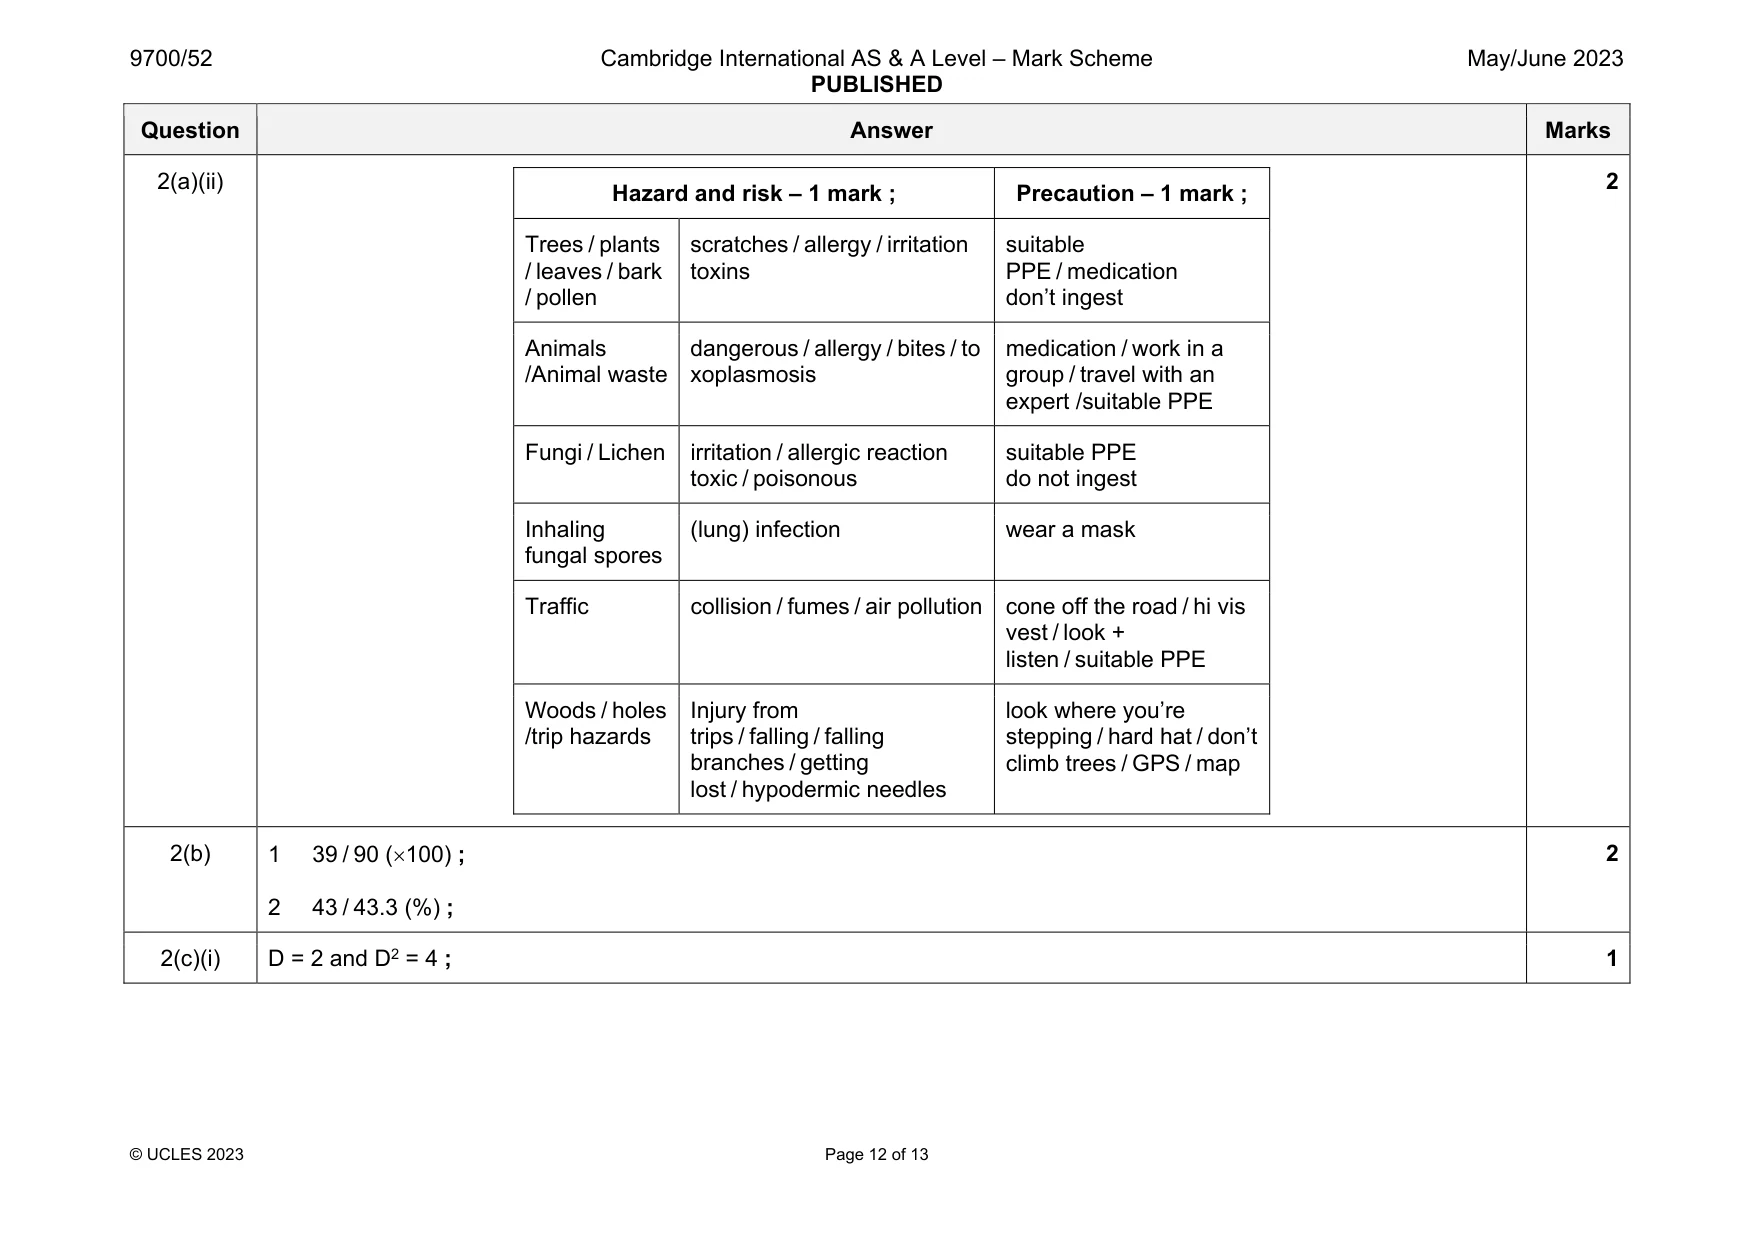
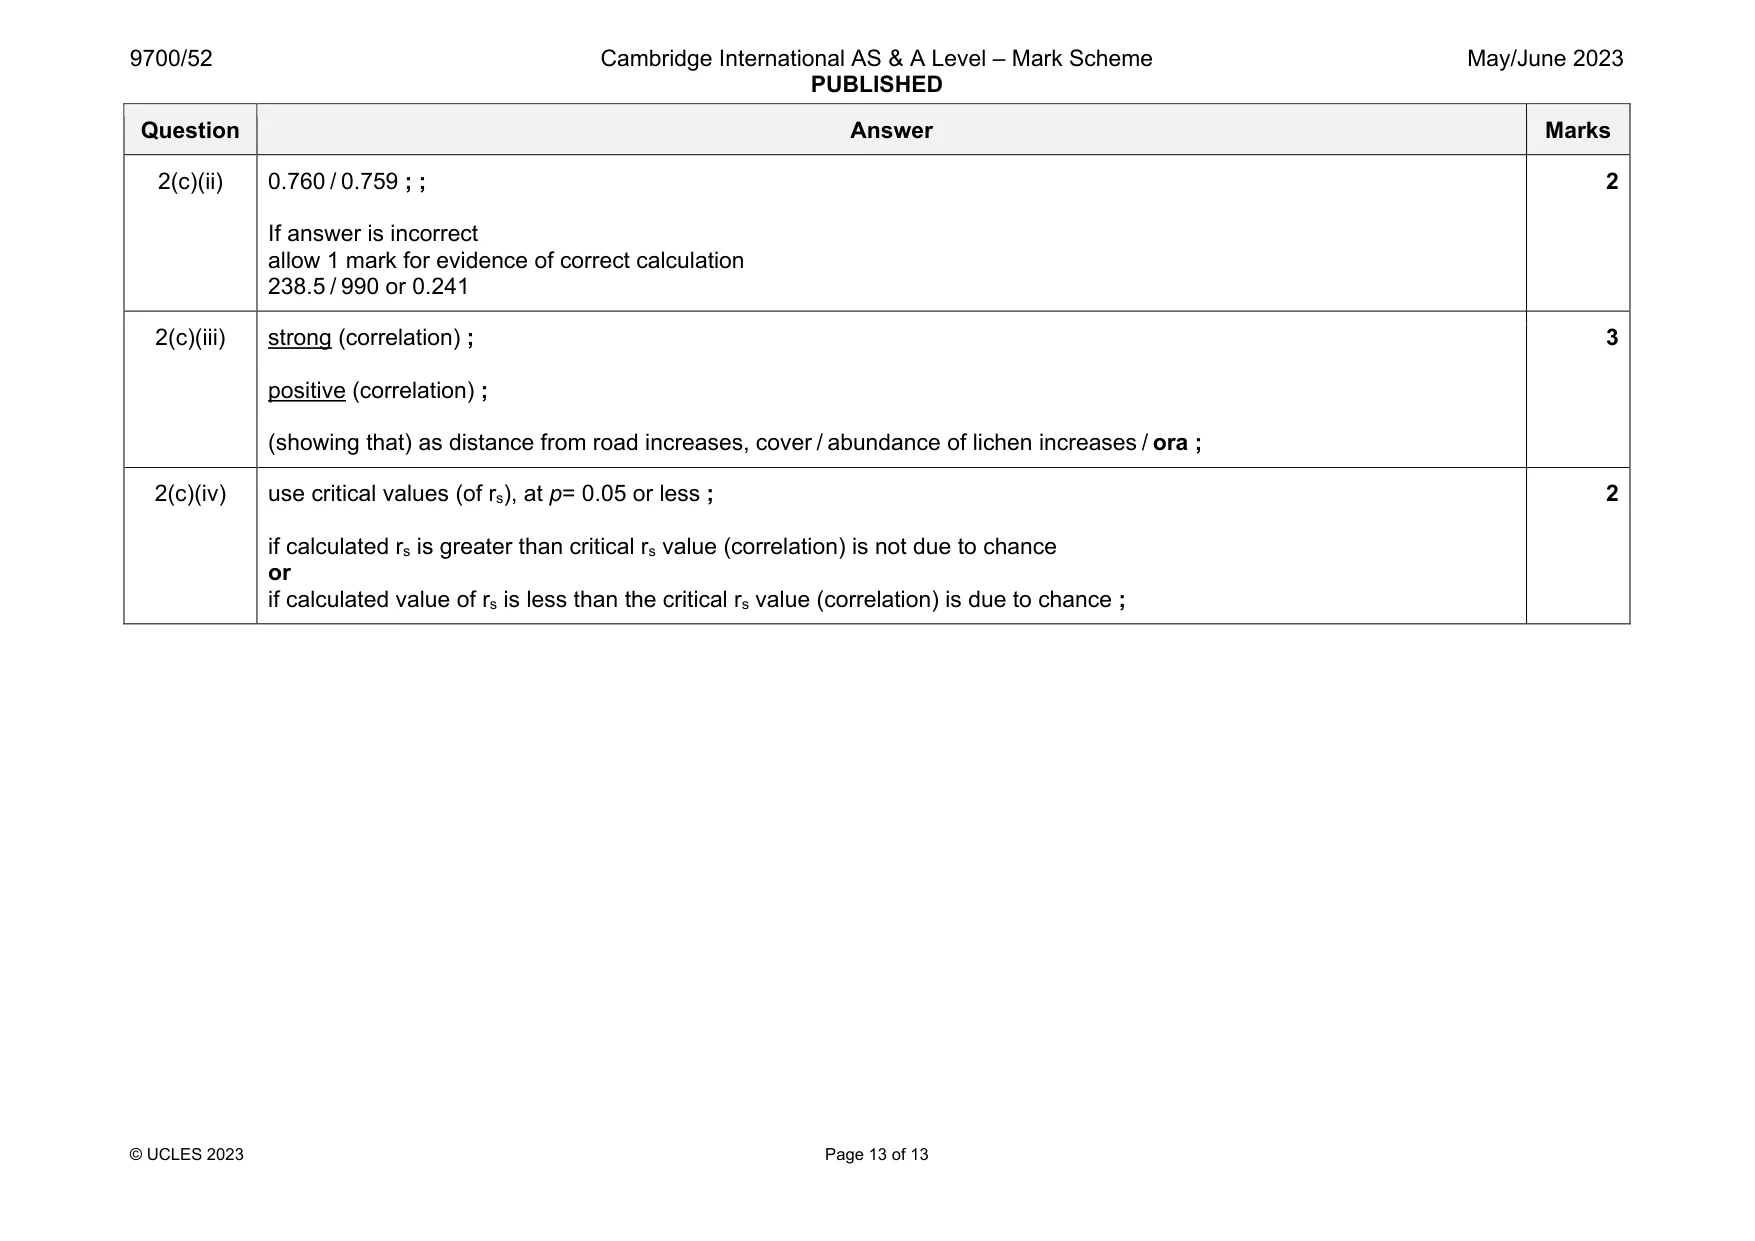
Mark scheme: 2(a)(i) any two from: type /species of tree / type of bark ; height (of grid) above ground ; side / aspect of tree ; age / size of tree ; AVP grid placed horizontally / orientated as diamond shape ; 2 Question Answer Marks 2(a)(ii) Hazard and risk – 1 mark ; Precaution – 1 mark ; Trees / plants / leaves / bark / pollen scratches / allergy / irritation toxins suitable PPE / medication don’t ingest Animals /Animal waste dangerous / allergy / bites / to xoplasmosis medication / work in a group / travel with an expert /suitable PPE Fungi / Lichen irritation / allergic reaction toxic / poisonous suitable PPE do not ingest Inhaling fungal spores (lung) infection wear a mask Traffic collision / fumes / air pollution cone off the road / hi vis vest / look + listen / suitable PPE Woods / holes /trip hazards Injury from trips / falling / falling branches / getting lost / hypodermic needles look where you’re stepping / hard hat / don’t climb trees / GPS / map 2 2(b) 1 39 / 90 (100) ; 2 43 / 43.3 (%) ; 2 2(c)(i) D = 2 and D2 = 4 ; 1 Question Answer Marks 2(c)(ii) 0.760 / 0.759 ; ; If answer is incorrect allow 1 mark for evidence of correct calculation 238.5 / 990 or 0.241 2 2(c)(iii) strong (correlation) ; positive (correlation) ; (showing that) as distance from road increases, cover / abundance of lichen increases / ora ; 3 2(c)(iv) use critical values (of rs), at p= 0.05 or less ; if calculated rs is greater than critical rs value (correlation) is not due to chance or if calculated value of rs is less than the critical rs value (correlation) is due to chance ; 2
Q10 · 5.6 7 74 5 [1] The formula for calculating Spearman’s rank correlation coefficient (rs)…
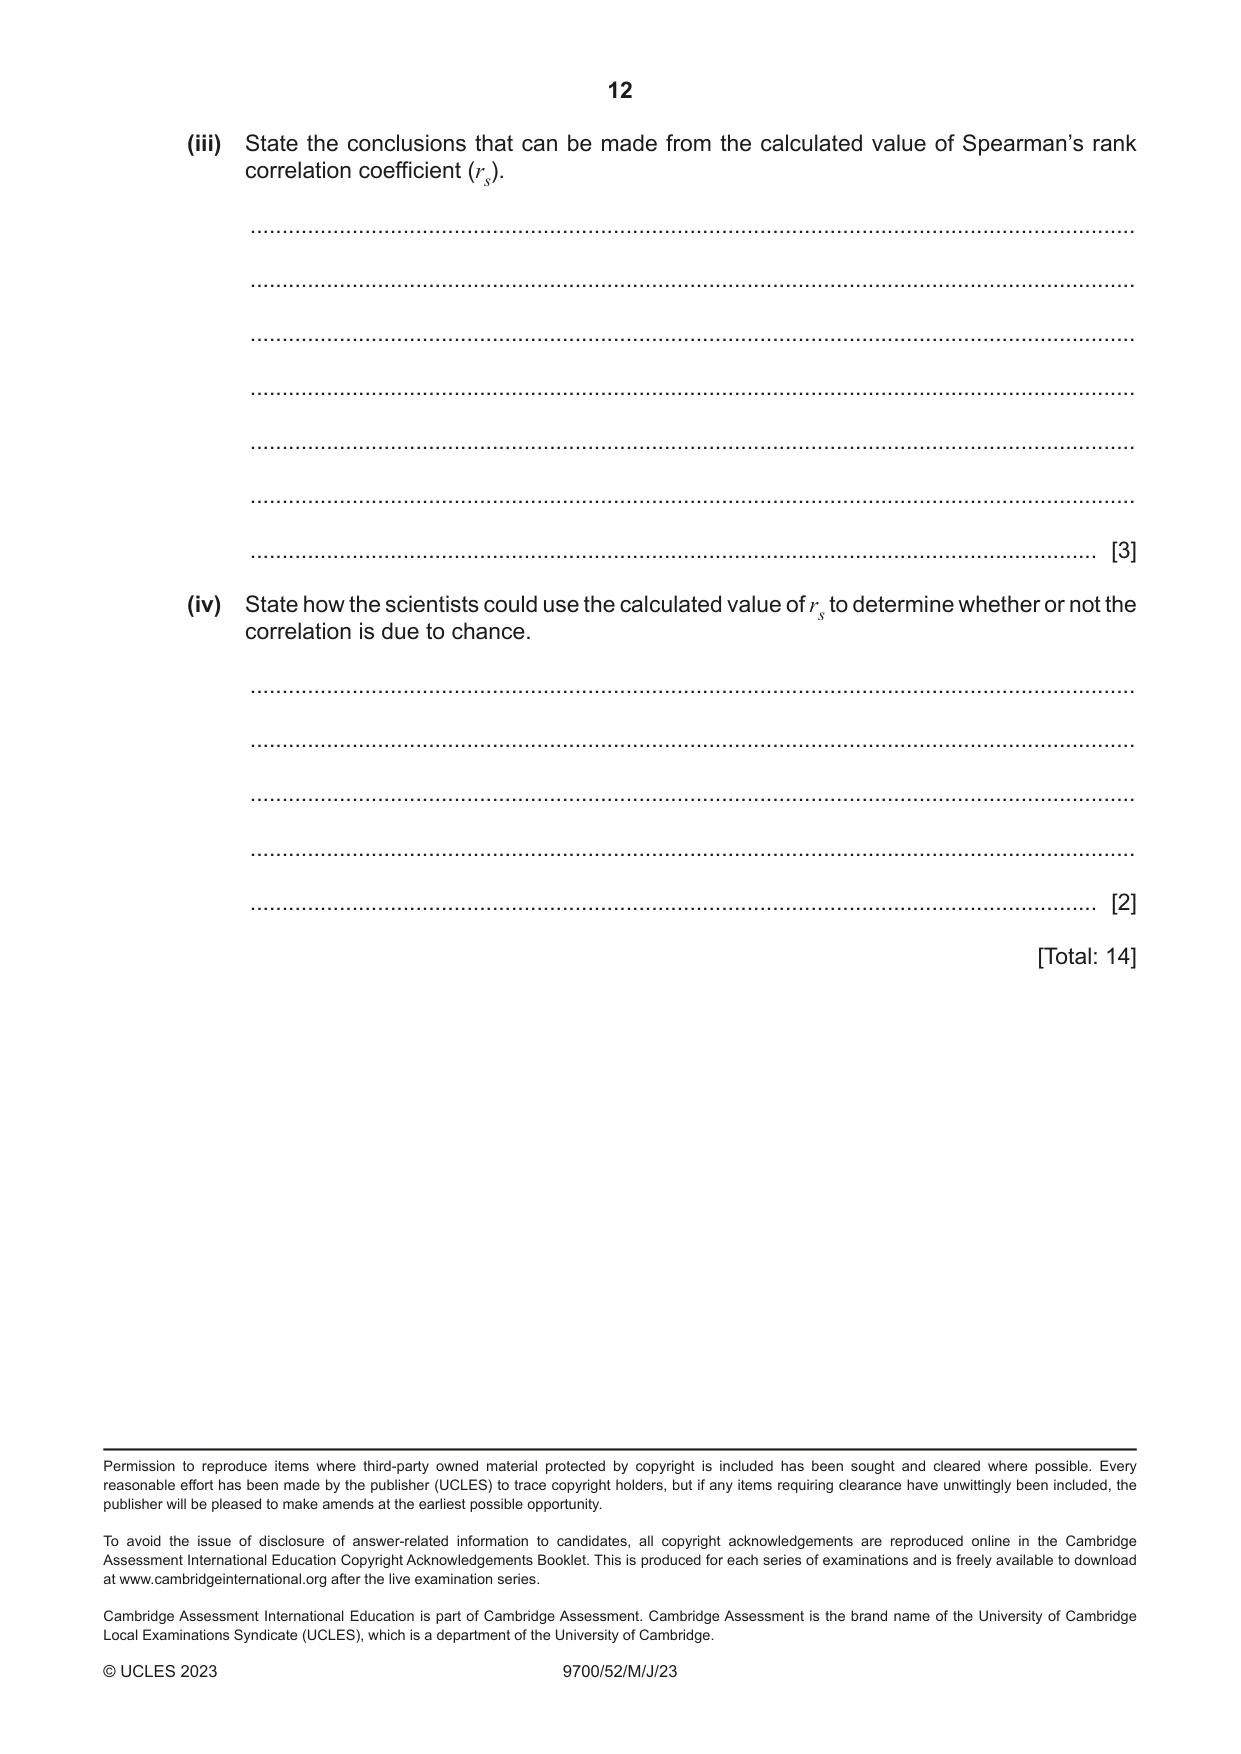
10 5.6 7 74 5 [1] The formula for calculating Spearman’s rank correlation coefficient (rs) is: Key to symbols: 6 × ΣD2 rs = 1 – D = difference in rank between each pair of measurements ( n3 – n ) n = number of pairs of items in the sample (ii) The scientists calculated the value of ΣD2 as 39.75. Calculate the Spearman’s rank correlation coefficient (rs) value to three significant figures. Use this space for working. Spearman’s rank correlation coefficient (rs) = ......................................................... [2] (iii) State the conclusions that can be made from the calculated value of Spearman’s rank correlation coefficient (rs). ........................................................................................................................................... ........................................................................................................................................... ........................................................................................................................................... ........................................................................................................................................... ........................................................................................................................................... ........................................................................................................................................... ..................................................................................................................................... [3] (iv) State how the scientists could use the calculated value of rs to determine whether or not the correlation is due to chance. ........................................................................................................................................... ........................................................................................................................................... ........................................................................................................................................... ........................................................................................................................................... ..................................................................................................................................... [2] [Total: 14]
What was in this paper
The subtopics covered by these 3 questions, and how many questions each got. Open one in a new tab to see every Cambridge question on it.
What you needed in this session
Cambridge’s own grade thresholds for 2023 May/June, Paper 5 · Variant 2. A higher threshold means an easier paper — the bar moves with how the cohort did.