Cambridge A Level Biology 9700 — 2022 Oct/Nov Paper 5 · Variant 2
9700/52/O/N/22 · 2 questions · 30 marks · ≈34 min
The question paper and its mark scheme, free to read here and free to download. This is Cambridge’s own paper, exactly as it was sat.
Question paper12 pages


Mark scheme10 pages
Answers below. Sit the paper first if you are practising.
Questions as text
Q1 · Egg albumen (egg white) is a good source of protein
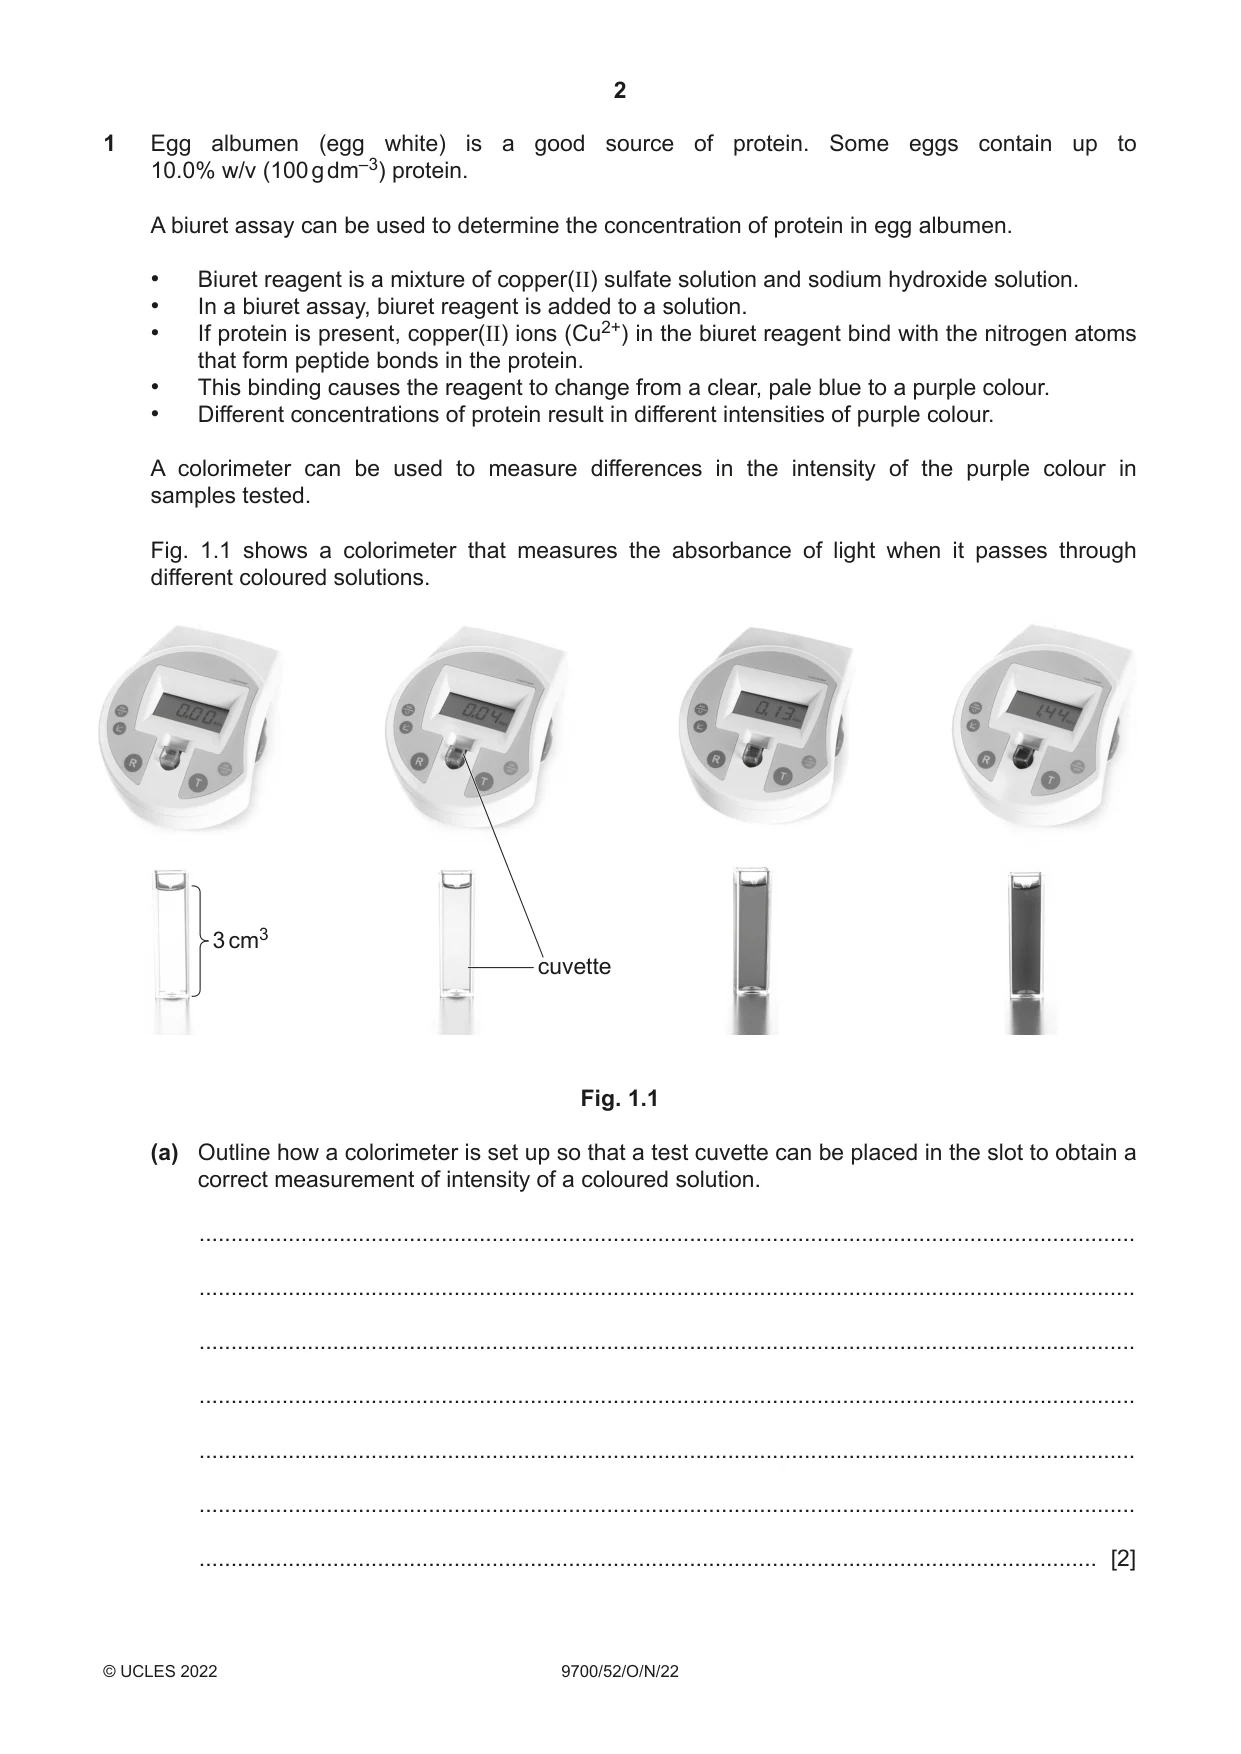
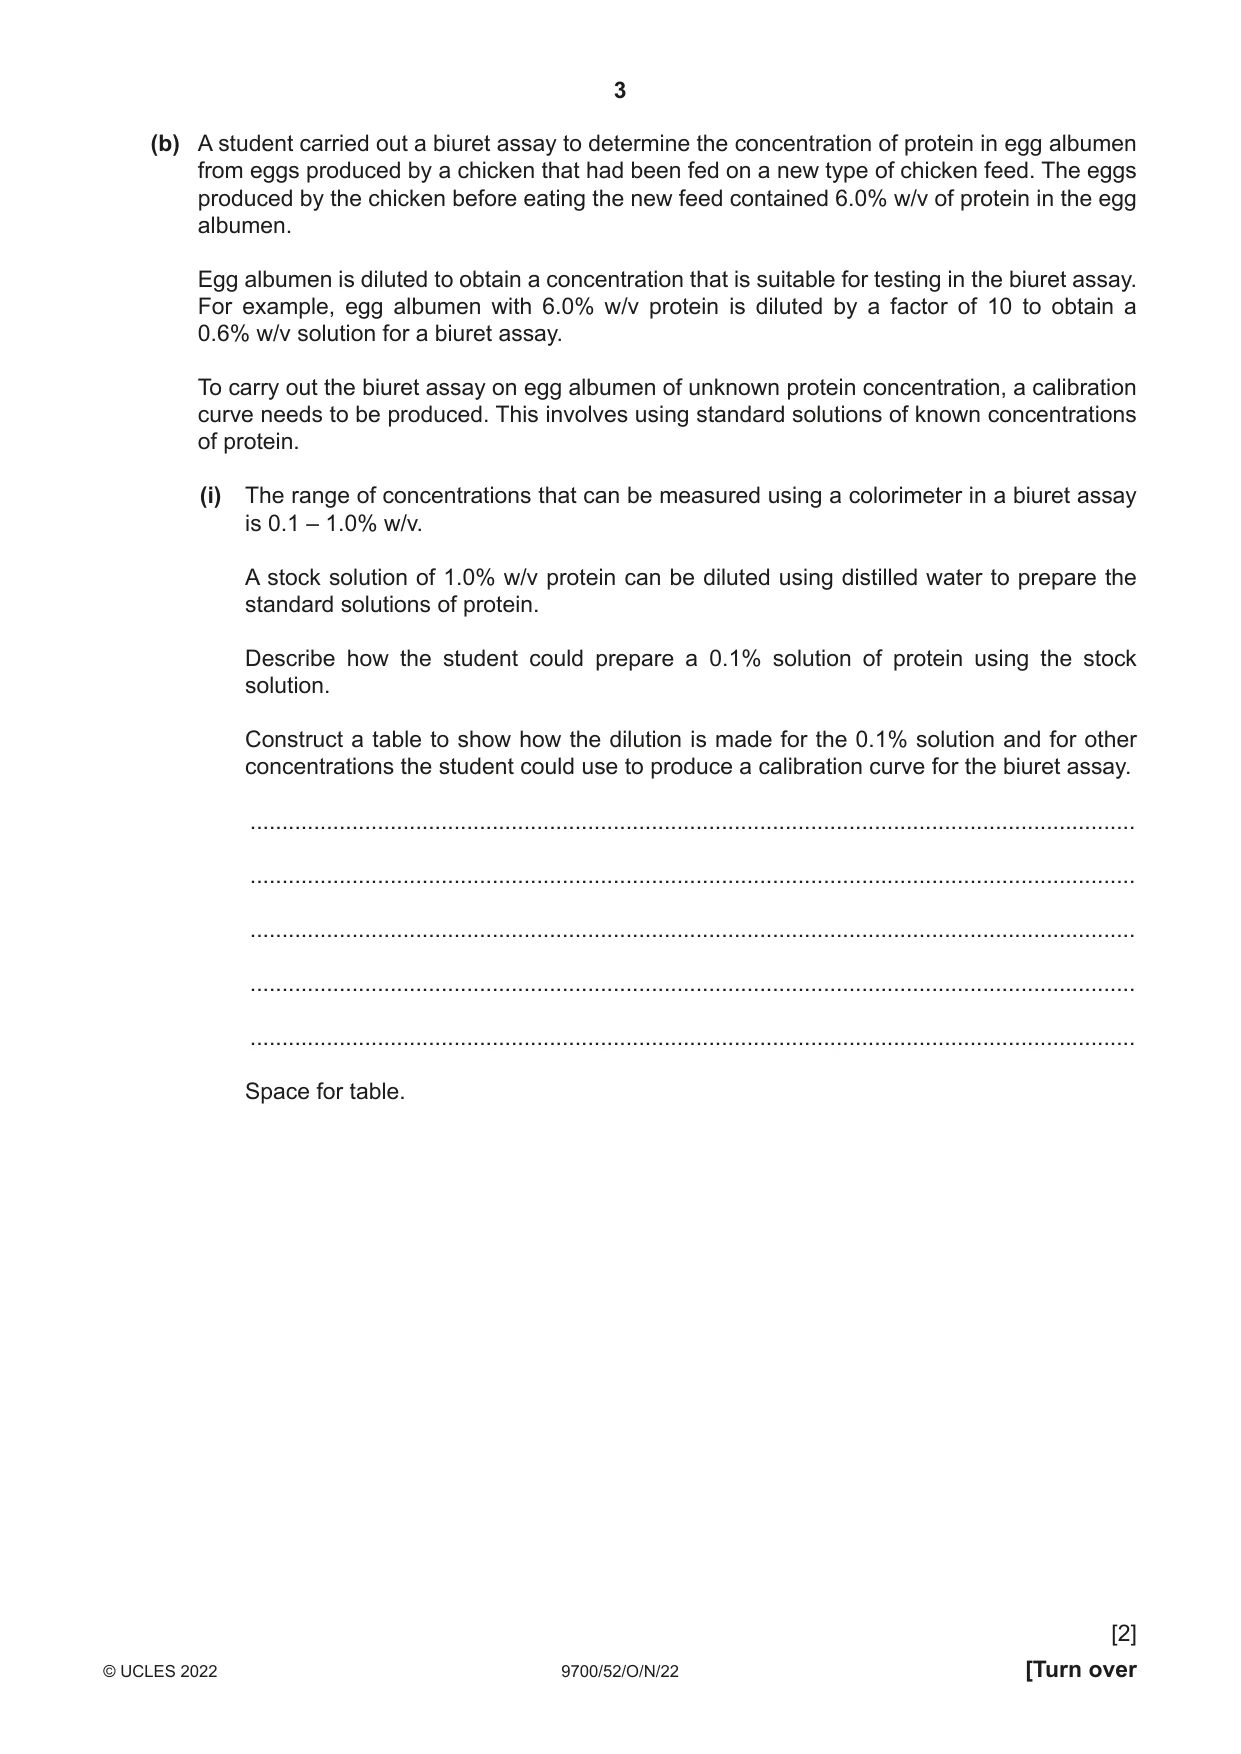
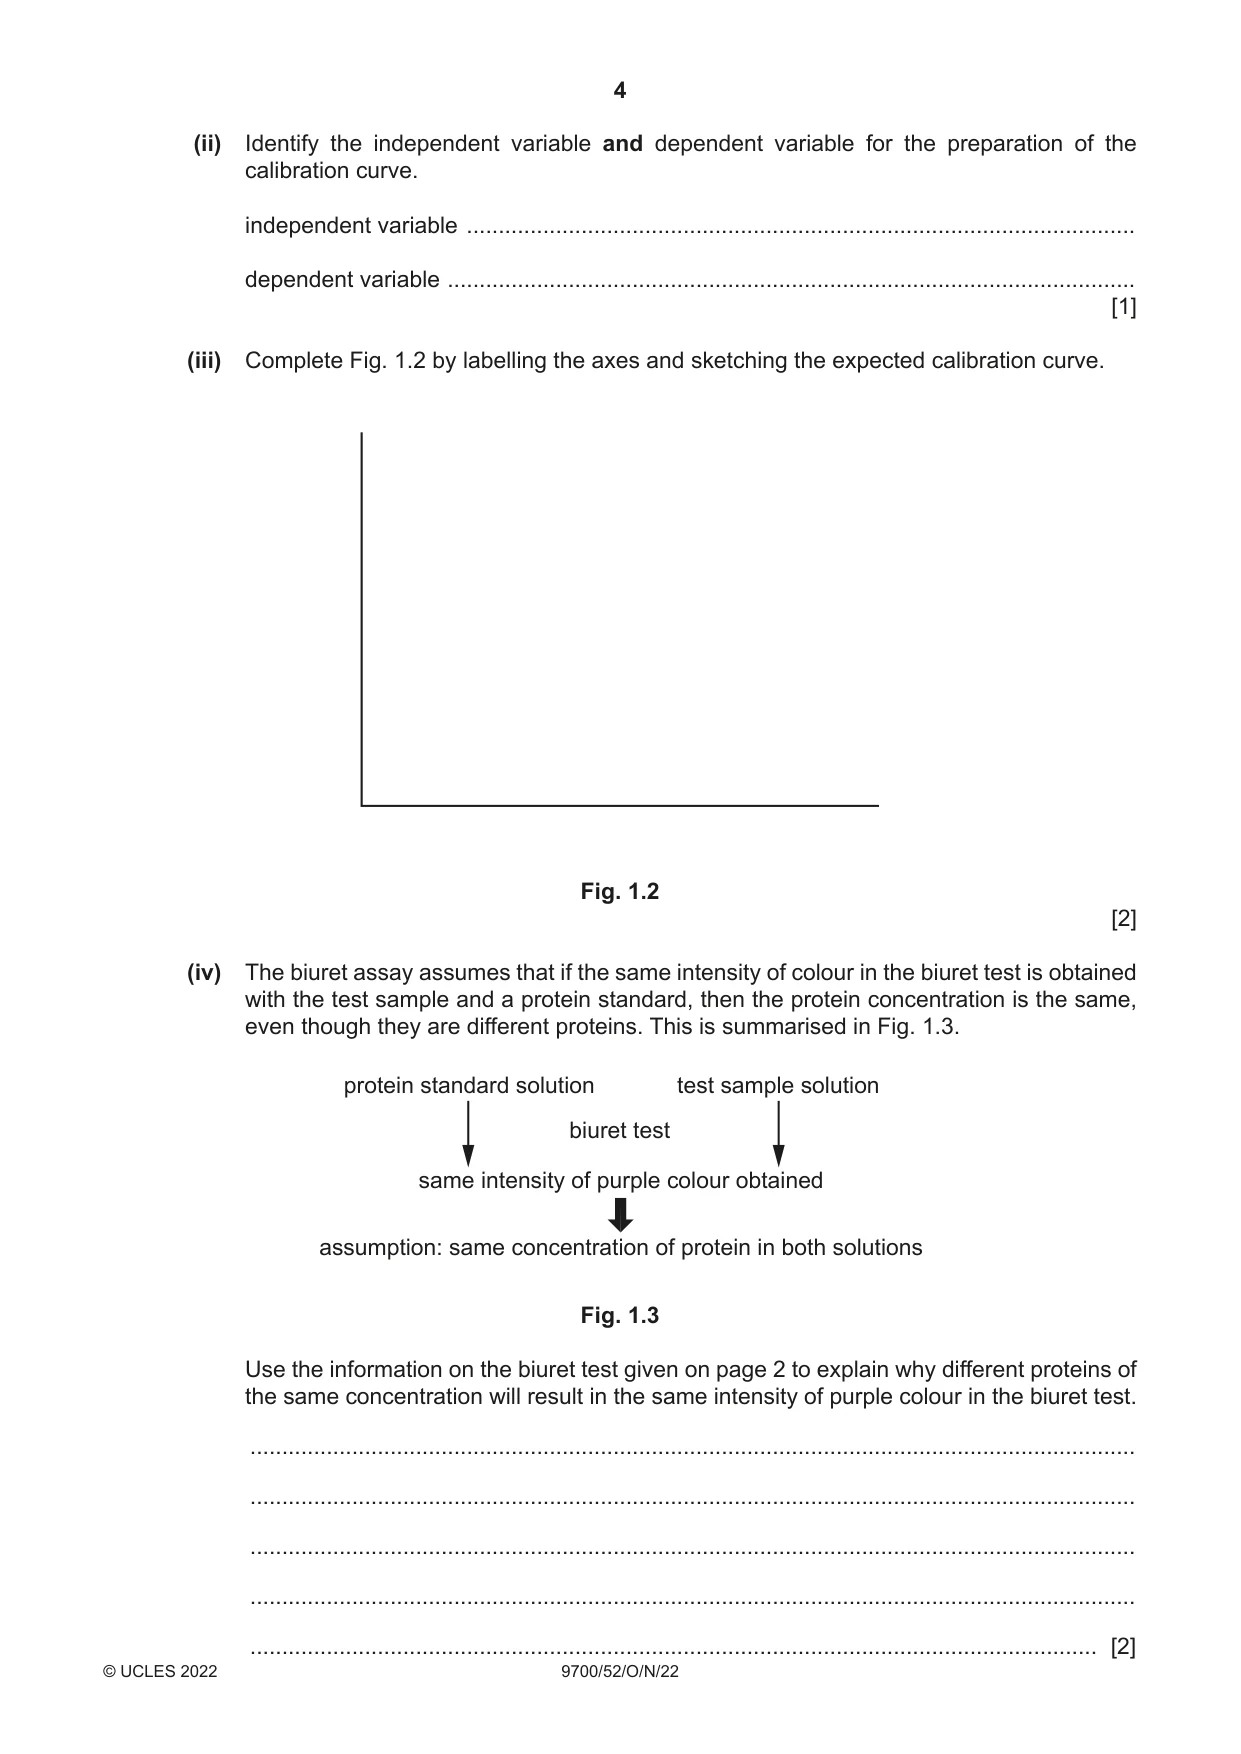
1 Egg albumen (egg white) is a good source of protein. Some eggs contain up to 10.0% w/v (100 g dm–3) protein. A biuret assay can be used to determine the concentration of protein in egg albumen. • Biuret reagent is a mixture of copper(II) sulfate solution and sodium hydroxide solution. • In a biuret assay, biuret reagent is added to a solution. • If protein is present, copper(II) ions (Cu2+) in the biuret reagent bind with the nitrogen atoms that form peptide bonds in the protein. • This binding causes the reagent to change from a clear, pale blue to a purple colour. • Different concentrations of protein result in different intensities of purple colour. A colorimeter can be used to measure differences in the intensity of the purple colour in samples tested. Fig. 1.1 shows a colorimeter that measures the absorbance of light when it passes through different coloured solutions. 3 cm3 cuvette Fig. 1.1 (a) Outline how a colorimeter is set up so that a test cuvette can be placed in the slot to obtain a correct measurement of intensity of a coloured solution. ................................................................................................................................................... ................................................................................................................................................... ................................................................................................................................................... ................................................................................................................................................... ................................................................................................................................................... ................................................................................................................................................... ............................................................................................................................................. [2] (b) A student carried out a biuret assay to determine the concentration of protein in egg albumen from eggs produced by a chicken that had been fed on a new type of chicken feed. The eggs produced by the chicken before eating the new feed contained 6.0% w/v of protein in the egg albumen. Egg albumen is diluted to obtain a concentration that is suitable for testing in the biuret assay. For example, egg albumen with 6.0% w/v protein is diluted by a factor of 10 to obtain a 0.6% w/v solution for a biuret assay. To carry out the biuret assay on egg albumen of unknown protein concentration, a calibration curve needs to be produced. This involves using standard solutions of known concentrations of protein. (i) The range of concentrations that can be measured using a colorimeter in a biuret assay is 0.1 – 1.0% w/v. A stock solution of 1.0% w/v protein can be diluted using distilled water to prepare the standard solutions of protein. Describe how the student could prepare a 0.1% solution of protein using the stock solution. Construct a table to show how the dilution is made for the 0.1% solution and for other concentrations the student could use to produce a calibration curve for the biuret assay. ........................................................................................................................................... ........................................................................................................................................... ........................................................................................................................................... ........................................................................................................................................... ........................................................................................................................................... Space for table. [2] (ii) Identify the independent variable and dependent variable for the preparation of the calibration curve. independent variable ......................................................................................................... dependent variable ............................................................................................................ [1] (iii) Complete Fig. 1.2 by labelling the axes and sketching the expected calibration curve. Fig. 1.2 [2] (iv) The biuret assay assumes that if the same intensity of colour in the biuret test is obtained with the test sample and a protein standard, then the protein concentration is the same, even though they are different proteins. This is summarised in Fig. 1.3. protein standard solution test sample solution biuret test same intensity of purple colour obtained assumption: same concentration of protein in both solutions Fig. 1.3 Use the information on the biuret test given on page 2 to explain why different proteins of the same concentration will result in the same intensity of purple colour in the biuret test. ........................................................................................................................................... ........................................................................................................................................... ........................................................................................................................................... ........................................................................................................................................... ..................................................................................................................................... [2] (c) Describe how the student would: • use the standard protein concentrations prepared in (b)(i) to obtain a calibration curve • determine the concentration of protein in the egg albumen from eggs of chickens fed on the new chicken feed. Do not repeat any detail given in (a) of how to use the colorimeter or in (b)(i) of how the standard protein solutions would be prepared. Your method should be set out in a logical way and be detailed enough to let another person follow it. ................................................................................................................................................... ................................................................................................................................................... ................................................................................................................................................... ................................................................................................................................................... ................................................................................................................................................... ................................................................................................................................................... ................................................................................................................................................... ................................................................................................................................................... ................................................................................................................................................... ................................................................................................................................................... ................................................................................................................................................... ................................................................................................................................................... ................................................................................................................................................... ................................................................................................................................................... ................................................................................................................................................... ................................................................................................................................................... ................................................................................................................................................... ................................................................................................................................................... ................................................................................................................................................... ................................................................................................................................................... ............................................................................................................................................. [6] [Total: 15]
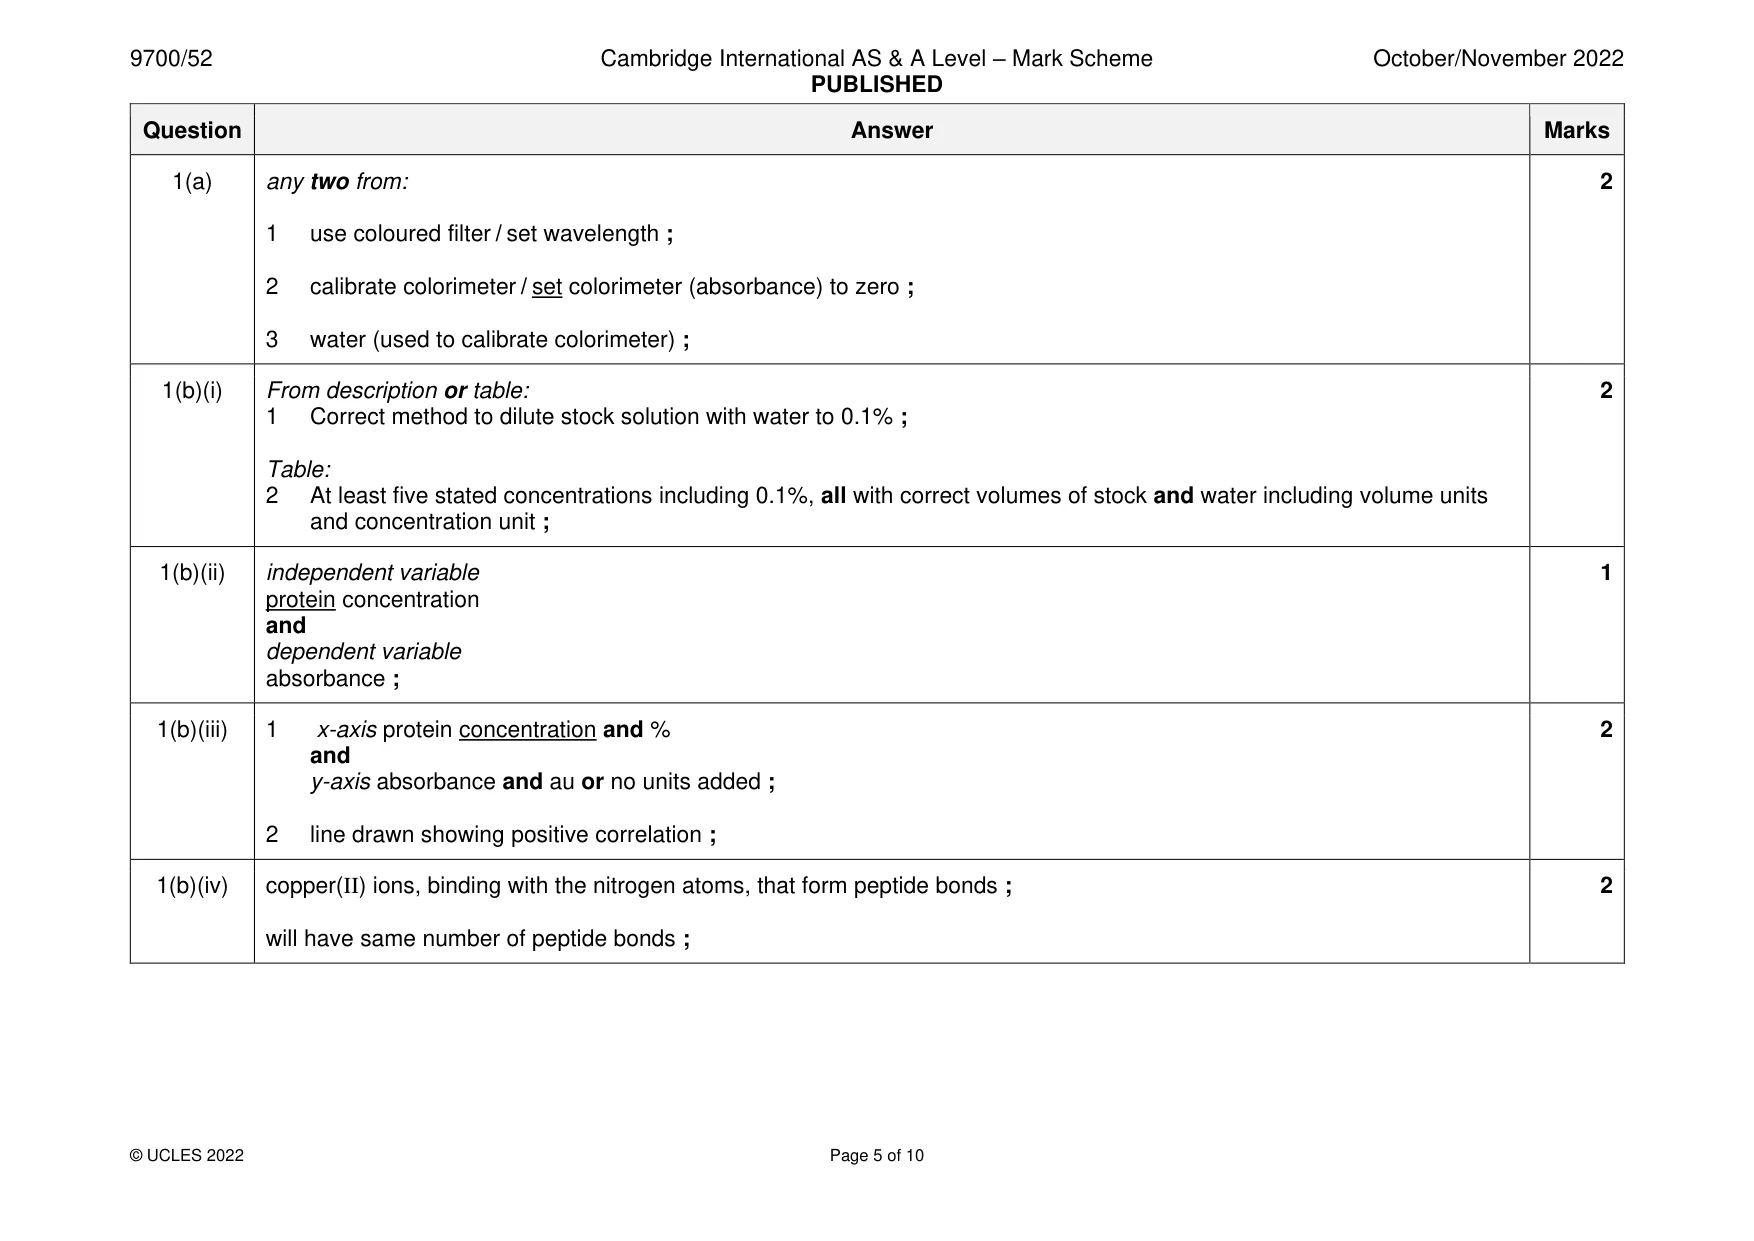
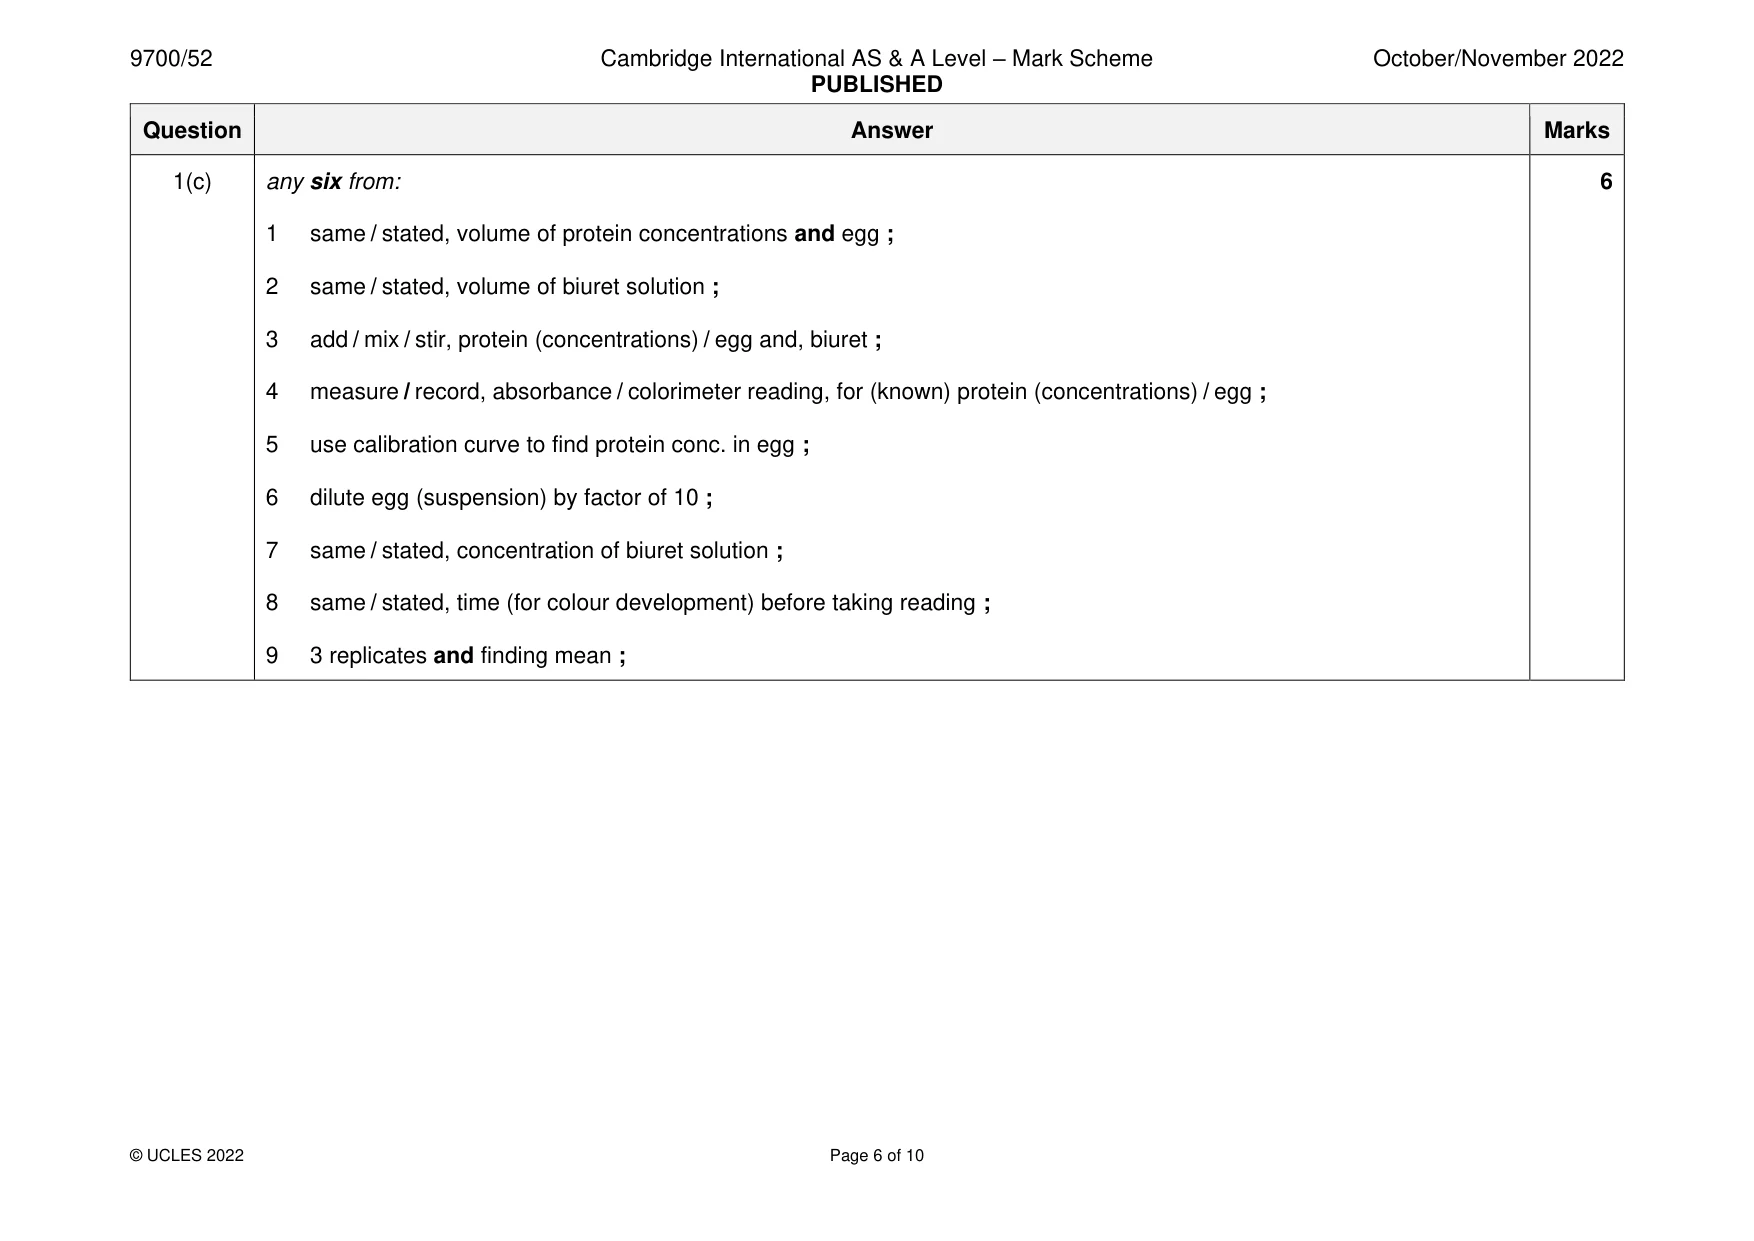
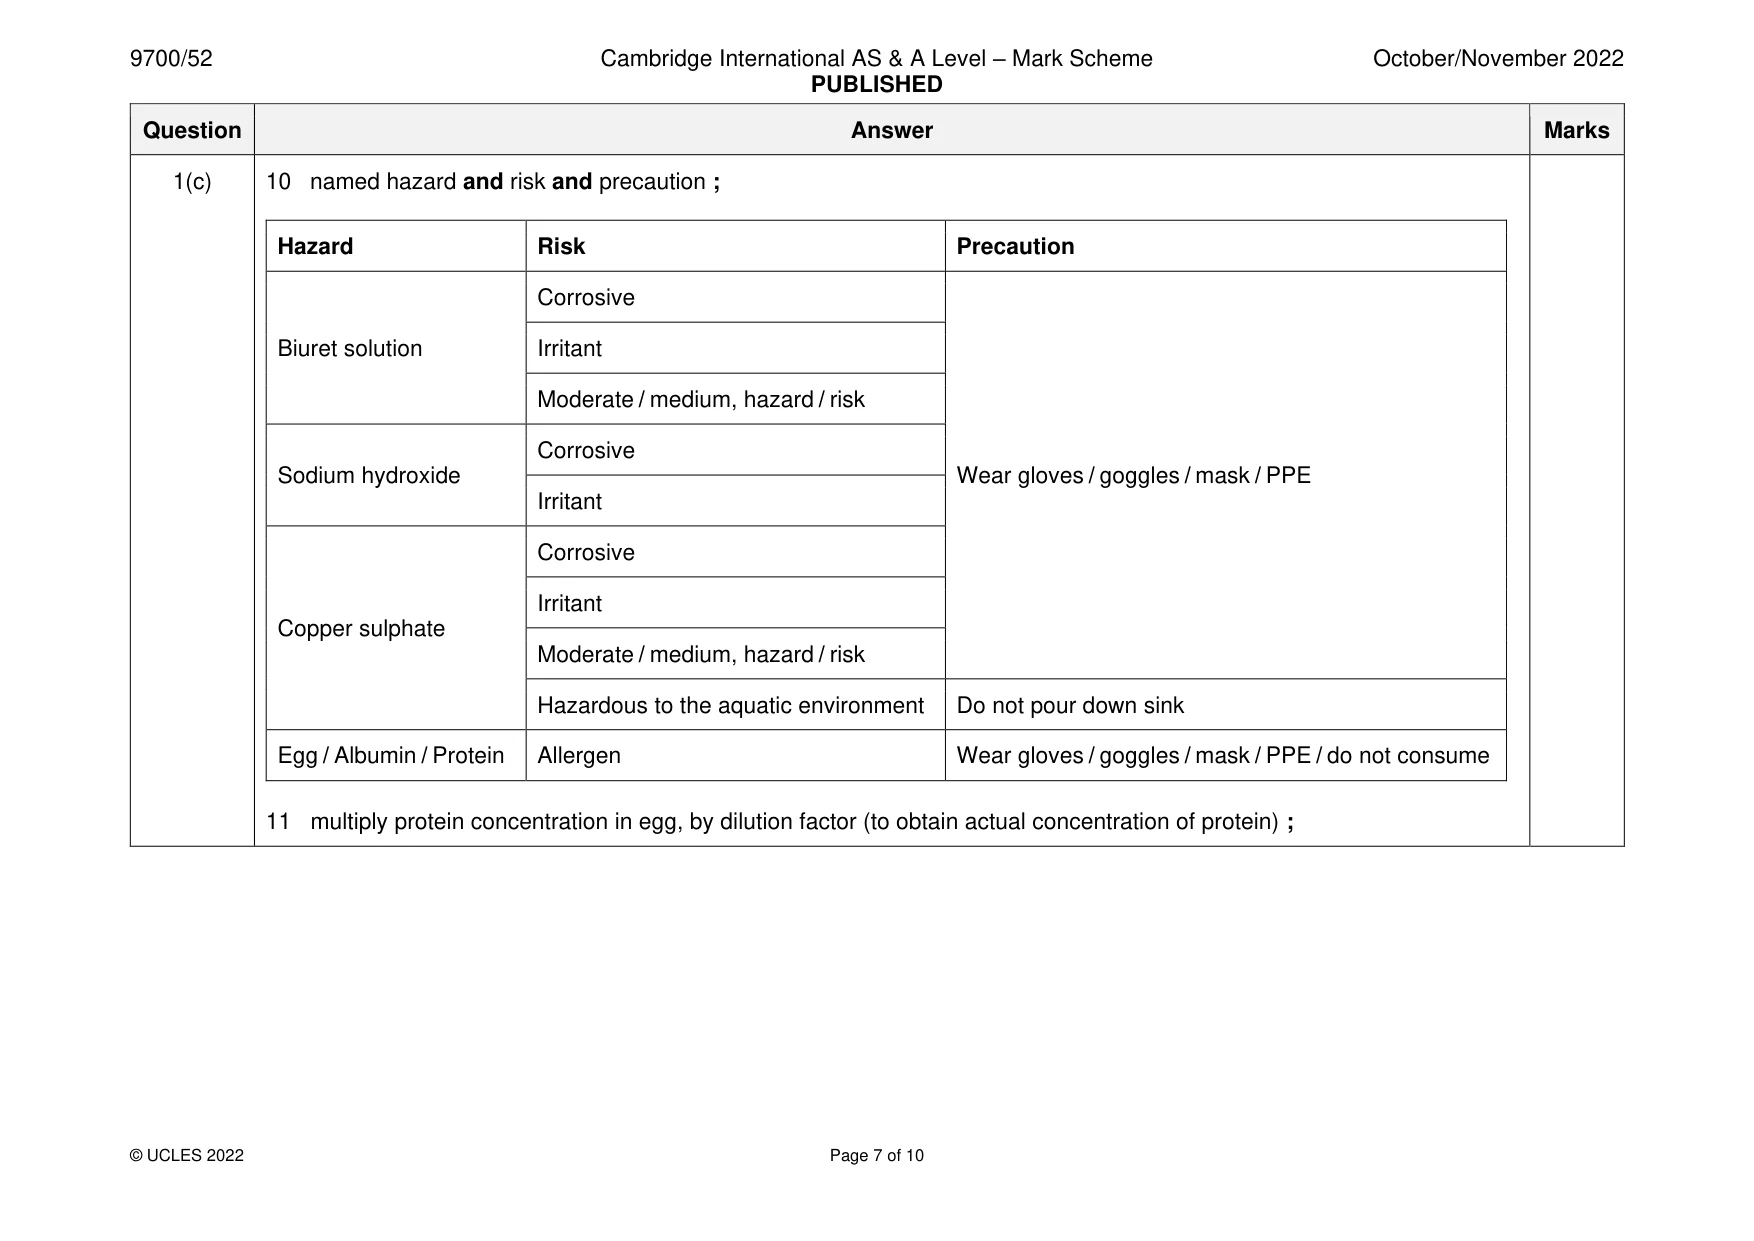
Mark scheme: Question Answer Marks 1(a) any two from: 2 1 use coloured filter / set wavelength ; 2 calibrate colorimeter / set colorimeter (absorbance) to zero ; 3 water (used to calibrate colorimeter) ; 1(b)(i) From description or table: 2 1 Correct method to dilute stock solution with water to 0.1% ; Table: 2 At least five stated concentrations including 0.1%, all with correct volumes of stock and water including volume units and concentration unit ; 1(b)(ii) independent variable 1 protein concentration and dependent variable absorbance ; 1(b)(iii) 1 x-axis protein concentration and % 2 and y-axis absorbance and au or no units added ; 2 line drawn showing positive correlation ; 1(b)(iv) copper(II) ions, binding with the nitrogen atoms, that form peptide bonds ; 2 will have same number of peptide bonds ; 1(c) any six from: 6 1 same / stated, volume of protein concentrations and egg ; 2 same / stated, volume of biuret solution ; 3 add / mix / stir, protein (concentrations) / egg and, biuret ; 4 measure / record, absorbance / colorimeter reading, for (known) protein (concentrations) / egg ; 5 use calibration curve to find protein conc. in egg ; 6 dilute egg (suspension) by factor of 10 ; 7 same / stated, concentration of biuret solution ; 8 same / stated, time (for colour development) before taking reading ; 9 3 replicates and finding mean ; 1(c) 10 named hazard and risk and precaution ; Hazard Risk Precaution Corrosive Biuret solution Irritant Moderate / medium, hazard / risk Corrosive Sodium hydroxide Wear gloves / goggles / mask / PPE Irritant Corrosive Irritant Copper sulphate Moderate / medium, hazard / risk Hazardous to the aquatic environment Do not pour down sink Egg / Albumin / Protein Allergen Wear gloves / goggles / mask / PPE / do not consume 11 multiply protein concentration in egg, by dilution factor (to obtain actual concentration of protein) ;
Q2 · A main feature of Huntington’s disease (HD) is a loss of neurones from a region of the…
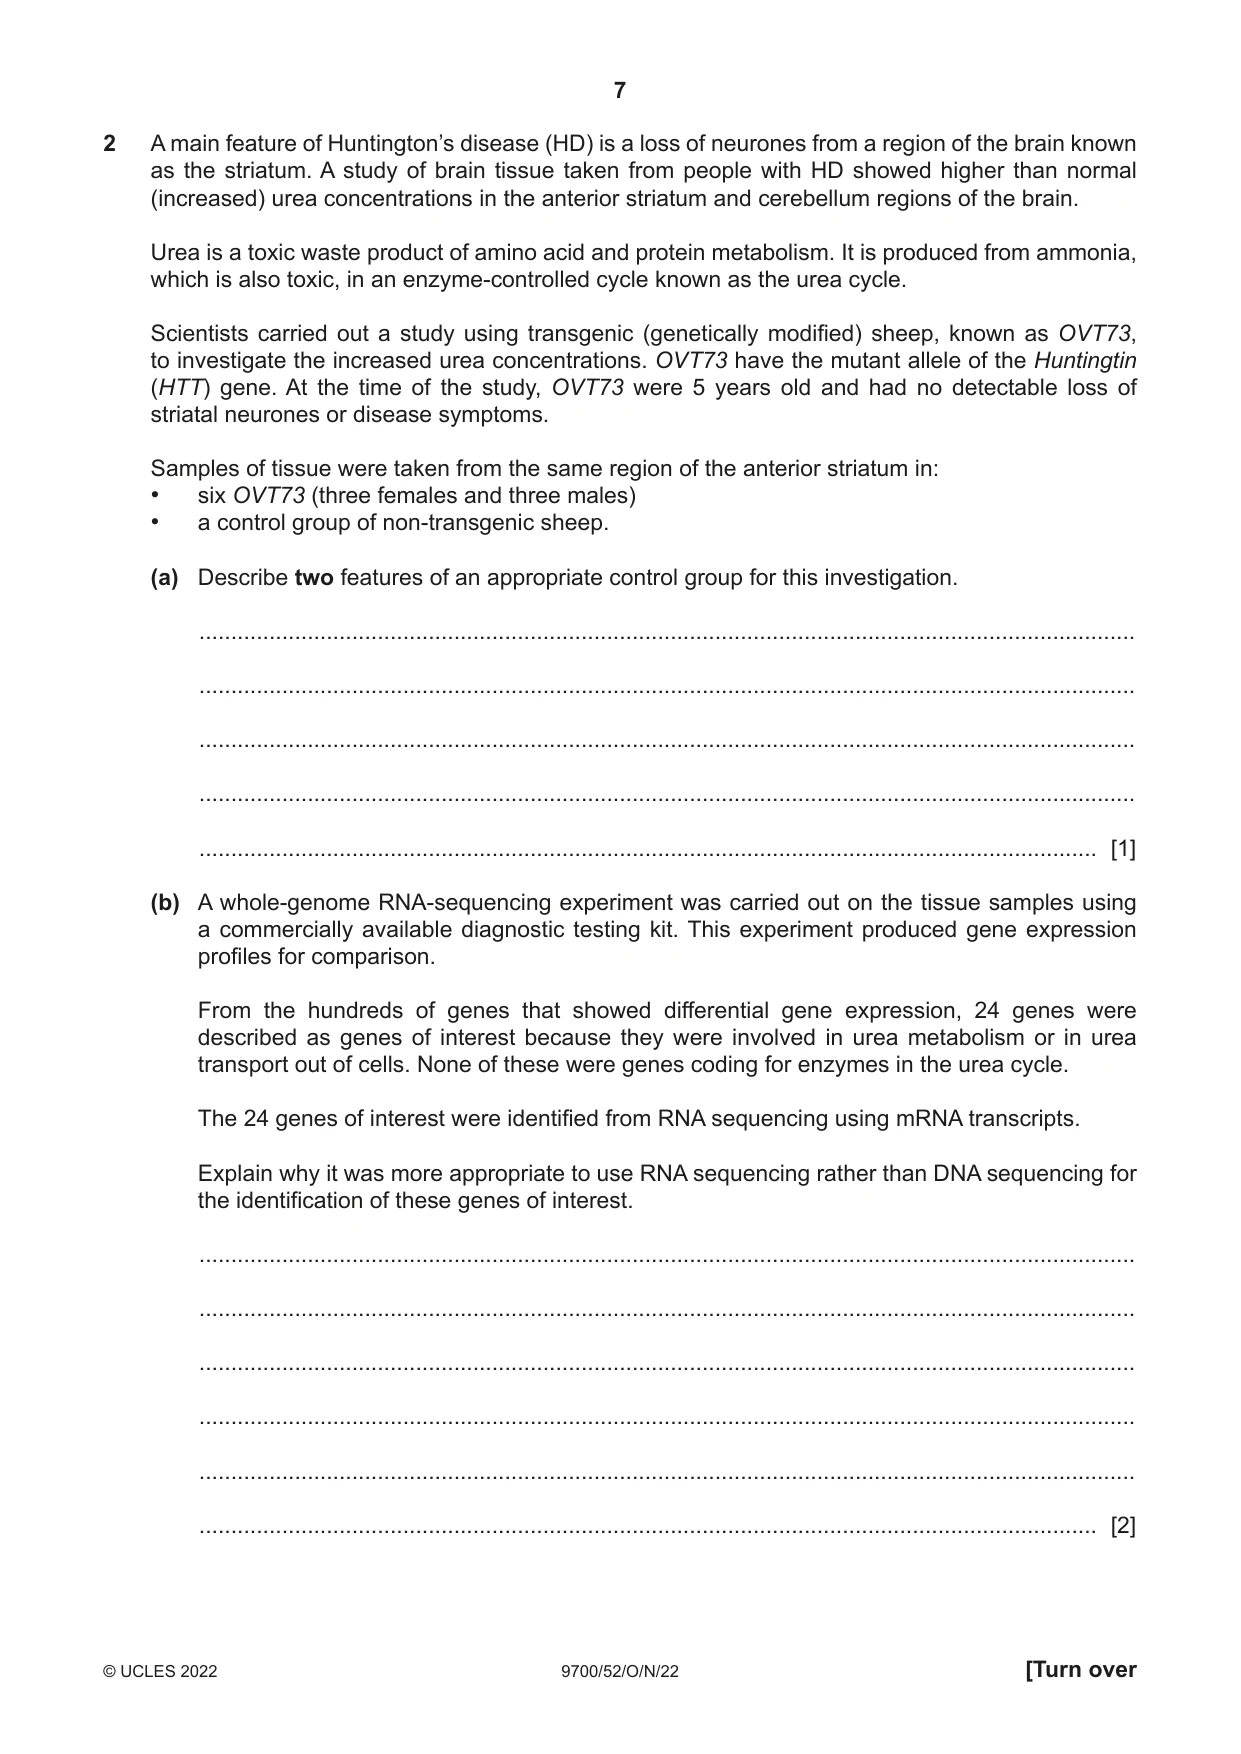
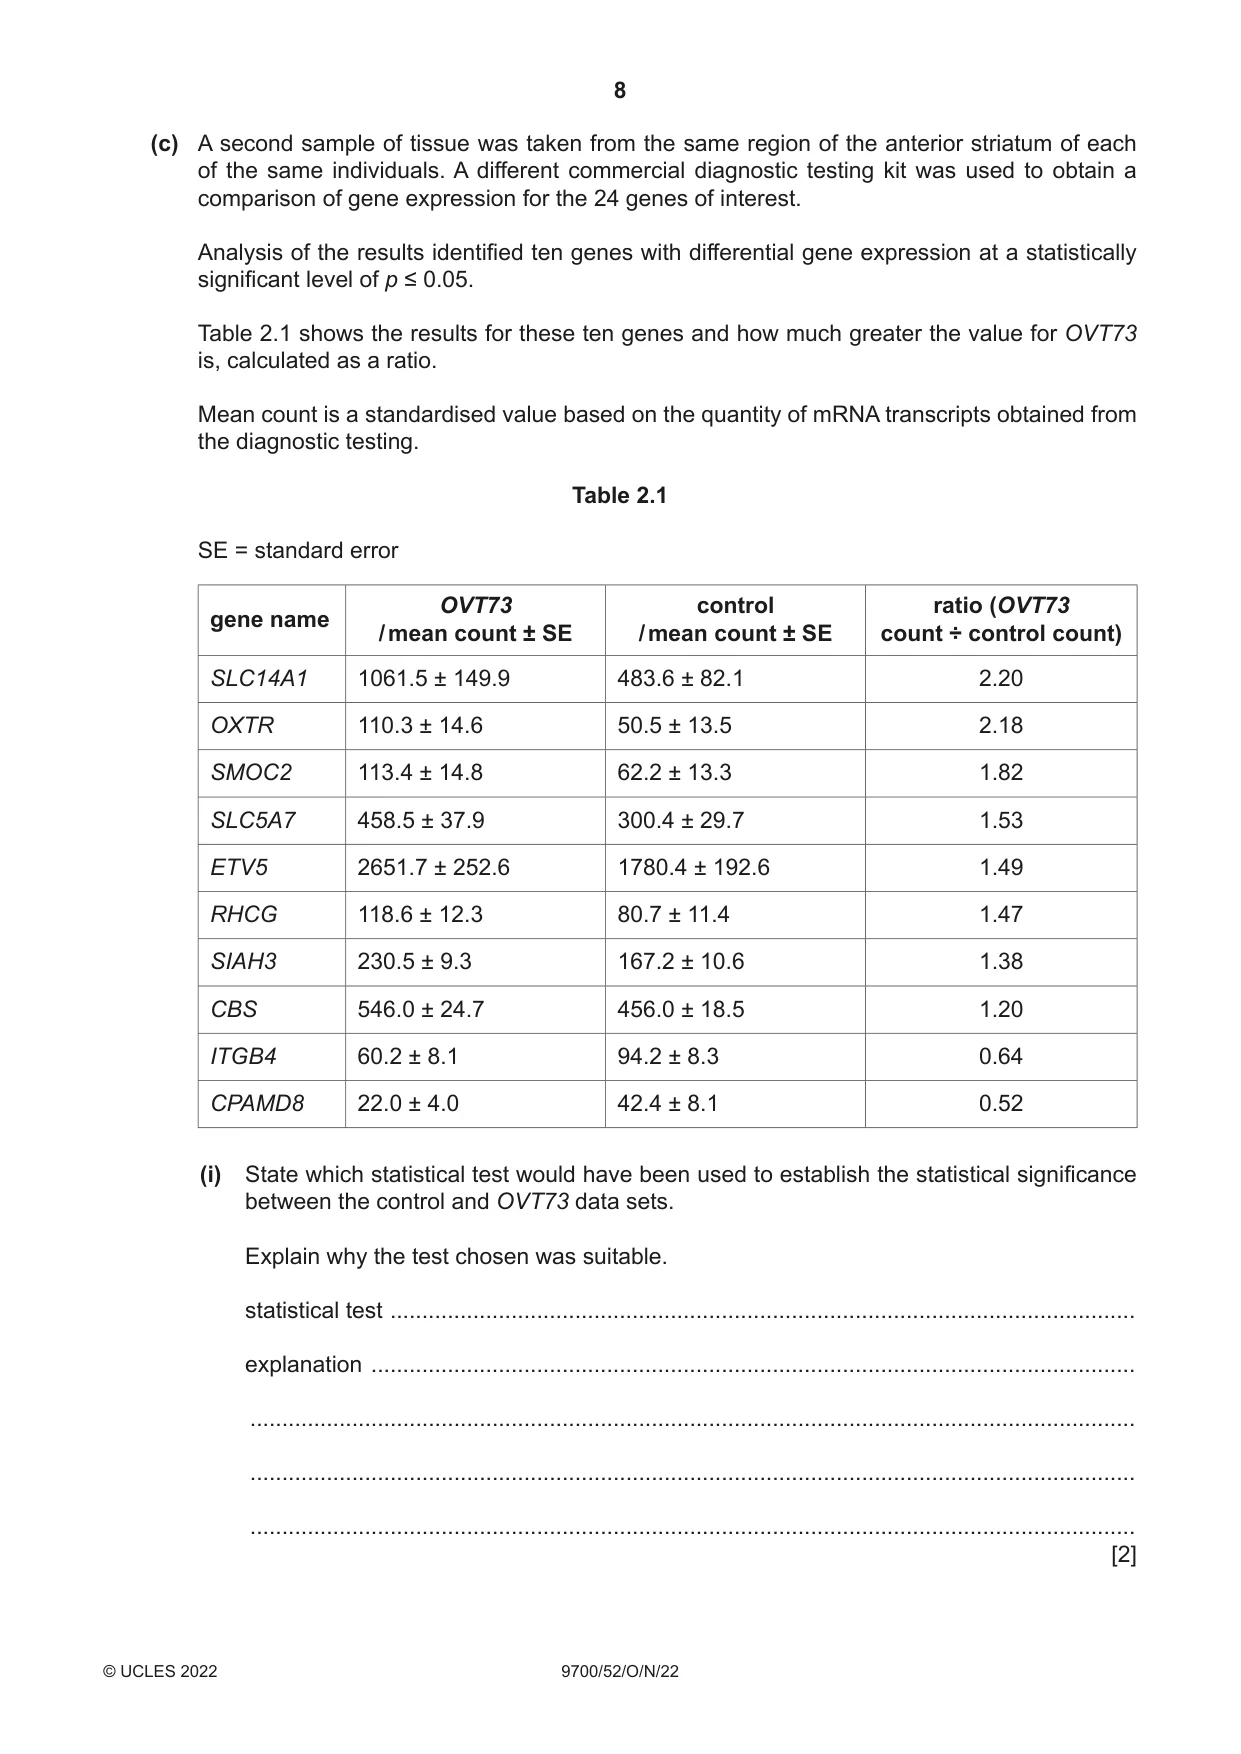
2 A main feature of Huntington’s disease (HD) is a loss of neurones from a region of the brain known as the striatum. A study of brain tissue taken from people with HD showed higher than normal (increased) urea concentrations in the anterior striatum and cerebellum regions of the brain. Urea is a toxic waste product of amino acid and protein metabolism. It is produced from ammonia, which is also toxic, in an enzyme-controlled cycle known as the urea cycle. Scientists carried out a study using transgenic (genetically modified) sheep, known as OVT73, to investigate the increased urea concentrations. OVT73 have the mutant allele of the Huntingtin (HTT) gene. At the time of the study, OVT73 were 5 years old and had no detectable loss of striatal neurones or disease symptoms. Samples of tissue were taken from the same region of the anterior striatum in: • six OVT73 (three females and three males) • a control group of non-transgenic sheep. (a) Describe two features of an appropriate control group for this investigation. ................................................................................................................................................... ................................................................................................................................................... ................................................................................................................................................... ................................................................................................................................................... ............................................................................................................................................. [1] (b) A whole-genome RNA-sequencing experiment was carried out on the tissue samples using a commercially available diagnostic testing kit. This experiment produced gene expression profiles for comparison. From the hundreds of genes that showed differential gene expression, 24 genes were described as genes of interest because they were involved in urea metabolism or in urea transport out of cells. None of these were genes coding for enzymes in the urea cycle. The 24 genes of interest were identified from RNA sequencing using mRNA transcripts. Explain why it was more appropriate to use RNA sequencing rather than DNA sequencing for the identification of these genes of interest. ................................................................................................................................................... ................................................................................................................................................... ................................................................................................................................................... ................................................................................................................................................... ................................................................................................................................................... ............................................................................................................................................. [2] (c) A second sample of tissue was taken from the same region of the anterior striatum of each of the same individuals. A different commercial diagnostic testing kit was used to obtain a comparison of gene expression for the 24 genes of interest. Analysis of the results identified ten genes with differential gene expression at a statistically significant level of p ≤ 0.05. Table 2.1 shows the results for these ten genes and how much greater the value for OVT73 is, calculated as a ratio. Mean count is a standardised value based on the quantity of mRNA transcripts obtained from the diagnostic testing. Table 2.1 SE = standard error OVT73 control ratio (OVT73 gene name / mean count ± SE / mean count ± SE count ÷ control count) SLC14A1 1061.5 ± 149.9 483.6 ± 82.1 2.20 OXTR 110.3 ± 14.6 50.5 ± 13.5 2.18 SMOC2 113.4 ± 14.8 62.2 ± 13.3 1.82 SLC5A7 458.5 ± 37.9 300.4 ± 29.7 1.53 ETV5 2651.7 ± 252.6 1780.4 ± 192.6 1.49 RHCG 118.6 ± 12.3 80.7 ± 11.4 1.47 SIAH3 230.5 ± 9.3 167.2 ± 10.6 1.38 CBS 546.0 ± 24.7 456.0 ± 18.5 1.20 ITGB4 60.2 ± 8.1 94.2 ± 8.3 0.64 CPAMD8 22.0 ± 4.0 42.4 ± 8.1 0.52 (i) State which statistical test would have been used to establish the statistical significance between the control and OVT73 data sets. Explain why the test chosen was suitable. statistical test ..................................................................................................................... explanation ........................................................................................................................ ........................................................................................................................................... ........................................................................................................................................... ........................................................................................................................................... [2] (ii) State the null hypothesis for the investigation. ........................................................................................................................................... ........................................................................................................................................... ..................................................................................................................................... [1] (iii) With reference to Table 2.1, explain the advantage of calculating the ratios. ........................................................................................................................................... ........................................................................................................................................... ........................................................................................................................................... ........................................................................................................................................... ..................................................................................................................................... [2] (d) The results of the two RNA-sequencing experiments indicate that there is a difference between OVT73 and the control group in the expression of each of the ten genes shown in Table 2.1. State one feature of the study that contributes to the validity of these results and one feature that would improve the validity of these results. feature that contributes to validity ............................................................................................. ................................................................................................................................................... ................................................................................................................................................... feature to improve validity ......................................................................................................... ................................................................................................................................................... ................................................................................................................................................... [2]
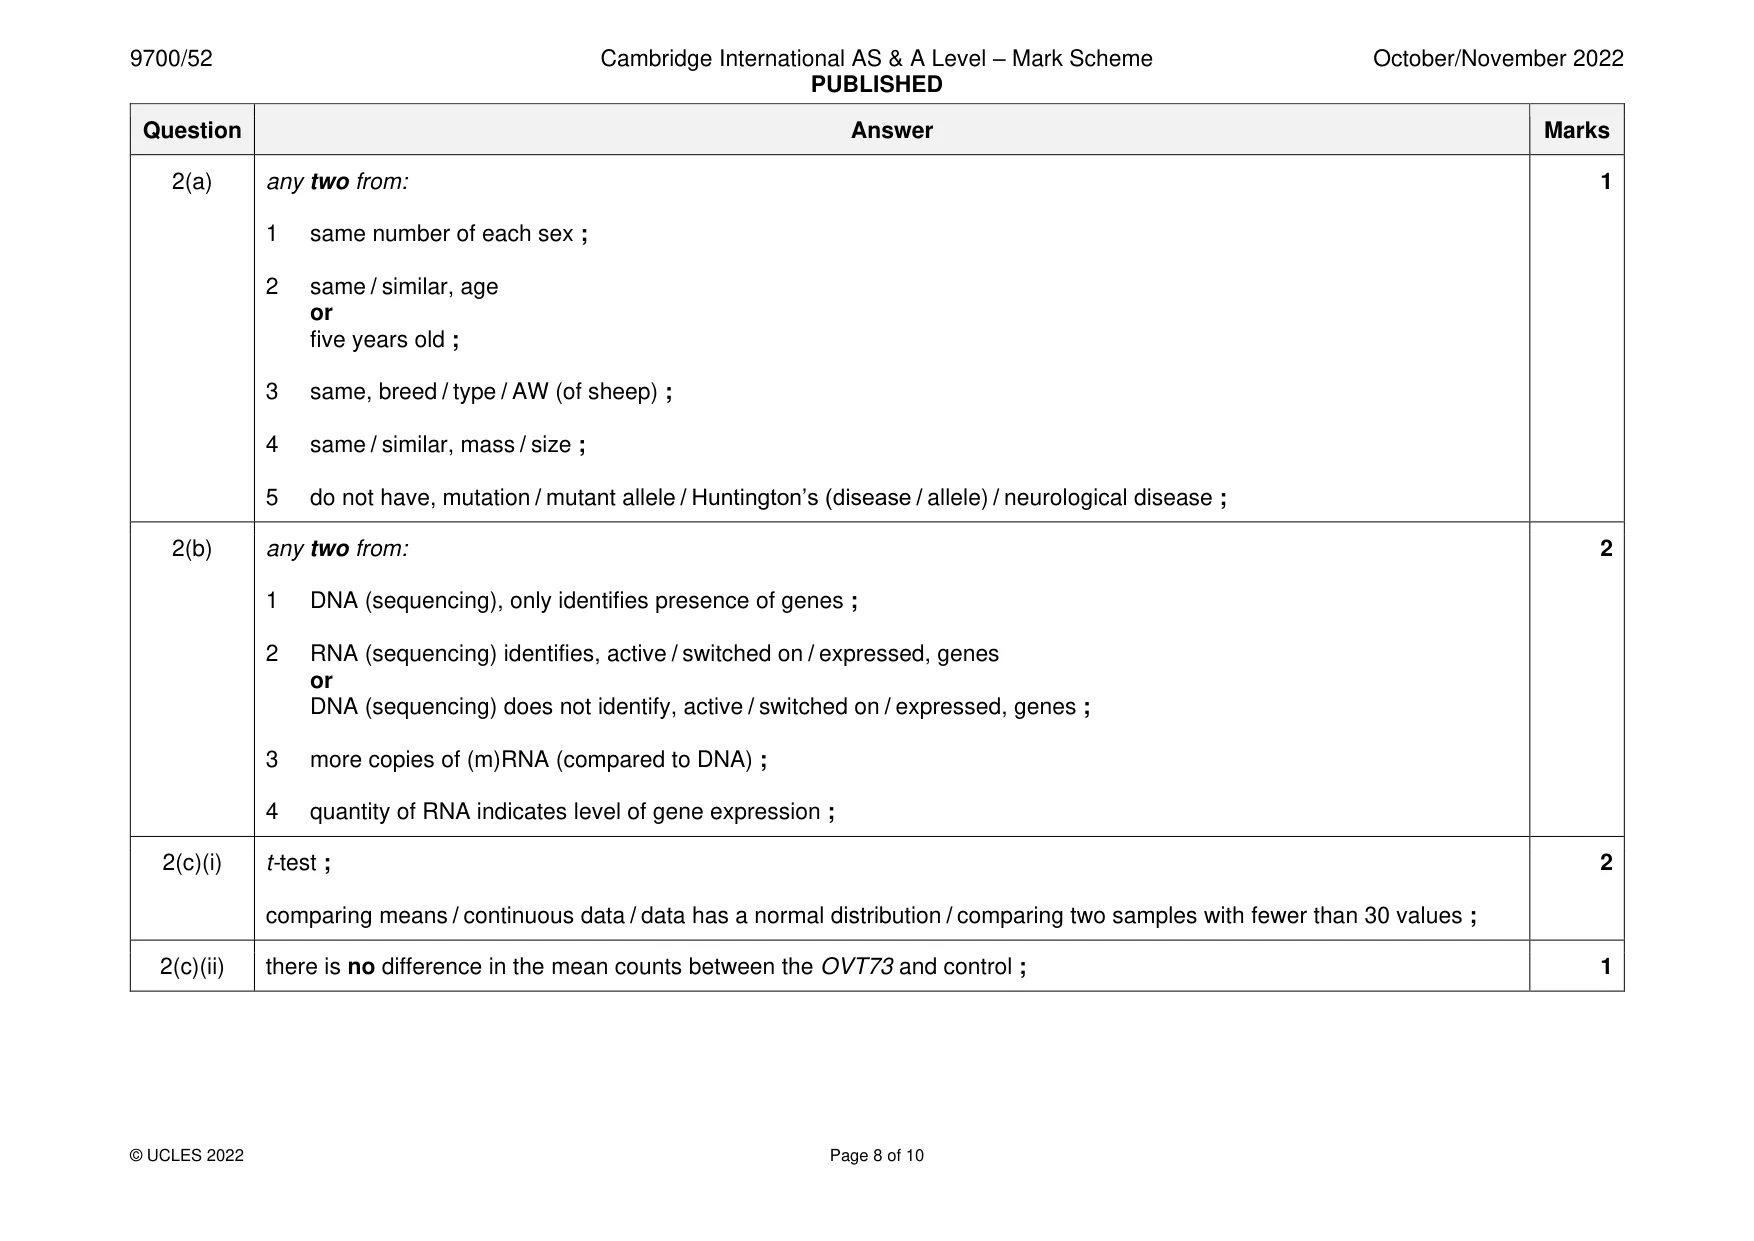
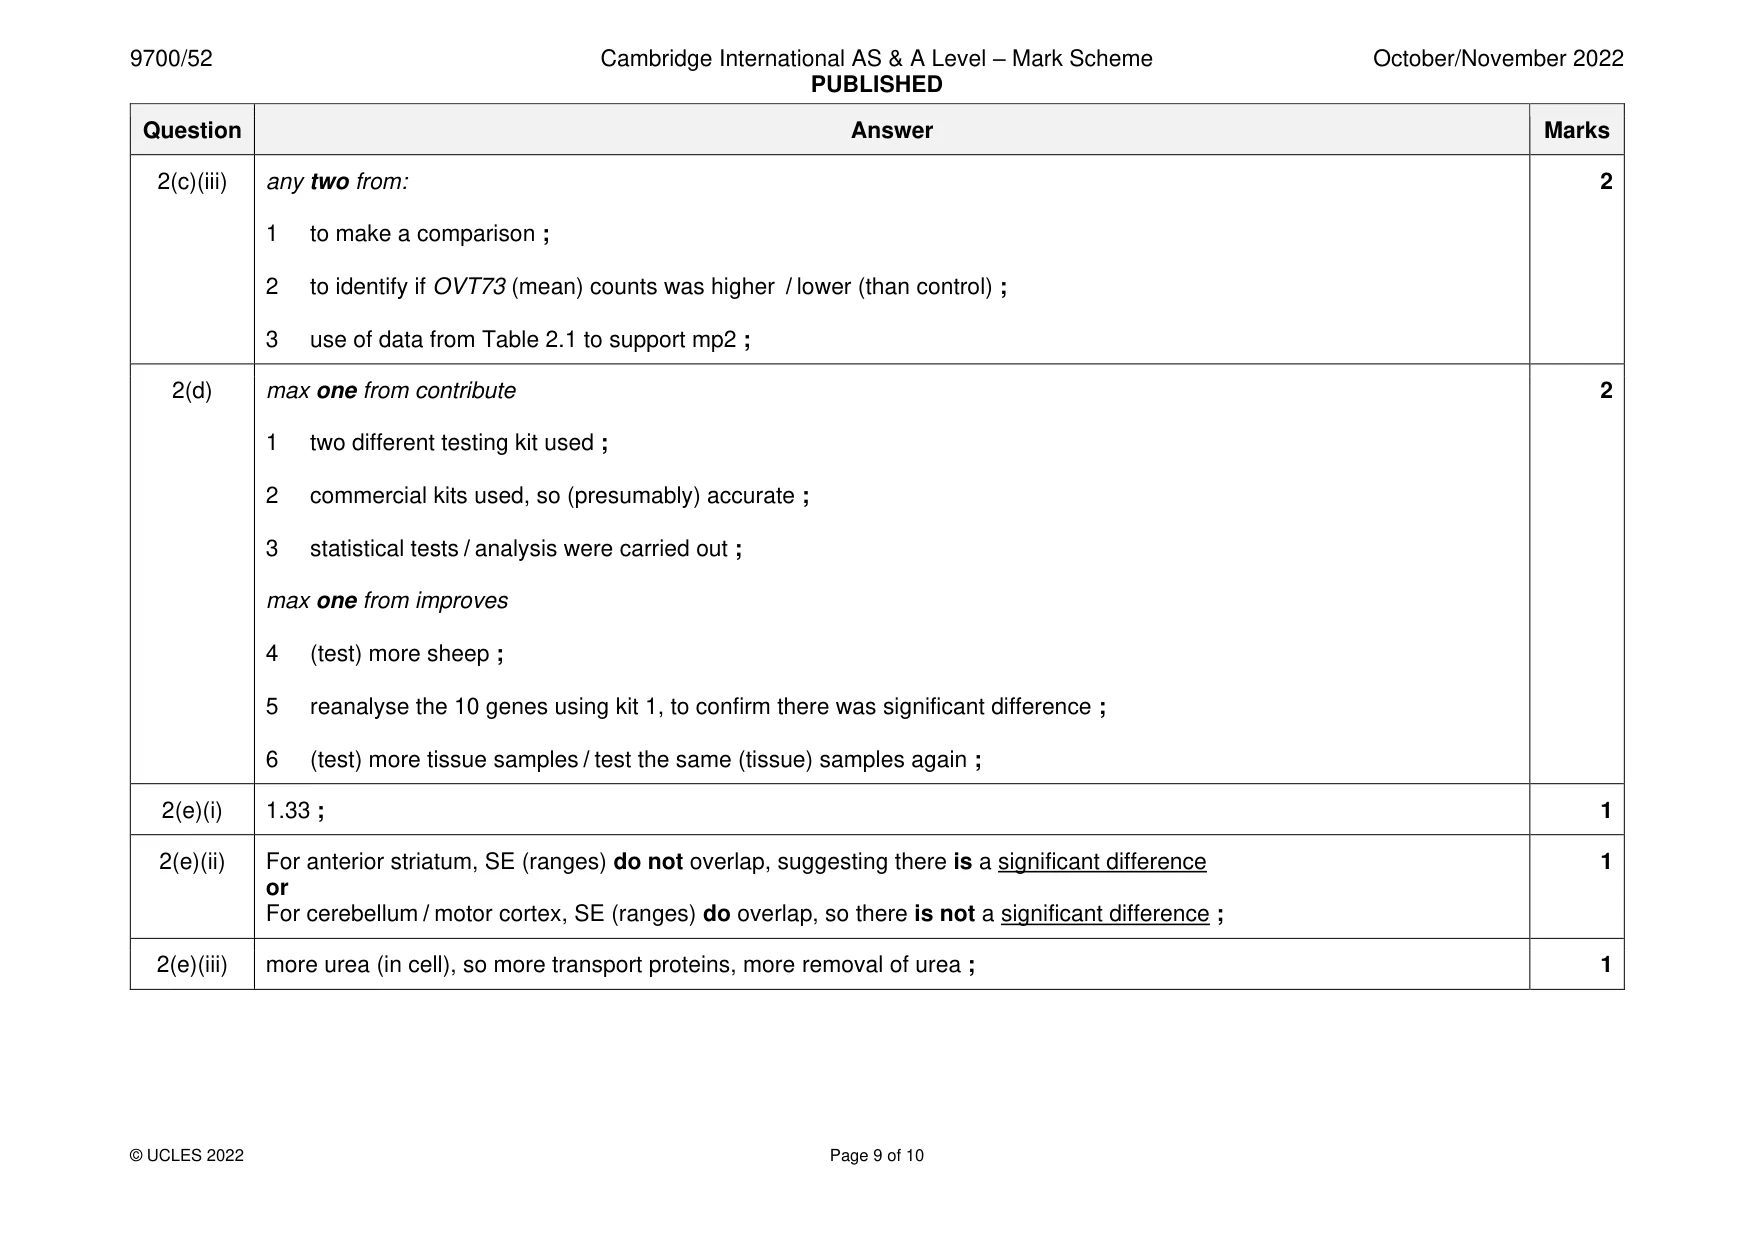
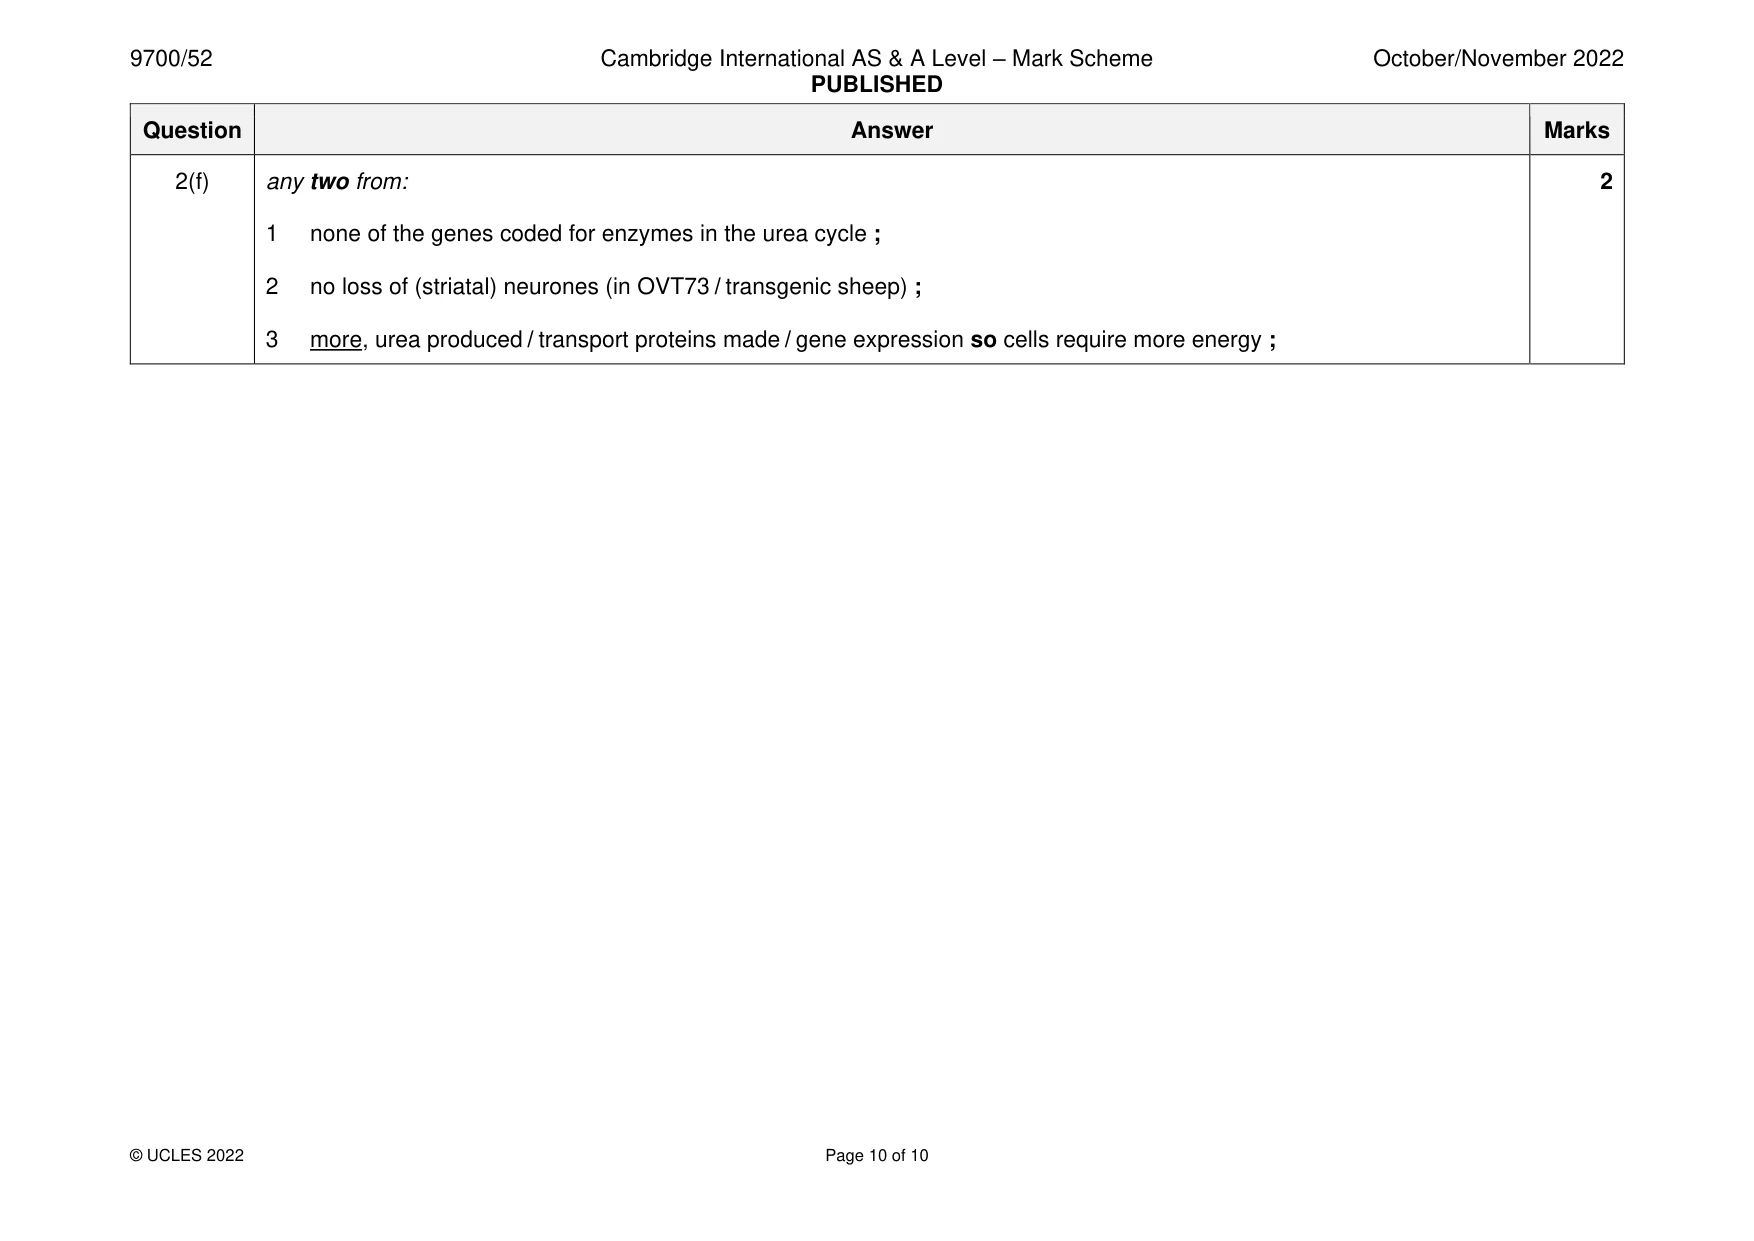
Mark scheme: 2(a) any two from: 1 1 same number of each sex ; 2 same / similar, age or five years old ; 3 same, breed / type / AW (of sheep) ; 4 same / similar, mass / size ; 5 do not have, mutation / mutant allele / Huntington’s (disease / allele) / neurological disease ; 2(b) any two from: 2 1 DNA (sequencing), only identifies presence of genes ; 2 RNA (sequencing) identifies, active / switched on / expressed, genes or DNA (sequencing) does not identify, active / switched on / expressed, genes ; 3 more copies of (m)RNA (compared to DNA) ; 4 quantity of RNA indicates level of gene expression ; 2(c)(i) t-test ; 2 comparing means / continuous data / data has a normal distribution / comparing two samples with fewer than 30 values ; 2(c)(ii) there is no difference in the mean counts between the OVT73 and control ; 1 2(c)(iii) any two from: 2 1 to make a comparison ; 2 to identify if OVT73 (mean) counts was higher / lower (than control) ; 3 use of data from Table 2.1 to support mp2 ; 2(d) max one from contribute 2 1 two different testing kit used ; 2 commercial kits used, so (presumably) accurate ; 3 statistical tests / analysis were carried out ; max one from improves 4 (test) more sheep ; 5 reanalyse the 10 genes using kit 1, to confirm there was significant difference ; 6 (test) more tissue samples / test the same (tissue) samples again ; 2(e)(i) 1.33 ; 1 2(e)(ii) For anterior striatum, SE (ranges) do not overlap, suggesting there is a significant difference 1 or For cerebellum / motor cortex, SE (ranges) do overlap, so there is not a significant difference ; 2(e)(iii) more urea (in cell), so more transport proteins, more removal of urea ; 1 2(f) any two from: 2 1 none of the genes coded for enzymes in the urea cycle ; 2 no loss of (striatal) neurones (in OVT73 / transgenic sheep) ; 3 more, urea produced / transport proteins made / gene expression so cells require more energy ;
What was in this paper
The subtopics covered by these 2 questions, and how many questions each got. Open one in a new tab to see every Cambridge question on it.
What you needed in this session
Cambridge’s own grade thresholds for 2022 Oct/Nov, Paper 5 · Variant 2. A higher threshold means an easier paper — the bar moves with how the cohort did.