Cambridge A Level Biology 9700 — 2022 Oct/Nov Paper 5 · Variant 1
9700/51/O/N/22 · 2 questions · 30 marks · ≈34 min
The question paper and its mark scheme, free to read here and free to download. This is Cambridge’s own paper, exactly as it was sat.
Question paper16 pages

Mark scheme11 pages
Answers below. Sit the paper first if you are practising.
Questions as text
Q1 · Antibiotic resistance in bacteria is a global problem that has caused scientists to…
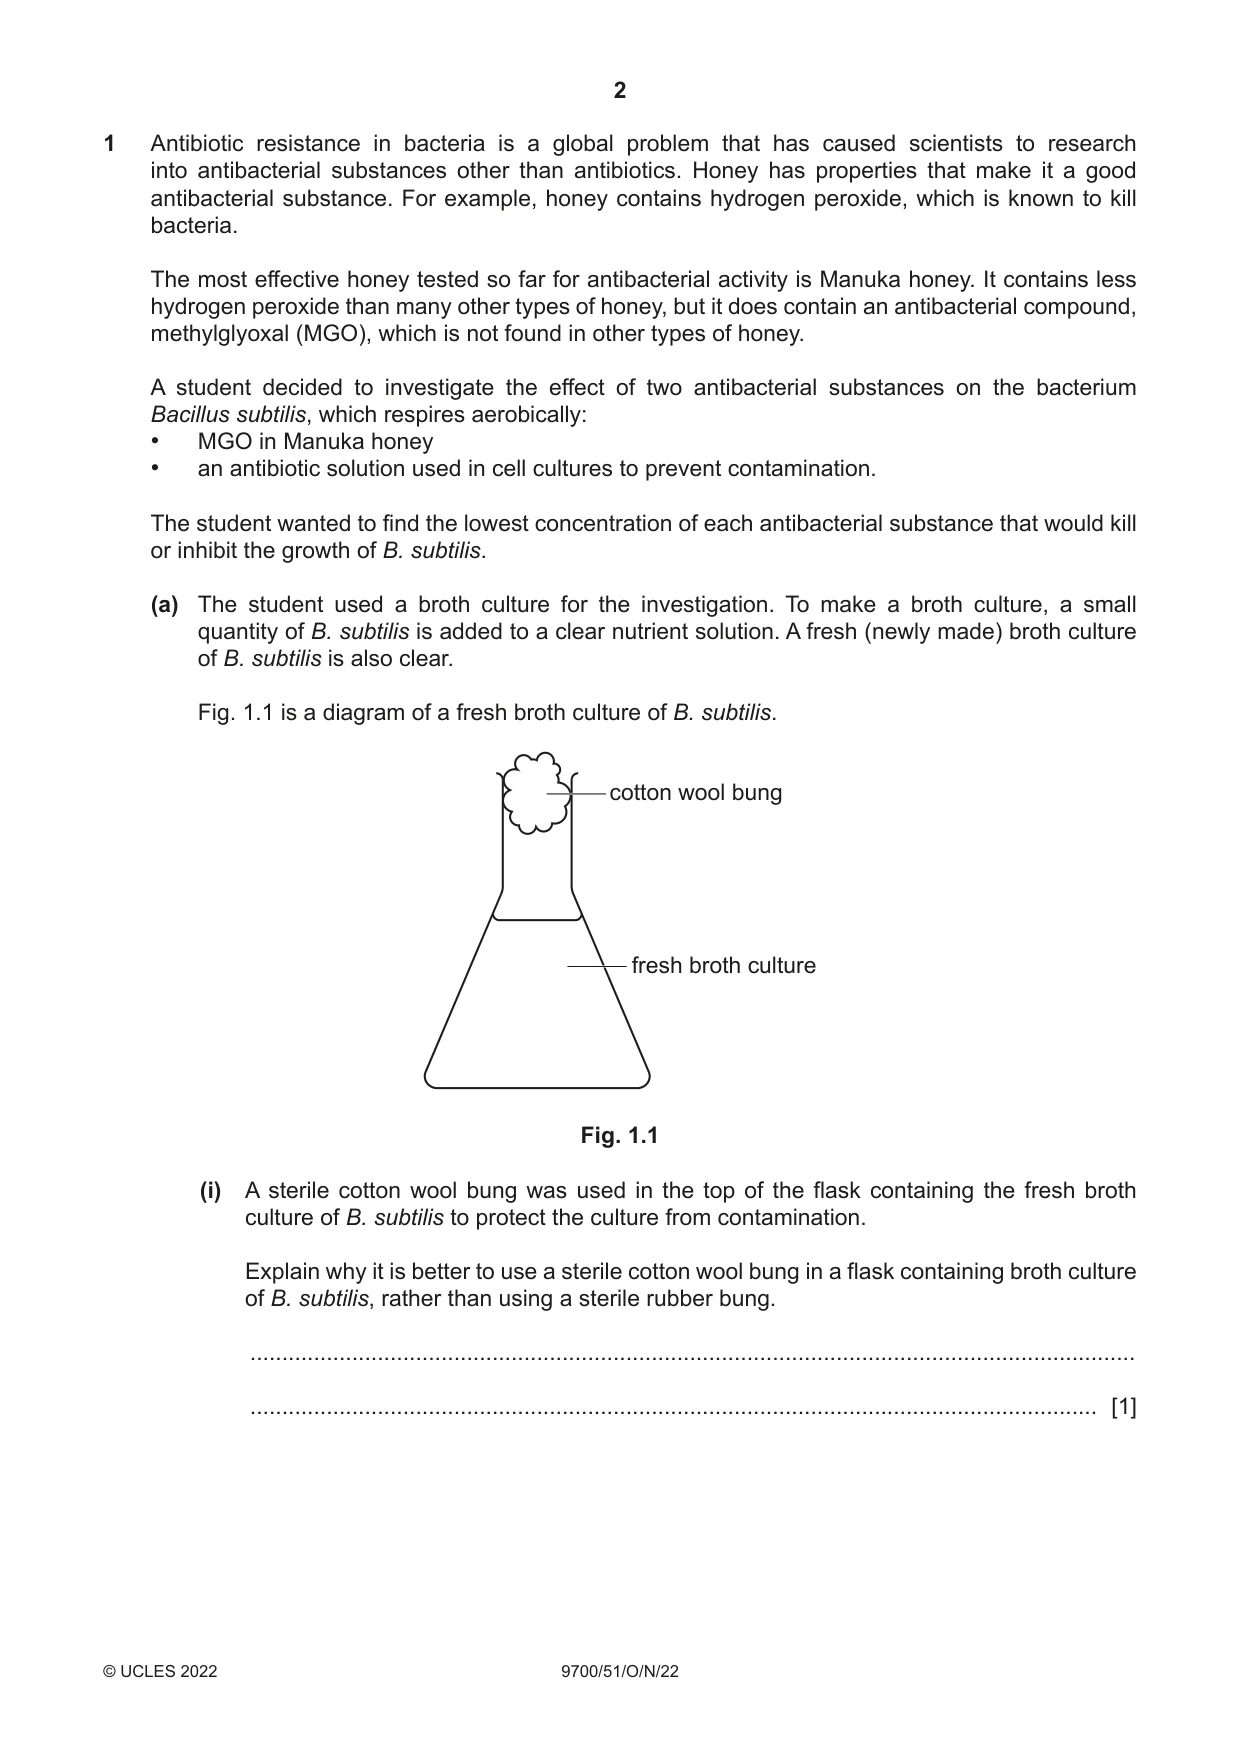
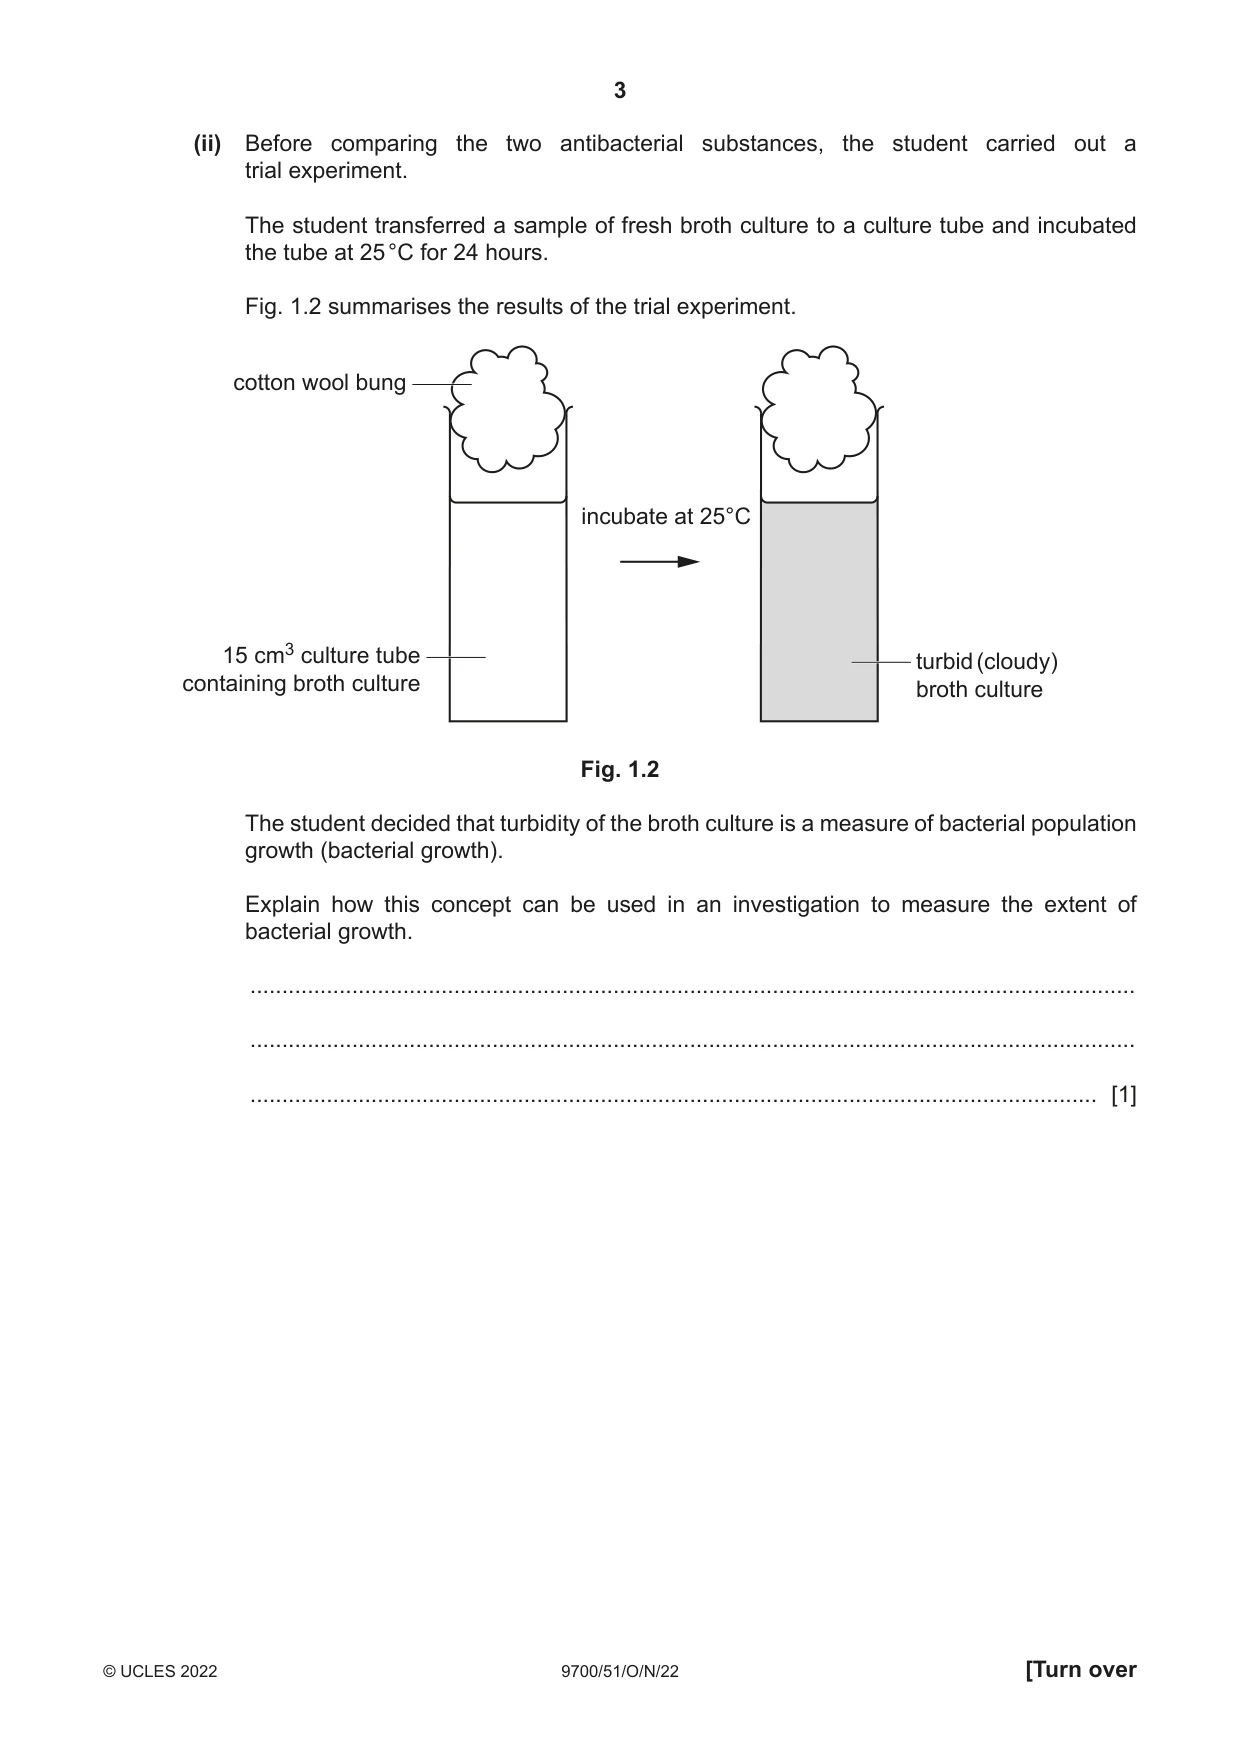
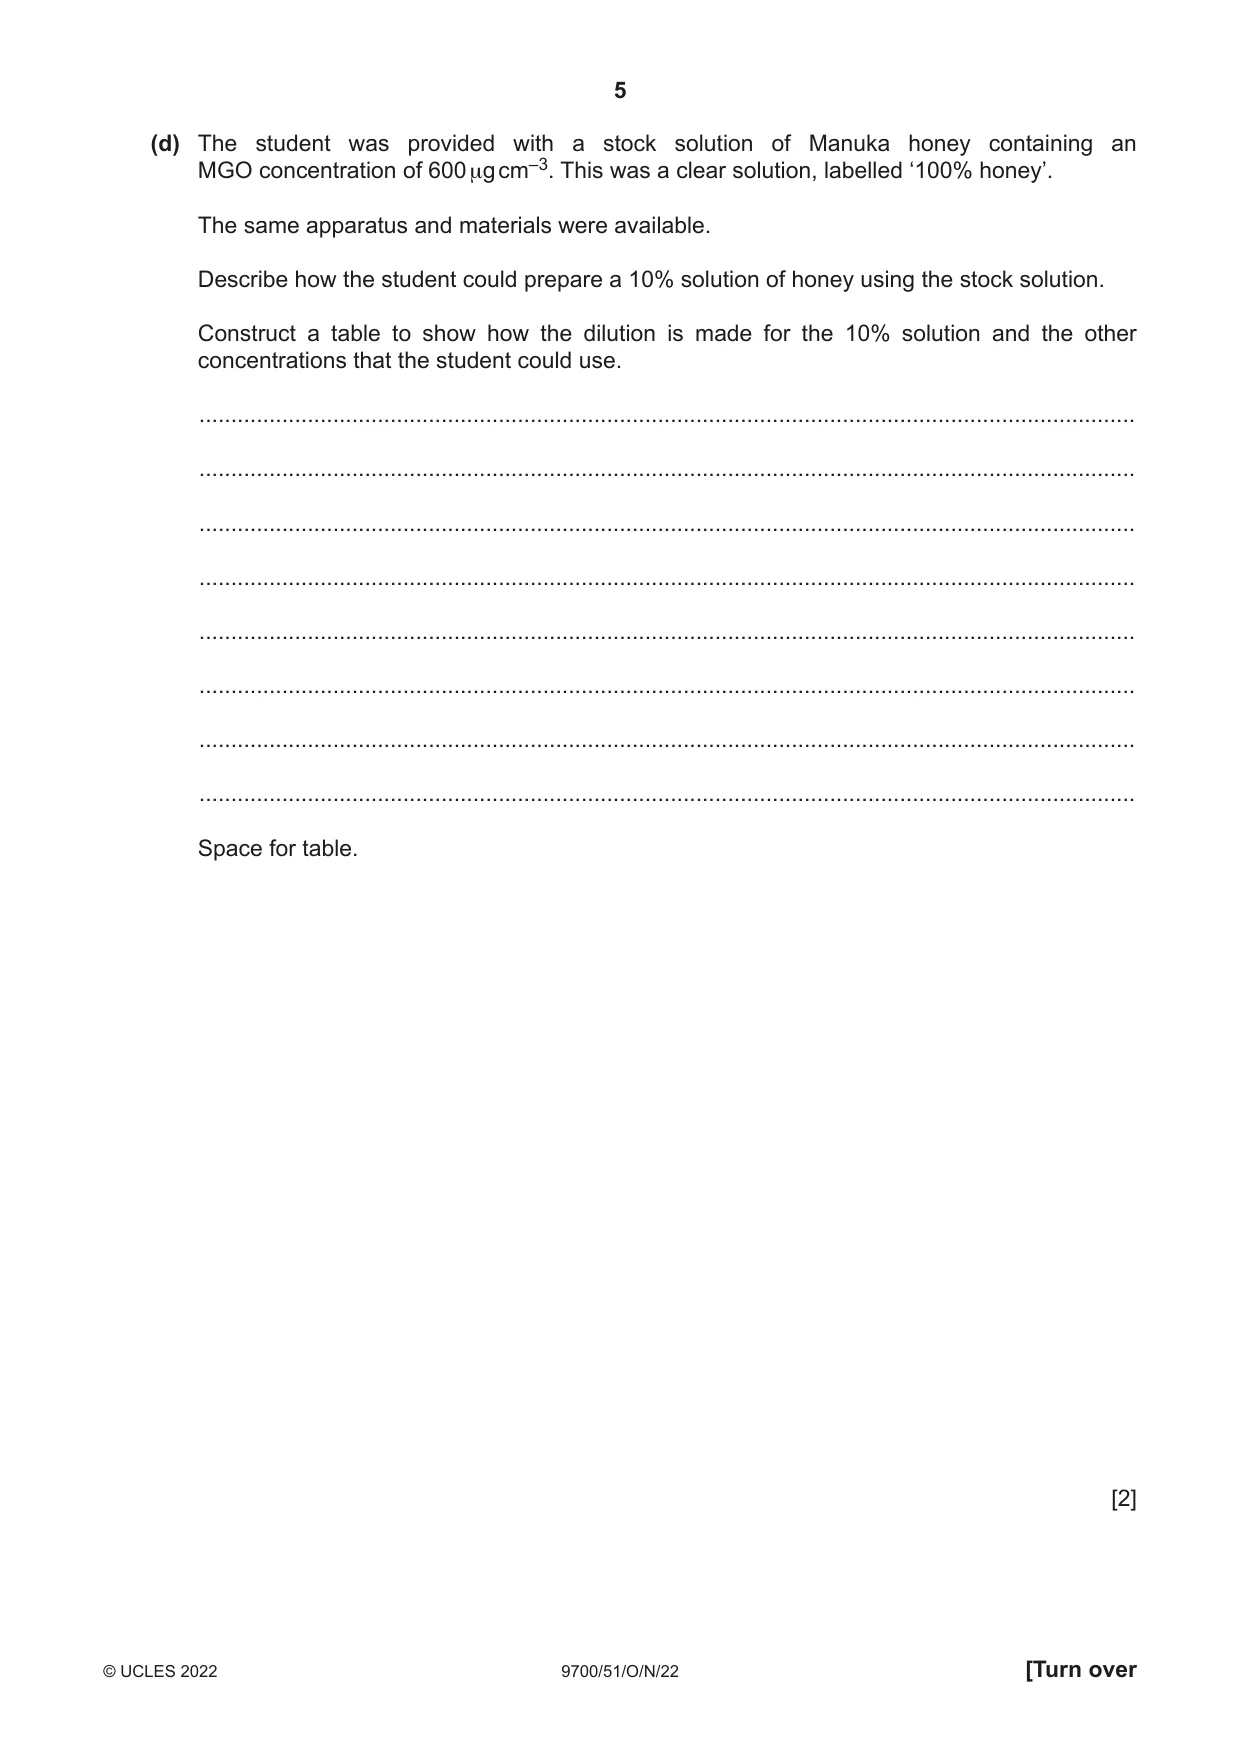
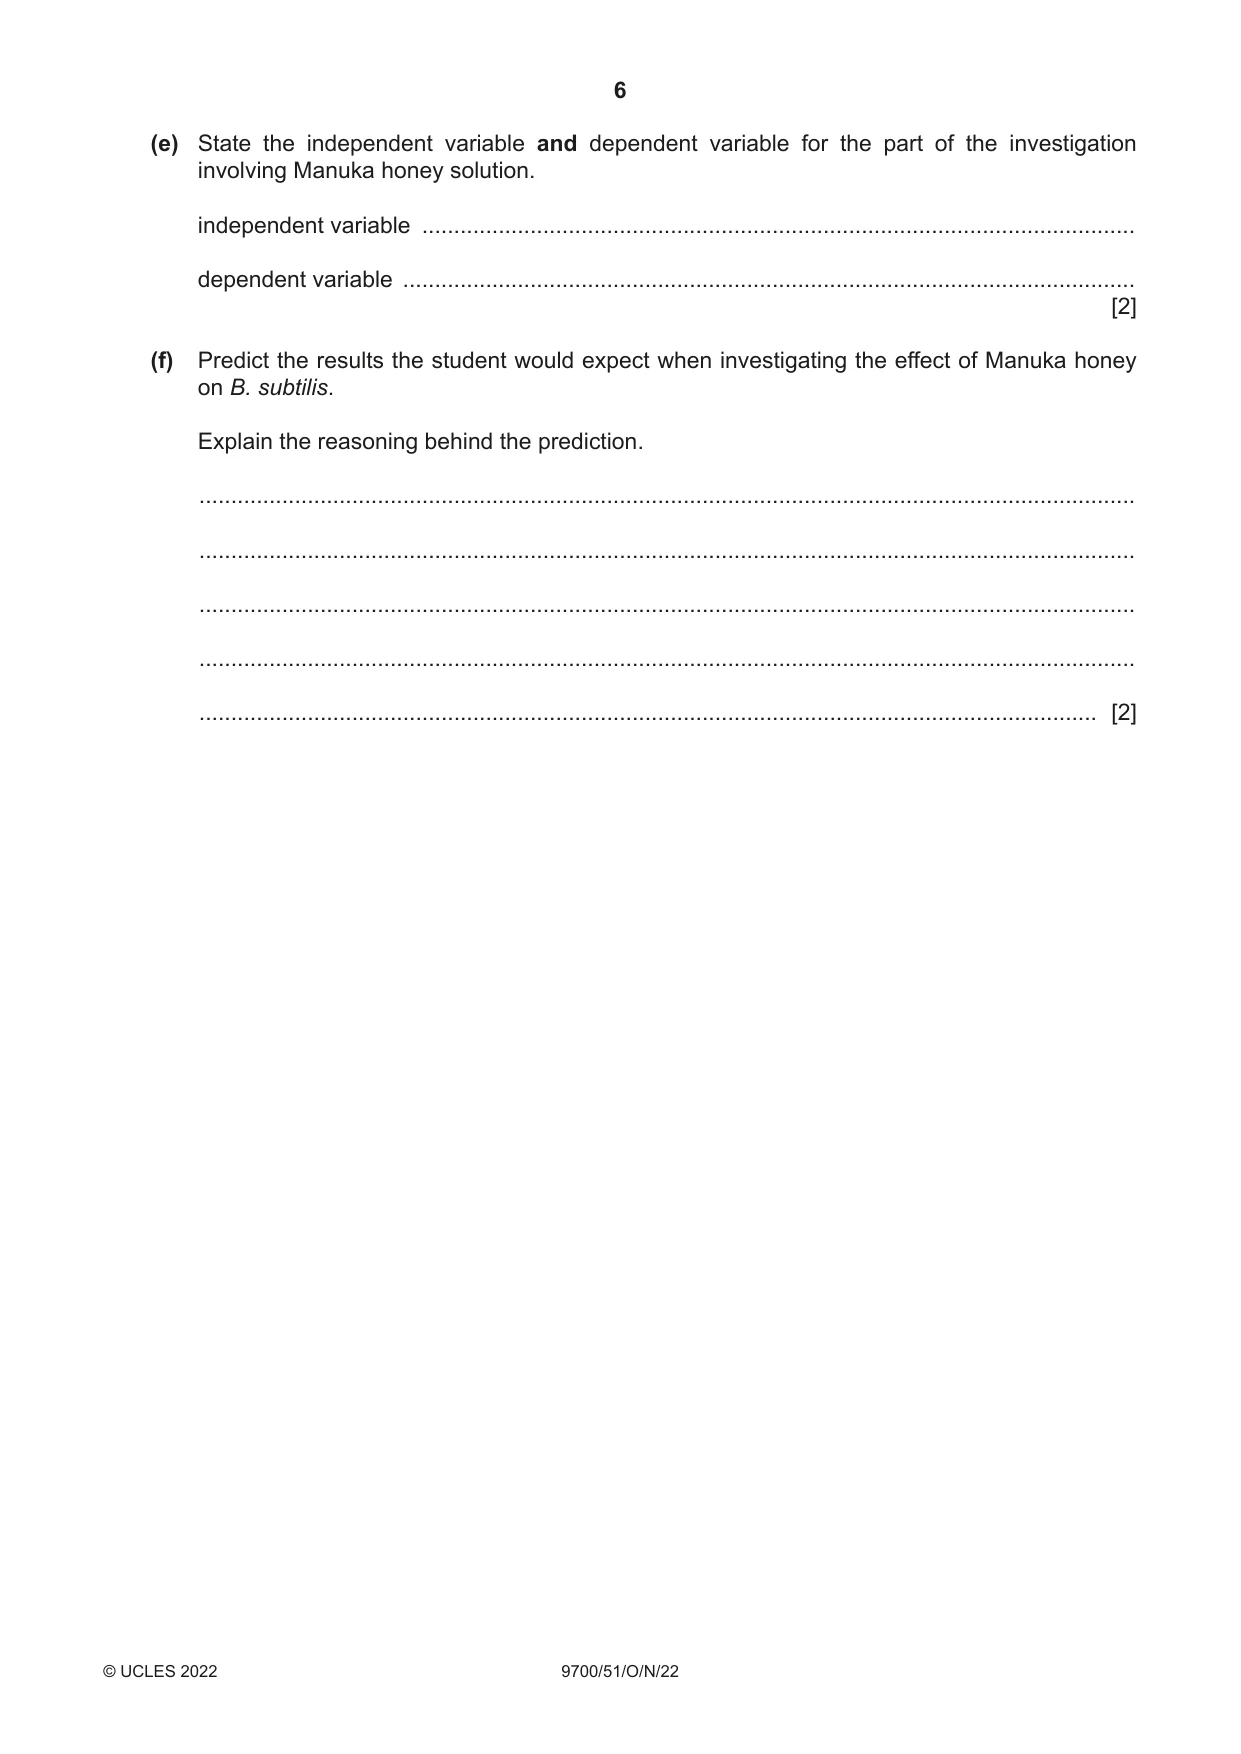
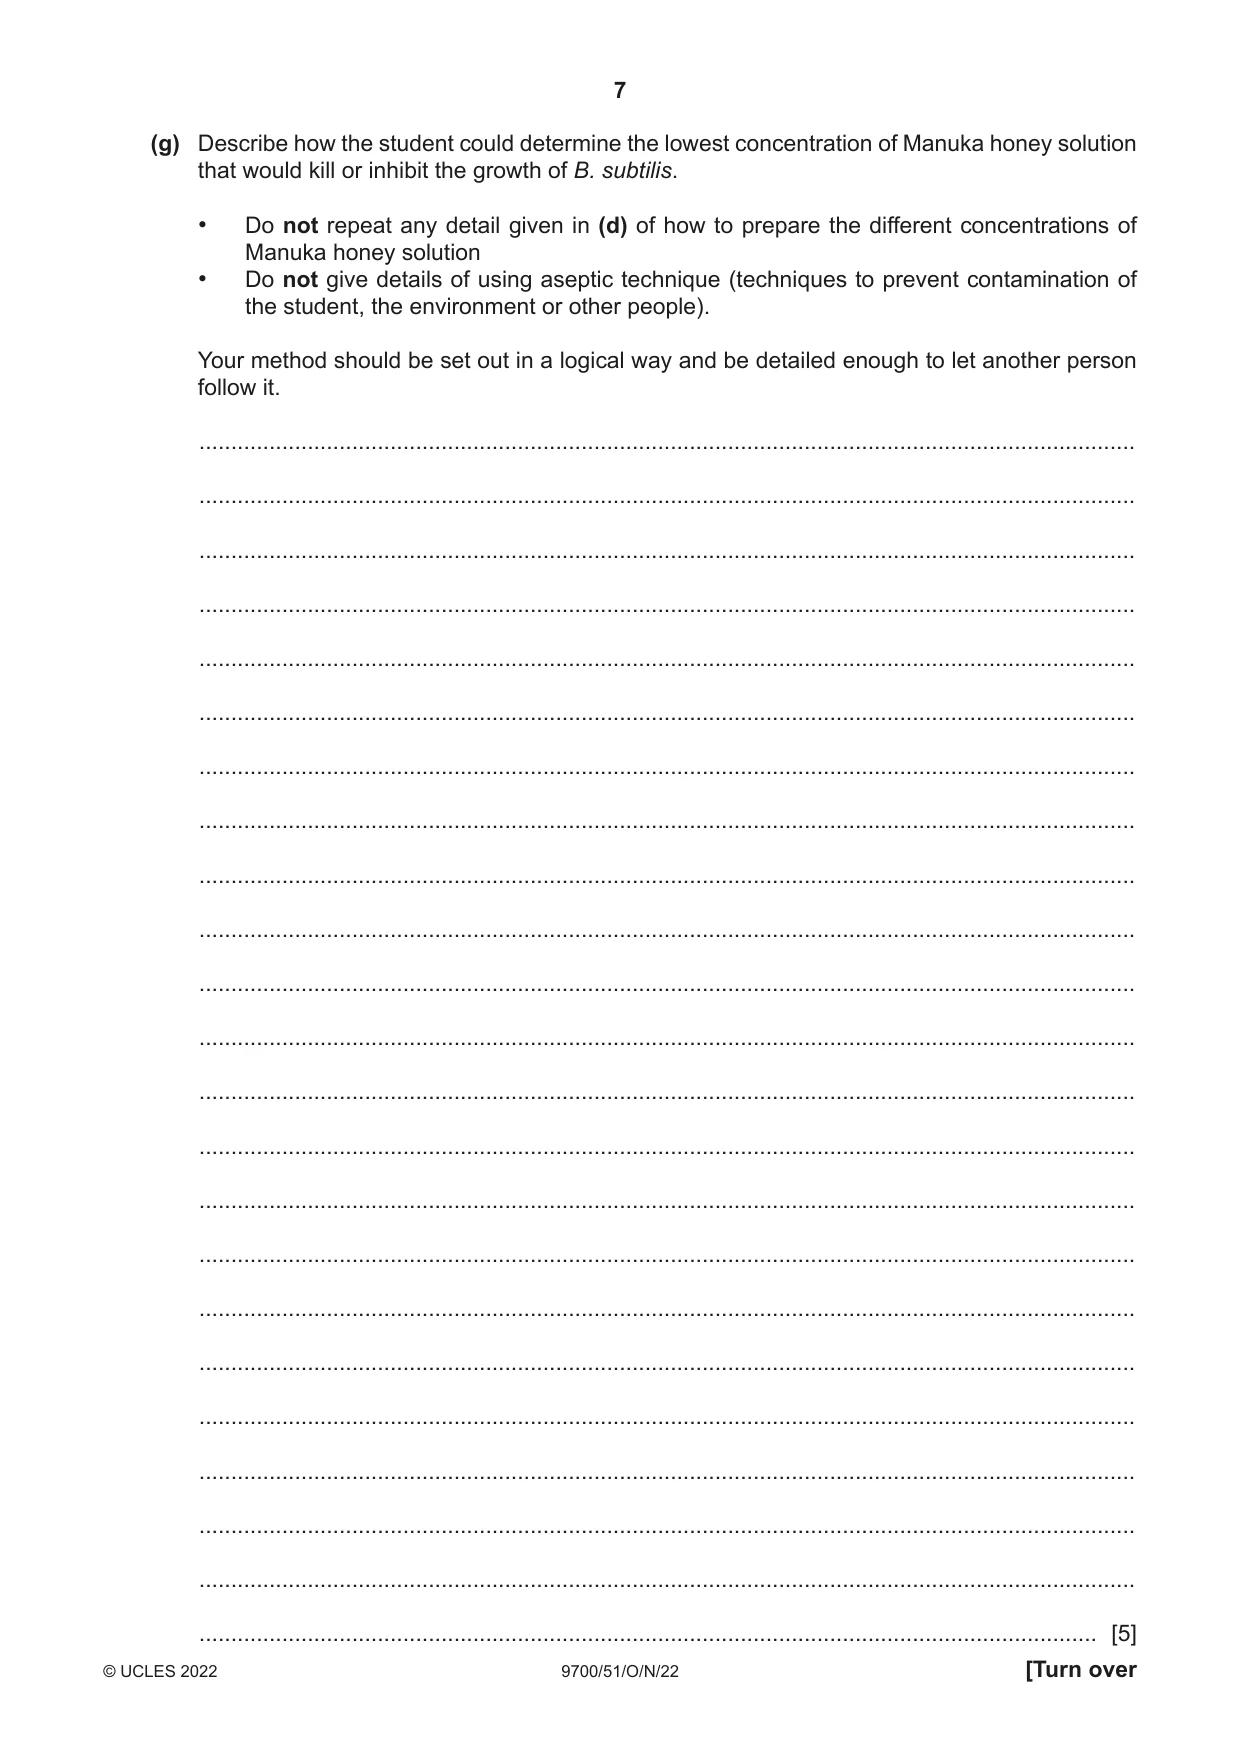
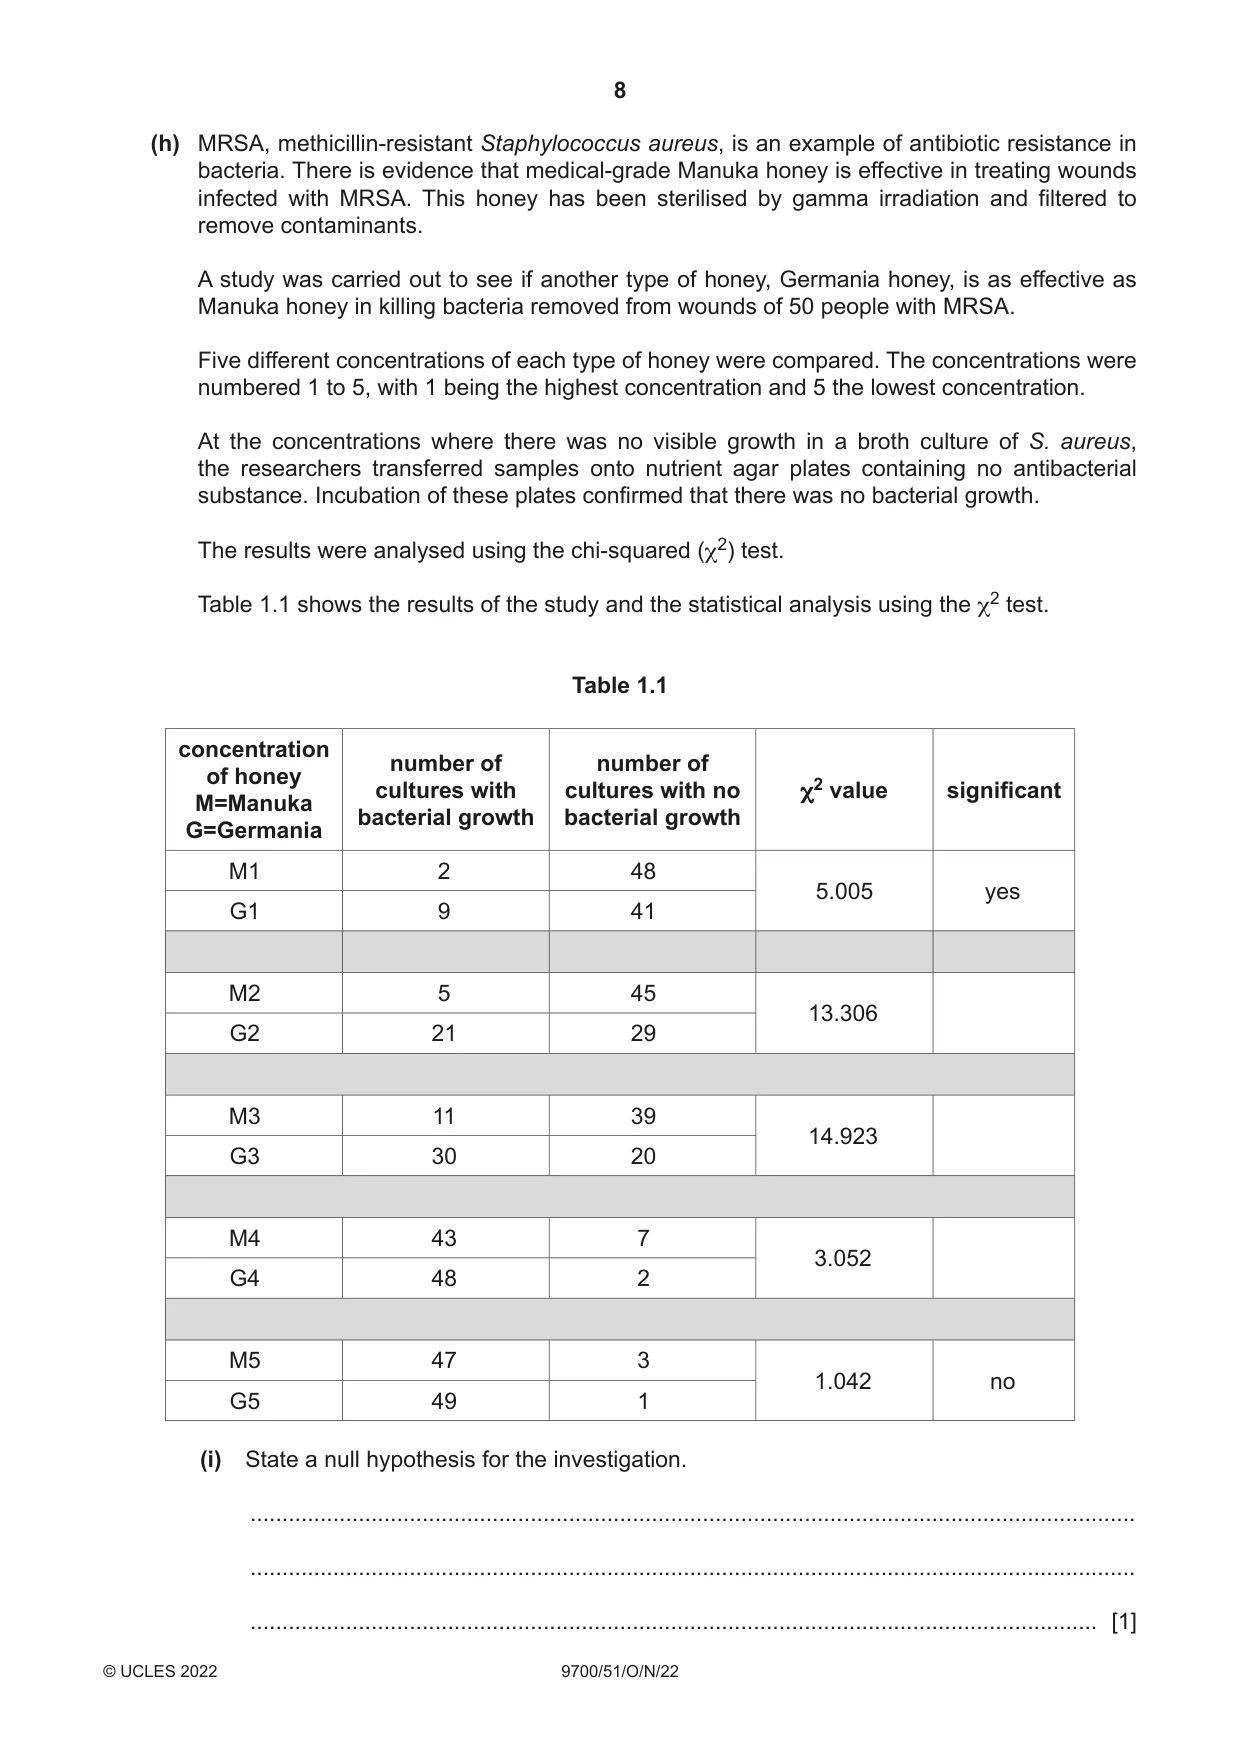
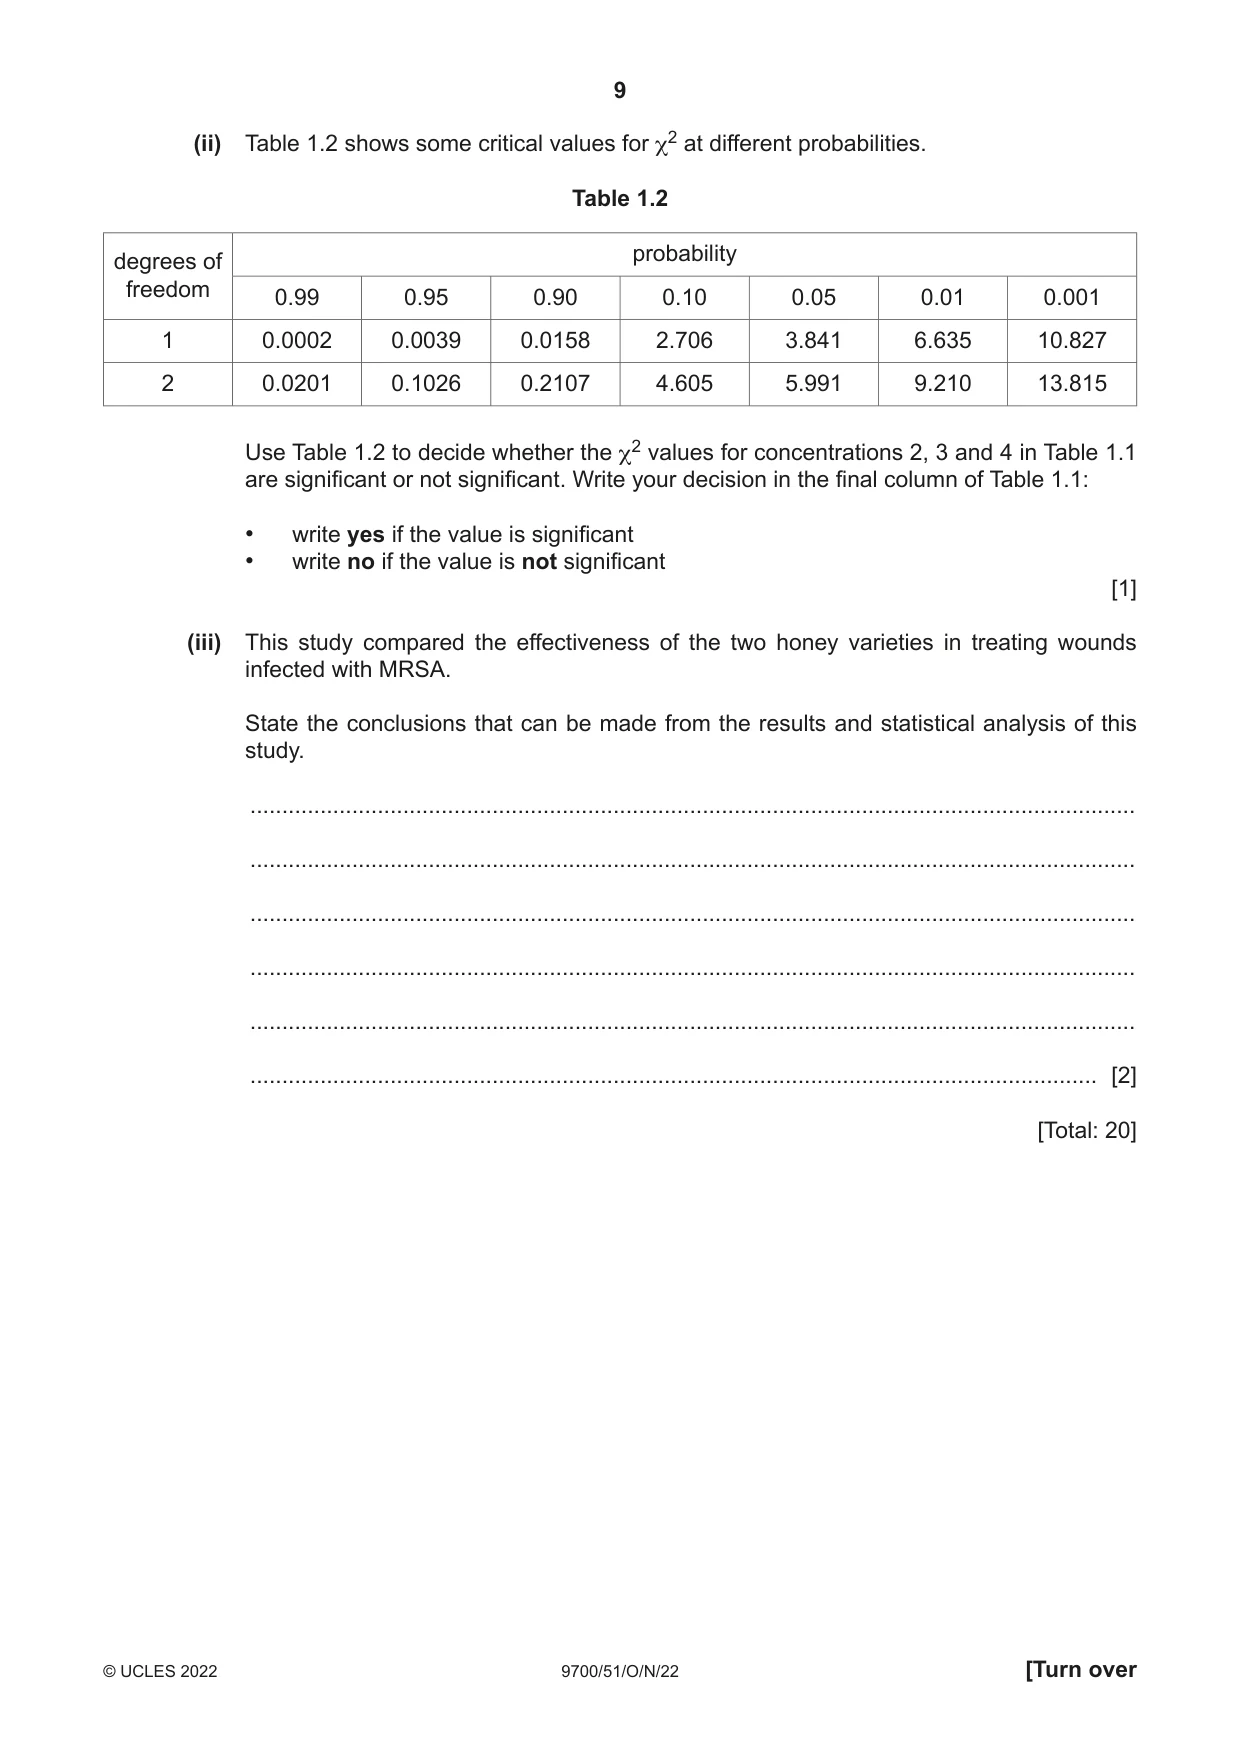
1 Antibiotic resistance in bacteria is a global problem that has caused scientists to research into antibacterial substances other than antibiotics. Honey has properties that make it a good antibacterial substance. For example, honey contains hydrogen peroxide, which is known to kill bacteria. The most effective honey tested so far for antibacterial activity is Manuka honey. It contains less hydrogen peroxide than many other types of honey, but it does contain an antibacterial compound, methylglyoxal (MGO), which is not found in other types of honey. A student decided to investigate the effect of two antibacterial substances on the bacterium Bacillus subtilis, which respires aerobically: • MGO in Manuka honey • an antibiotic solution used in cell cultures to prevent contamination. The student wanted to find the lowest concentration of each antibacterial substance that would kill or inhibit the growth of B. subtilis. (a) The student used a broth culture for the investigation. To make a broth culture, a small quantity of B. subtilis is added to a clear nutrient solution. A fresh (newly made) broth culture of B. subtilis is also clear. Fig. 1.1 is a diagram of a fresh broth culture of B. subtilis. cotton wool bung fresh broth culture Fig. 1.1 (i) A sterile cotton wool bung was used in the top of the flask containing the fresh broth culture of B. subtilis to protect the culture from contamination. Explain why it is better to use a sterile cotton wool bung in a flask containing broth culture of B. subtilis, rather than using a sterile rubber bung. ........................................................................................................................................... ..................................................................................................................................... [1] (ii) Before comparing the two antibacterial substances, the student carried out a trial experiment. The student transferred a sample of fresh broth culture to a culture tube and incubated the tube at 25 °C for 24 hours. Fig. 1.2 summarises the results of the trial experiment. cotton wool bung incubate at 25°C 15 cm3 culture tube turbid (cloudy) containing broth culture broth culture Fig. 1.2 The student decided that turbidity of the broth culture is a measure of bacterial population growth (bacterial growth). Explain how this concept can be used in an investigation to measure the extent of bacterial growth. ........................................................................................................................................... ........................................................................................................................................... ..................................................................................................................................... [1] (b) The student decided to test the antibiotic solution before testing the Manuka honey. In addition to normal laboratory apparatus and materials, the student was provided with: • a fresh broth culture of B. subtilis • a clear antibiotic stock solution • nutrient solution to dilute the antibiotic stock solution • 15 cm3 flat-bottomed glass culture tubes with sterile cotton wool bungs • a choice of graduated pipettes to measure volumes accurately: 0.2 cm3, 2.0 cm3, 10.0 cm3, 25.0 cm3. The student: • prepared dilutions of the antibiotic stock solution and added a volume of each to different culture tubes • added a volume of fresh broth culture of B. subtilis to each culture tube • incubated the culture tubes in an incubator • allowed time for bacterial growth to occur and then checked each culture tube • recorded and analysed the results • decided on the lowest concentration of antibiotic solution that appeared to kill or inhibit the growth of B. subtilis. Outline a control for this part of the investigation. ................................................................................................................................................... ................................................................................................................................................... ................................................................................................................................................... ............................................................................................................................................. [1] (c) In the next part of the investigation, the student used a stock solution of Manuka honey. The student remembered that hydrogen peroxide could be present but could not think of a way to break down the hydrogen peroxide to remove it from the solution. Describe how the student can improve the investigation by removing hydrogen peroxide from the Manuka honey solution and explain why this improvement makes the results more valid. ................................................................................................................................................... ................................................................................................................................................... ................................................................................................................................................... ................................................................................................................................................... ................................................................................................................................................... ............................................................................................................................................. [2] (d) The student was provided with a stock solution of Manuka honey containing an MGO concentration of 600 μg cm–3. This was a clear solution, labelled ‘100% honey’. The same apparatus and materials were available. Describe how the student could prepare a 10% solution of honey using the stock solution. Construct a table to show how the dilution is made for the 10% solution and the other concentrations that the student could use. ................................................................................................................................................... ................................................................................................................................................... ................................................................................................................................................... ................................................................................................................................................... ................................................................................................................................................... ................................................................................................................................................... ................................................................................................................................................... ................................................................................................................................................... Space for table. [2] (e) State the independent variable and dependent variable for the part of the investigation involving Manuka honey solution. independent variable ................................................................................................................ dependent variable ................................................................................................................... [2] (f) Predict the results the student would expect when investigating the effect of Manuka honey on B. subtilis. Explain the reasoning behind the prediction. ................................................................................................................................................... ................................................................................................................................................... ................................................................................................................................................... ................................................................................................................................................... ............................................................................................................................................. [2] (g) Describe how the student could determine the lowest concentration of Manuka honey solution that would kill or inhibit the growth of B. subtilis. • Do not repeat any detail given in (d) of how to prepare the different concentrations of Manuka honey solution • Do not give details of using aseptic technique (techniques to prevent contamination of the student, the environment or other people). Your method should be set out in a logical way and be detailed enough to let another person follow it. ................................................................................................................................................... ................................................................................................................................................... ................................................................................................................................................... ................................................................................................................................................... ................................................................................................................................................... ................................................................................................................................................... ................................................................................................................................................... ................................................................................................................................................... ................................................................................................................................................... ................................................................................................................................................... ................................................................................................................................................... ................................................................................................................................................... ................................................................................................................................................... ................................................................................................................................................... ................................................................................................................................................... ................................................................................................................................................... ................................................................................................................................................... ................................................................................................................................................... ................................................................................................................................................... ................................................................................................................................................... ................................................................................................................................................... ................................................................................................................................................... ............................................................................................................................................. [5] (h) MRSA, methicillin-resistant Staphylococcus aureus, is an example of antibiotic resistance in bacteria. There is evidence that medical-grade Manuka honey is effective in treating wounds infected with MRSA. This honey has been sterilised by gamma irradiation and filtered to remove contaminants. A study was carried out to see if another type of honey, Germania honey, is as effective as Manuka honey in killing bacteria removed from wounds of 50 people with MRSA. Five different concentrations of each type of honey were compared. The concentrations were numbered 1 to 5, with 1 being the highest concentration and 5 the lowest concentration. At the concentrations where there was no visible growth in a broth culture of S. aureus, the researchers transferred samples onto nutrient agar plates containing no antibacterial substance. Incubation of these plates confirmed that there was no bacterial growth. The results were analysed using the chi-squared (χ2) test. Table 1.1 shows the results of the study and the statistical analysis using the χ2 test. Table 1.1 concentration number of number of of honey cultures with cultures with no χ2 value significant M=Manuka bacterial growth bacterial growth G=Germania M1 2 48 5.005 yes G1 9 41 M2 5 45 13.306 G2 21 29 M3 11 39 14.923 G3 30 20 M4 43 7 3.052 G4 48 2 M5 47 3 1.042 no G5 49 1 (i) State a null hypothesis for the investigation. ........................................................................................................................................... ........................................................................................................................................... ..................................................................................................................................... [1] (ii) Table 1.2 shows some critical values for χ2 at different probabilities. Table 1.2 probabilitydegrees of freedom 0.99 0.95 0.90 0.10 0.05 0.01 0.001 1 0.0002 0.0039 0.0158 2.706 3.841 6.635 10.827 2 0.0201 0.1026 0.2107 4.605 5.991 9.210 13.815 Use Table 1.2 to decide whether the χ2 values for concentrations 2, 3 and 4 in Table 1.1 are significant or not significant. Write your decision in the final column of Table 1.1: • write yes if the value is significant • write no if the value is not significant [1] (iii) This study compared the effectiveness of the two honey varieties in treating wounds infected with MRSA. State the conclusions that can be made from the results and statistical analysis of this study. ........................................................................................................................................... ........................................................................................................................................... ........................................................................................................................................... ........................................................................................................................................... ........................................................................................................................................... ..................................................................................................................................... [2] [Total: 20]
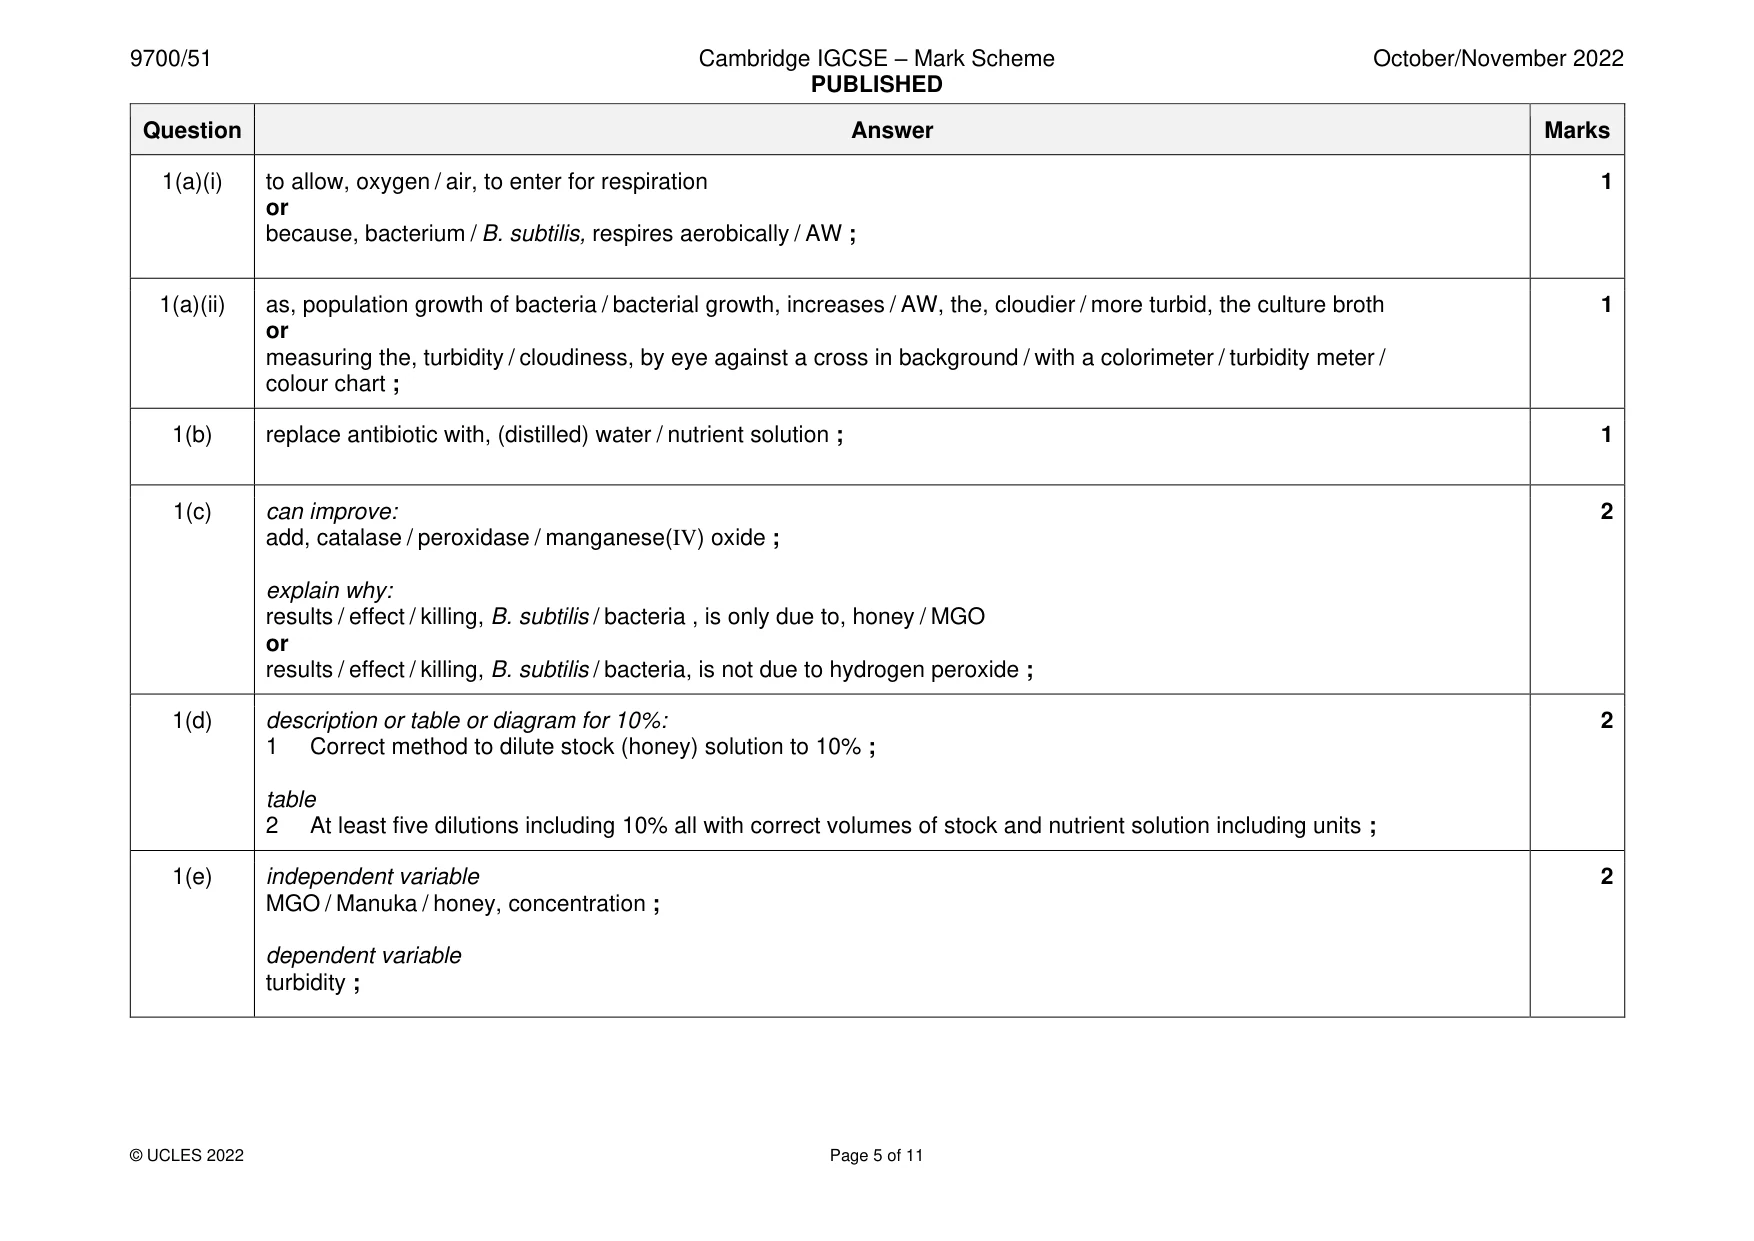
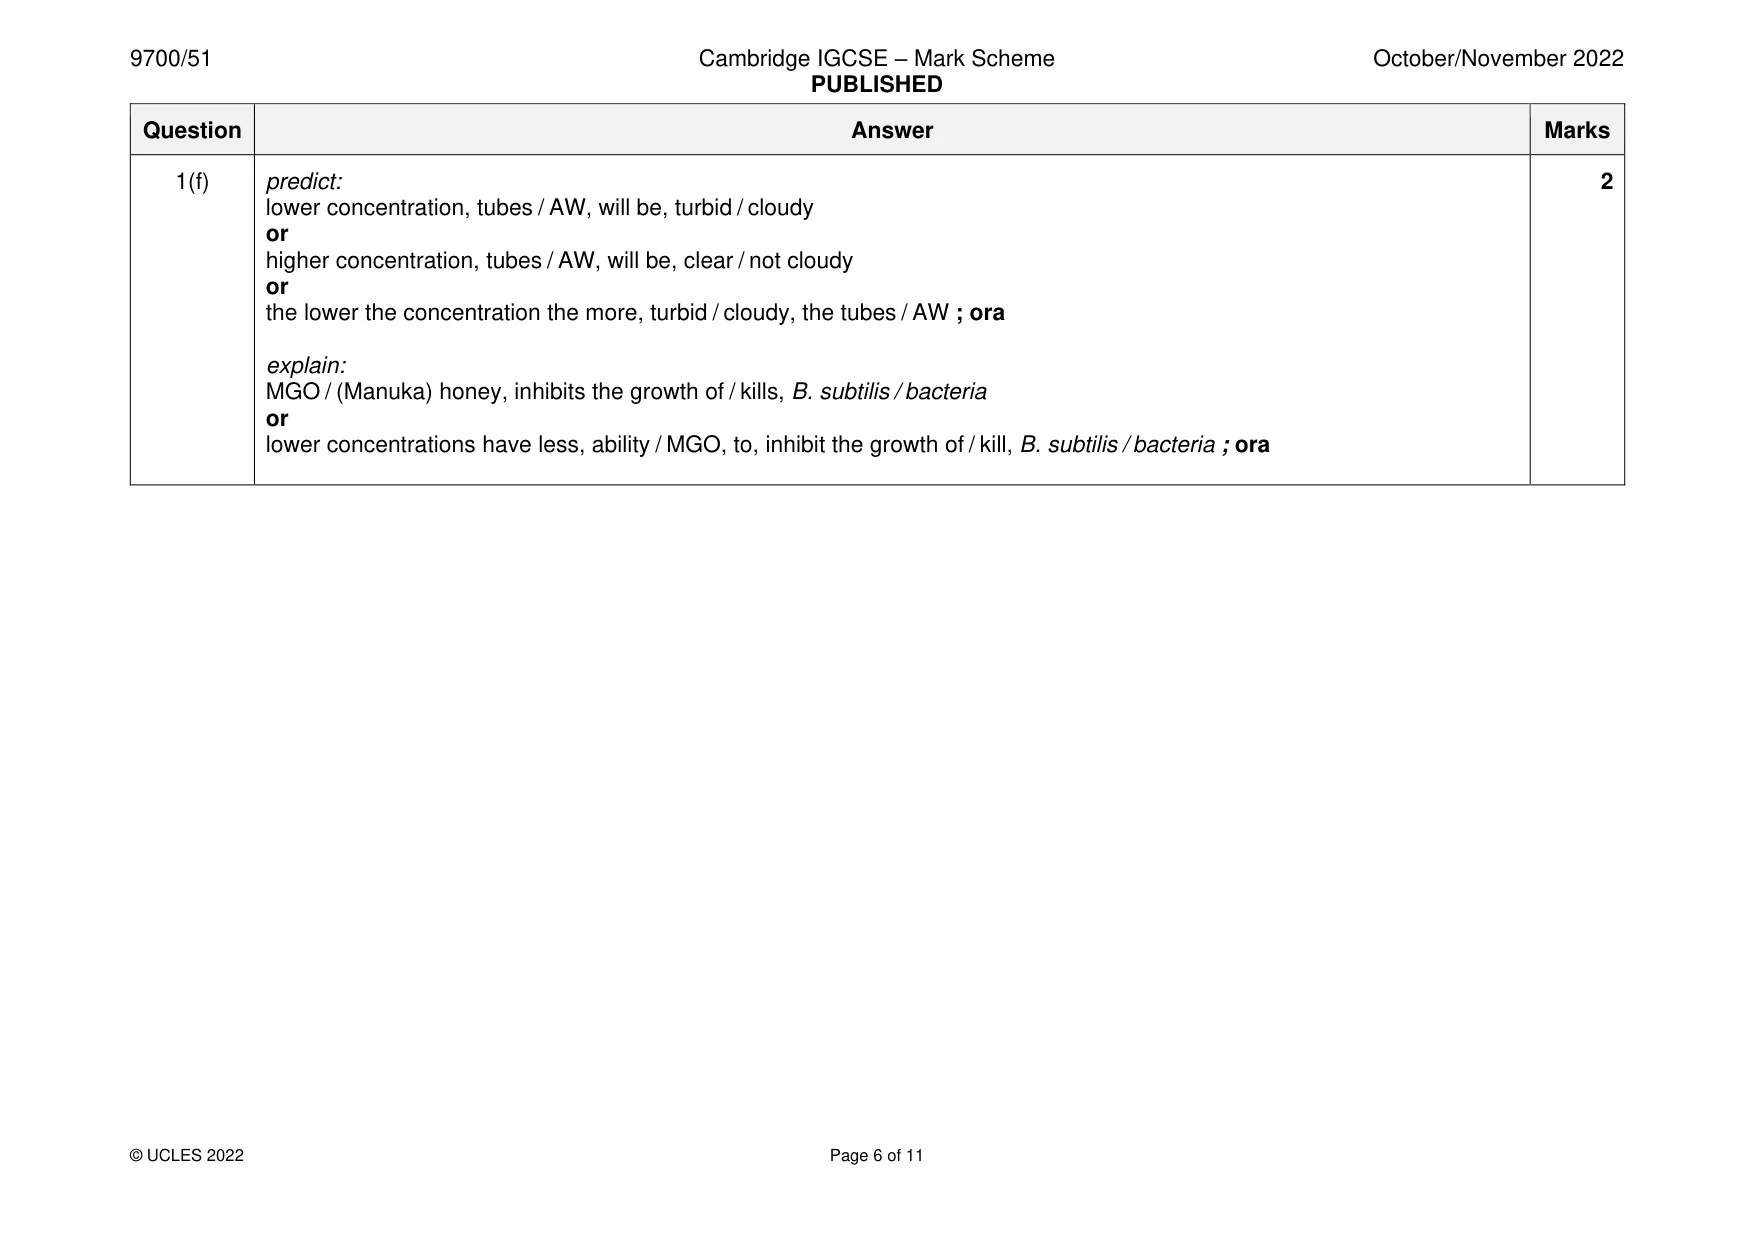
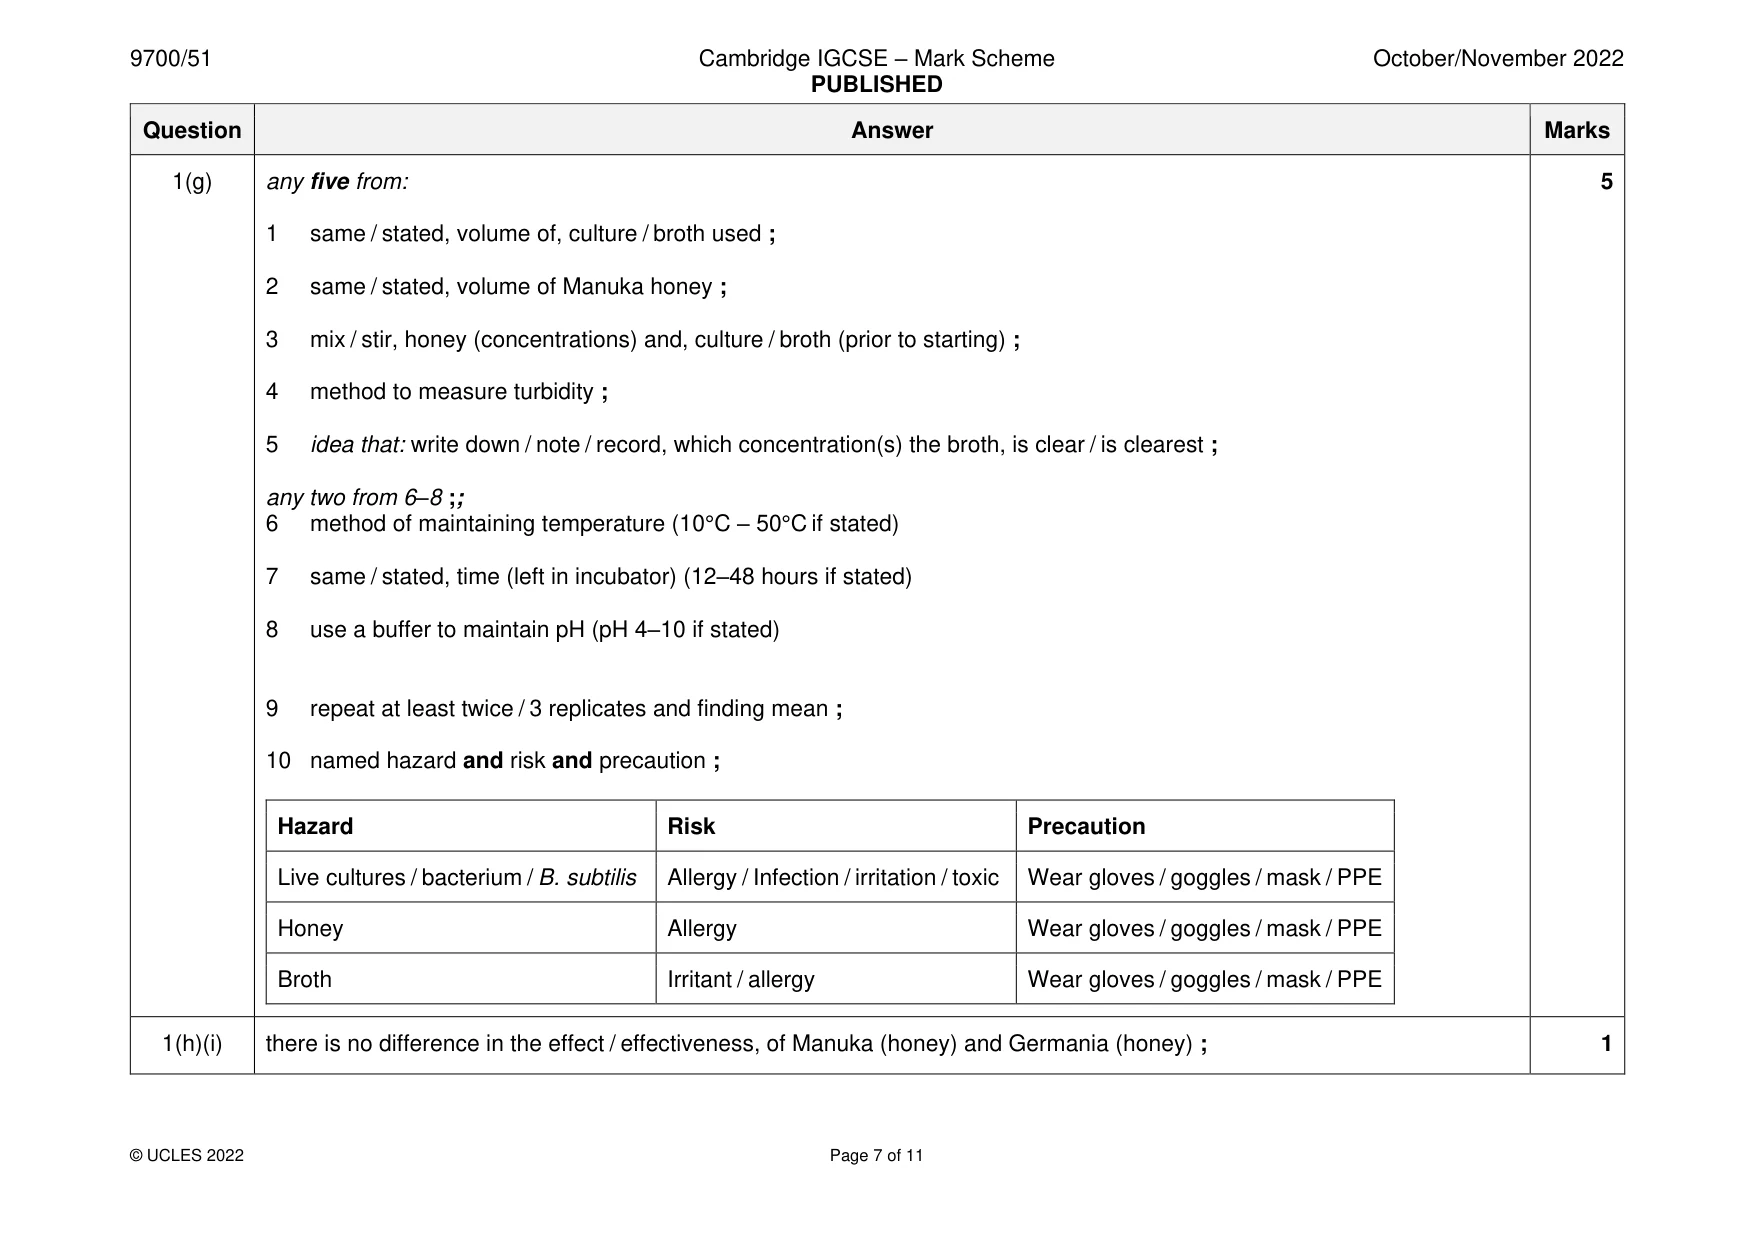
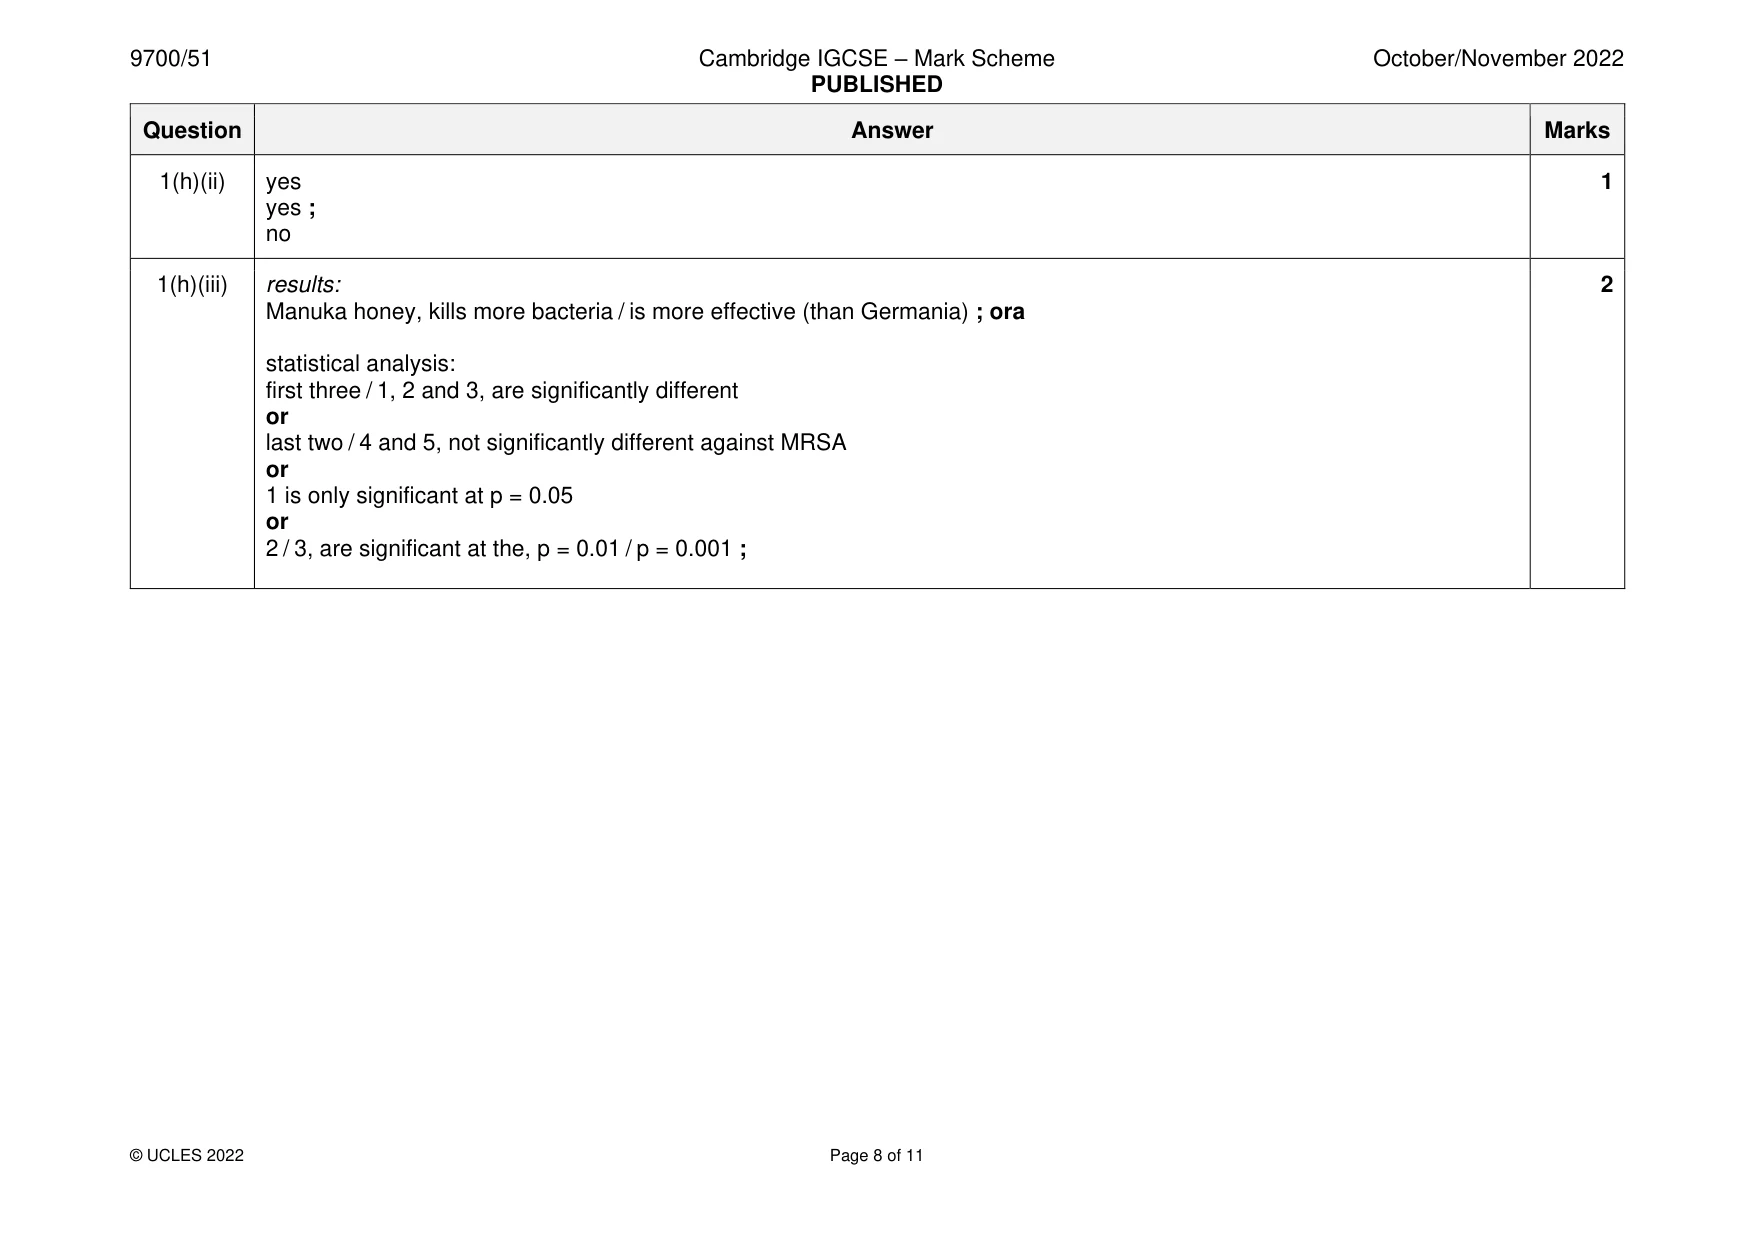
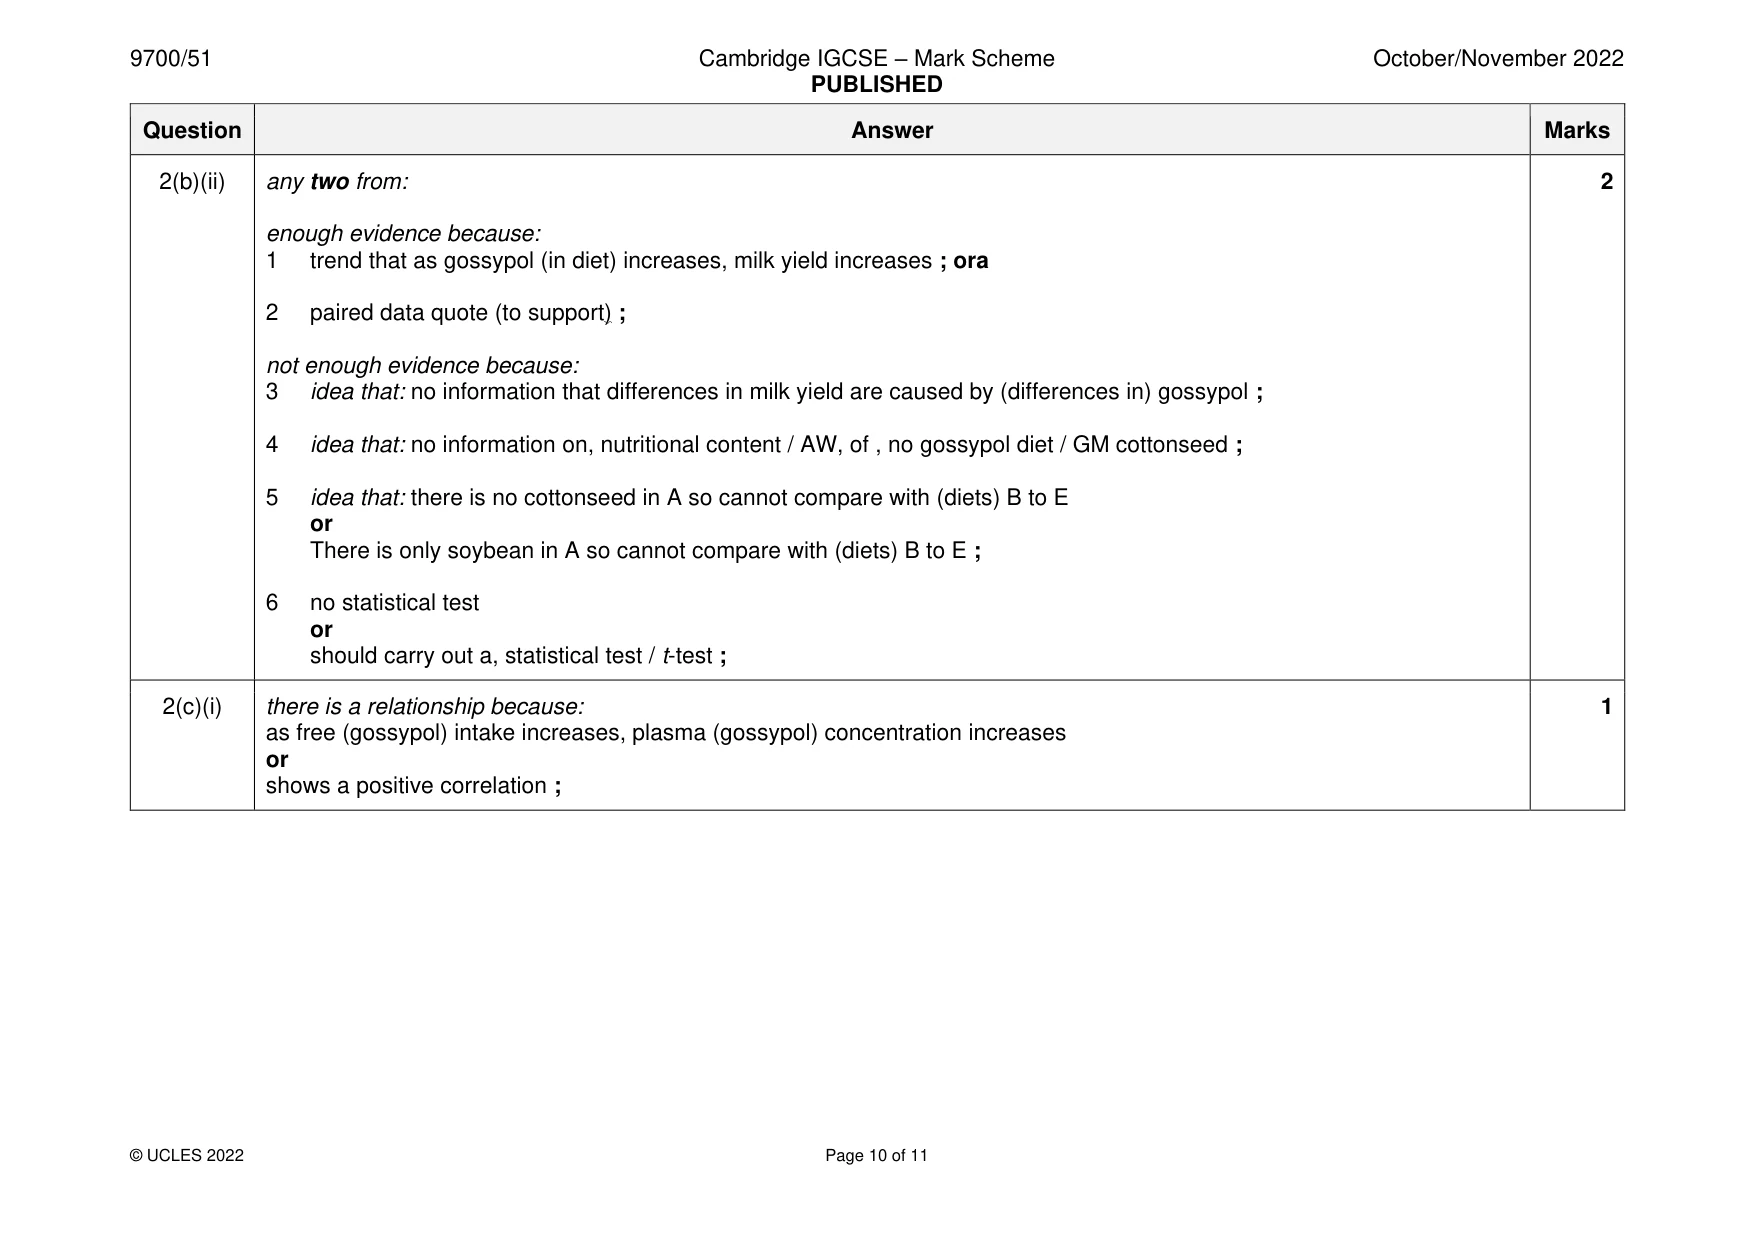
Mark scheme: Question Answer Marks 1(a)(i) to allow, oxygen / air, to enter for respiration 1 or because, bacterium / B. subtilis, respires aerobically / AW ; 1(a)(ii) as, population growth of bacteria / bacterial growth, increases / AW, the, cloudier / more turbid, the culture broth 1 or measuring the, turbidity / cloudiness, by eye against a cross in background / with a colorimeter / turbidity meter / colour chart ; 1(b) replace antibiotic with, (distilled) water / nutrient solution ; 1 1(c) can improve: 2 add, catalase / peroxidase / manganese(IV) oxide ; explain why: results / effect / killing, B. subtilis / bacteria , is only due to, honey / MGO or results / effect / killing, B. subtilis / bacteria, is not due to hydrogen peroxide ; 1(d) description or table or diagram for 10%: 2 1 Correct method to dilute stock (honey) solution to 10% ; table 2 At least five dilutions including 10% all with correct volumes of stock and nutrient solution including units ; 1(e) independent variable 2 MGO / Manuka / honey, concentration ; dependent variable turbidity ; 1(f) predict: 2 lower concentration, tubes / AW, will be, turbid / cloudy or higher concentration, tubes / AW, will be, clear / not cloudy or the lower the concentration the more, turbid / cloudy, the tubes / AW ; ora explain: MGO / (Manuka) honey, inhibits the growth of / kills, B. subtilis / bacteria or lower concentrations have less, ability / MGO, to, inhibit the growth of / kill, B. subtilis / bacteria ; ora 1(g) any five from: 5 1 same / stated, volume of, culture / broth used ; 2 same / stated, volume of Manuka honey ; 3 mix / stir, honey (concentrations) and, culture / broth (prior to starting) ; 4 method to measure turbidity ; 5 idea that: write down / note / record, which concentration(s) the broth, is clear / is clearest ; any two from 6–8 ;; 6 method of maintaining temperature (10°C – 50°C if stated) 7 same / stated, time (left in incubator) (12–48 hours if stated) 8 use a buffer to maintain pH (pH 4–10 if stated) 9 repeat at least twice / 3 replicates and finding mean ; 10 named hazard and risk and precaution ; Hazard Risk Precaution Live cultures / bacterium / B. subtilis Allergy / Infection / irritation / toxic Wear gloves / goggles / mask / PPE Honey Allergy Wear gloves / goggles / mask / PPE Broth Irritant / allergy Wear gloves / goggles / mask / PPE 1(h)(i) there is no difference in the effect / effectiveness, of Manuka (honey) and Germania (honey) ; 1 1(h)(ii) yes 1 yes ; no 1(h)(iii) results: 2 Manuka honey, kills more bacteria / is more effective (than Germania) ; ora statistical analysis: first three / 1, 2 and 3, are significantly different or last two / 4 and 5, not significantly different against MRSA or 1 is only significant at p = 0.05 or 2 / 3, are significant at the, p = 0.01 / p = 0.001 ;
Q2 · Holstein cattle have been selectively bred for their high milk production
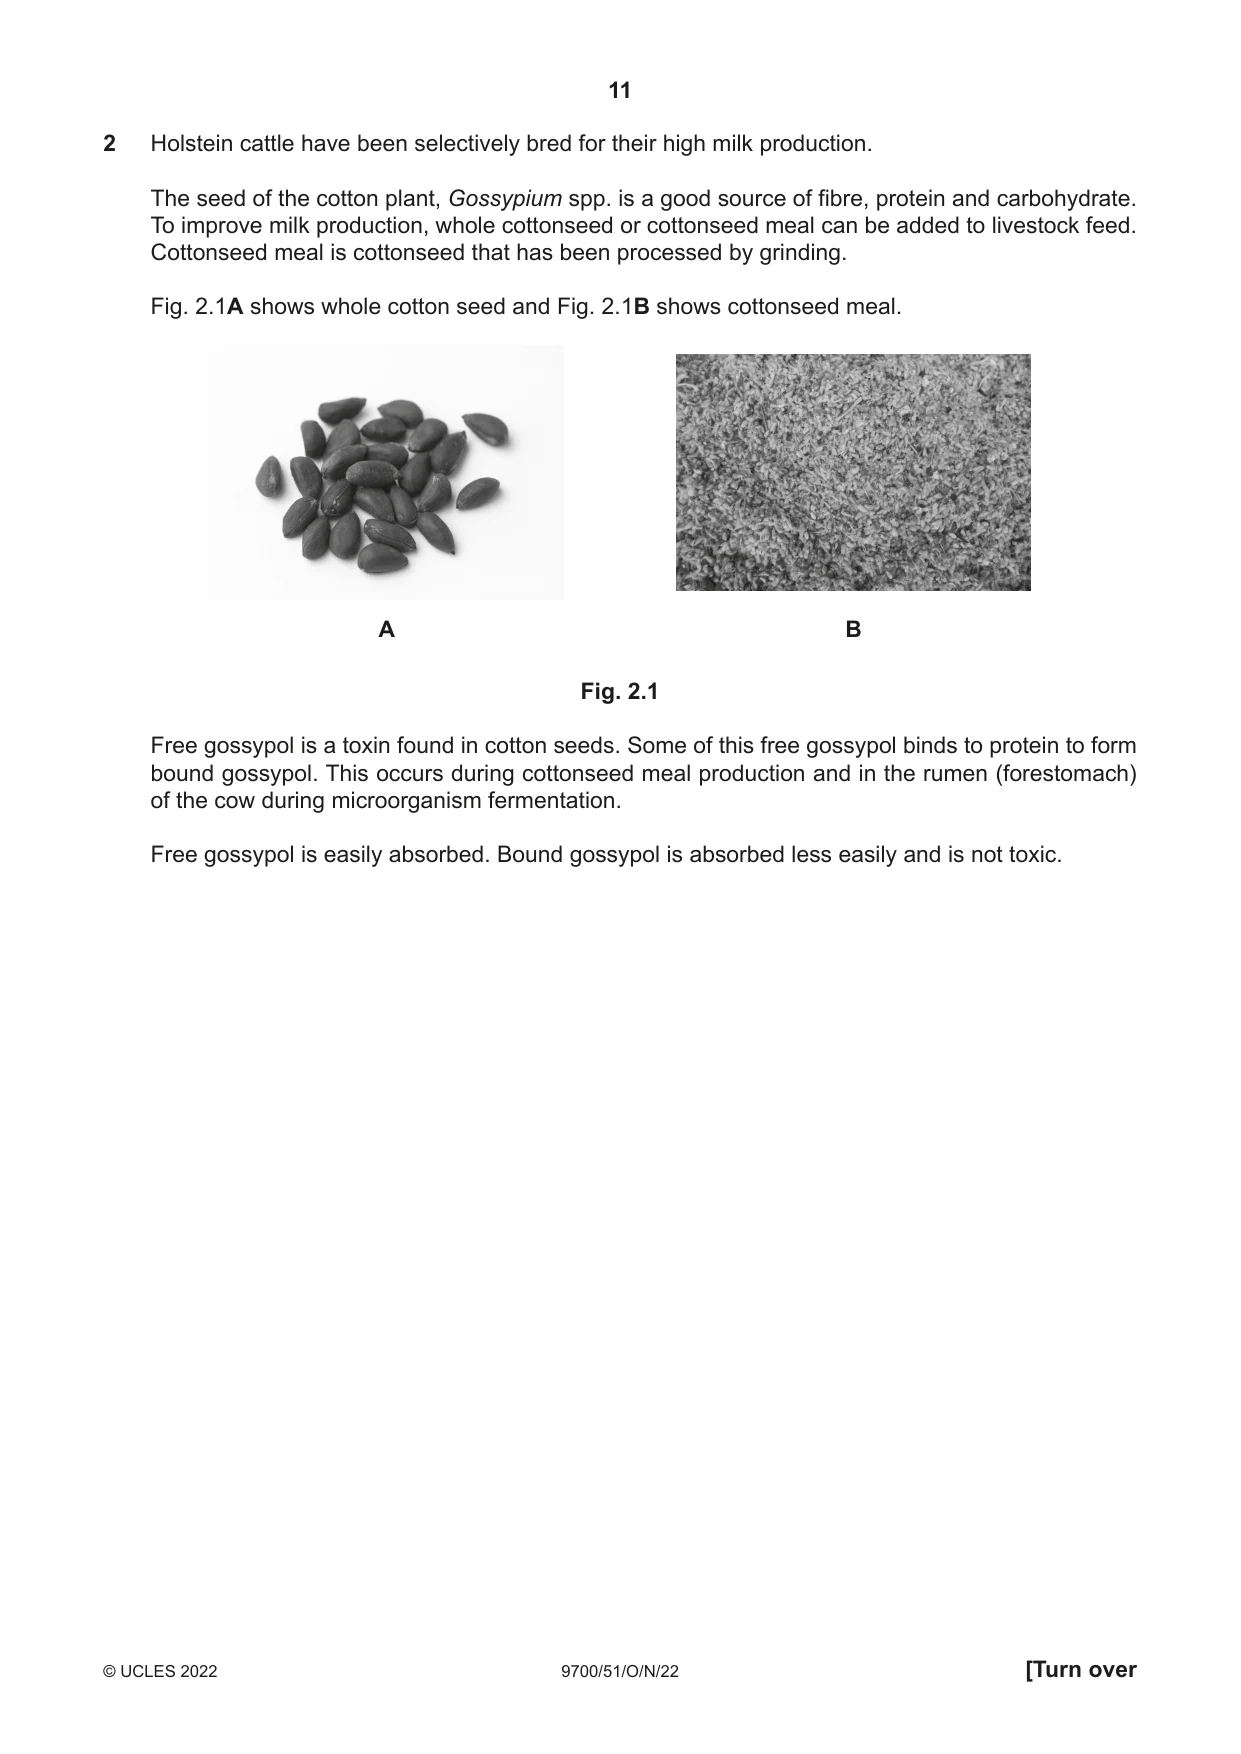
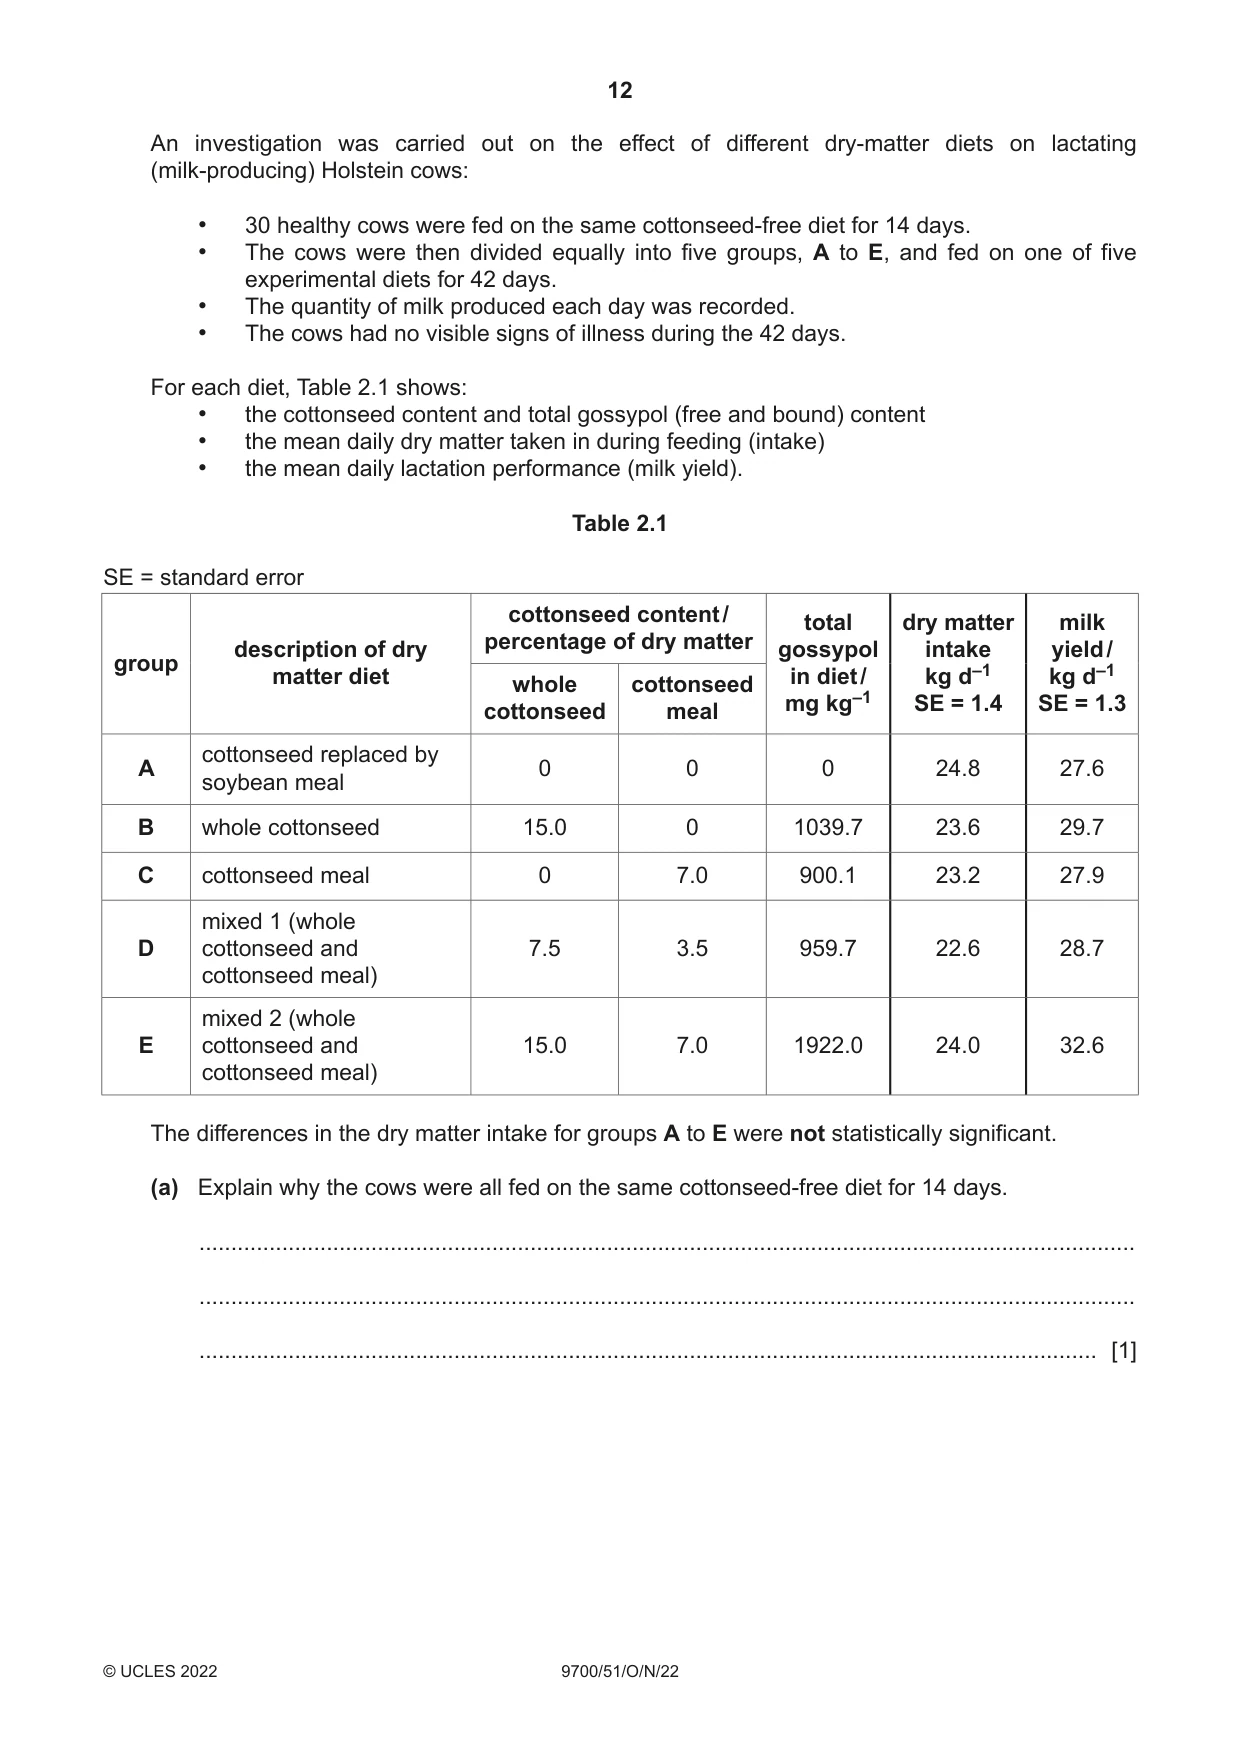
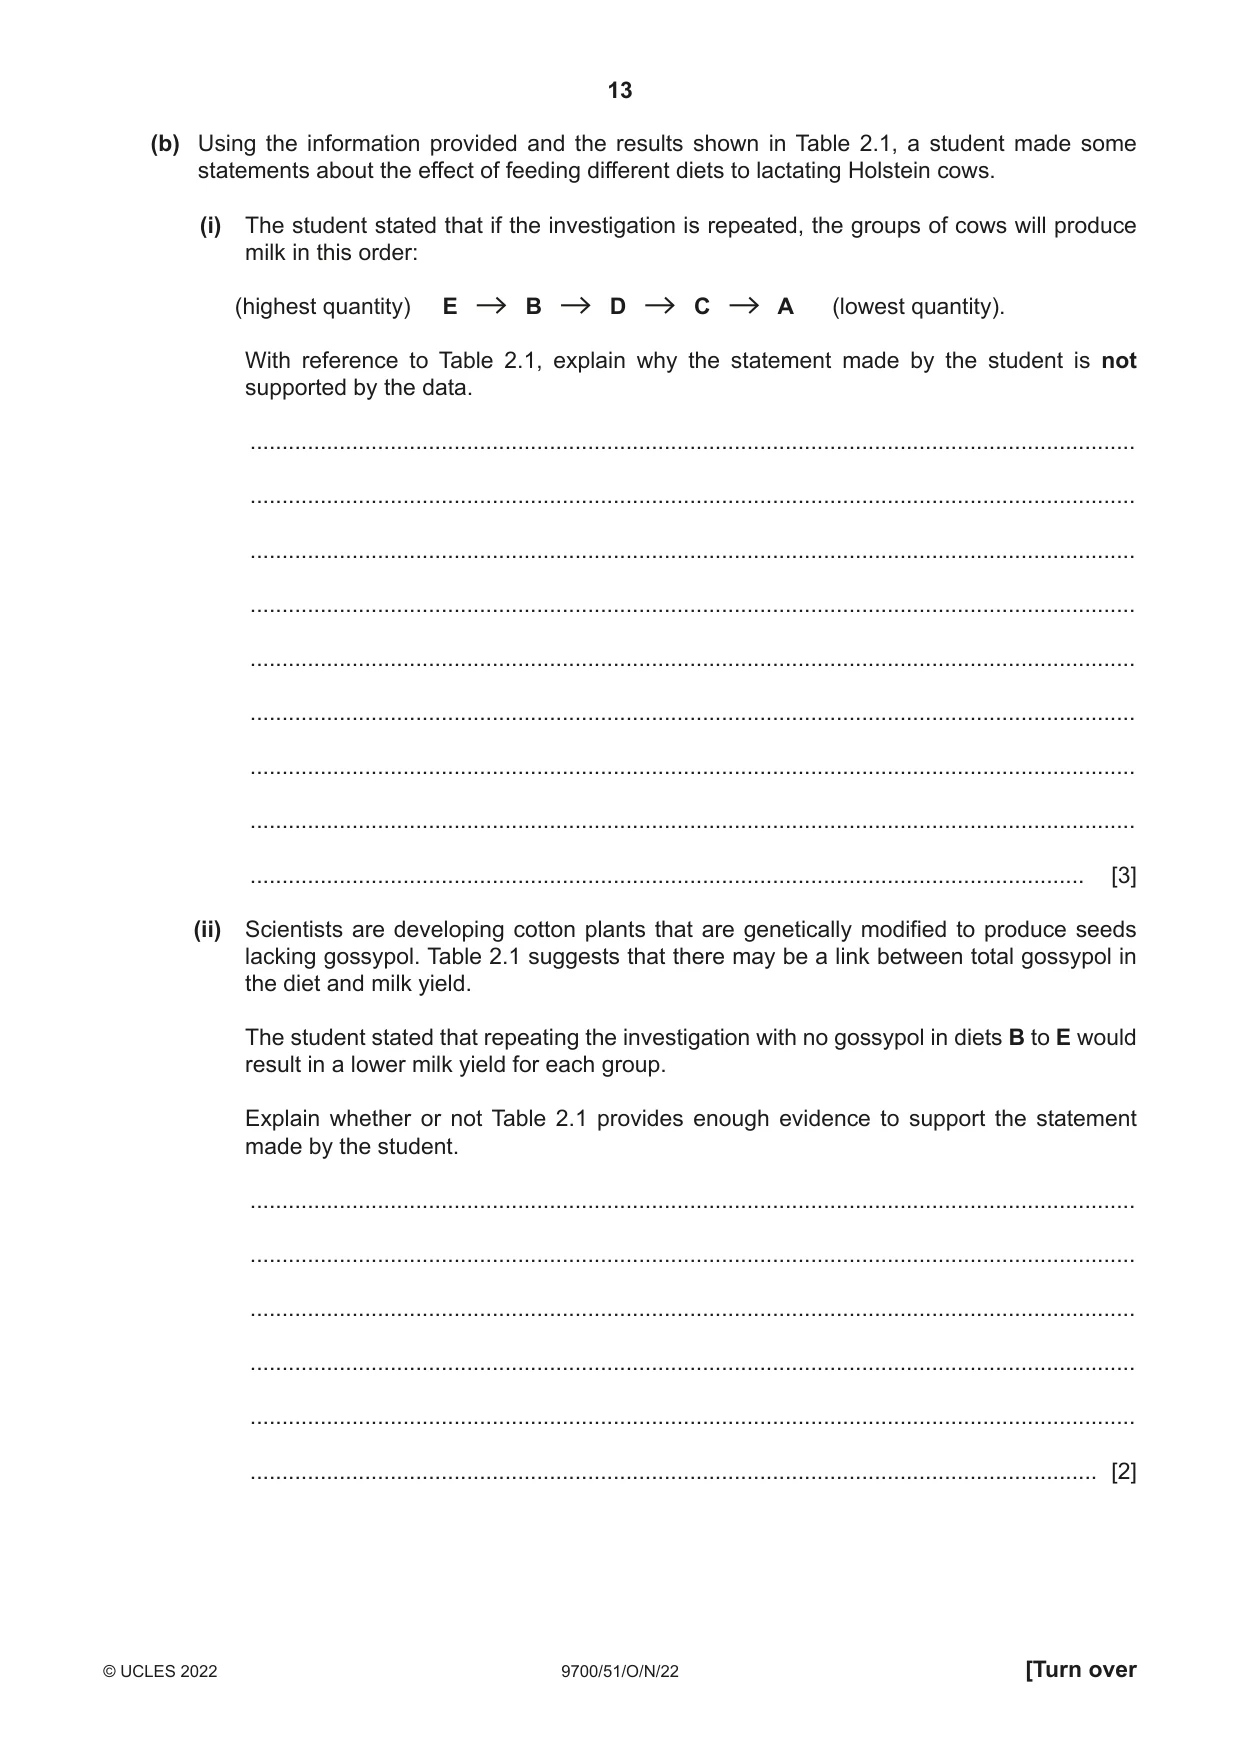
2 Holstein cattle have been selectively bred for their high milk production. The seed of the cotton plant, Gossypium spp. is a good source of fibre, protein and carbohydrate. To improve milk production, whole cottonseed or cottonseed meal can be added to livestock feed. Cottonseed meal is cottonseed that has been processed by grinding. Fig. 2.1A shows whole cotton seed and Fig. 2.1B shows cottonseed meal. A B Fig. 2.1 Free gossypol is a toxin found in cotton seeds. Some of this free gossypol binds to protein to form bound gossypol. This occurs during cottonseed meal production and in the rumen (forestomach) of the cow during microorganism fermentation. Free gossypol is easily absorbed. Bound gossypol is absorbed less easily and is not toxic. An investigation was carried out on the effect of different dry-matter diets on lactating (milk-producing) Holstein cows: • 30 healthy cows were fed on the same cottonseed-free diet for 14 days. • The cows were then divided equally into five groups, A to E, and fed on one of five experimental diets for 42 days. • The quantity of milk produced each day was recorded. • The cows had no visible signs of illness during the 42 days. For each diet, Table 2.1 shows: • the cottonseed content and total gossypol (free and bound) content • the mean daily dry matter taken in during feeding (intake) • the mean daily lactation performance (milk yield). Table 2.1 SE = standard error cottonseed content / total dry matter milk percentage of dry matter description of dry gossypol intake yield / group matter diet in diet / kg d–1 kg d–1 whole cottonseed mg kg–1 SE = 1.4 SE = 1.3 cottonseed meal cottonseed replaced by A 0 0 0 24.8 27.6 soybean meal B whole cottonseed 15.0 0 1039.7 23.6 29.7 C cottonseed meal 0 7.0 900.1 23.2 27.9 mixed 1 (whole D cottonseed and 7.5 3.5 959.7 22.6 28.7 cottonseed meal) mixed 2 (whole E cottonseed and 15.0 7.0 1922.0 24.0 32.6 cottonseed meal) The differences in the dry matter intake for groups A to E were not statistically significant. (a) Explain why the cows were all fed on the same cottonseed-free diet for 14 days. ................................................................................................................................................... ................................................................................................................................................... ............................................................................................................................................. [1] (b) Using the information provided and the results shown in Table 2.1, a student made some statements about the effect of feeding different diets to lactating Holstein cows. (i) The student stated that if the investigation is repeated, the groups of cows will produce milk in this order: (highest quantity) E B D C A (lowest quantity). With reference to Table 2.1, explain why the statement made by the student is not supported by the data. ........................................................................................................................................... ........................................................................................................................................... ........................................................................................................................................... ........................................................................................................................................... ........................................................................................................................................... ........................................................................................................................................... ........................................................................................................................................... ........................................................................................................................................... ................................................................................................................................... [3] (ii) Scientists are developing cotton plants that are genetically modified to produce seeds lacking gossypol. Table 2.1 suggests that there may be a link between total gossypol in the diet and milk yield. The student stated that repeating the investigation with no gossypol in diets B to E would result in a lower milk yield for each group. Explain whether or not Table 2.1 provides enough evidence to support the statement made by the student. ........................................................................................................................................... ........................................................................................................................................... ........................................................................................................................................... ........................................................................................................................................... ........................................................................................................................................... ..................................................................................................................................... [2]
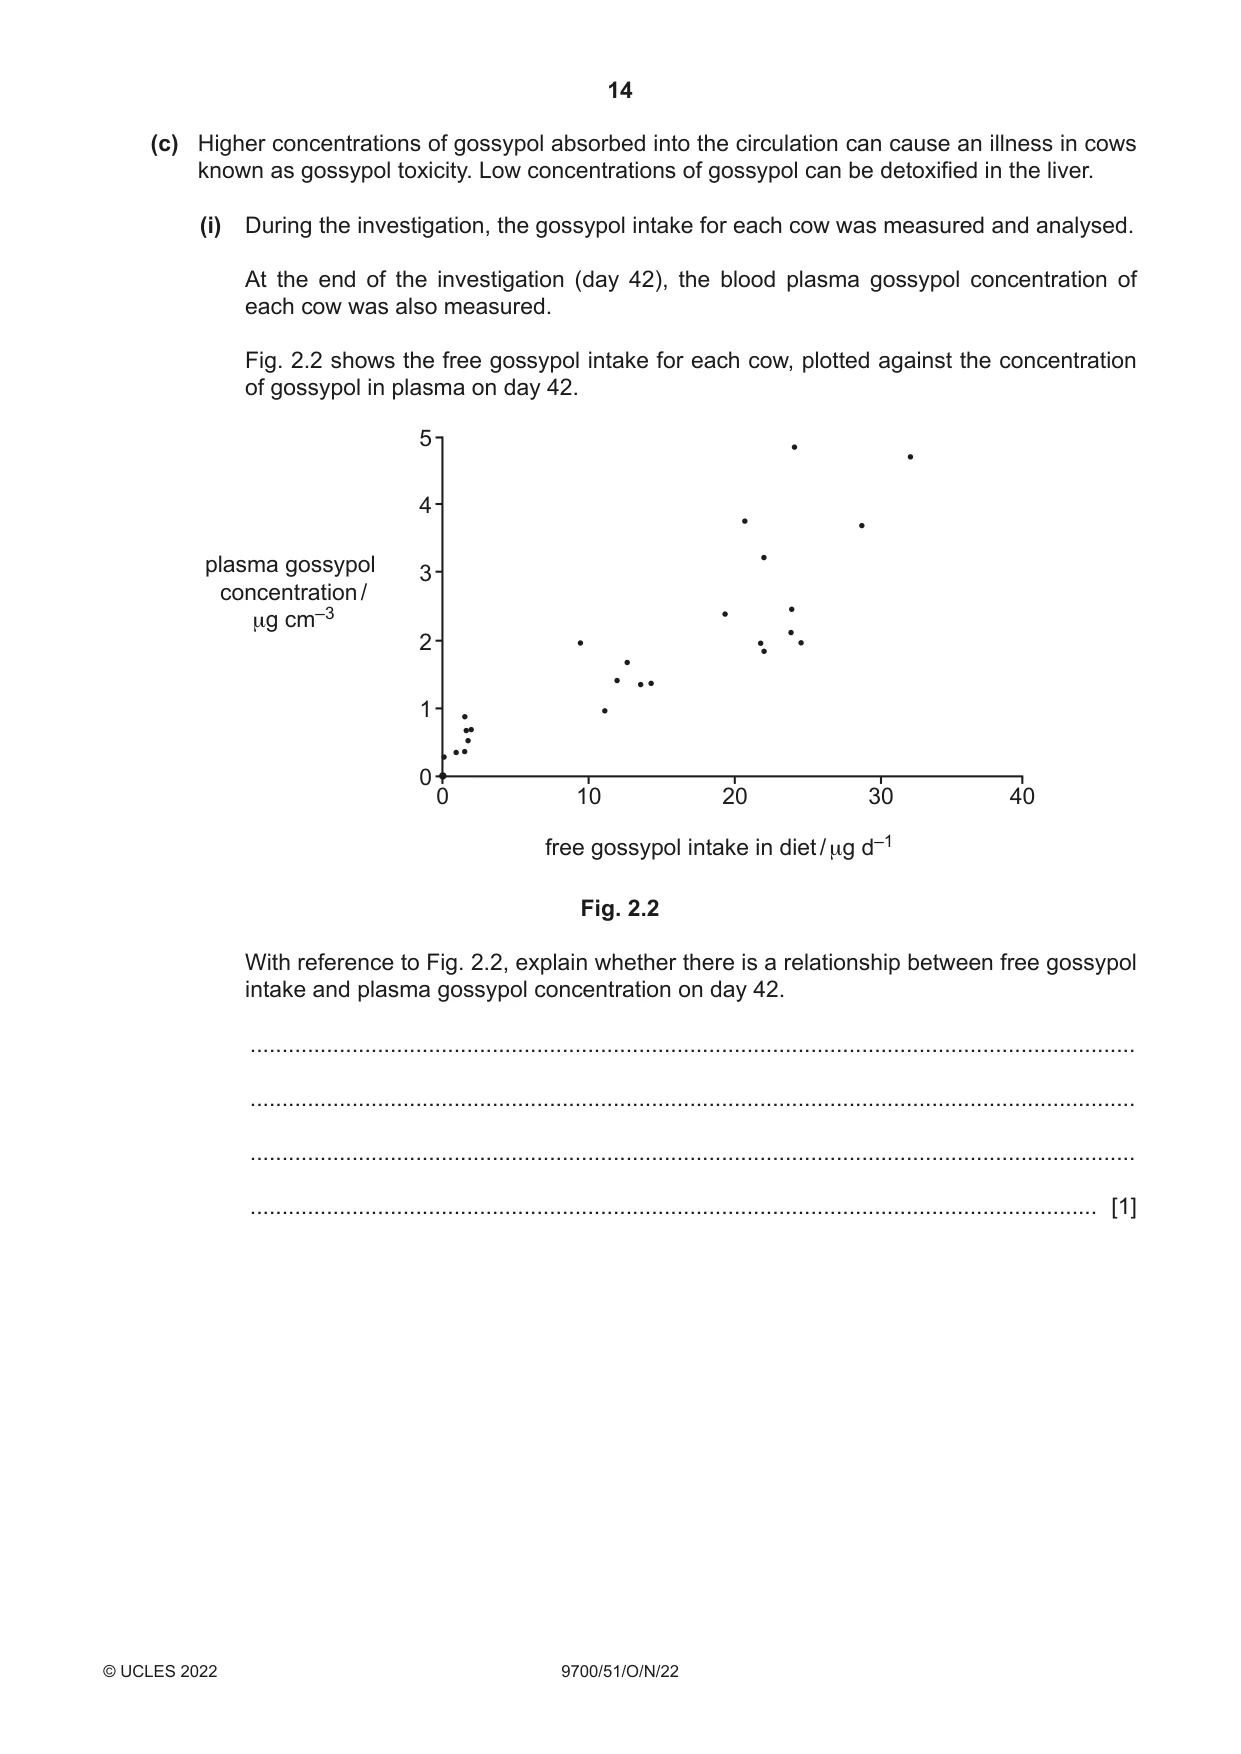
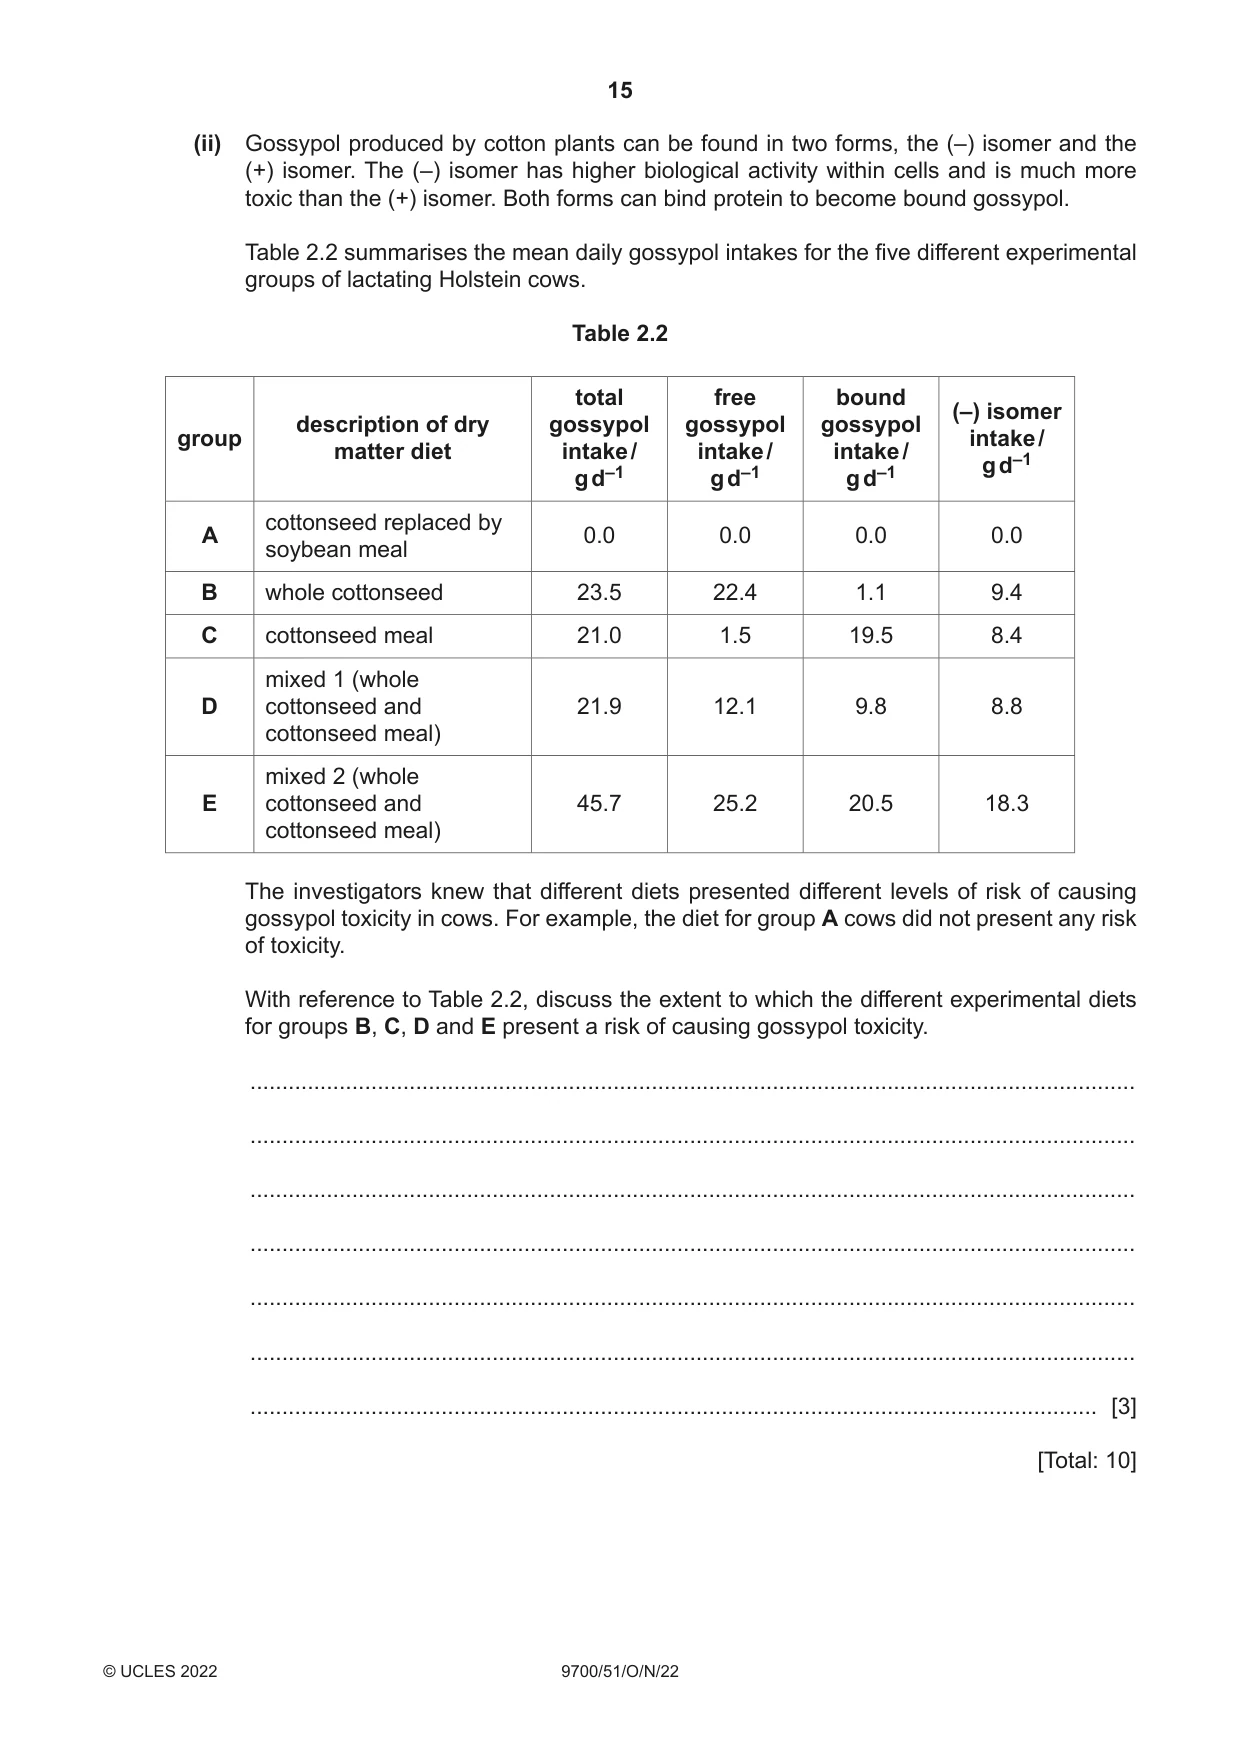
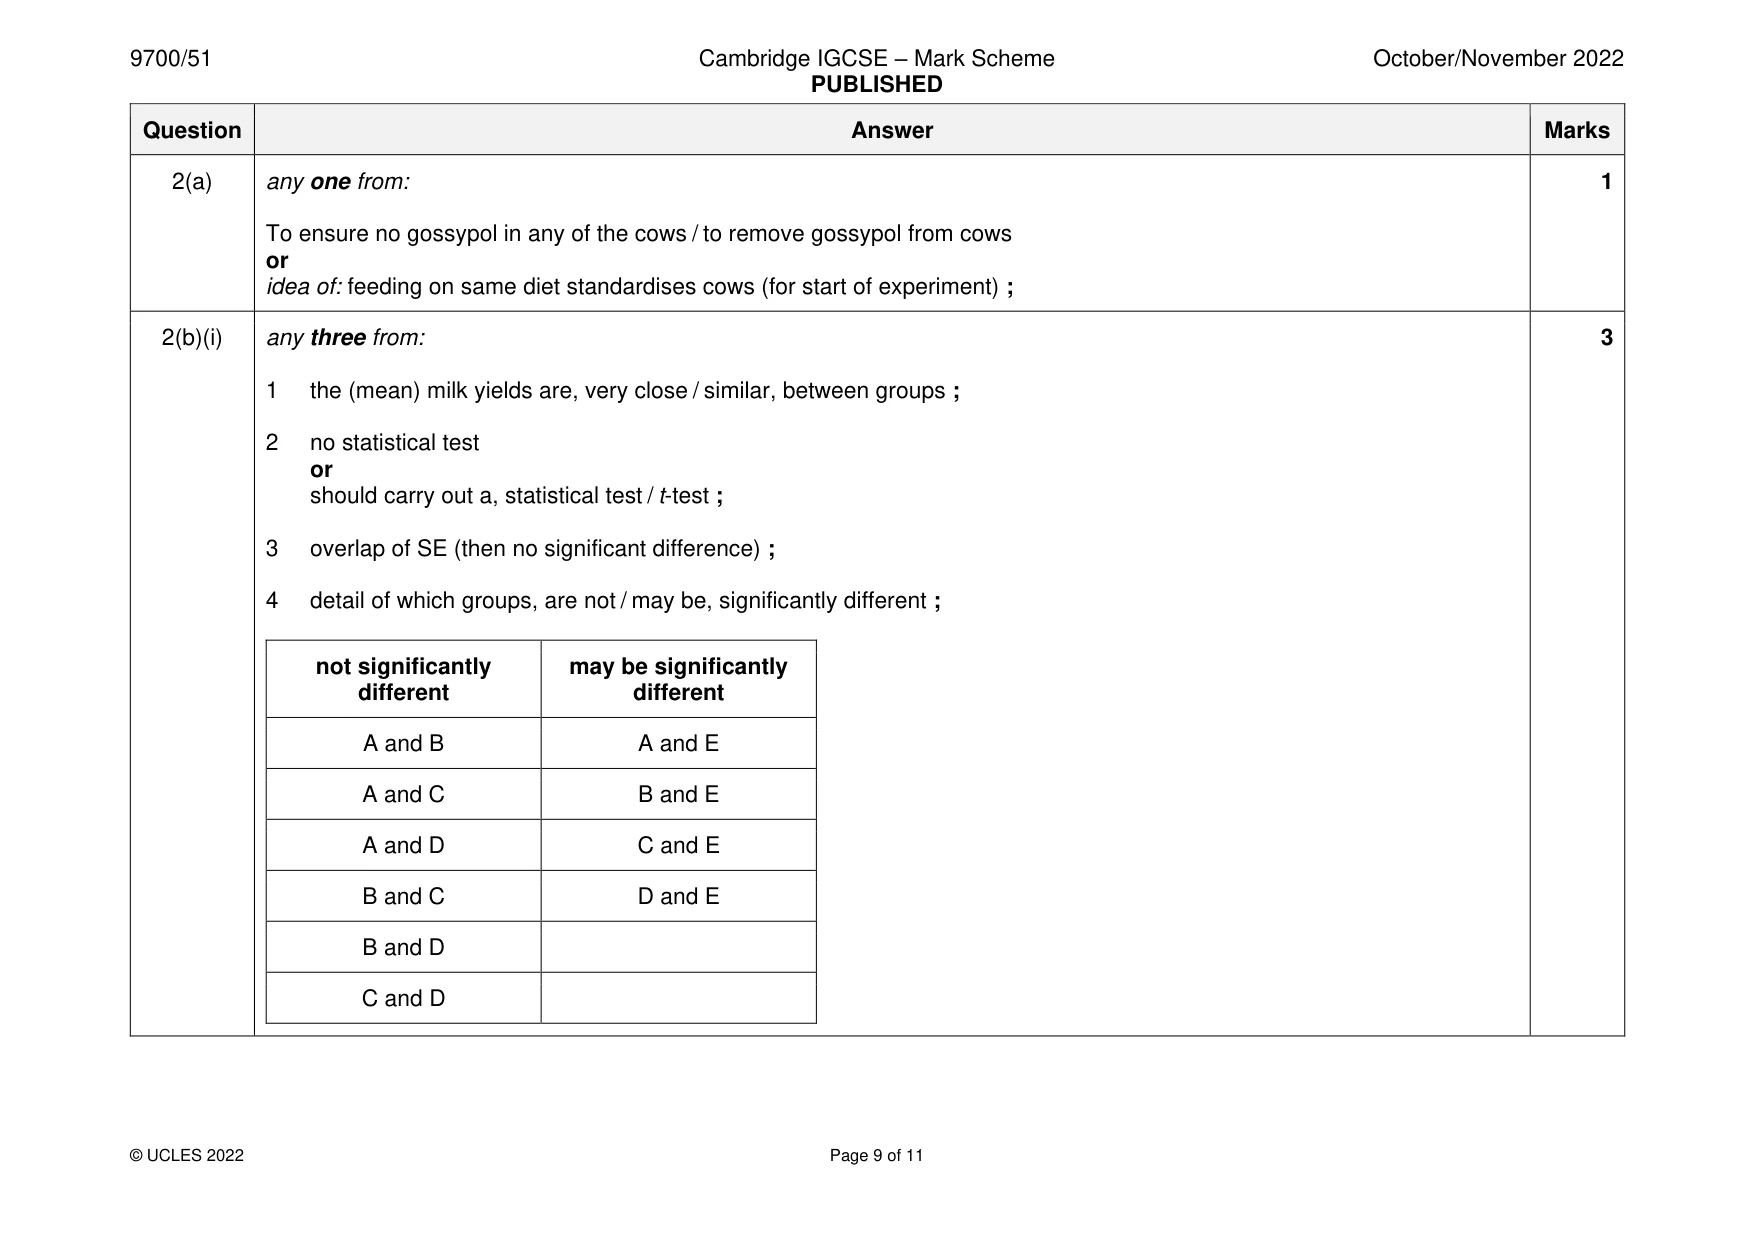
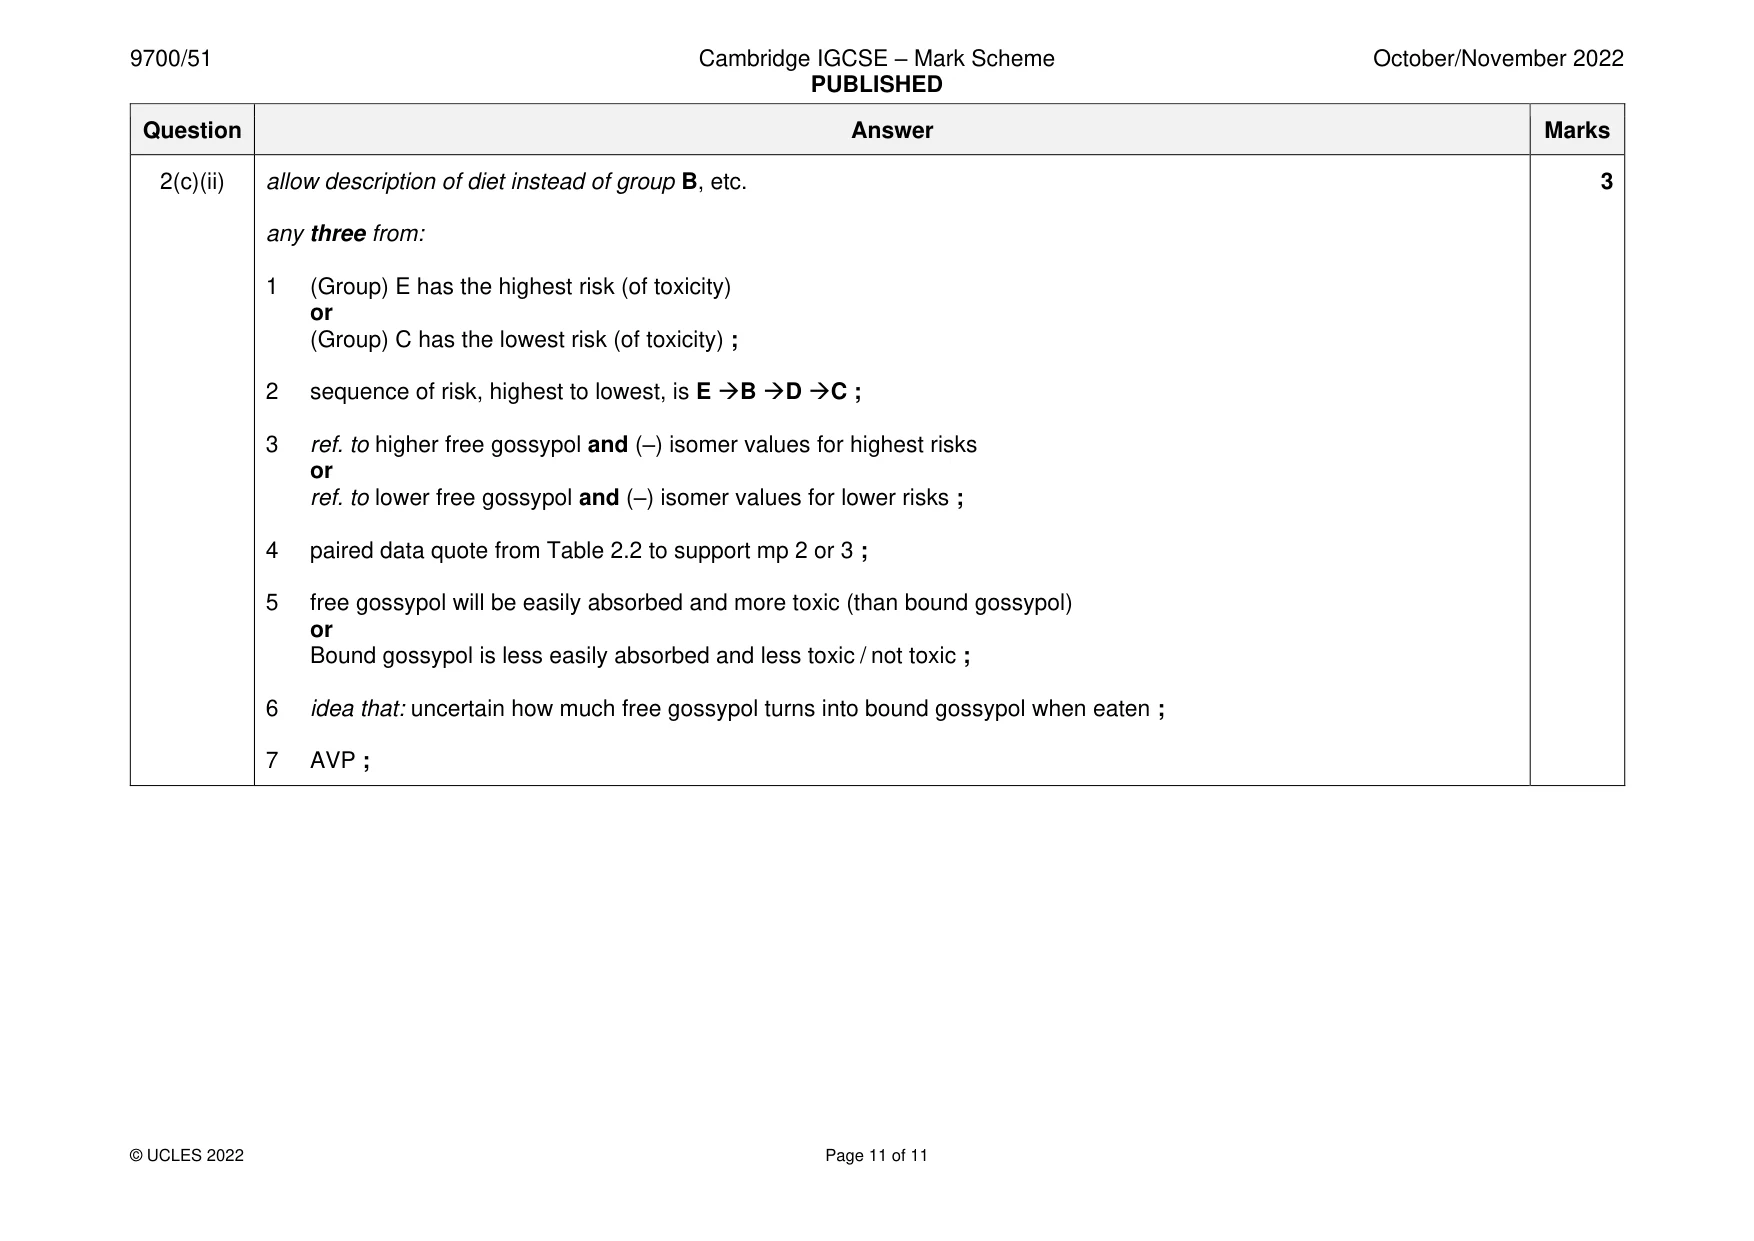
Mark scheme: 2(a) any one from: 1 To ensure no gossypol in any of the cows / to remove gossypol from cows or idea of: feeding on same diet standardises cows (for start of experiment) ; 2(b)(i) any three from: 3 1 the (mean) milk yields are, very close / similar, between groups ; 2 no statistical test or should carry out a, statistical test / t-test ; 3 overlap of SE (then no significant difference) ; 4 detail of which groups, are not / may be, significantly different ; not significantly may be significantly different different A and B A and E A and C B and E A and D C and E B and C D and E B and D C and D 2(b)(ii) any two from: 2 enough evidence because: 1 trend that as gossypol (in diet) increases, milk yield increases ; ora 2 paired data quote (to support) ; not enough evidence because: 3 idea that: no information that differences in milk yield are caused by (differences in) gossypol ; 4 idea that: no information on, nutritional content / AW, of , no gossypol diet / GM cottonseed ; 5 idea that: there is no cottonseed in A so cannot compare with (diets) B to E or There is only soybean in A so cannot compare with (diets) B to E ; 6 no statistical test or should carry out a, statistical test / t-test ; 2(c)(i) there is a relationship because: 1 as free (gossypol) intake increases, plasma (gossypol) concentration increases or shows a positive correlation ; 2(c)(ii) allow description of diet instead of group B, etc. 3 any three from: 1 (Group) E has the highest risk (of toxicity) or (Group) C has the lowest risk (of toxicity) ; 2 sequence of risk, highest to lowest, is E →B →D →C ; 3 ref. to higher free gossypol and (–) isomer values for highest risks or ref. to lower free gossypol and (–) isomer values for lower risks ; 4 paired data quote from Table 2.2 to support mp 2 or 3 ; 5 free gossypol will be easily absorbed and more toxic (than bound gossypol) or Bound gossypol is less easily absorbed and less toxic / not toxic ; 6 idea that: uncertain how much free gossypol turns into bound gossypol when eaten ; 7 AVP ;
What was in this paper
The subtopics covered by these 2 questions, and how many questions each got. Open one in a new tab to see every Cambridge question on it.
What you needed in this session
Cambridge’s own grade thresholds for 2022 Oct/Nov, Paper 5 · Variant 1. A higher threshold means an easier paper — the bar moves with how the cohort did.