Cambridge A Level Biology 9700 — 2022 Oct/Nov Paper 3 · Variant 4
9700/34/O/N/22 · 2 questions · 40 marks · ≈45 min
The question paper and its mark scheme, free to read here and free to download. This is Cambridge’s own paper, exactly as it was sat.
Question paper16 pages



Mark scheme7 pages
Answers below. Sit the paper first if you are practising.
Questions as text
Q1 · Ascorbic acid is important in the diet for maintaining health
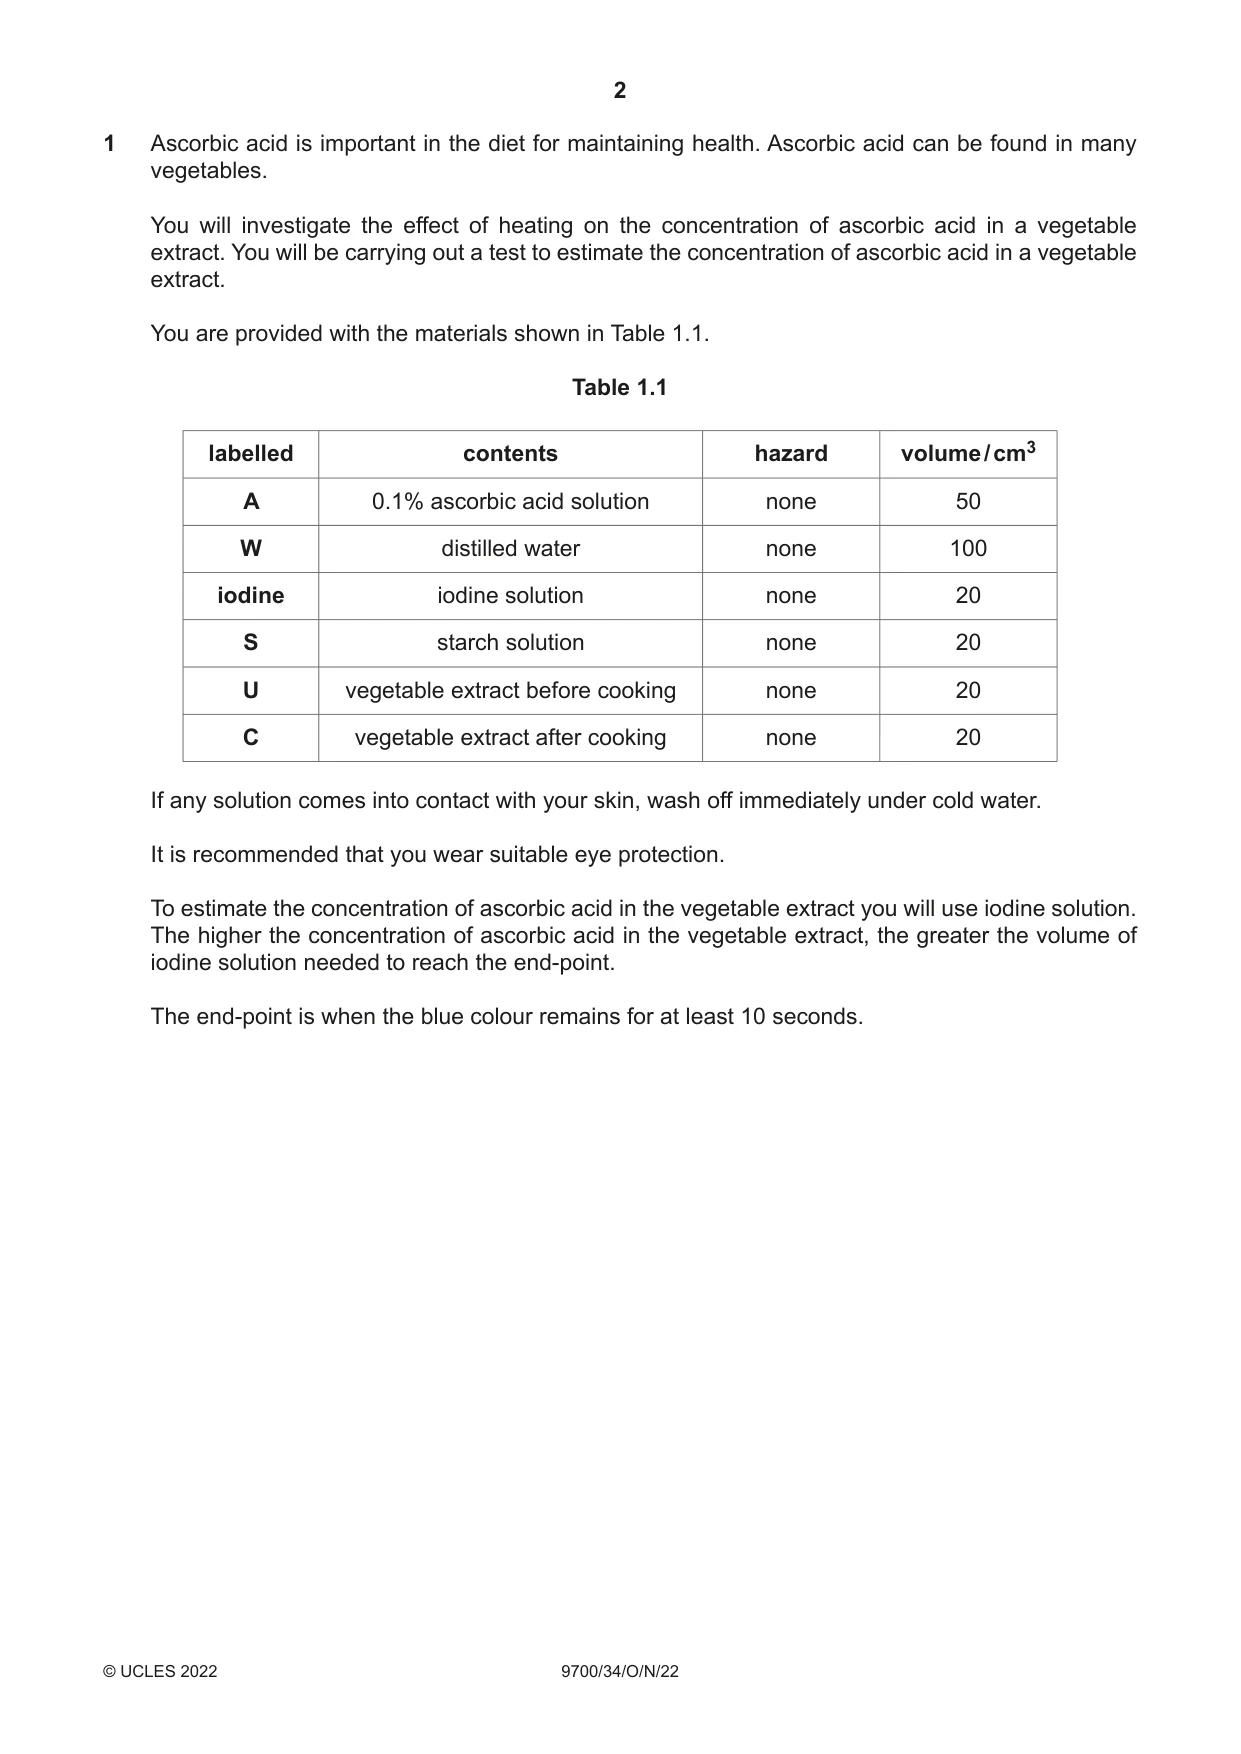
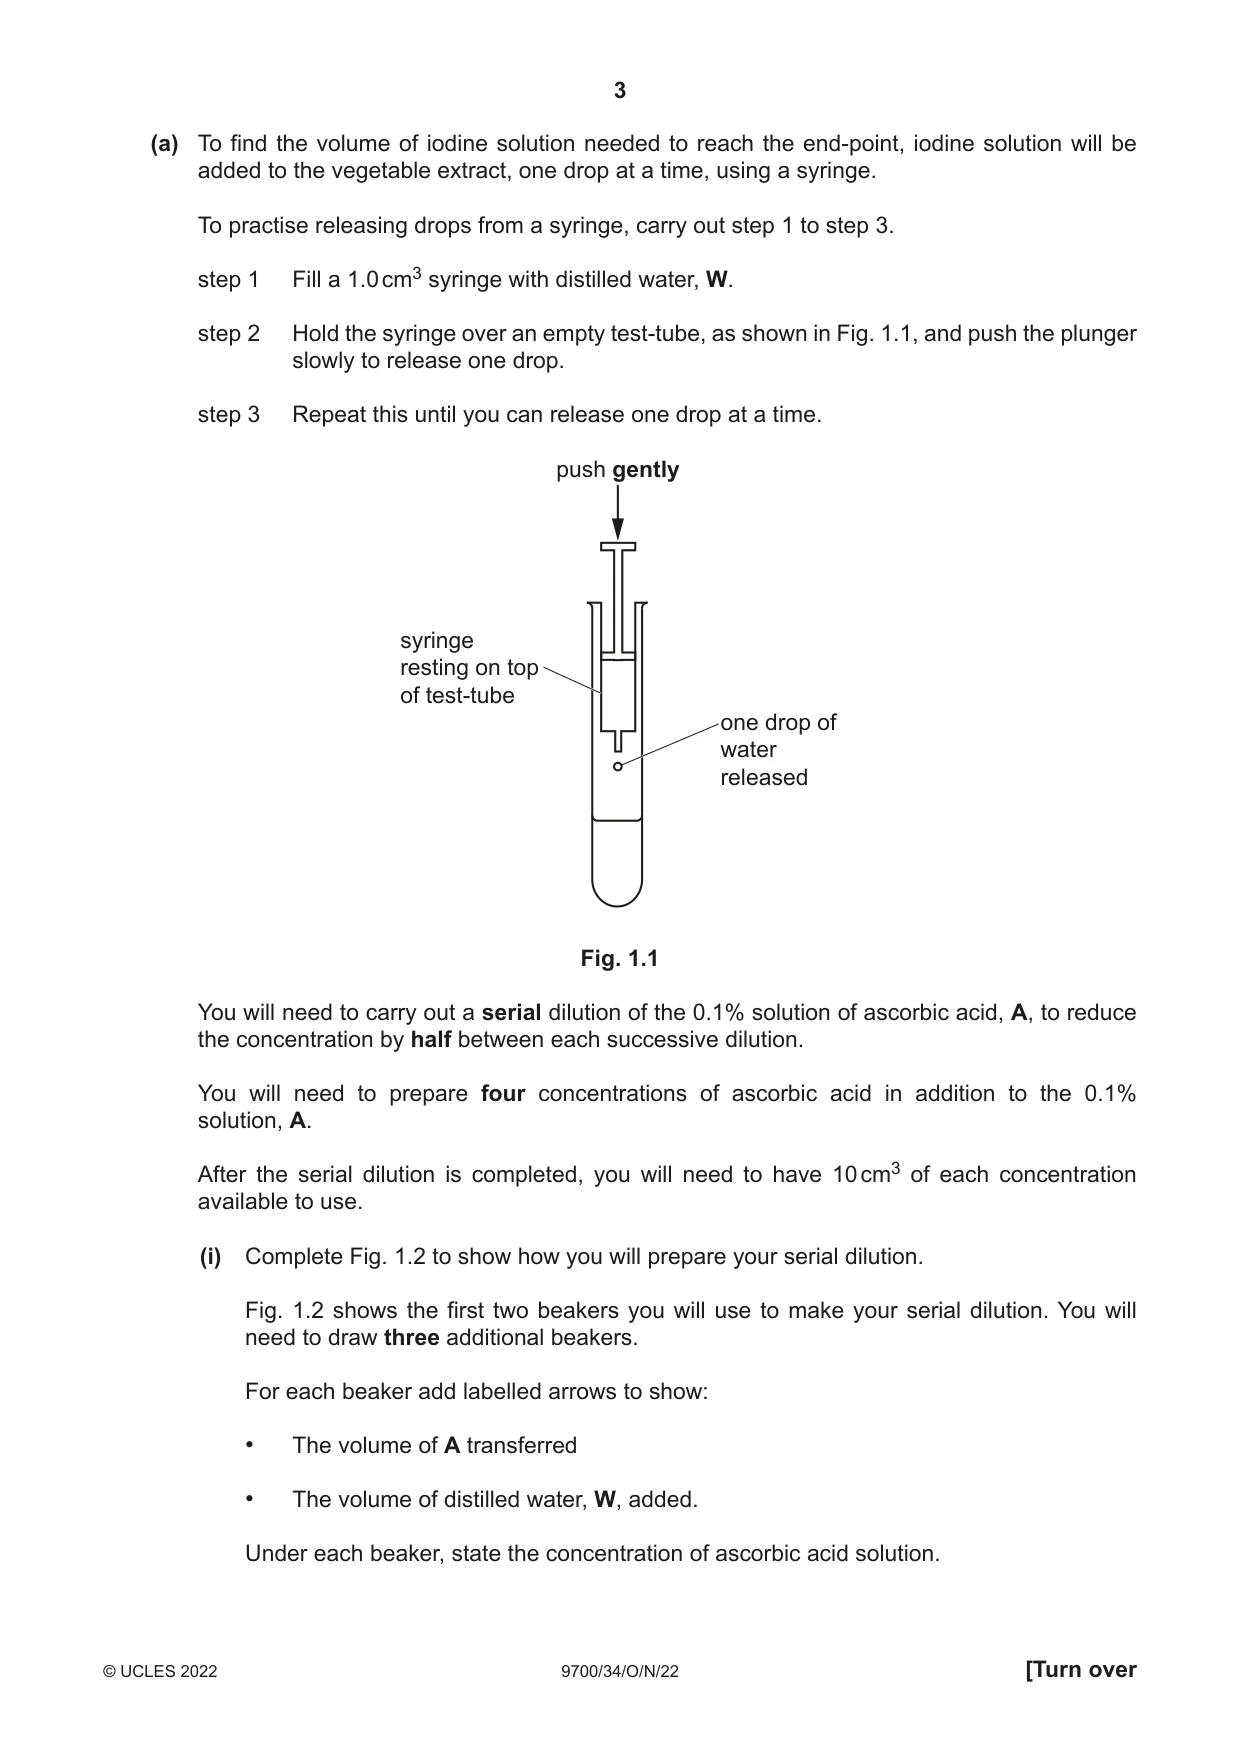
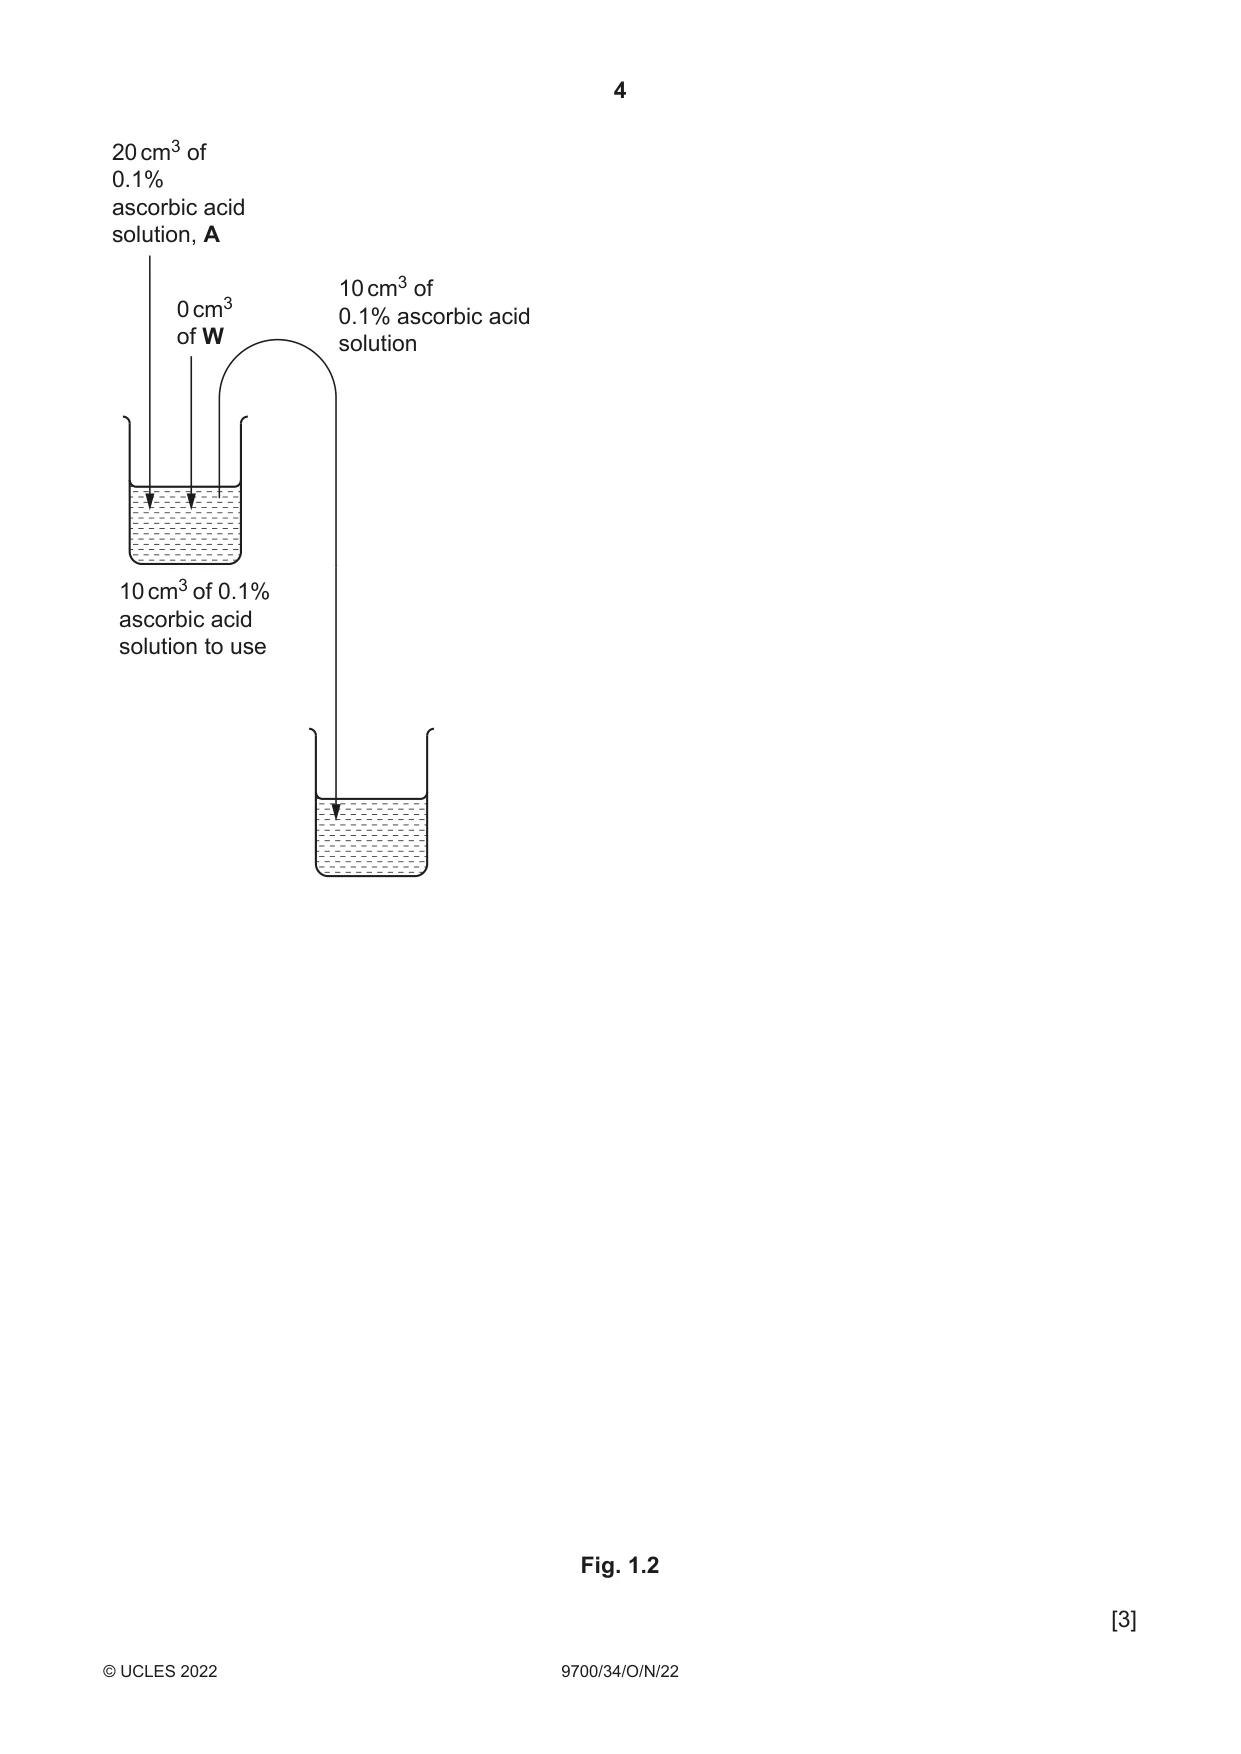
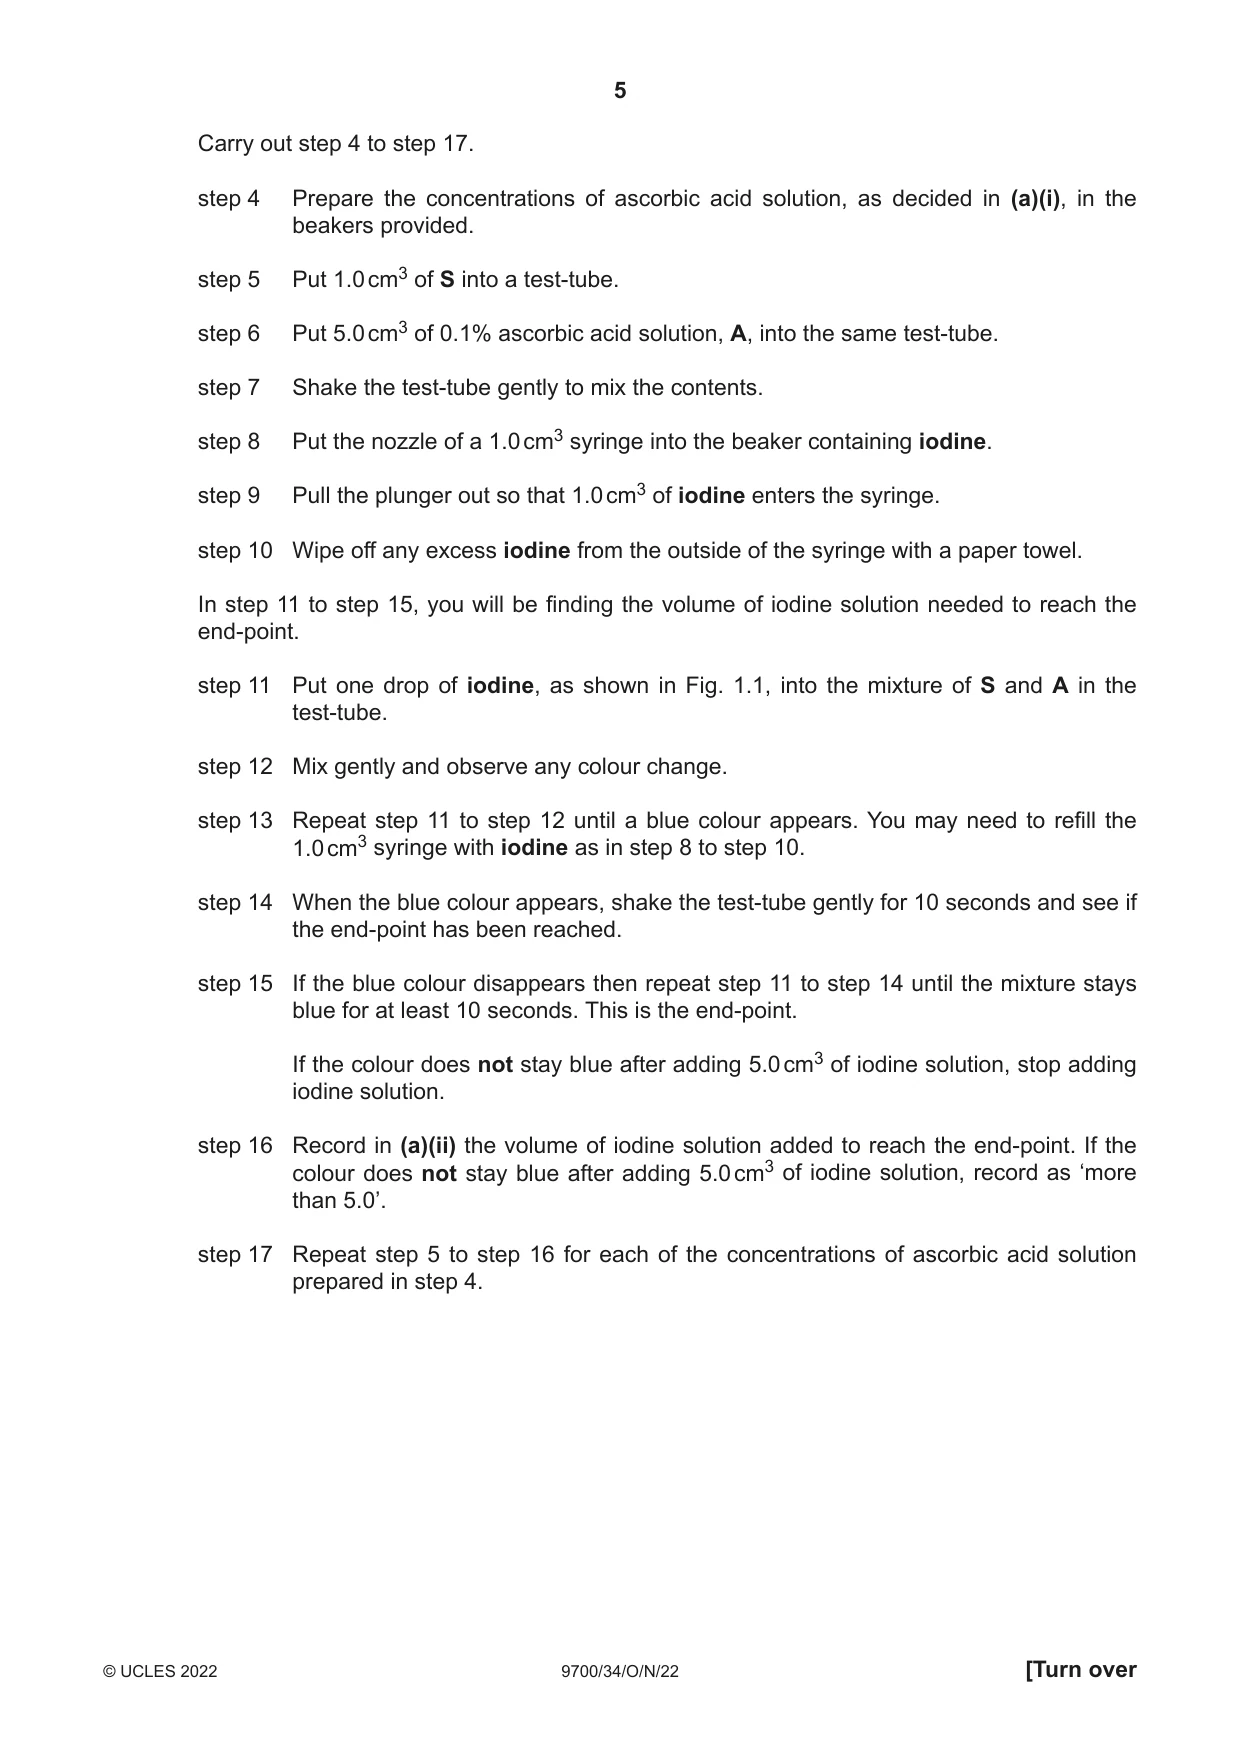
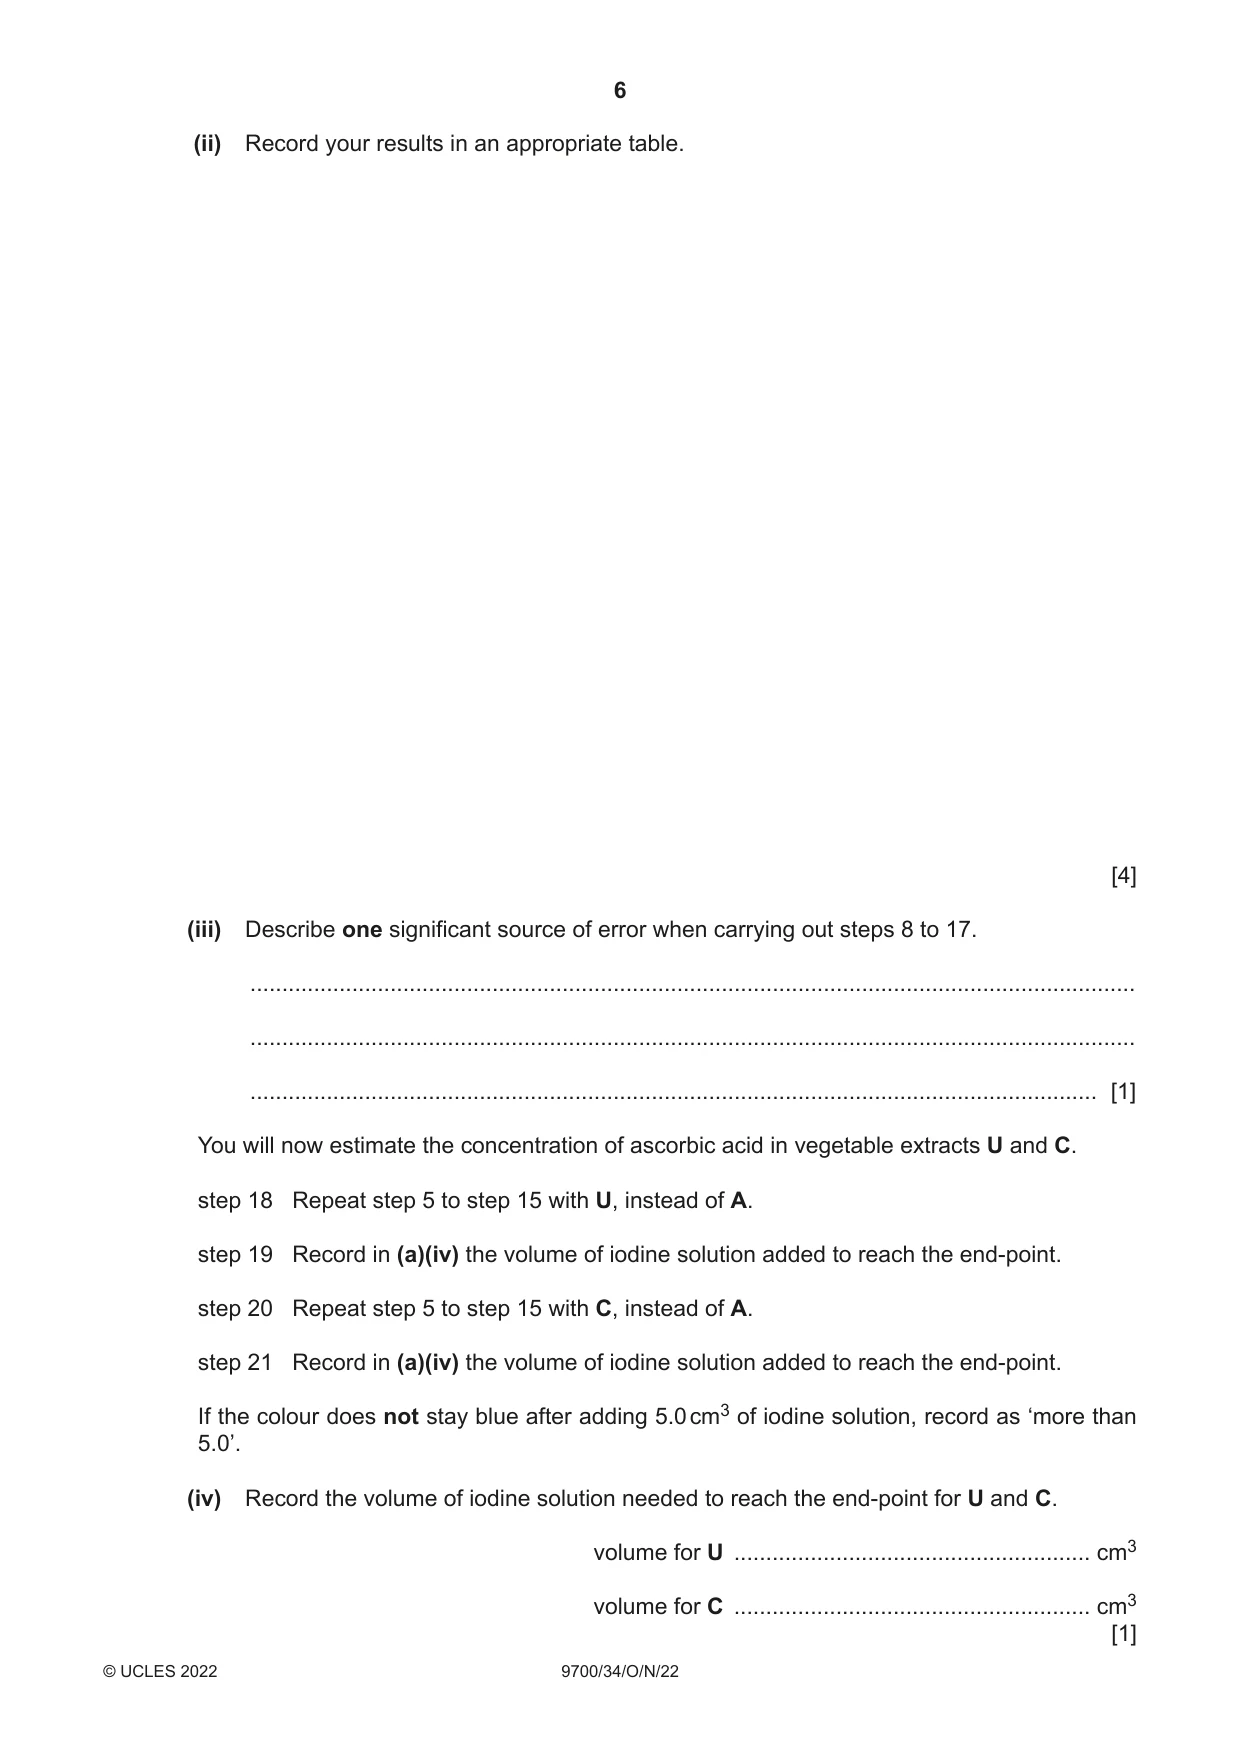
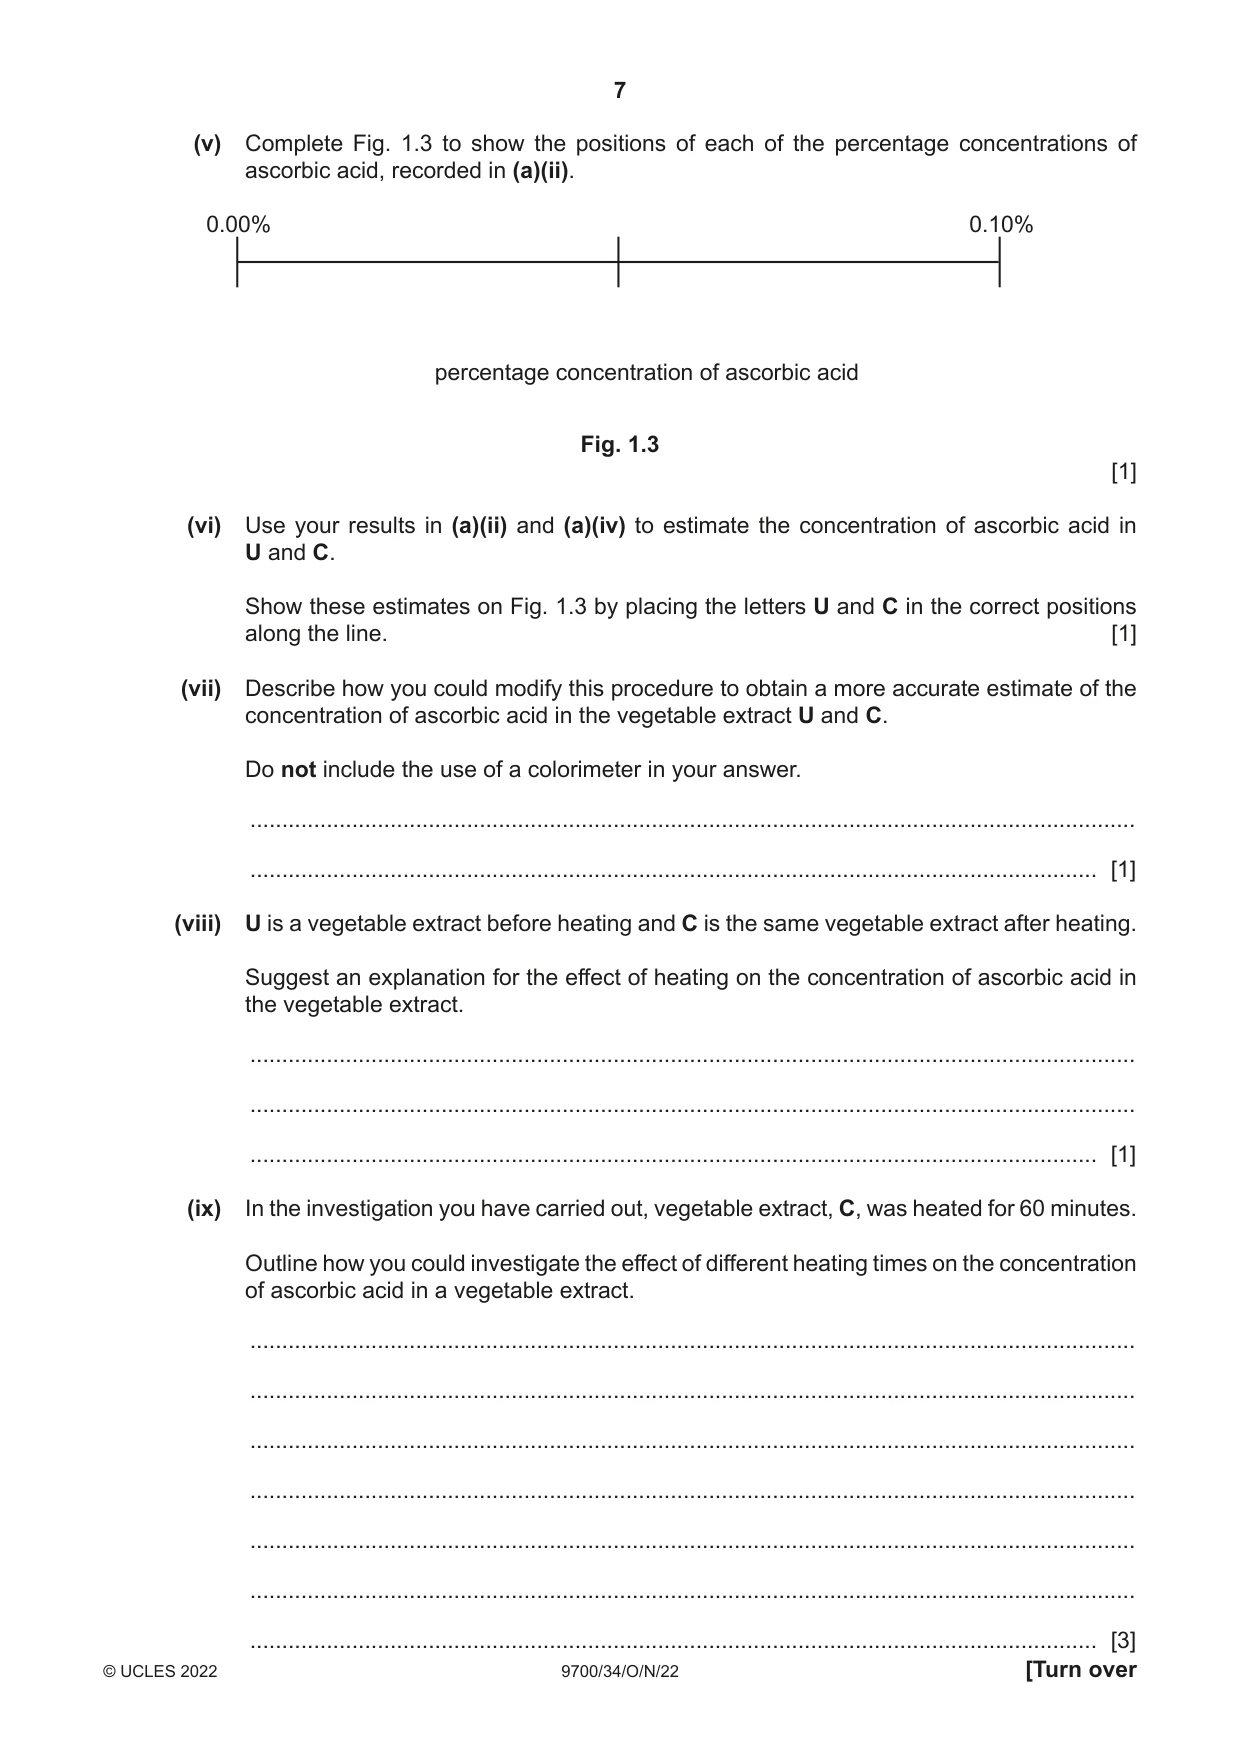
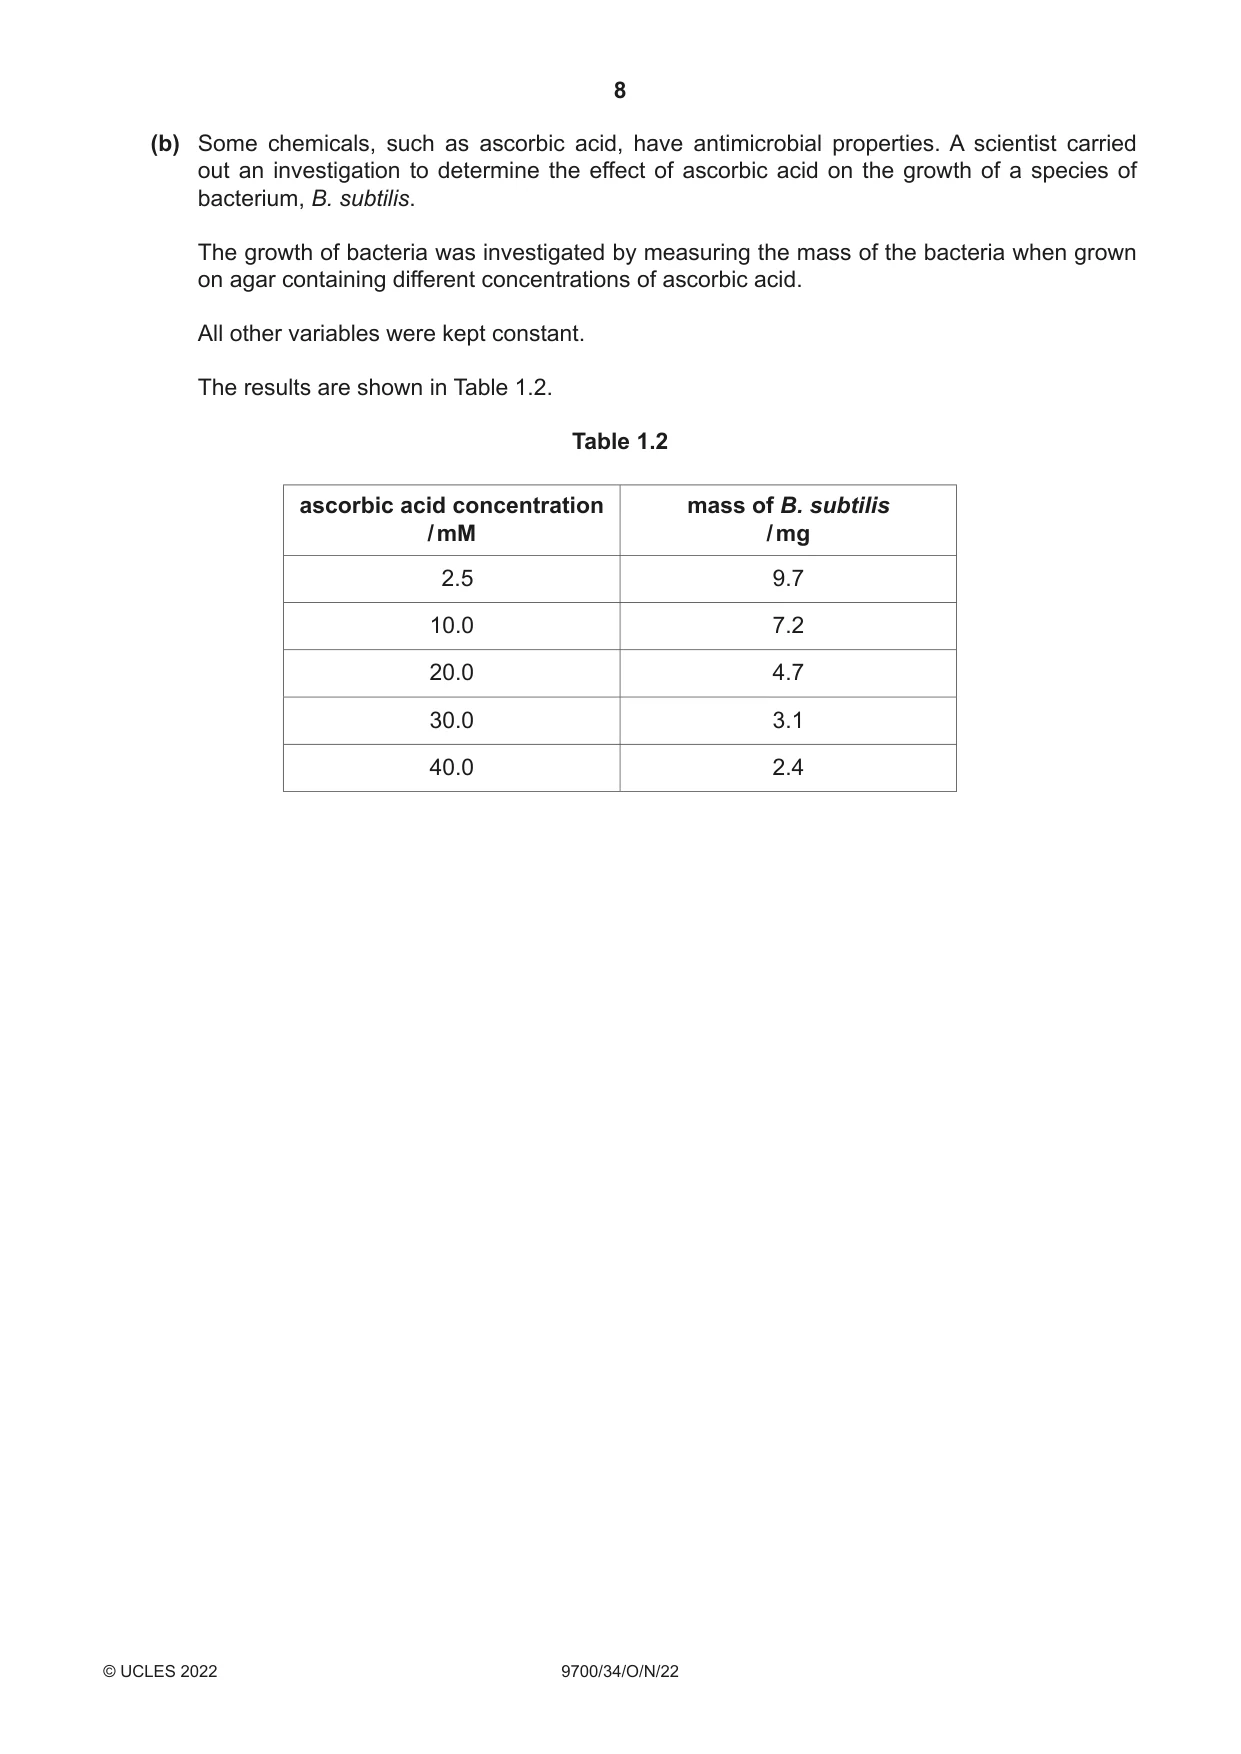
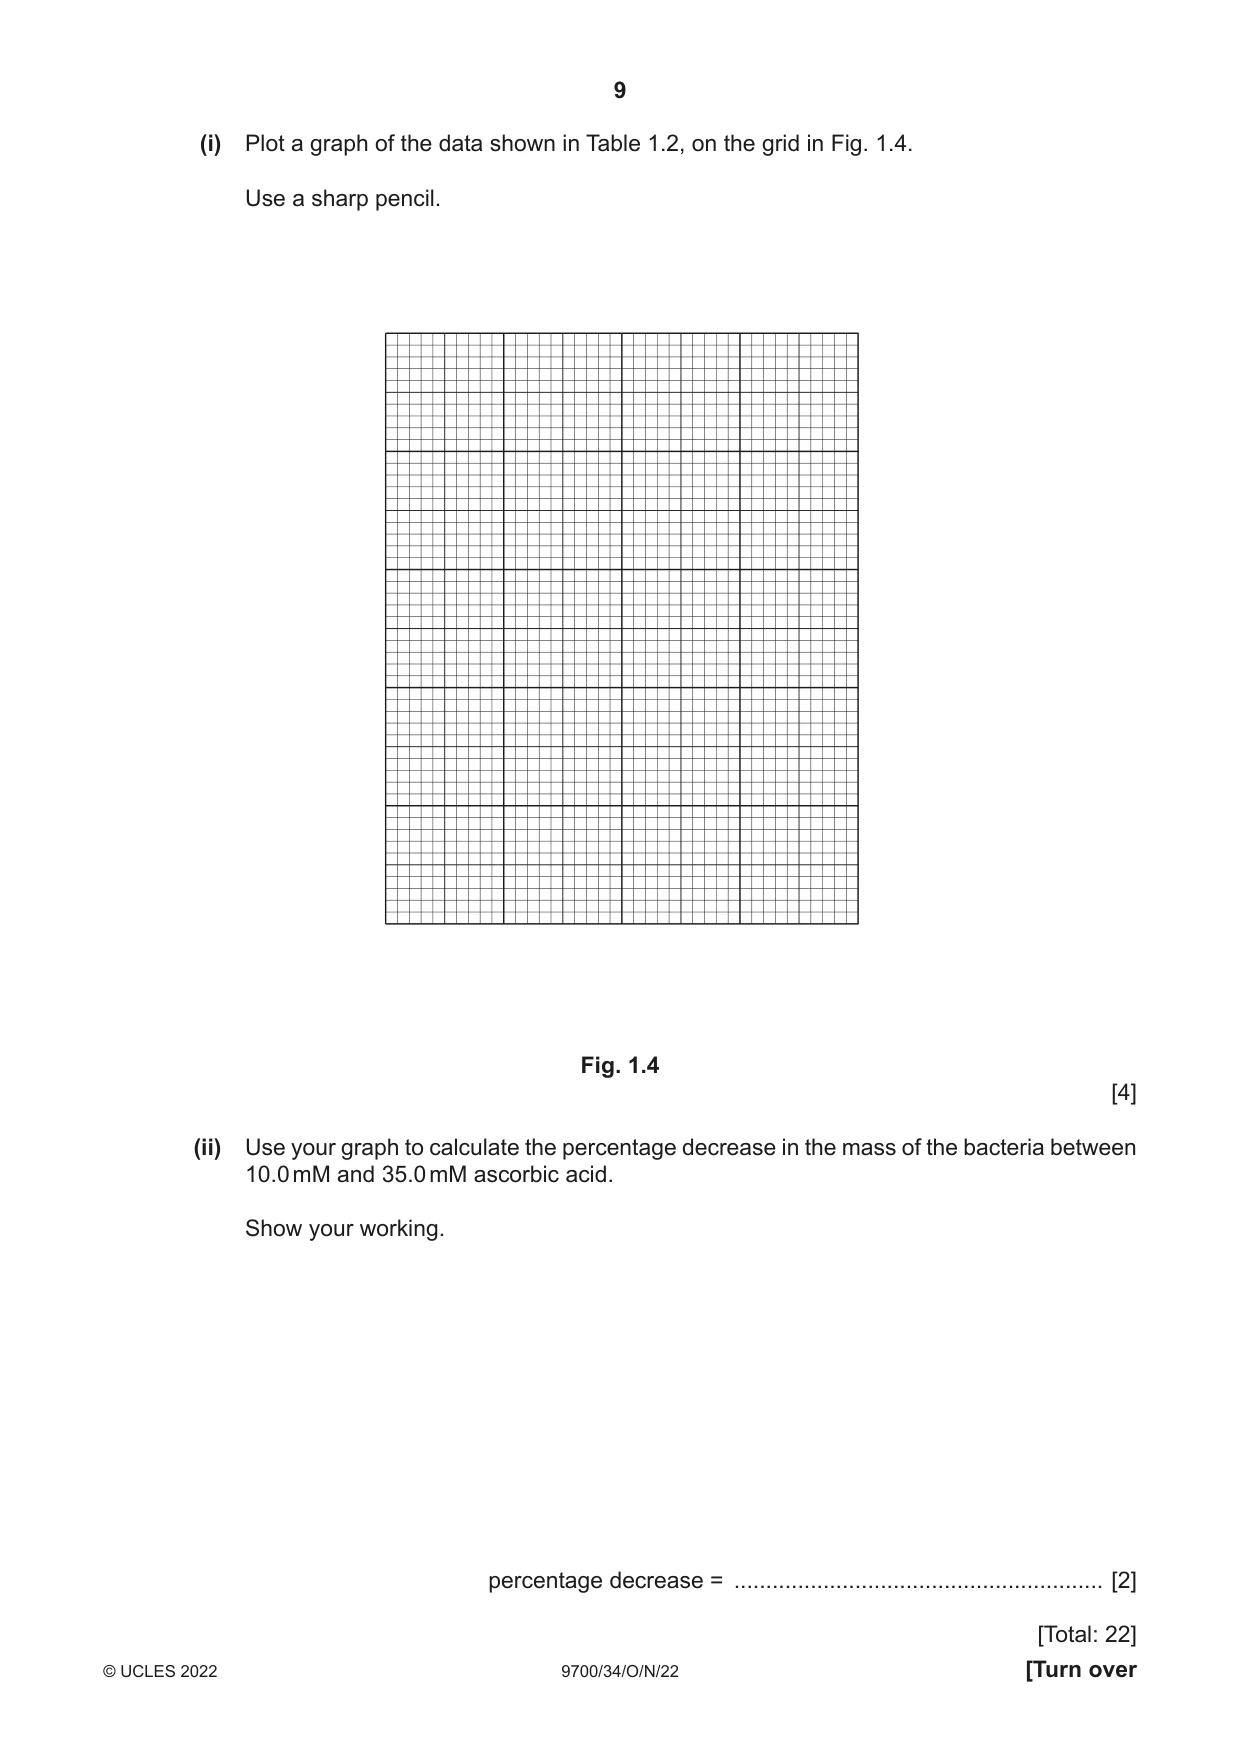
1 Ascorbic acid is important in the diet for maintaining health. Ascorbic acid can be found in many vegetables. You will investigate the effect of heating on the concentration of ascorbic acid in a vegetable extract. You will be carrying out a test to estimate the concentration of ascorbic acid in a vegetable extract. You are provided with the materials shown in Table 1.1. Table 1.1 labelled contents hazard volume / cm3 A 0.1% ascorbic acid solution none 50 W distilled water none 100 iodine iodine solution none 20 S starch solution none 20 U vegetable extract before cooking none 20 C vegetable extract after cooking none 20 If any solution comes into contact with your skin, wash off immediately under cold water. It is recommended that you wear suitable eye protection. To estimate the concentration of ascorbic acid in the vegetable extract you will use iodine solution. The higher the concentration of ascorbic acid in the vegetable extract, the greater the volume of iodine solution needed to reach the end-point. The end-point is when the blue colour remains for at least 10 seconds. (a) To find the volume of iodine solution needed to reach the end-point, iodine solution will be added to the vegetable extract, one drop at a time, using a syringe. To practise releasing drops from a syringe, carry out step 1 to step 3. step 1 Fill a 1.0 cm3 syringe with distilled water, W. step 2 Hold the syringe over an empty test-tube, as shown in Fig. 1.1, and push the plunger slowly to release one drop. step 3 Repeat this until you can release one drop at a time. push gently syringe resting on top of test-tube one drop of water released Fig. 1.1 You will need to carry out a serial dilution of the 0.1% solution of ascorbic acid, A, to reduce the concentration by half between each successive dilution. You will need to prepare four concentrations of ascorbic acid in addition to the 0.1% solution, A. After the serial dilution is completed, you will need to have 10 cm3 of each concentration available to use. (i) Complete Fig. 1.2 to show how you will prepare your serial dilution. Fig. 1.2 shows the first two beakers you will use to make your serial dilution. You will need to draw three additional beakers. For each beaker add labelled arrows to show: • The volume of A transferred • The volume of distilled water, W, added. Under each beaker, state the concentration of ascorbic acid solution. 20 cm3 of 0.1% ascorbic acid solution, A 10 cm3 of 0 cm3 0.1% ascorbic acid of W solution 10 cm3 of 0.1% ascorbic acid solution to use Fig. 1.2 [3] Carry out step 4 to step 17. step 4 Prepare the concentrations of ascorbic acid solution, as decided in (a)(i), in the beakers provided. step 5 Put 1.0 cm3 of S into a test-tube. step 6 Put 5.0 cm3 of 0.1% ascorbic acid solution, A, into the same test-tube. step 7 Shake the test-tube gently to mix the contents. step 8 Put the nozzle of a 1.0 cm3 syringe into the beaker containing iodine. step 9 Pull the plunger out so that 1.0 cm3 of iodine enters the syringe. step 10 Wipe off any excess iodine from the outside of the syringe with a paper towel. In step 11 to step 15, you will be finding the volume of iodine solution needed to reach the end-point. step 11 Put one drop of iodine, as shown in Fig. 1.1, into the mixture of S and A in the test-tube. step 12 Mix gently and observe any colour change. step 13 Repeat step 11 to step 12 until a blue colour appears. You may need to refill the 1.0 cm3 syringe with iodine as in step 8 to step 10. step 14 When the blue colour appears, shake the test-tube gently for 10 seconds and see if the end-point has been reached. step 15 If the blue colour disappears then repeat step 11 to step 14 until the mixture stays blue for at least 10 seconds. This is the end-point. If the colour does not stay blue after adding 5.0 cm3 of iodine solution, stop adding iodine solution. step 16 Record in (a)(ii) the volume of iodine solution added to reach the end-point. If the colour does not stay blue after adding 5.0 cm3 of iodine solution, record as ‘more than 5.0’. step 17 Repeat step 5 to step 16 for each of the concentrations of ascorbic acid solution prepared in step 4. (ii) Record your results in an appropriate table. [4] (iii) Describe one significant source of error when carrying out steps 8 to 17. ........................................................................................................................................... ........................................................................................................................................... ..................................................................................................................................... [1] You will now estimate the concentration of ascorbic acid in vegetable extracts U and C. step 18 Repeat step 5 to step 15 with U, instead of A. step 19 Record in (a)(iv) the volume of iodine solution added to reach the end-point. step 20 Repeat step 5 to step 15 with C, instead of A. step 21 Record in (a)(iv) the volume of iodine solution added to reach the end-point. If the colour does not stay blue after adding 5.0 cm3 of iodine solution, record as ‘more than 5.0’. (iv) Record the volume of iodine solution needed to reach the end-point for U and C. volume for U ........................................................ cm3 volume for C ........................................................ cm3 [1] (v) Complete Fig. 1.3 to show the positions of each of the percentage concentrations of ascorbic acid, recorded in (a)(ii). 0.00% 0.10% percentage concentration of ascorbic acid Fig. 1.3 [1] (vi) Use your results in (a)(ii) and (a)(iv) to estimate the concentration of ascorbic acid in U and C. Show these estimates on Fig. 1.3 by placing the letters U and C in the correct positions along the line. [1] (vii) Describe how you could modify this procedure to obtain a more accurate estimate of the concentration of ascorbic acid in the vegetable extract U and C. Do not include the use of a colorimeter in your answer. ........................................................................................................................................... ..................................................................................................................................... [1] (viii) U is a vegetable extract before heating and C is the same vegetable extract after heating. Suggest an explanation for the effect of heating on the concentration of ascorbic acid in the vegetable extract. ........................................................................................................................................... ........................................................................................................................................... ..................................................................................................................................... [1] (ix) In the investigation you have carried out, vegetable extract, C, was heated for 60 minutes. Outline how you could investigate the effect of different heating times on the concentration of ascorbic acid in a vegetable extract. ........................................................................................................................................... ........................................................................................................................................... ........................................................................................................................................... ........................................................................................................................................... ........................................................................................................................................... ........................................................................................................................................... ..................................................................................................................................... [3] (b) Some chemicals, such as ascorbic acid, have antimicrobial properties. A scientist carried out an investigation to determine the effect of ascorbic acid on the growth of a species of bacterium, B. subtilis. The growth of bacteria was investigated by measuring the mass of the bacteria when grown on agar containing different concentrations of ascorbic acid. All other variables were kept constant. The results are shown in Table 1.2. Table 1.2 ascorbic acid concentration mass of B. subtilis / mM / mg 2.5 9.7 10.0 7.2 20.0 4.7 30.0 3.1 40.0 2.4 (i) Plot a graph of the data shown in Table 1.2, on the grid in Fig. 1.4. Use a sharp pencil. Fig. 1.4 [4] (ii) Use your graph to calculate the percentage decrease in the mass of the bacteria between 10.0 mM and 35.0 mM ascorbic acid. Show your working. percentage decrease = .......................................................... [2] [Total: 22]
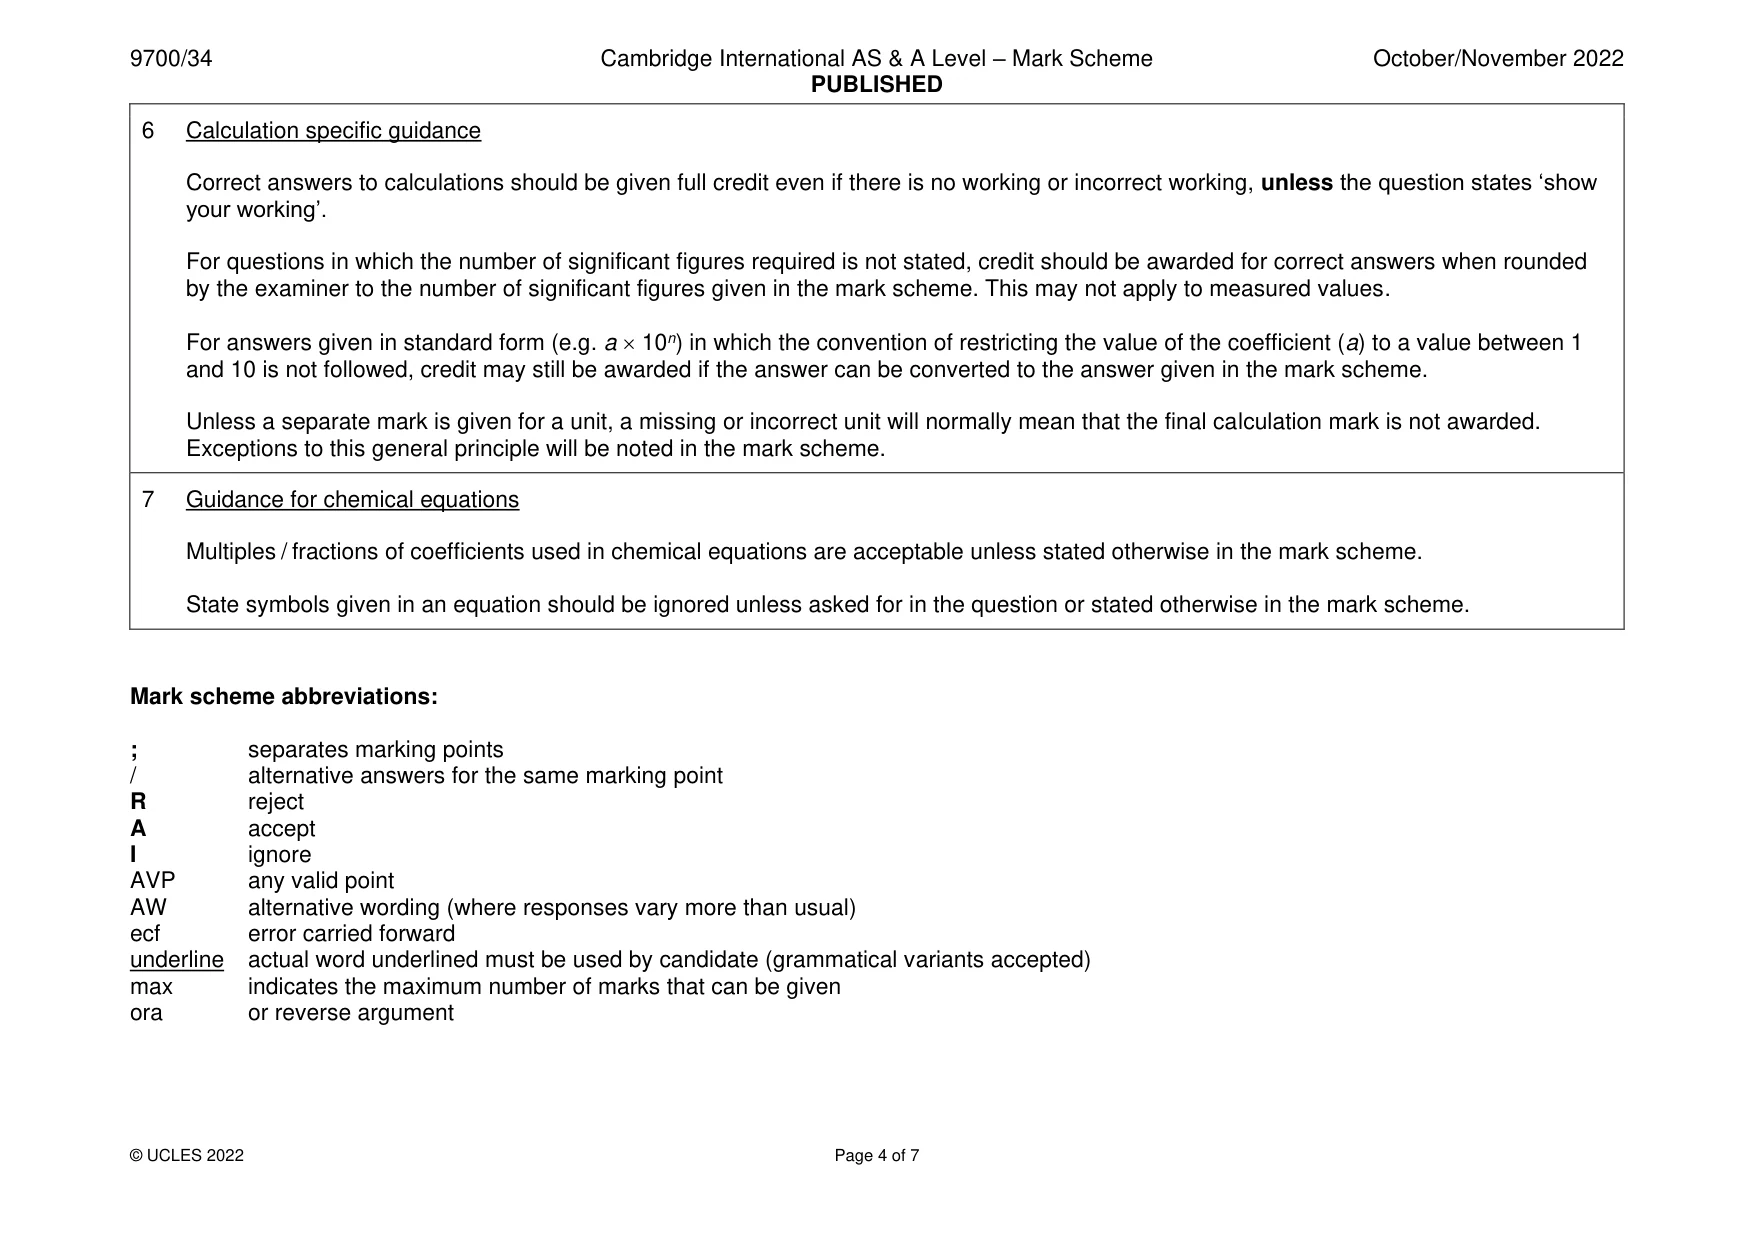
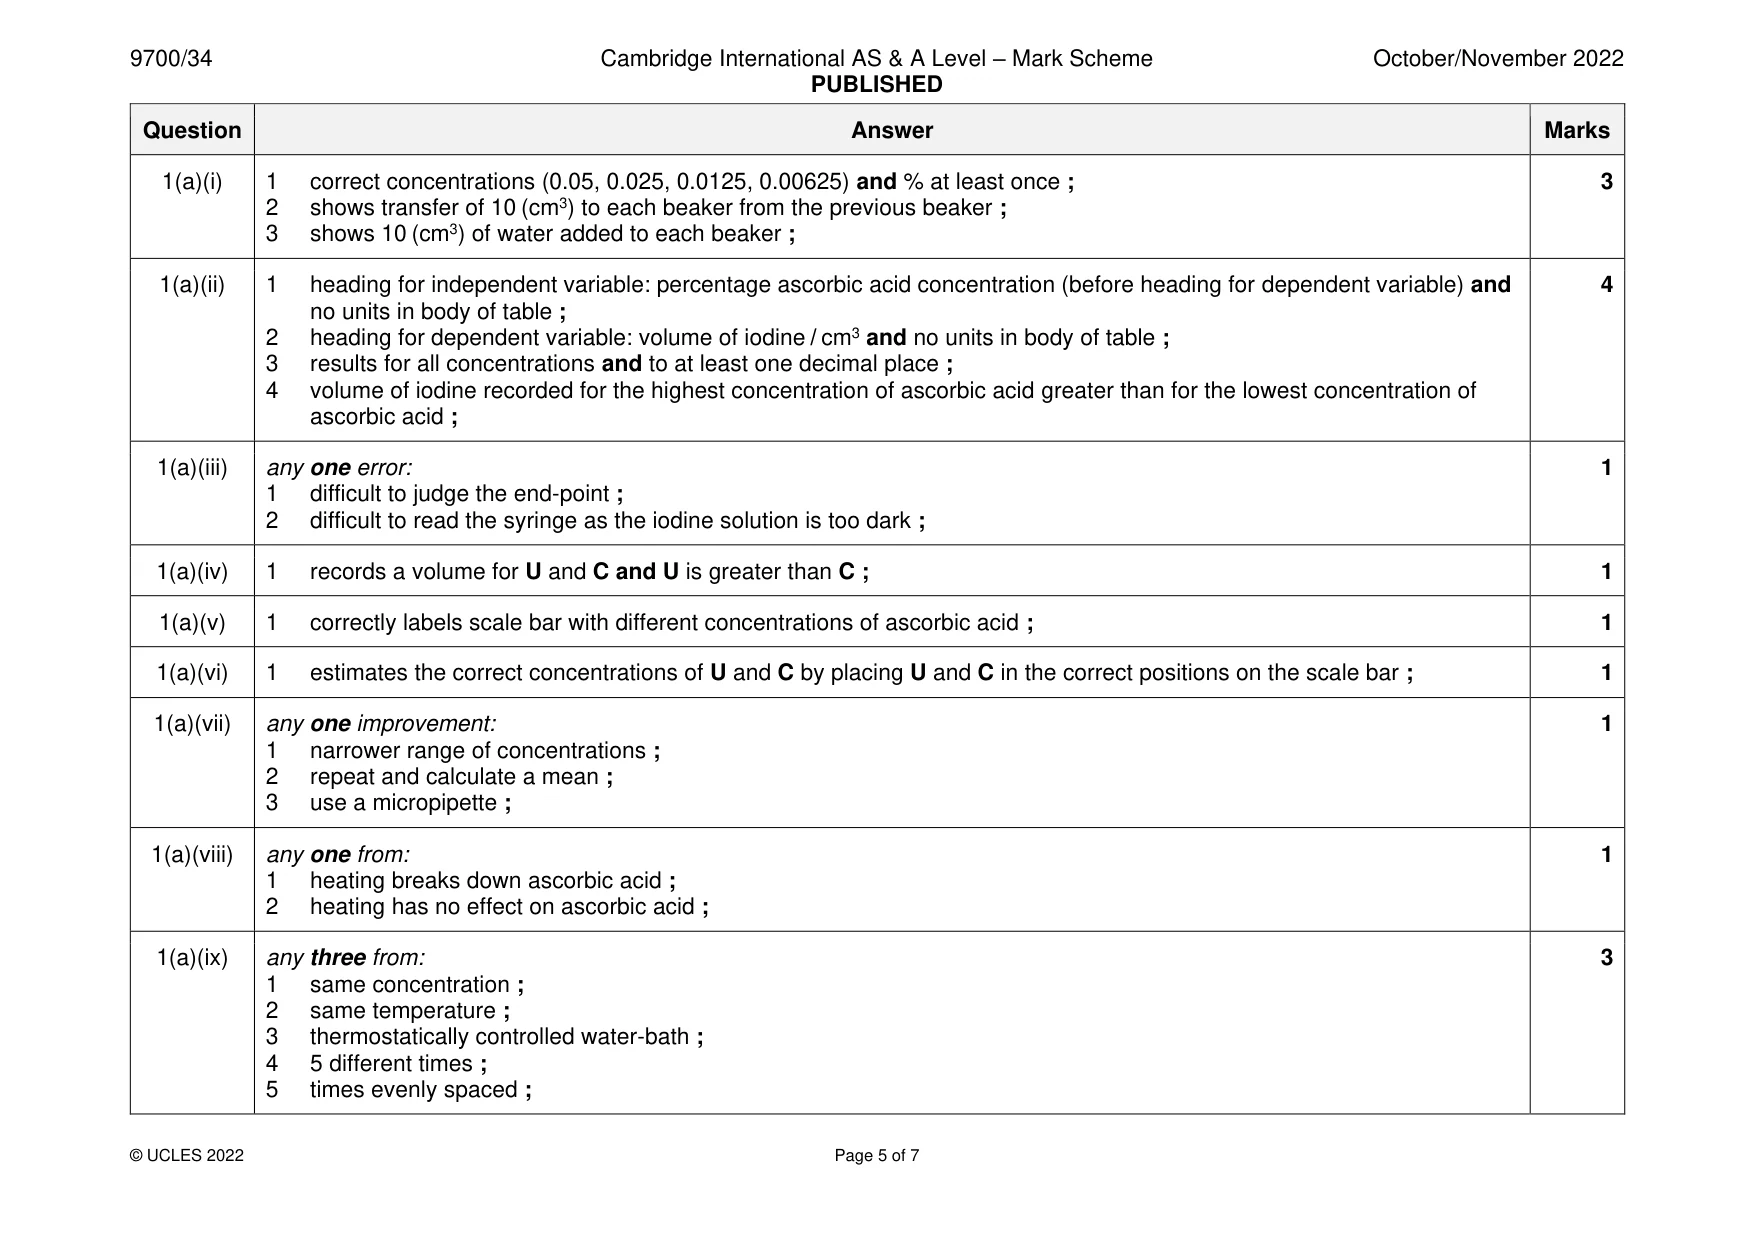
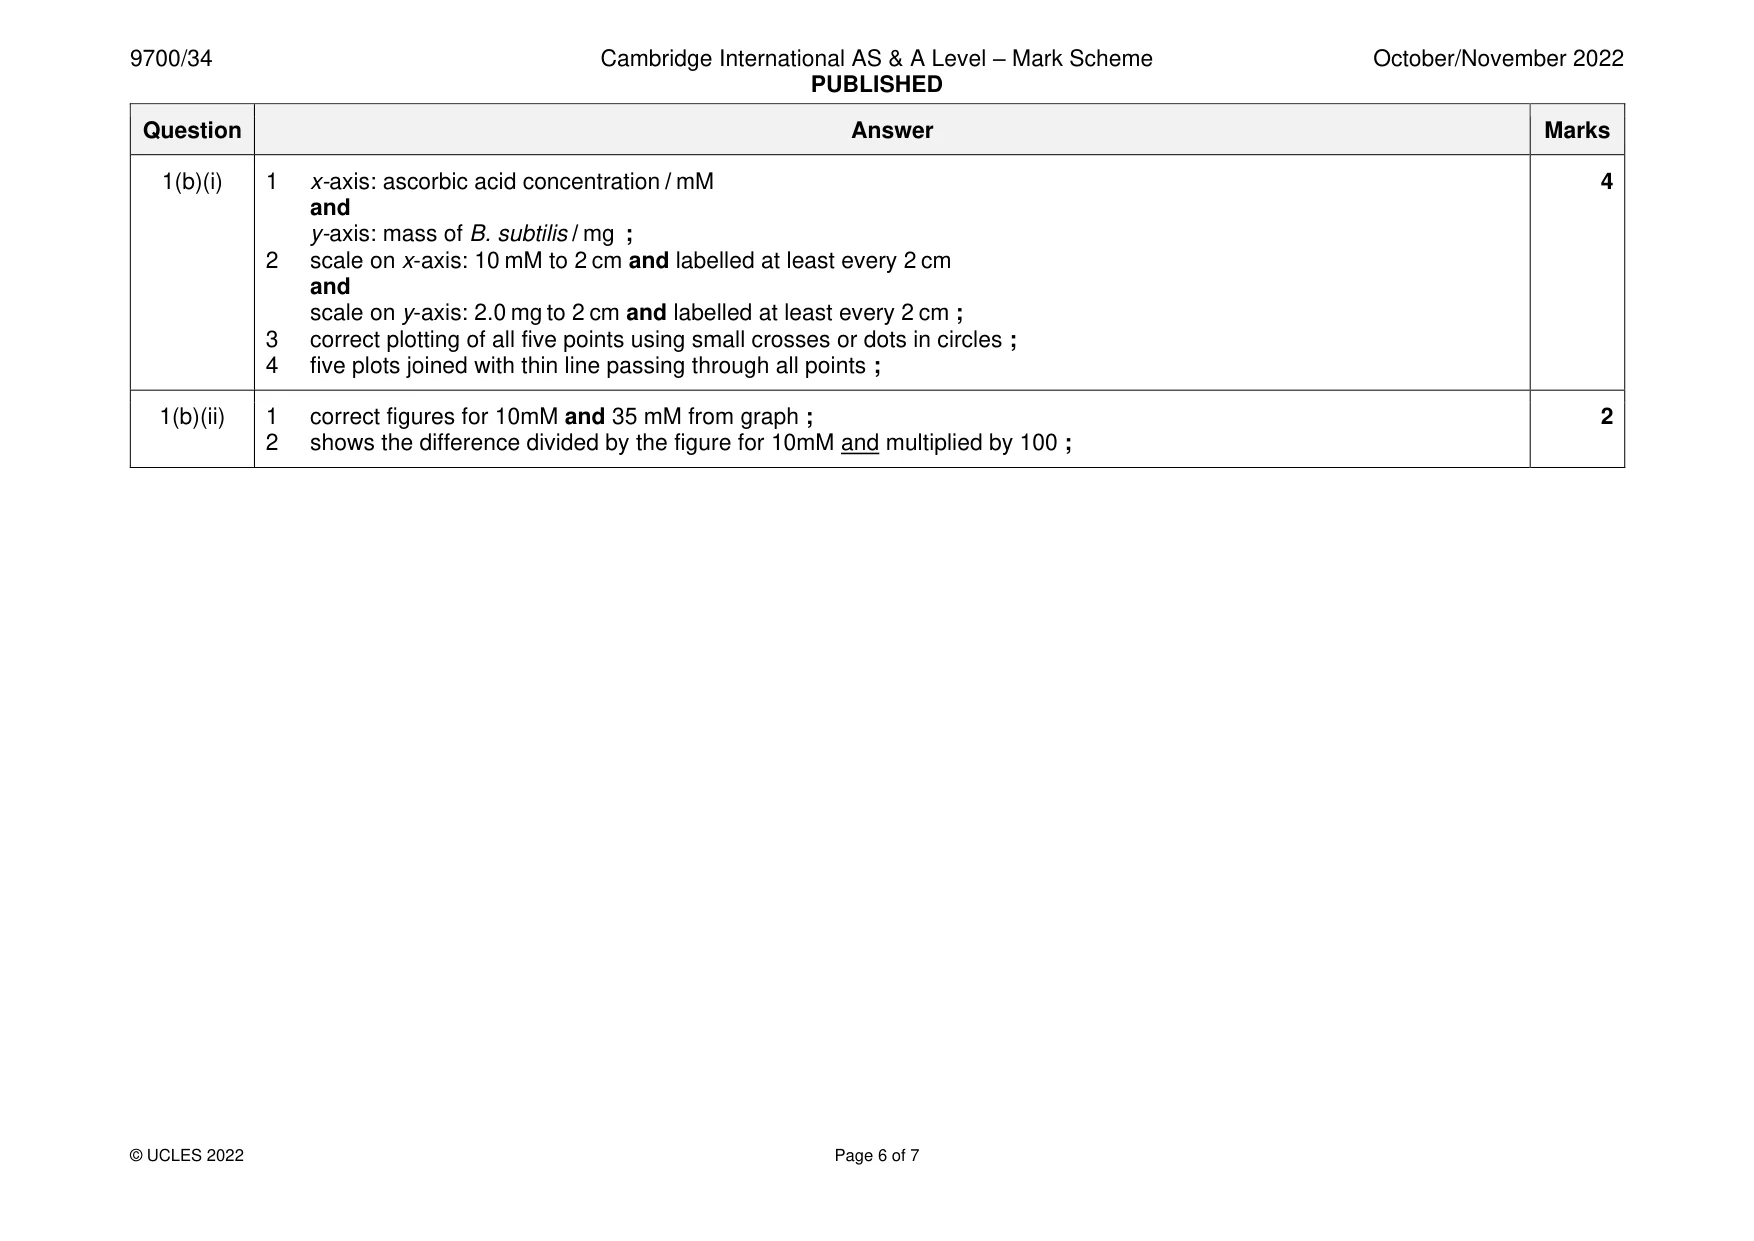
Mark scheme: Question Answer Marks 1(a)(i) 1 correct concentrations (0.05, 0.025, 0.0125, 0.00625) and % at least once ; 3 2 shows transfer of 10 (cm3) to each beaker from the previous beaker ; 3 shows 10 (cm3) of water added to each beaker ; 1(a)(ii) 1 heading for independent variable: percentage ascorbic acid concentration (before heading for dependent variable) and 4 no units in body of table ; 2 heading for dependent variable: volume of iodine / cm3 and no units in body of table ; 3 results for all concentrations and to at least one decimal place ; 4 volume of iodine recorded for the highest concentration of ascorbic acid greater than for the lowest concentration of ascorbic acid ; 1(a)(iii) any one error: 1 1 difficult to judge the end-point ; 2 difficult to read the syringe as the iodine solution is too dark ; 1(a)(iv) 1 records a volume for U and C and U is greater than C ; 1 1(a)(v) 1 correctly labels scale bar with different concentrations of ascorbic acid ; 1 1(a)(vi) 1 estimates the correct concentrations of U and C by placing U and C in the correct positions on the scale bar ; 1 1(a)(vii) any one improvement: 1 1 narrower range of concentrations ; 2 repeat and calculate a mean ; 3 use a micropipette ; 1(a)(viii) any one from: 1 1 heating breaks down ascorbic acid ; 2 heating has no effect on ascorbic acid ; 1(a)(ix) any three from: 3 1 same concentration ; 2 same temperature ; 3 thermostatically controlled water-bath ; 4 5 different times ; 5 times evenly spaced ; 1(b)(i) 1 x-axis: ascorbic acid concentration / mM 4 and y-axis: mass of B. subtilis / mg ; 2 scale on x-axis: 10 mM to 2 cm and labelled at least every 2 cm and scale on y-axis: 2.0 mg to 2 cm and labelled at least every 2 cm ; 3 correct plotting of all five points using small crosses or dots in circles ; 4 five plots joined with thin line passing through all points ; 1(b)(ii) 1 correct figures for 10mM and 35 mM from graph ; 2 2 shows the difference divided by the figure for 10mM and multiplied by 100 ;
Q2 · L1 is a slide of a stained transverse section through a plant root
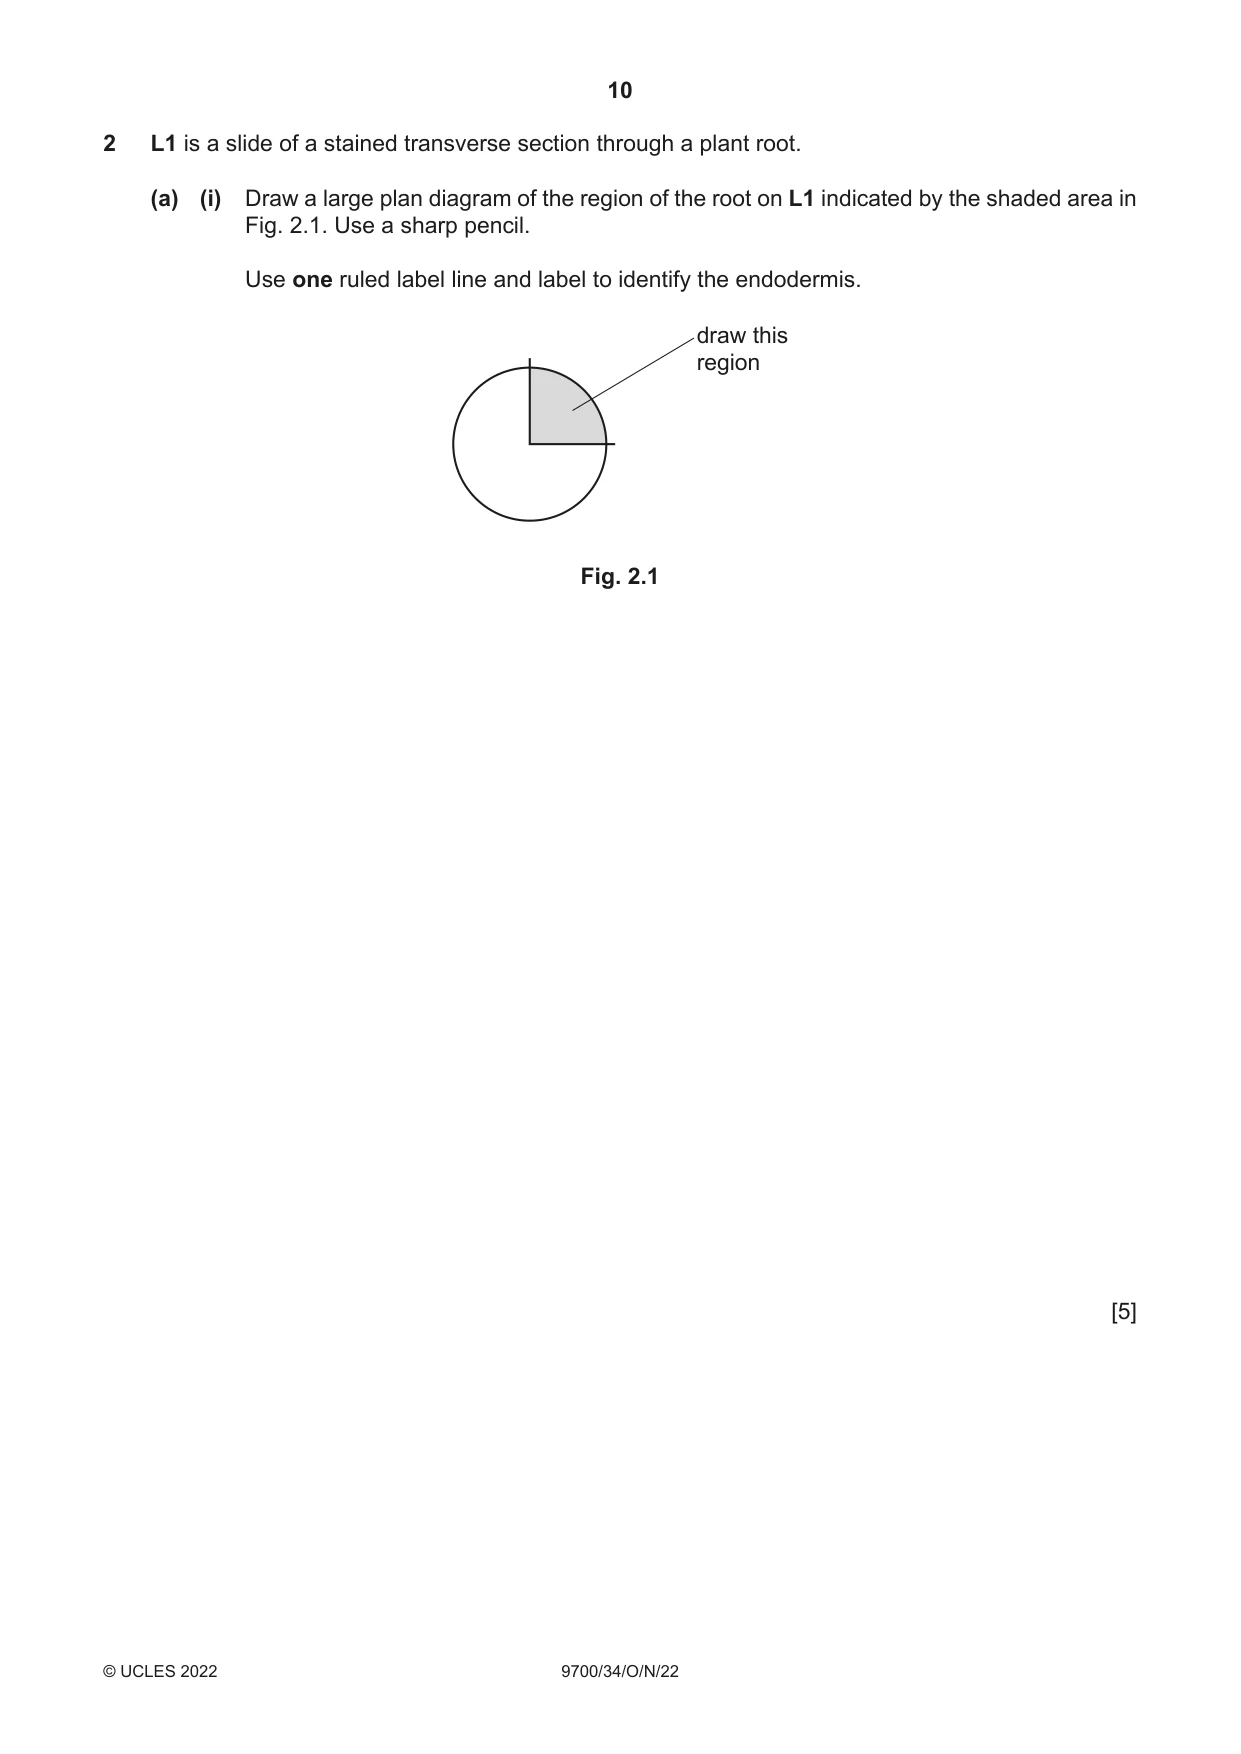
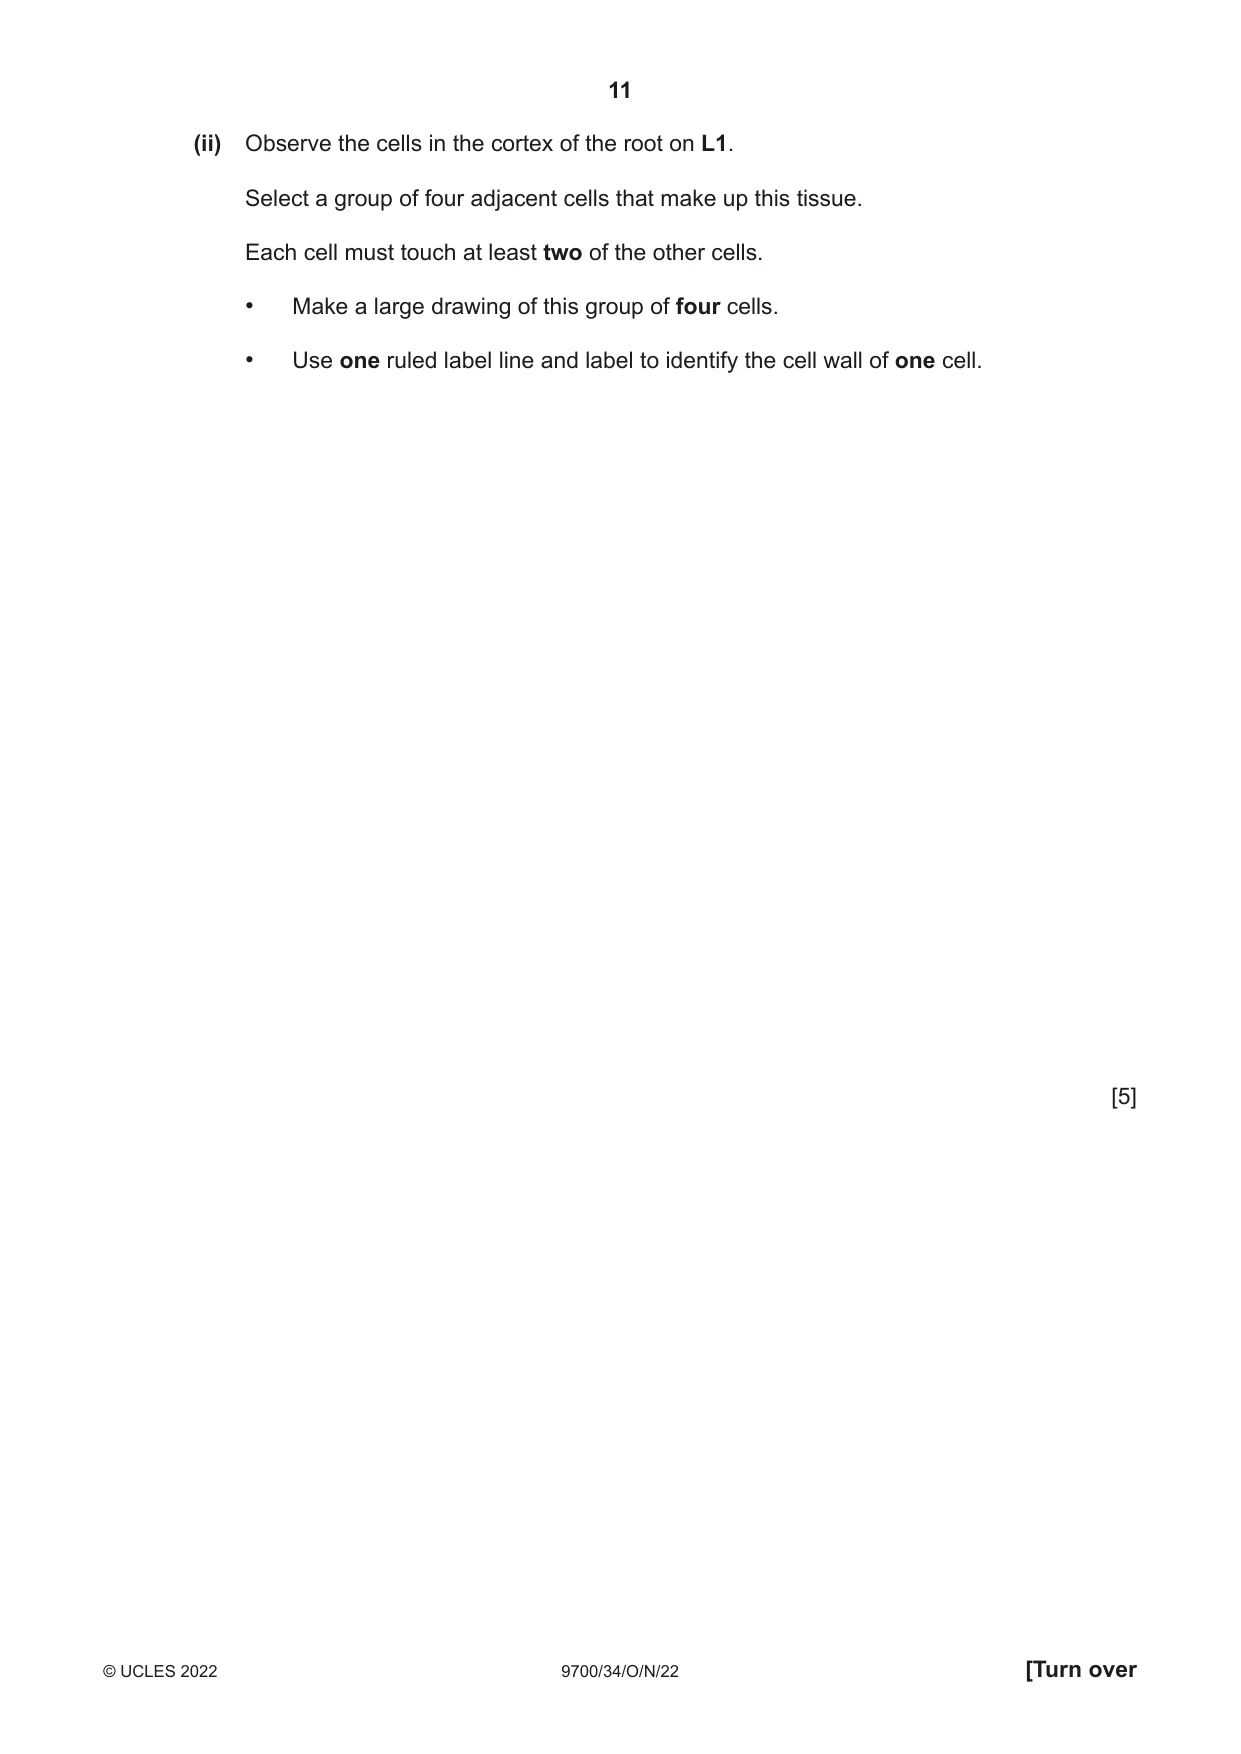
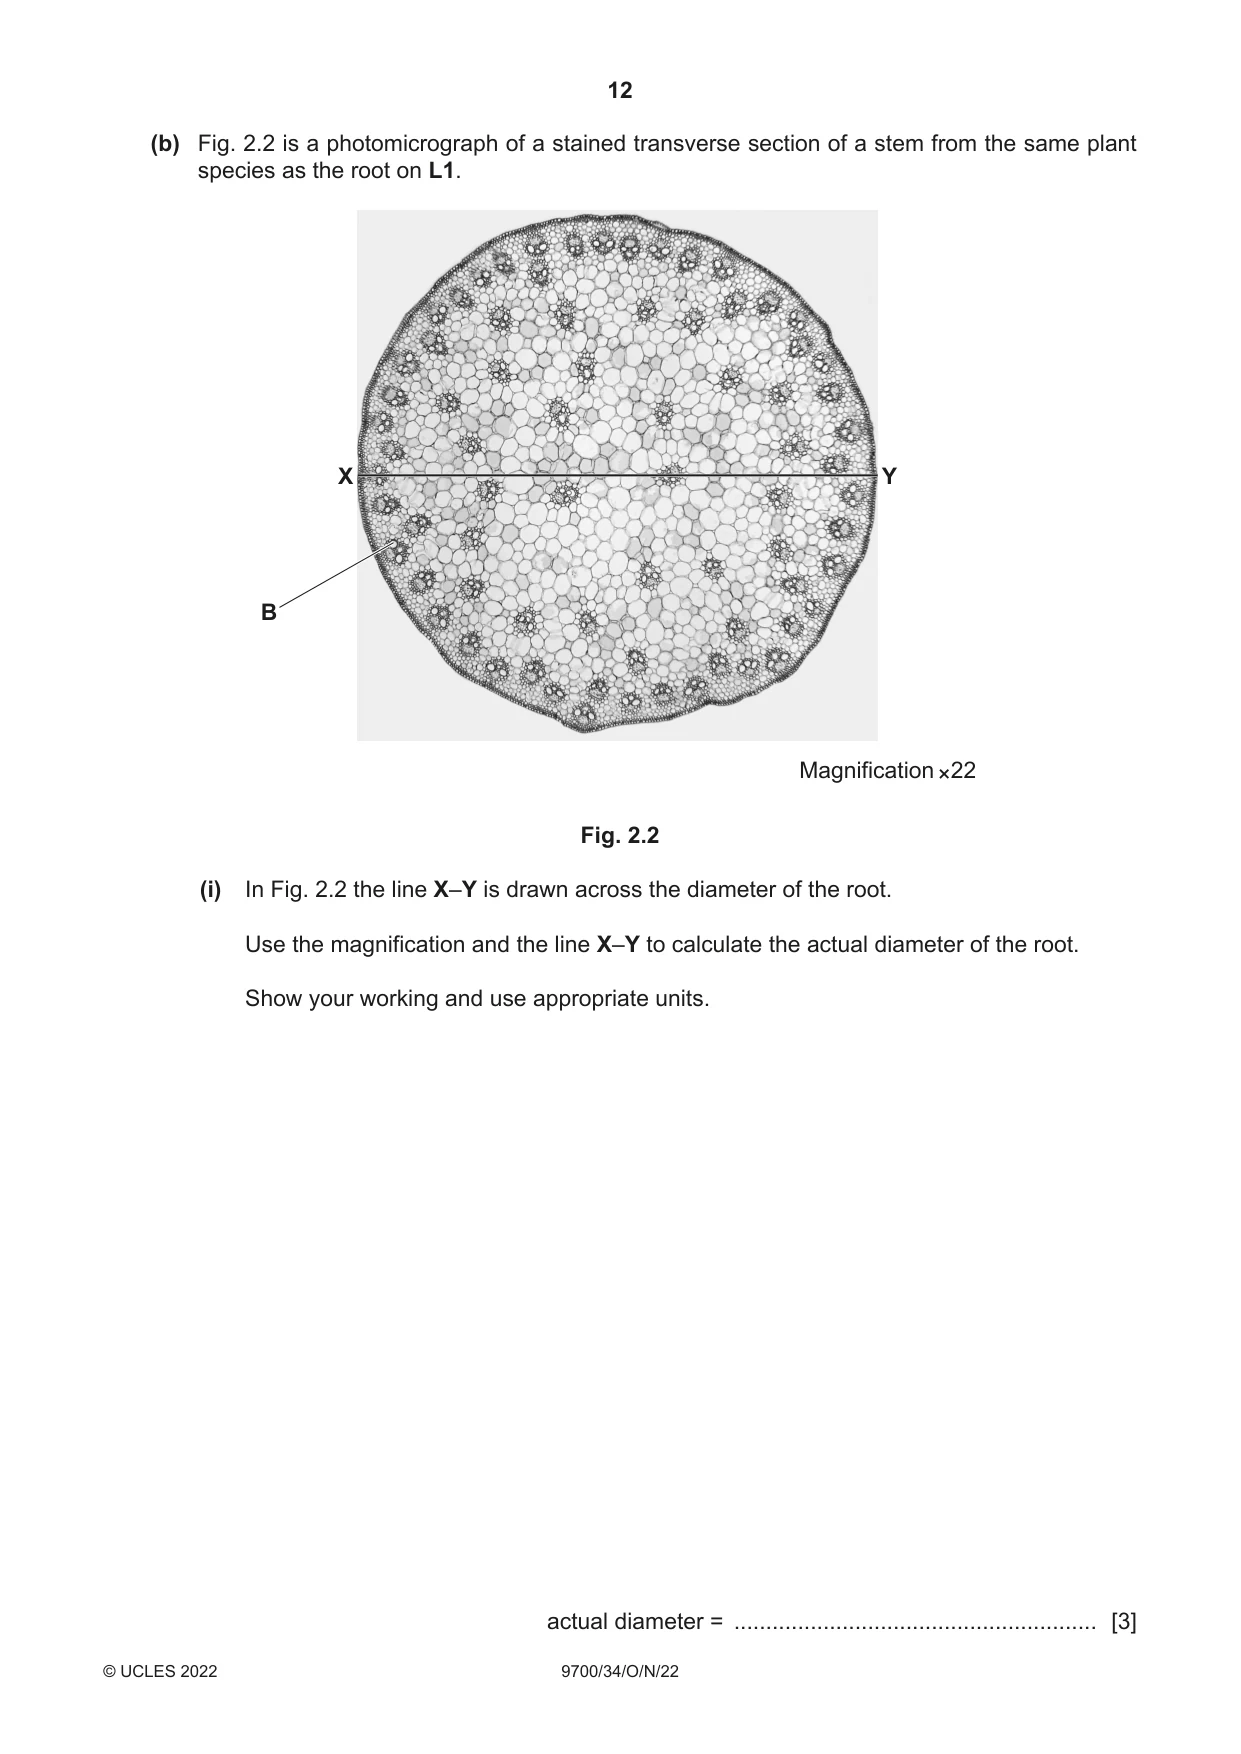
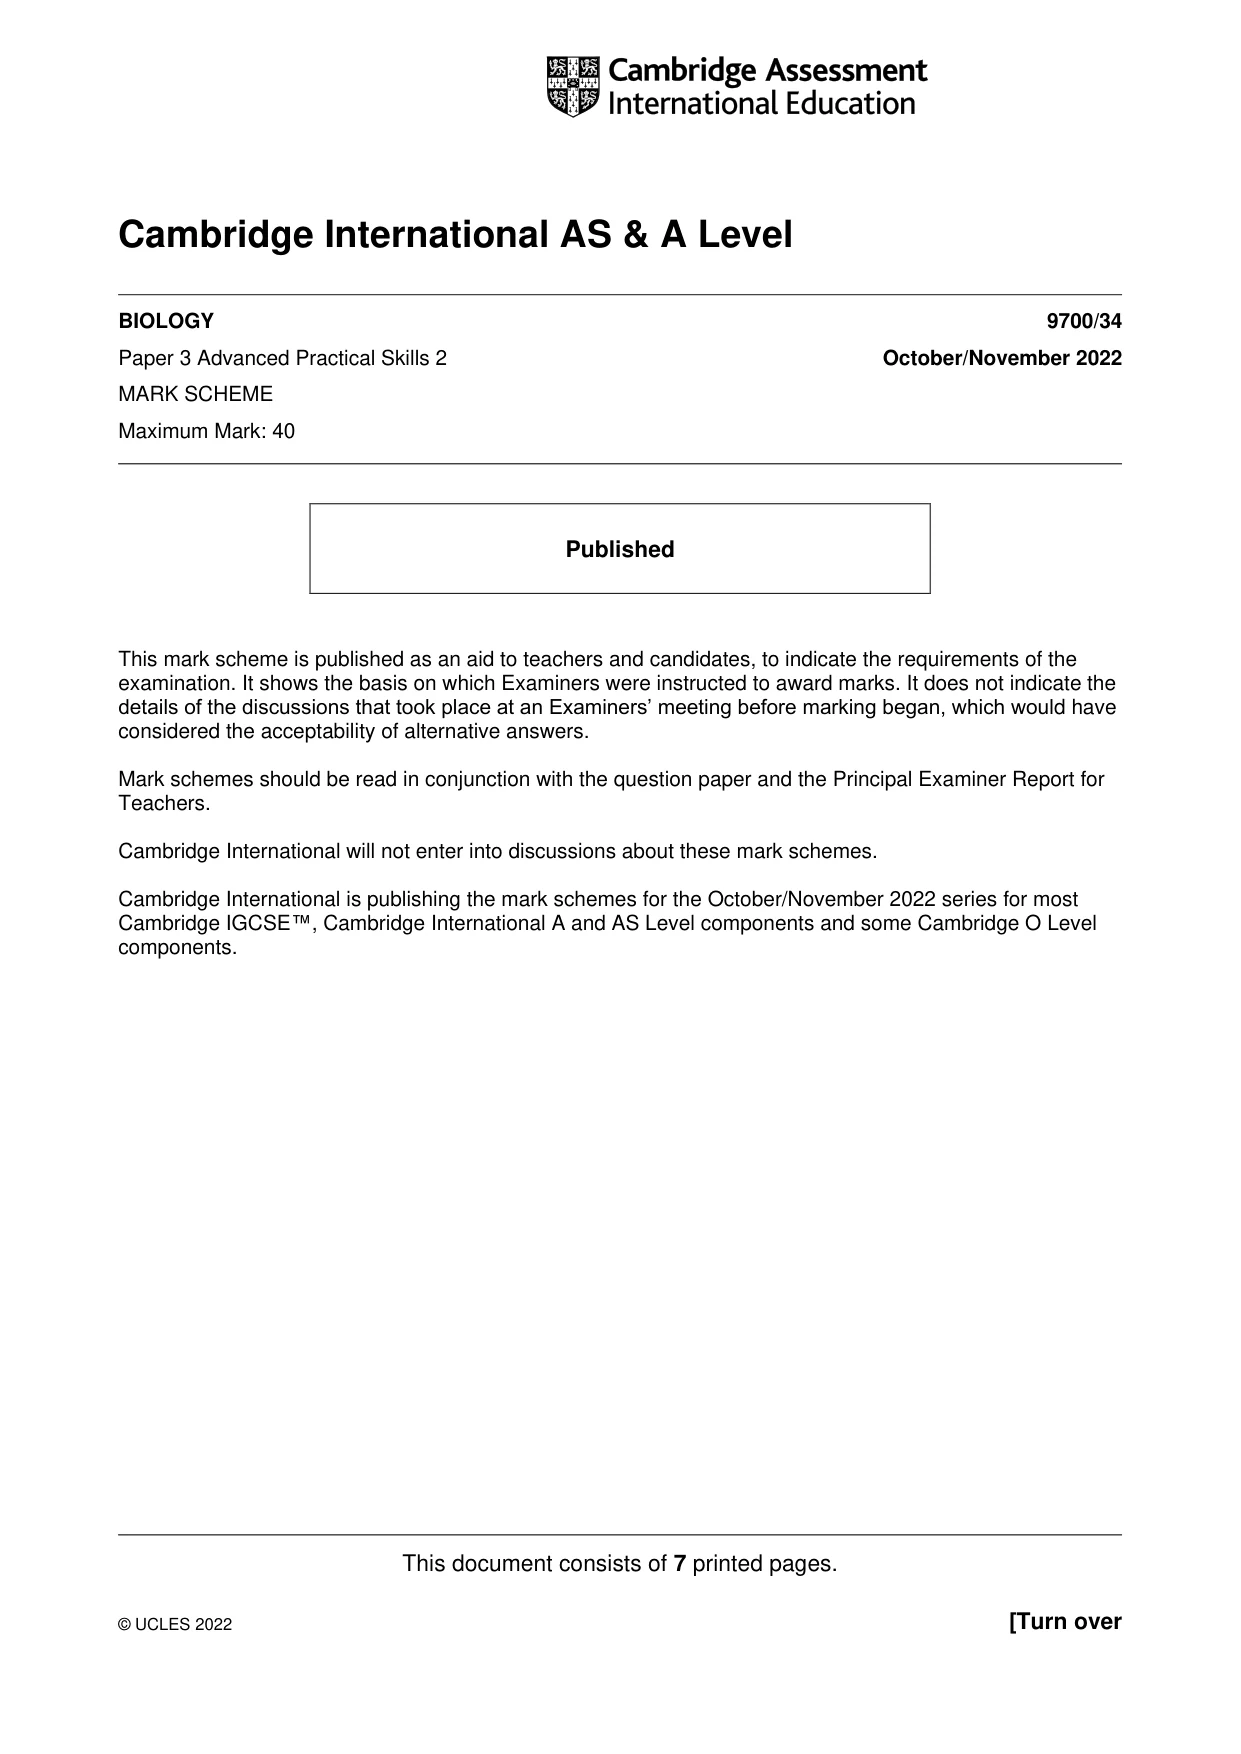
2 L1 is a slide of a stained transverse section through a plant root. (a) (i) Draw a large plan diagram of the region of the root on L1 indicated by the shaded area in Fig. 2.1. Use a sharp pencil. Use one ruled label line and label to identify the endodermis. draw this region Fig. 2.1 [5] (ii) Observe the cells in the cortex of the root on L1. Select a group of four adjacent cells that make up this tissue. Each cell must touch at least two of the other cells. • Make a large drawing of this group of four cells. • Use one ruled label line and label to identify the cell wall of one cell. [5] (b) Fig. 2.2 is a photomicrograph of a stained transverse section of a stem from the same plant species as the root on L1. X Y B Magnification ×22 Fig. 2.2 (i) In Fig. 2.2 the line X–Y is drawn across the diameter of the root. Use the magnification and the line X–Y to calculate the actual diameter of the root. Show your working and use appropriate units. actual diameter = ......................................................... [3]
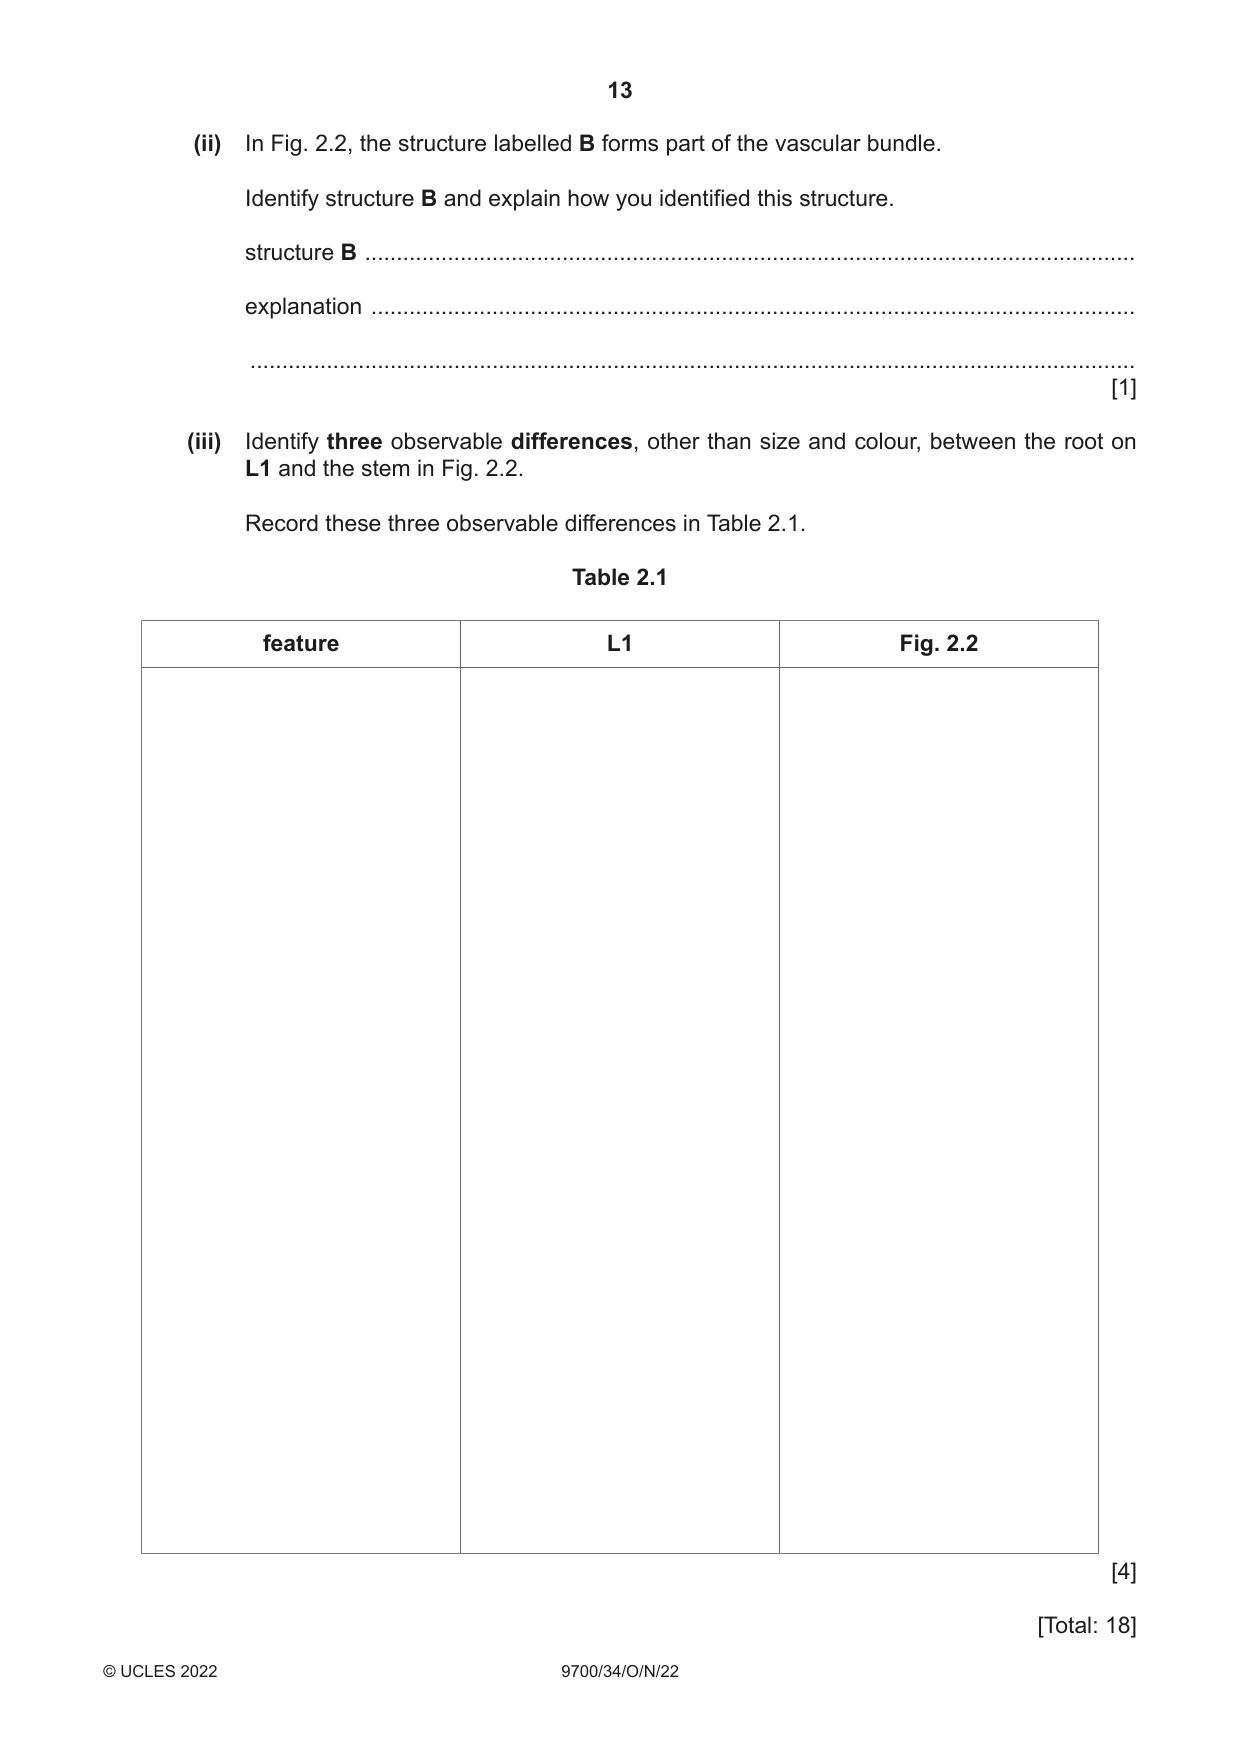
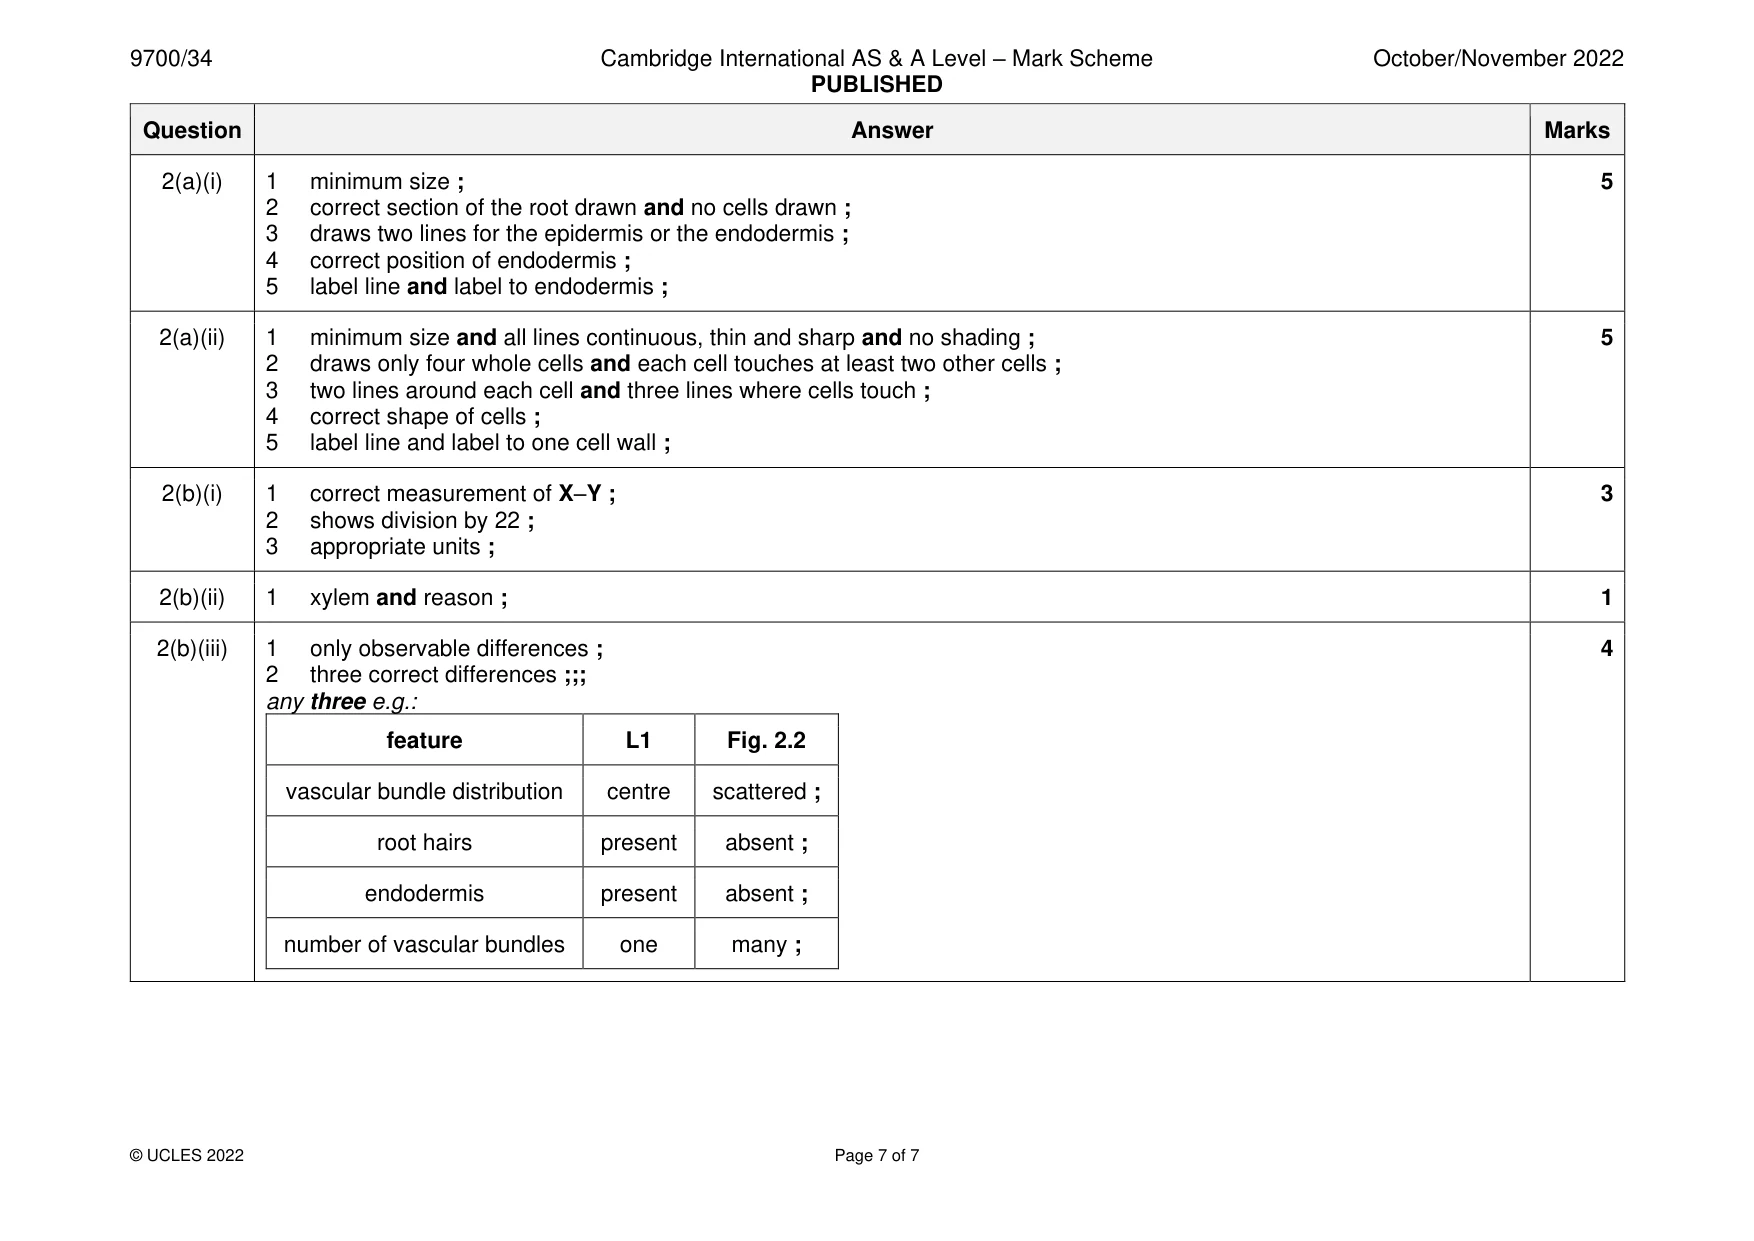
Mark scheme: 2(a)(i) 1 minimum size ; 5 2 correct section of the root drawn and no cells drawn ; 3 draws two lines for the epidermis or the endodermis ; 4 correct position of endodermis ; 5 label line and label to endodermis ; 2(a)(ii) 1 minimum size and all lines continuous, thin and sharp and no shading ; 5 2 draws only four whole cells and each cell touches at least two other cells ; 3 two lines around each cell and three lines where cells touch ; 4 correct shape of cells ; 5 label line and label to one cell wall ; 2(b)(i) 1 correct measurement of X–Y ; 3 2 shows division by 22 ; 3 appropriate units ; 2(b)(ii) 1 xylem and reason ; 1 2(b)(iii) 1 only observable differences ; 4 2 three correct differences ;;; any three e.g.: feature L1 Fig. 2.2 vascular bundle distribution centre scattered ; root hairs present absent ; endodermis present absent ; number of vascular bundles one many ;
More questions on Cells as the basic units of living organisms
What was in this paper
The subtopics covered by these 2 questions, and how many questions each got. Open one in a new tab to see every Cambridge question on it.
What you needed in this session
Cambridge’s own grade thresholds for 2022 Oct/Nov, Paper 3 · Variant 4. A higher threshold means an easier paper — the bar moves with how the cohort did.