Cambridge A Level Biology 9700 — 2022 Feb/March Paper 2 · Variant 2
9700/22/F/M/22 · 6 questions · 60 marks · ≈68 min
The question paper and its mark scheme, free to read here and free to download. This is Cambridge’s own paper, exactly as it was sat.
Question paper20 pages

Mark scheme13 pages
Answers below. Sit the paper first if you are practising.
Questions as text
Q1 · Three of the processes by which substances in solution can move across cell membranes
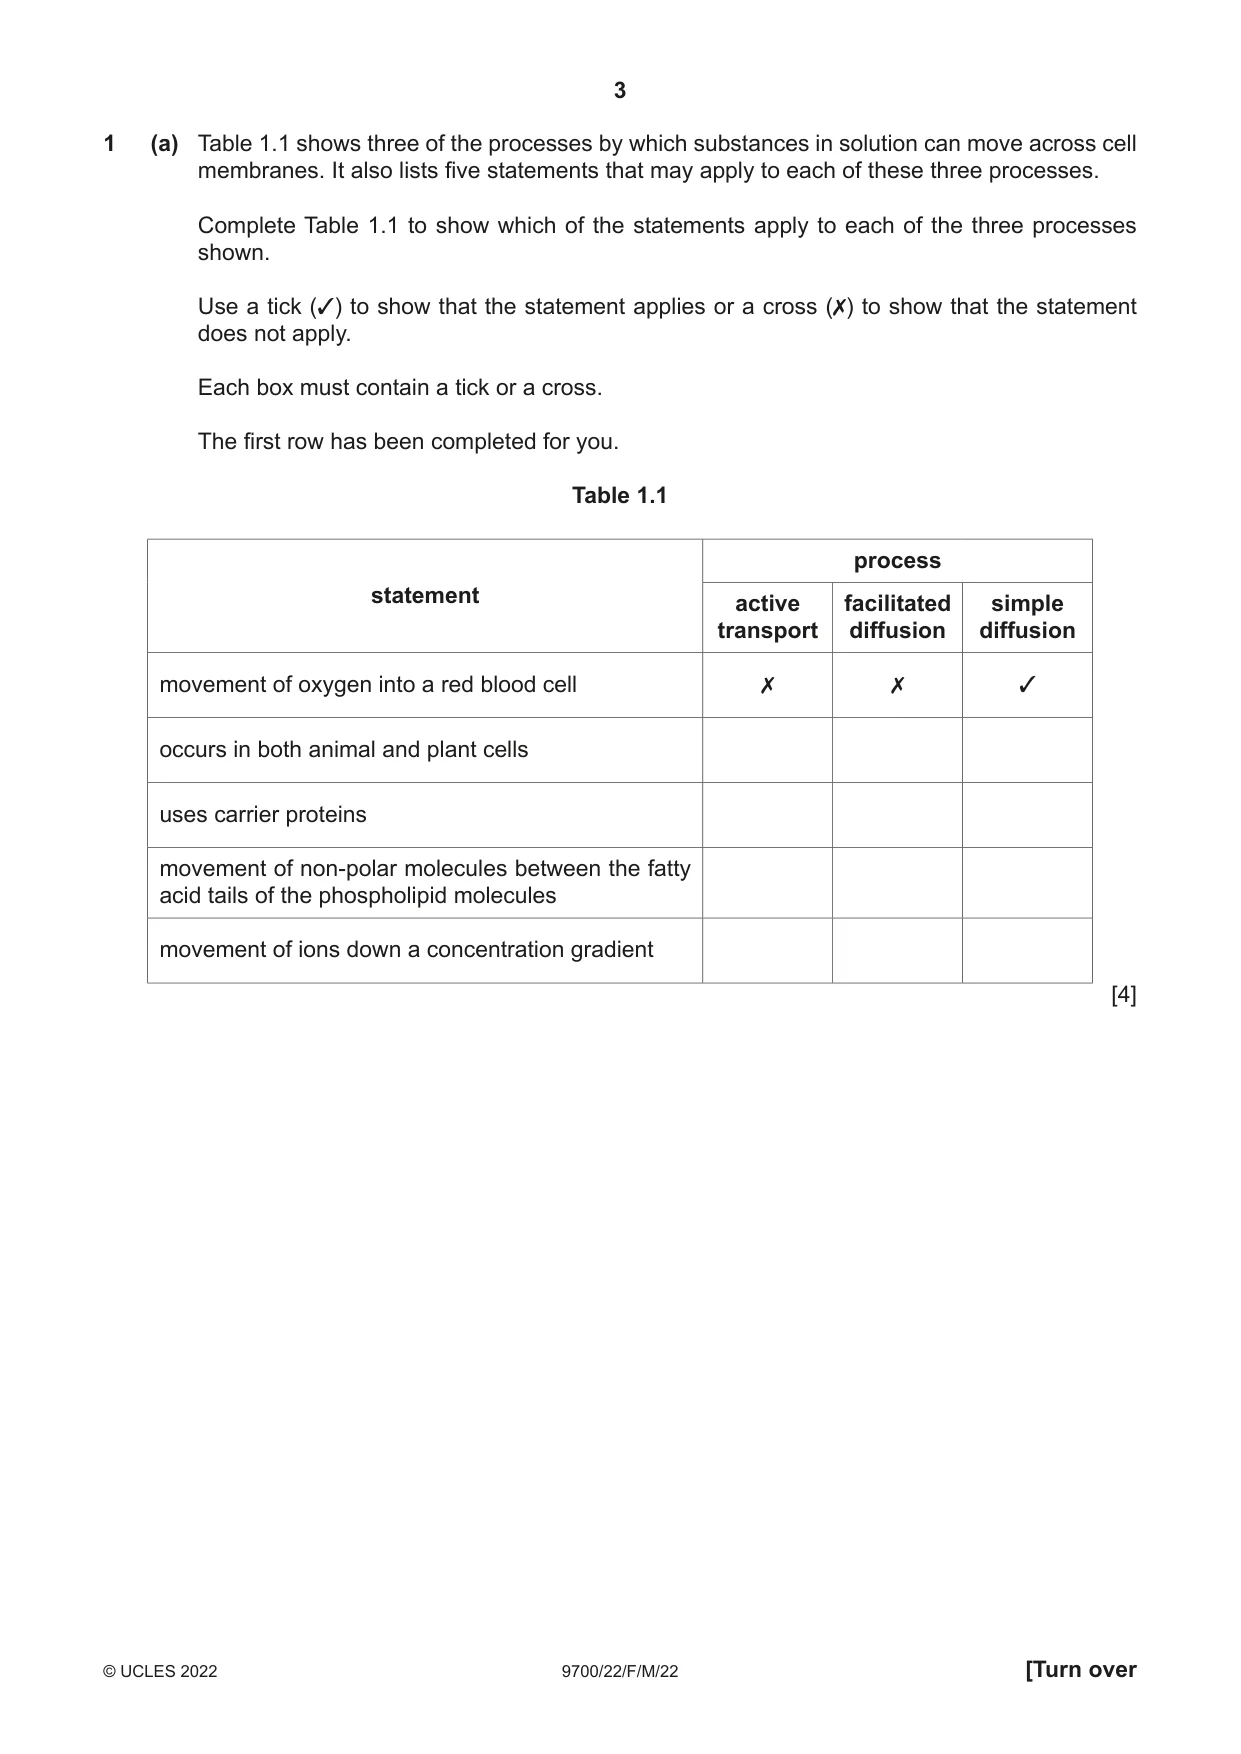
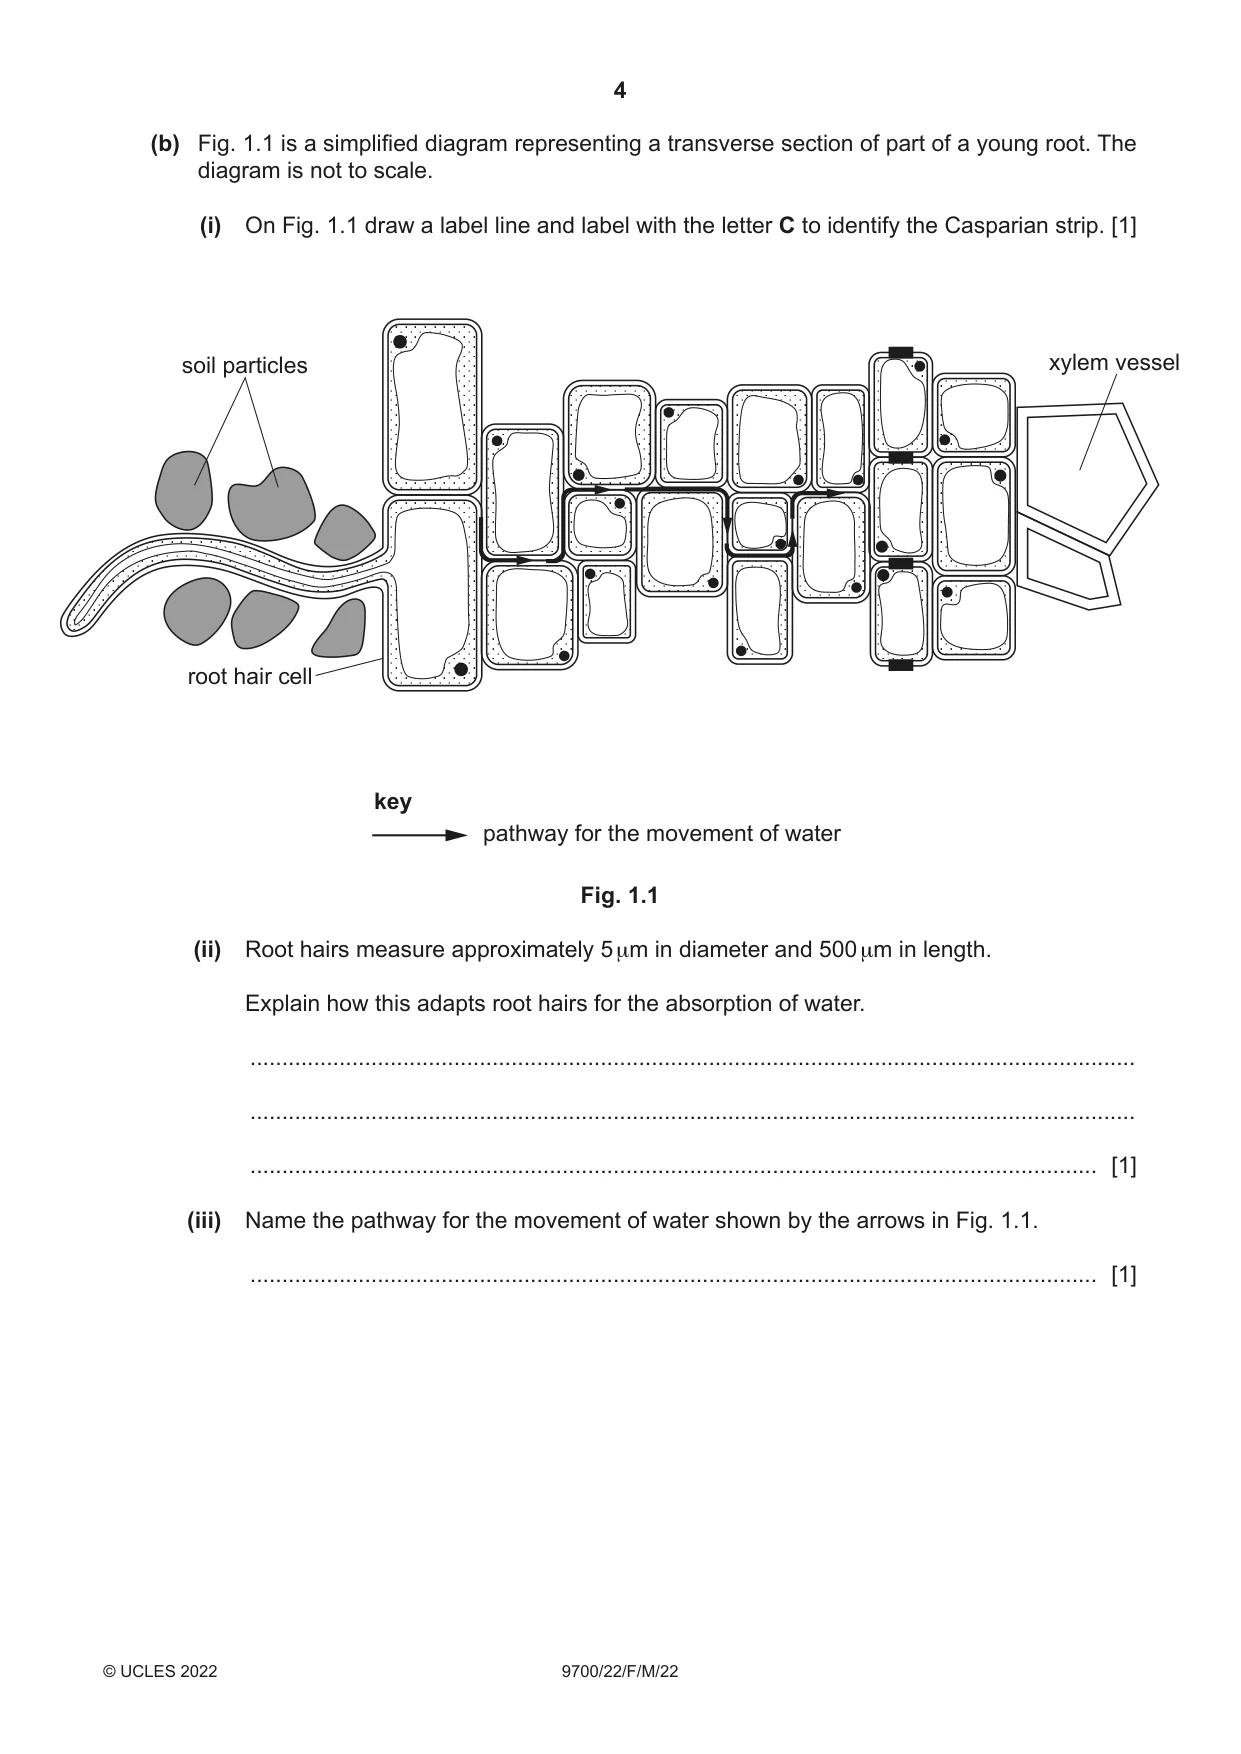
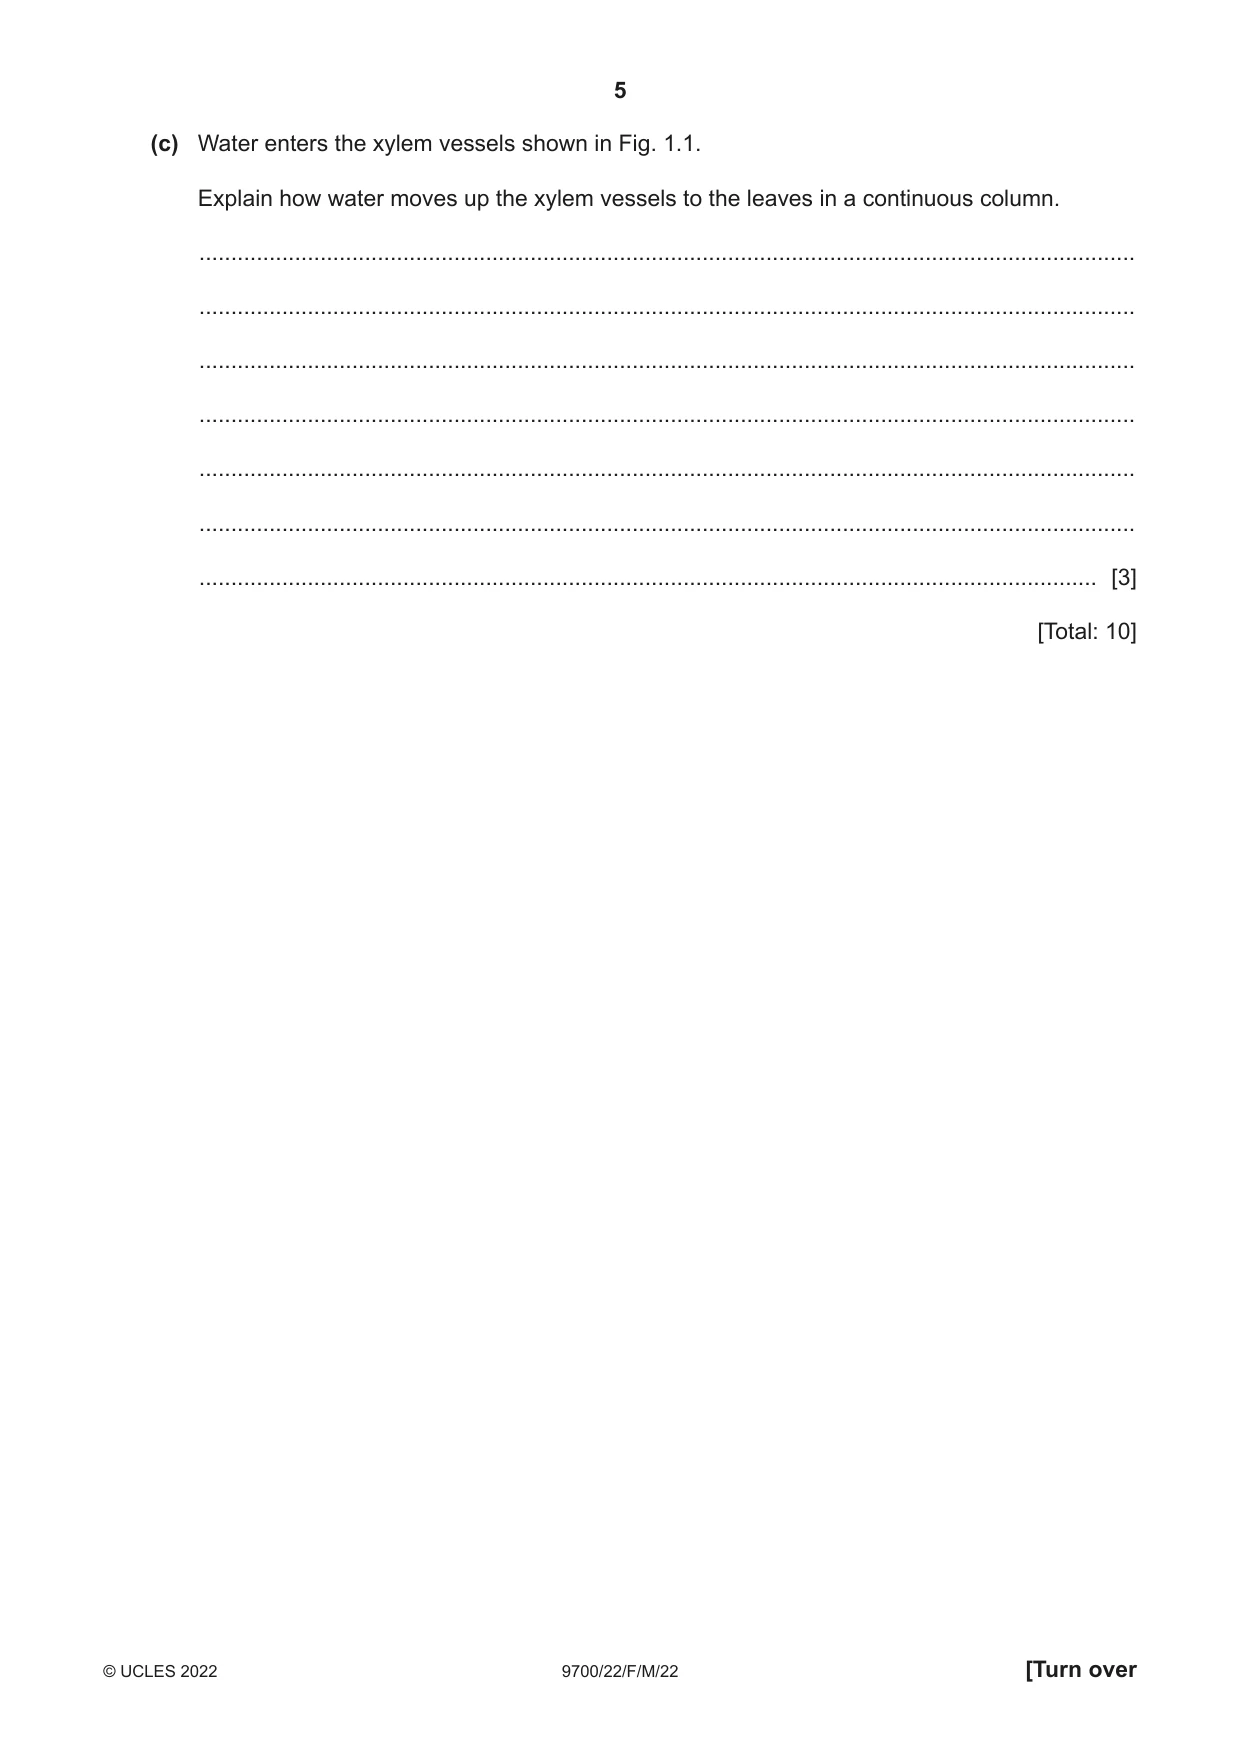
1 (a) Table 1.1 shows three of the processes by which substances in solution can move across cell membranes. It also lists five statements that may apply to each of these three processes. Complete Table 1.1 to show which of the statements apply to each of the three processes shown. Use a tick (3) to show that the statement applies or a cross (✗) to show that the statement does not apply. Each box must contain a tick or a cross. The first row has been completed for you. Table 1.1 process statement active facilitated simple transport diffusion diffusion movement of oxygen into a red blood cell ✗ ✗ 3 occurs in both animal and plant cells uses carrier proteins movement of non-polar molecules between the fatty acid tails of the phospholipid molecules movement of ions down a concentration gradient [4] (b) Fig. 1.1 is a simplified diagram representing a transverse section of part of a young root. The diagram is not to scale. (i) On Fig. 1.1 draw a label line and label with the letter C to identify the Casparian strip. [1] soil particles xylem vessel root hair cell key pathway for the movement of water Fig. 1.1 (ii) Root hairs measure approximately 5 μm in diameter and 500 μm in length. Explain how this adapts root hairs for the absorption of water. ........................................................................................................................................... ........................................................................................................................................... ..................................................................................................................................... [1] (iii) Name the pathway for the movement of water shown by the arrows in Fig. 1.1. ..................................................................................................................................... [1] (c) Water enters the xylem vessels shown in Fig. 1.1. Explain how water moves up the xylem vessels to the leaves in a continuous column. ................................................................................................................................................... ................................................................................................................................................... ................................................................................................................................................... ................................................................................................................................................... ................................................................................................................................................... ................................................................................................................................................... ............................................................................................................................................. [3] [Total: 10]
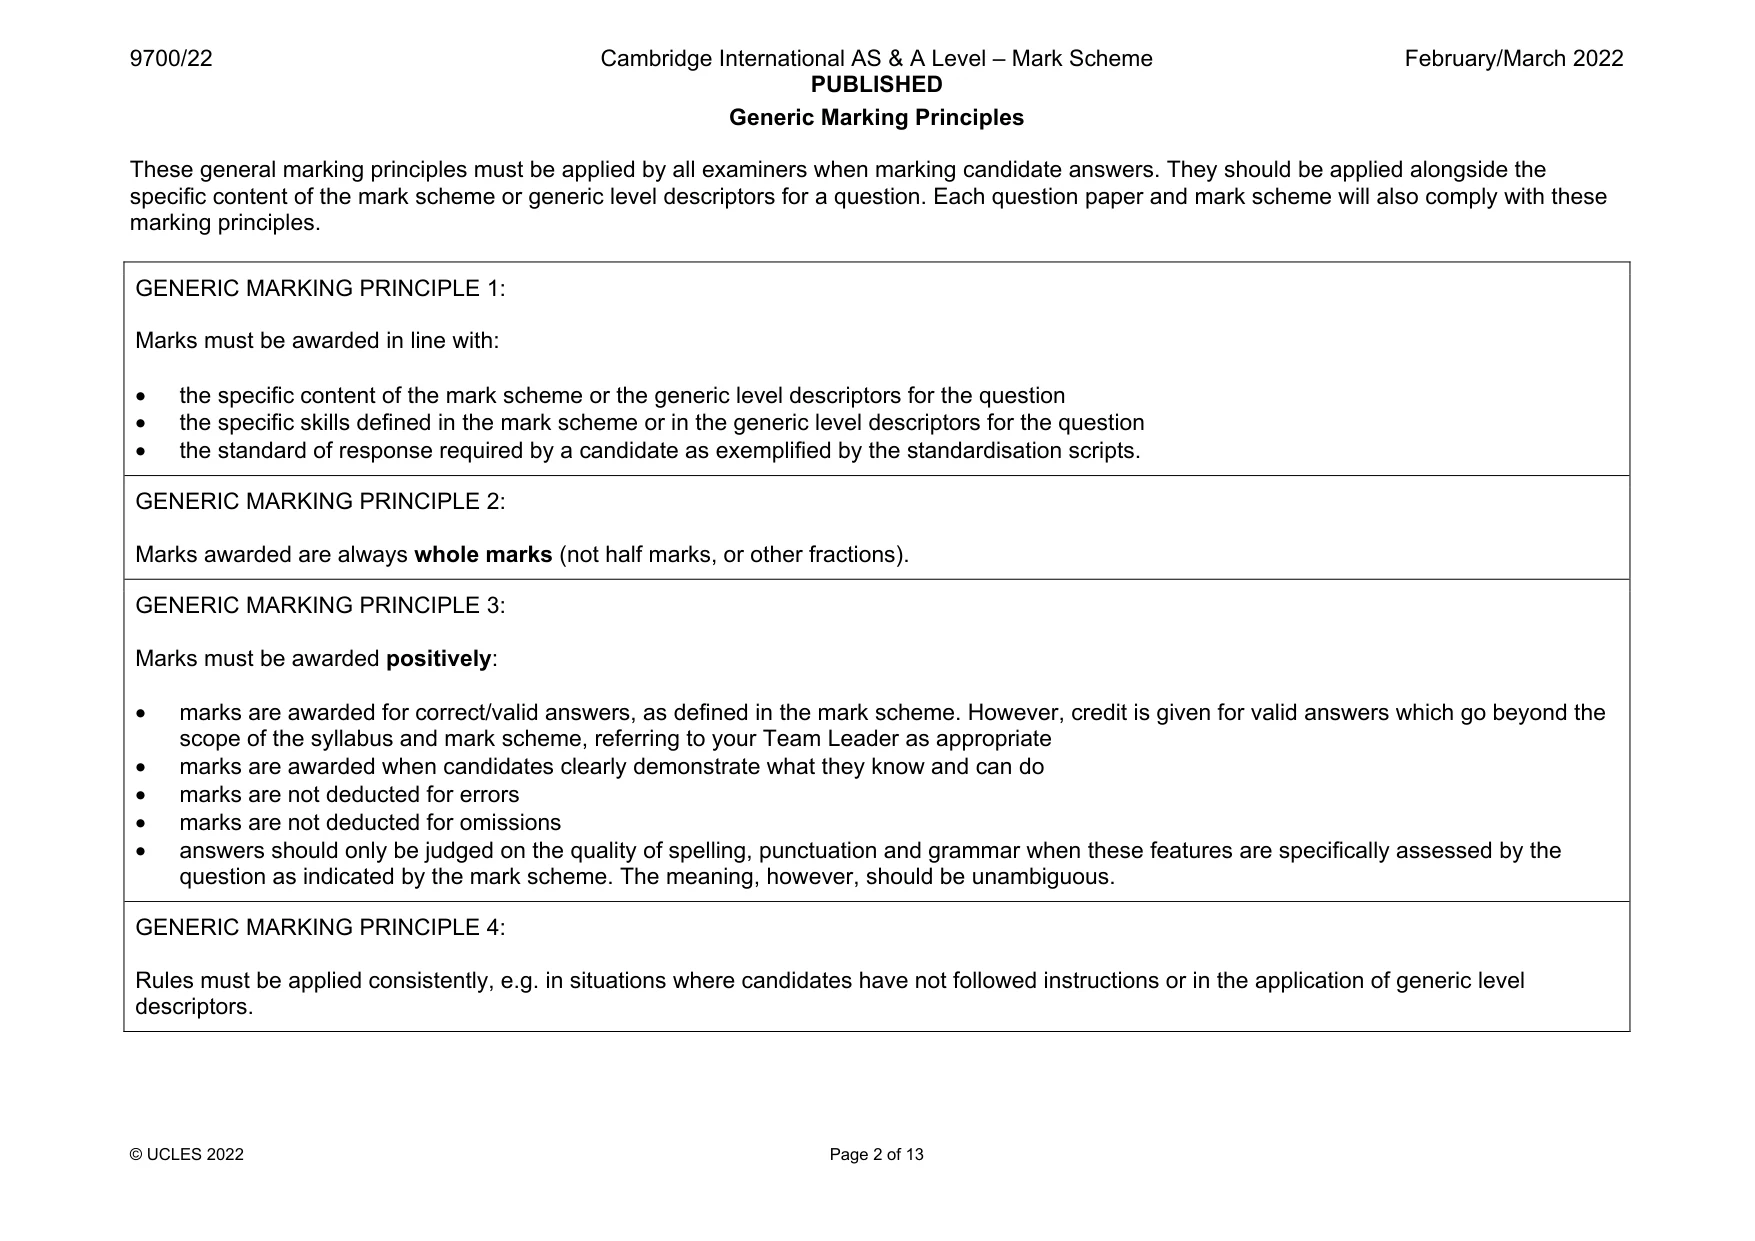
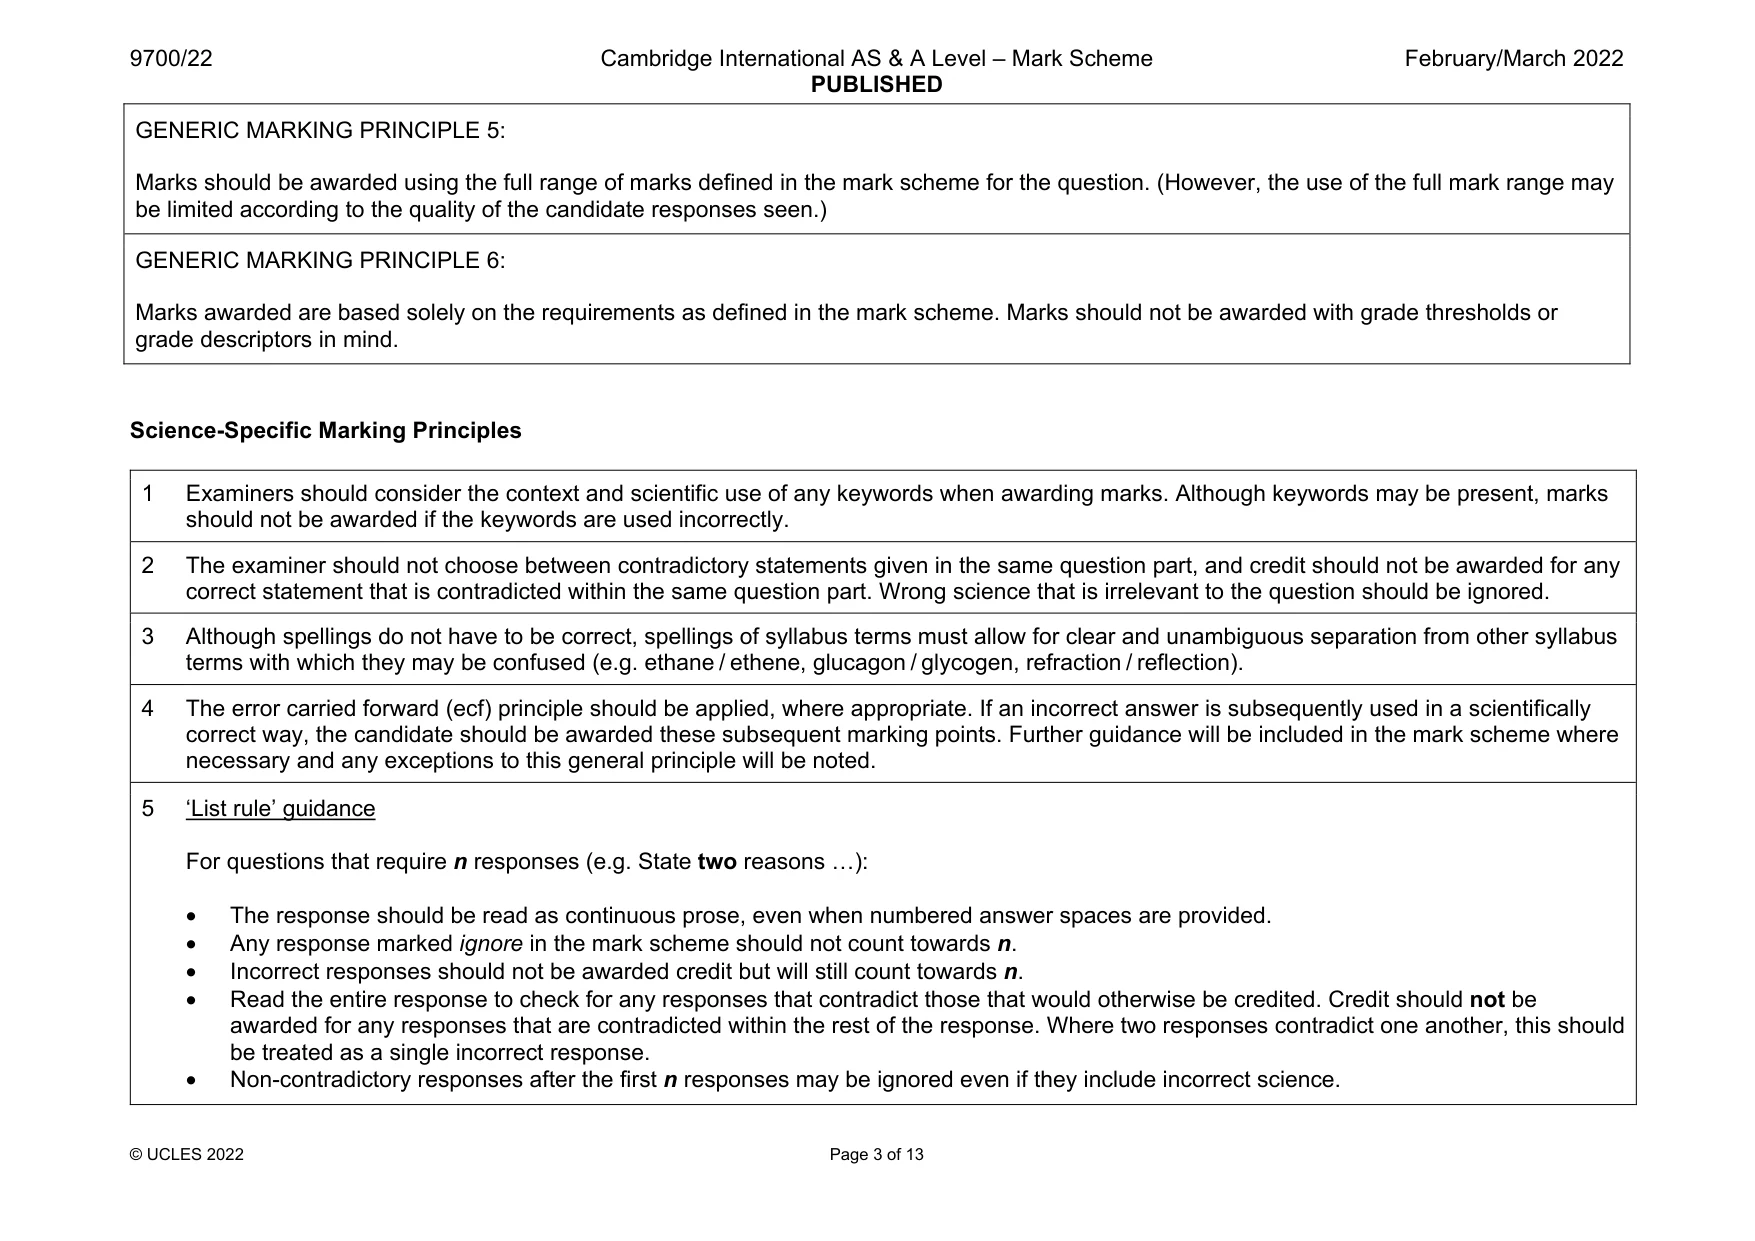
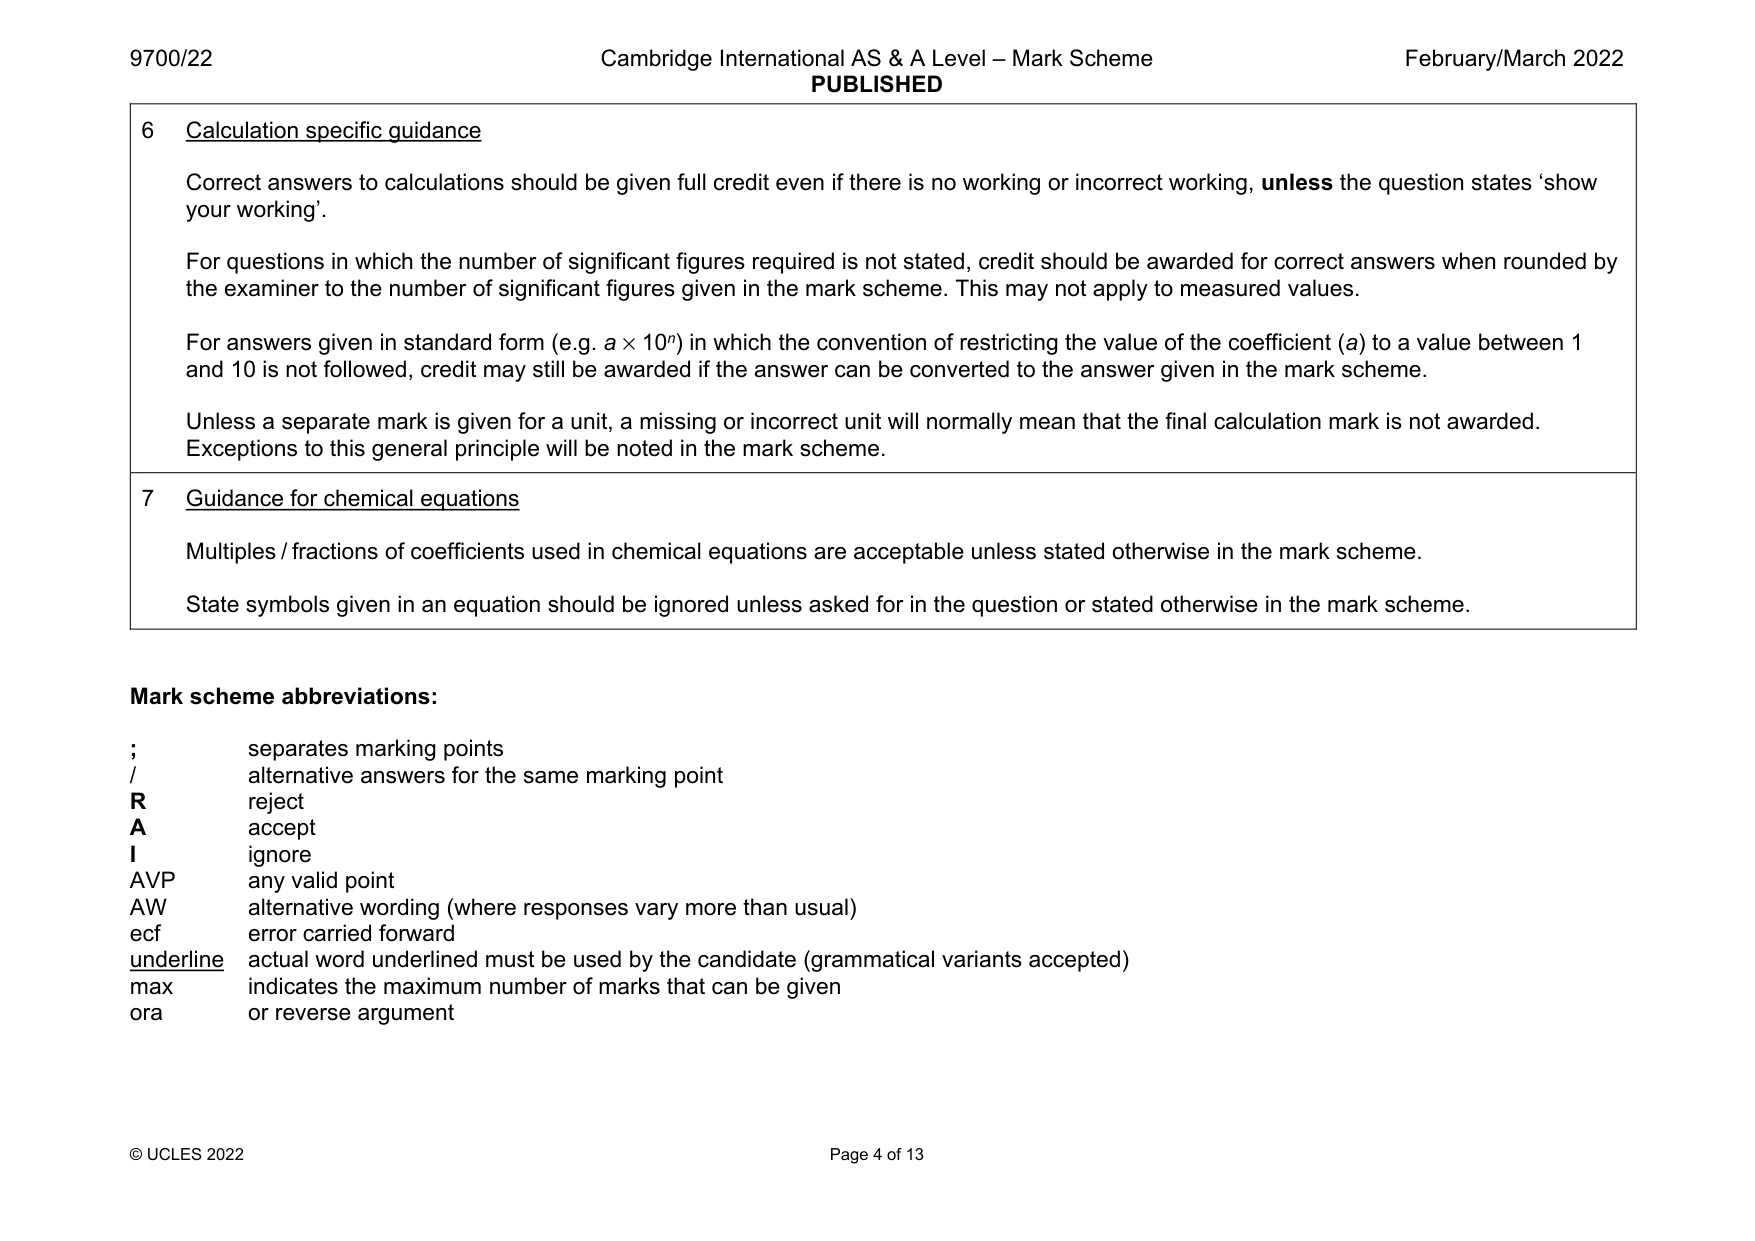
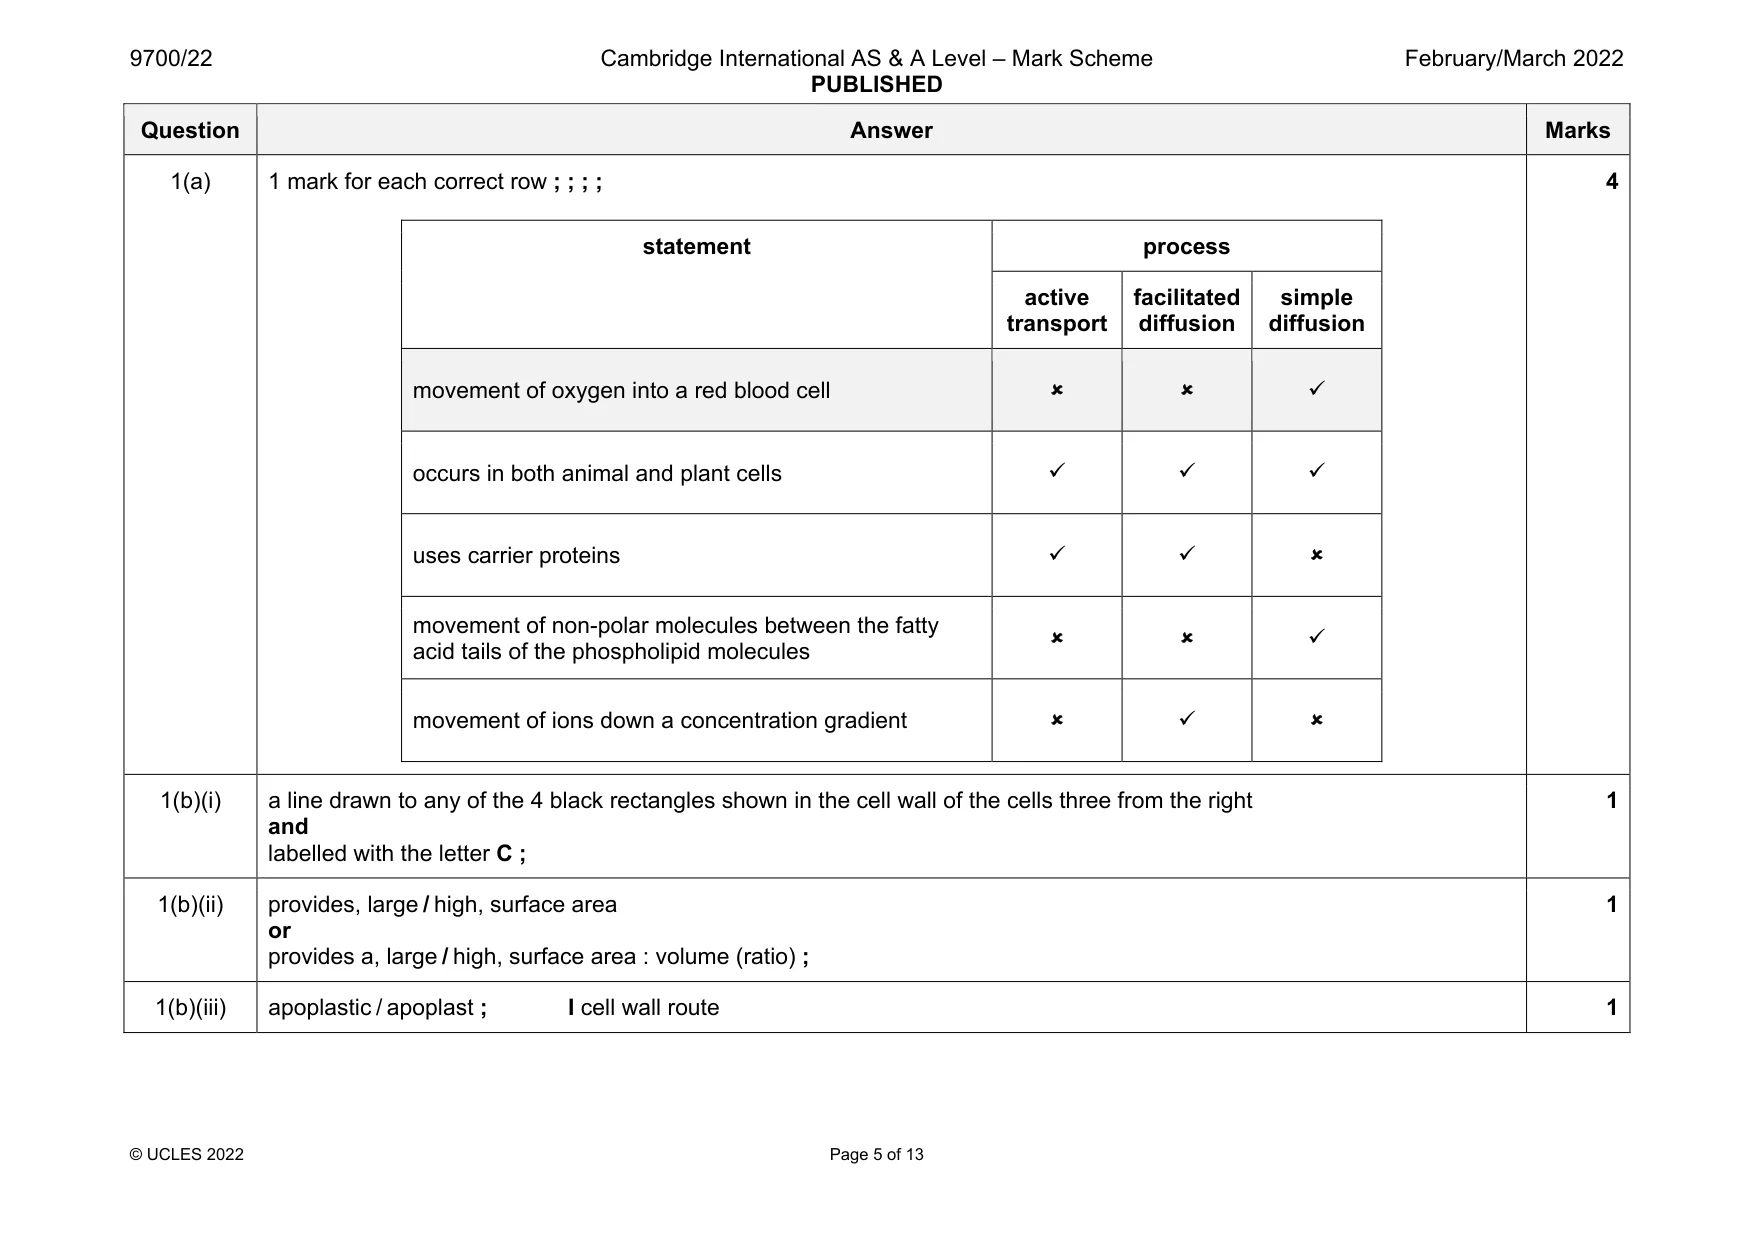
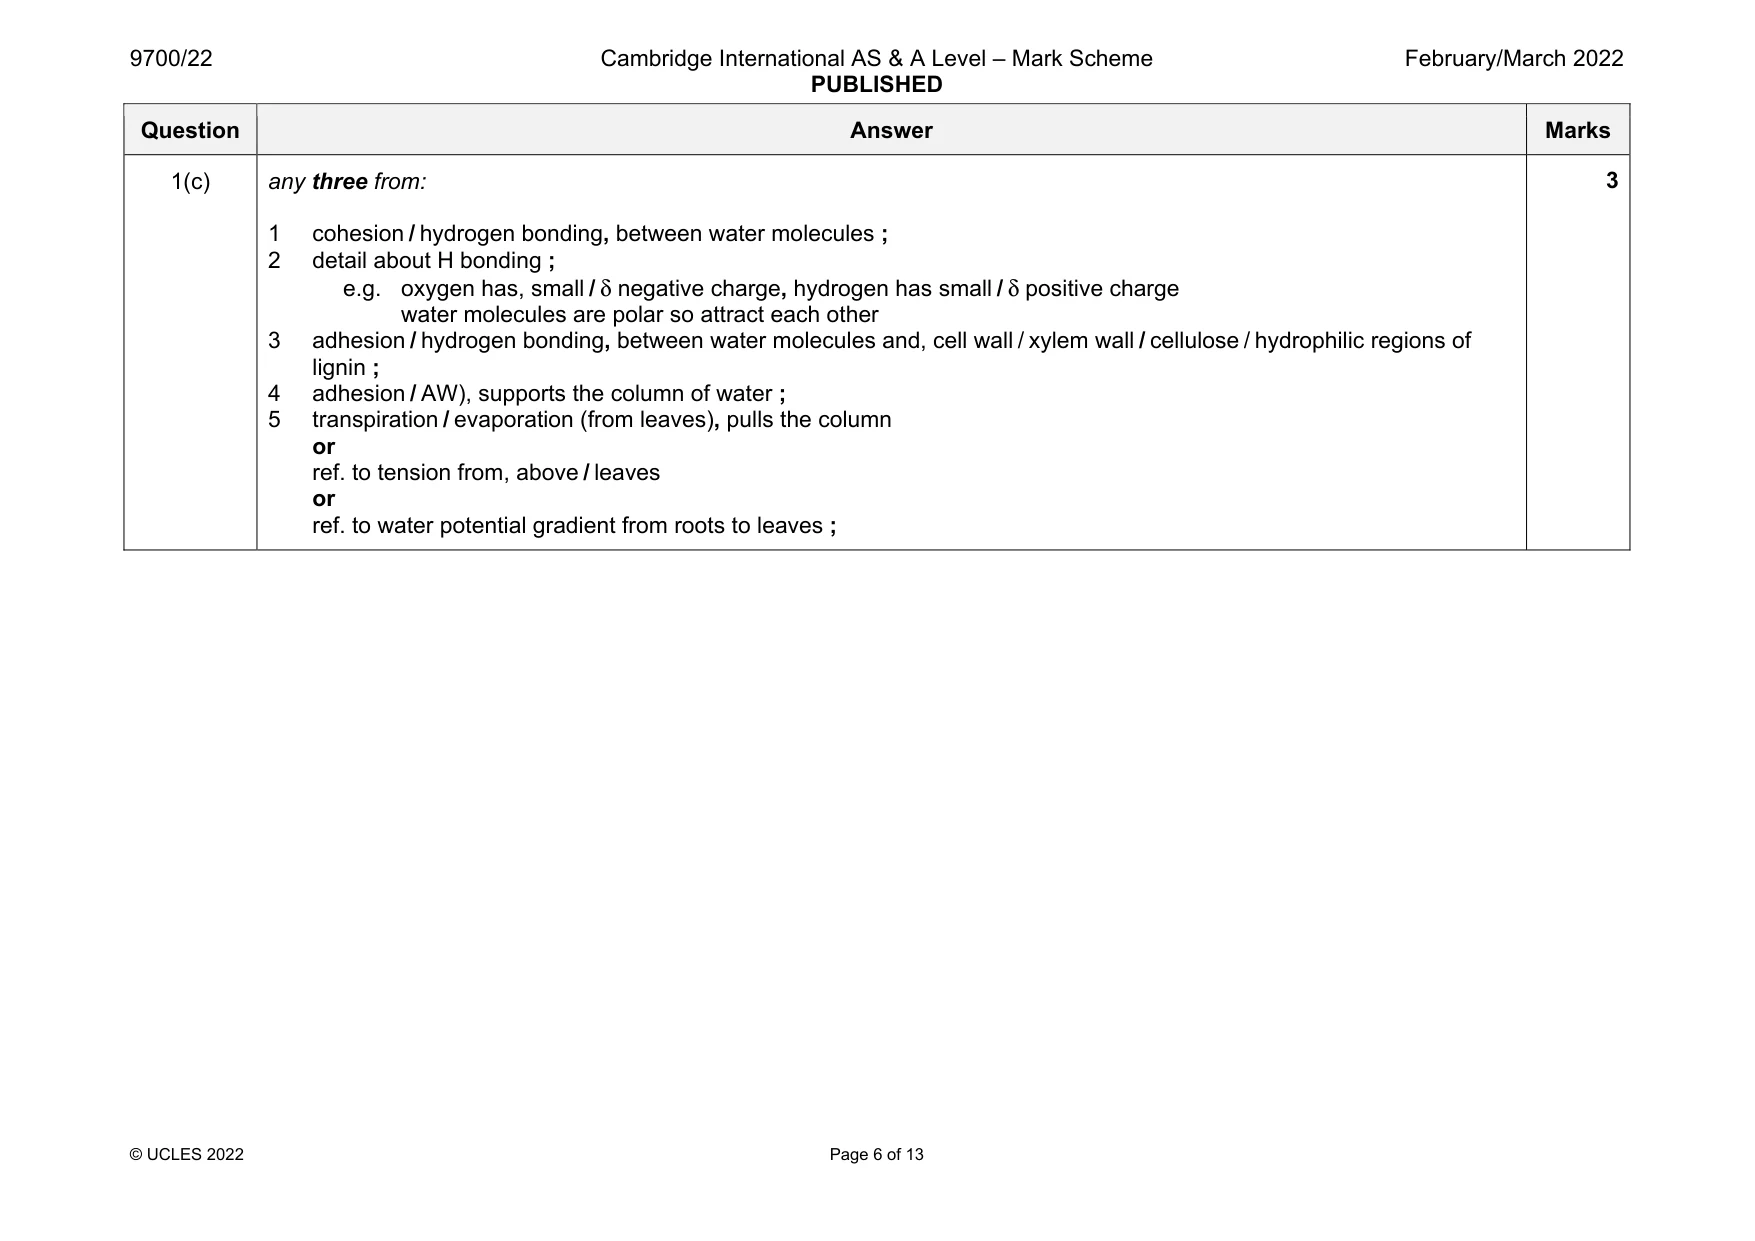
Mark scheme: 1(a) 1 mark for each correct row ; ; ; ; statement process active transport facilitated diffusion simple diffusion movement of oxygen into a red blood cell occurs in both animal and plant cells uses carrier proteins movement of non-polar molecules between the fatty acid tails of the phospholipid molecules movement of ions down a concentration gradient 4 1(b)(i) a line drawn to any of the 4 black rectangles shown in the cell wall of the cells three from the right and labelled with the letter C ; 1 1(b)(ii) provides, large / high, surface area or provides a, large / high, surface area : volume (ratio) ; 1 1(b)(iii) apoplastic / apoplast ; I cell wall route 1 Question Answer Marks 1(c) any three from: 1 cohesion / hydrogen bonding, between water molecules ; 2 detail about H bonding ; e.g. oxygen has, small / δ negative charge, hydrogen has small / δ positive charge water molecules are polar so attract each other 3 adhesion / hydrogen bonding, between water molecules and, cell wall / xylem wall / cellulose / hydrophilic regions of lignin ; 4 adhesion / AW), supports the column of water ; 5 transpiration / evaporation (from leaves), pulls the column or ref. to tension from, above / leaves or ref. to water potential gradient from roots to leaves ; 3
Q2 · A cell at one of the main stages of mitosis in the mitotic cell cycle
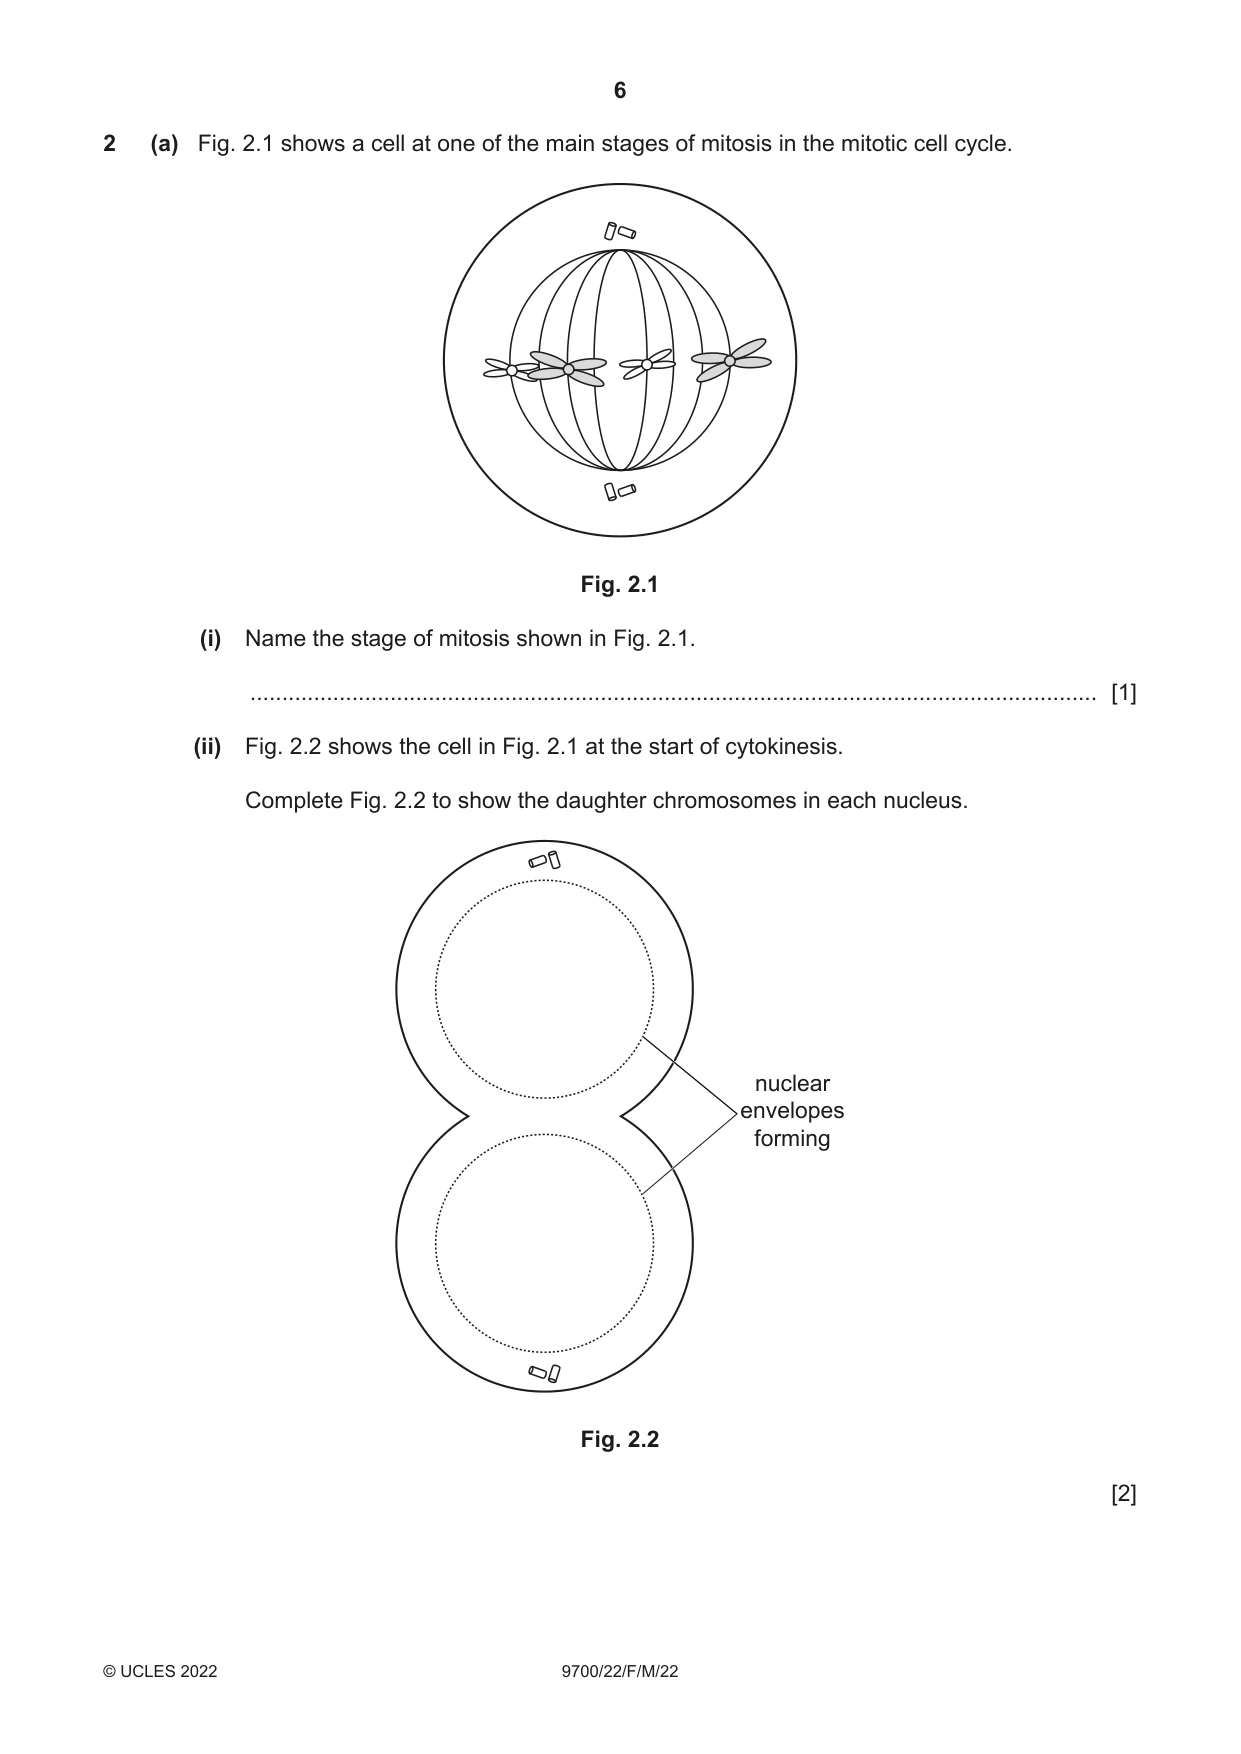
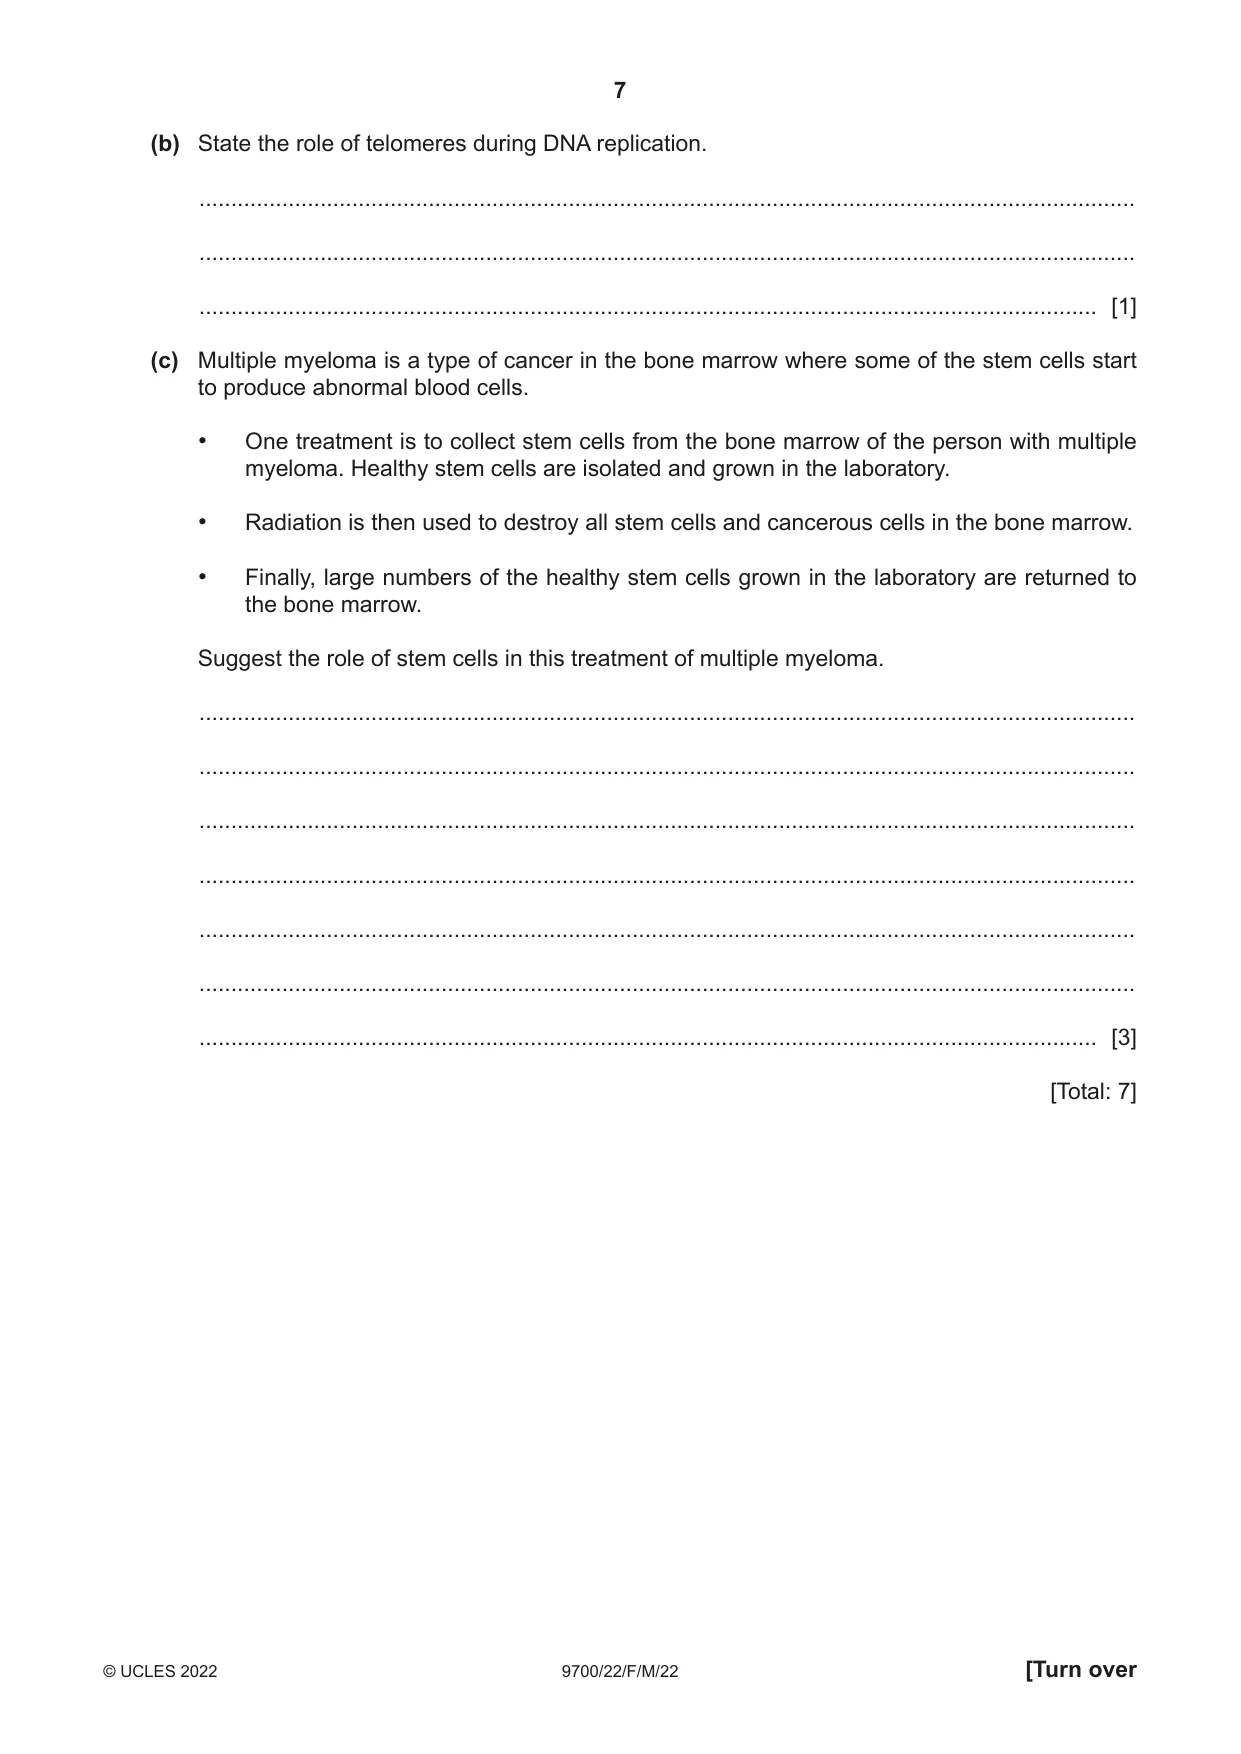
2 (a) Fig. 2.1 shows a cell at one of the main stages of mitosis in the mitotic cell cycle. Fig. 2.1 (i) Name the stage of mitosis shown in Fig. 2.1. ..................................................................................................................................... [1] (ii) Fig. 2.2 shows the cell in Fig. 2.1 at the start of cytokinesis. Complete Fig. 2.2 to show the daughter chromosomes in each nucleus. nuclear envelopes forming Fig. 2.2 [2] (b) State the role of telomeres during DNA replication. ................................................................................................................................................... ................................................................................................................................................... ............................................................................................................................................. [1] (c) Multiple myeloma is a type of cancer in the bone marrow where some of the stem cells start to produce abnormal blood cells. • One treatment is to collect stem cells from the bone marrow of the person with multiple myeloma. Healthy stem cells are isolated and grown in the laboratory. • Radiation is then used to destroy all stem cells and cancerous cells in the bone marrow. • Finally, large numbers of the healthy stem cells grown in the laboratory are returned to the bone marrow. Suggest the role of stem cells in this treatment of multiple myeloma. ................................................................................................................................................... ................................................................................................................................................... ................................................................................................................................................... ................................................................................................................................................... ................................................................................................................................................... ................................................................................................................................................... ............................................................................................................................................. [3] [Total: 7]
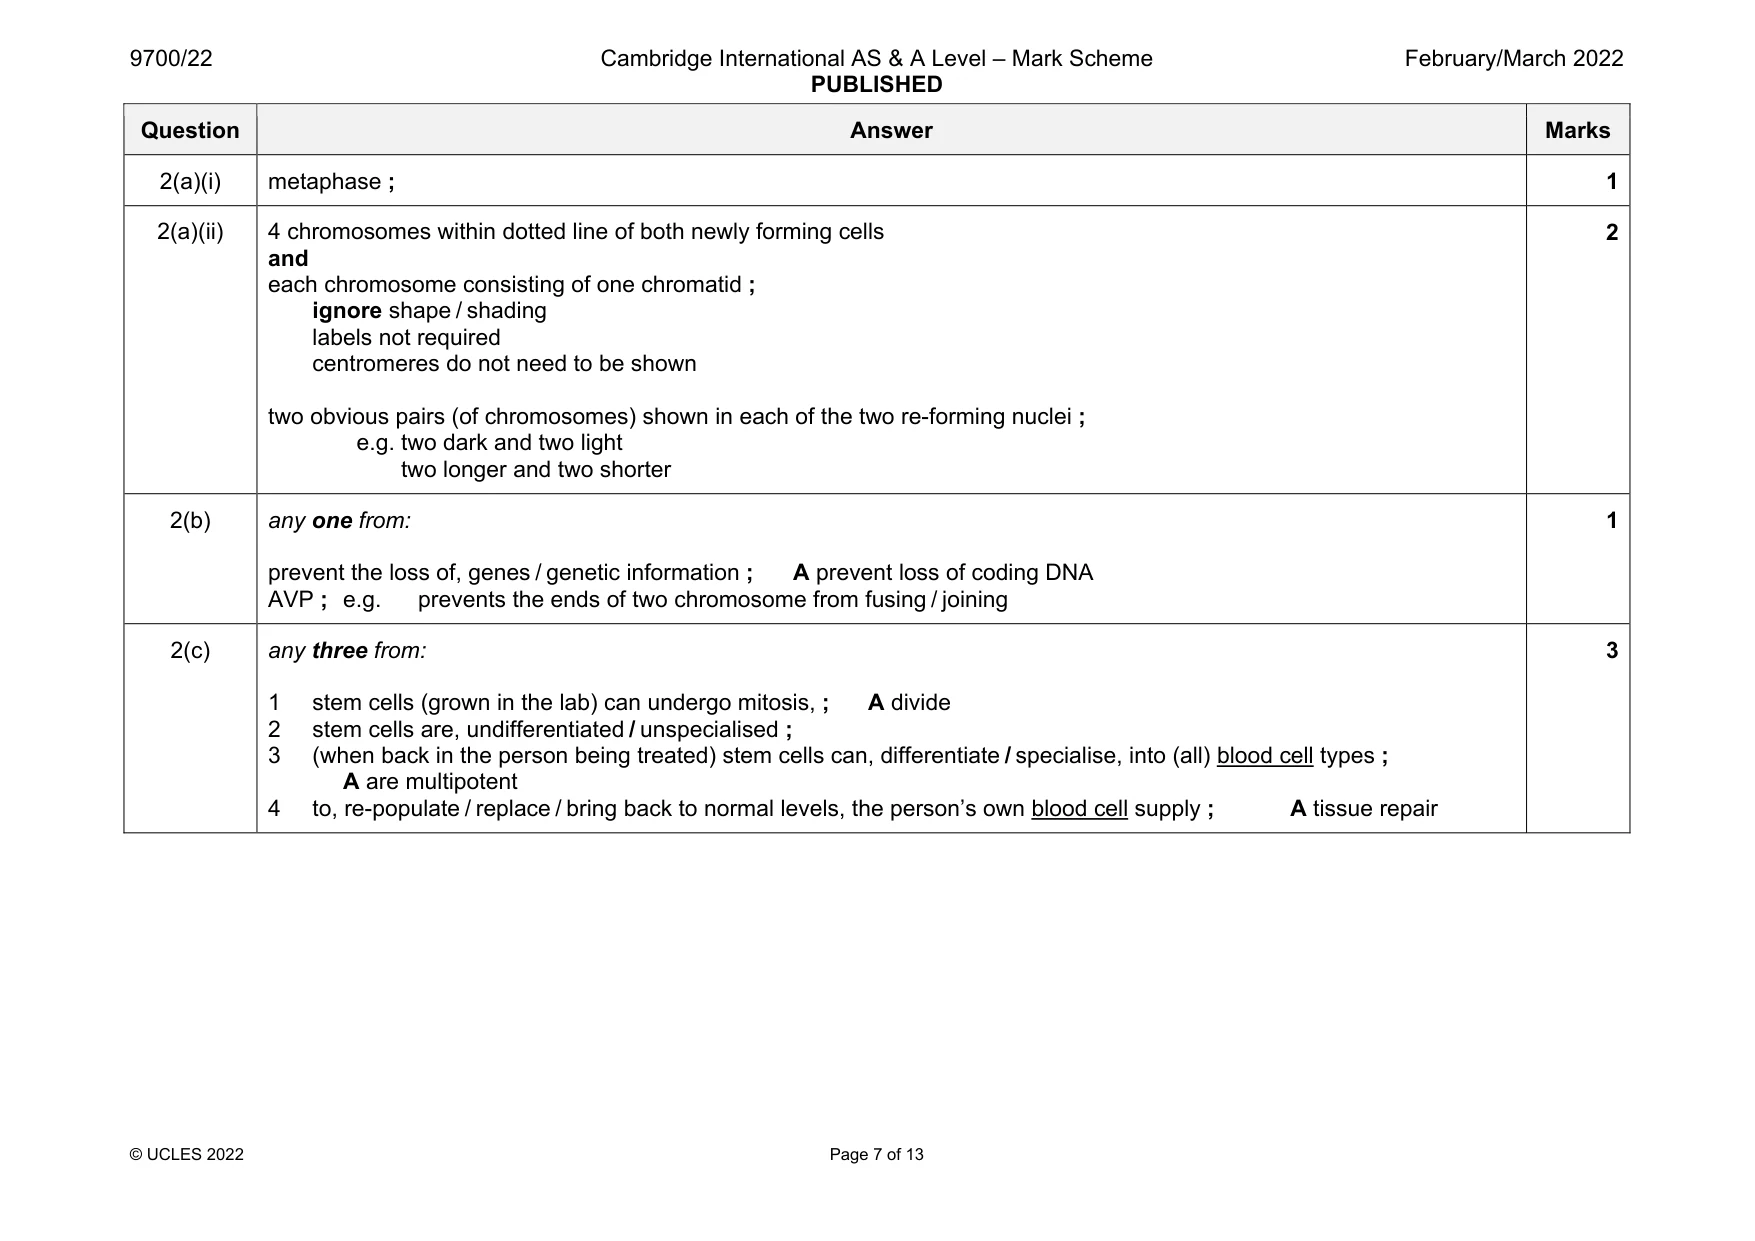
Mark scheme: 2(a)(i) metaphase ; 1 2(a)(ii) 4 chromosomes within dotted line of both newly forming cells and each chromosome consisting of one chromatid ; ignore shape / shading labels not required centromeres do not need to be shown two obvious pairs (of chromosomes) shown in each of the two re-forming nuclei ; e.g. two dark and two light two longer and two shorter 2 2(b) any one from: prevent the loss of, genes / genetic information ; A prevent loss of coding DNA AVP ; e.g. prevents the ends of two chromosome from fusing / joining 1 2(c) any three from: 1 stem cells (grown in the lab) can undergo mitosis, ; A divide 2 stem cells are, undifferentiated / unspecialised ; 3 (when back in the person being treated) stem cells can, differentiate / specialise, into (all) blood cell types ; A are multipotent 4 to, re-populate / replace / bring back to normal levels, the person’s own blood cell supply ; A tissue repair 3
Q3 · Enzymes are polymers of amino acids
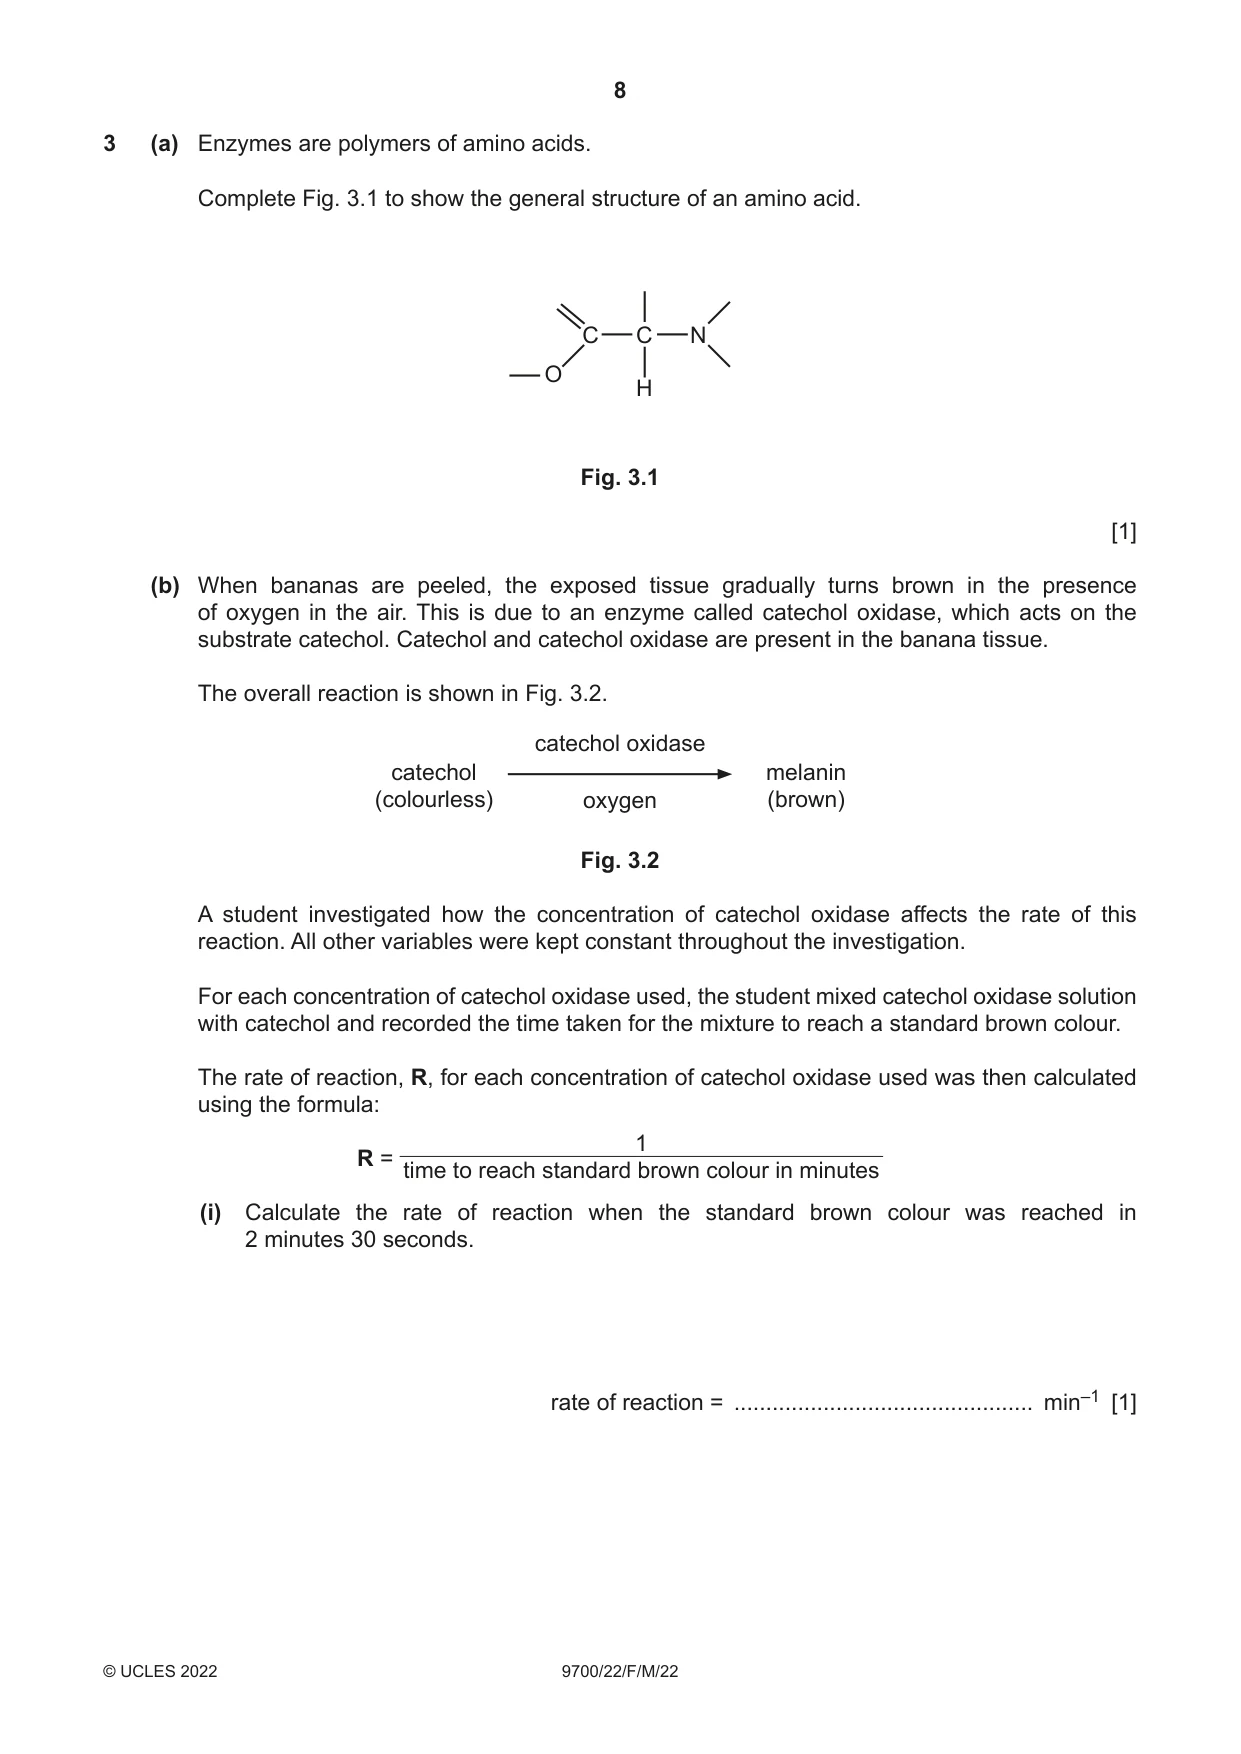
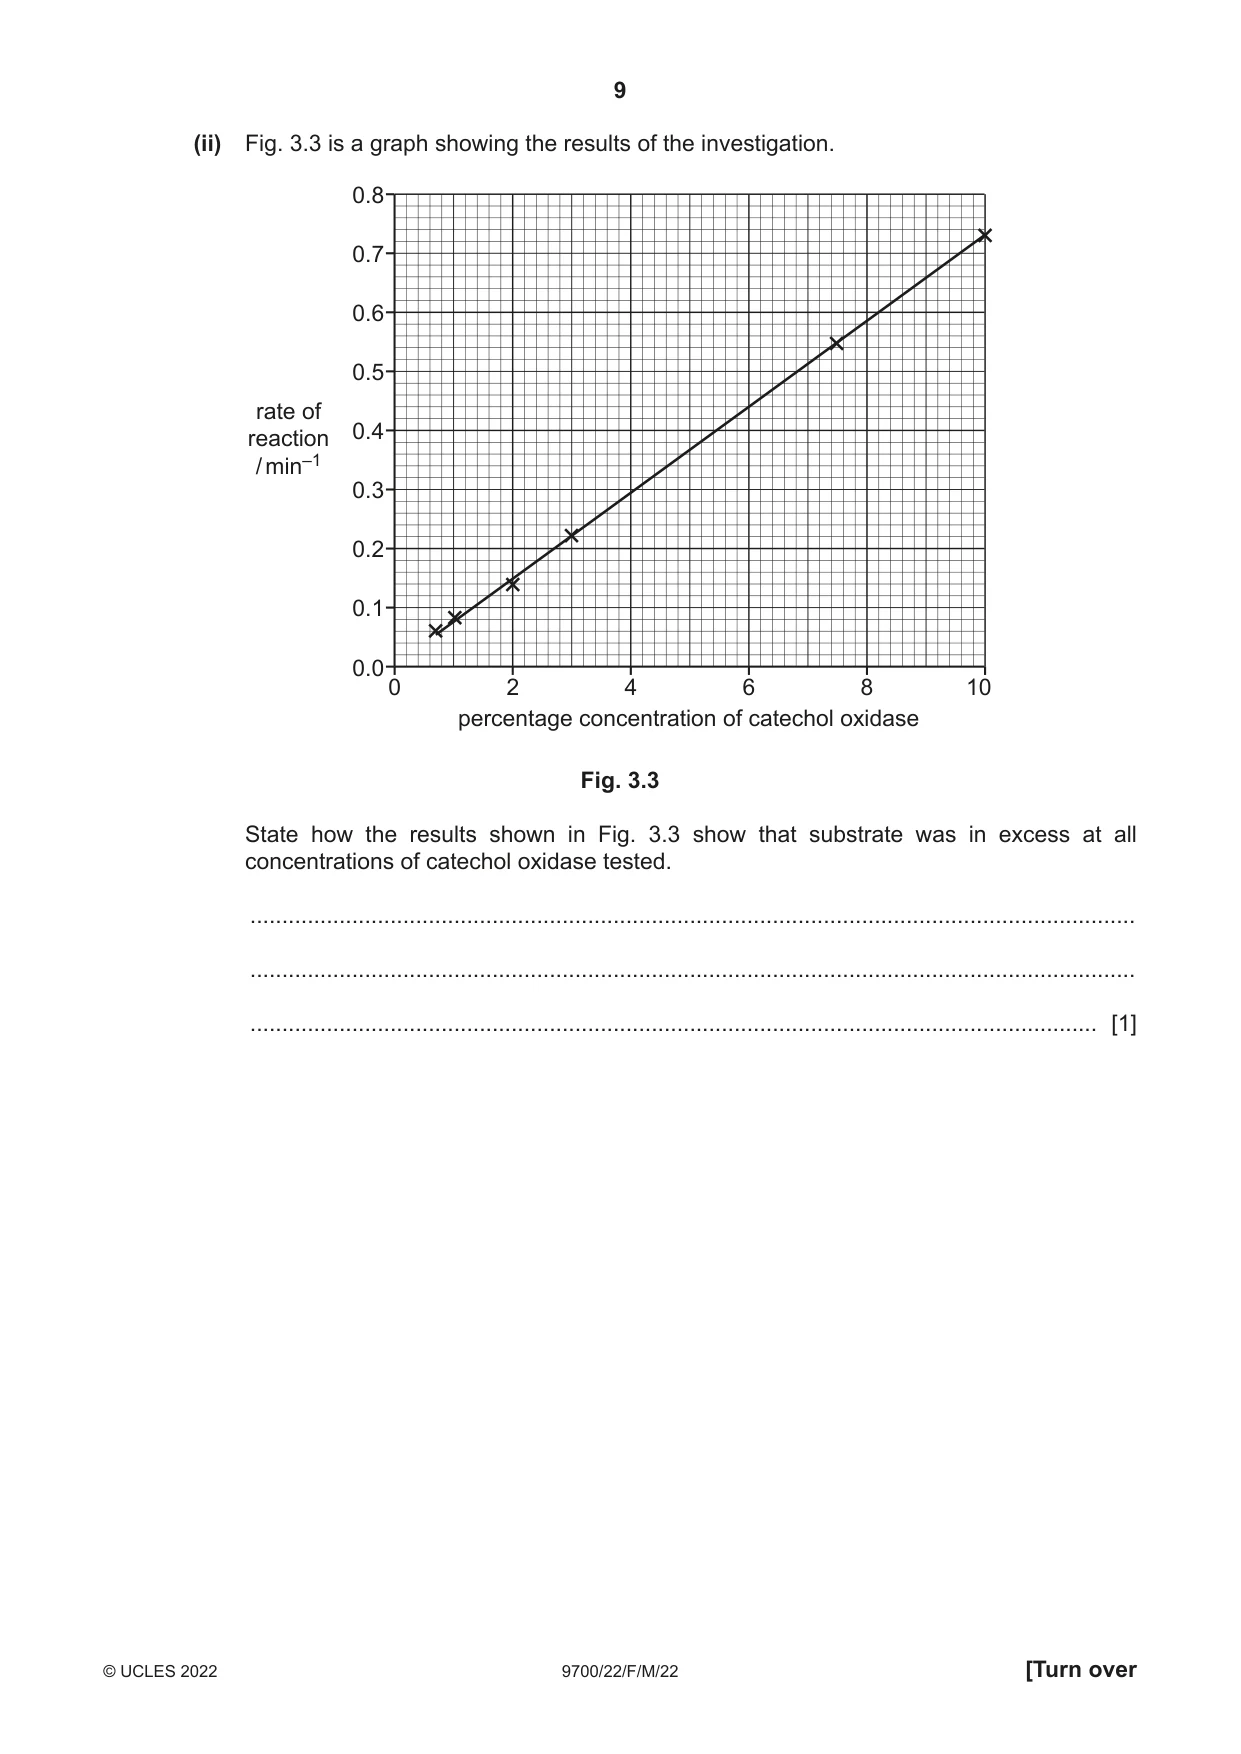
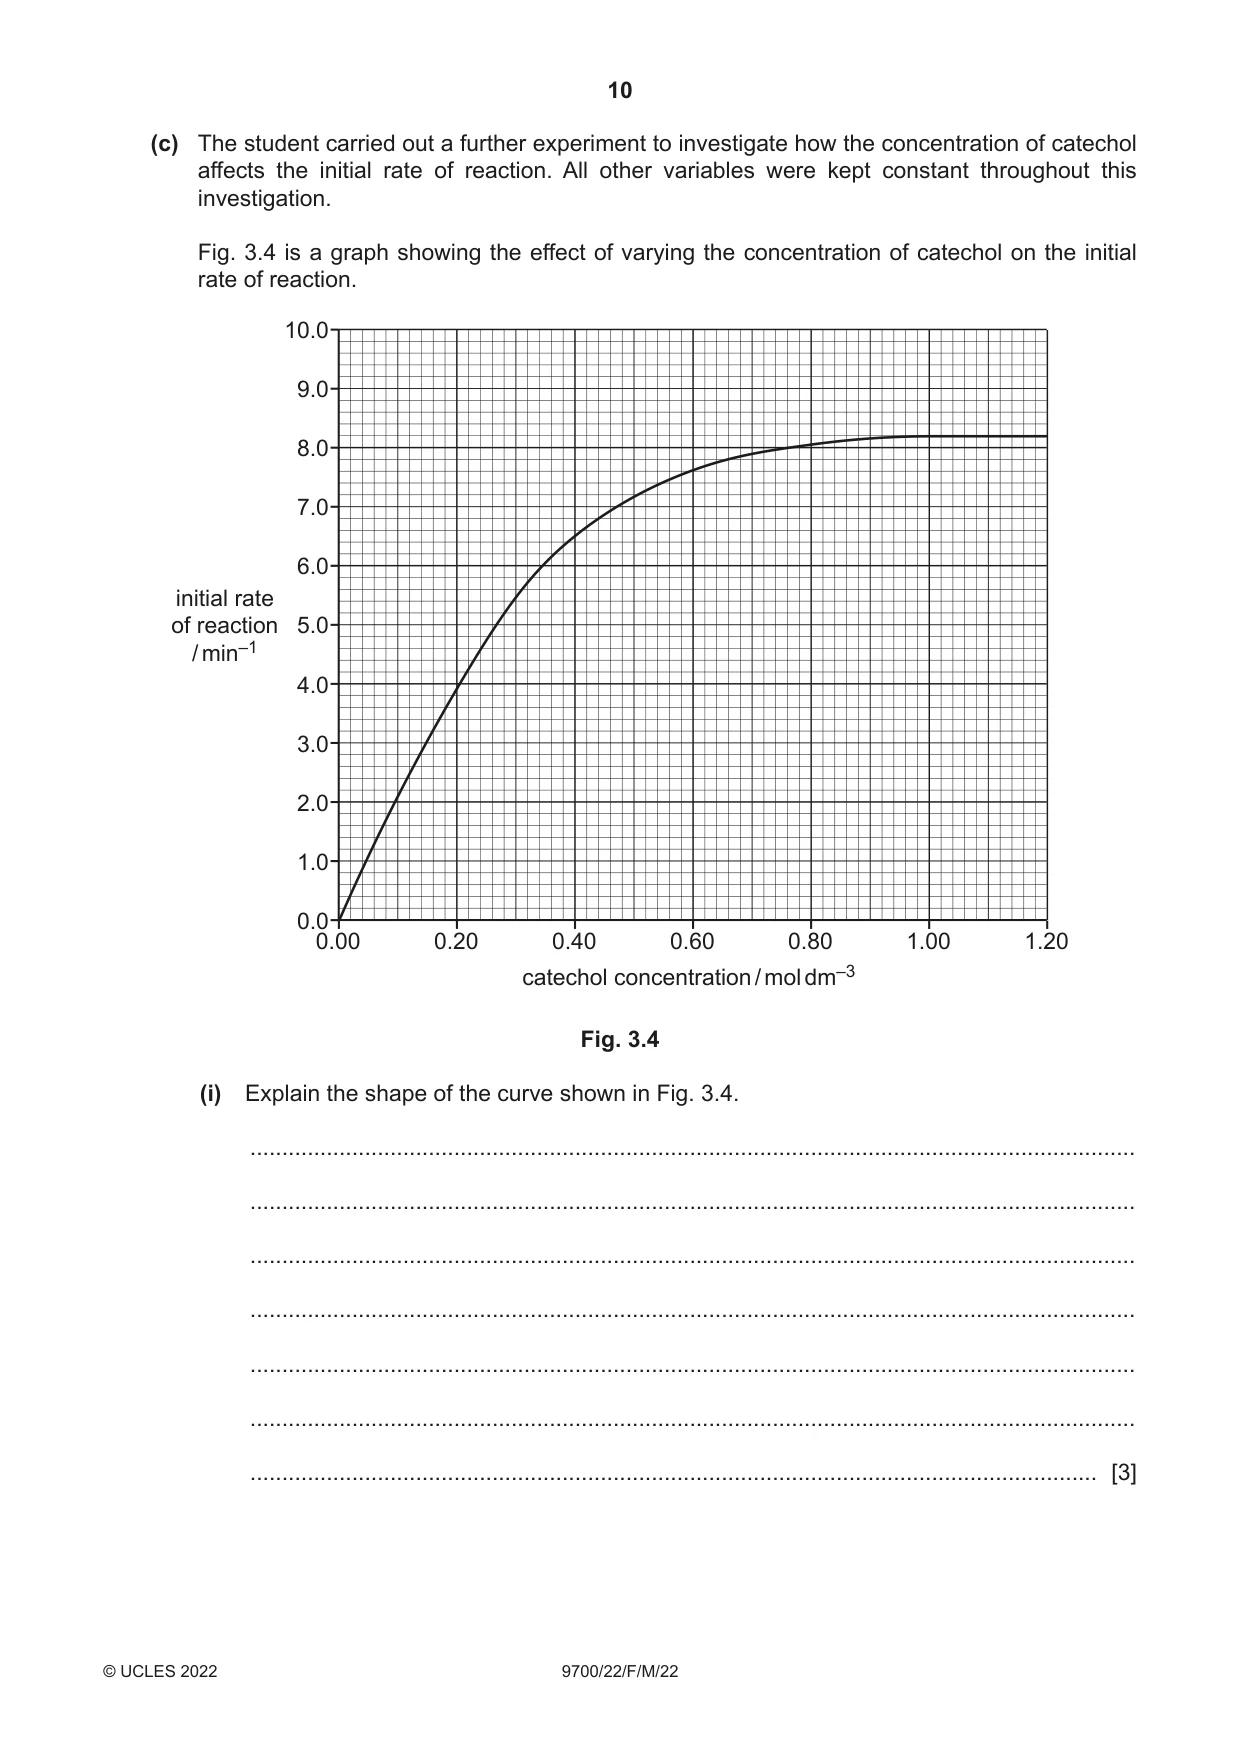
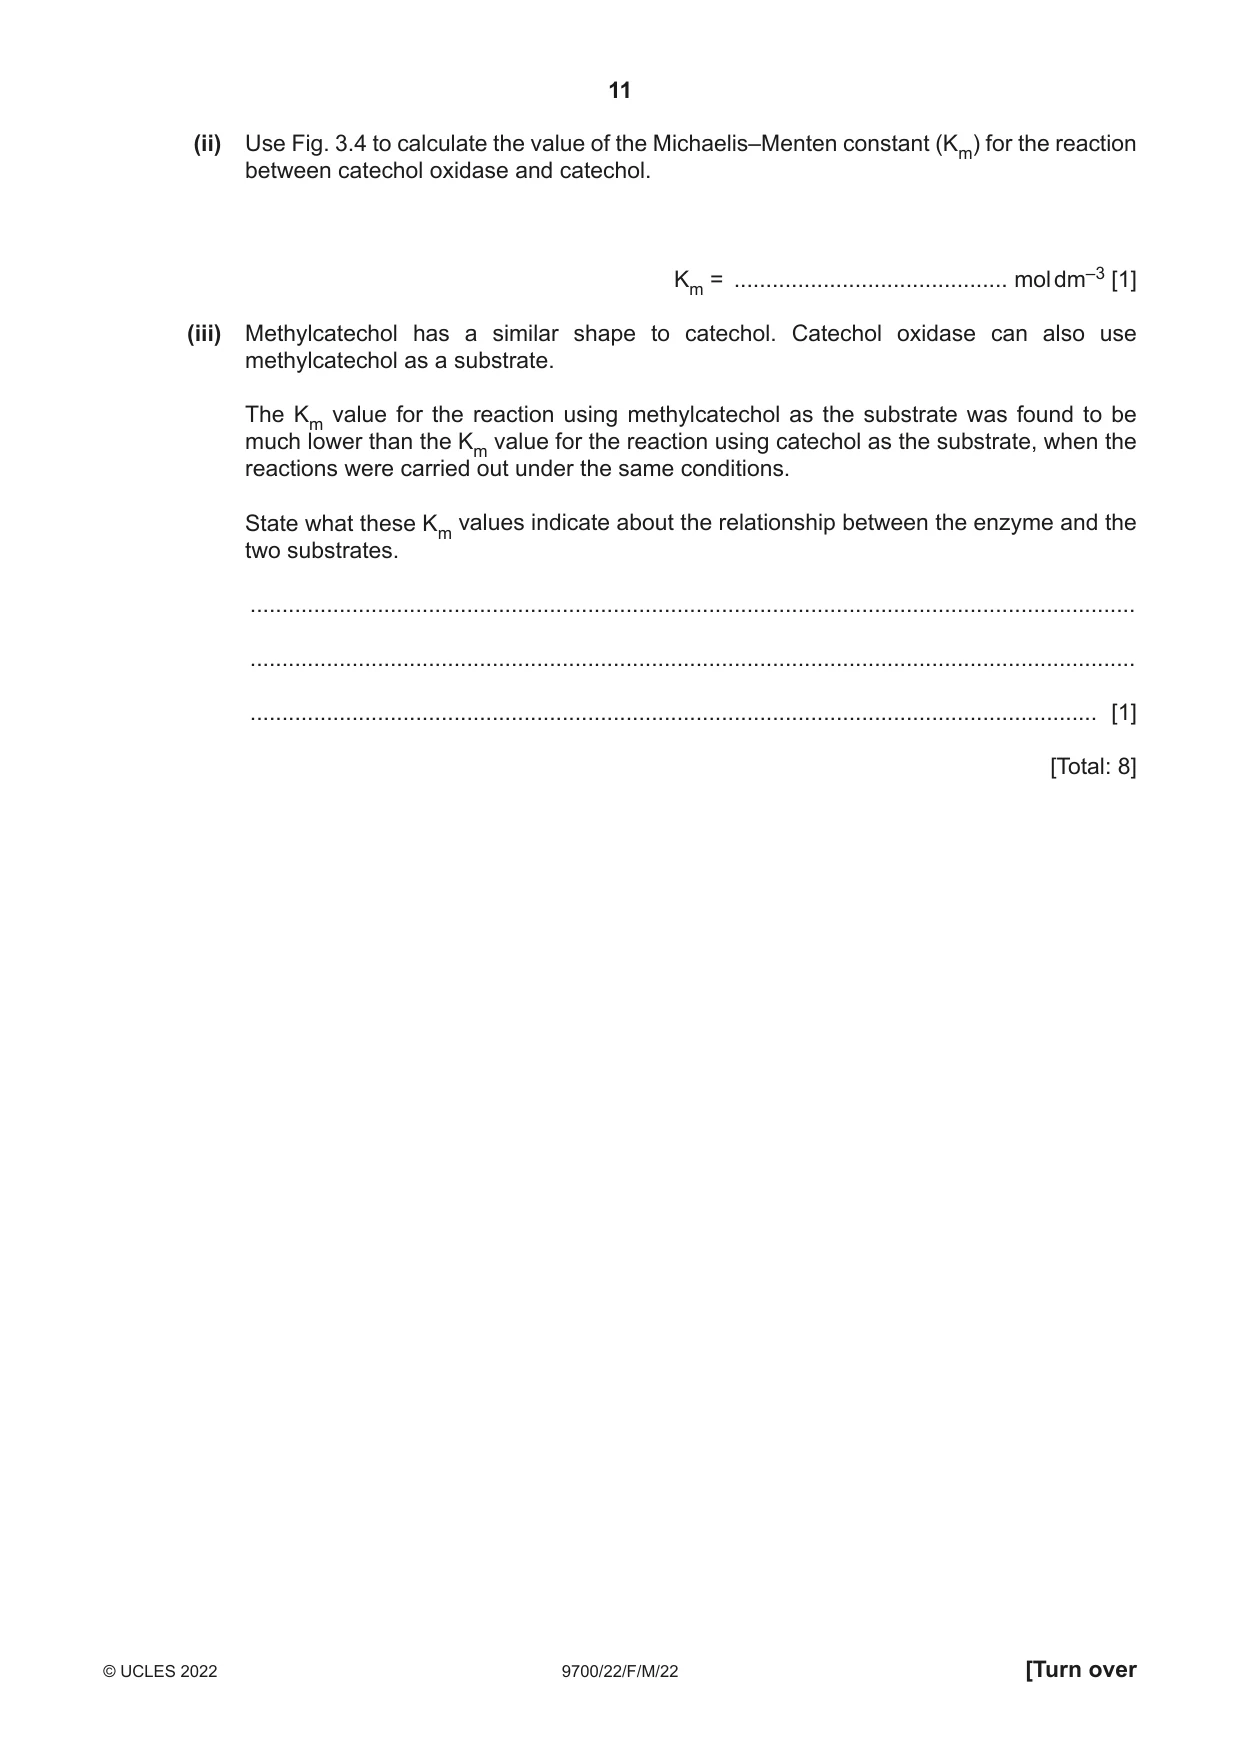
3 (a) Enzymes are polymers of amino acids. Complete Fig. 3.1 to show the general structure of an amino acid. C C N O H Fig. 3.1 [1] (b) When bananas are peeled, the exposed tissue gradually turns brown in the presence of oxygen in the air. This is due to an enzyme called catechol oxidase, which acts on the substrate catechol. Catechol and catechol oxidase are present in the banana tissue. The overall reaction is shown in Fig. 3.2. catechol oxidase catechol melanin (colourless) oxygen (brown) Fig. 3.2 A student investigated how the concentration of catechol oxidase affects the rate of this reaction. All other variables were kept constant throughout the investigation. For each concentration of catechol oxidase used, the student mixed catechol oxidase solution with catechol and recorded the time taken for the mixture to reach a standard brown colour. The rate of reaction, R, for each concentration of catechol oxidase used was then calculated using the formula: 1 R = time to reach standard brown colour in minutes (i) Calculate the rate of reaction when the standard brown colour was reached in 2 minutes 30 seconds. rate of reaction = ............................................... min–1 [1] (ii) Fig. 3.3 is a graph showing the results of the investigation. 0.8 0.7 0.6 0.5 rate of 0.4 reaction / min–1 0.3 0.2 0.1 0.0 0 2 4 6 8 10 percentage concentration of catechol oxidase Fig. 3.3 State how the results shown in Fig. 3.3 show that substrate was in excess at all concentrations of catechol oxidase tested. ........................................................................................................................................... ........................................................................................................................................... ..................................................................................................................................... [1] (c) The student carried out a further experiment to investigate how the concentration of catechol affects the initial rate of reaction. All other variables were kept constant throughout this investigation. Fig. 3.4 is a graph showing the effect of varying the concentration of catechol on the initial rate of reaction. 10.0 9.0 8.0 7.0 6.0 initial rate of reaction 5.0 / min–1 4.0 3.0 2.0 1.0 0.0 0.00 0.20 0.40 0.60 0.80 1.00 1.20 catechol concentration / mol dm–3 Fig. 3.4 (i) Explain the shape of the curve shown in Fig. 3.4. ........................................................................................................................................... ........................................................................................................................................... ........................................................................................................................................... ........................................................................................................................................... ........................................................................................................................................... ........................................................................................................................................... ..................................................................................................................................... [3] (ii) Use Fig. 3.4 to calculate the value of the Michaelis–Menten constant (Km) for the reaction between catechol oxidase and catechol. Km = ........................................... mol dm–3 [1] (iii) Methylcatechol has a similar shape to catechol. Catechol oxidase can also use methylcatechol as a substrate. The Km value for the reaction using methylcatechol as the substrate was found to be much lower than the Km value for the reaction using catechol as the substrate, when the reactions were carried out under the same conditions. State what these Km values indicate about the relationship between the enzyme and the two substrates. ........................................................................................................................................... ........................................................................................................................................... ..................................................................................................................................... [1] [Total: 8]
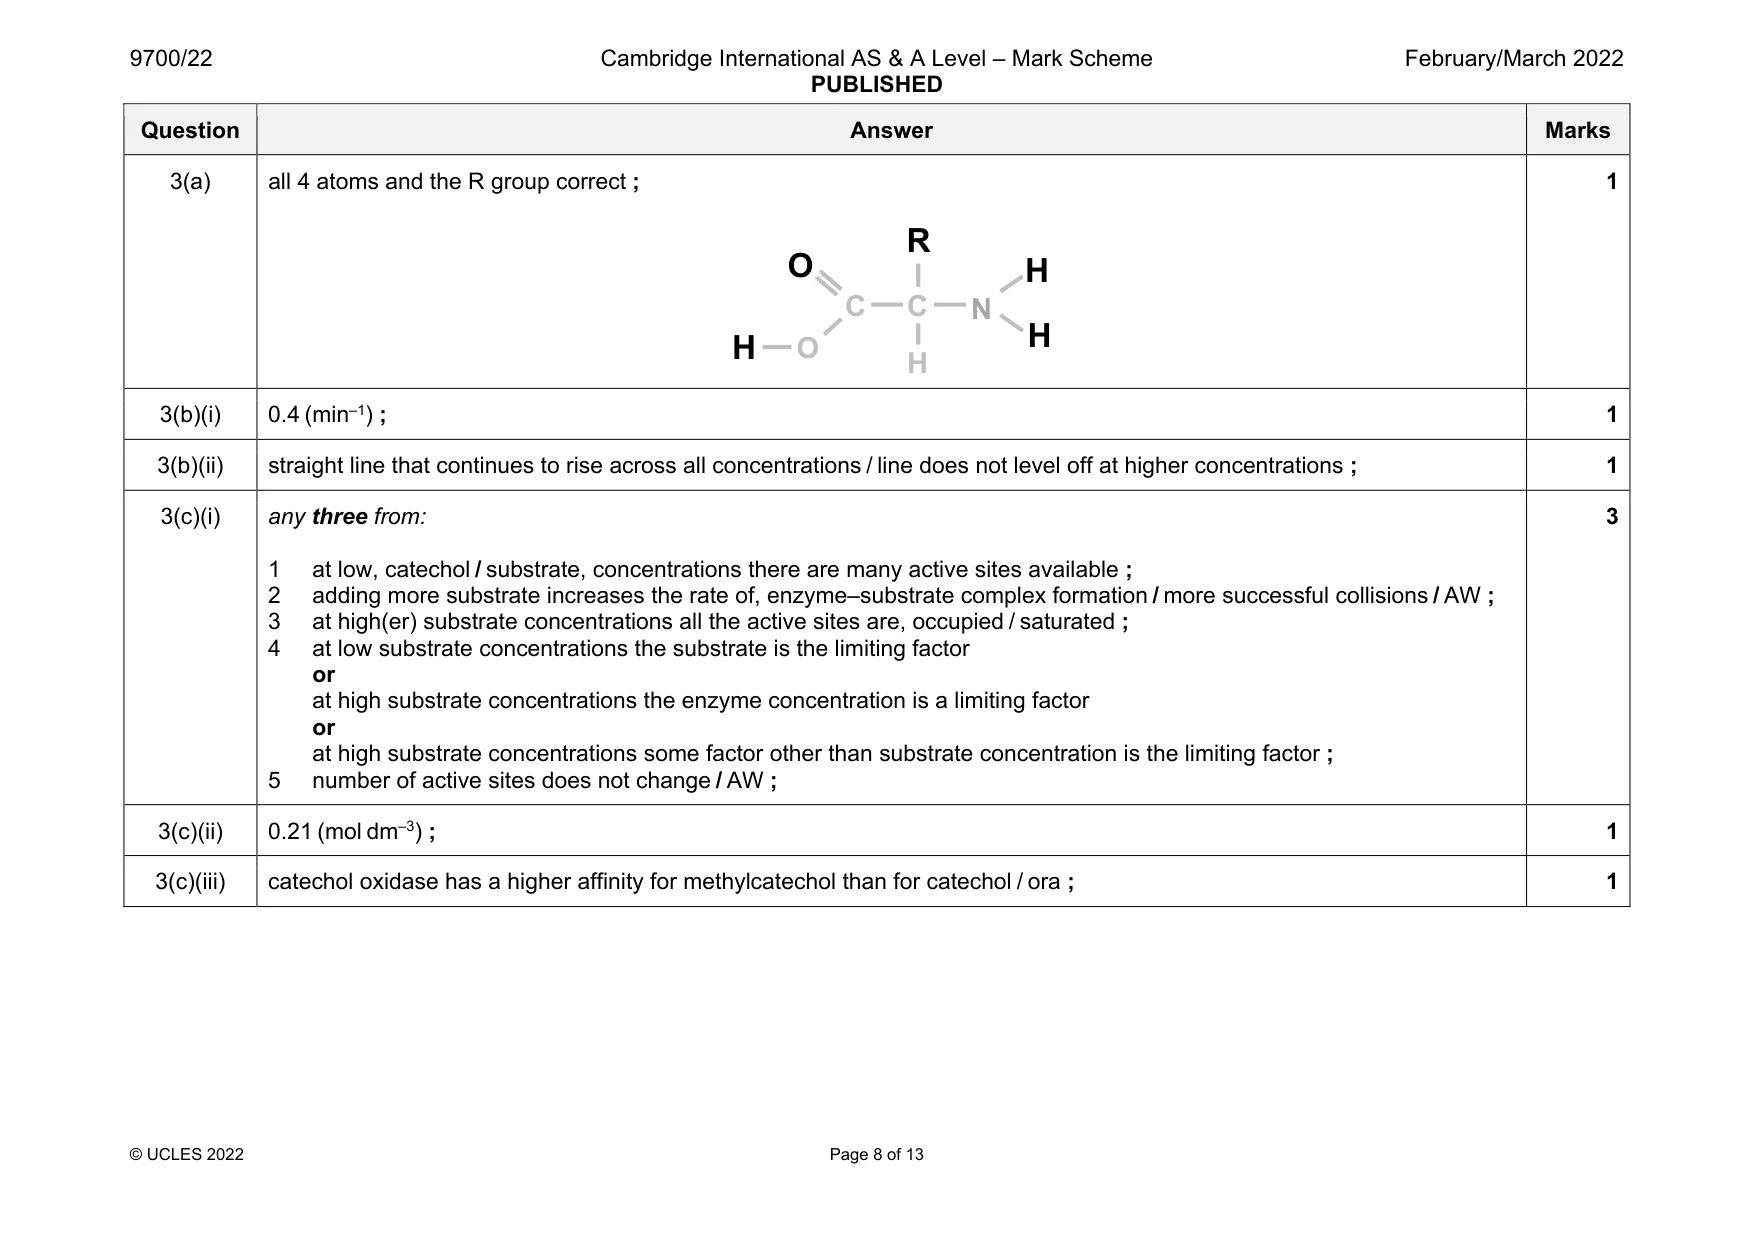
Mark scheme: 3(a) all 4 atoms and the R group correct ; 1 3(b)(i) 0.4 (min–1) ; 1 3(b)(ii) straight line that continues to rise across all concentrations / line does not level off at higher concentrations ; 1 3(c)(i) any three from: 1 at low, catechol / substrate, concentrations there are many active sites available ; 2 adding more substrate increases the rate of, enzyme–substrate complex formation / more successful collisions / AW ; 3 at high(er) substrate concentrations all the active sites are, occupied / saturated ; 4 at low substrate concentrations the substrate is the limiting factor or at high substrate concentrations the enzyme concentration is a limiting factor or at high substrate concentrations some factor other than substrate concentration is the limiting factor ; 5 number of active sites does not change / AW ; 3 3(c)(ii) 0.21 (mol dm–3) ; 1 3(c)(iii) catechol oxidase has a higher affinity for methylcatechol than for catechol / ora ; 1 N C C H O O R H H H
Q4 · Tuberculosis (TB) is a major cause of ill health worldwide
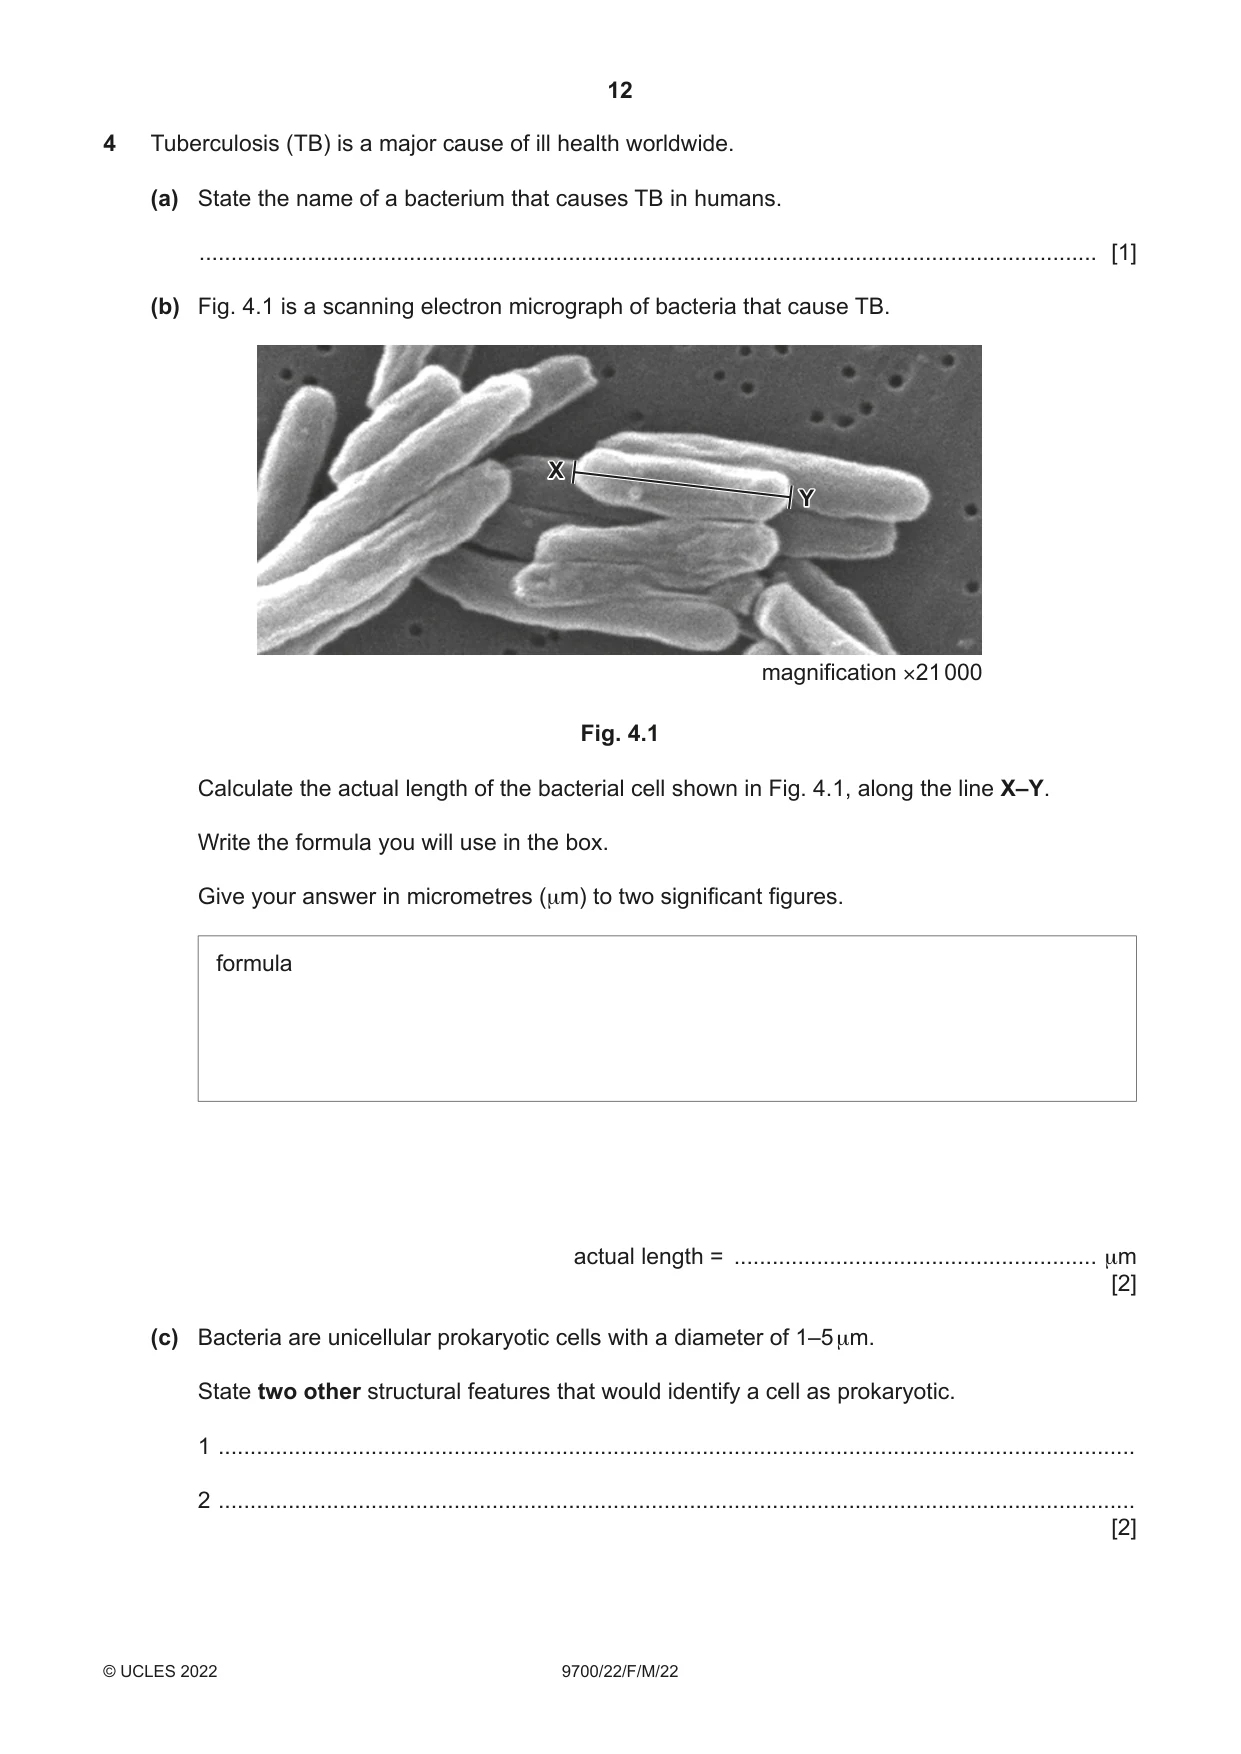
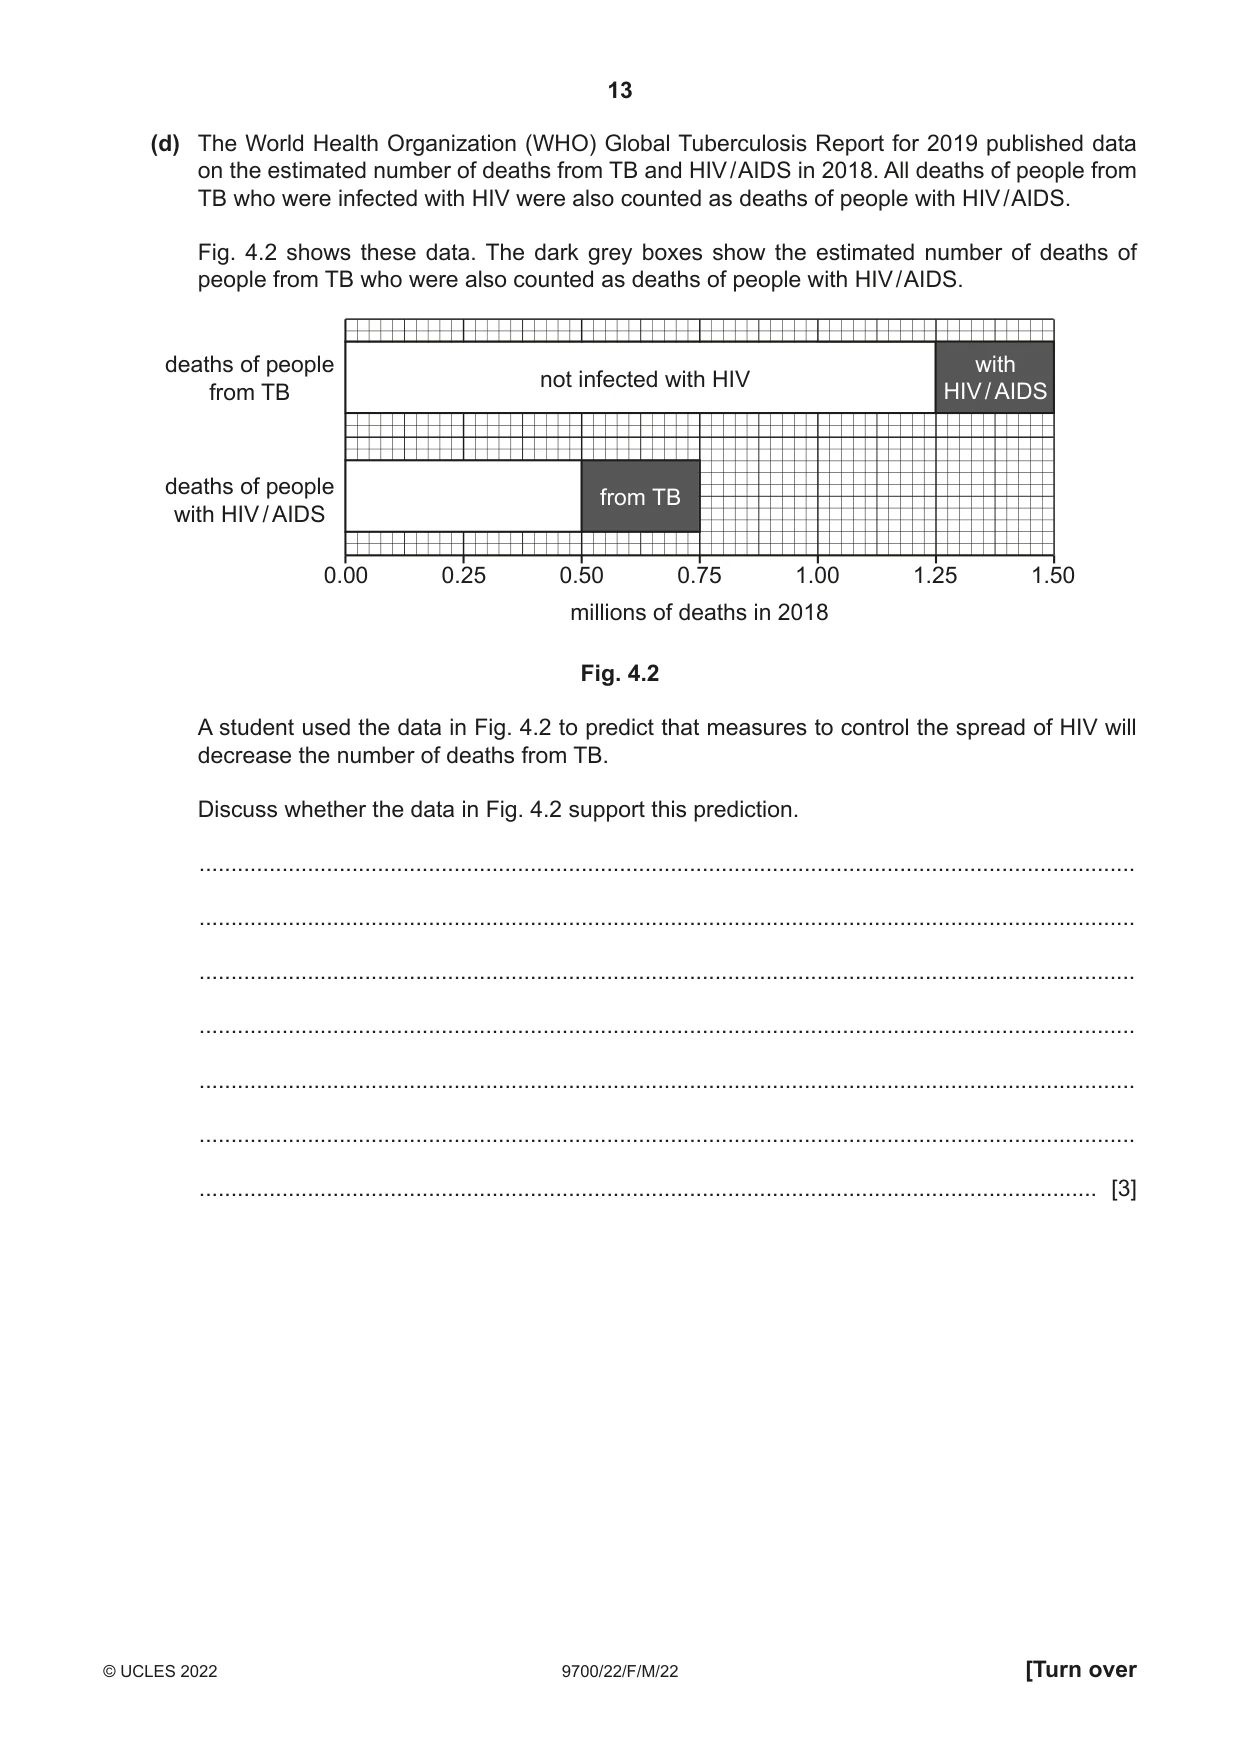
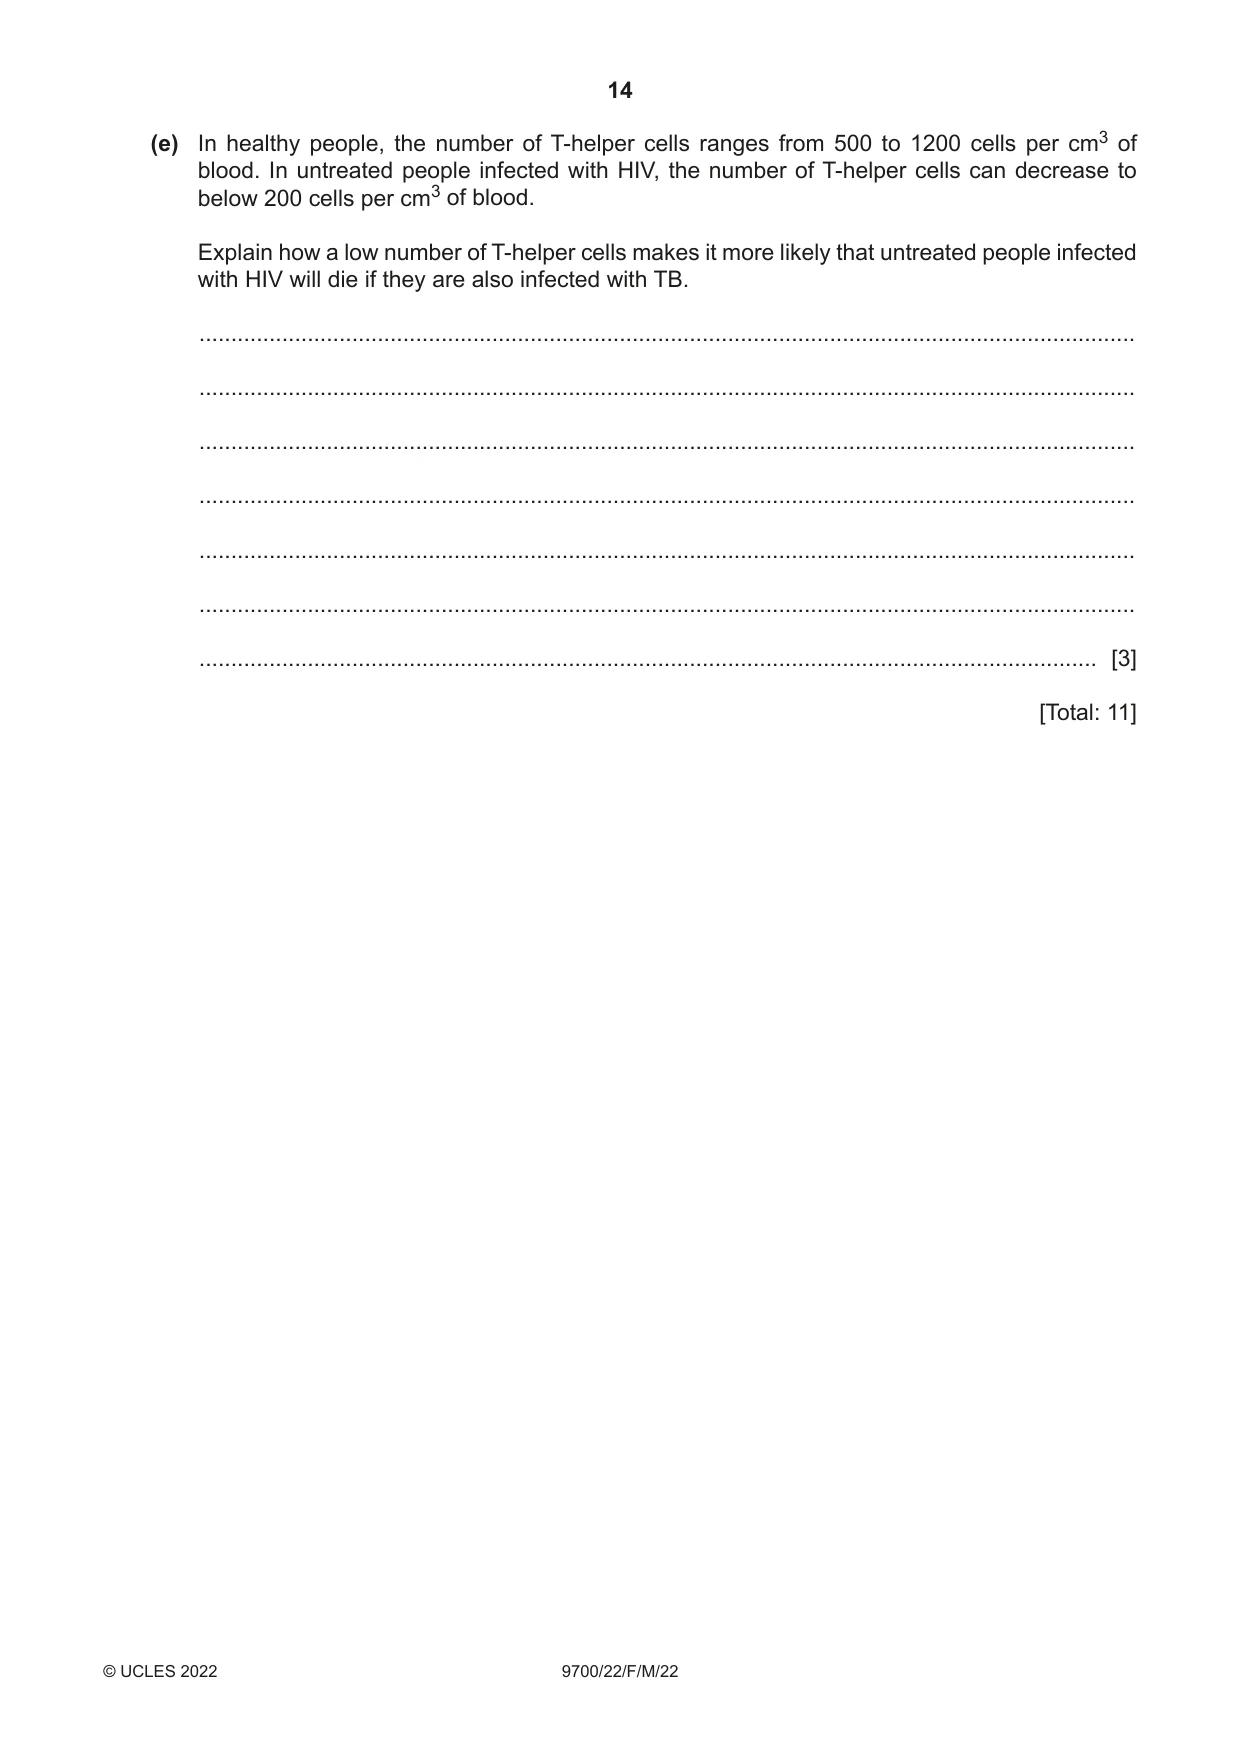
4 Tuberculosis (TB) is a major cause of ill health worldwide. (a) State the name of a bacterium that causes TB in humans. ............................................................................................................................................. [1] (b) Fig. 4.1 is a scanning electron micrograph of bacteria that cause TB. XX YY magnification ×21 000 Fig. 4.1 Calculate the actual length of the bacterial cell shown in Fig. 4.1, along the line X–Y. Write the formula you will use in the box. Give your answer in micrometres (μm) to two significant figures. formula actual length = ......................................................... μm [2] (c) Bacteria are unicellular prokaryotic cells with a diameter of 1–5 μm. State two other structural features that would identify a cell as prokaryotic. 1 ................................................................................................................................................ 2 ................................................................................................................................................ [2] (d) The World Health Organization (WHO) Global Tuberculosis Report for 2019 published data on the estimated number of deaths from TB and HIV / AIDS in 2018. All deaths of people from TB who were infected with HIV were also counted as deaths of people with HIV / AIDS. Fig. 4.2 shows these data. The dark grey boxes show the estimated number of deaths of people from TB who were also counted as deaths of people with HIV / AIDS. deaths of people with not infected with HIV from TB HIV / AIDS deaths of people from TB with HIV / AIDS 0.00 0.25 0.50 0.75 1.00 1.25 1.50 millions of deaths in 2018 Fig. 4.2 A student used the data in Fig. 4.2 to predict that measures to control the spread of HIV will decrease the number of deaths from TB. Discuss whether the data in Fig. 4.2 support this prediction. ................................................................................................................................................... ................................................................................................................................................... ................................................................................................................................................... ................................................................................................................................................... ................................................................................................................................................... ................................................................................................................................................... ............................................................................................................................................. [3] (e) In healthy people, the number of T-helper cells ranges from 500 to 1200 cells per cm3 of blood. In untreated people infected with HIV, the number of T-helper cells can decrease to below 200 cells per cm3 of blood. Explain how a low number of T-helper cells makes it more likely that untreated people infected with HIV will die if they are also infected with TB. ................................................................................................................................................... ................................................................................................................................................... ................................................................................................................................................... ................................................................................................................................................... ................................................................................................................................................... ................................................................................................................................................... ............................................................................................................................................. [3] [Total: 11]
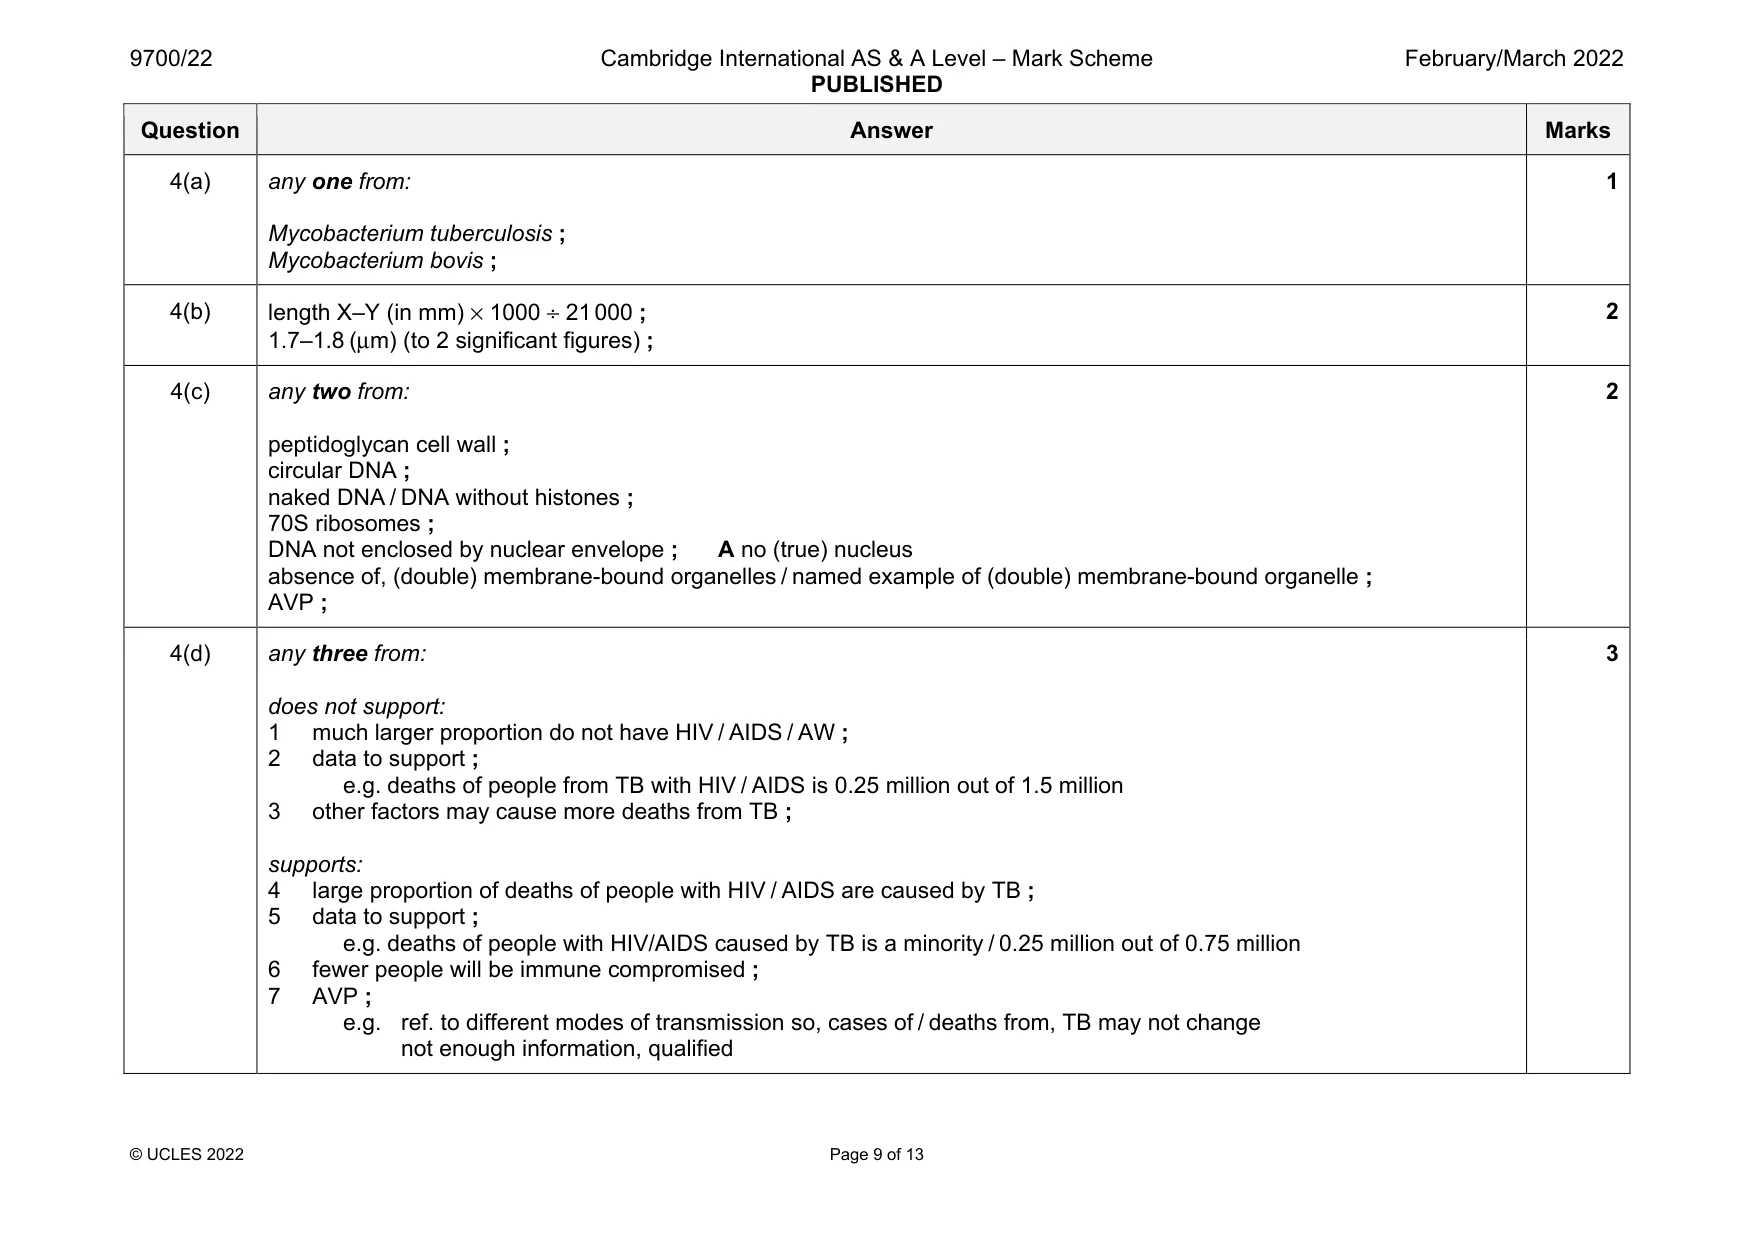
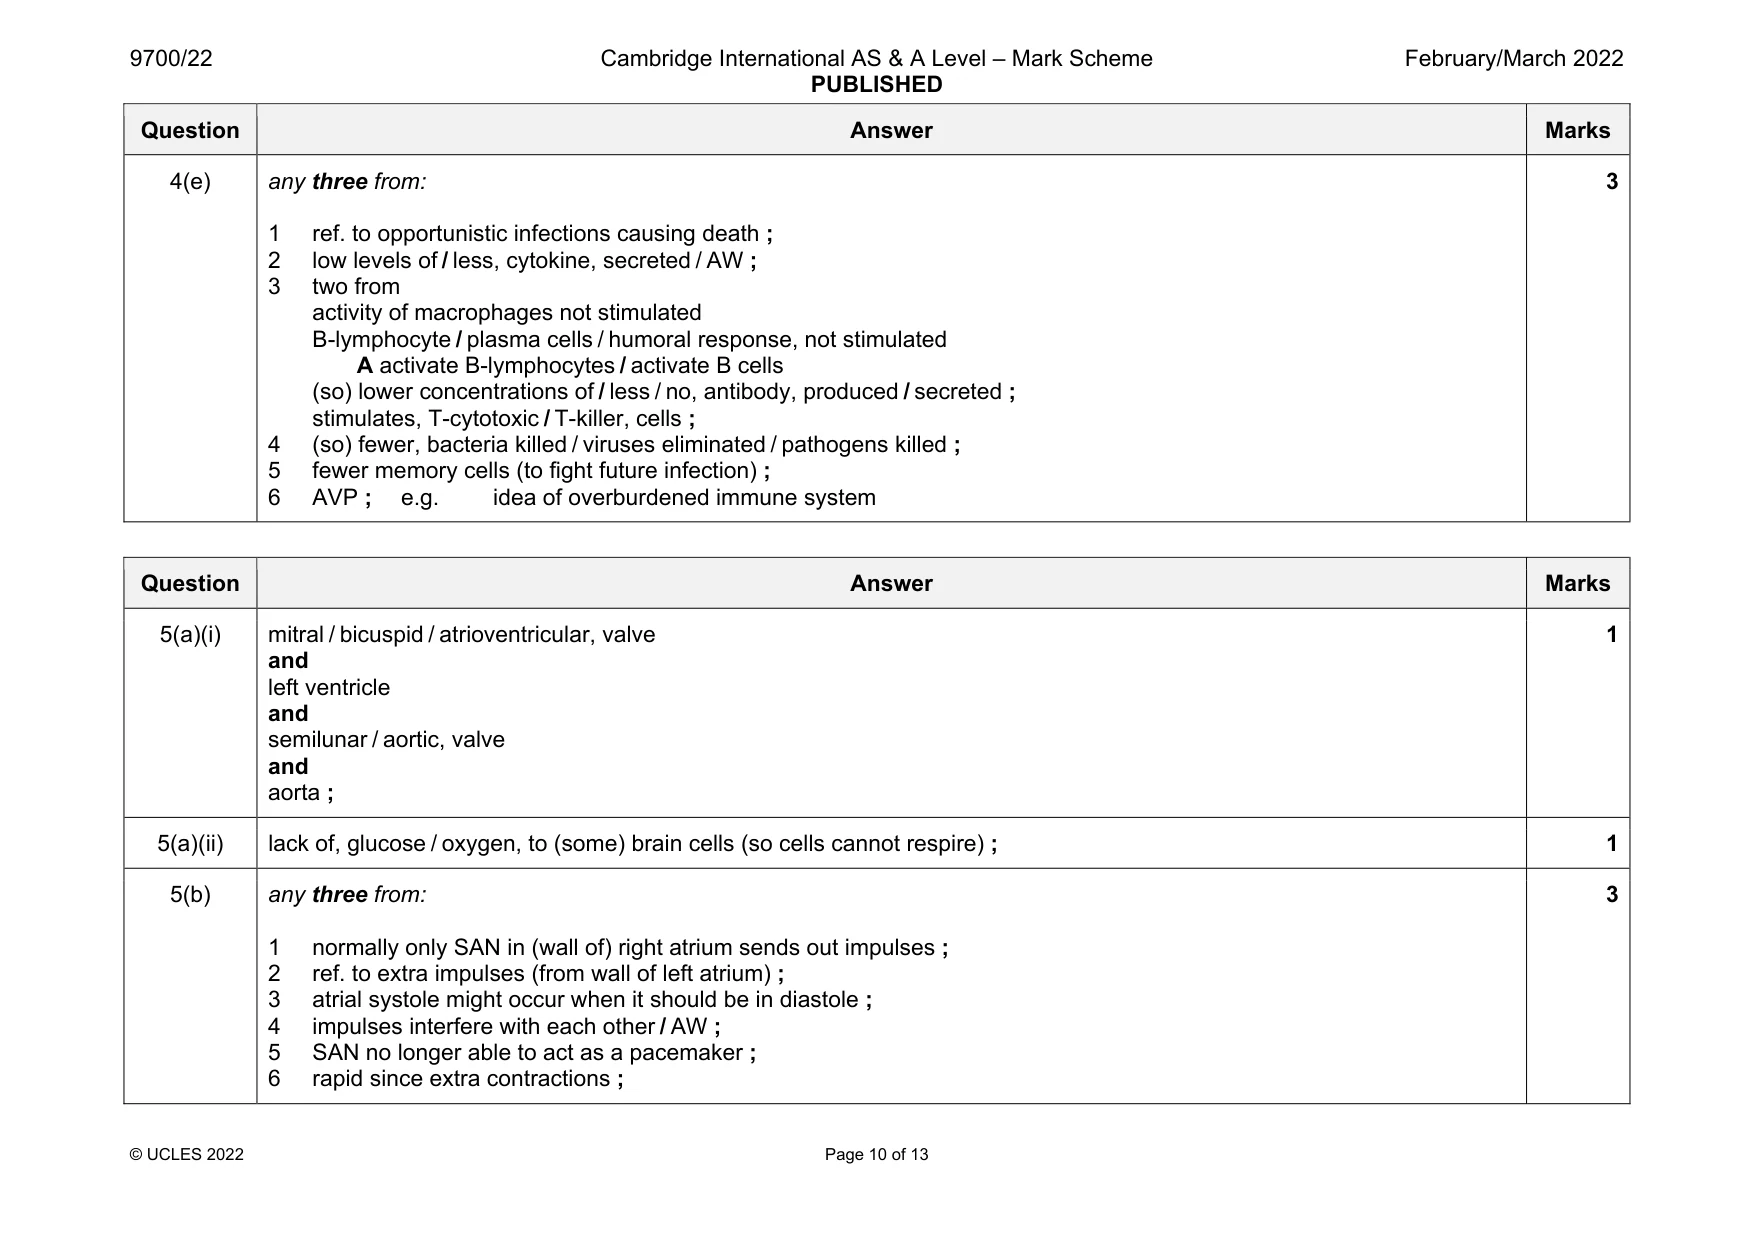
Mark scheme: 4(a) any one from: Mycobacterium tuberculosis ; Mycobacterium bovis ; 1 4(b) length X–Y (in mm) × 1000 ÷ 21 000 ; 1.7–1.8 (μm) (to 2 significant figures) ; 2 4(c) any two from: peptidoglycan cell wall ; circular DNA ; naked DNA / DNA without histones ; 70S ribosomes ; DNA not enclosed by nuclear envelope ; A no (true) nucleus absence of, (double) membrane-bound organelles / named example of (double) membrane-bound organelle ; AVP ; 2 4(d) any three from: does not support: 1 much larger proportion do not have HIV / AIDS / AW ; 2 data to support ; e.g. deaths of people from TB with HIV / AIDS is 0.25 million out of 1.5 million 3 other factors may cause more deaths from TB ; supports: 4 large proportion of deaths of people with HIV / AIDS are caused by TB ; 5 data to support ; e.g. deaths of people with HIV/AIDS caused by TB is a minority / 0.25 million out of 0.75 million 6 fewer people will be immune compromised ; 7 AVP ; e.g. ref. to different modes of transmission so, cases of / deaths from, TB may not change not enough information, qualified 3 Question Answer Marks 4(e) any three from: 1 ref. to opportunistic infections causing death ; 2 low levels of / less, cytokine, secreted / AW ; 3 two from activity of macrophages not stimulated B-lymphocyte / plasma cells / humoral response, not stimulated A activate B-lymphocytes / activate B cells (so) lower concentrations of / less / no, antibody, produced / secreted ; stimulates, T-cytotoxic / T-killer, cells ; 4 (so) fewer, bacteria killed / viruses eliminated / pathogens killed ; 5 fewer memory cells (to fight future infection) ; 6 AVP ; e.g. idea of overburdened immune system 3
Q5 · Control of heartbeat is myogenic
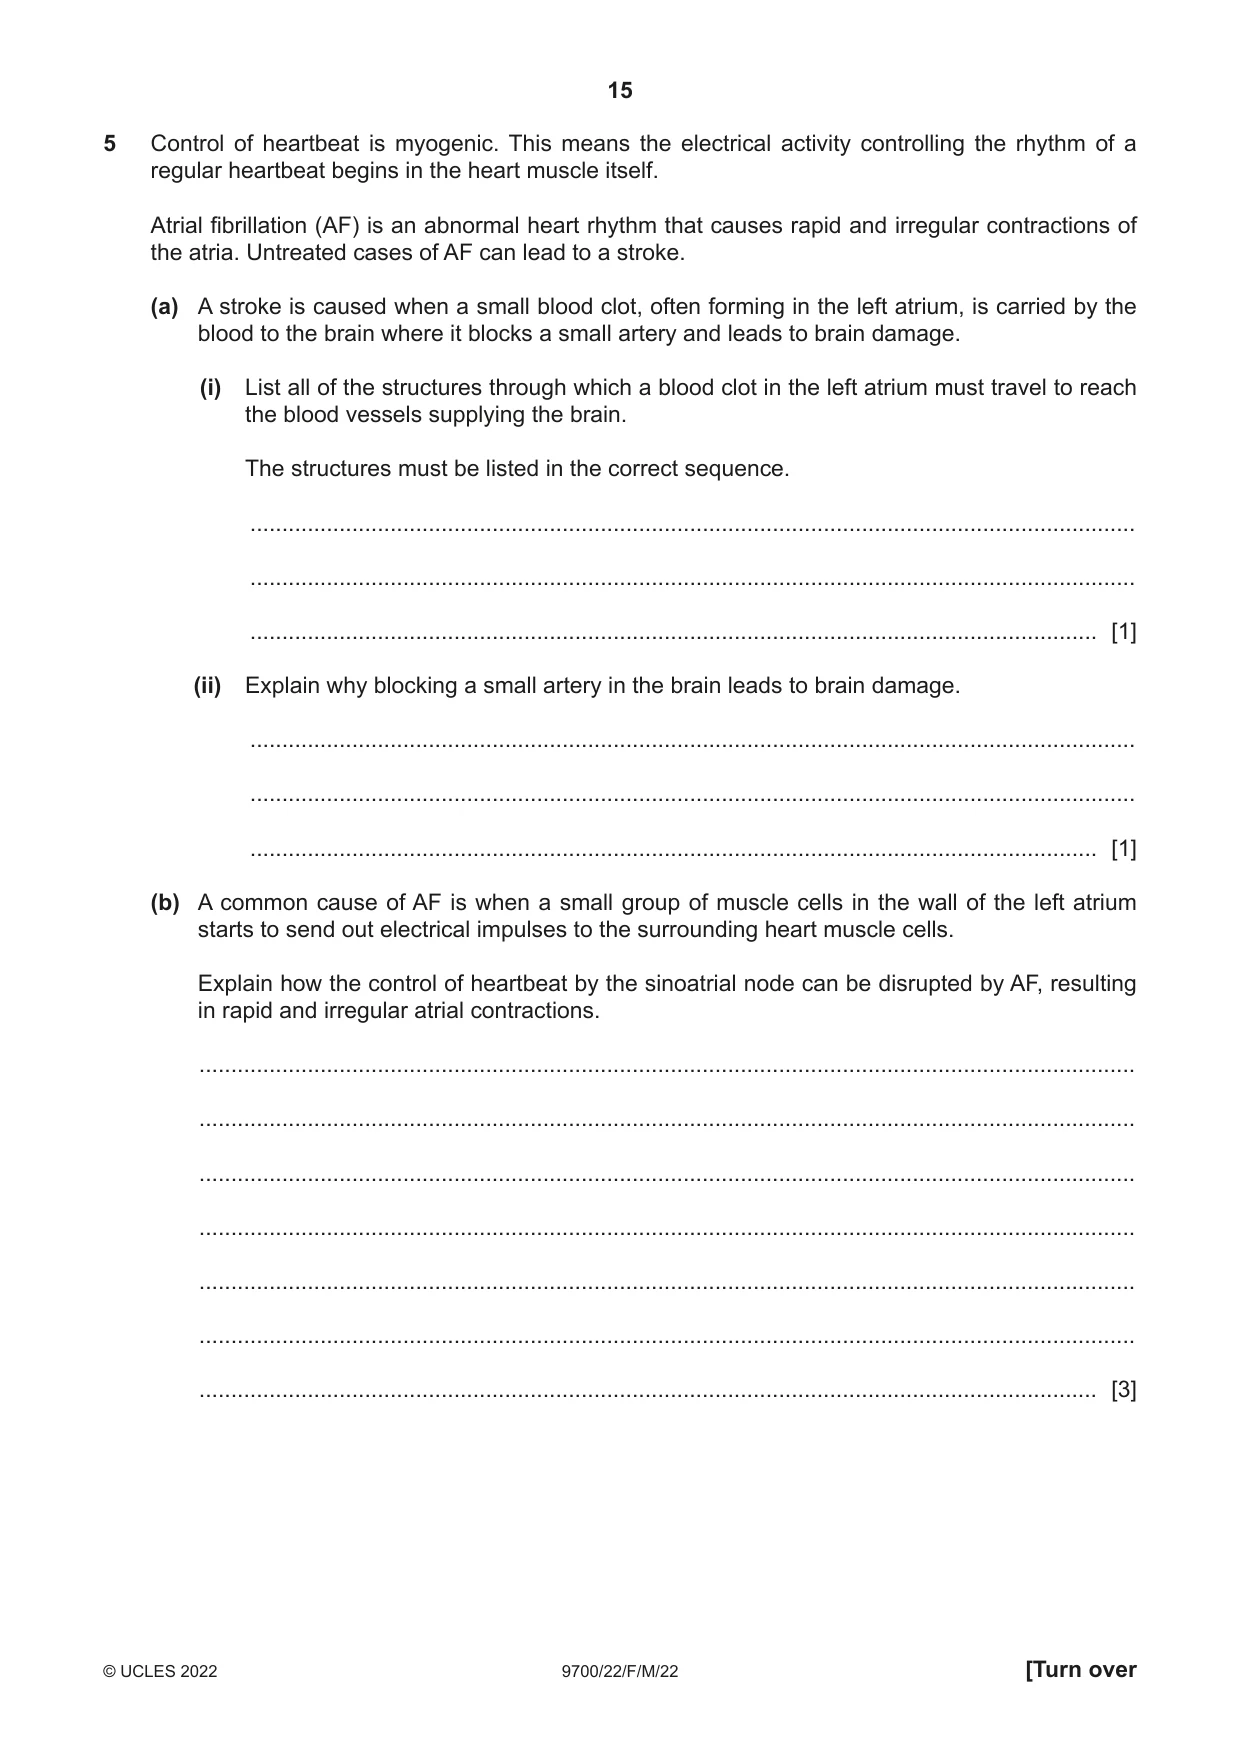
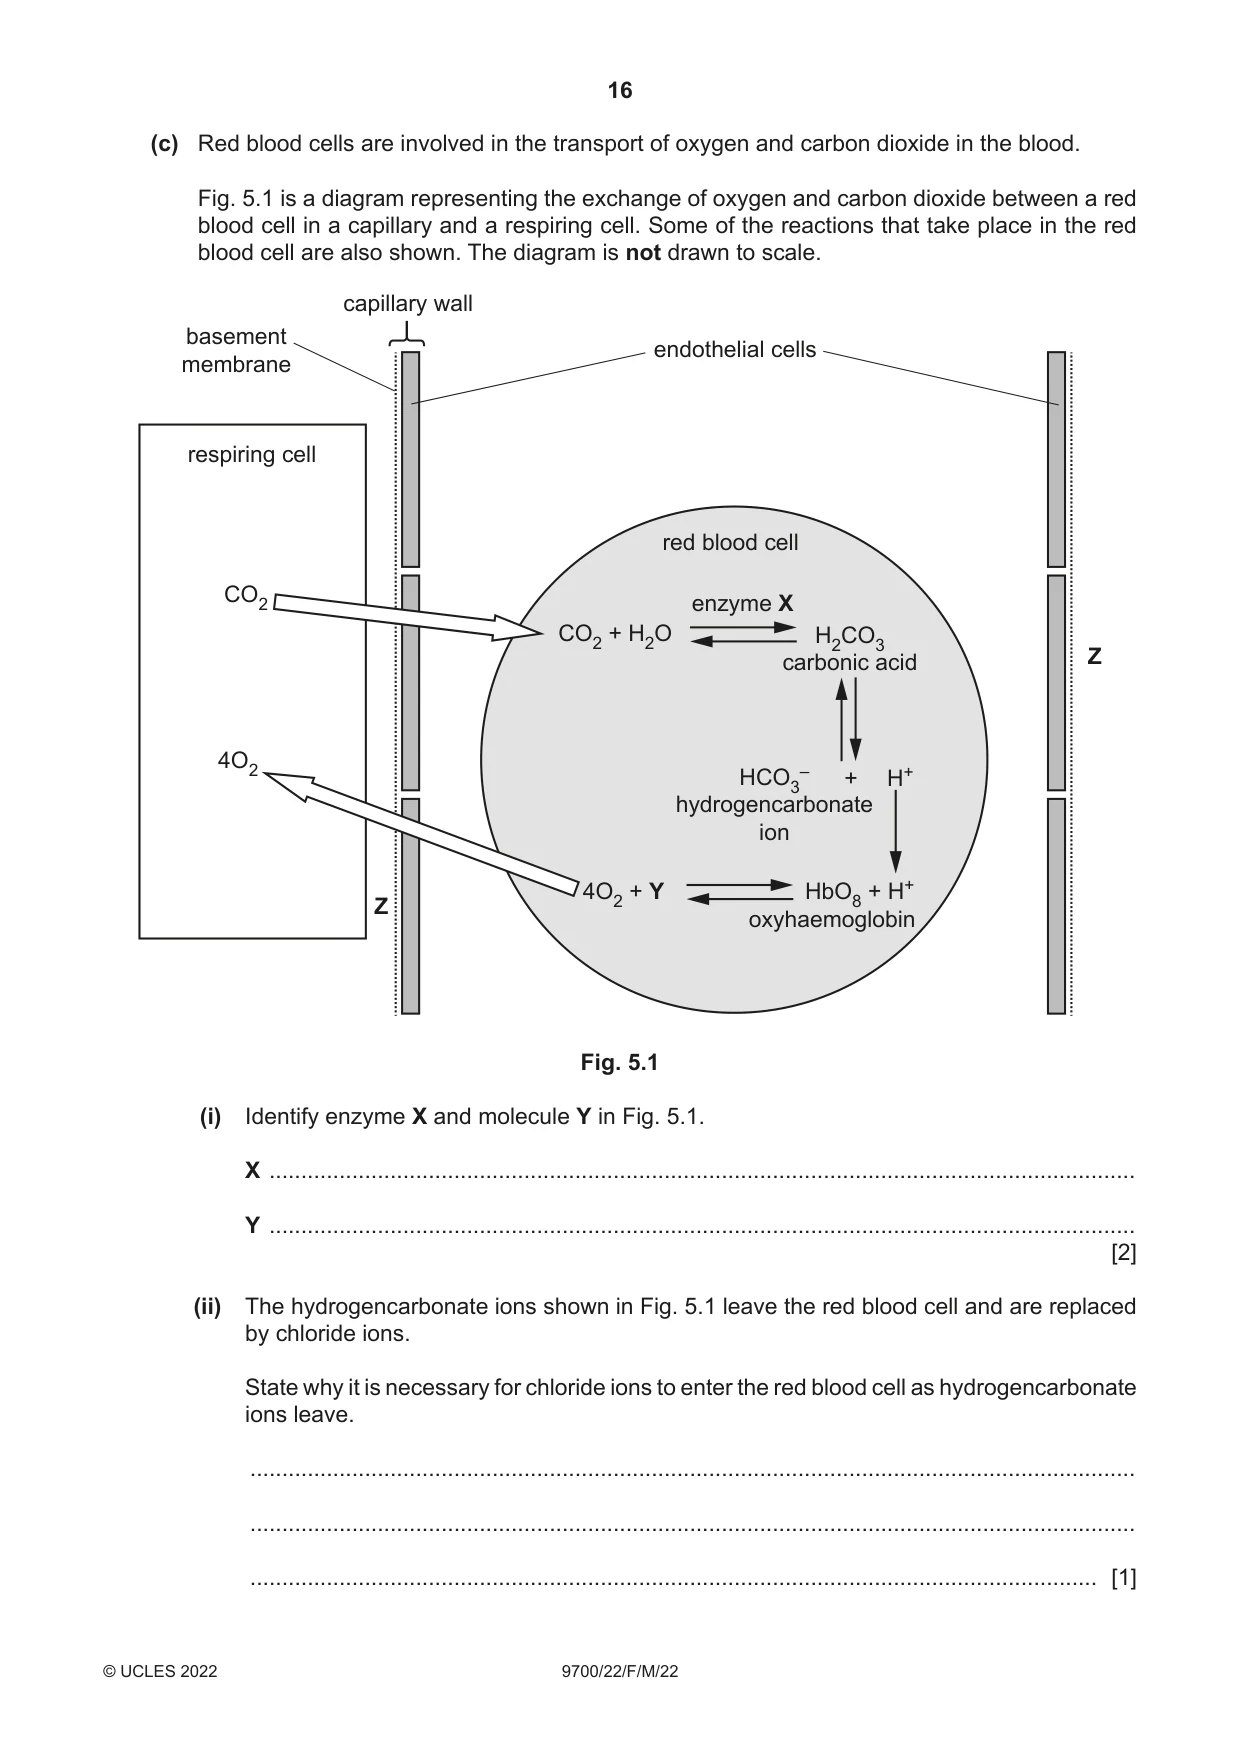
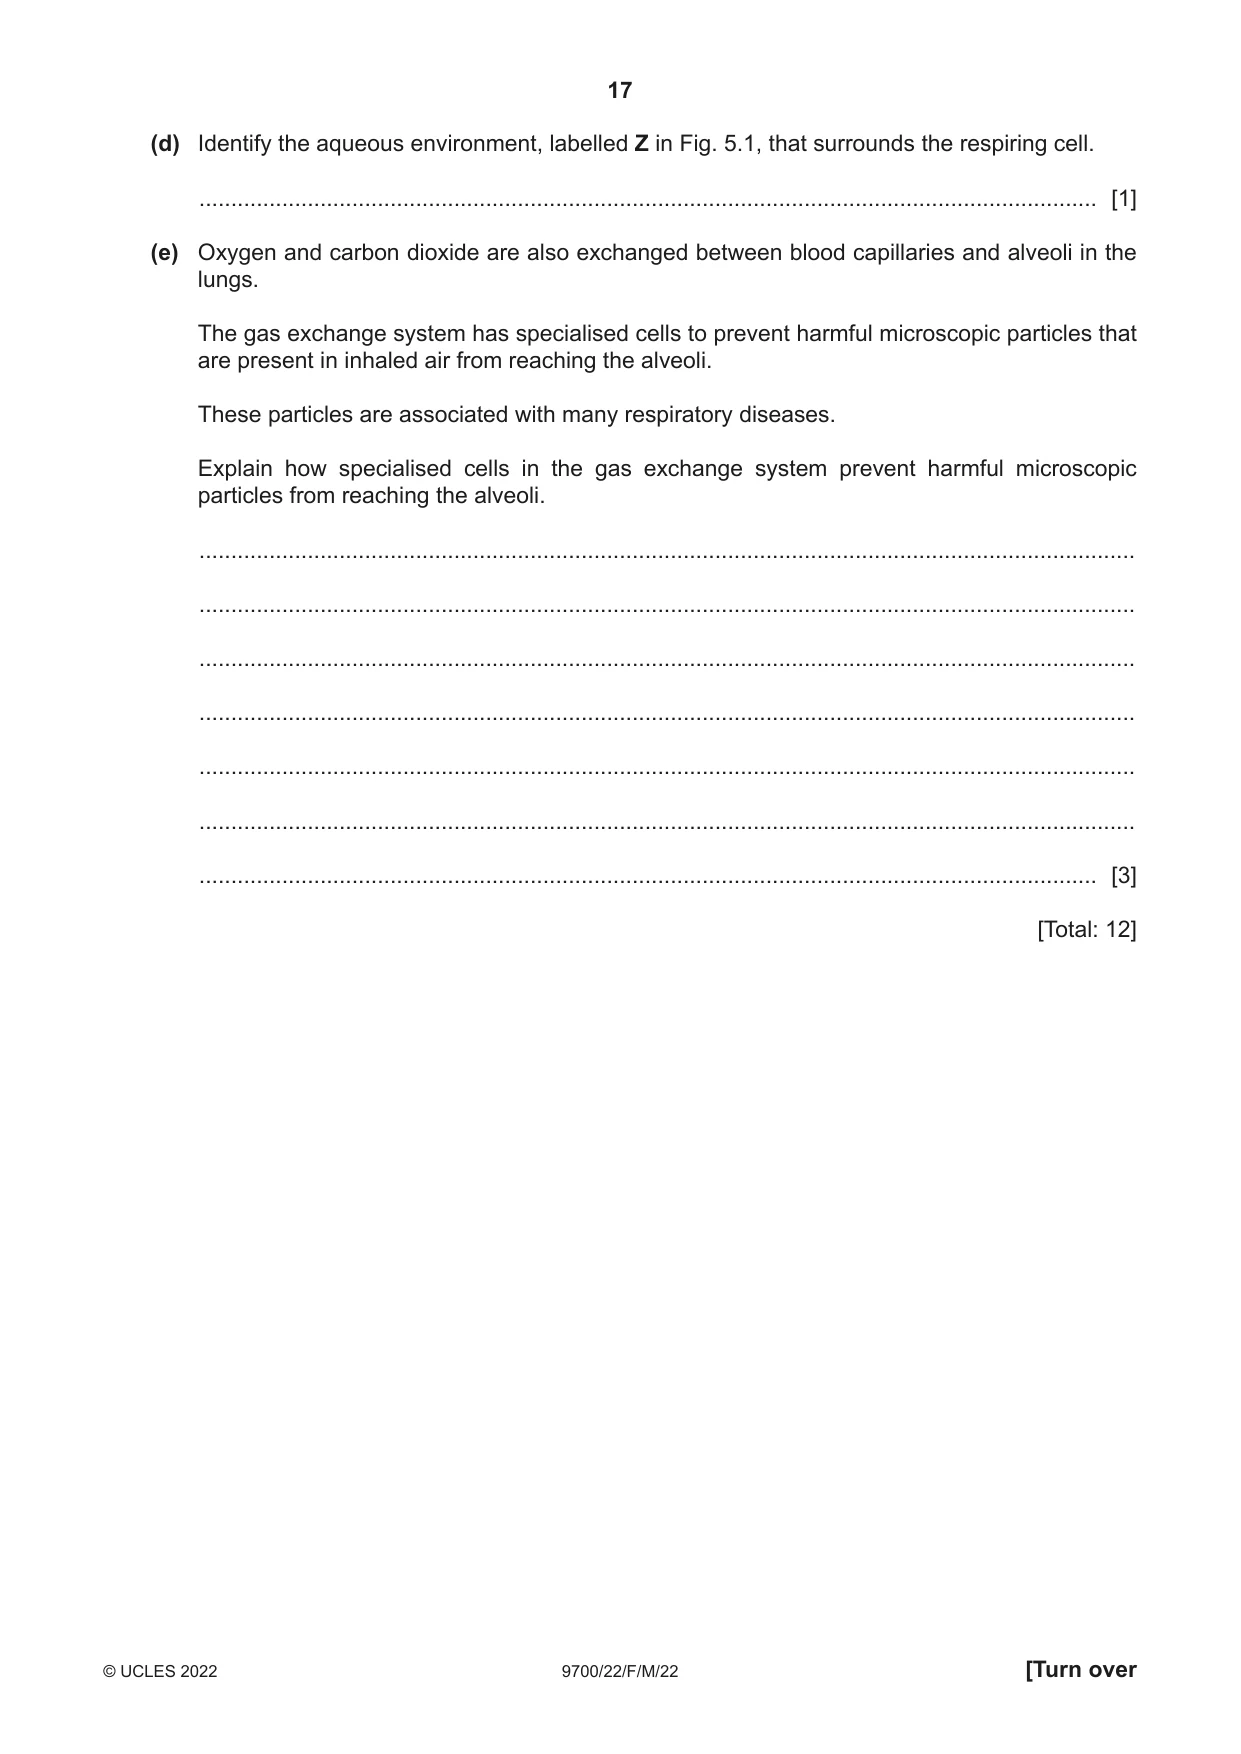
5 Control of heartbeat is myogenic. This means the electrical activity controlling the rhythm of a regular heartbeat begins in the heart muscle itself. Atrial fibrillation (AF) is an abnormal heart rhythm that causes rapid and irregular contractions of the atria. Untreated cases of AF can lead to a stroke. (a) A stroke is caused when a small blood clot, often forming in the left atrium, is carried by the blood to the brain where it blocks a small artery and leads to brain damage. (i) List all of the structures through which a blood clot in the left atrium must travel to reach the blood vessels supplying the brain. The structures must be listed in the correct sequence. ........................................................................................................................................... ........................................................................................................................................... ..................................................................................................................................... [1] (ii) Explain why blocking a small artery in the brain leads to brain damage. ........................................................................................................................................... ........................................................................................................................................... ..................................................................................................................................... [1] (b) A common cause of AF is when a small group of muscle cells in the wall of the left atrium starts to send out electrical impulses to the surrounding heart muscle cells. Explain how the control of heartbeat by the sinoatrial node can be disrupted by AF, resulting in rapid and irregular atrial contractions. ................................................................................................................................................... ................................................................................................................................................... ................................................................................................................................................... ................................................................................................................................................... ................................................................................................................................................... ................................................................................................................................................... ............................................................................................................................................. [3] (c) Red blood cells are involved in the transport of oxygen and carbon dioxide in the blood. Fig. 5.1 is a diagram representing the exchange of oxygen and carbon dioxide between a red blood cell in a capillary and a respiring cell. Some of the reactions that take place in the red blood cell are also shown. The diagram is not drawn to scale. capillary wall basement endothelial cells membrane respiring cell red blood cell CO2 enzyme X CO2 + H2O H2CO3 carbonic acid Z 4O2 – HCO3 + H+ hydrogencarbonate ion 4O2 + Y HbO8 + H+ Z oxyhaemoglobin Fig. 5.1 (i) Identify enzyme X and molecule Y in Fig. 5.1. X ........................................................................................................................................ Y ........................................................................................................................................ [2] (ii) The hydrogencarbonate ions shown in Fig. 5.1 leave the red blood cell and are replaced by chloride ions. State why it is necessary for chloride ions to enter the red blood cell as hydrogencarbonate ions leave. ........................................................................................................................................... ........................................................................................................................................... ..................................................................................................................................... [1] (d) Identify the aqueous environment, labelled Z in Fig. 5.1, that surrounds the respiring cell. ............................................................................................................................................. [1] (e) Oxygen and carbon dioxide are also exchanged between blood capillaries and alveoli in the lungs. The gas exchange system has specialised cells to prevent harmful microscopic particles that are present in inhaled air from reaching the alveoli. These particles are associated with many respiratory diseases. Explain how specialised cells in the gas exchange system prevent harmful microscopic particles from reaching the alveoli. ................................................................................................................................................... ................................................................................................................................................... ................................................................................................................................................... ................................................................................................................................................... ................................................................................................................................................... ................................................................................................................................................... ............................................................................................................................................. [3] [Total: 12]
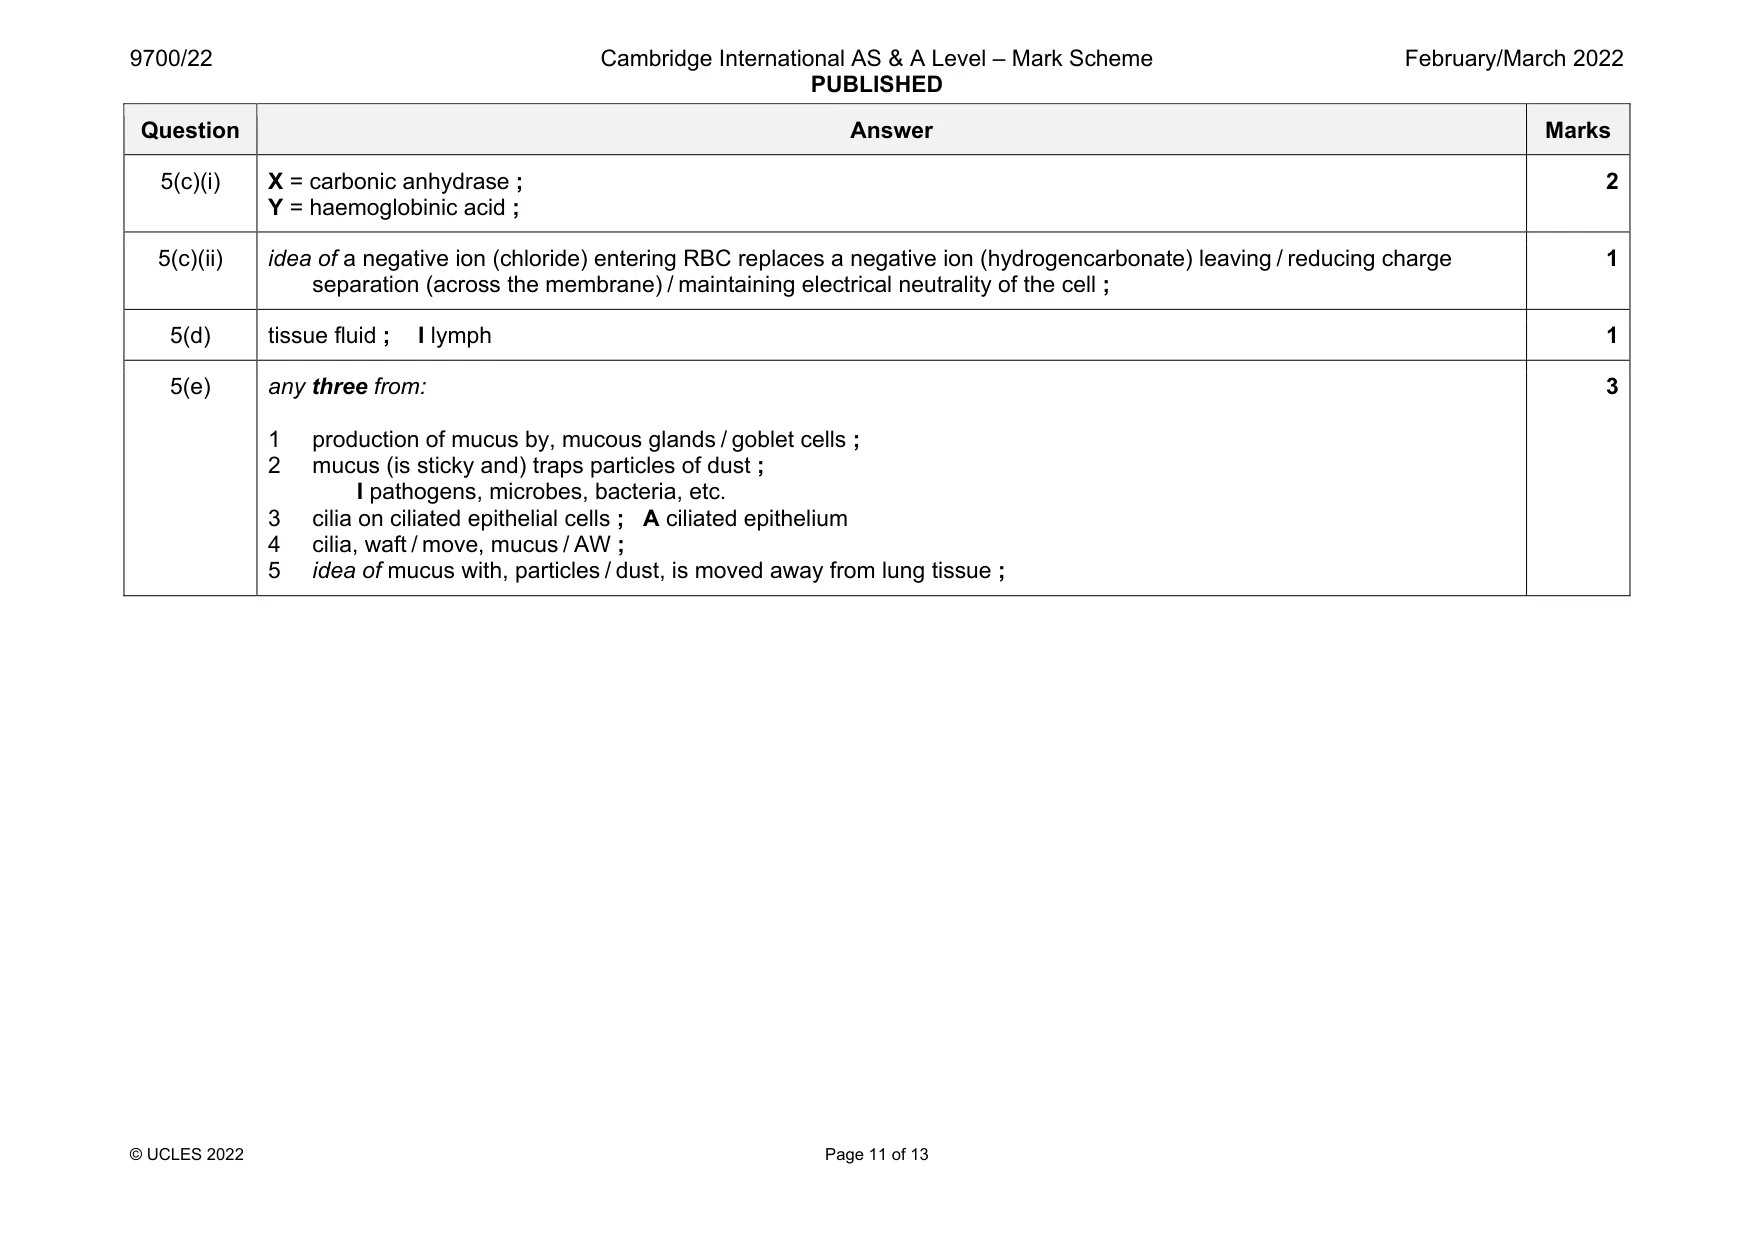
Mark scheme: 5(a)(i) mitral / bicuspid / atrioventricular, valve and left ventricle and semilunar / aortic, valve and aorta ; 5(a)(ii) lack of, glucose / oxygen, to (some) brain cells (so cells cannot respire) ; 1 5(b) any three from: 1 normally only SAN in (wall of) right atrium sends out impulses ; 2 ref. to extra impulses (from wall of left atrium) ; 3 atrial systole might occur when it should be in diastole ; 4 impulses interfere with each other / AW ; 5 SAN no longer able to act as a pacemaker ; 6 rapid since extra contractions ; 3 Question Answer Marks 5(c)(i) X = carbonic anhydrase ; Y = haemoglobinic acid ; 2 5(c)(ii) idea of a negative ion (chloride) entering RBC replaces a negative ion (hydrogencarbonate) leaving / reducing charge separation (across the membrane) / maintaining electrical neutrality of the cell ; 1 5(d) tissue fluid ; I lymph 1 5(e) any three from: 1 production of mucus by, mucous glands / goblet cells ; 2 mucus (is sticky and) traps particles of dust ; I pathogens, microbes, bacteria, etc. 3 cilia on ciliated epithelial cells ; A ciliated epithelium 4 cilia, waft / move, mucus / AW ; 5 idea of mucus with, particles / dust, is moved away from lung tissue ; 3
Q6 · A diagram showing the structure of part of a DNA molecule
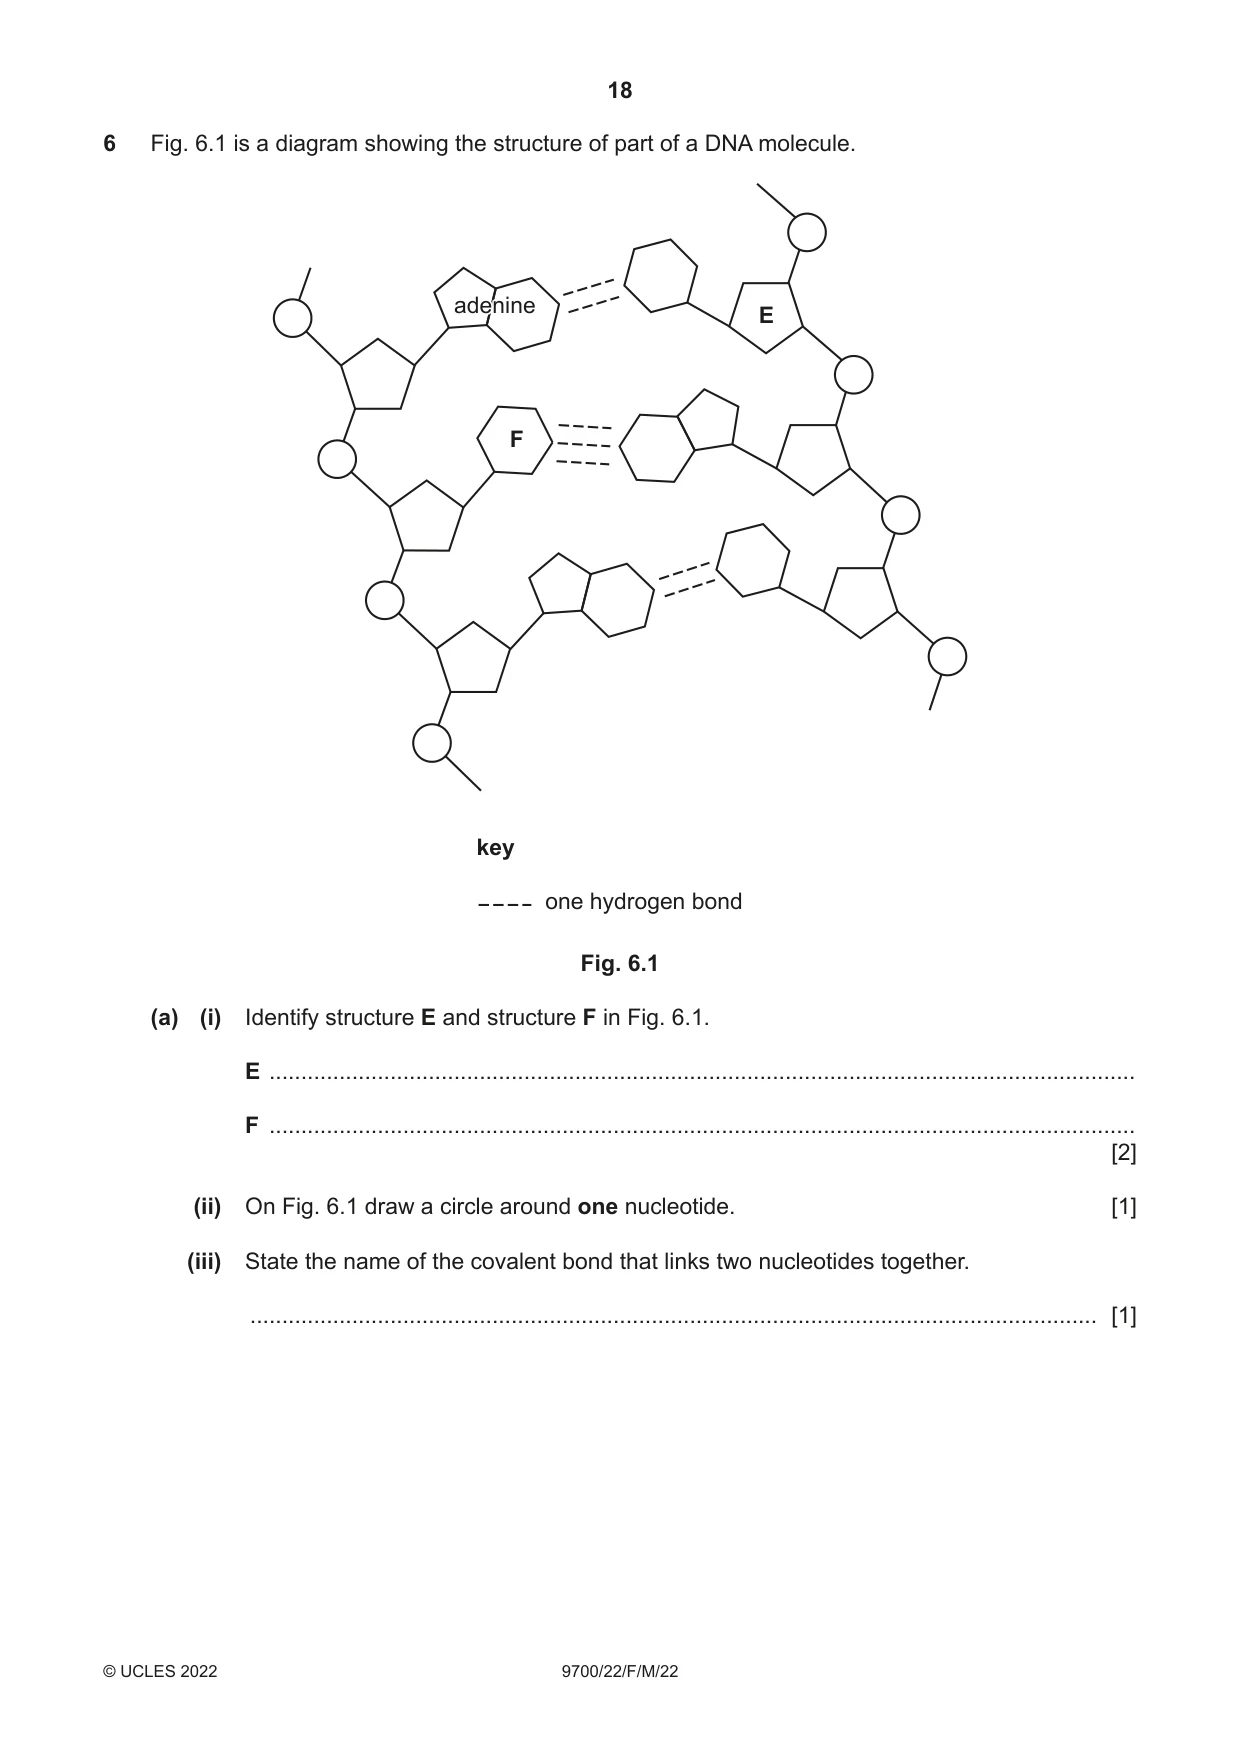
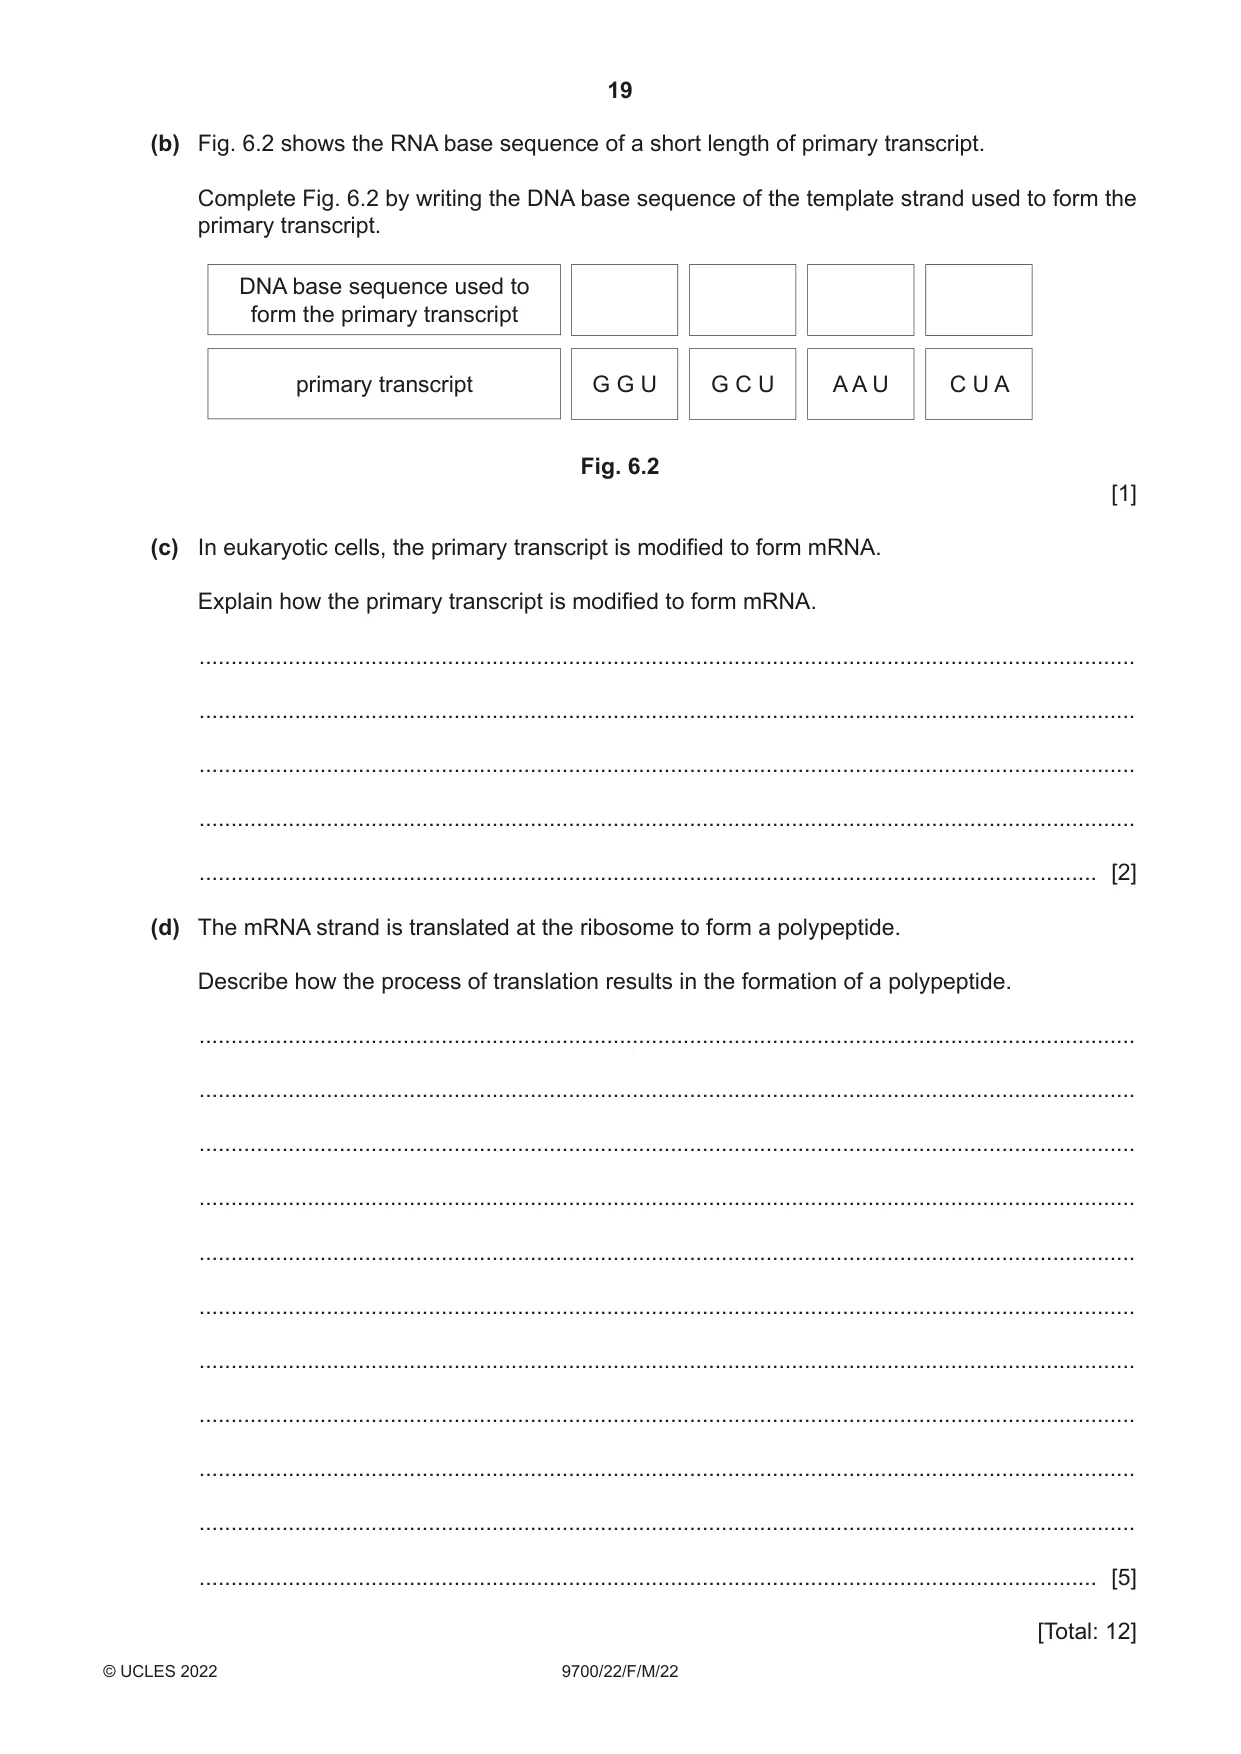
6 Fig. 6.1 is a diagram showing the structure of part of a DNA molecule. adenineadenine E F key one hydrogen bond Fig. 6.1 (a) (i) Identify structure E and structure F in Fig. 6.1. E ........................................................................................................................................ F ........................................................................................................................................ [2] (ii) On Fig. 6.1 draw a circle around one nucleotide. [1] (iii) State the name of the covalent bond that links two nucleotides together. ..................................................................................................................................... [1] (b) Fig. 6.2 shows the RNA base sequence of a short length of primary transcript. Complete Fig. 6.2 by writing the DNA base sequence of the template strand used to form the primary transcript. DNA base sequence used to form the primary transcript primary transcript G G U G C U A A U C U A Fig. 6.2 [1] (c) In eukaryotic cells, the primary transcript is modified to form mRNA. Explain how the primary transcript is modified to form mRNA. ................................................................................................................................................... ................................................................................................................................................... ................................................................................................................................................... ................................................................................................................................................... ............................................................................................................................................. [2] (d) The mRNA strand is translated at the ribosome to form a polypeptide. Describe how the process of translation results in the formation of a polypeptide. ................................................................................................................................................... ................................................................................................................................................... ................................................................................................................................................... ................................................................................................................................................... ................................................................................................................................................... ................................................................................................................................................... ................................................................................................................................................... ................................................................................................................................................... ................................................................................................................................................... ................................................................................................................................................... ............................................................................................................................................. [5] [Total: 12]
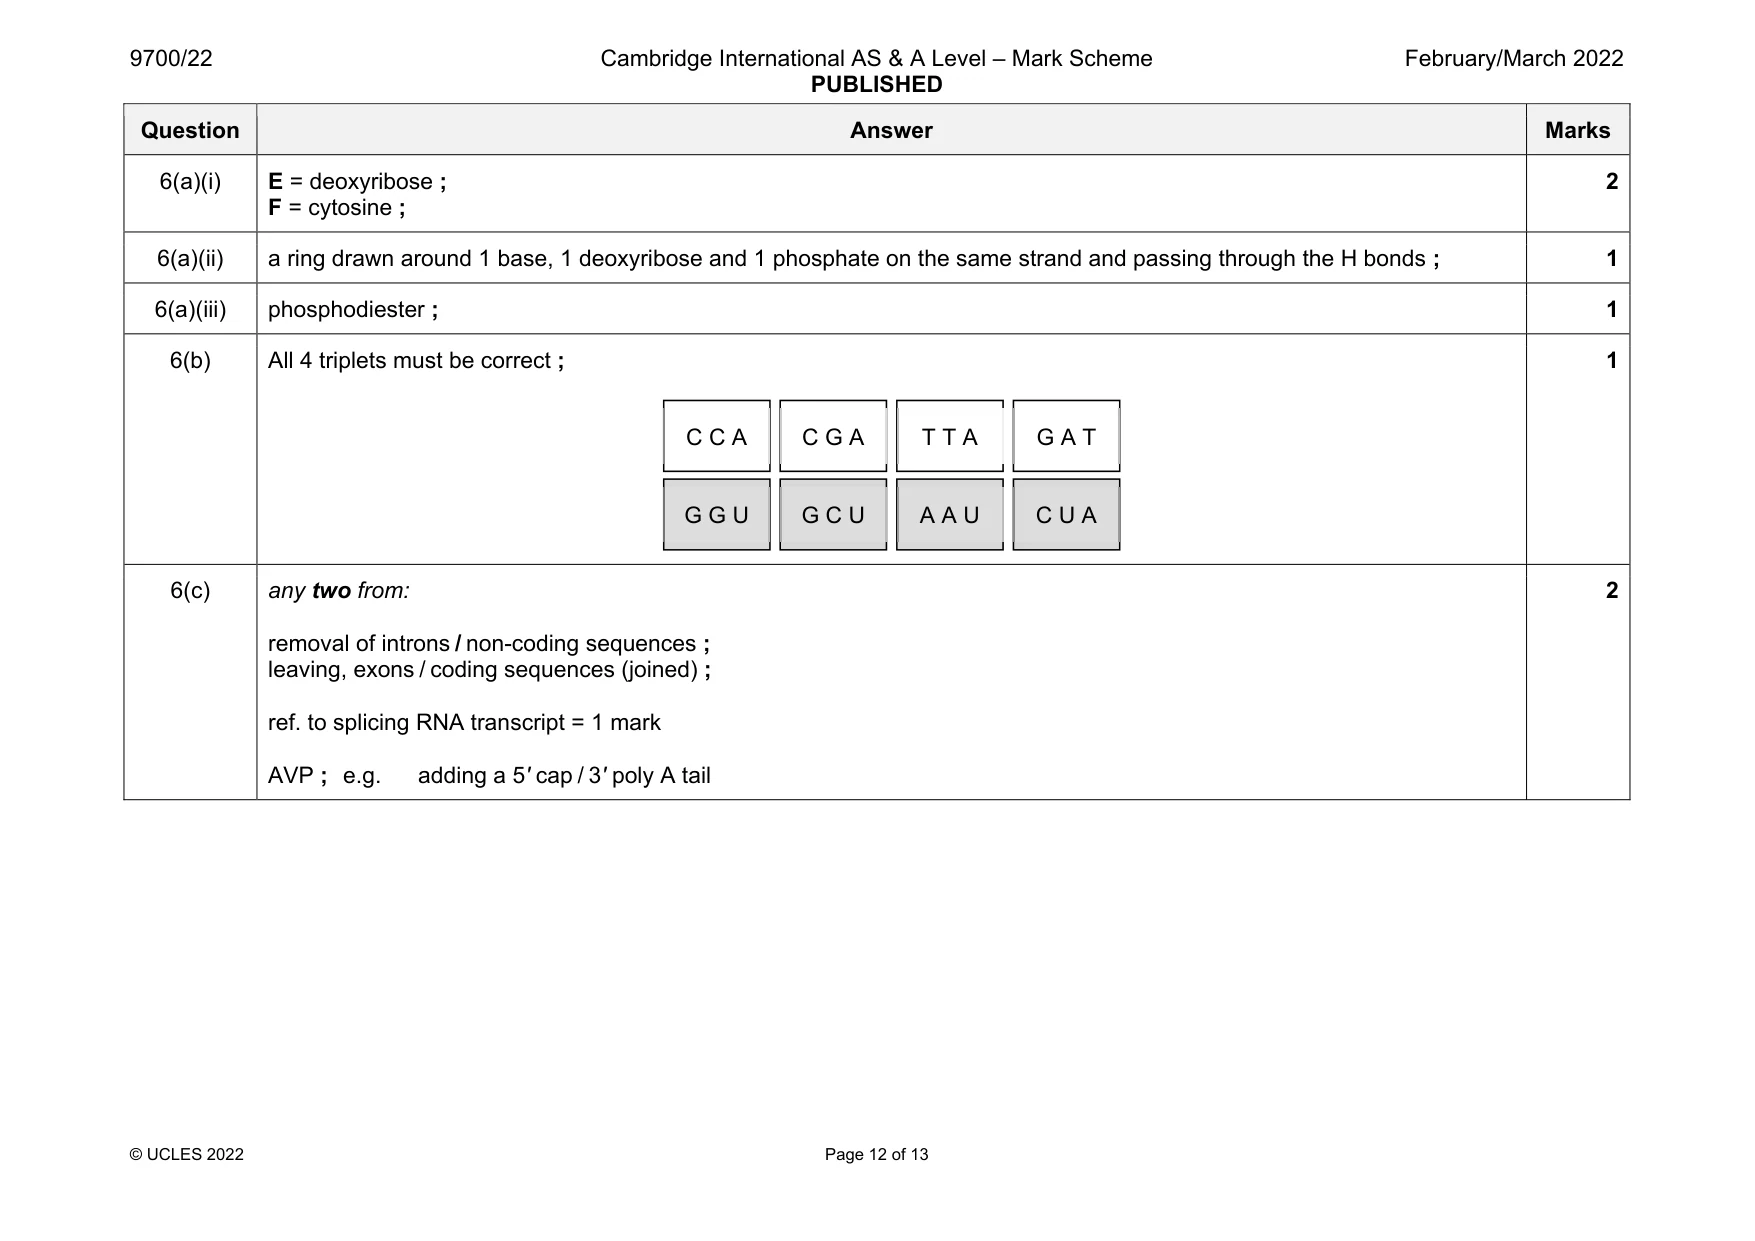
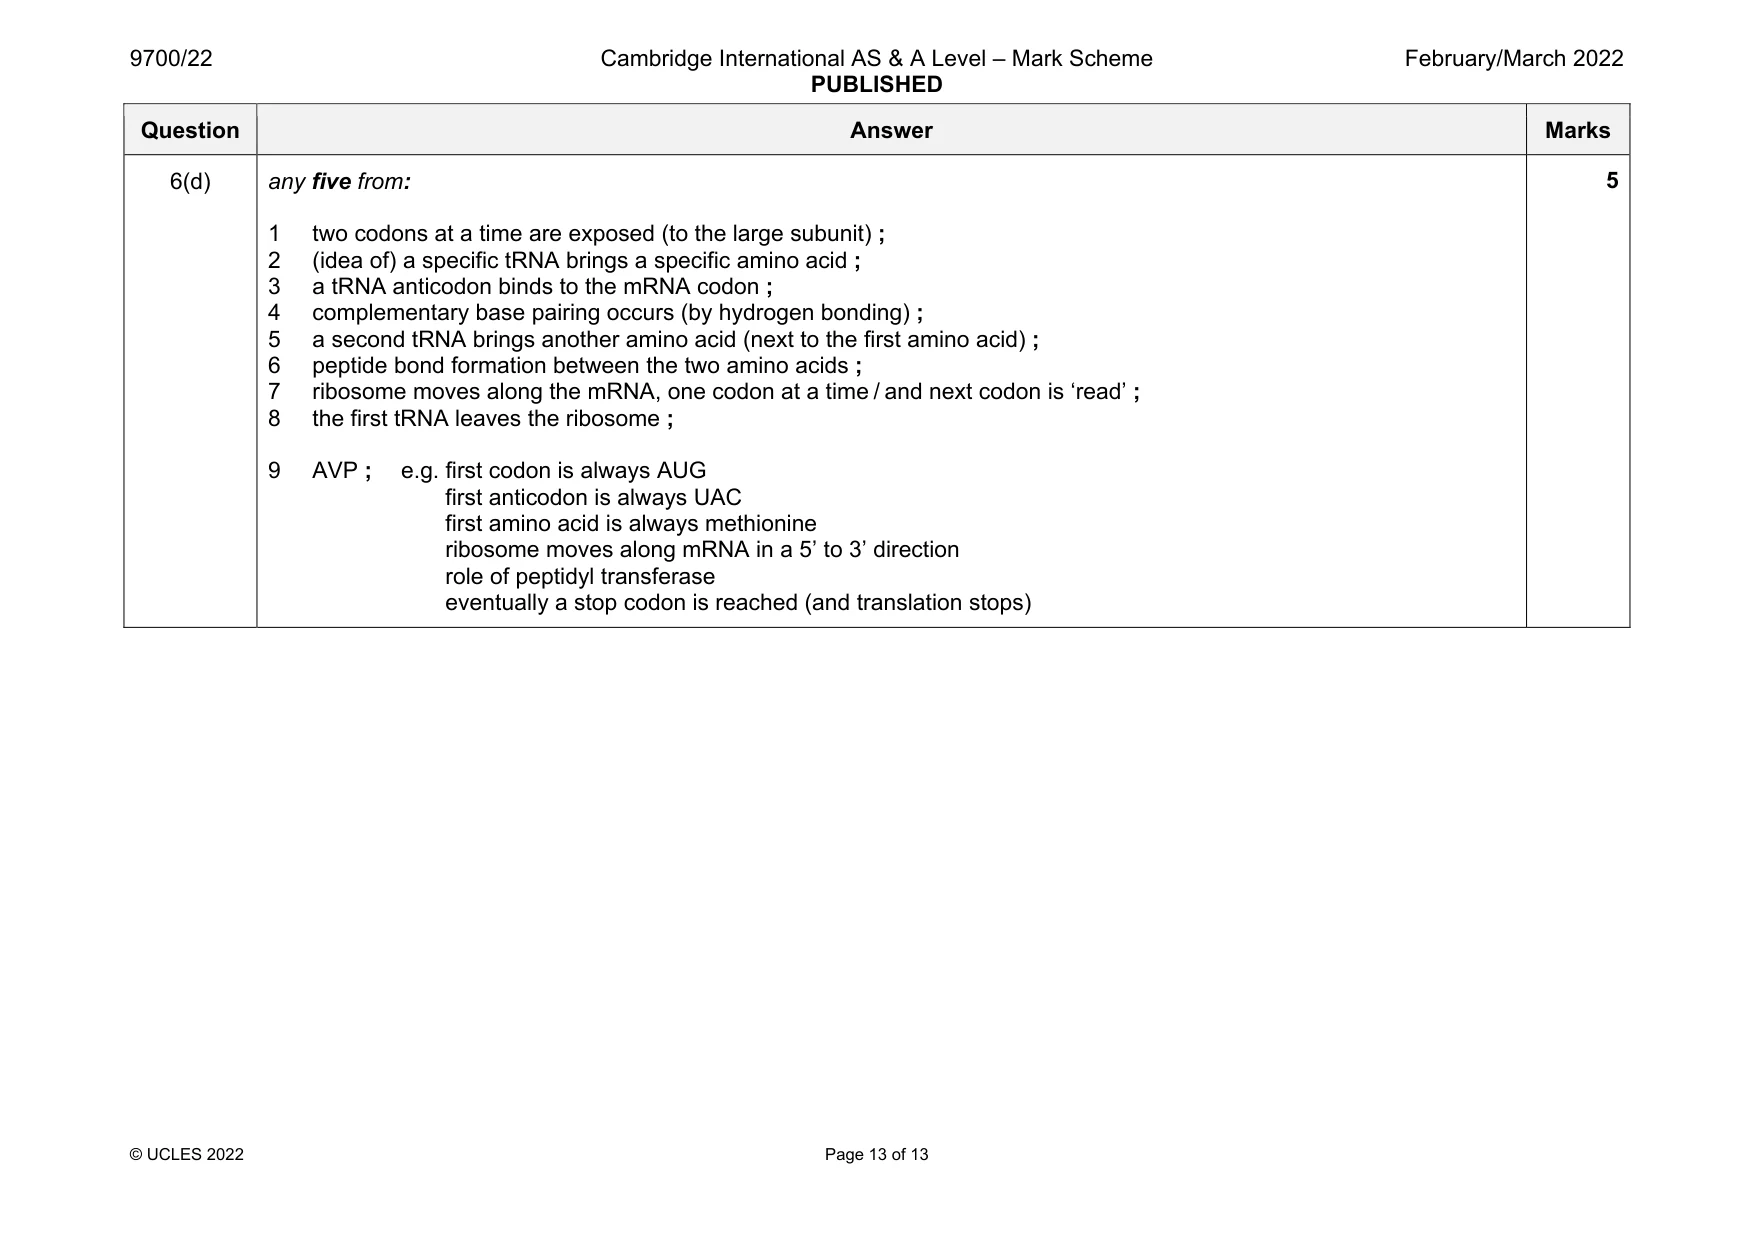
Mark scheme: 6(a)(i) E = deoxyribose ; F = cytosine ; 2 6(a)(ii) a ring drawn around 1 base, 1 deoxyribose and 1 phosphate on the same strand and passing through the H bonds ; 1 6(a)(iii) phosphodiester ; 1 6(b) All 4 triplets must be correct ; 1 6(c) any two from: removal of introns / non-coding sequences ; leaving, exons / coding sequences (joined) ; ref. to splicing RNA transcript = 1 mark AVP ; e.g. adding a 5ʹ cap / 3ʹ poly A tail 2 C C A G G U C G A G C U T T A A A U G A T C U A Question Answer Marks 6(d) any five from: 1 two codons at a time are exposed (to the large subunit) ; 2 (idea of) a specific tRNA brings a specific amino acid ; 3 a tRNA anticodon binds to the mRNA codon ; 4 complementary base pairing occurs (by hydrogen bonding) ; 5 a second tRNA brings another amino acid (next to the first amino acid) ; 6 peptide bond formation between the two amino acids ; 7 ribosome moves along the mRNA, one codon at a time / and next codon is ‘read’ ; 8 the first tRNA leaves the ribosome ; 9 AVP ; e.g. first codon is always AUG first anticodon is always UAC first amino acid is always methionine ribosome moves along mRNA in a 5’ to 3’ direction role of peptidyl transferase eventually a stop codon is reached (and translation stops) 5
More questions on Structure of nucleic acids and replication of DNA
What was in this paper
The subtopics covered by these 6 questions, and how many questions each got. Open one in a new tab to see every Cambridge question on it.
What you needed in this session
Cambridge’s own grade thresholds for 2022 Feb/March, Paper 2 · Variant 2. A higher threshold means an easier paper — the bar moves with how the cohort did.