Cambridge A Level Biology 9700 — 2021 Oct/Nov Paper 5 · Variant 2
9700/52/O/N/21 · 2 questions · 30 marks · ≈34 min
The question paper and its mark scheme, free to read here and free to download. This is Cambridge’s own paper, exactly as it was sat.
Question paper12 pages


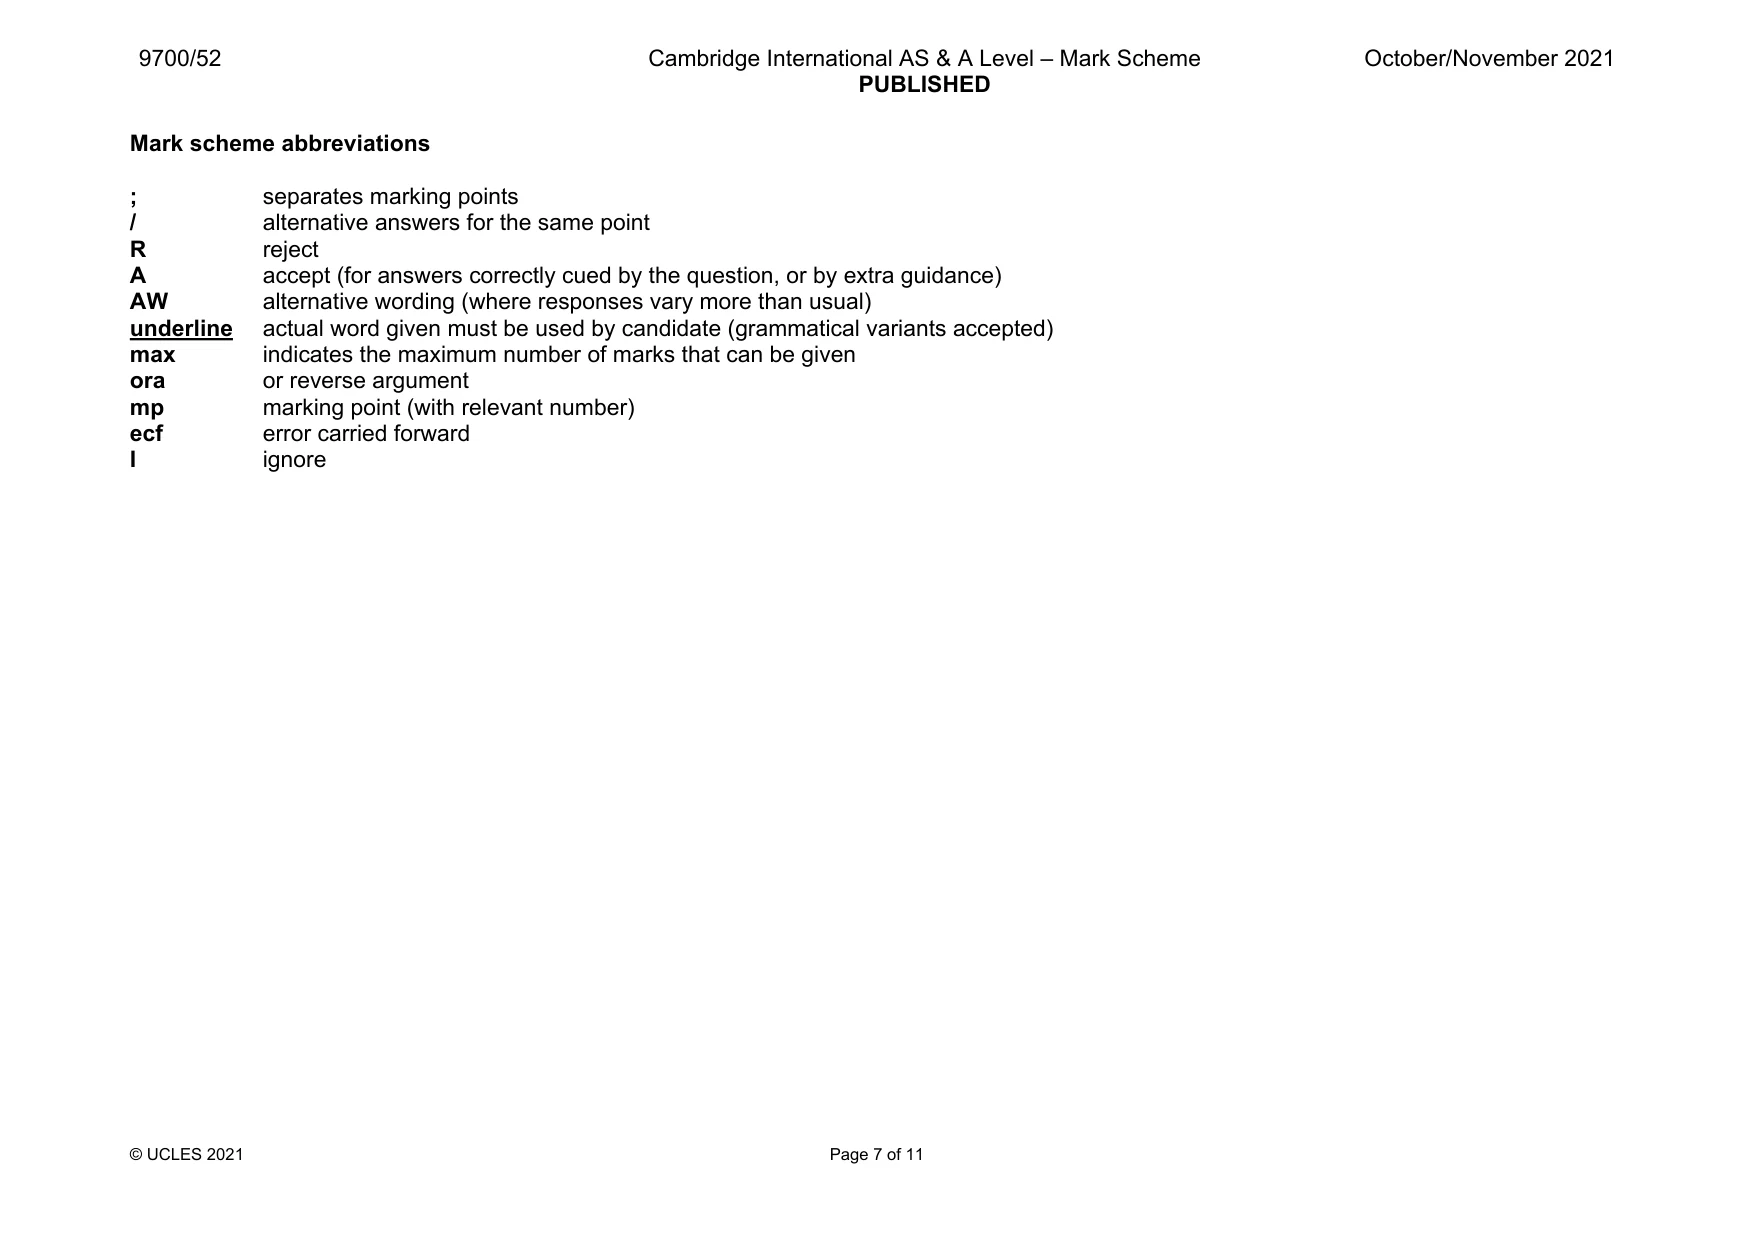
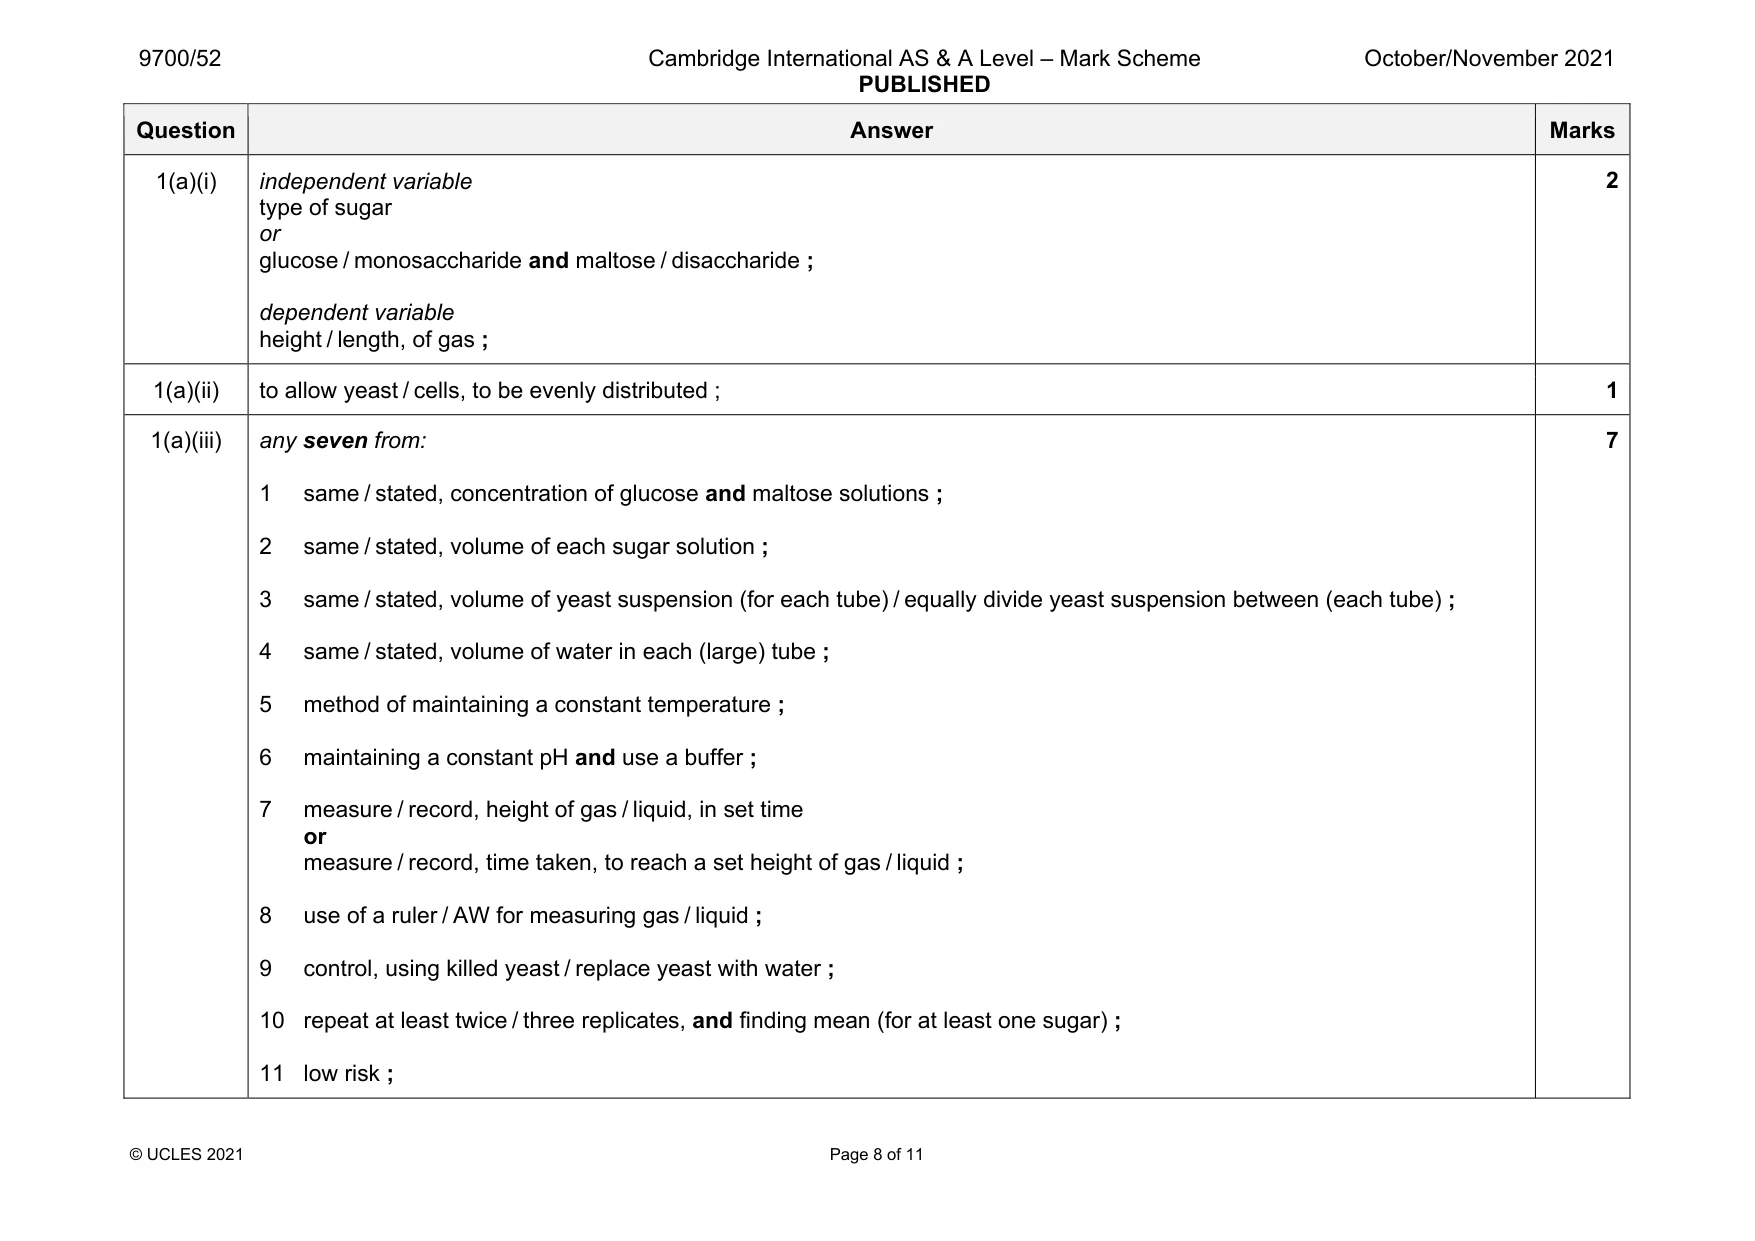
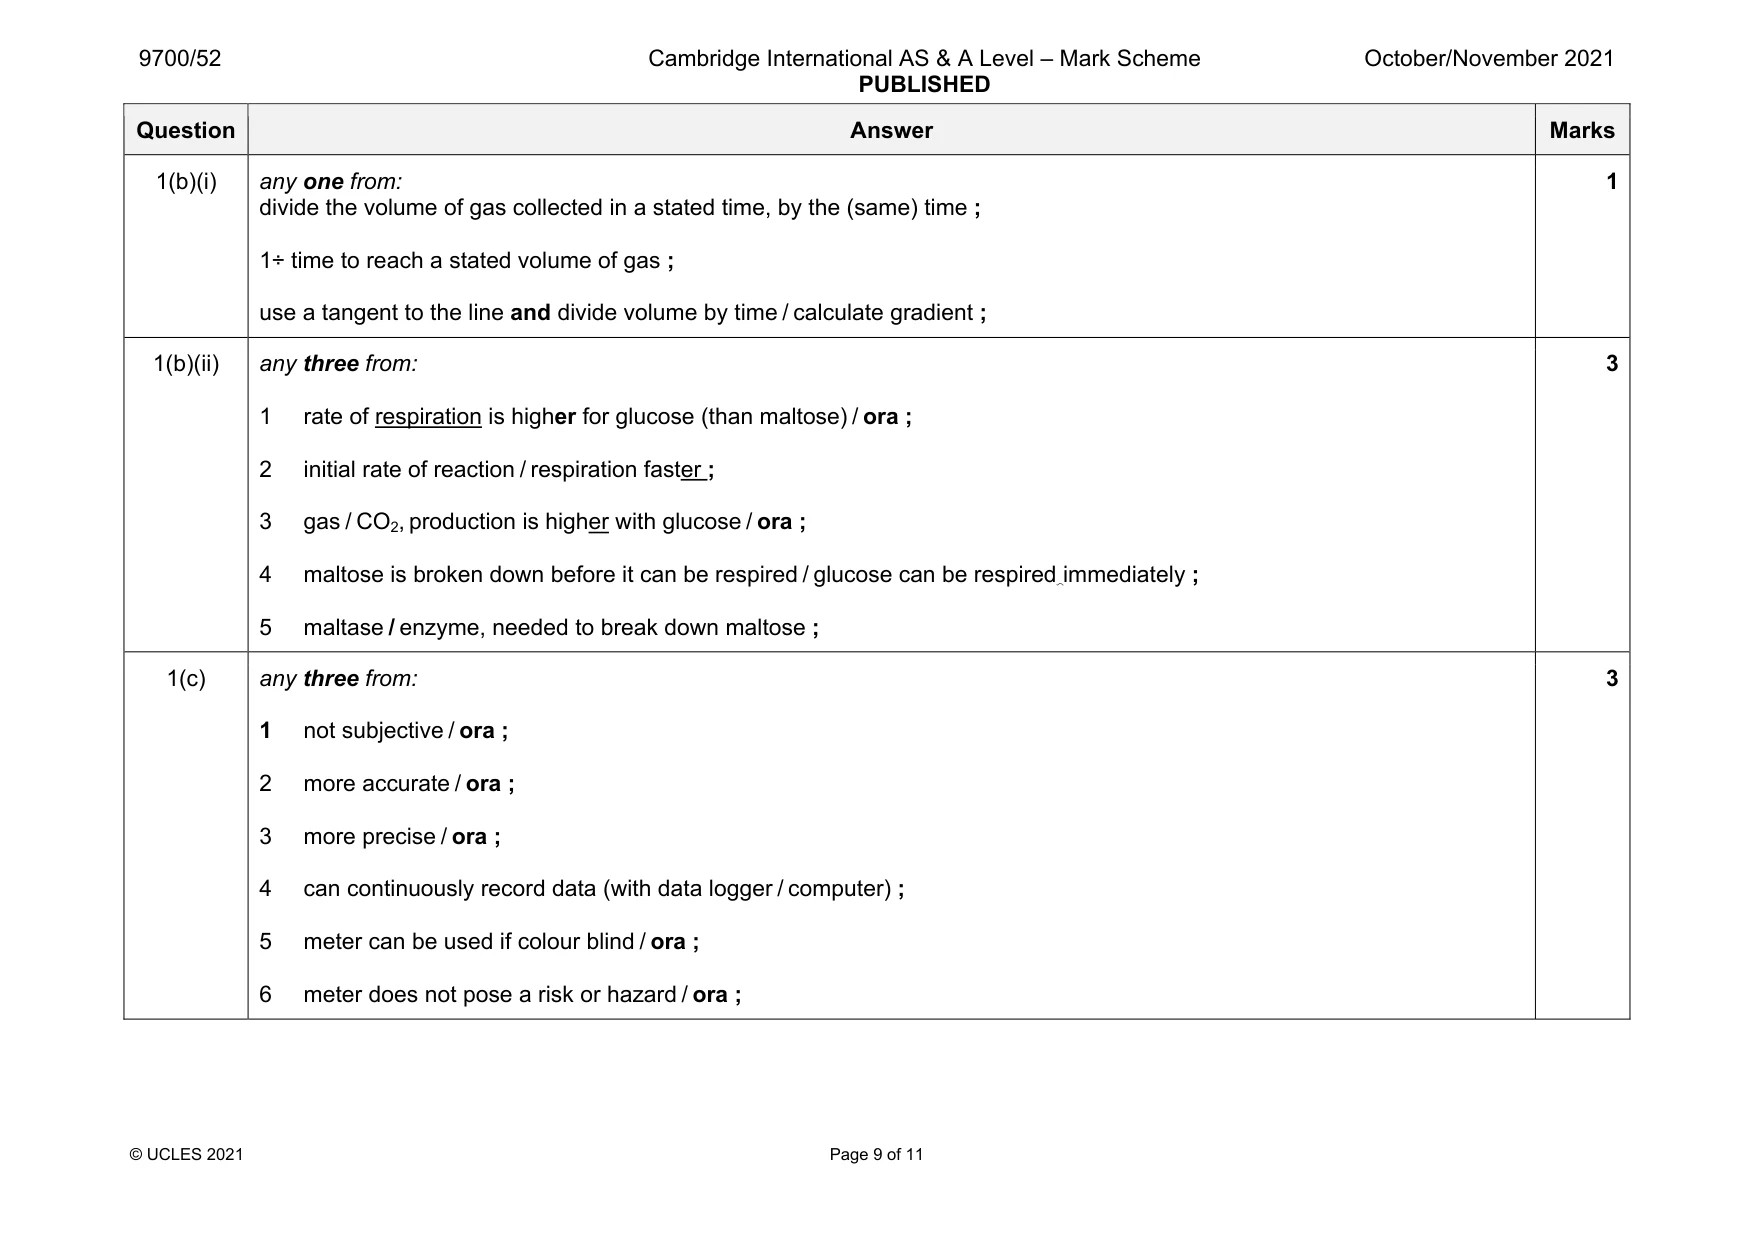
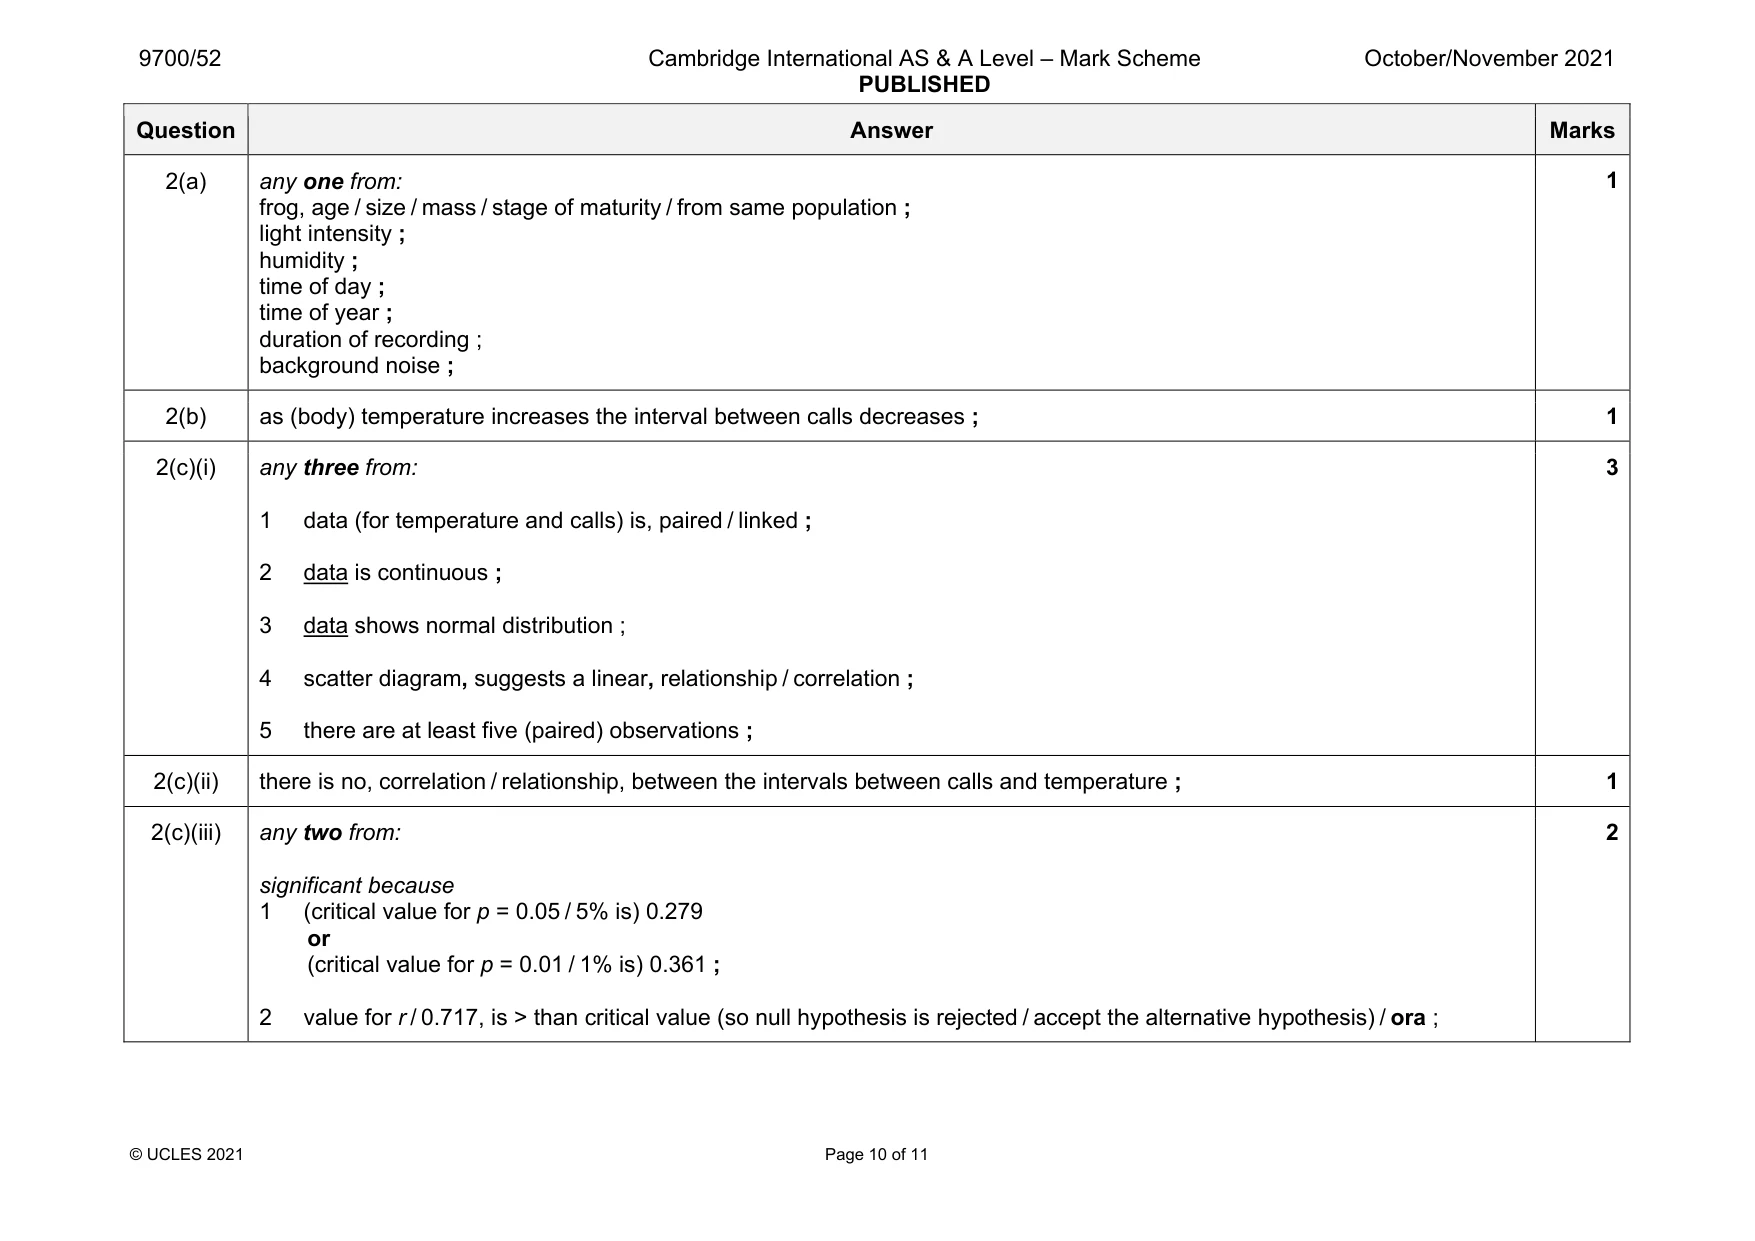
Mark scheme11 pages
Answers below. Sit the paper first if you are practising.
Questions as text
Q1 · Some students researched how yeast, Saccharomyces cerevisiae, is used in the food industry
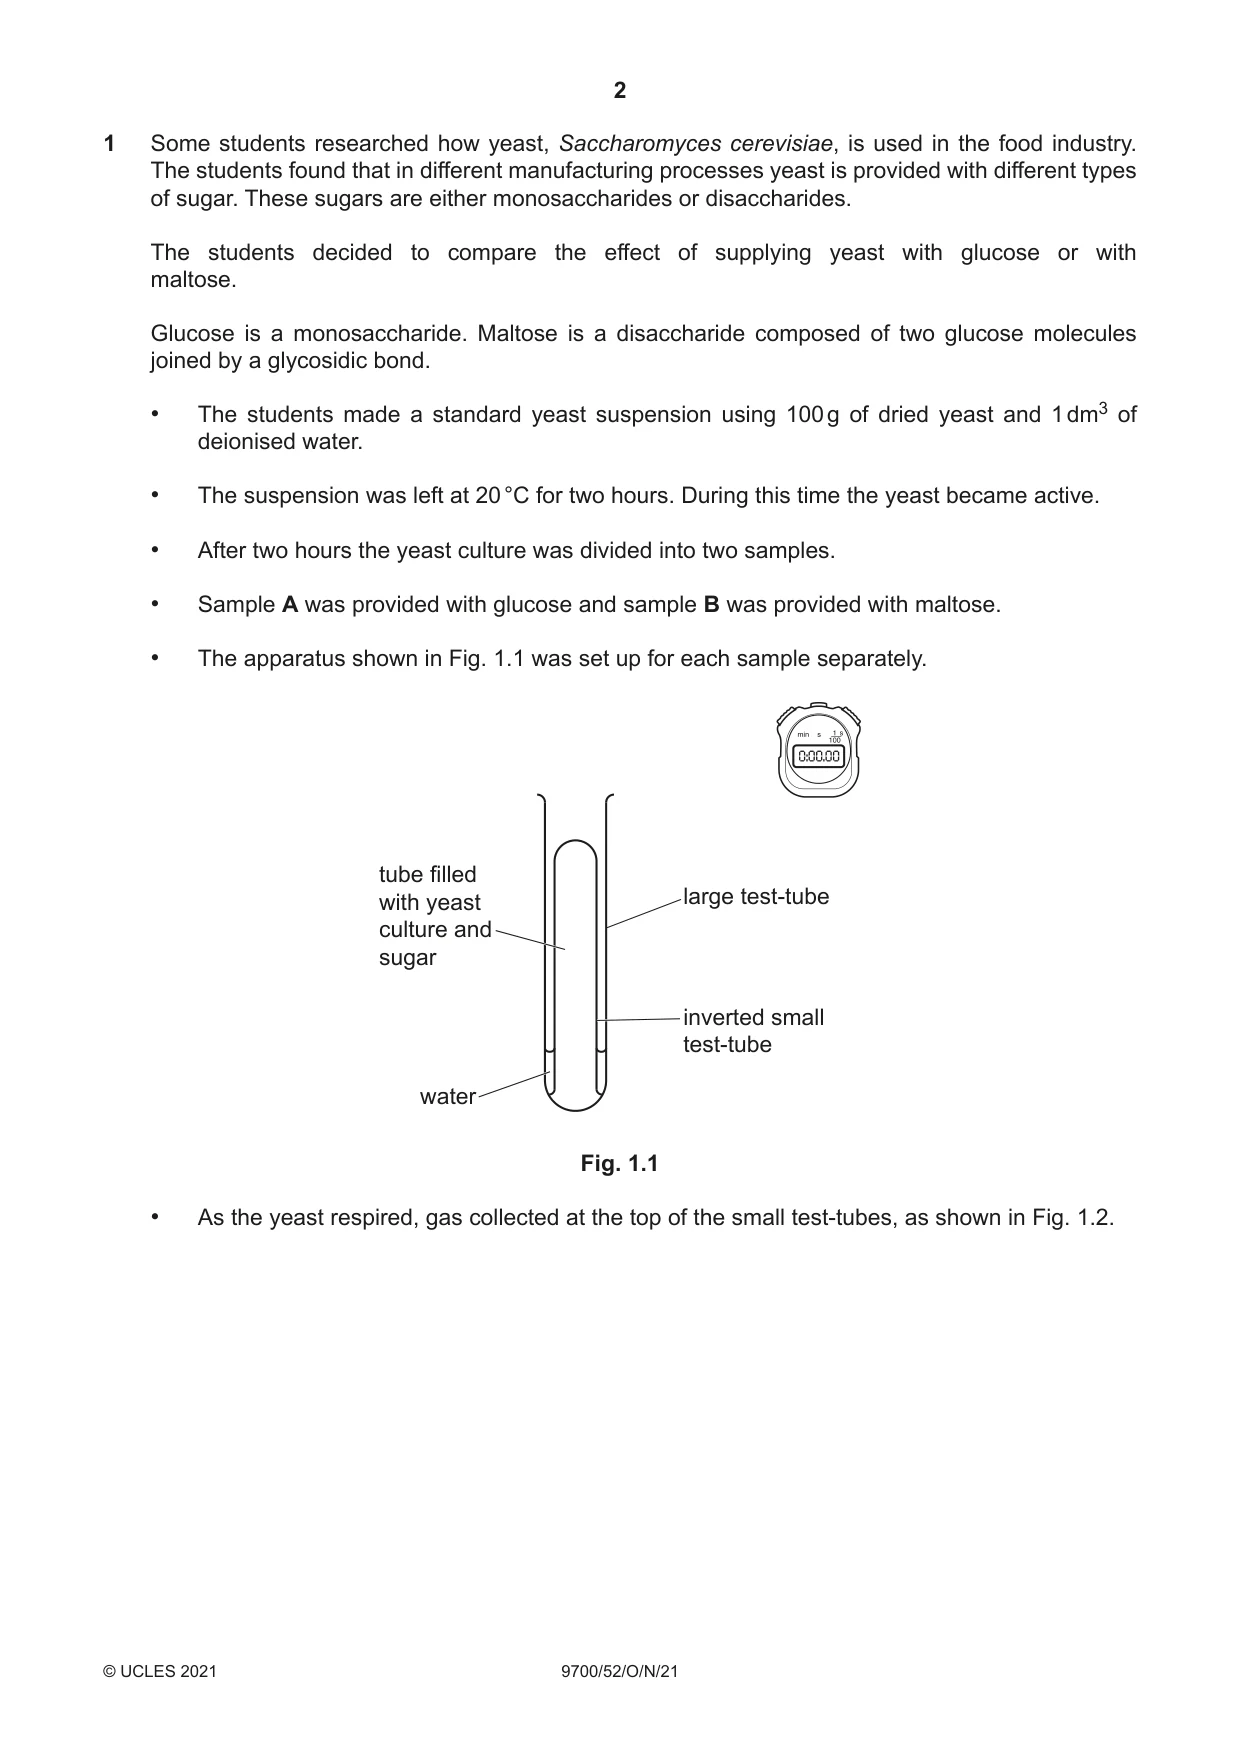
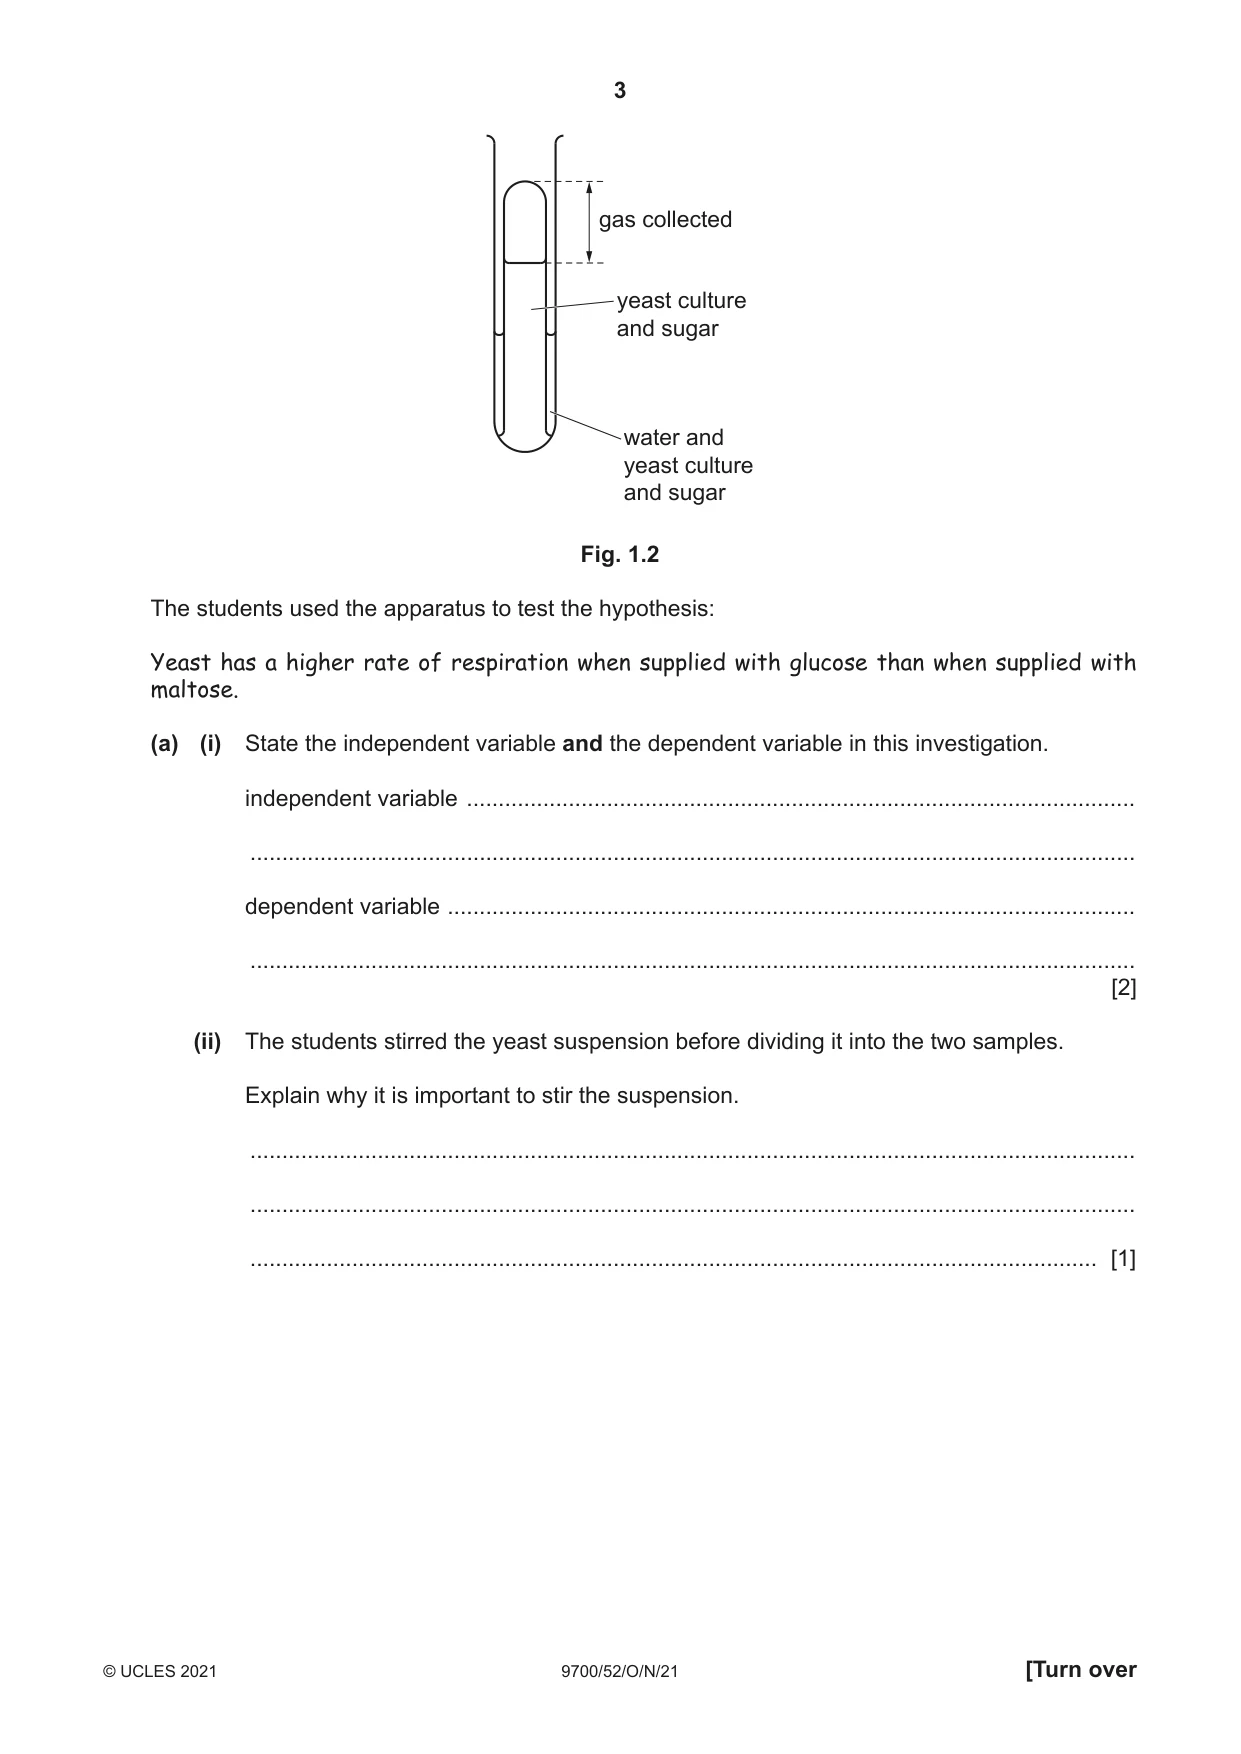
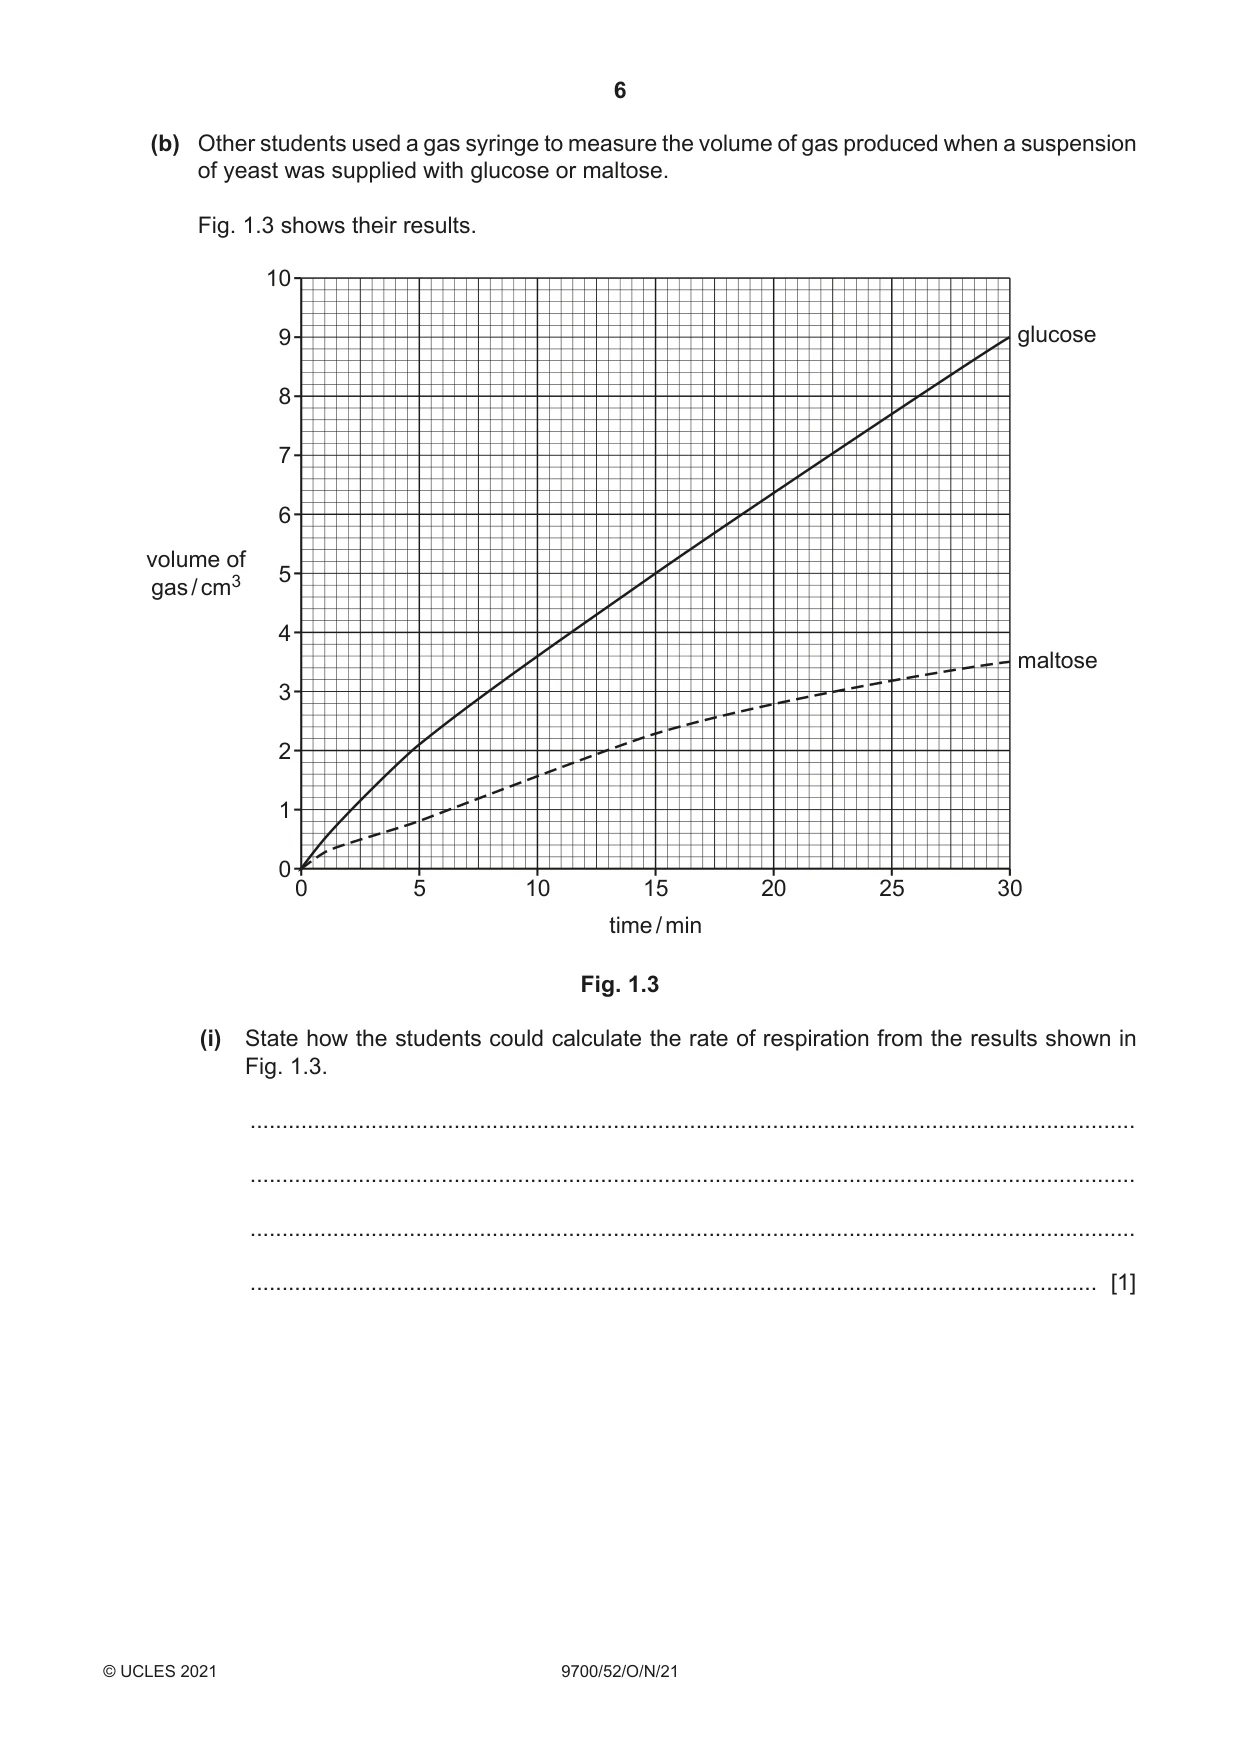
1 Some students researched how yeast, Saccharomyces cerevisiae, is used in the food industry. The students found that in different manufacturing processes yeast is provided with different types of sugar. These sugars are either monosaccharides or disaccharides. The students decided to compare the effect of supplying yeast with glucose or with maltose. Glucose is a monosaccharide. Maltose is a disaccharide composed of two glucose molecules joined by a glycosidic bond. • The students made a standard yeast suspension using 100 g of dried yeast and 1 dm3 of deionised water. • The suspension was left at 20 °C for two hours. During this time the yeast became active. • After two hours the yeast culture was divided into two samples. • Sample A was provided with glucose and sample B was provided with maltose. • The apparatus shown in Fig. 1.1 was set up for each sample separately. tube filled with yeast large test-tube culture and sugar inverted small test-tube water Fig. 1.1 • As the yeast respired, gas collected at the top of the small test-tubes, as shown in Fig. 1.2. gas collected yeast culture and sugar water and yeast culture and sugar Fig. 1.2 The students used the apparatus to test the hypothesis: Yeast has a higher rate of respiration when supplied with glucose than when supplied with maltose. (a) (i) State the independent variable and the dependent variable in this investigation. independent variable ......................................................................................................... ........................................................................................................................................... dependent variable ............................................................................................................ ........................................................................................................................................... [2] (ii) The students stirred the yeast suspension before dividing it into the two samples. Explain why it is important to stir the suspension. ........................................................................................................................................... ........................................................................................................................................... ..................................................................................................................................... [1] (iii) Describe a method using the apparatus set up as shown in Fig. 1.1 that the students could use to test their hypothesis. Your method should be set out in a logical order and be detailed enough for another person to follow. You should not include details of how to make the yeast suspension or how to set up the apparatus. ........................................................................................................................................... ........................................................................................................................................... ........................................................................................................................................... ........................................................................................................................................... ........................................................................................................................................... ........................................................................................................................................... ........................................................................................................................................... ........................................................................................................................................... ........................................................................................................................................... ........................................................................................................................................... ........................................................................................................................................... ........................................................................................................................................... ........................................................................................................................................... ........................................................................................................................................... ........................................................................................................................................... ........................................................................................................................................... ........................................................................................................................................... ........................................................................................................................................... ........................................................................................................................................... ........................................................................................................................................... ........................................................................................................................................... ........................................................................................................................................... ........................................................................................................................................... ..................................................................................................................................... [7] Question 1 continues on page 6. (b) Other students used a gas syringe to measure the volume of gas produced when a suspension of yeast was supplied with glucose or maltose. Fig. 1.3 shows their results. 10 9 glucose 8 7 6 volume of 5gas / cm3 4 maltose 3 2 1 0 0 5 10 15 20 25 30 time / min Fig. 1.3 (i) State how the students could calculate the rate of respiration from the results shown in Fig. 1.3. ........................................................................................................................................... ........................................................................................................................................... ........................................................................................................................................... ..................................................................................................................................... [1] (ii) State and explain the conclusions that can be made for the results in Fig. 1.3. ........................................................................................................................................... ........................................................................................................................................... ........................................................................................................................................... ........................................................................................................................................... ........................................................................................................................................... ........................................................................................................................................... ..................................................................................................................................... [3] (c) When the students evaluated their method they thought that they could measure the change in pH in the yeast suspension as the gas produced by yeast is carbon dioxide. One student suggested using an indicator solution and colour chart. Another student suggested using a pH meter. Suggest the advantages of using a pH meter rather than an indicator solution and colour chart. ................................................................................................................................................... ................................................................................................................................................... ................................................................................................................................................... ................................................................................................................................................... ................................................................................................................................................... ................................................................................................................................................... ............................................................................................................................................. [3] [Total: 17]
Mark scheme: 1(a)(i) independent variable type of sugar or glucose / monosaccharide and maltose / disaccharide ; dependent variable height / length, of gas ; 1(a)(ii) to allow yeast / cells, to be evenly distributed ; 1 1(a)(iii) any seven from: 1 same / stated, concentration of glucose and maltose solutions ; 2 same / stated, volume of each sugar solution ; 3 same / stated, volume of yeast suspension (for each tube) / equally divide yeast suspension between (each tube) ; 4 same / stated, volume of water in each (large) tube ; 5 method of maintaining a constant temperature ; 6 maintaining a constant pH and use a buffer ; 7 measure / record, height of gas / liquid, in set time or measure / record, time taken, to reach a set height of gas / liquid ; 8 use of a ruler / AW for measuring gas / liquid ; 9 control, using killed yeast / replace yeast with water ; 10 repeat at least twice / three replicates, and finding mean (for at least one sugar) ; 11 low risk ; 7 Question Answer Marks 1(b)(i) any one from: divide the volume of gas collected in a stated time, by the (same) time ; 1÷ time to reach a stated volume of gas ; use a tangent to the line and divide volume by time / calculate gradient ; 1 1(b)(ii) any three from: 1 rate of respiration is higher for glucose (than maltose) / ora ; 2 initial rate of reaction / respiration faster ; 3 gas / CO2, production is higher with glucose / ora ; 4 maltose is broken down before it can be respired / glucose can be respired immediately ; 5 maltase / enzyme, needed to break down maltose ; 3 1(c) any three from: 1 not subjective / ora ; 2 more accurate / ora ; 3 more precise / ora ; 4 can continuously record data (with data logger / computer) ; 5 meter can be used if colour blind / ora ; 6 meter does not pose a risk or hazard / ora ; 3
Q2 · A gray tree frog, Dryophytes versicolor
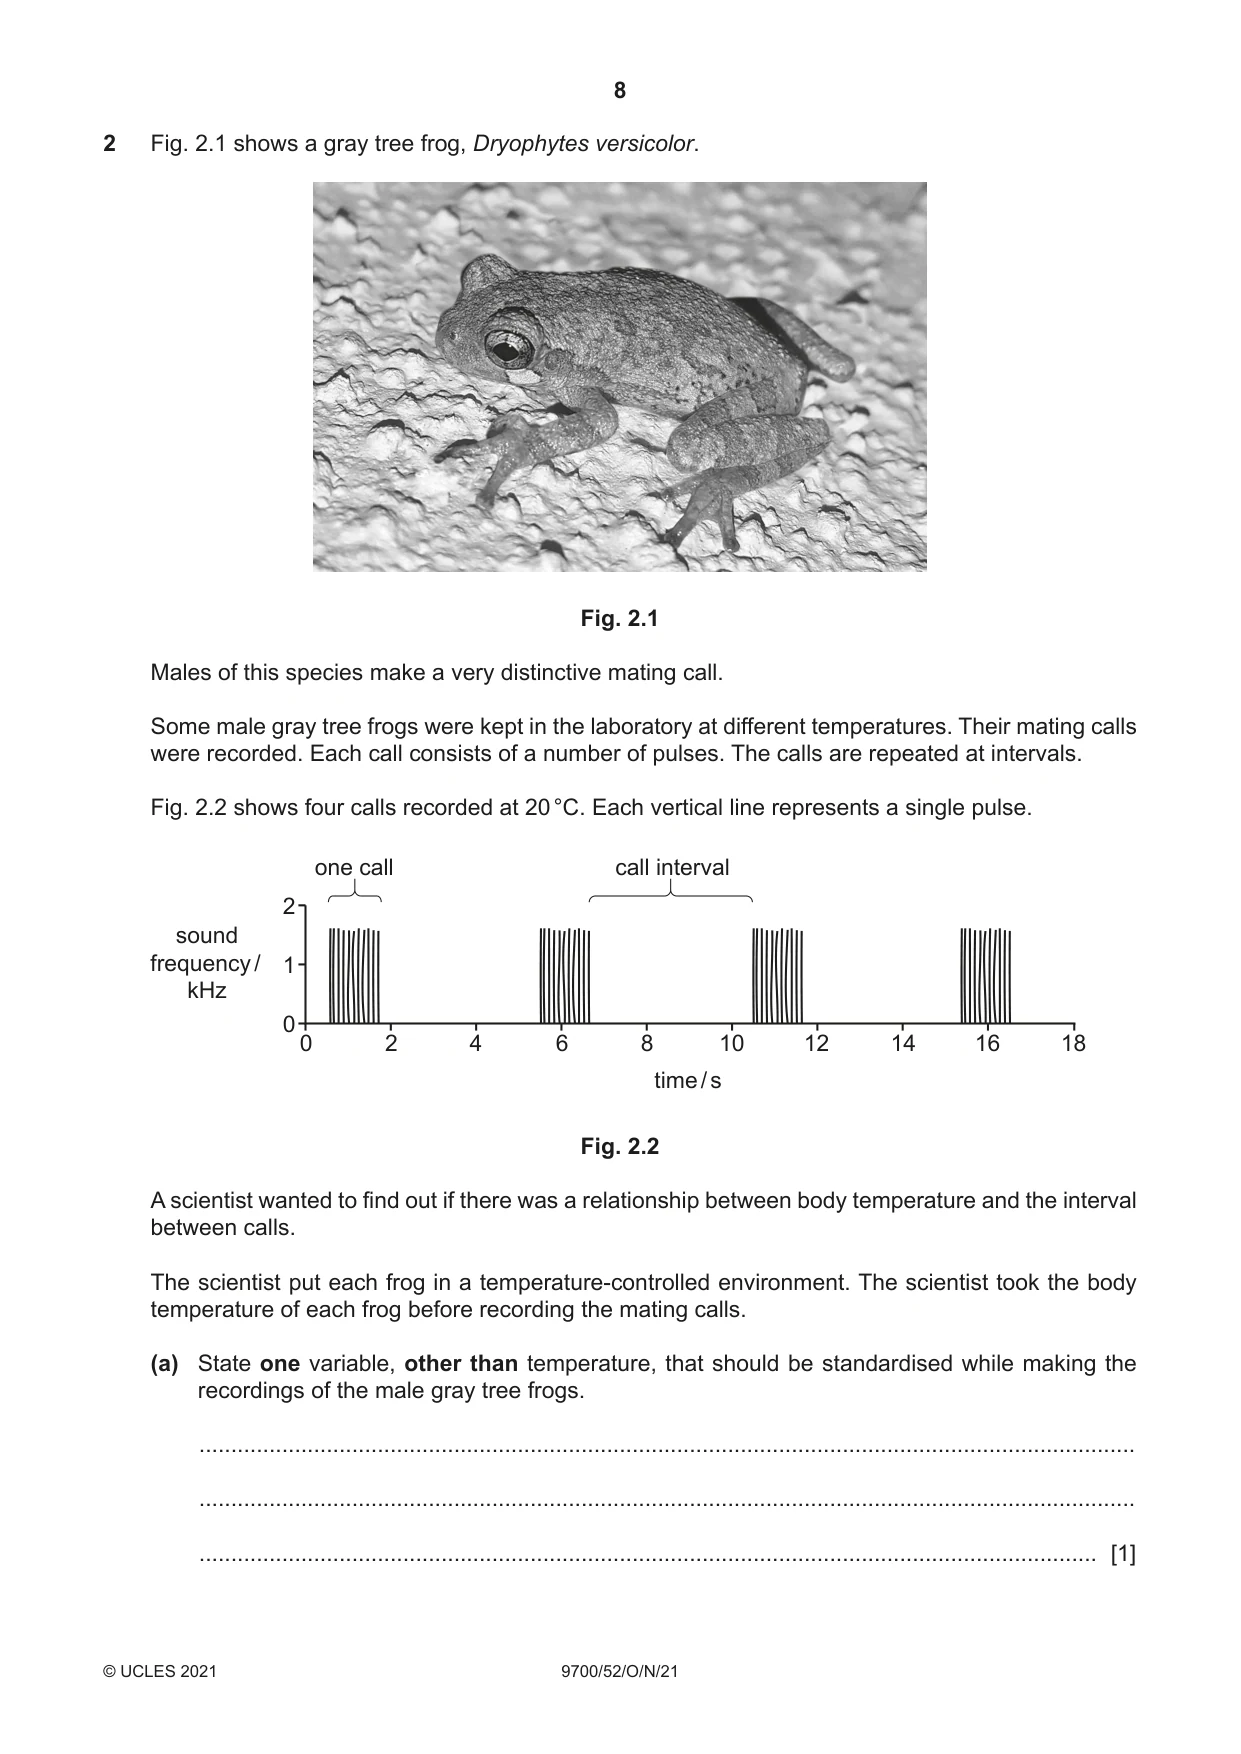
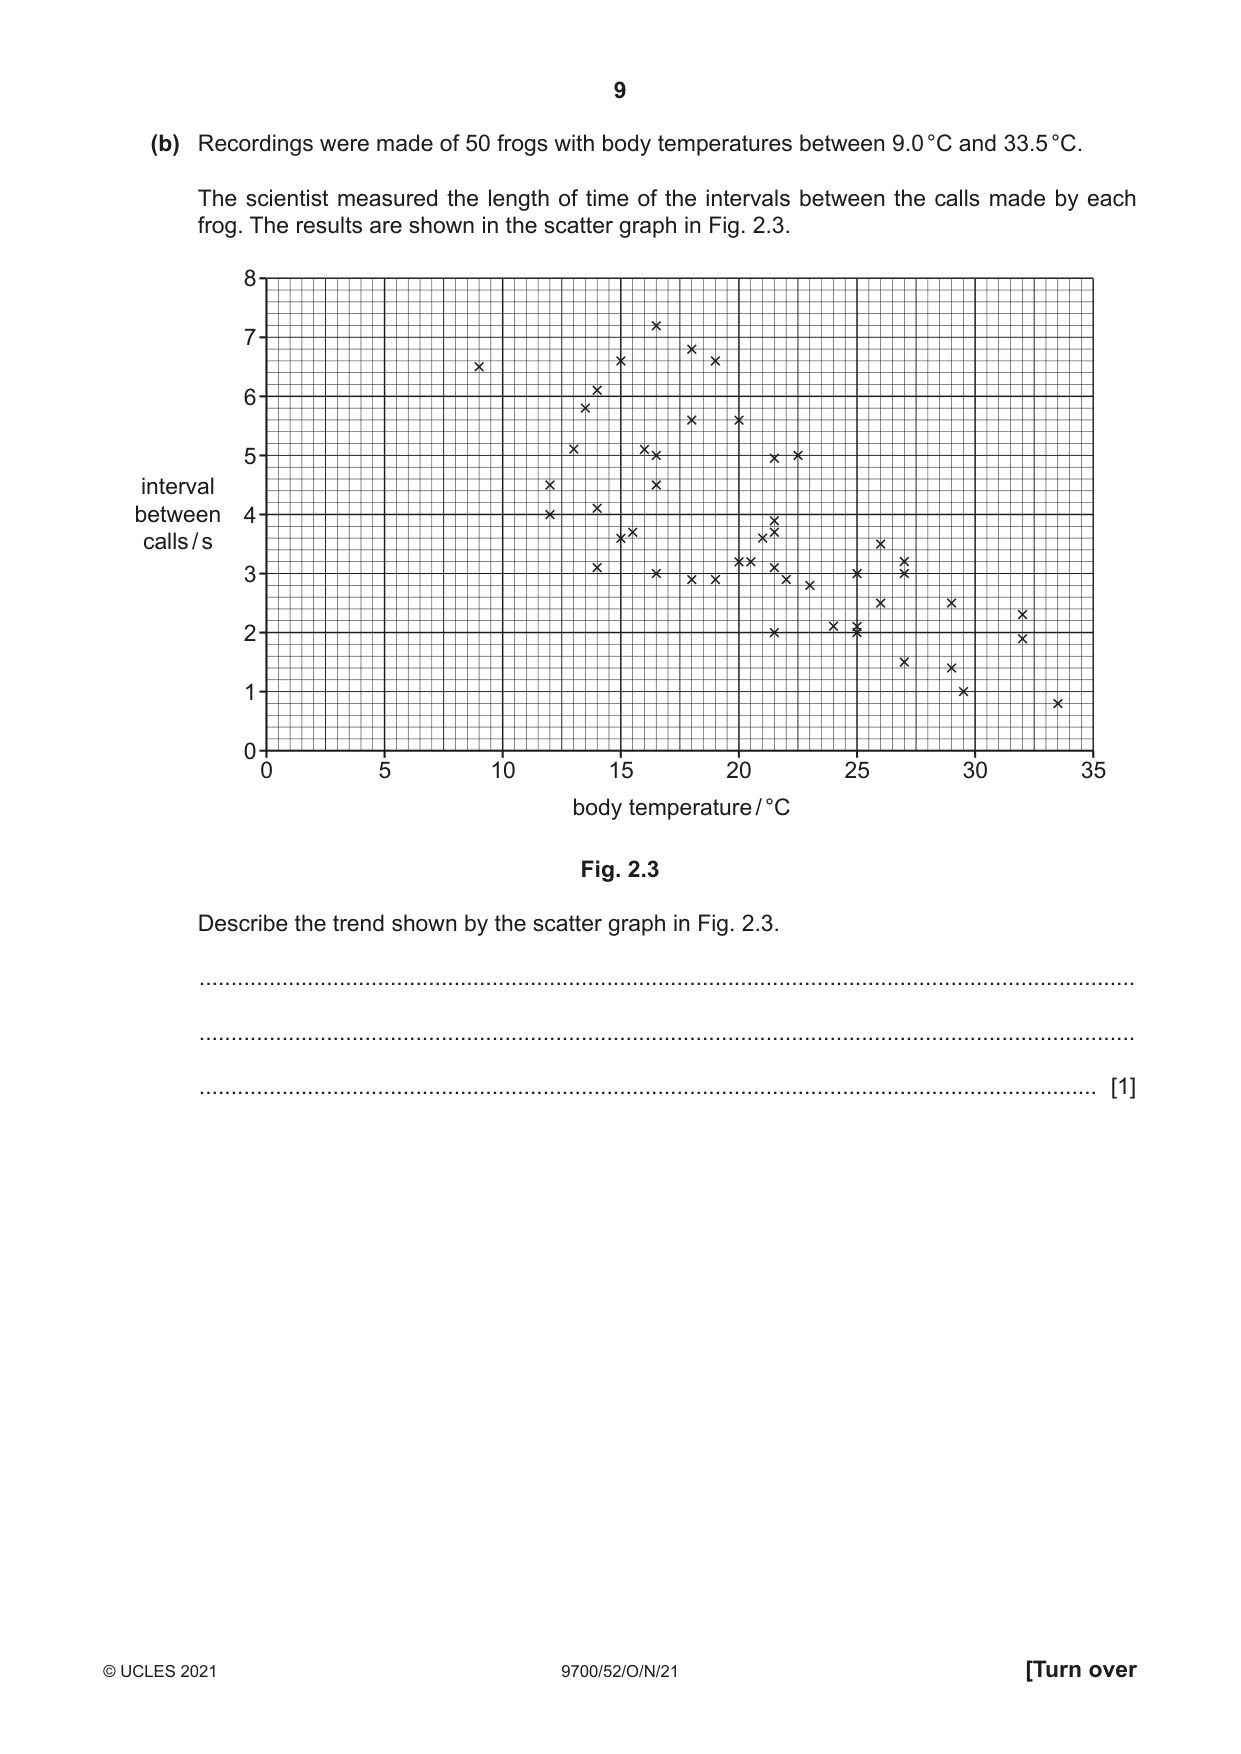
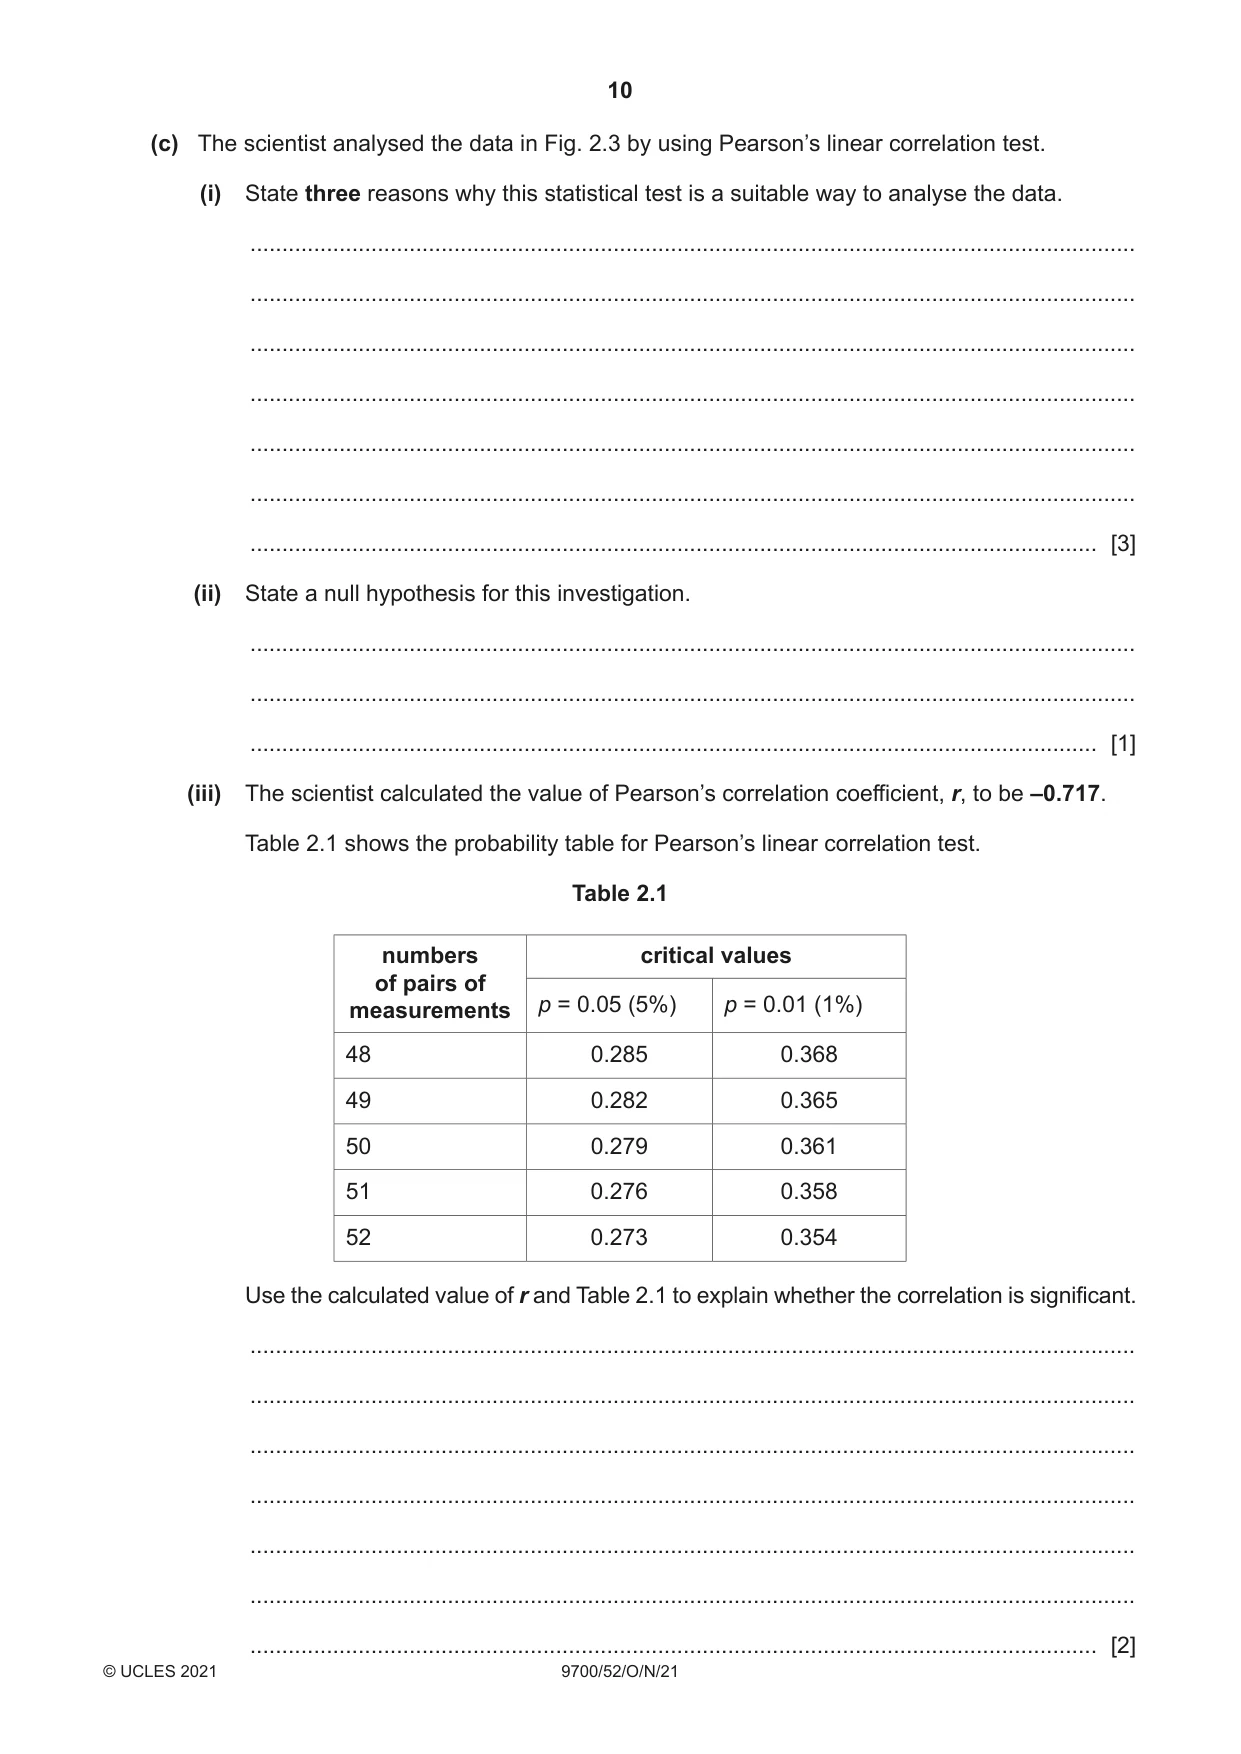
2 Fig. 2.1 shows a gray tree frog, Dryophytes versicolor. Fig. 2.1 Males of this species make a very distinctive mating call. Some male gray tree frogs were kept in the laboratory at different temperatures. Their mating calls were recorded. Each call consists of a number of pulses. The calls are repeated at intervals. Fig. 2.2 shows four calls recorded at 20 °C. Each vertical line represents a single pulse. one call call interval 2 sound frequency / 1 kHz 0 0 2 4 6 8 10 12 14 16 18 time / s Fig. 2.2 A scientist wanted to find out if there was a relationship between body temperature and the interval between calls. The scientist put each frog in a temperature-controlled environment. The scientist took the body temperature of each frog before recording the mating calls. (a) State one variable, other than temperature, that should be standardised while making the recordings of the male gray tree frogs. ................................................................................................................................................... ................................................................................................................................................... ............................................................................................................................................. [1] (b) Recordings were made of 50 frogs with body temperatures between 9.0 °C and 33.5 °C. The scientist measured the length of time of the intervals between the calls made by each frog. The results are shown in the scatter graph in Fig. 2.3. 8 7 6 5 interval between 4 calls / s 3 2 1 0 0 5 10 15 20 25 30 35 body temperature / °C Fig. 2.3 Describe the trend shown by the scatter graph in Fig. 2.3. ................................................................................................................................................... ................................................................................................................................................... ............................................................................................................................................. [1] (c) The scientist analysed the data in Fig. 2.3 by using Pearson’s linear correlation test. (i) State three reasons why this statistical test is a suitable way to analyse the data. ........................................................................................................................................... ........................................................................................................................................... ........................................................................................................................................... ........................................................................................................................................... ........................................................................................................................................... ........................................................................................................................................... ..................................................................................................................................... [3] (ii) State a null hypothesis for this investigation. ........................................................................................................................................... ........................................................................................................................................... ..................................................................................................................................... [1] (iii) The scientist calculated the value of Pearson’s correlation coefficient, r, to be –0.717. Table 2.1 shows the probability table for Pearson’s linear correlation test. Table 2.1 numbers critical values of pairs of measurements p = 0.05 (5%) p = 0.01 (1%) 48 0.285 0.368 49 0.282 0.365 50 0.279 0.361 51 0.276 0.358 52 0.273 0.354 Use the calculated value of r and Table 2.1 to explain whether the correlation is significant. ........................................................................................................................................... ........................................................................................................................................... ........................................................................................................................................... ........................................................................................................................................... ........................................................................................................................................... ...........................................................................................................................................
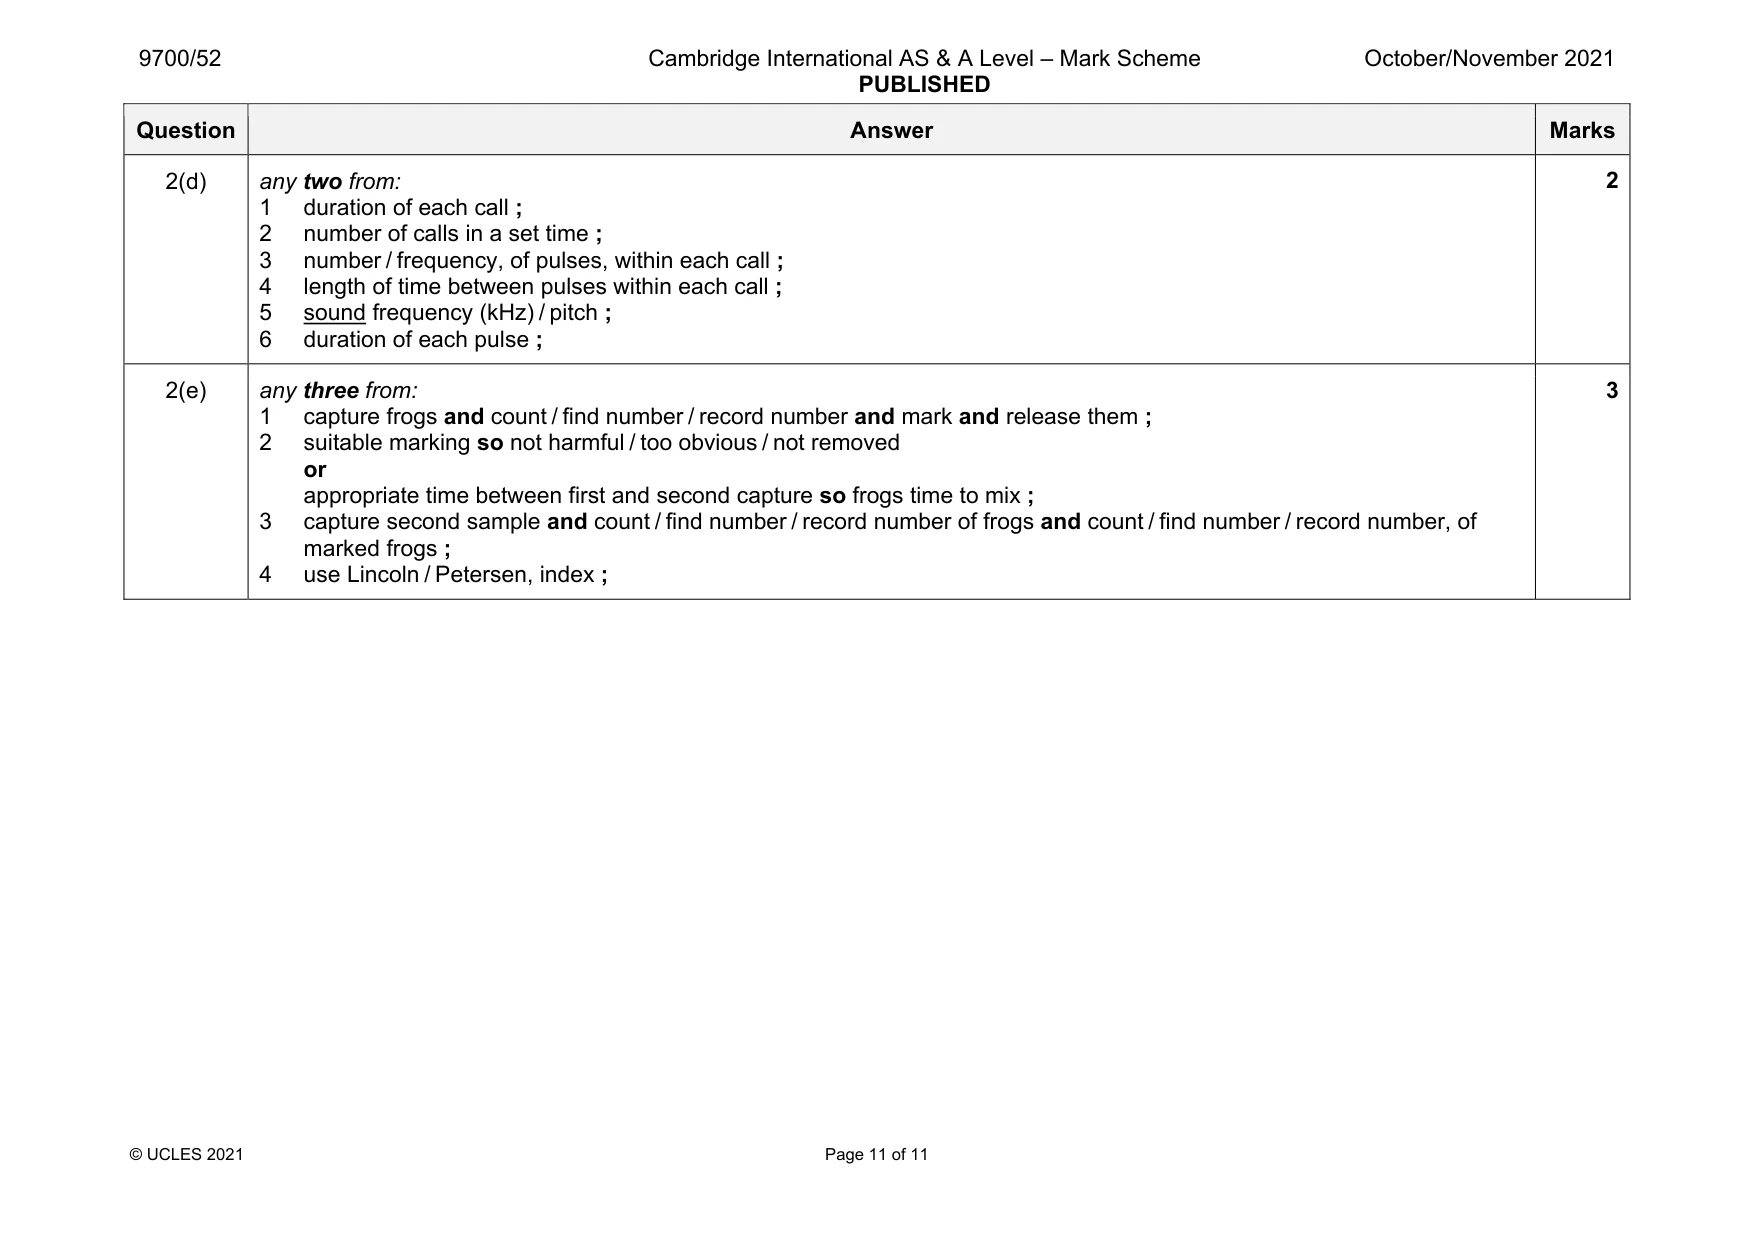
Mark scheme: 2(a) any one from: frog, age / size / mass / stage of maturity / from same population ; light intensity ; humidity ; time of day ; time of year ; duration of recording ; background noise ; 2(b) as (body) temperature increases the interval between calls decreases ; 1 2(c)(i) any three from: 1 data (for temperature and calls) is, paired / linked ; 2 data is continuous ; 3 data shows normal distribution ; 4 scatter diagram, suggests a linear, relationship / correlation ; 5 there are at least five (paired) observations ; 3 2(c)(ii) there is no, correlation / relationship, between the intervals between calls and temperature ; 1 2(c)(iii) any two from: significant because 1 (critical value for p = 0.05 / 5% is) 0.279 or (critical value for p = 0.01 / 1% is) 0.361 ; 2 value for r / 0.717, is > than critical value (so null hypothesis is rejected / accept the alternative hypothesis) / ora ; 2 Question Answer Marks 2(d) any two from: 1 duration of each call ; 2 number of calls in a set time ; 3 number / frequency, of pulses, within each call ; 4 length of time between pulses within each call ; 5 sound frequency (kHz) / pitch ; 6 duration of each pulse ; 2 2(e) any three from: 1 capture frogs and count / find number / record number and mark and release them ; 2 suitable marking so not harmful / too obvious / not removed or appropriate time between first and second capture so frogs time to mix ; 3 capture second sample and count / find number / record number of frogs and count / find number / record number, of marked frogs ; 4 use Lincoln / Petersen, index ; 3
What was in this paper
The subtopics covered by these 2 questions, and how many questions each got. Open one in a new tab to see every Cambridge question on it.
What you needed in this session
Cambridge’s own grade thresholds for 2021 Oct/Nov, Paper 5 · Variant 2. A higher threshold means an easier paper — the bar moves with how the cohort did.