Cambridge A Level Biology 9700 — 2021 Oct/Nov Paper 5 · Variant 3
9700/53/O/N/21 · 2 questions · 30 marks · ≈34 min
The question paper and its mark scheme, free to read here and free to download. This is Cambridge’s own paper, exactly as it was sat.
Question paper12 pages
Mark scheme11 pages
Answers below. Sit the paper first if you are practising.
Questions as text
Q1 · Baker’s yeast, Saccharomyces cerevisiae, has two metabolic pathways for the production of…
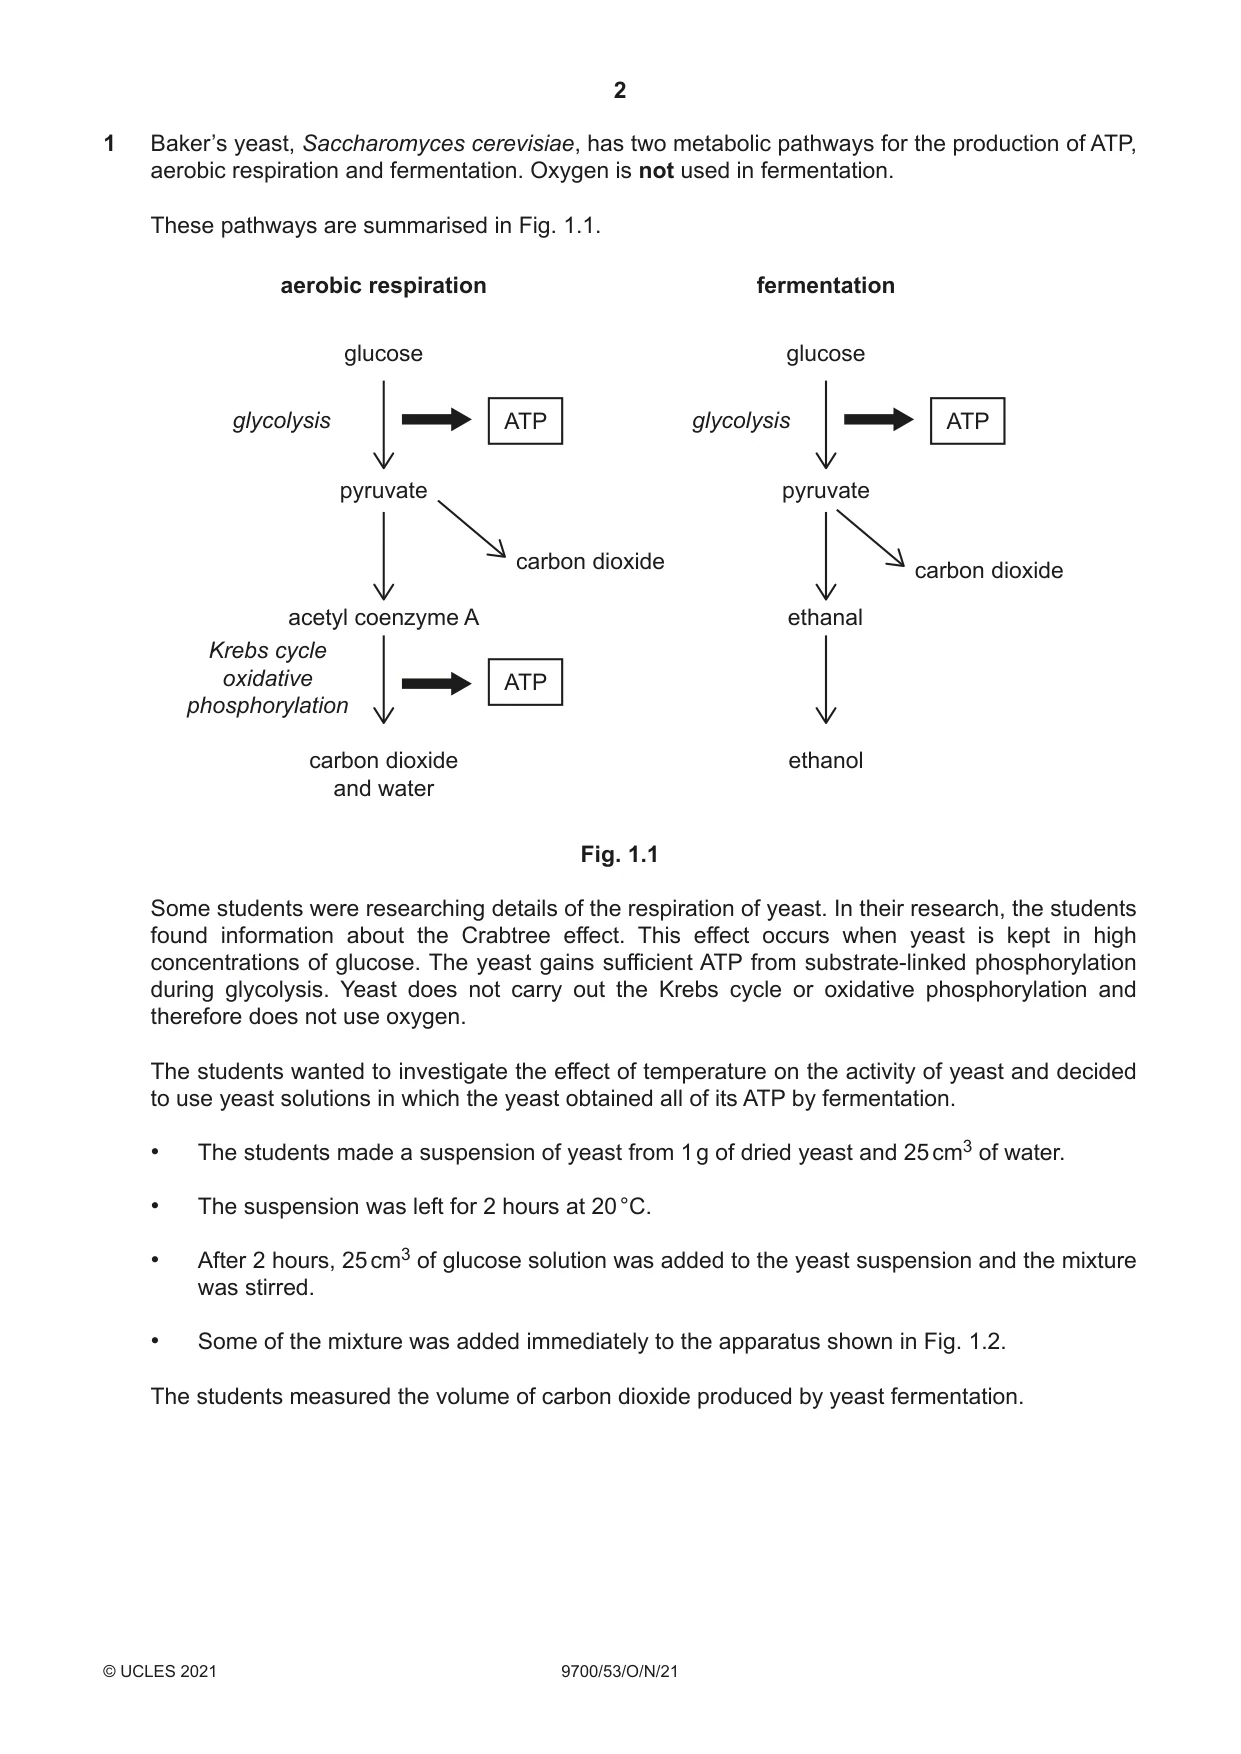
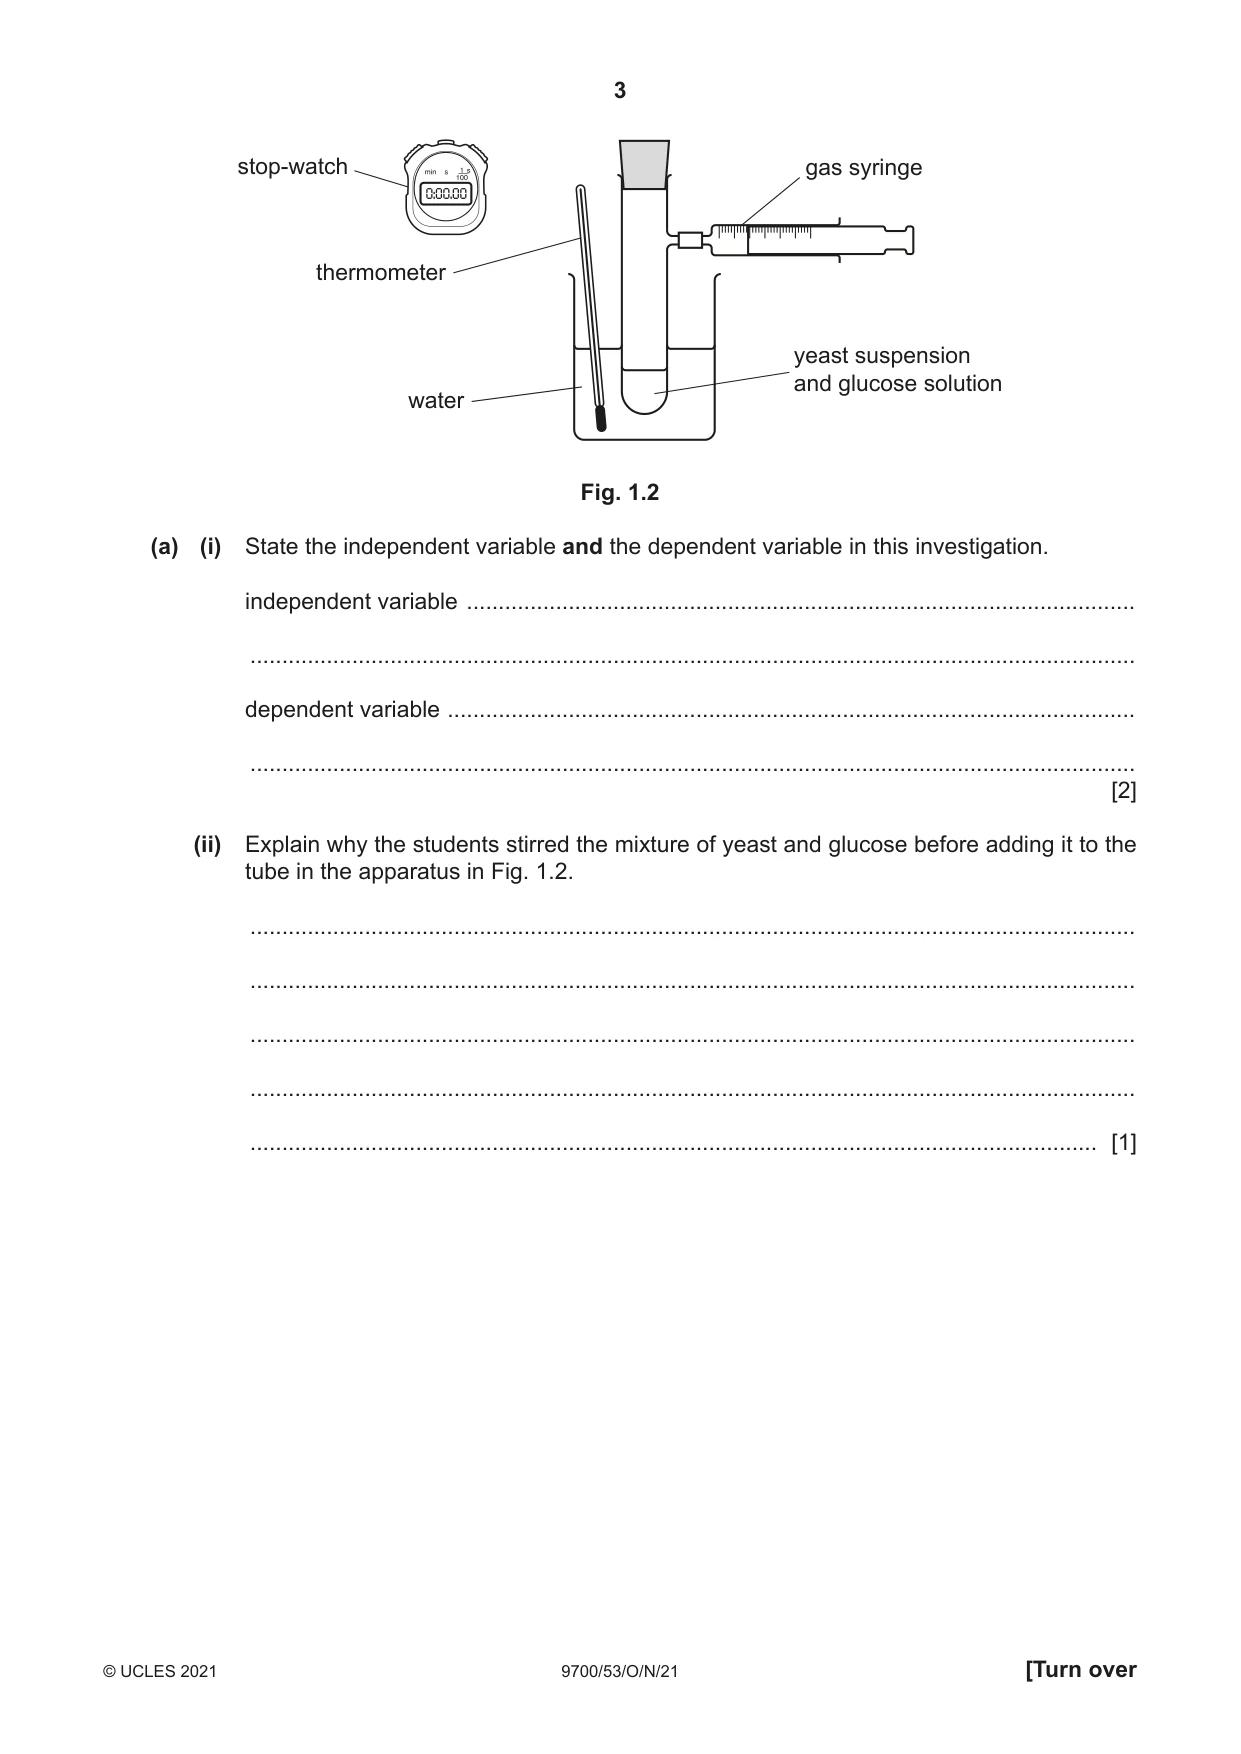
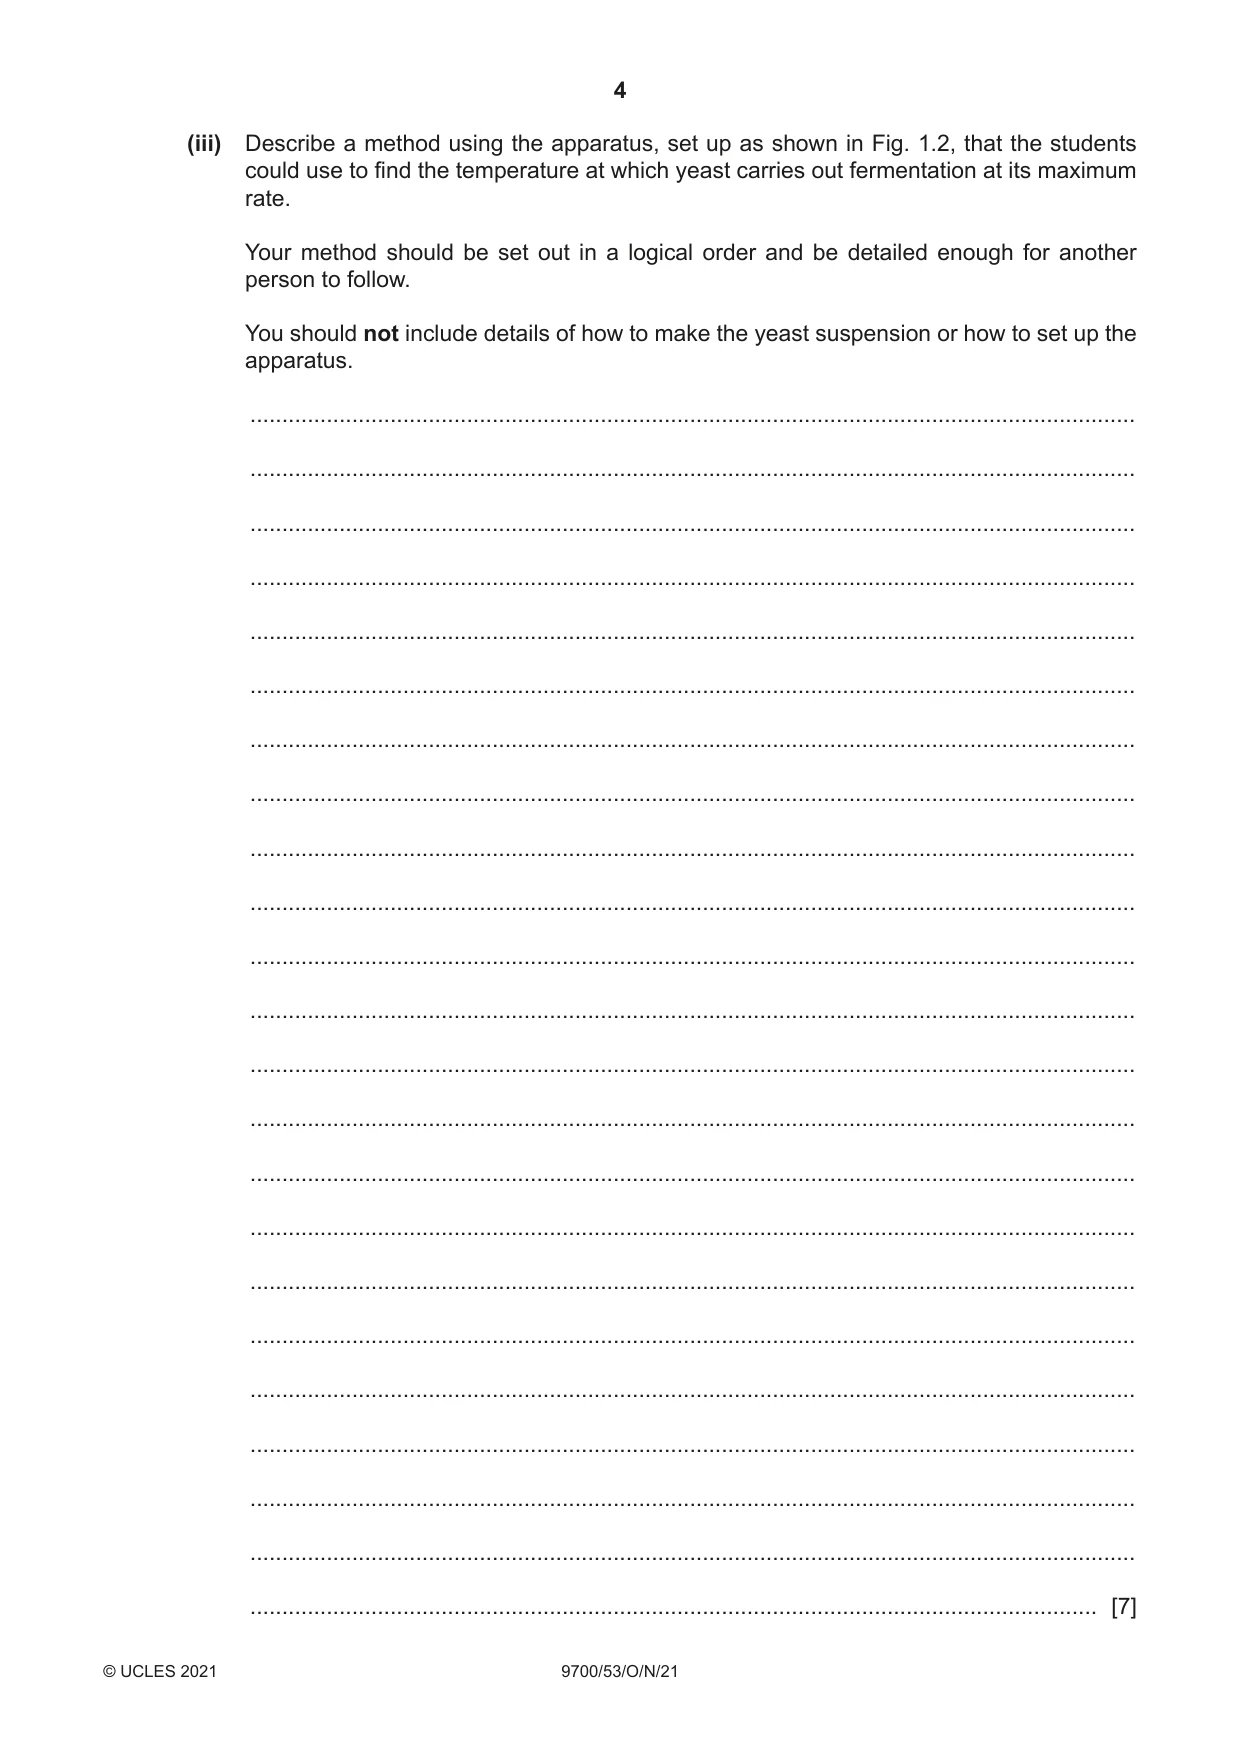
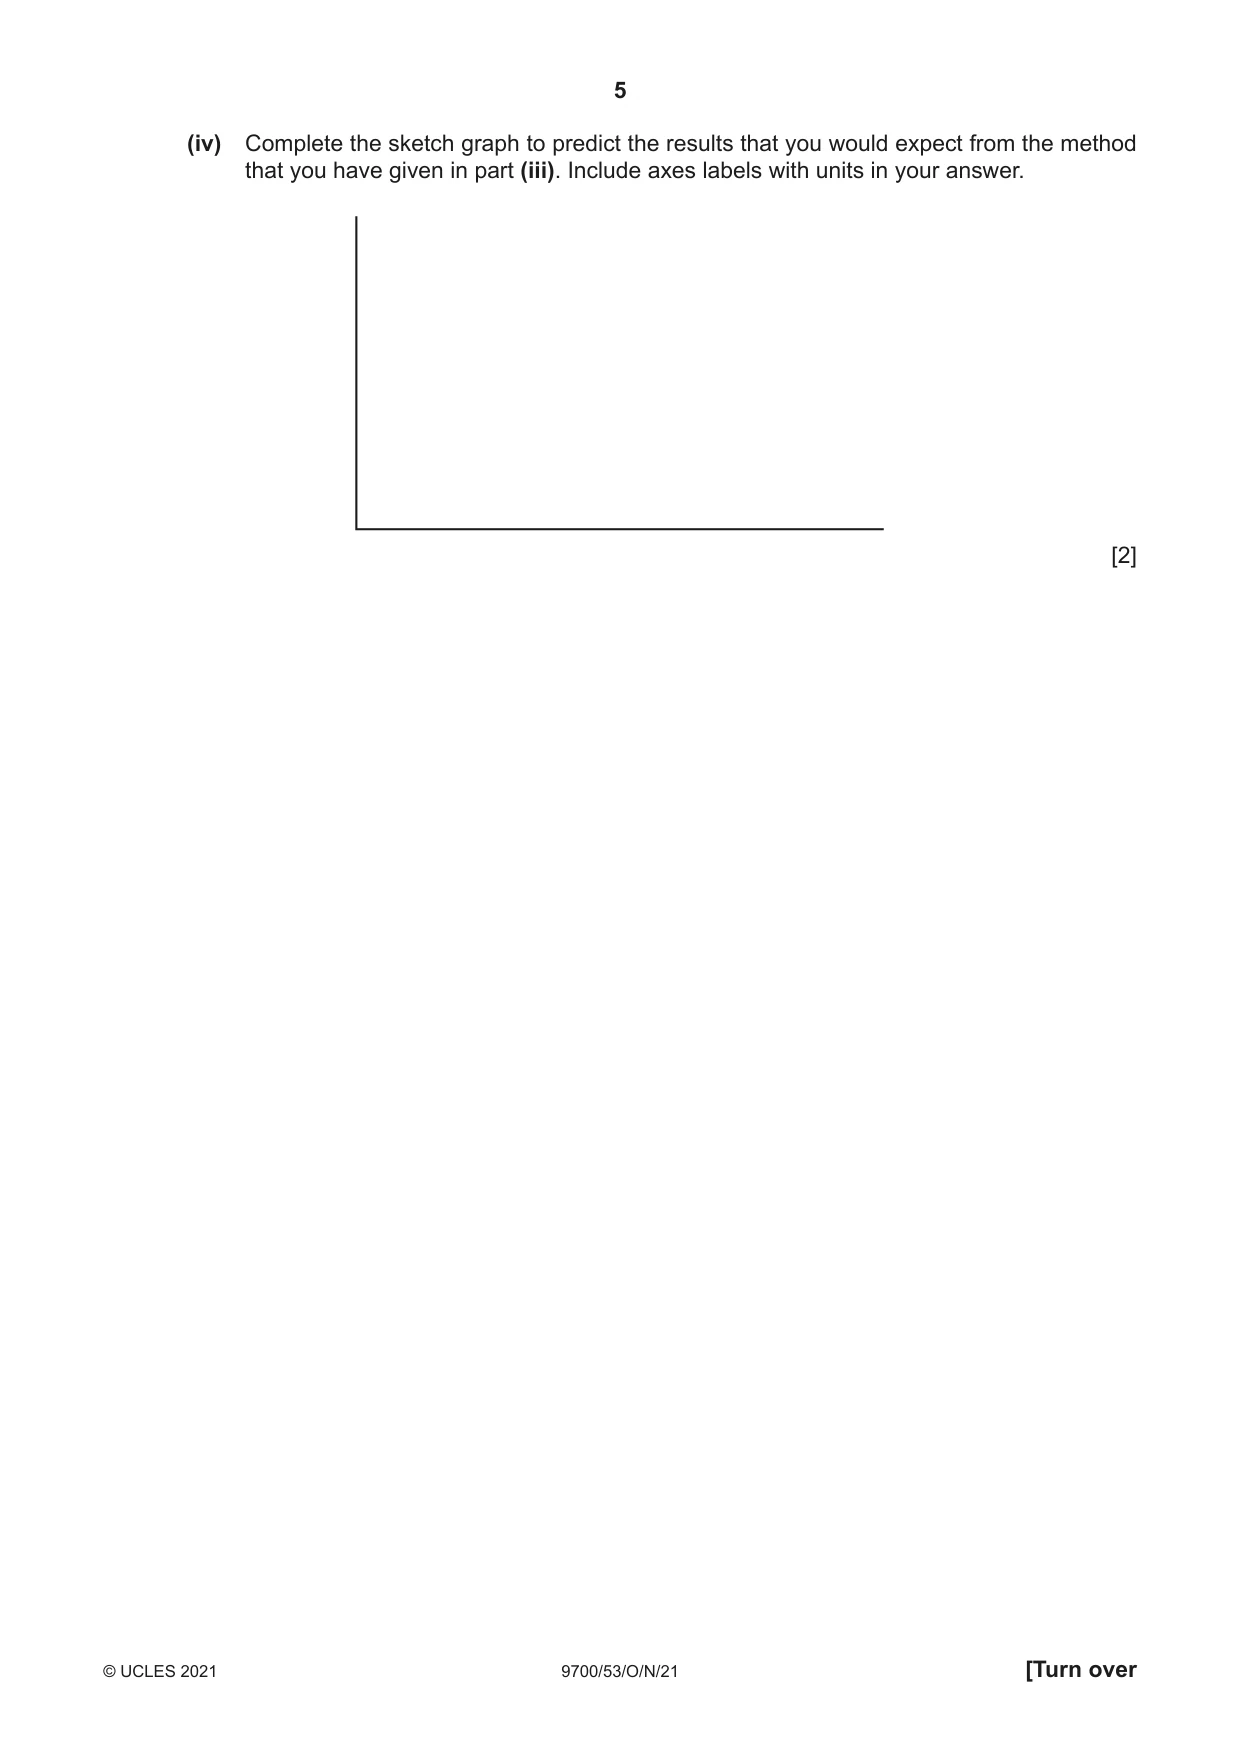
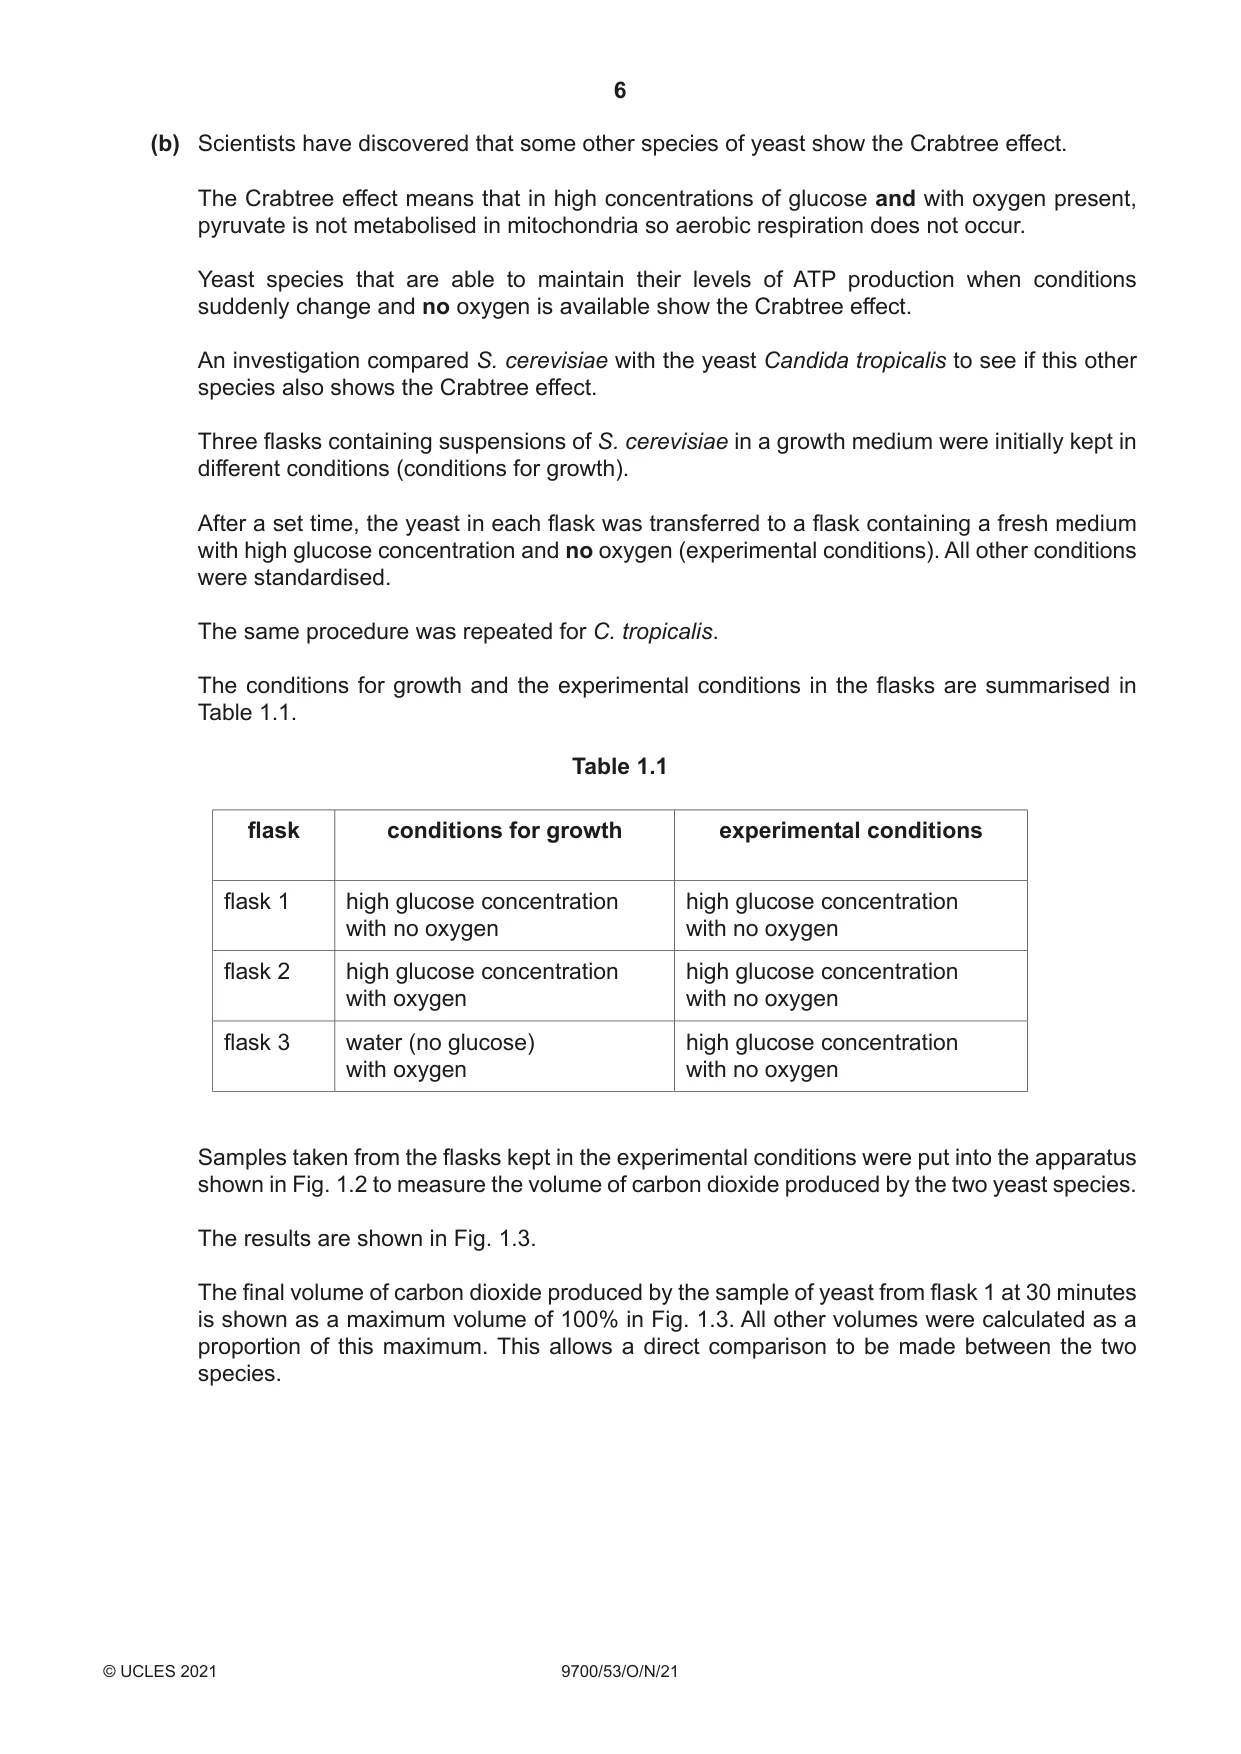
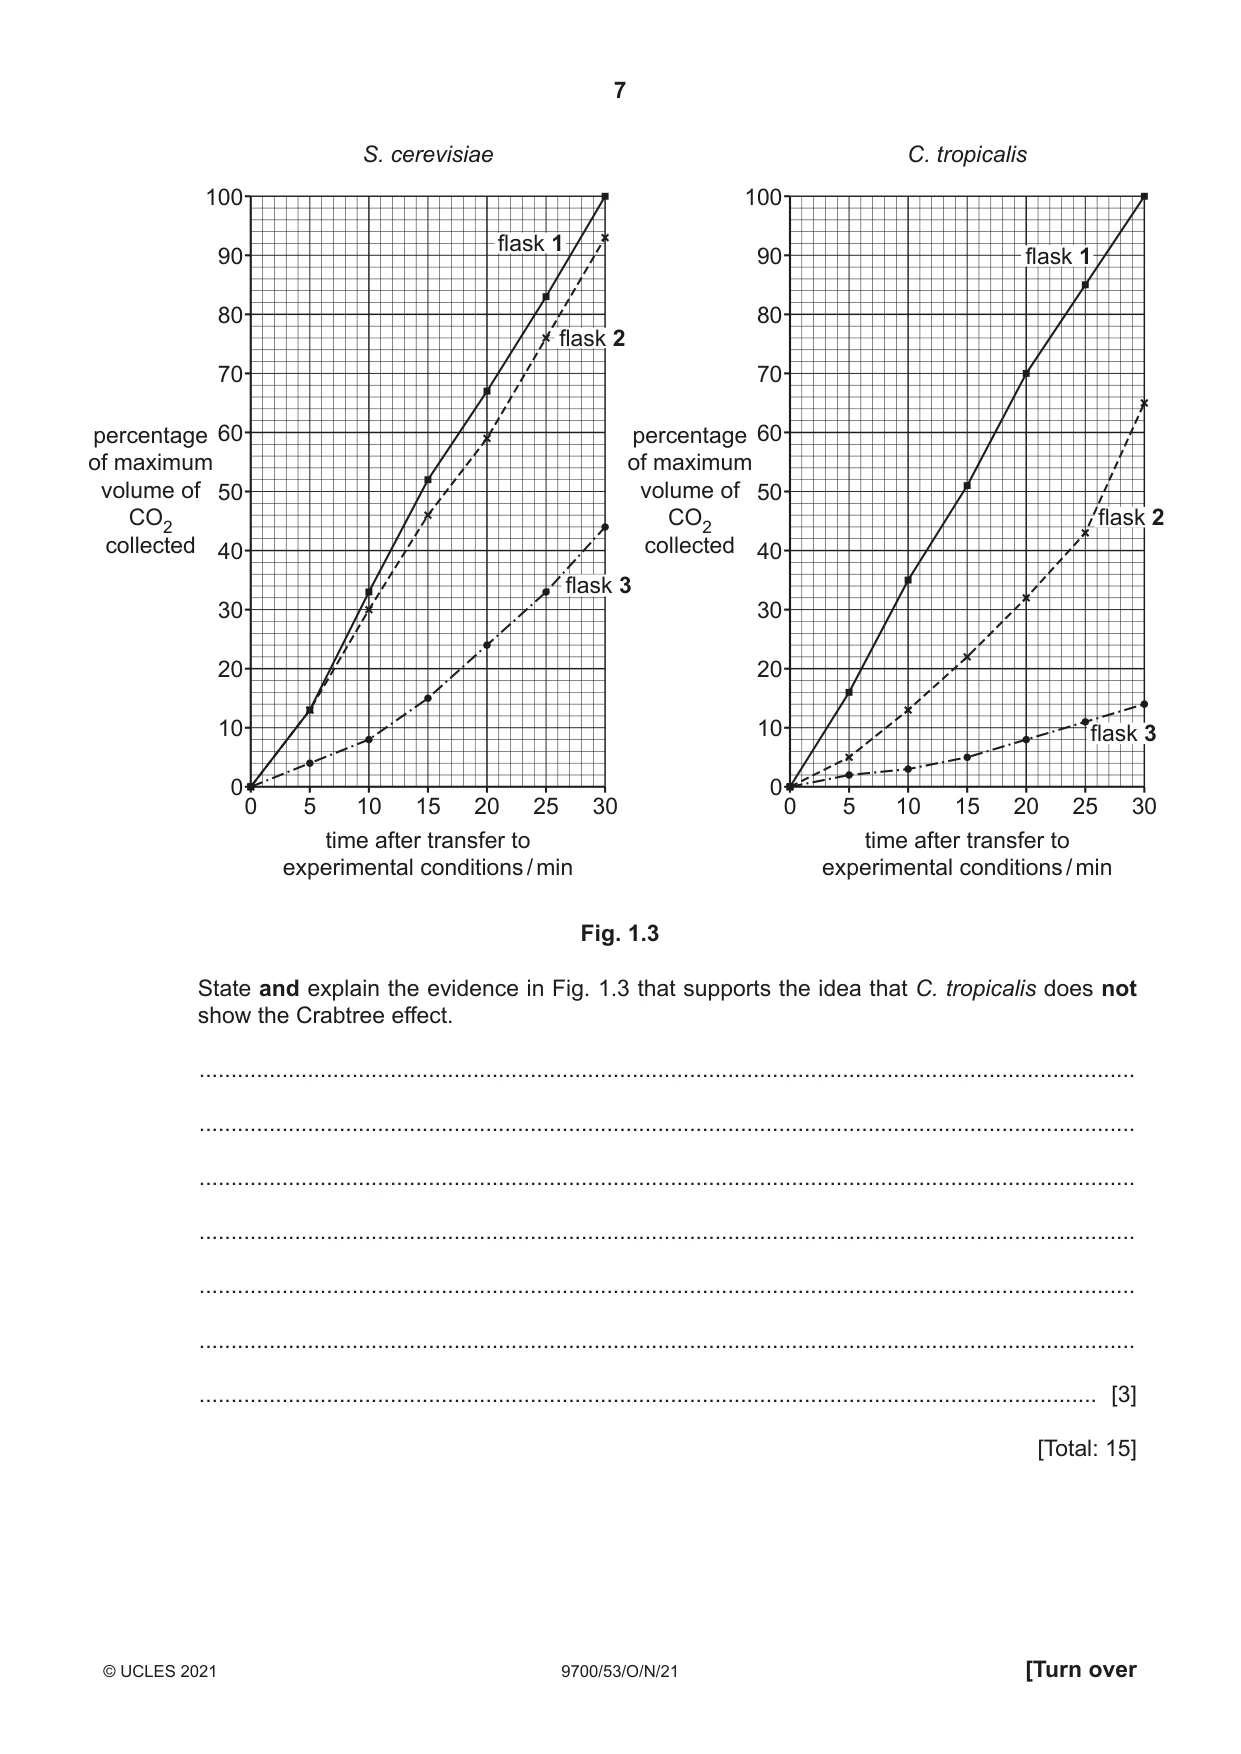
1 Baker’s yeast, Saccharomyces cerevisiae, has two metabolic pathways for the production of ATP, aerobic respiration and fermentation. Oxygen is not used in fermentation. These pathways are summarised in Fig. 1.1. aerobic respiration fermentation glucose glucose glycolysis ATP glycolysis ATP pyruvate pyruvate carbon dioxide carbon dioxide acetyl coenzyme A ethanal Krebs cycle oxidative ATP phosphorylation carbon dioxide ethanol and water Fig. 1.1 Some students were researching details of the respiration of yeast. In their research, the students found information about the Crabtree effect. This effect occurs when yeast is kept in high concentrations of glucose. The yeast gains sufficient ATP from substrate-linked phosphorylation during glycolysis. Yeast does not carry out the Krebs cycle or oxidative phosphorylation and therefore does not use oxygen. The students wanted to investigate the effect of temperature on the activity of yeast and decided to use yeast solutions in which the yeast obtained all of its ATP by fermentation. • The students made a suspension of yeast from 1 g of dried yeast and 25 cm3 of water. • The suspension was left for 2 hours at 20 °C. • After 2 hours, 25 cm3 of glucose solution was added to the yeast suspension and the mixture was stirred. • Some of the mixture was added immediately to the apparatus shown in Fig. 1.2. The students measured the volume of carbon dioxide produced by yeast fermentation. stop-watch gas syringe thermometer yeast suspension and glucose solution water Fig. 1.2 (a) (i) State the independent variable and the dependent variable in this investigation. independent variable ......................................................................................................... ........................................................................................................................................... dependent variable ............................................................................................................ ........................................................................................................................................... [2] (ii) Explain why the students stirred the mixture of yeast and glucose before adding it to the tube in the apparatus in Fig. 1.2. ........................................................................................................................................... ........................................................................................................................................... ........................................................................................................................................... ........................................................................................................................................... ..................................................................................................................................... [1] (iii) Describe a method using the apparatus, set up as shown in Fig. 1.2, that the students could use to find the temperature at which yeast carries out fermentation at its maximum rate. Your method should be set out in a logical order and be detailed enough for another person to follow. You should not include details of how to make the yeast suspension or how to set up the apparatus. ........................................................................................................................................... ........................................................................................................................................... ........................................................................................................................................... ........................................................................................................................................... ........................................................................................................................................... ........................................................................................................................................... ........................................................................................................................................... ........................................................................................................................................... ........................................................................................................................................... ........................................................................................................................................... ........................................................................................................................................... ........................................................................................................................................... ........................................................................................................................................... ........................................................................................................................................... ........................................................................................................................................... ........................................................................................................................................... ........................................................................................................................................... ........................................................................................................................................... ........................................................................................................................................... ........................................................................................................................................... ........................................................................................................................................... ........................................................................................................................................... ..................................................................................................................................... [7] (iv) Complete the sketch graph to predict the results that you would expect from the method that you have given in part (iii). Include axes labels with units in your answer. [2] (b) Scientists have discovered that some other species of yeast show the Crabtree effect. The Crabtree effect means that in high concentrations of glucose and with oxygen present, pyruvate is not metabolised in mitochondria so aerobic respiration does not occur. Yeast species that are able to maintain their levels of ATP production when conditions suddenly change and no oxygen is available show the Crabtree effect. An investigation compared S. cerevisiae with the yeast Candida tropicalis to see if this other species also shows the Crabtree effect. Three flasks containing suspensions of S. cerevisiae in a growth medium were initially kept in different conditions (conditions for growth). After a set time, the yeast in each flask was transferred to a flask containing a fresh medium with high glucose concentration and no oxygen (experimental conditions). All other conditions were standardised. The same procedure was repeated for C. tropicalis. The conditions for growth and the experimental conditions in the flasks are summarised in Table 1.1. Table 1.1 flask conditions for growth experimental conditions flask 1 high glucose concentration high glucose concentration with no oxygen with no oxygen flask 2 high glucose concentration high glucose concentration with oxygen with no oxygen flask 3 water (no glucose) high glucose concentration with oxygen with no oxygen Samples taken from the flasks kept in the experimental conditions were put into the apparatus shown in Fig. 1.2 to measure the volume of carbon dioxide produced by the two yeast species. The results are shown in Fig. 1.3. The final volume of carbon dioxide produced by the sample of yeast from flask 1 at 30 minutes is shown as a maximum volume of 100% in Fig. 1.3. All other volumes were calculated as a proportion of this maximum. This allows a direct comparison to be made between the two species. S. cerevisiae C. tropicalis 100 100 flask 1 90 90 flask 1 80 80 flask 2 70 70 percentage 60 percentage 60 of maximum of maximum volume of 50 volume of 50 CO2 CO2 flask 2 collected 40 collected 40 flask 3 30 30 20 20 10 10 flask 3 0 0 0 5 10 15 20 25 30 0 5 10 15 20 25 30 time after transfer to time after transfer to experimental conditions / min experimental conditions / min Fig. 1.3 State and explain the evidence in Fig. 1.3 that supports the idea that C. tropicalis does not show the Crabtree effect. ................................................................................................................................................... ................................................................................................................................................... ................................................................................................................................................... ................................................................................................................................................... ................................................................................................................................................... ................................................................................................................................................... ............................................................................................................................................. [3] [Total: 15]
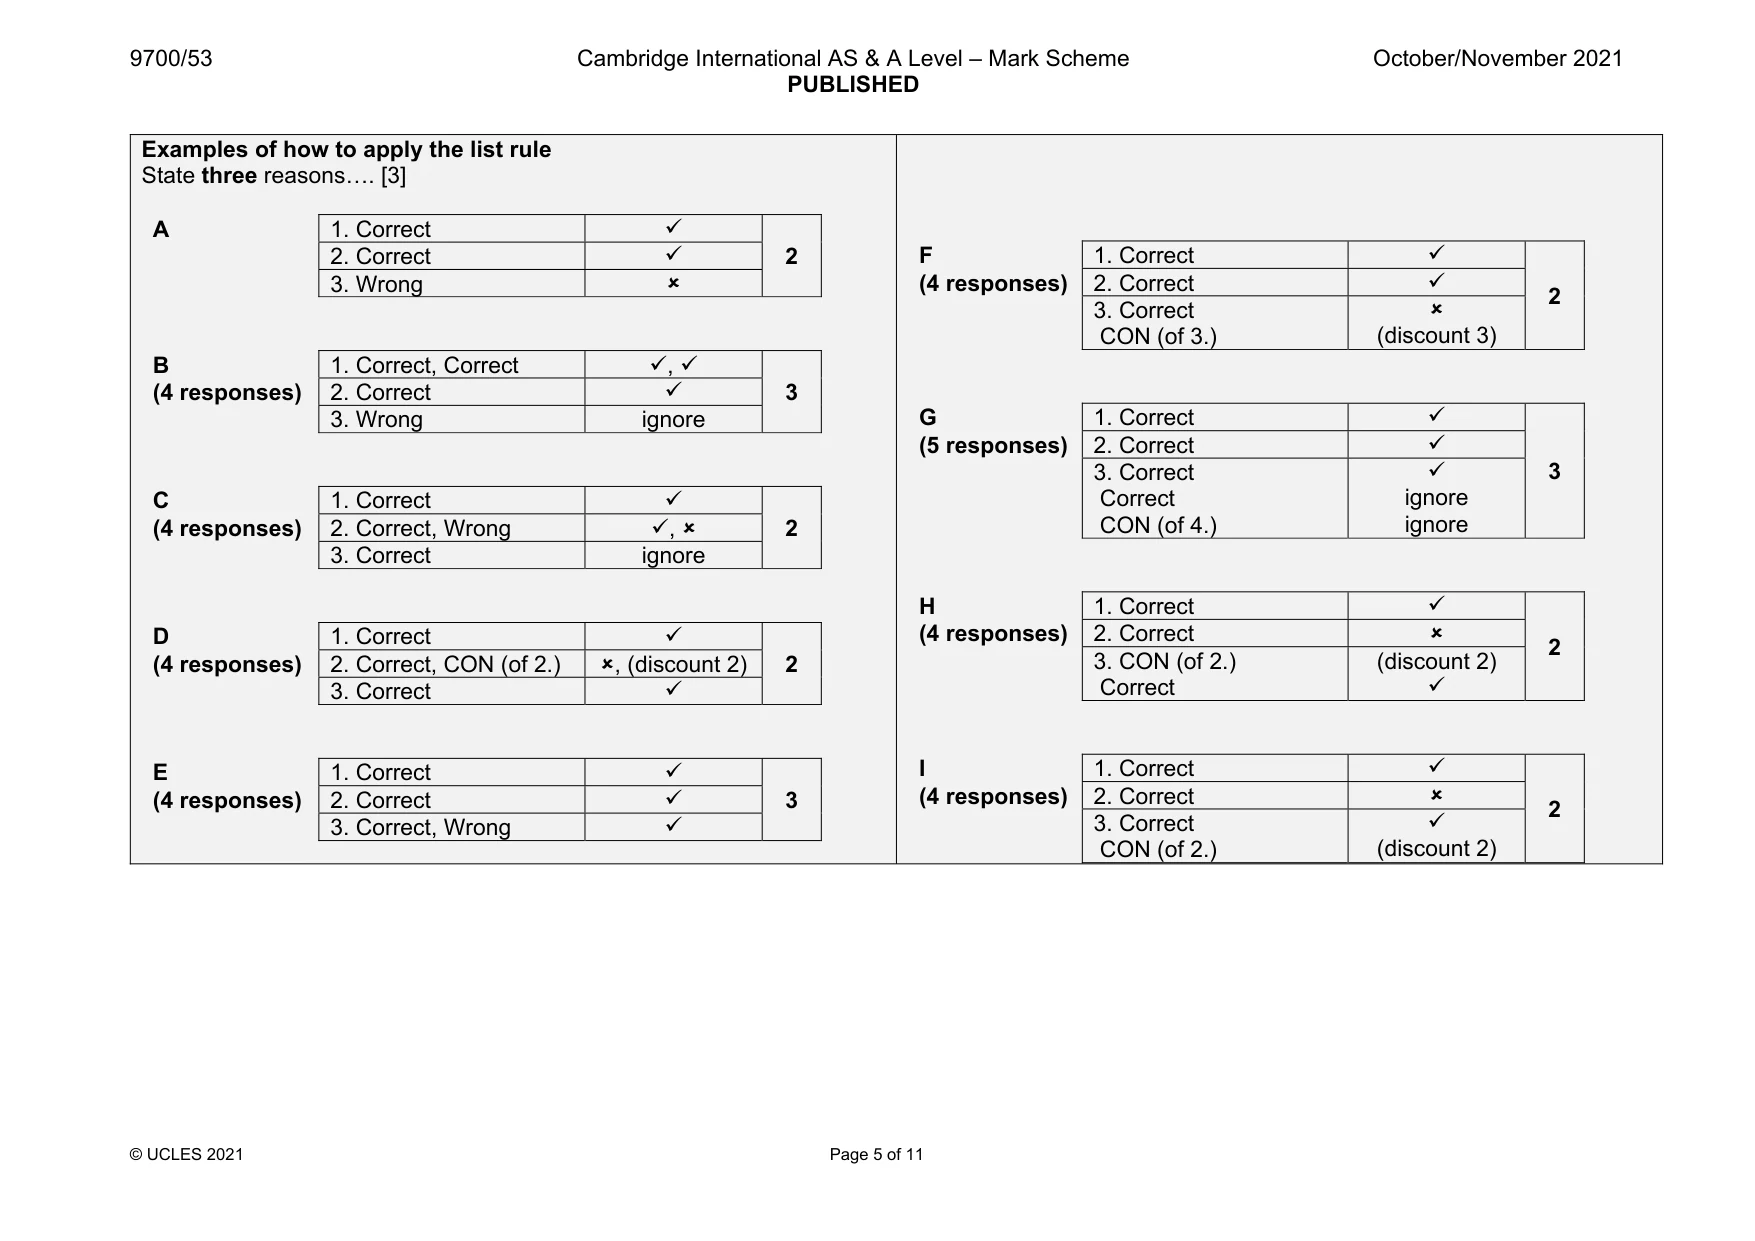
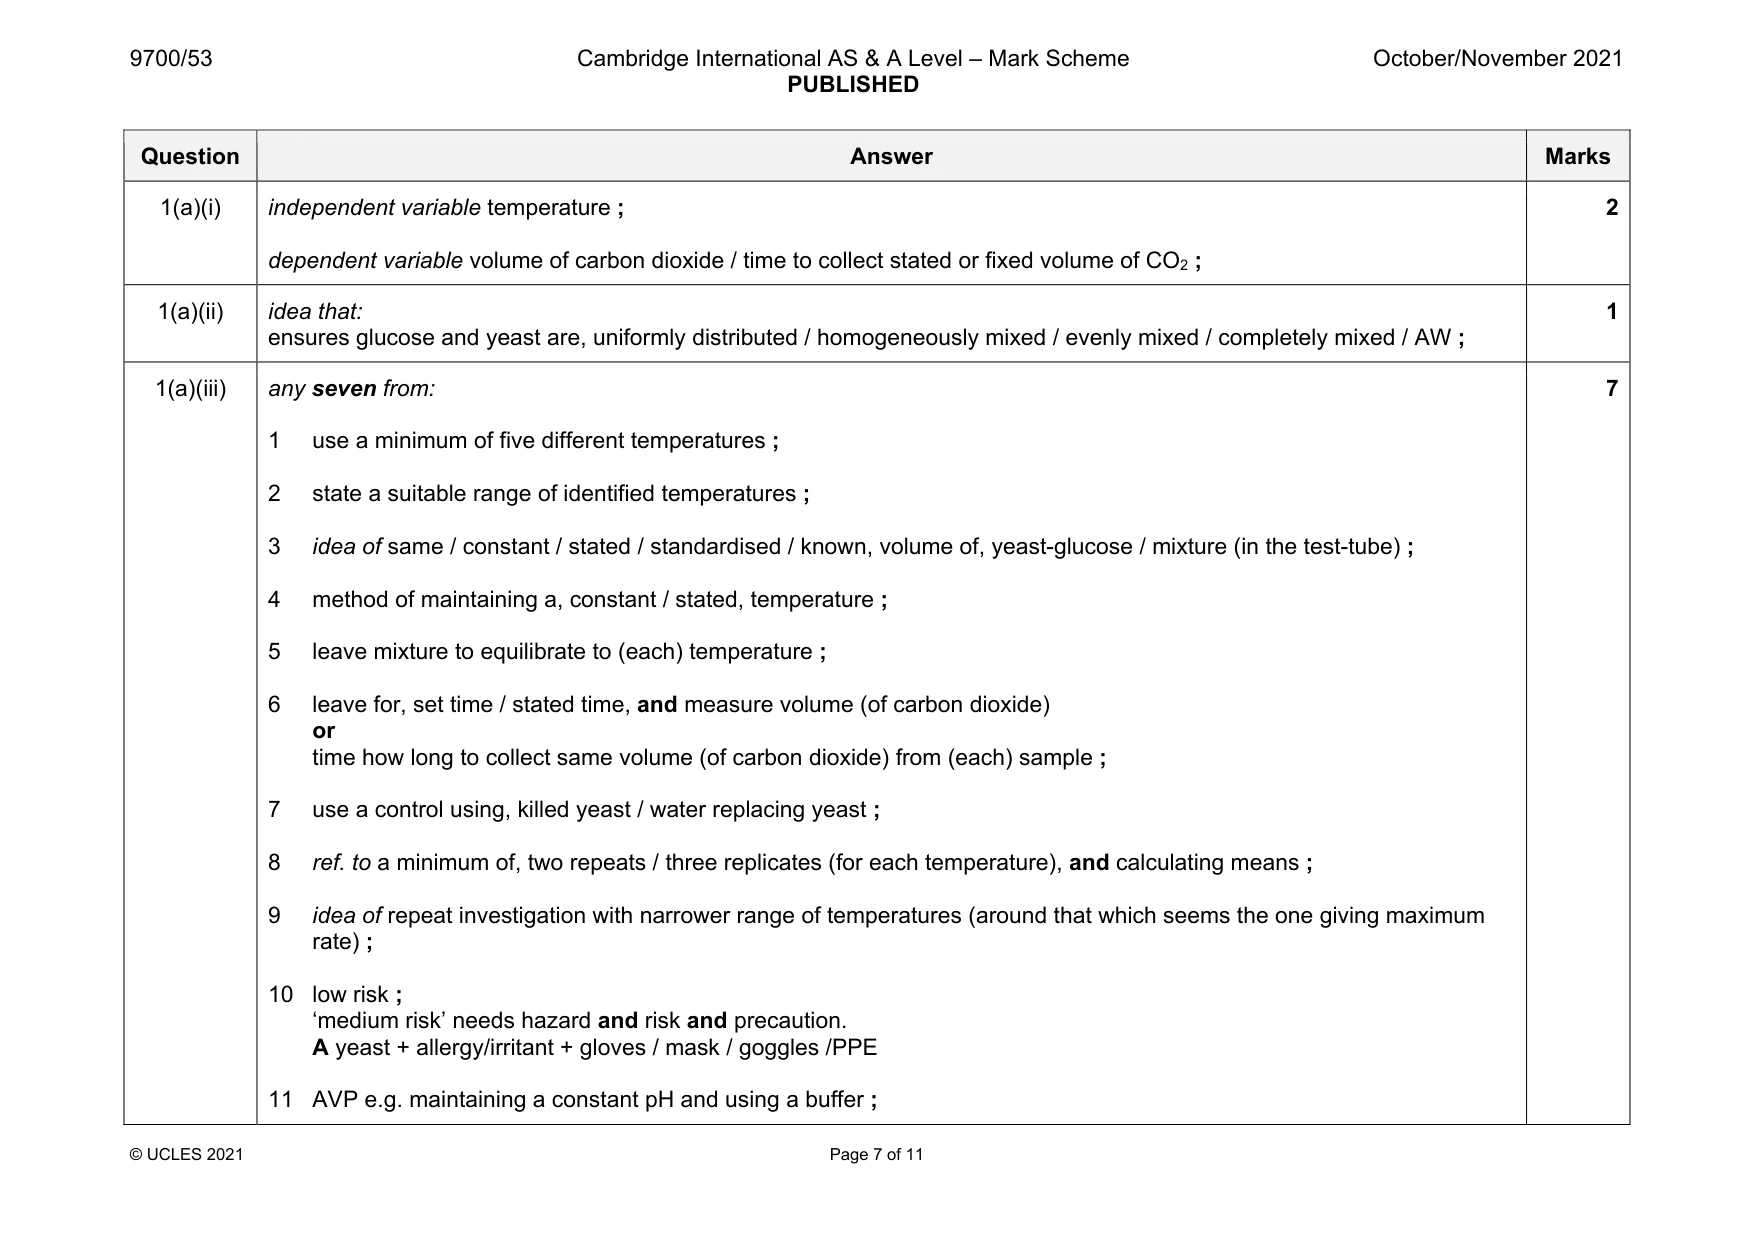
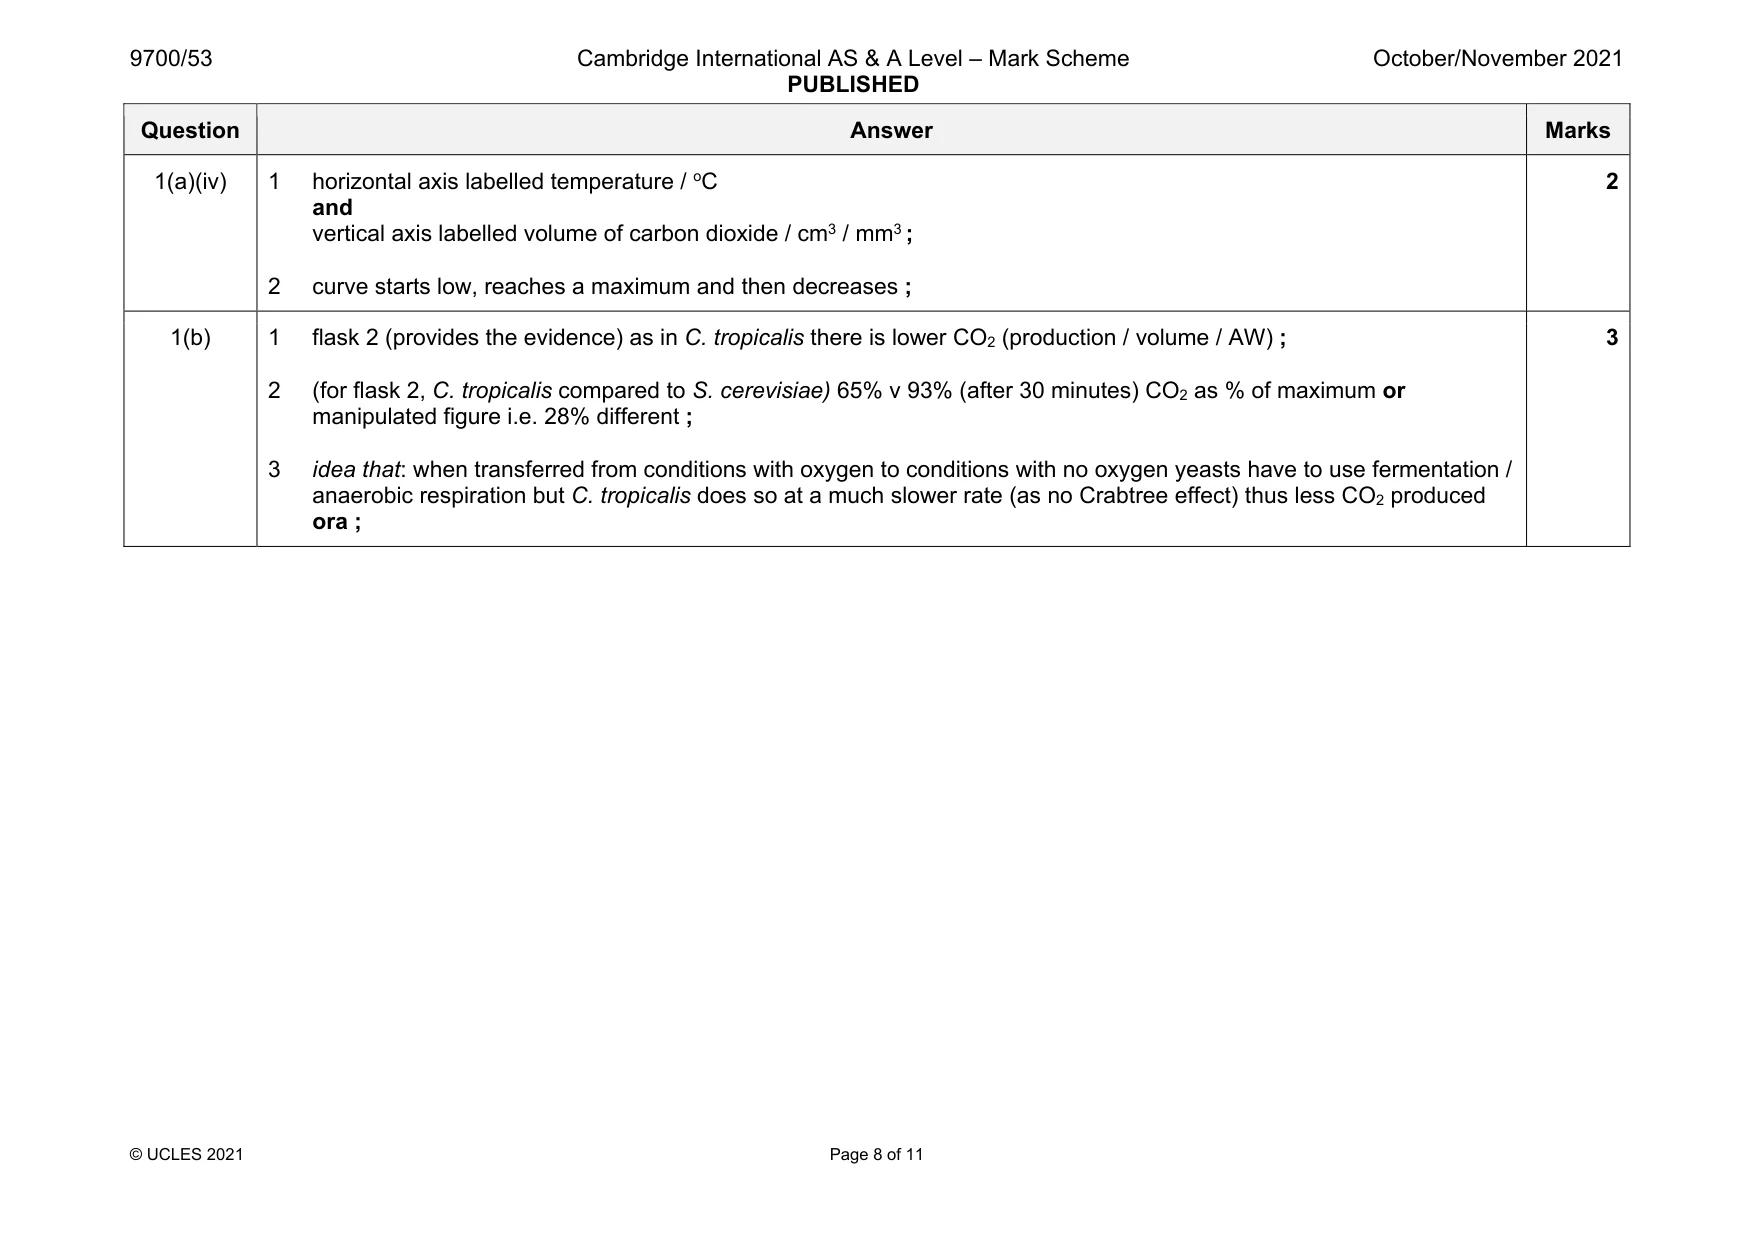
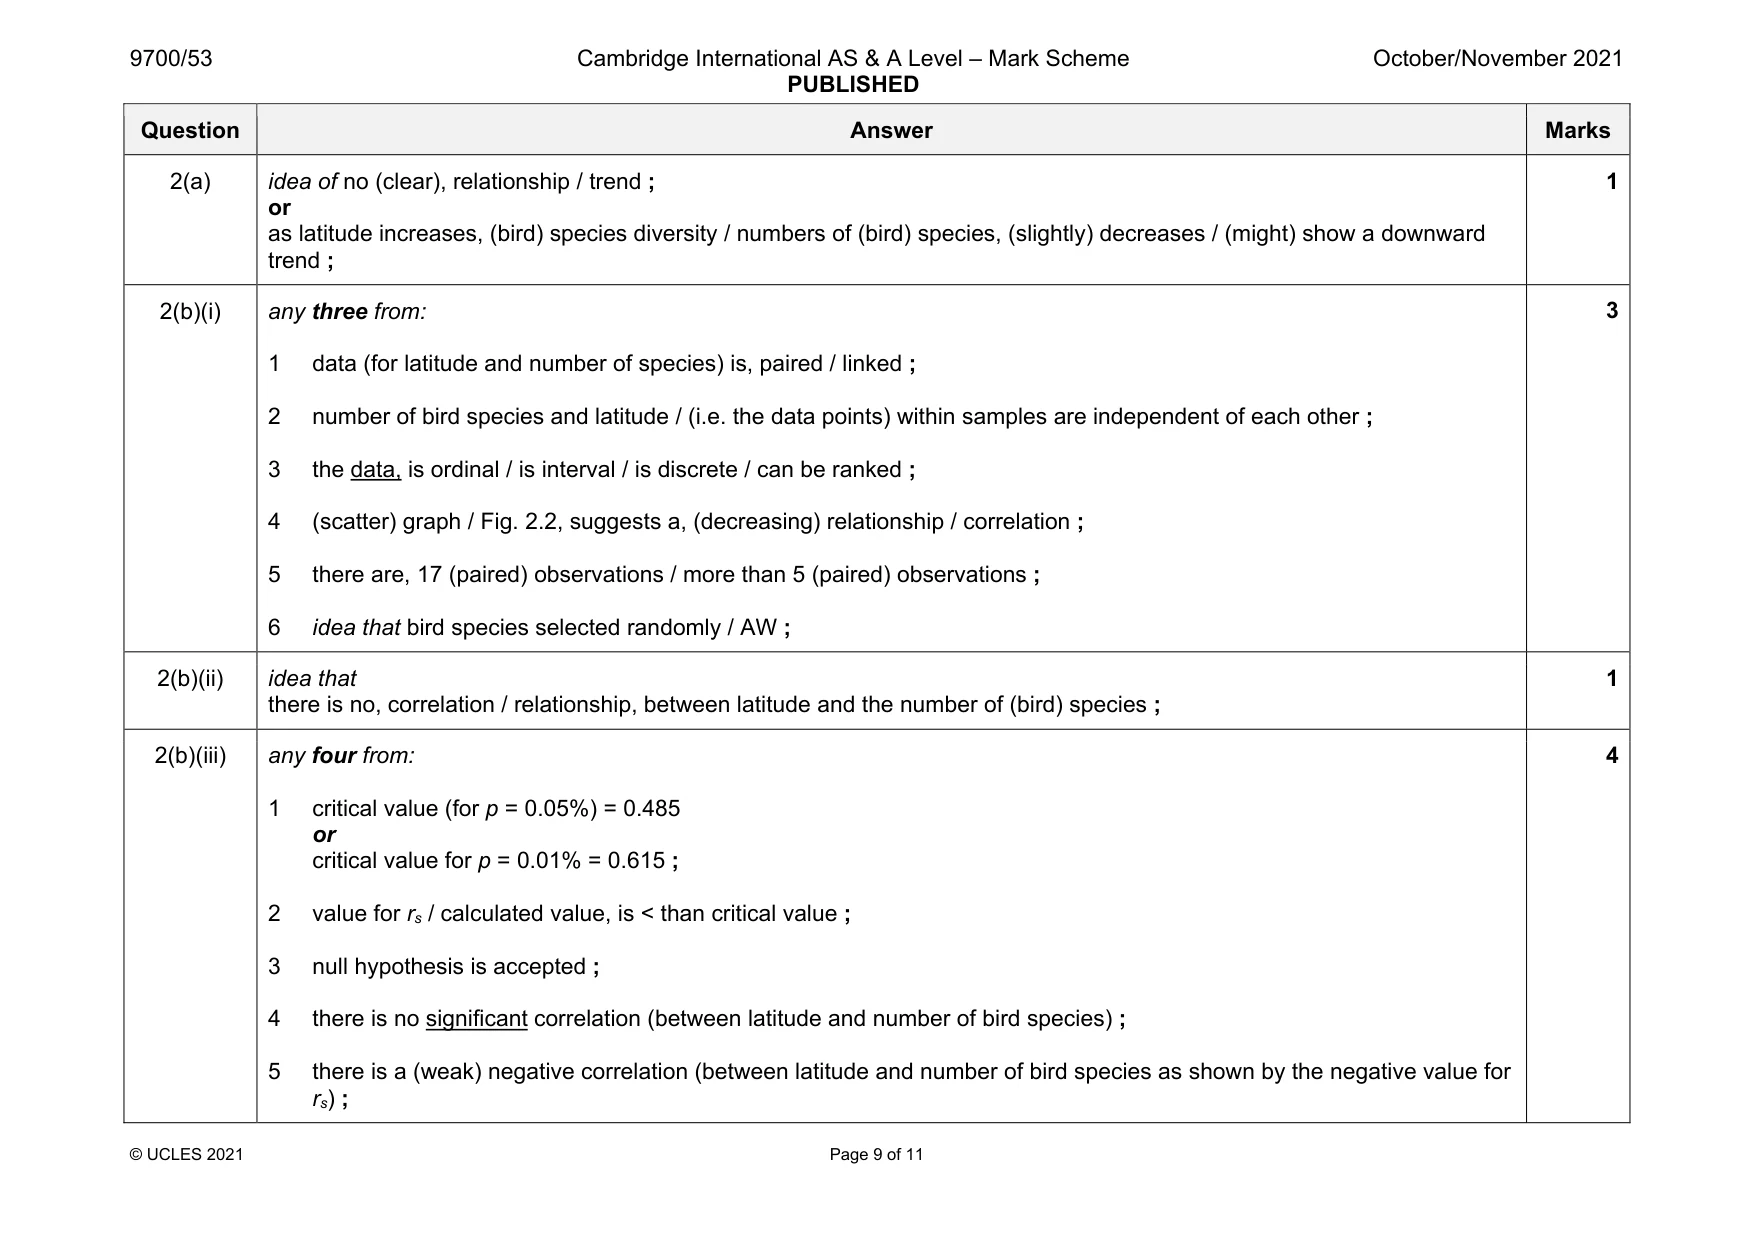
Mark scheme: 1(a)(i) independent variable temperature ; dependent variable volume of carbon dioxide / time to collect stated or fixed volume of CO2 ; 2 1(a)(ii) idea that: ensures glucose and yeast are, uniformly distributed / homogeneously mixed / evenly mixed / completely mixed / AW ; 1 1(a)(iii) any seven from: 1 use a minimum of five different temperatures ; 2 state a suitable range of identified temperatures ; 3 idea of same / constant / stated / standardised / known, volume of, yeast-glucose / mixture (in the test-tube) ; 4 method of maintaining a, constant / stated, temperature ; 5 leave mixture to equilibrate to (each) temperature ; 6 leave for, set time / stated time, and measure volume (of carbon dioxide) or time how long to collect same volume (of carbon dioxide) from (each) sample ; 7 use a control using, killed yeast / water replacing yeast ; 8 ref. to a minimum of, two repeats / three replicates (for each temperature), and calculating means ; 9 idea of repeat investigation with narrower range of temperatures (around that which seems the one giving maximum rate) ; 10 low risk ; ‘medium risk’ needs hazard and risk and precaution. A yeast + allergy/irritant + gloves / mask / goggles /PPE 11 AVP e.g. maintaining a constant pH and using a buffer ; 7 Question Answer Marks 1(a)(iv) 1 horizontal axis labelled temperature / oC and vertical axis labelled volume of carbon dioxide / cm3 / mm3 ; 2 curve starts low, reaches a maximum and then decreases ; 2 1(b) 1 flask 2 (provides the evidence) as in C. tropicalis there is lower CO2 (production / volume / AW) ; 2 (for flask 2, C. tropicalis compared to S. cerevisiae) 65% v 93% (after 30 minutes) CO2 as % of maximum or manipulated figure i.e. 28% different ; 3 idea that: when transferred from conditions with oxygen to conditions with no oxygen yeasts have to use fermentation / anaerobic respiration but C. tropicalis does so at a much slower rate (as no Crabtree effect) thus less CO2 produced ora ; 3
Q2 · Species diversity is often used as a simple way to compare the biodiversity of different…
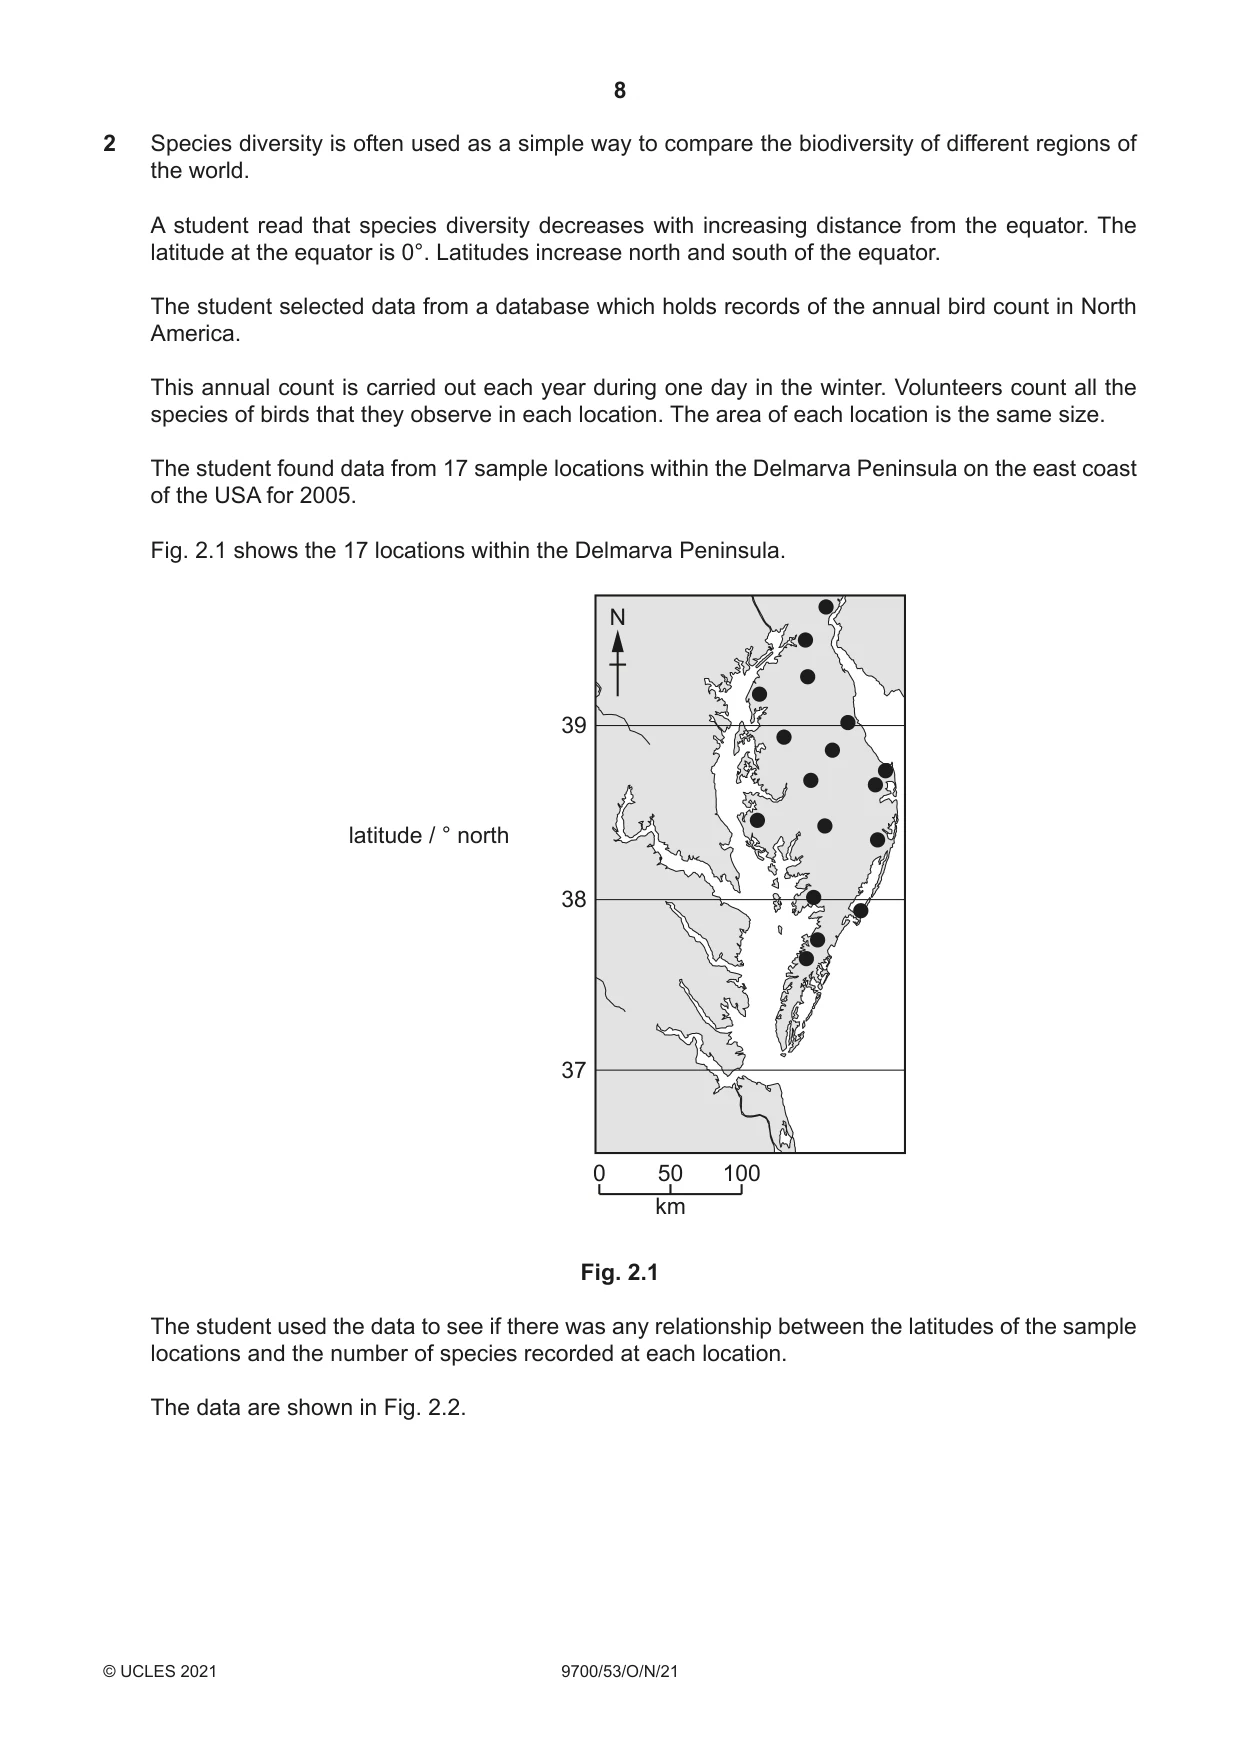
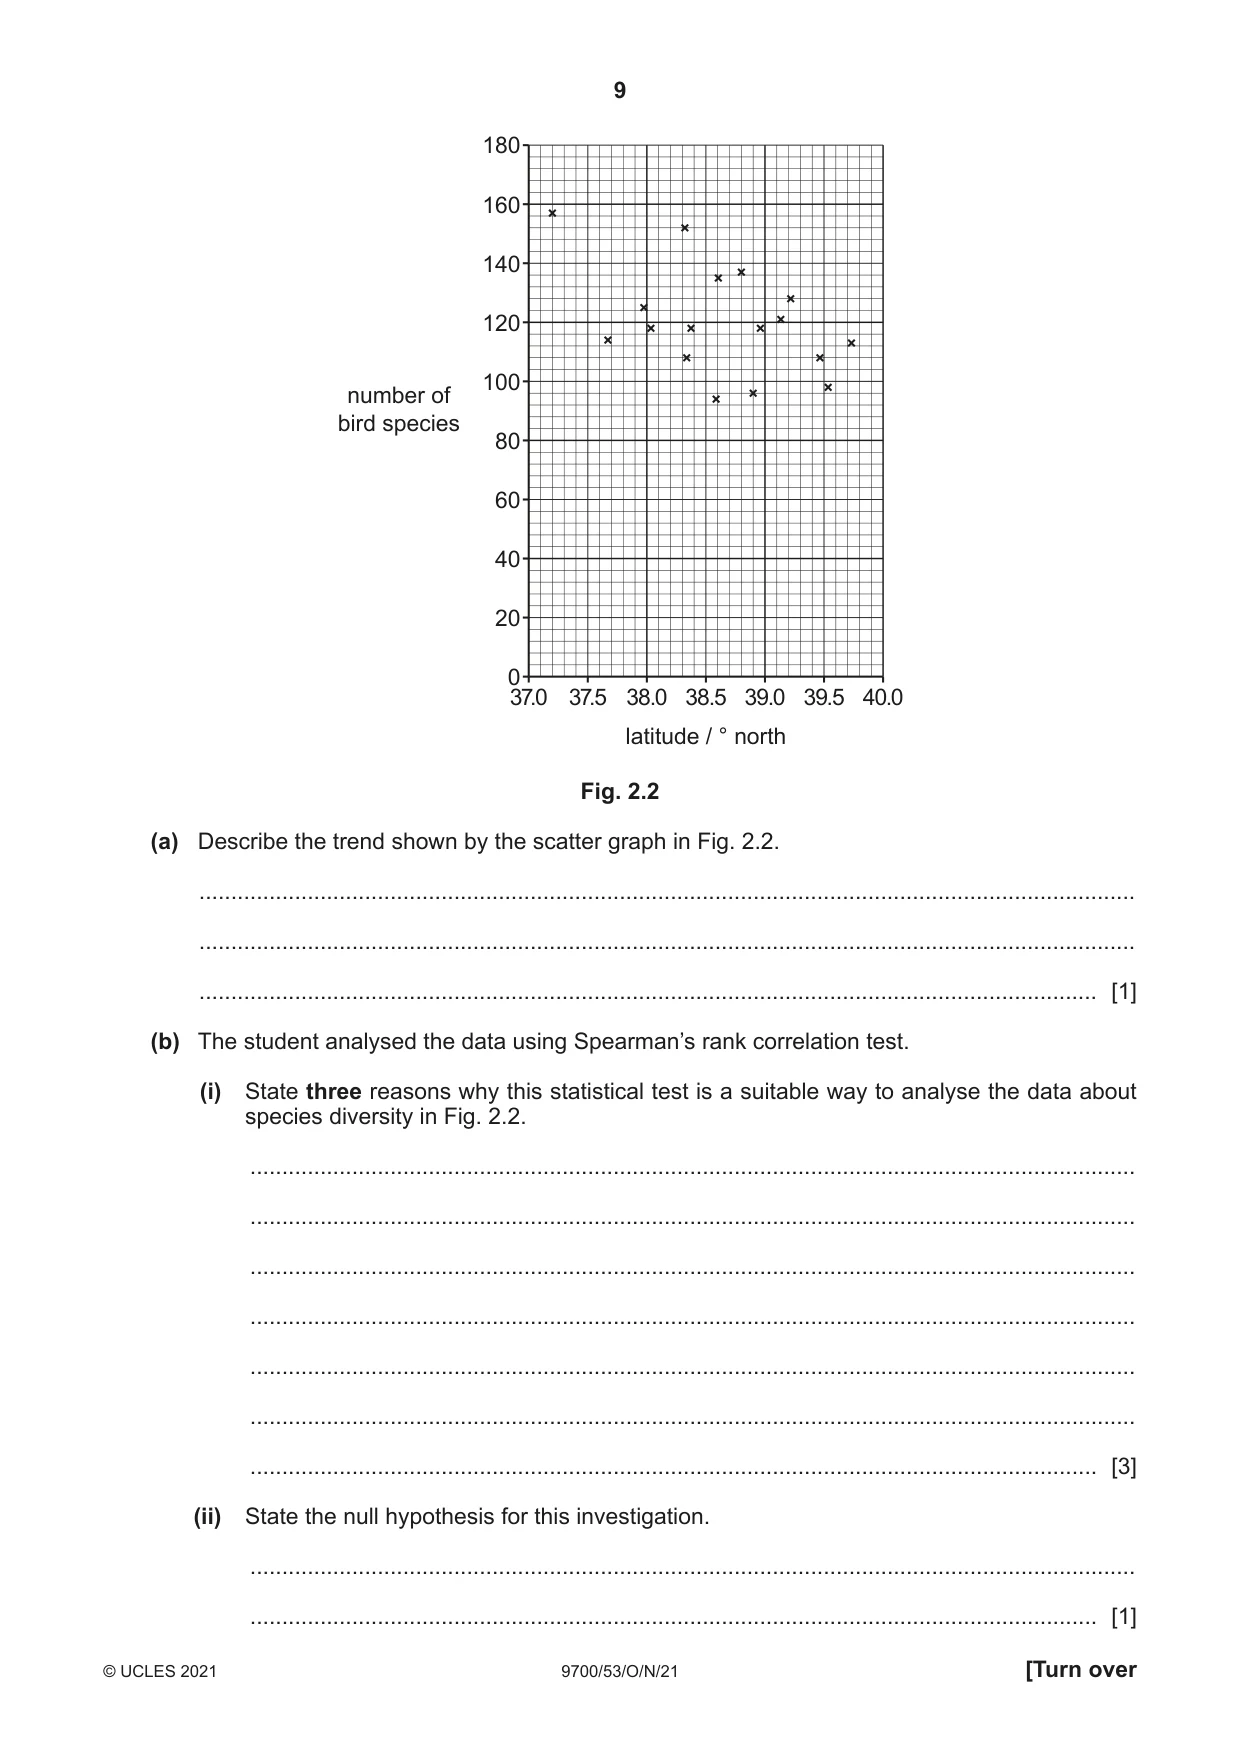
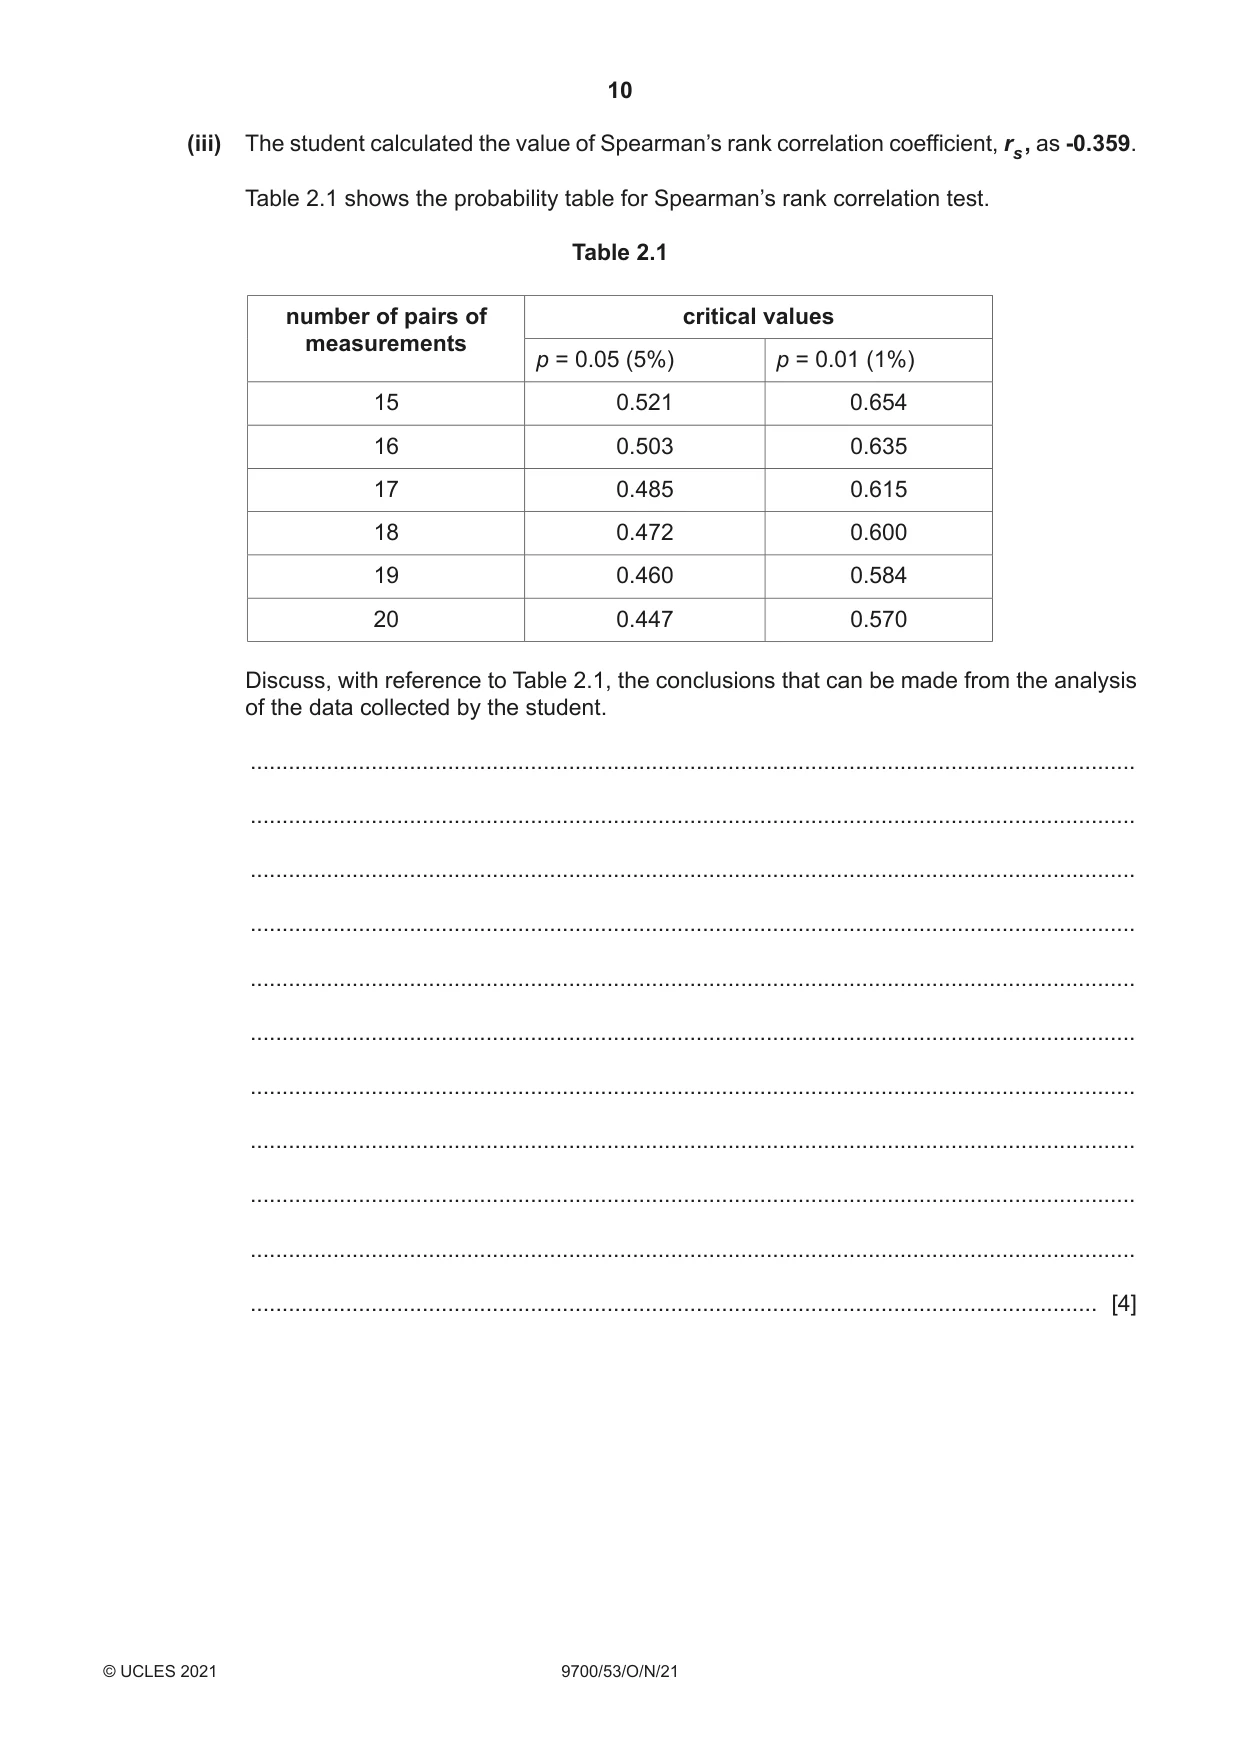
2 Species diversity is often used as a simple way to compare the biodiversity of different regions of the world. A student read that species diversity decreases with increasing distance from the equator. The latitude at the equator is 0°. Latitudes increase north and south of the equator. The student selected data from a database which holds records of the annual bird count in North America. This annual count is carried out each year during one day in the winter. Volunteers count all the species of birds that they observe in each location. The area of each location is the same size. The student found data from 17 sample locations within the Delmarva Peninsula on the east coast of the USA for 2005. Fig. 2.1 shows the 17 locations within the Delmarva Peninsula. N 39 latitude / ° north 38 37 0 50 100 km Fig. 2.1 The student used the data to see if there was any relationship between the latitudes of the sample locations and the number of species recorded at each location. The data are shown in Fig. 2.2. 180 160 140 120 100 number of bird species 80 60 40 20 0 37.0 37.5 38.0 38.5 39.0 39.5 40.0 latitude / ° north Fig. 2.2 (a) Describe the trend shown by the scatter graph in Fig. 2.2. ................................................................................................................................................... ................................................................................................................................................... ............................................................................................................................................. [1] (b) The student analysed the data using Spearman’s rank correlation test. (i) State three reasons why this statistical test is a suitable way to analyse the data about species diversity in Fig. 2.2. ........................................................................................................................................... ........................................................................................................................................... ........................................................................................................................................... ........................................................................................................................................... ........................................................................................................................................... ........................................................................................................................................... ..................................................................................................................................... [3] (ii) State the null hypothesis for this investigation. ........................................................................................................................................... ..................................................................................................................................... [1] (iii) The student calculated the value of Spearman’s rank correlation coefficient, rs , as -0.359. Table 2.1 shows the probability table for Spearman’s rank correlation test. Table 2.1 number of pairs of critical values measurements p = 0.05 (5%) p = 0.01 (1%) 15 0.521 0.654 16 0.503 0.635 17 0.485 0.615 18 0.472 0.600 19 0.460 0.584 20 0.447 0.570 Discuss, with reference to Table 2.1, the conclusions that can be made from the analysis of the data collected by the student. ........................................................................................................................................... ........................................................................................................................................... ........................................................................................................................................... ........................................................................................................................................... ........................................................................................................................................... ........................................................................................................................................... ........................................................................................................................................... ........................................................................................................................................... ........................................................................................................................................... ........................................................................................................................................... ..................................................................................................................................... [4]
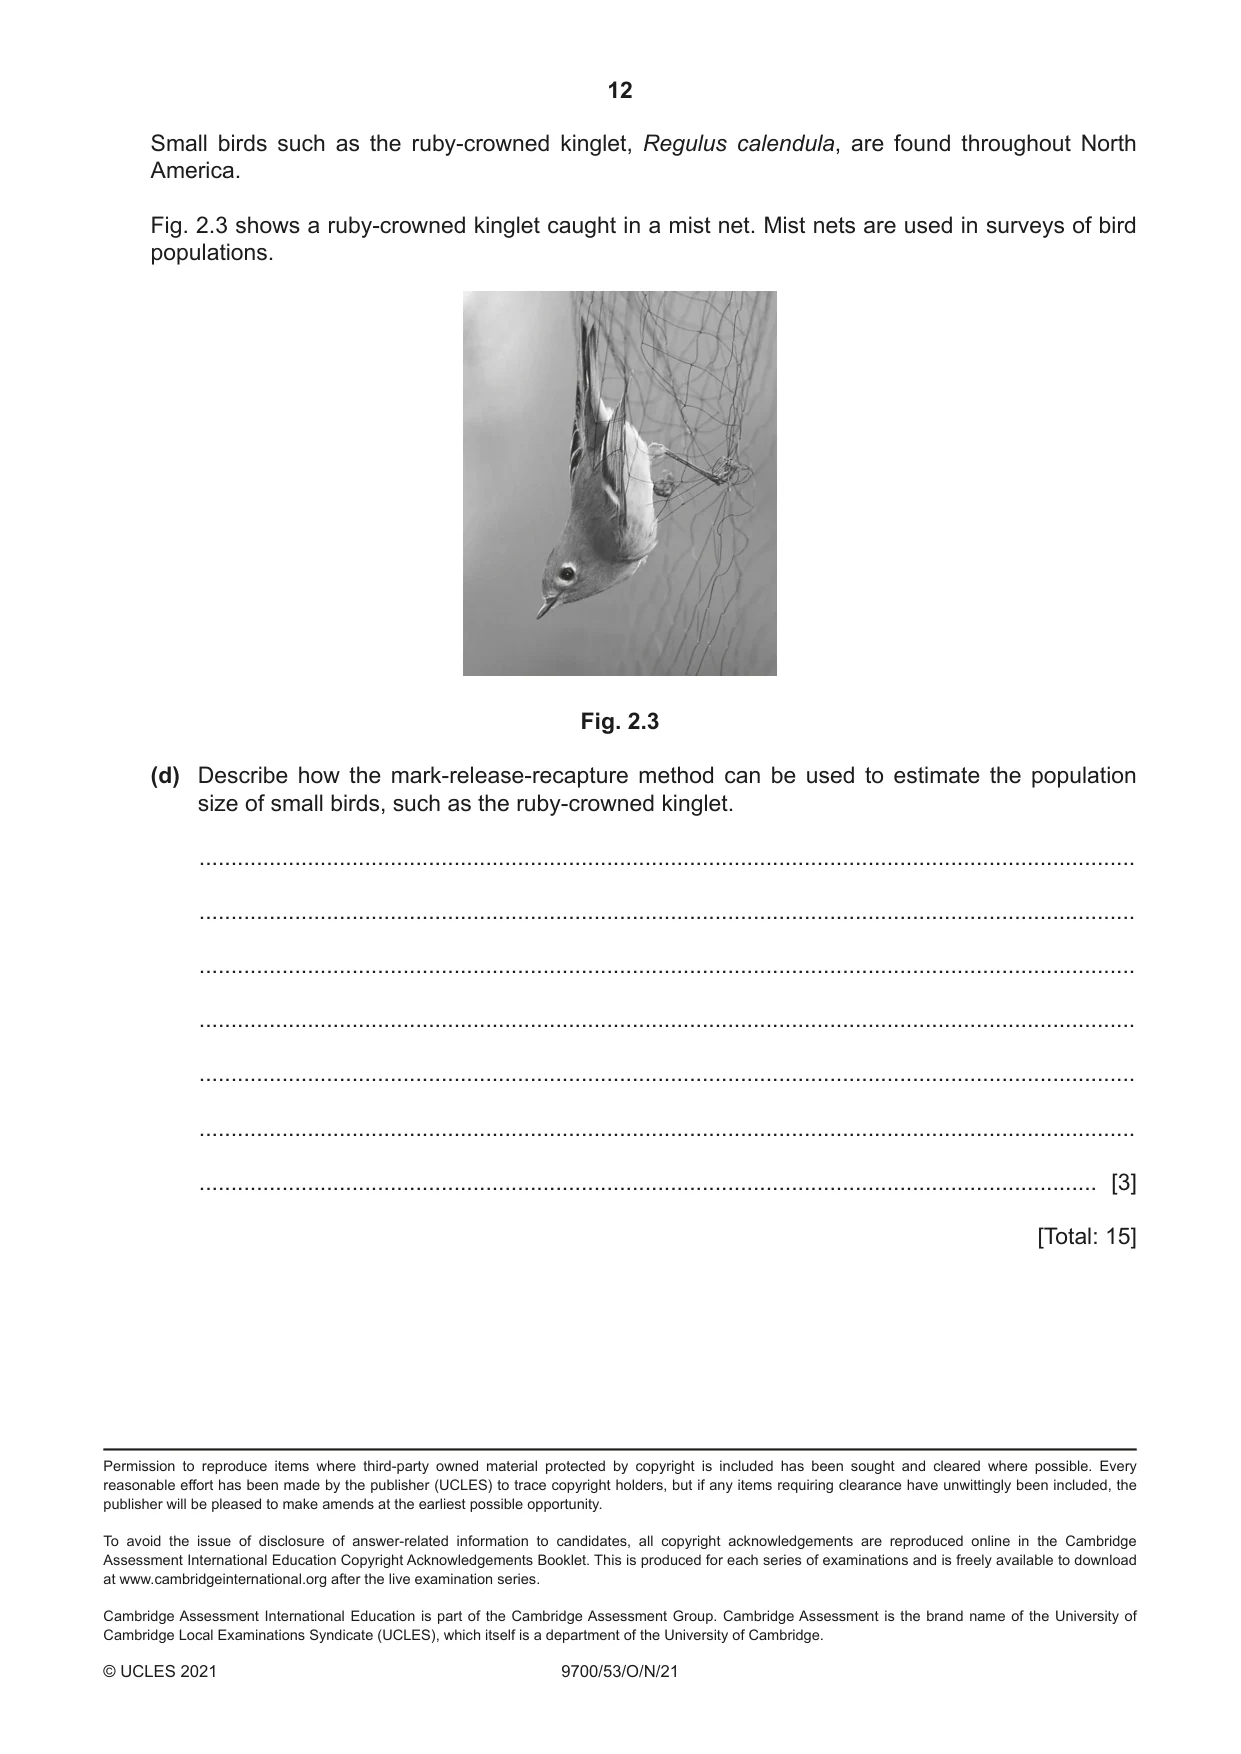
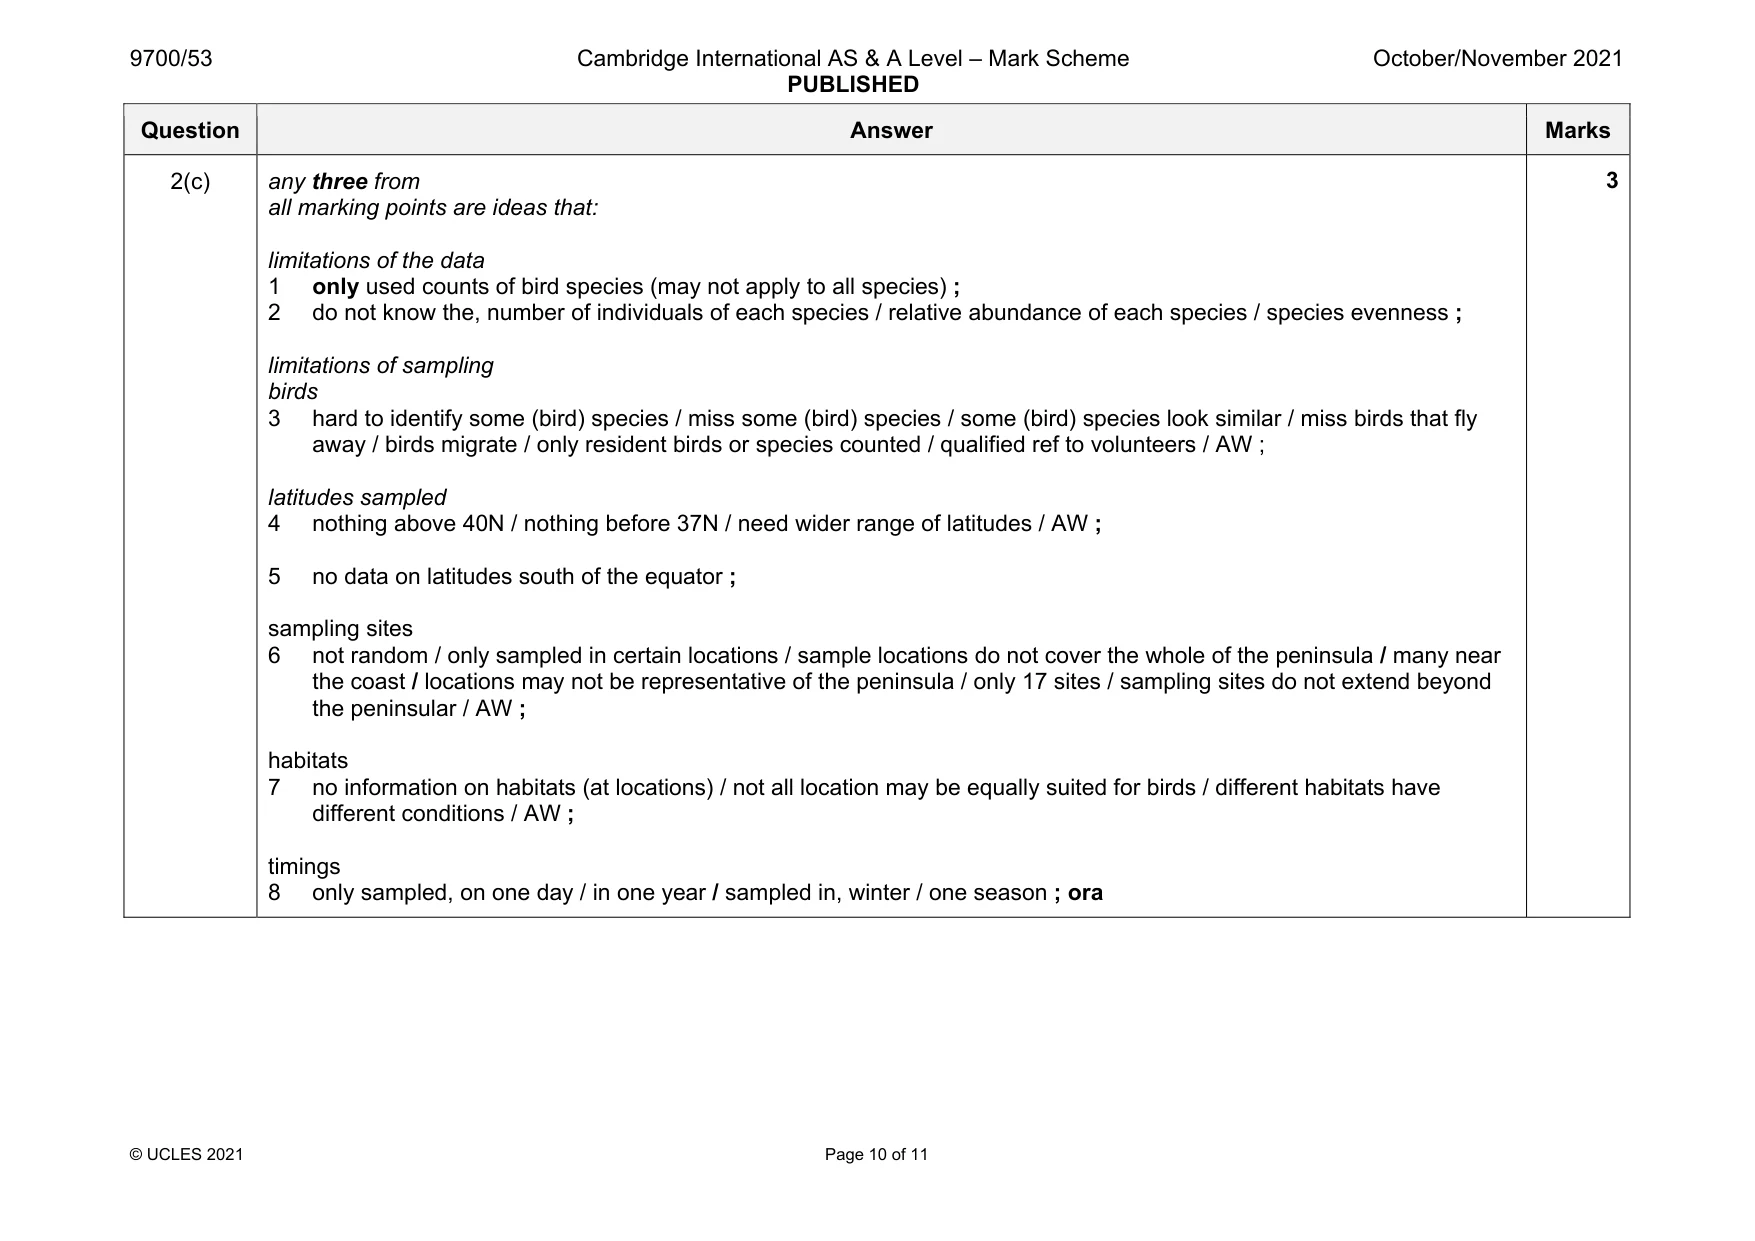
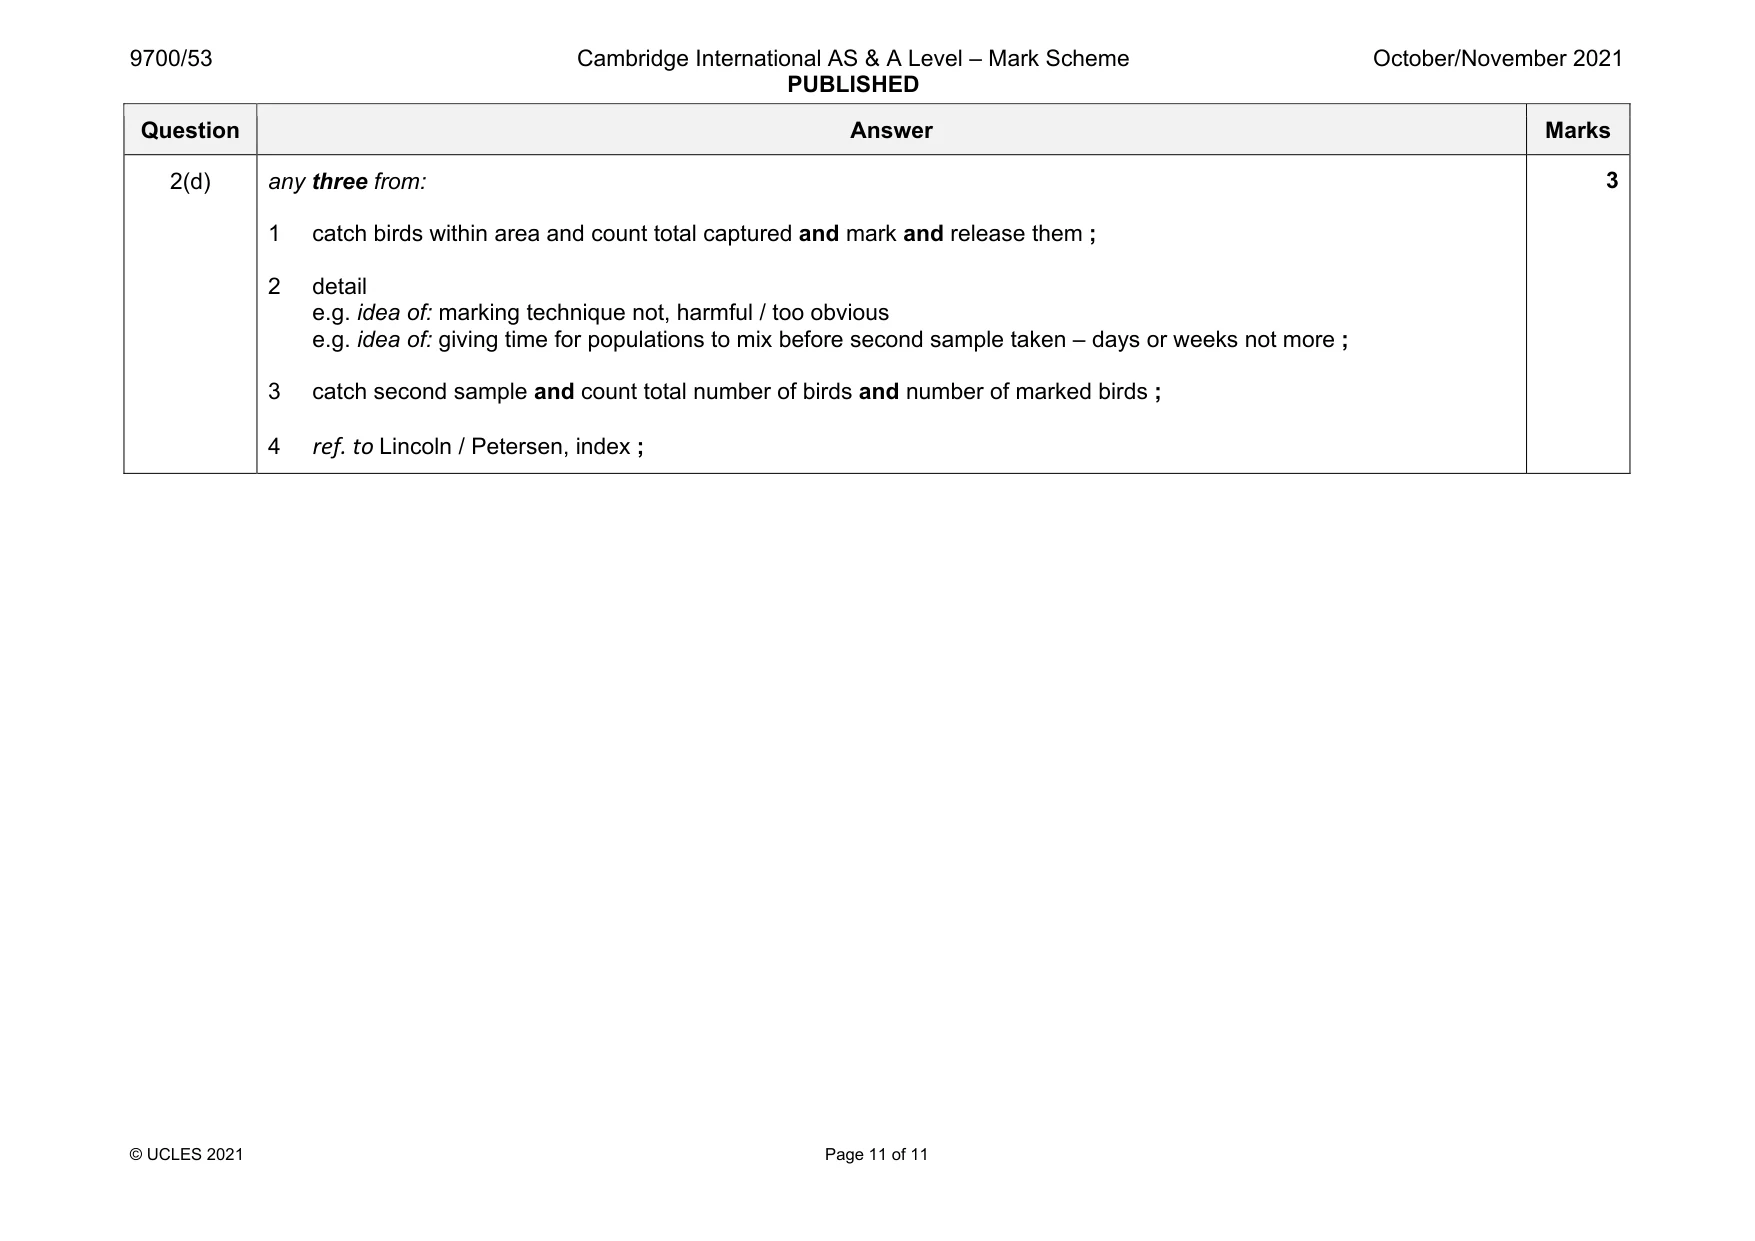
Mark scheme: 2(a) idea of no (clear), relationship / trend ; or as latitude increases, (bird) species diversity / numbers of (bird) species, (slightly) decreases / (might) show a downward trend ; 1 2(b)(i) any three from: 1 data (for latitude and number of species) is, paired / linked ; 2 number of bird species and latitude / (i.e. the data points) within samples are independent of each other ; 3 the data, is ordinal / is interval / is discrete / can be ranked ; 4 (scatter) graph / Fig. 2.2, suggests a, (decreasing) relationship / correlation ; 5 there are, 17 (paired) observations / more than 5 (paired) observations ; 6 idea that bird species selected randomly / AW ; 3 2(b)(ii) idea that there is no, correlation / relationship, between latitude and the number of (bird) species ; 1 2(b)(iii) any four from: 1 critical value (for p = 0.05%) = 0.485 or critical value for p = 0.01% = 0.615 ; 2 value for rs / calculated value, is < than critical value ; 3 null hypothesis is accepted ; 4 there is no significant correlation (between latitude and number of bird species) ; 5 there is a (weak) negative correlation (between latitude and number of bird species as shown by the negative value for rs) ; 4 Question Answer Marks 2(c) any three from all marking points are ideas that: limitations of the data 1 only used counts of bird species (may not apply to all species) ; 2 do not know the, number of individuals of each species / relative abundance of each species / species evenness ; limitations of sampling birds 3 hard to identify some (bird) species / miss some (bird) species / some (bird) species look similar / miss birds that fly away / birds migrate / only resident birds or species counted / qualified ref to volunteers / AW ; latitudes sampled 4 nothing above 40N / nothing before 37N / need wider range of latitudes / AW ; 5 no data on latitudes south of the equator ; sampling sites 6 not random / only sampled in certain locations / sample locations do not cover the whole of the peninsula / many near the coast / locations may not be representative of the peninsula / only 17 sites / sampling sites do not extend beyond the peninsular / AW ; habitats 7 no information on habitats (at locations) / not all location may be equally suited for birds / different habitats have different conditions / AW ; timings 8 only sampled, on one day / in one year / sampled in, winter / one season ; ora 3 Question Answer Marks 2(d) any three from: 1 catch birds within area and count total captured and mark and release them ; 2 detail e.g. idea of: marking technique not, harmful / too obvious e.g. idea of: giving time for populations to mix before second sample taken – days or weeks not more ; 3 catch second sample and count total number of birds and number of marked birds ; 4 ref. to Lincoln / Petersen, index ; 3
What was in this paper
The subtopics covered by these 2 questions, and how many questions each got. Open one in a new tab to see every Cambridge question on it.
What you needed in this session
Cambridge’s own grade thresholds for 2021 Oct/Nov, Paper 5 · Variant 3. A higher threshold means an easier paper — the bar moves with how the cohort did.