Cambridge A Level Biology 9700 — 2021 Oct/Nov Paper 3 · Variant 1
9700/31/O/N/21 · 2 questions · 40 marks · ≈45 min
The question paper and its mark scheme, free to read here and free to download. This is Cambridge’s own paper, exactly as it was sat.
Question paper16 pages

Mark scheme7 pages
Answers below. Sit the paper first if you are practising.
Questions as text
Q1 · The kidneys are the organs that remove waste products from the blood and produce urine
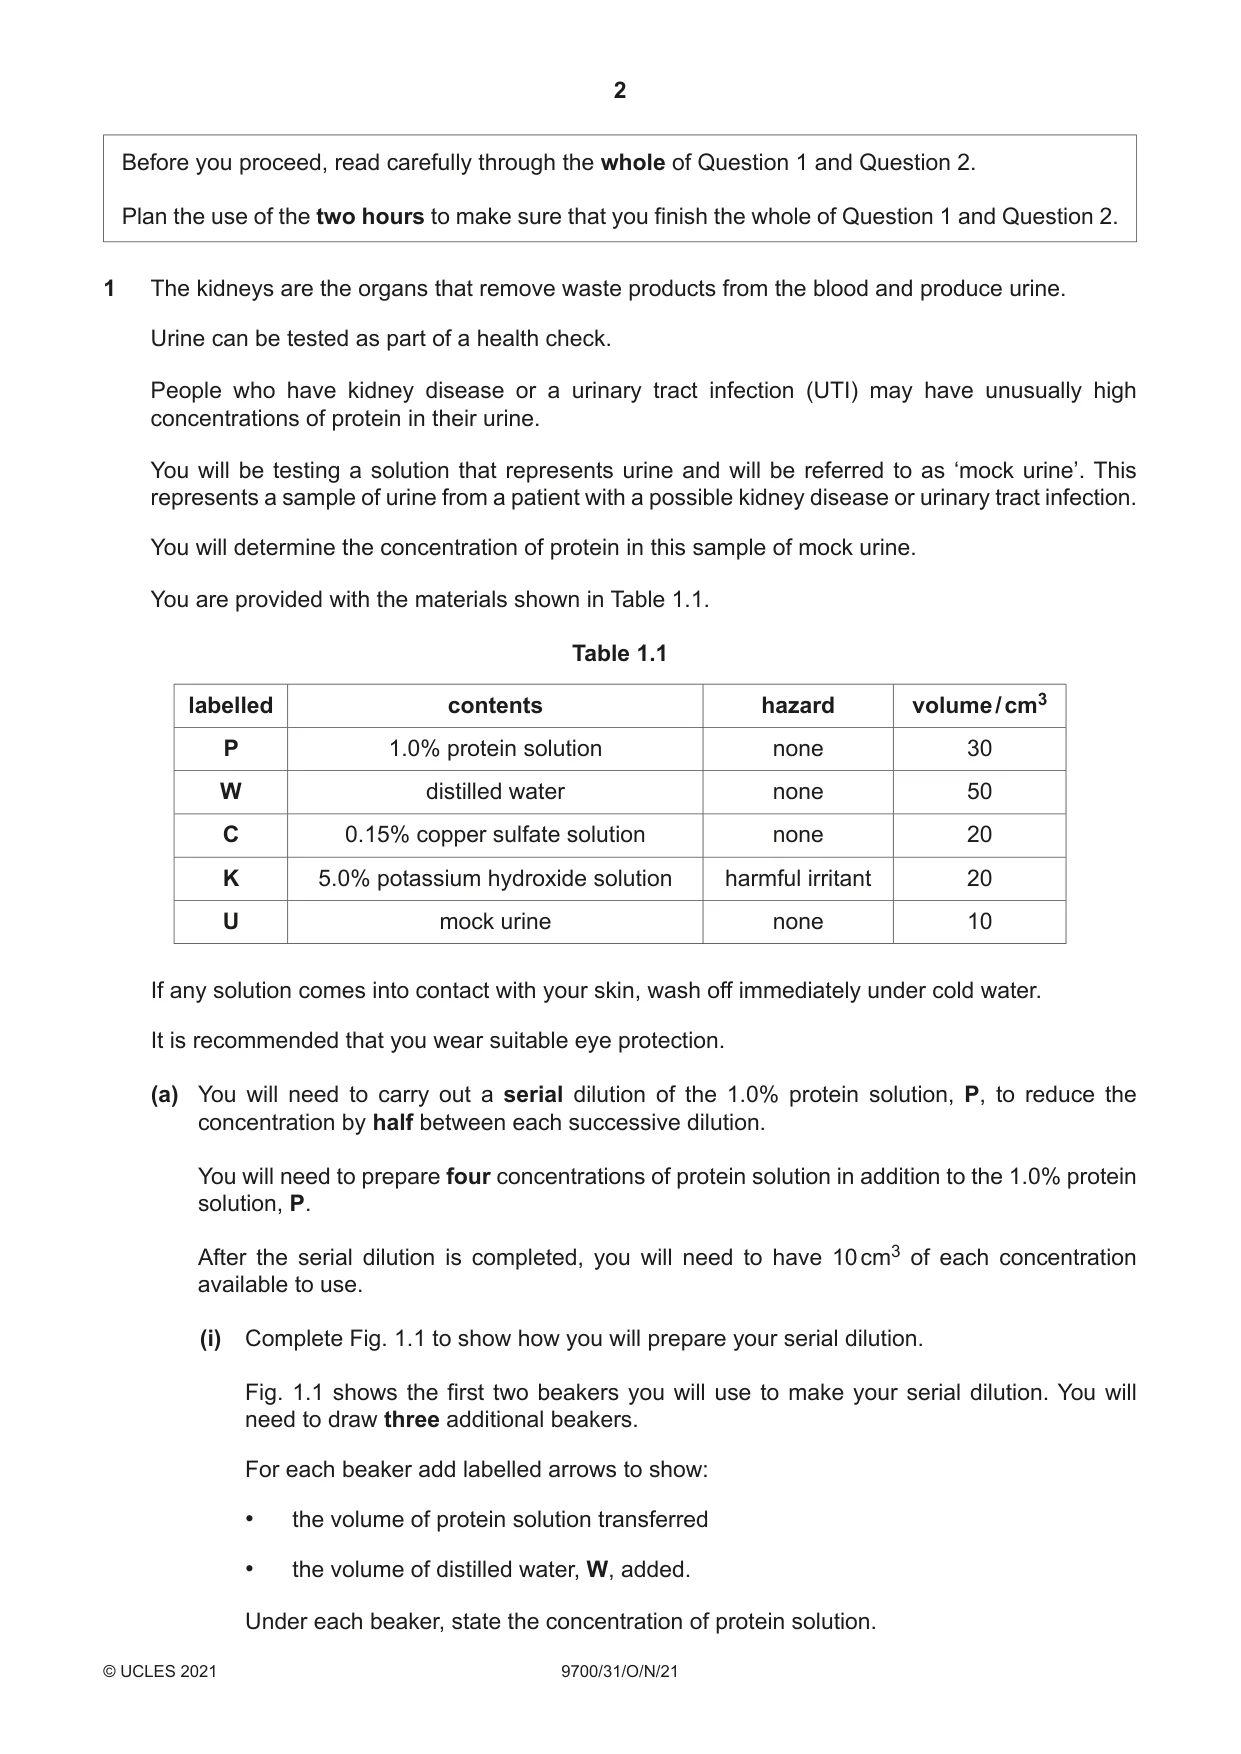
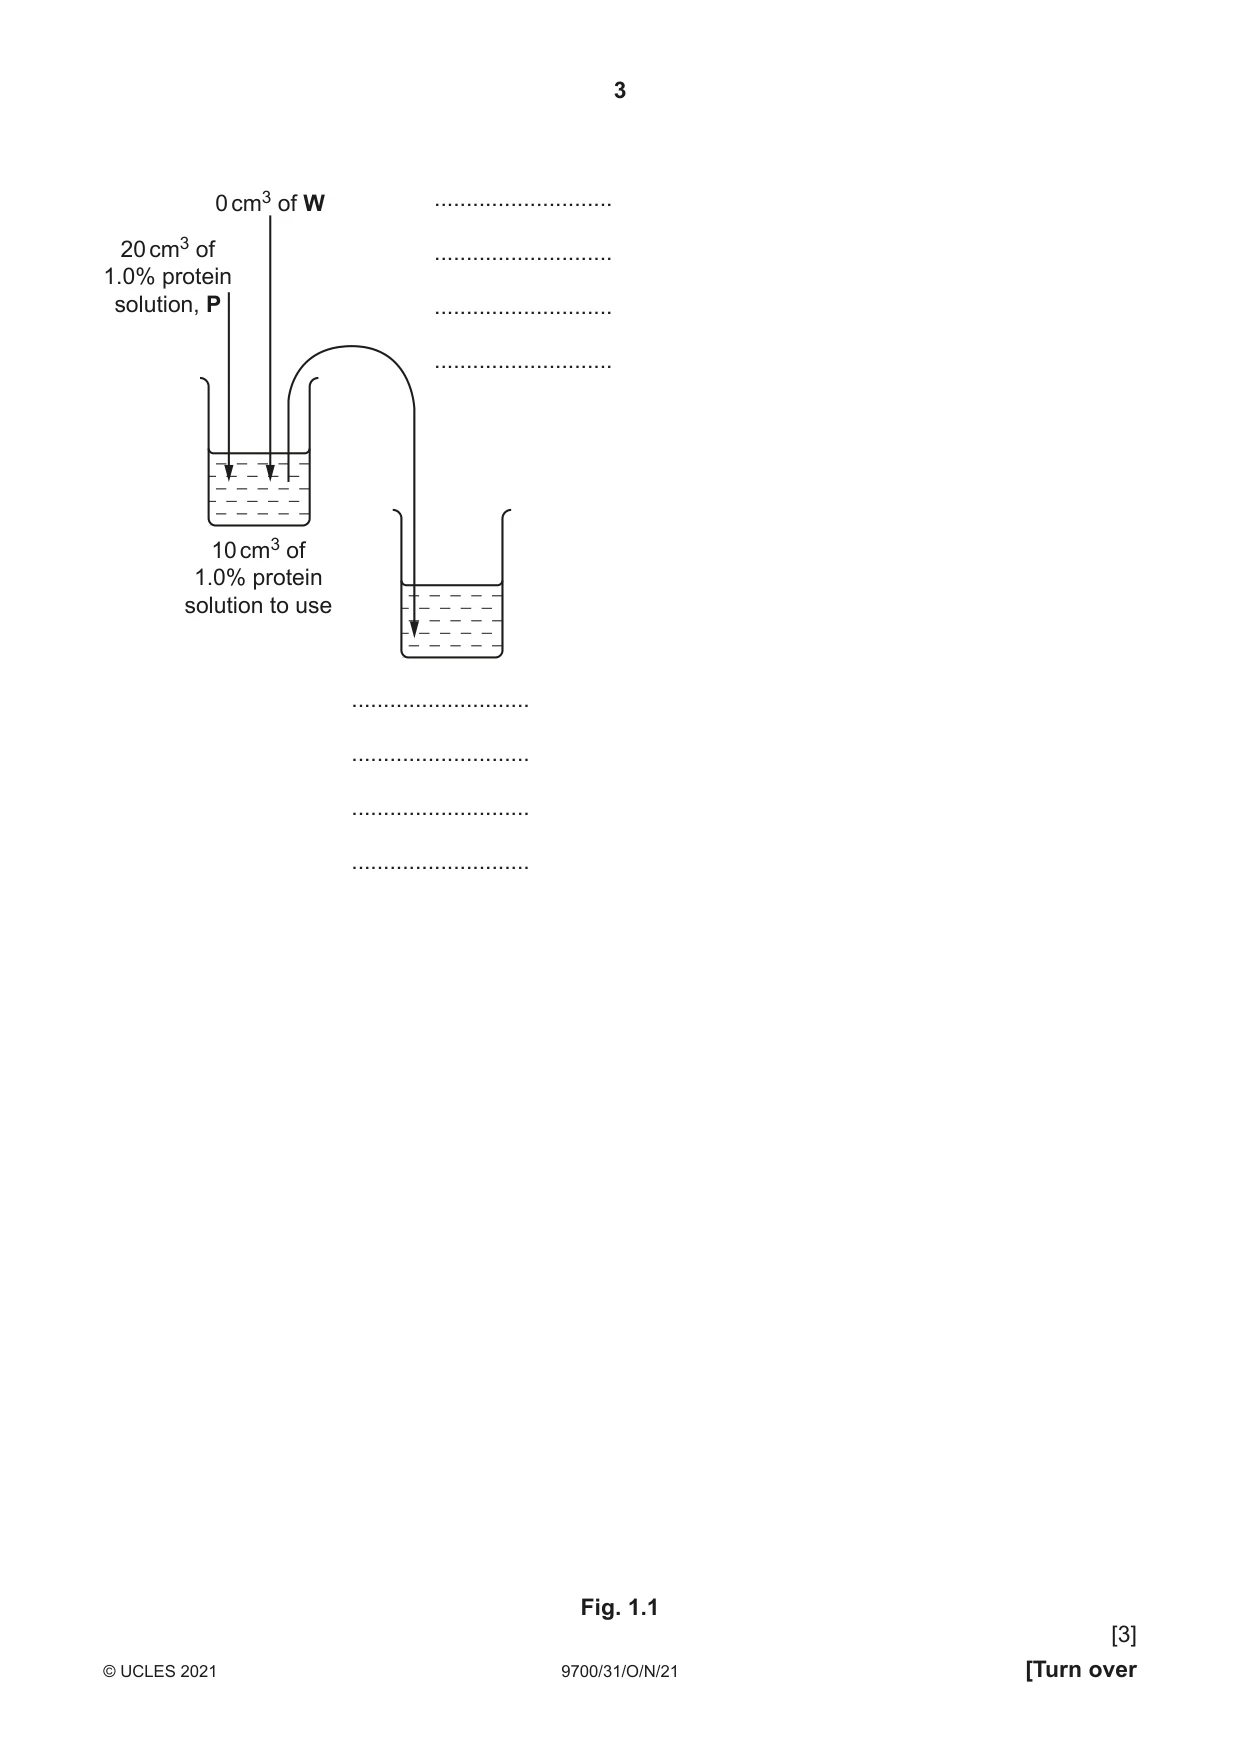
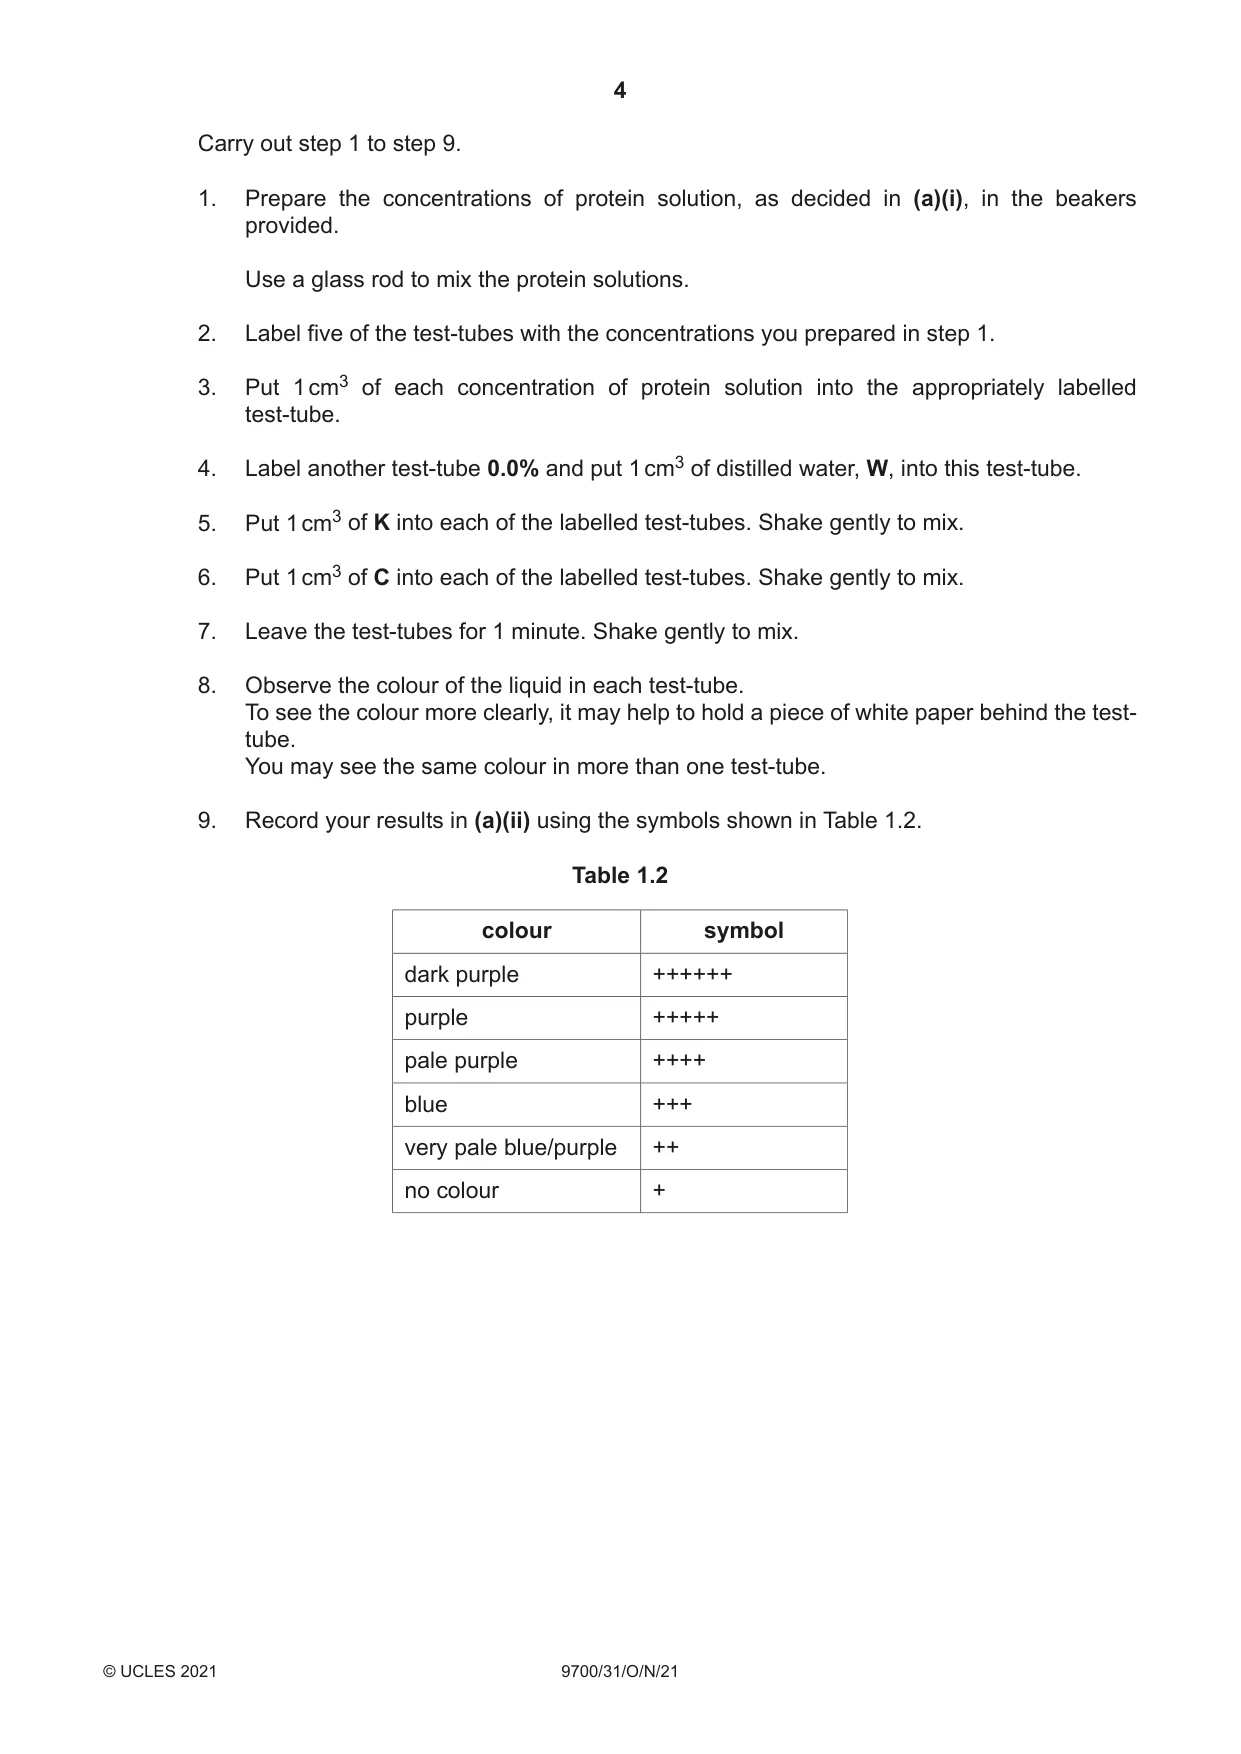
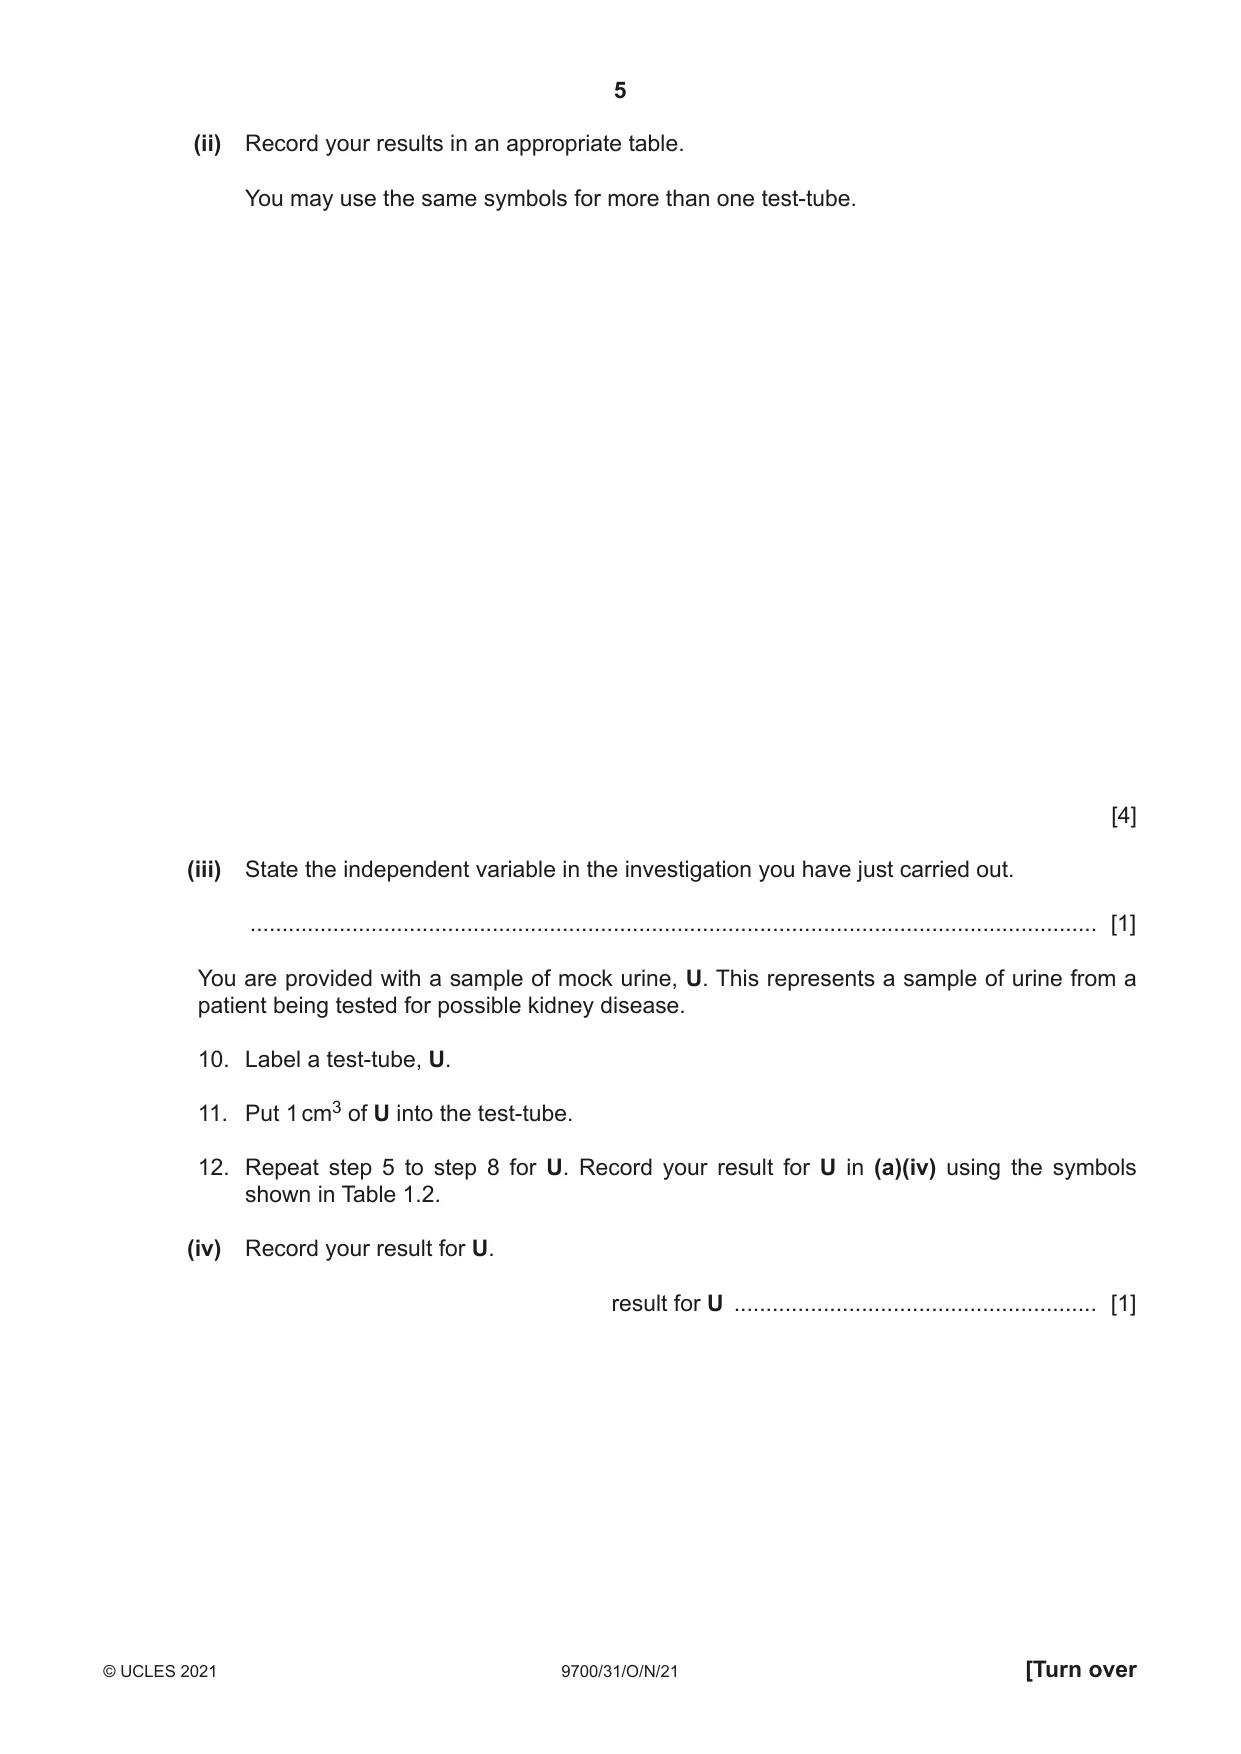
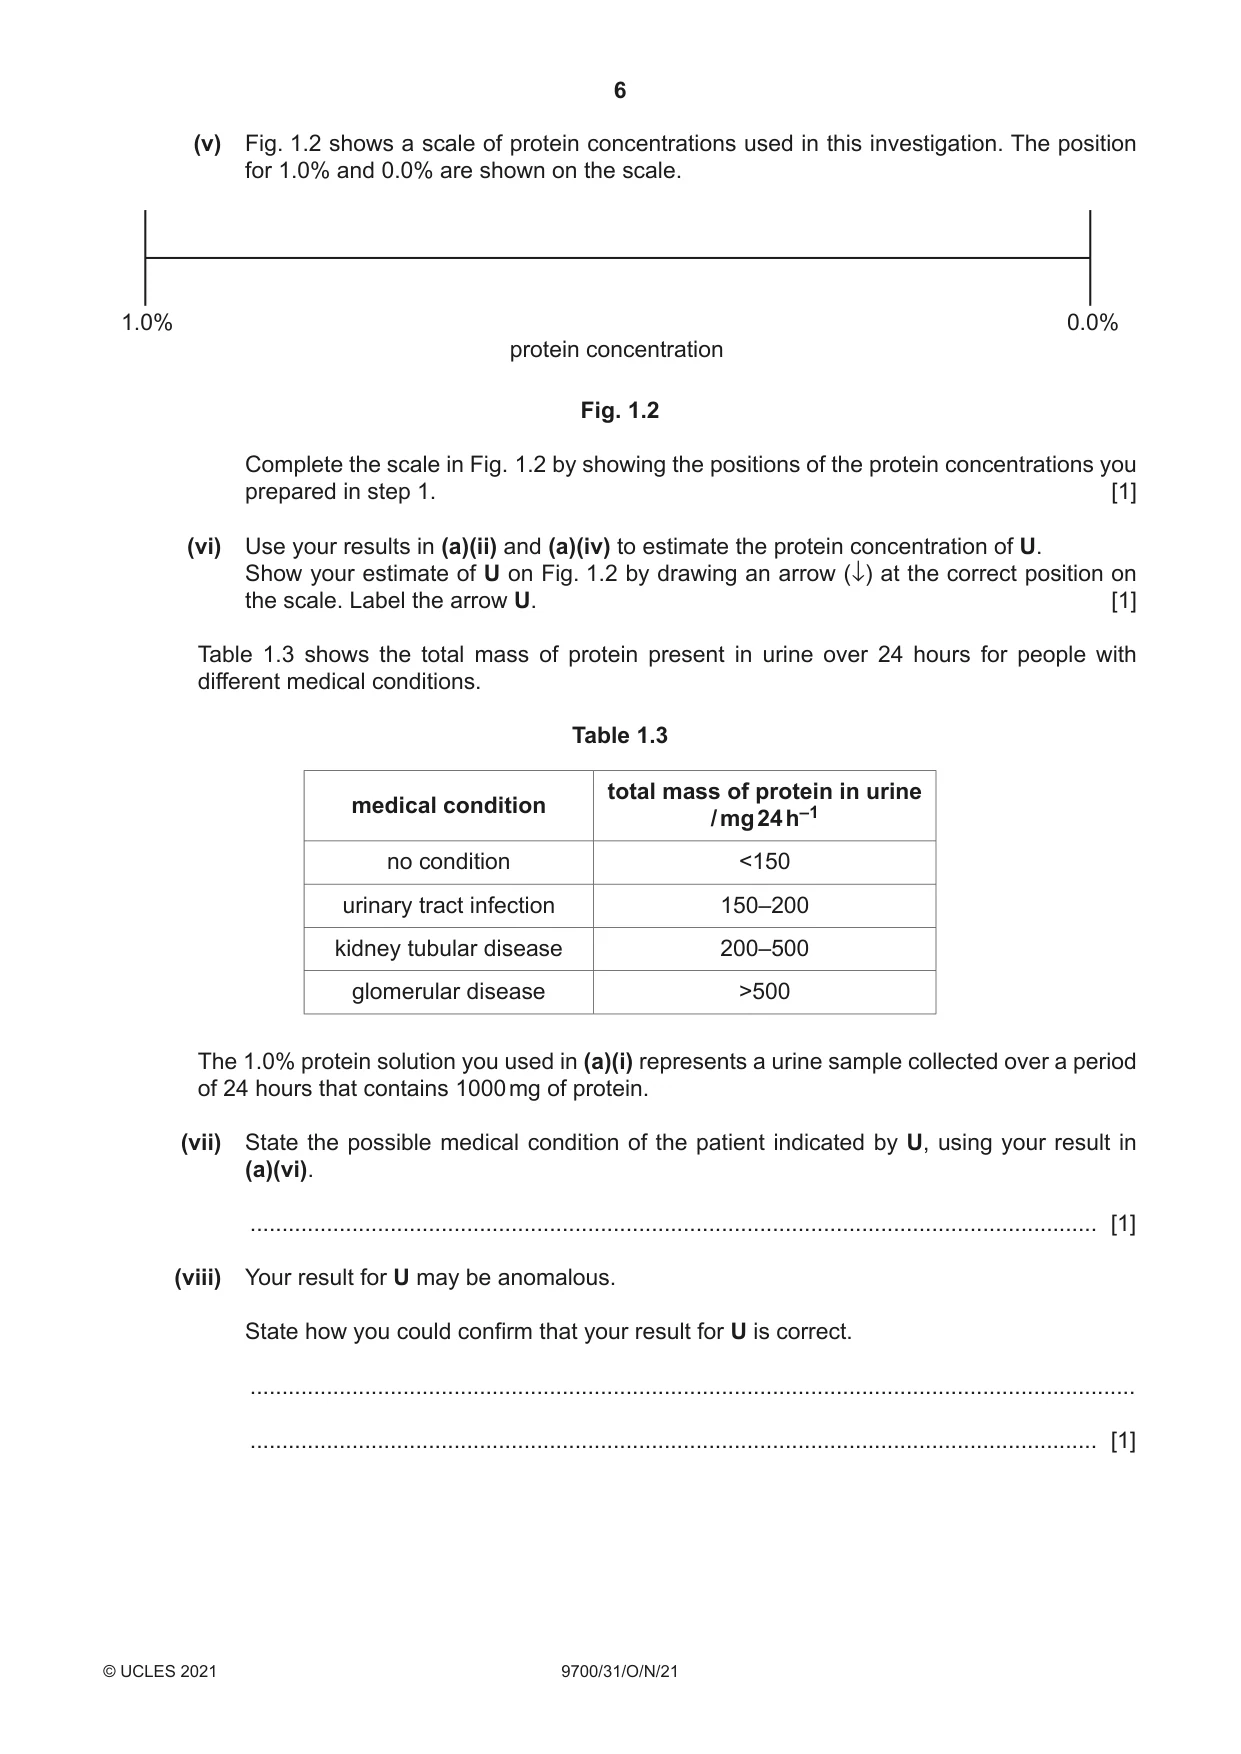
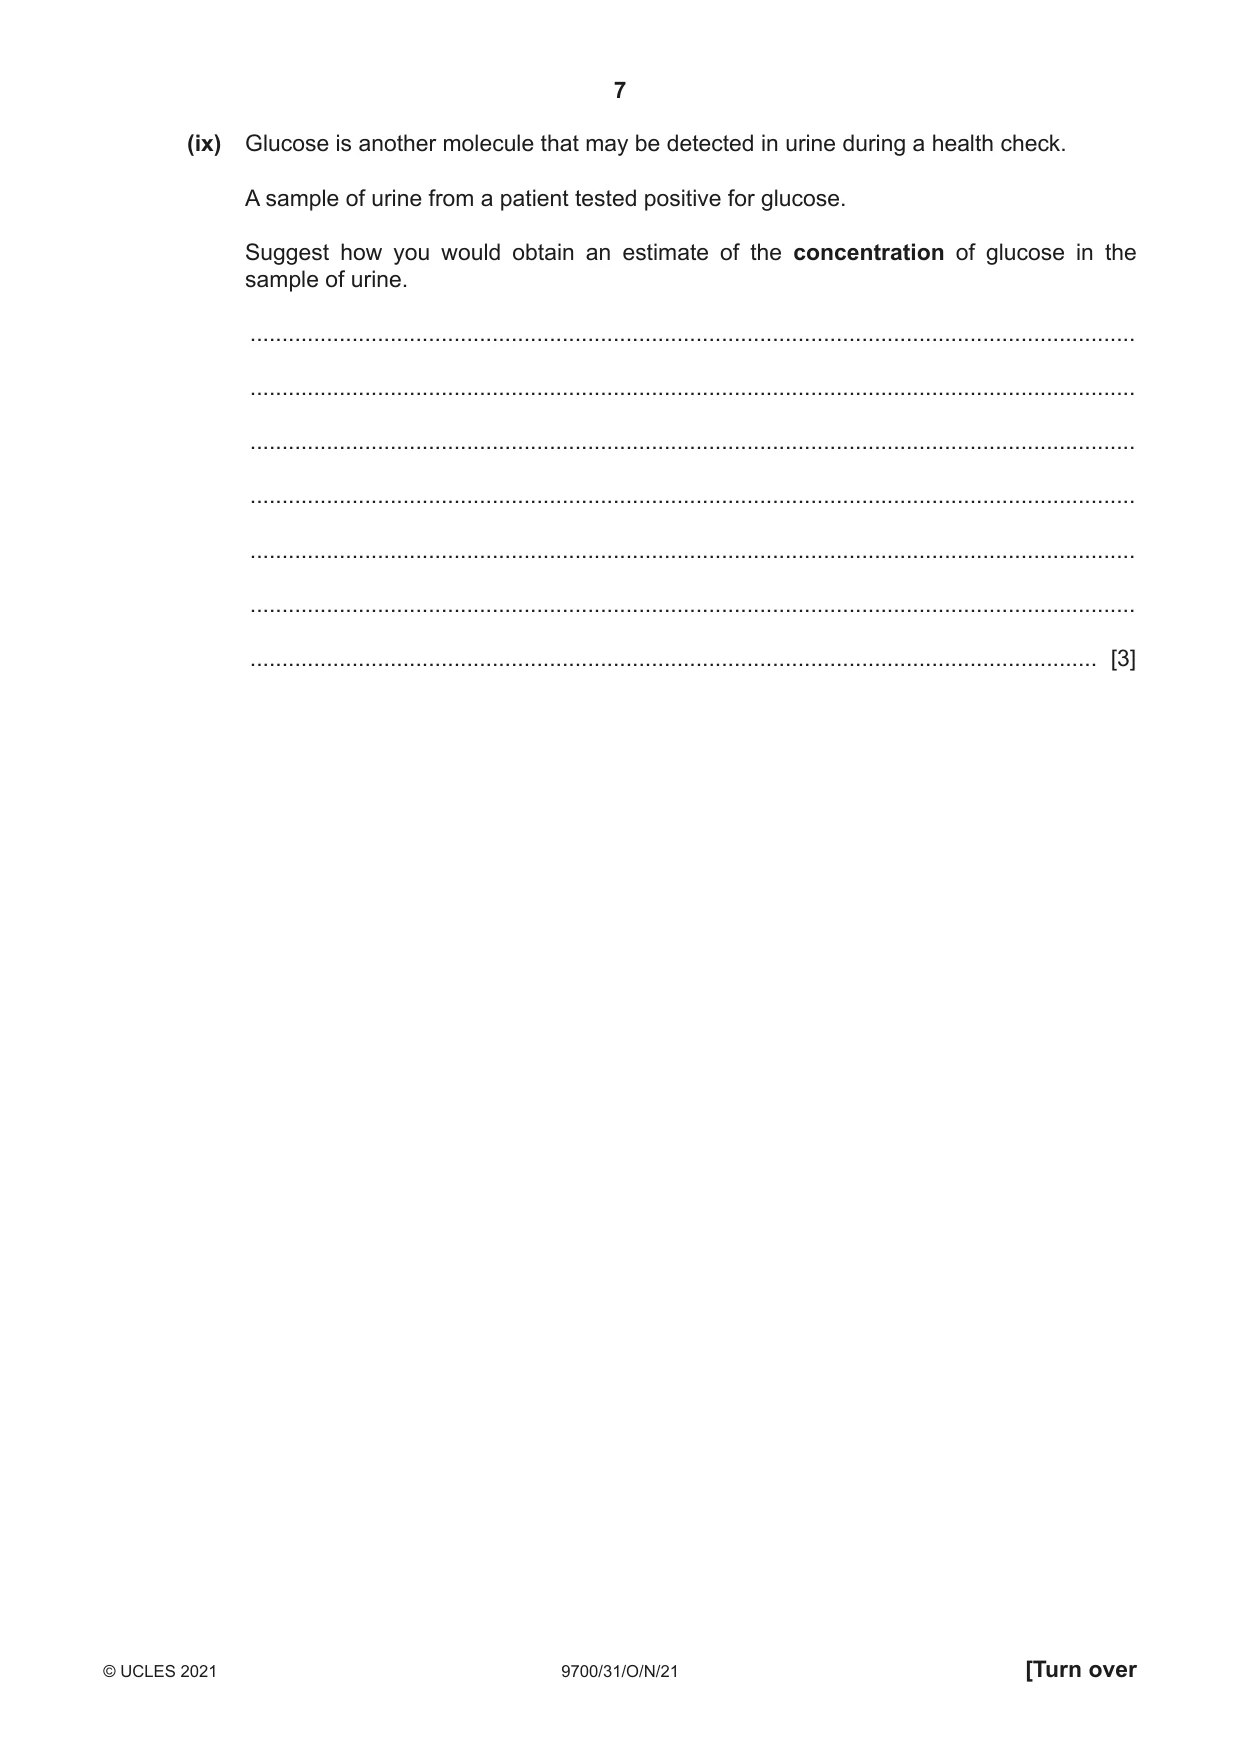
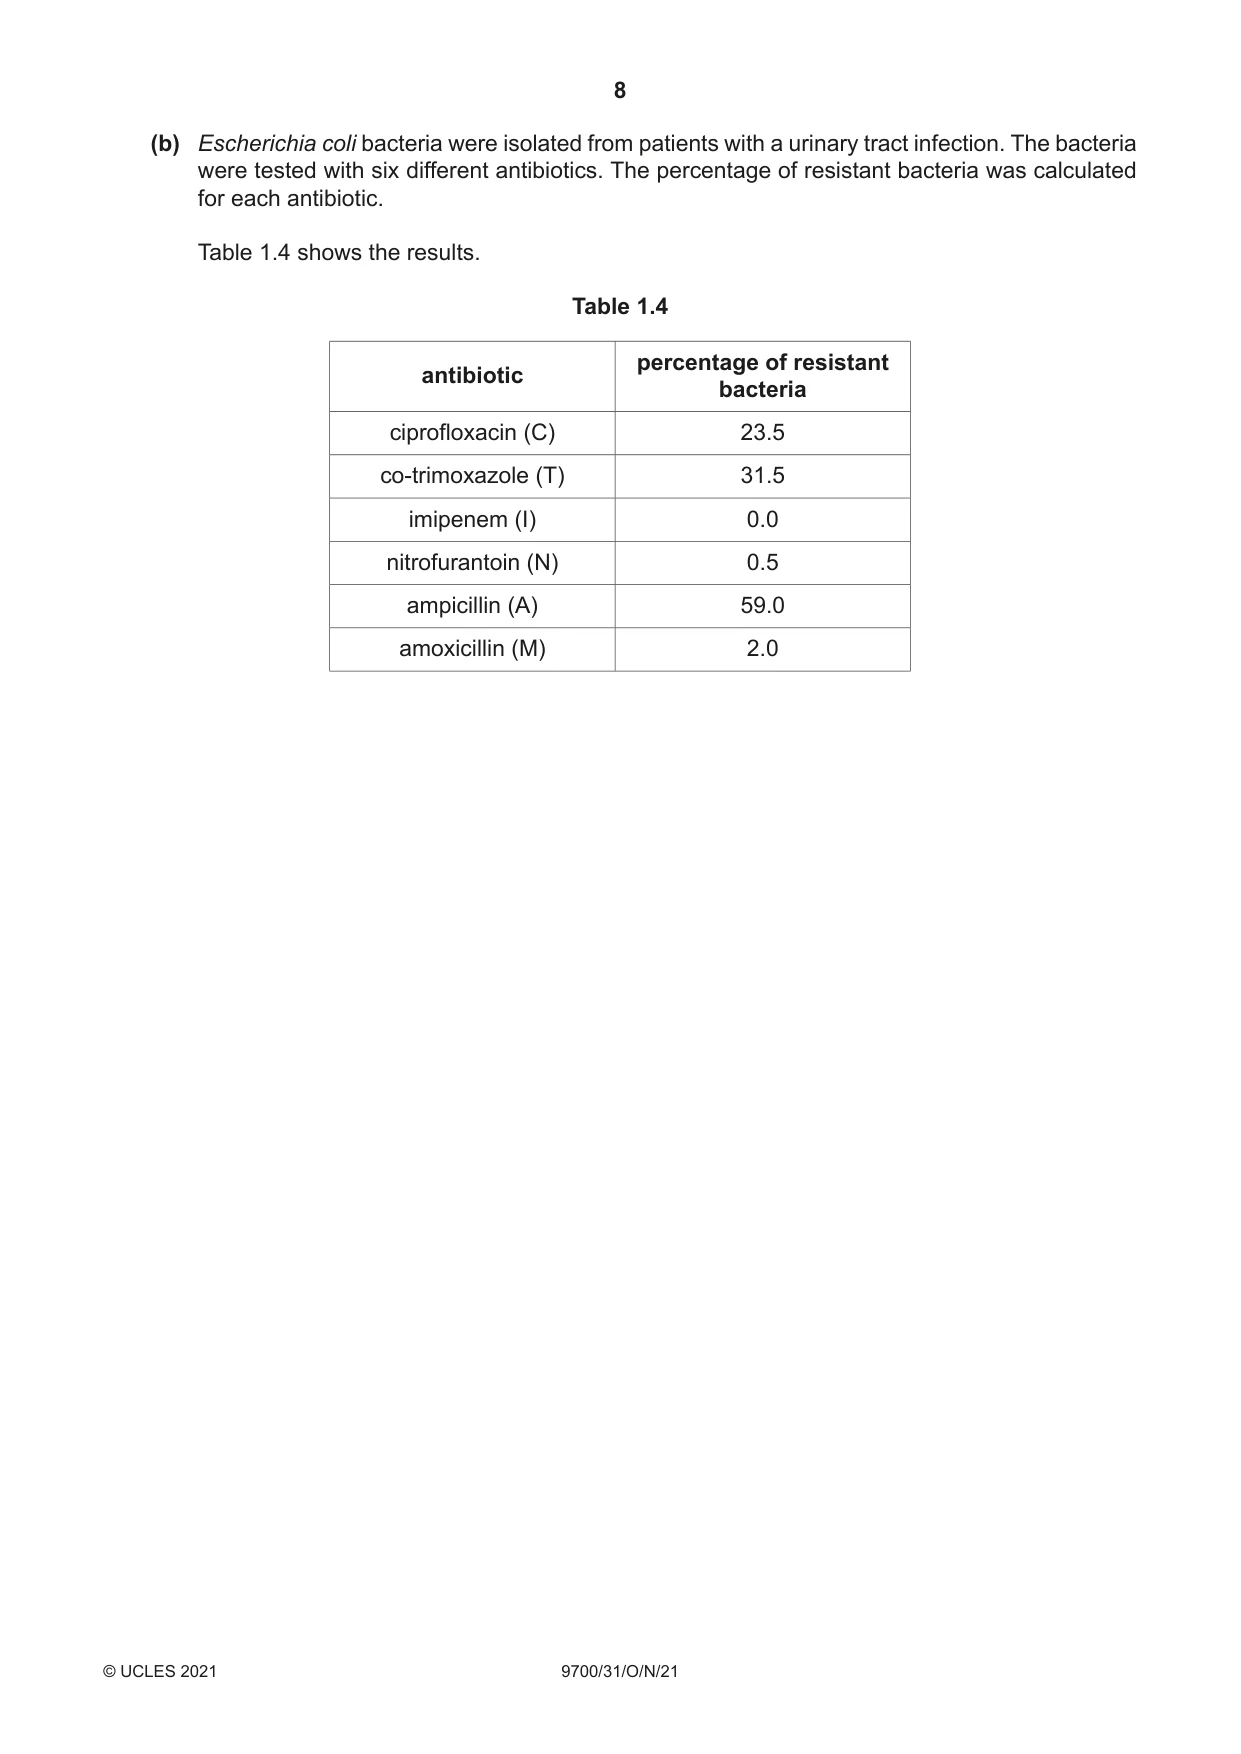
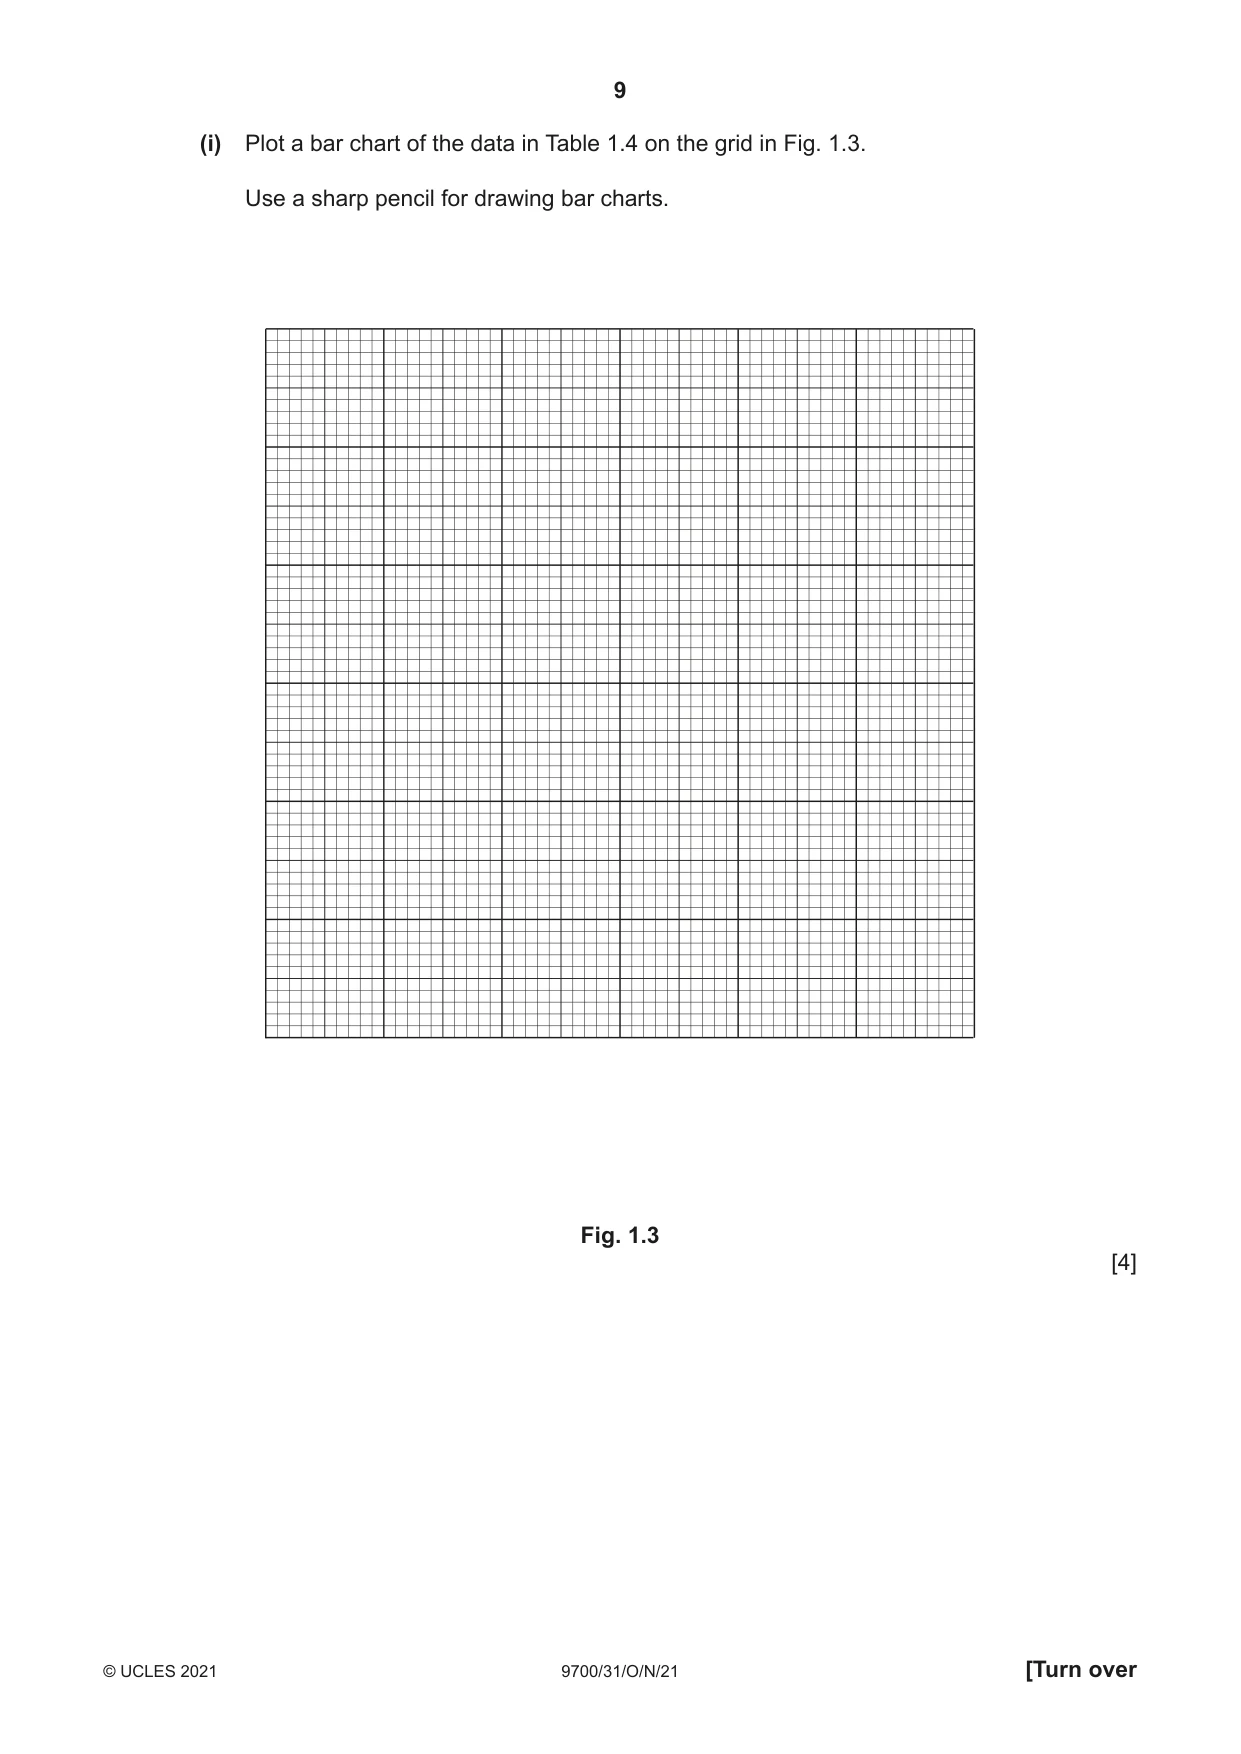
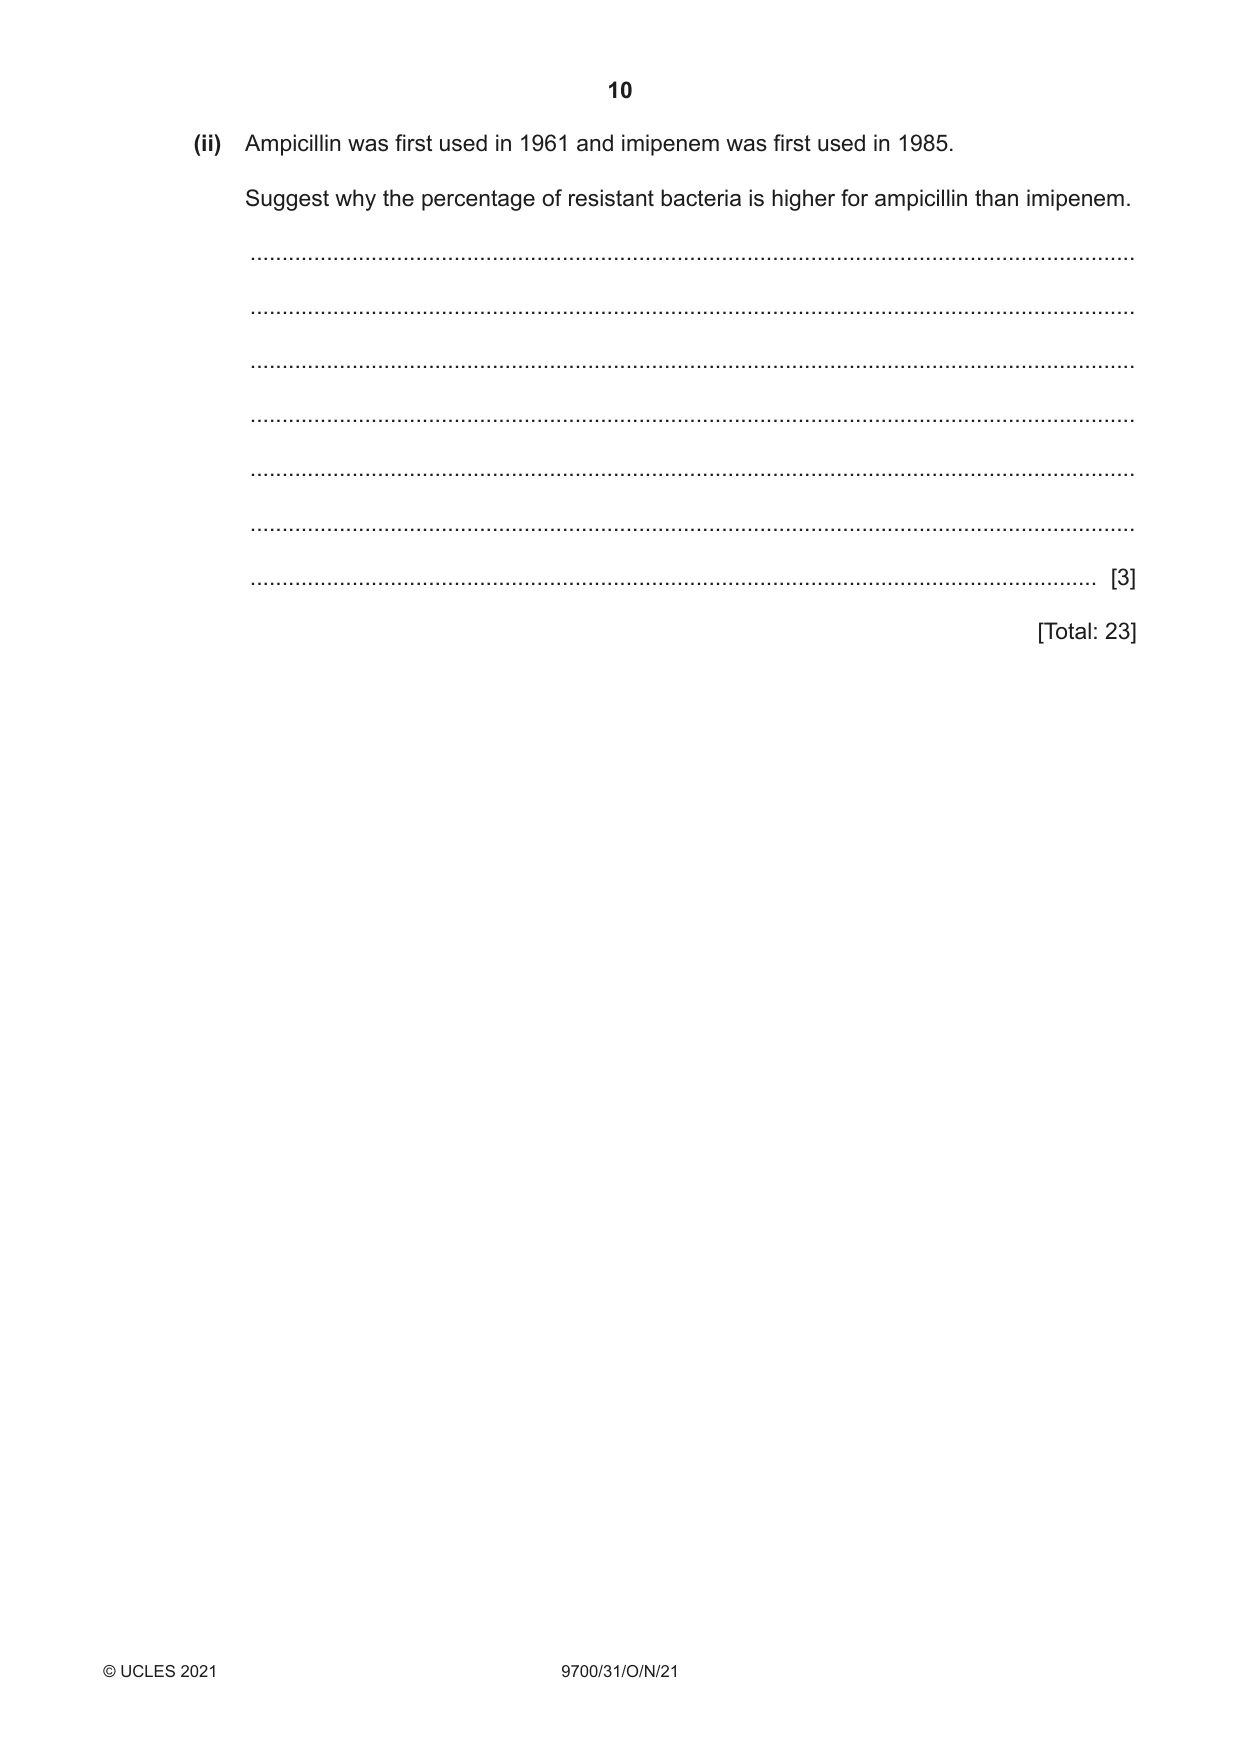
1 The kidneys are the organs that remove waste products from the blood and produce urine. Urine can be tested as part of a health check. People who have kidney disease or a urinary tract infection (UTI) may have unusually high concentrations of protein in their urine. You will be testing a solution that represents urine and will be referred to as ‘mock urine’. This represents a sample of urine from a patient with a possible kidney disease or urinary tract infection. You will determine the concentration of protein in this sample of mock urine. You are provided with the materials shown in Table 1.1. Table 1.1 labelled contents hazard volume / cm3 P 1.0% protein solution none 30 W distilled water none 50 C 0.15% copper sulfate solution none 20 K 5.0% potassium hydroxide solution harmful irritant 20 U mock urine none 10 If any solution comes into contact with your skin, wash off immediately under cold water. It is recommended that you wear suitable eye protection. (a) You will need to carry out a serial dilution of the 1.0% protein solution, P, to reduce the concentration by half between each successive dilution. You will need to prepare four concentrations of protein solution in addition to the 1.0% protein solution, P. After the serial dilution is completed, you will need to have 10 cm3 of each concentration available to use. (i) Complete Fig. 1.1 to show how you will prepare your serial dilution. Fig. 1.1 shows the first two beakers you will use to make your serial dilution. You will need to draw three additional beakers. For each beaker add labelled arrows to show: • the volume of protein solution transferred • the volume of distilled water, W, added. Under each beaker, state the concentration of protein solution. 0 cm3 of W ............................ 20 cm3 of ............................ 1.0% protein solution, P ............................ ............................ 10 cm3 of 1.0% protein solution to use ............................ ............................ ............................ ............................ Fig. 1.1 [3] Carry out step 1 to step 9. 1. Prepare the concentrations of protein solution, as decided in (a)(i), in the beakers provided. Use a glass rod to mix the protein solutions. 2. Label five of the test-tubes with the concentrations you prepared in step 1. 3. Put 1 cm3 of each concentration of protein solution into the appropriately labelled test-tube. 4. Label another test-tube 0.0% and put 1 cm3 of distilled water, W, into this test-tube. 5. Put 1 cm3 of K into each of the labelled test-tubes. Shake gently to mix. 6. Put 1 cm3 of C into each of the labelled test-tubes. Shake gently to mix. 7. Leave the test-tubes for 1 minute. Shake gently to mix. 8. Observe the colour of the liquid in each test-tube. To see the colour more clearly, it may help to hold a piece of white paper behind the test- tube. You may see the same colour in more than one test-tube. 9. Record your results in (a)(ii) using the symbols shown in Table 1.2. Table 1.2 colour symbol dark purple ++++++ purple +++++ pale purple ++++ blue +++ very pale blue/purple ++ no colour + (ii) Record your results in an appropriate table. You may use the same symbols for more than one test-tube. [4] (iii) State the independent variable in the investigation you have just carried out. ..................................................................................................................................... [1] You are provided with a sample of mock urine, U. This represents a sample of urine from a patient being tested for possible kidney disease. 10. Label a test-tube, U. 11. Put 1 cm3 of U into the test-tube. 12. Repeat step 5 to step 8 for U. Record your result for U in (a)(iv) using the symbols shown in Table 1.2. (iv) Record your result for U. result for U ......................................................... [1] (v) Fig. 1.2 shows a scale of protein concentrations used in this investigation. The position for 1.0% and 0.0% are shown on the scale. 1.0% 0.0% protein concentration Fig. 1.2 Complete the scale in Fig. 1.2 by showing the positions of the protein concentrations you prepared in step 1. [1] (vi) Use your results in (a)(ii) and (a)(iv) to estimate the protein concentration of U. Show your estimate of U on Fig. 1.2 by drawing an arrow (↓) at the correct position on the scale. Label the arrow U. [1] Table 1.3 shows the total mass of protein present in urine over 24 hours for people with different medical conditions. Table 1.3 total mass of protein in urine medical condition / mg 24 h–1 no condition <150 urinary tract infection 150–200 kidney tubular disease 200–500 glomerular disease >500 The 1.0% protein solution you used in (a)(i) represents a urine sample collected over a period of 24 hours that contains 1000 mg of protein. (vii) State the possible medical condition of the patient indicated by U, using your result in (a)(vi). ..................................................................................................................................... [1] (viii) Your result for U may be anomalous. State how you could confirm that your result for U is correct. ........................................................................................................................................... ..................................................................................................................................... [1] (ix) Glucose is another molecule that may be detected in urine during a health check. A sample of urine from a patient tested positive for glucose. Suggest how you would obtain an estimate of the concentration of glucose in the sample of urine. ........................................................................................................................................... ........................................................................................................................................... ........................................................................................................................................... ........................................................................................................................................... ........................................................................................................................................... ........................................................................................................................................... ..................................................................................................................................... [3] (b) Escherichia coli bacteria were isolated from patients with a urinary tract infection. The bacteria were tested with six different antibiotics. The percentage of resistant bacteria was calculated for each antibiotic. Table 1.4 shows the results. Table 1.4 percentage of resistant antibiotic bacteria ciprofloxacin (C) 23.5 co-trimoxazole (T) 31.5 imipenem (I) 0.0 nitrofurantoin (N) 0.5 ampicillin (A) 59.0 amoxicillin (M) 2.0 (i) Plot a bar chart of the data in Table 1.4 on the grid in Fig. 1.3. Use a sharp pencil for drawing bar charts. Fig. 1.3 [4] (ii) Ampicillin was first used in 1961 and imipenem was first used in 1985. Suggest why the percentage of resistant bacteria is higher for ampicillin than imipenem. ........................................................................................................................................... ........................................................................................................................................... ........................................................................................................................................... ........................................................................................................................................... ........................................................................................................................................... ........................................................................................................................................... ..................................................................................................................................... [3] [Total: 23]
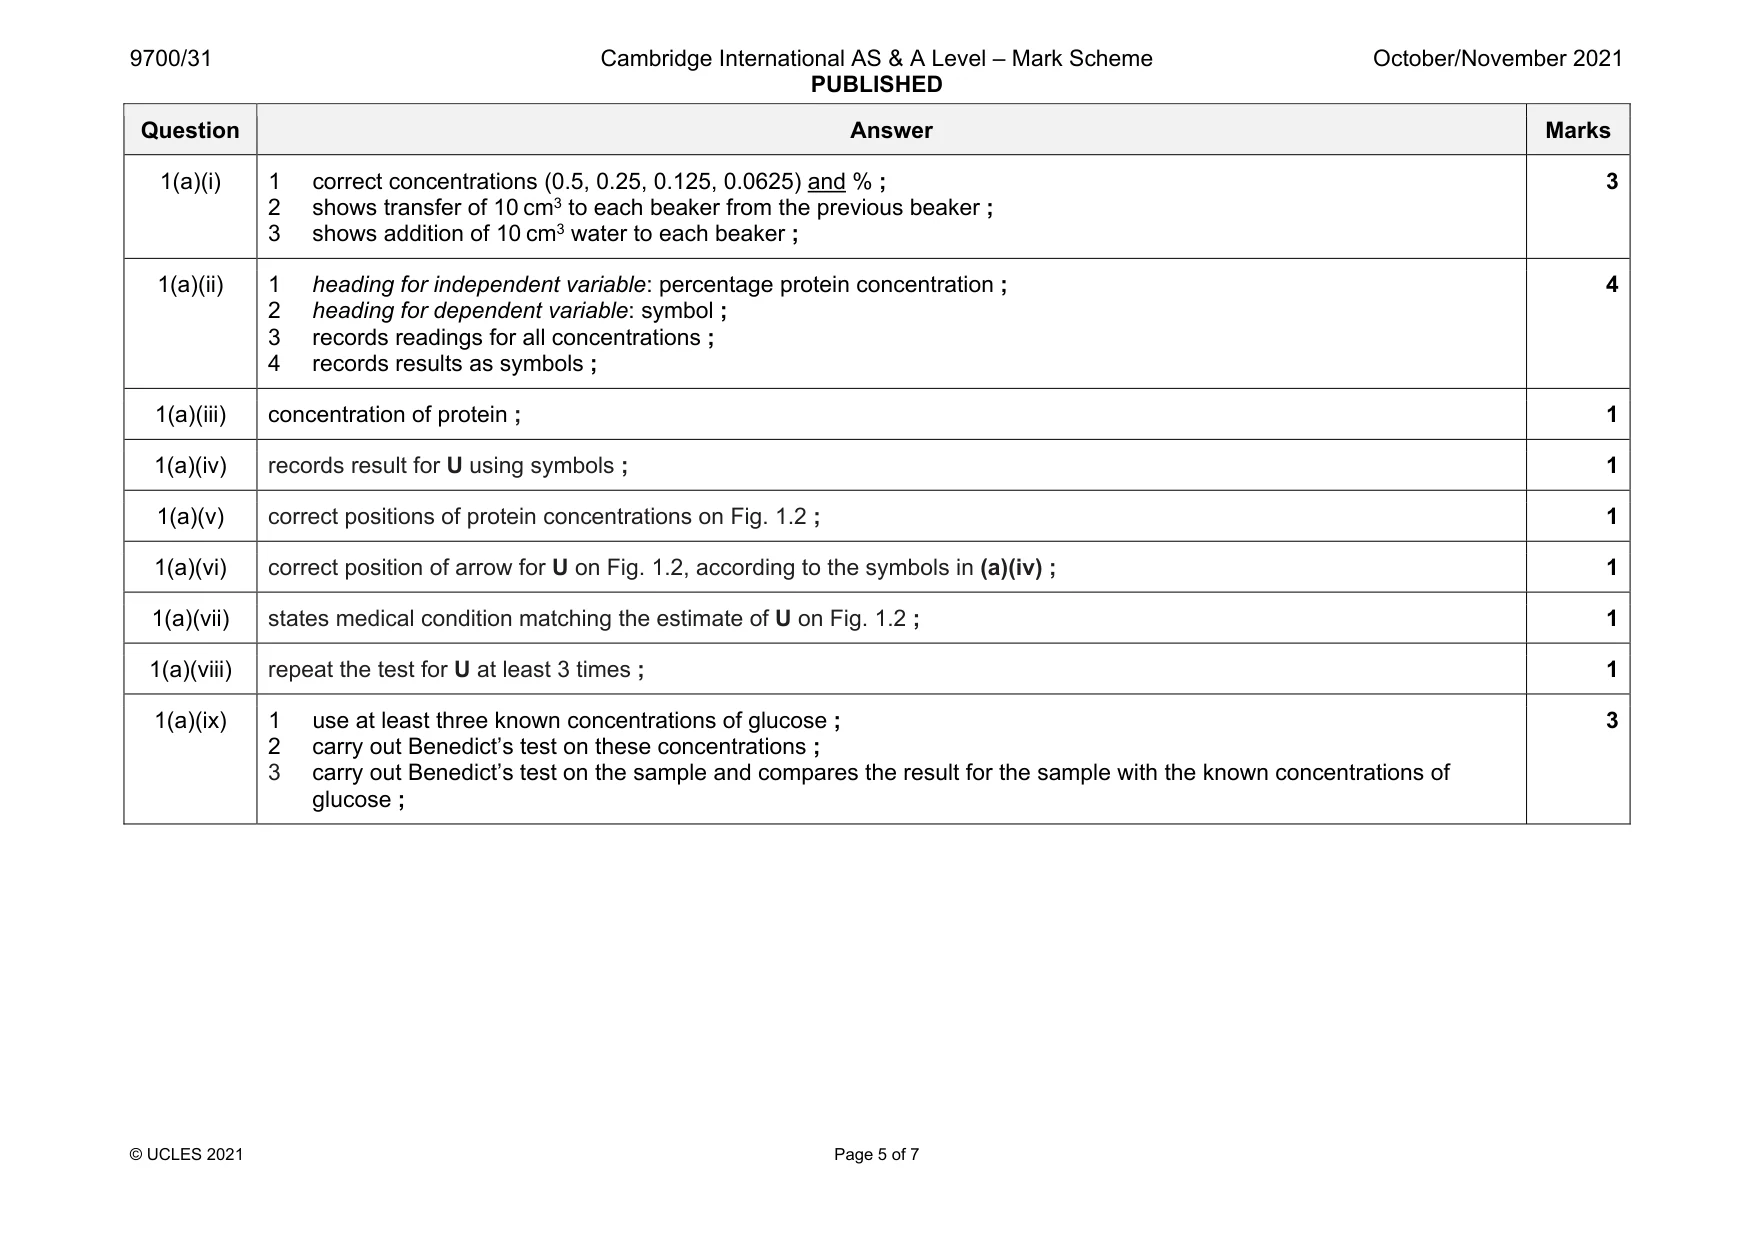
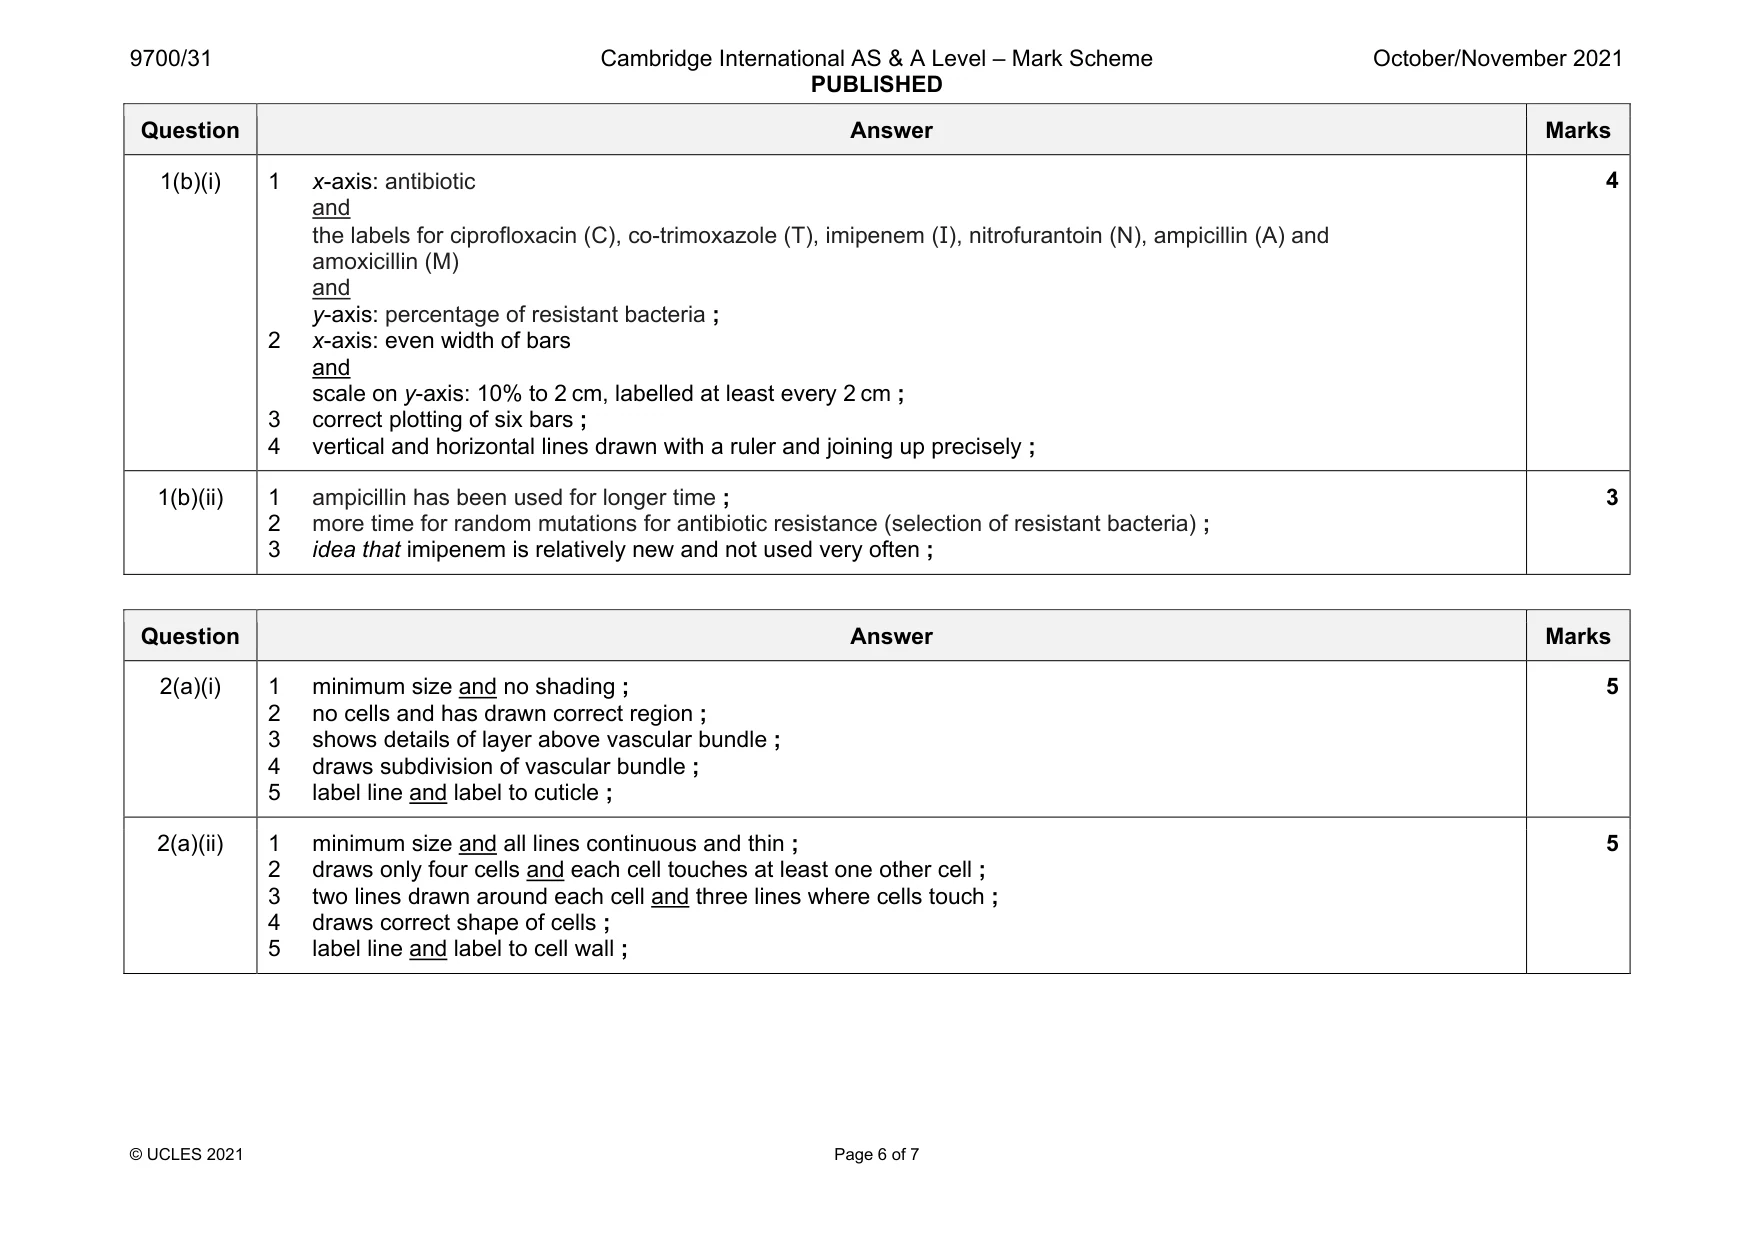
Mark scheme: 1(a)(i) 1 correct concentrations (0.5, 0.25, 0.125, 0.0625) and % ; 2 shows transfer of 10 cm3 to each beaker from the previous beaker ; 3 shows addition of 10 cm3 water to each beaker ; 3 1(a)(ii) 1 heading for independent variable: percentage protein concentration ; 2 heading for dependent variable: symbol ; 3 records readings for all concentrations ; 4 records results as symbols ; 4 1(a)(iii) concentration of protein ; 1 1(a)(iv) records result for U using symbols ; 1 1(a)(v) correct positions of protein concentrations on Fig. 1.2 ; 1 1(a)(vi) correct position of arrow for U on Fig. 1.2, according to the symbols in (a)(iv) ; 1 1(a)(vii) states medical condition matching the estimate of U on Fig. 1.2 ; 1 1(a)(viii) repeat the test for U at least 3 times ; 1 1(a)(ix) 1 use at least three known concentrations of glucose ; 2 carry out Benedict’s test on these concentrations ; 3 carry out Benedict’s test on the sample and compares the result for the sample with the known concentrations of glucose ; 3 Question Answer Marks 1(b)(i) 1 x-axis: antibiotic and the labels for ciprofloxacin (C), co-trimoxazole (T), imipenem (I), nitrofurantoin (N), ampicillin (A) and amoxicillin (M) and y-axis: percentage of resistant bacteria ; 2 x-axis: even width of bars and scale on y-axis: 10% to 2 cm, labelled at least every 2 cm ; 3 correct plotting of six bars ; 4 vertical and horizontal lines drawn with a ruler and joining up precisely ; 4 1(b)(ii) 1 ampicillin has been used for longer time ; 2 more time for random mutations for antibiotic resistance (selection of resistant bacteria) ; 3 idea that imipenem is relatively new and not used very often ; 3
Q2 · J1 is a slide of a stained transverse section through a plant leaf
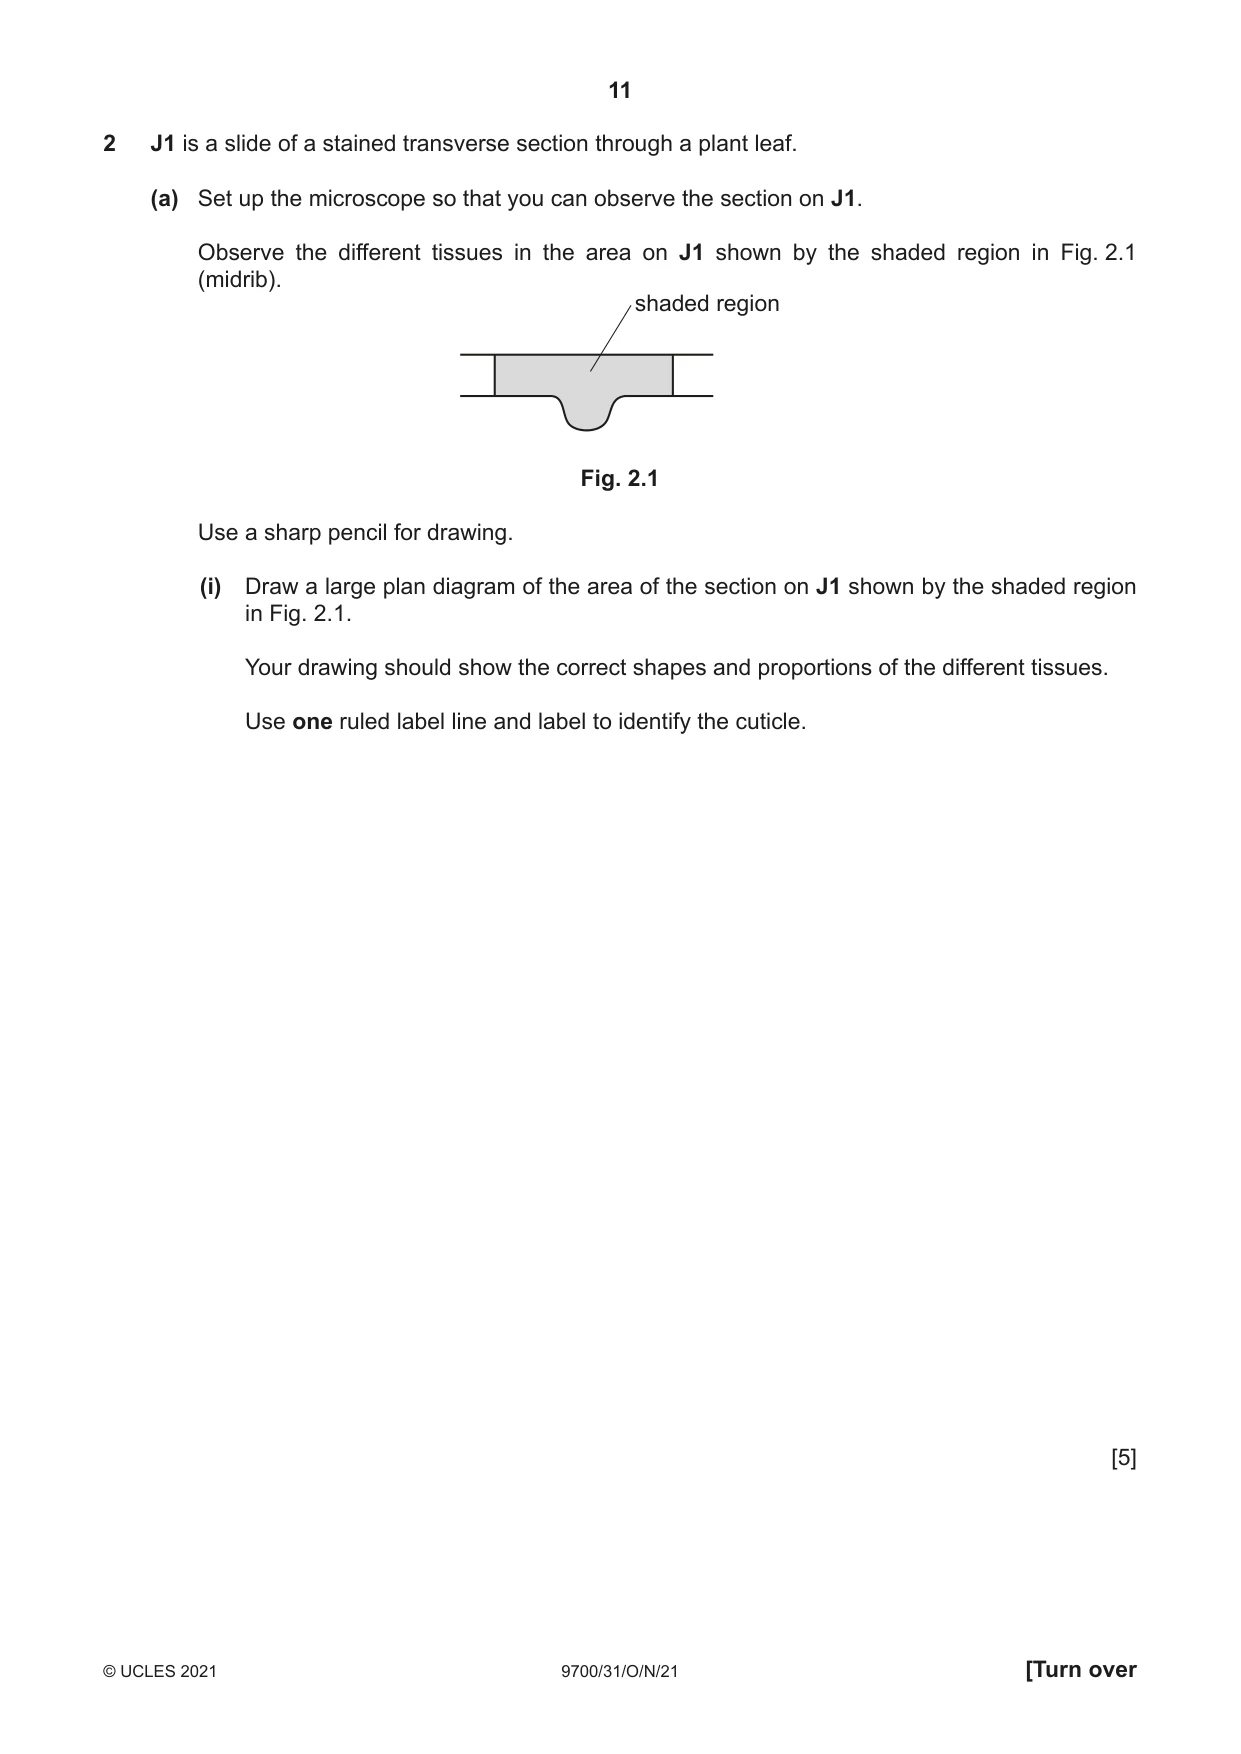
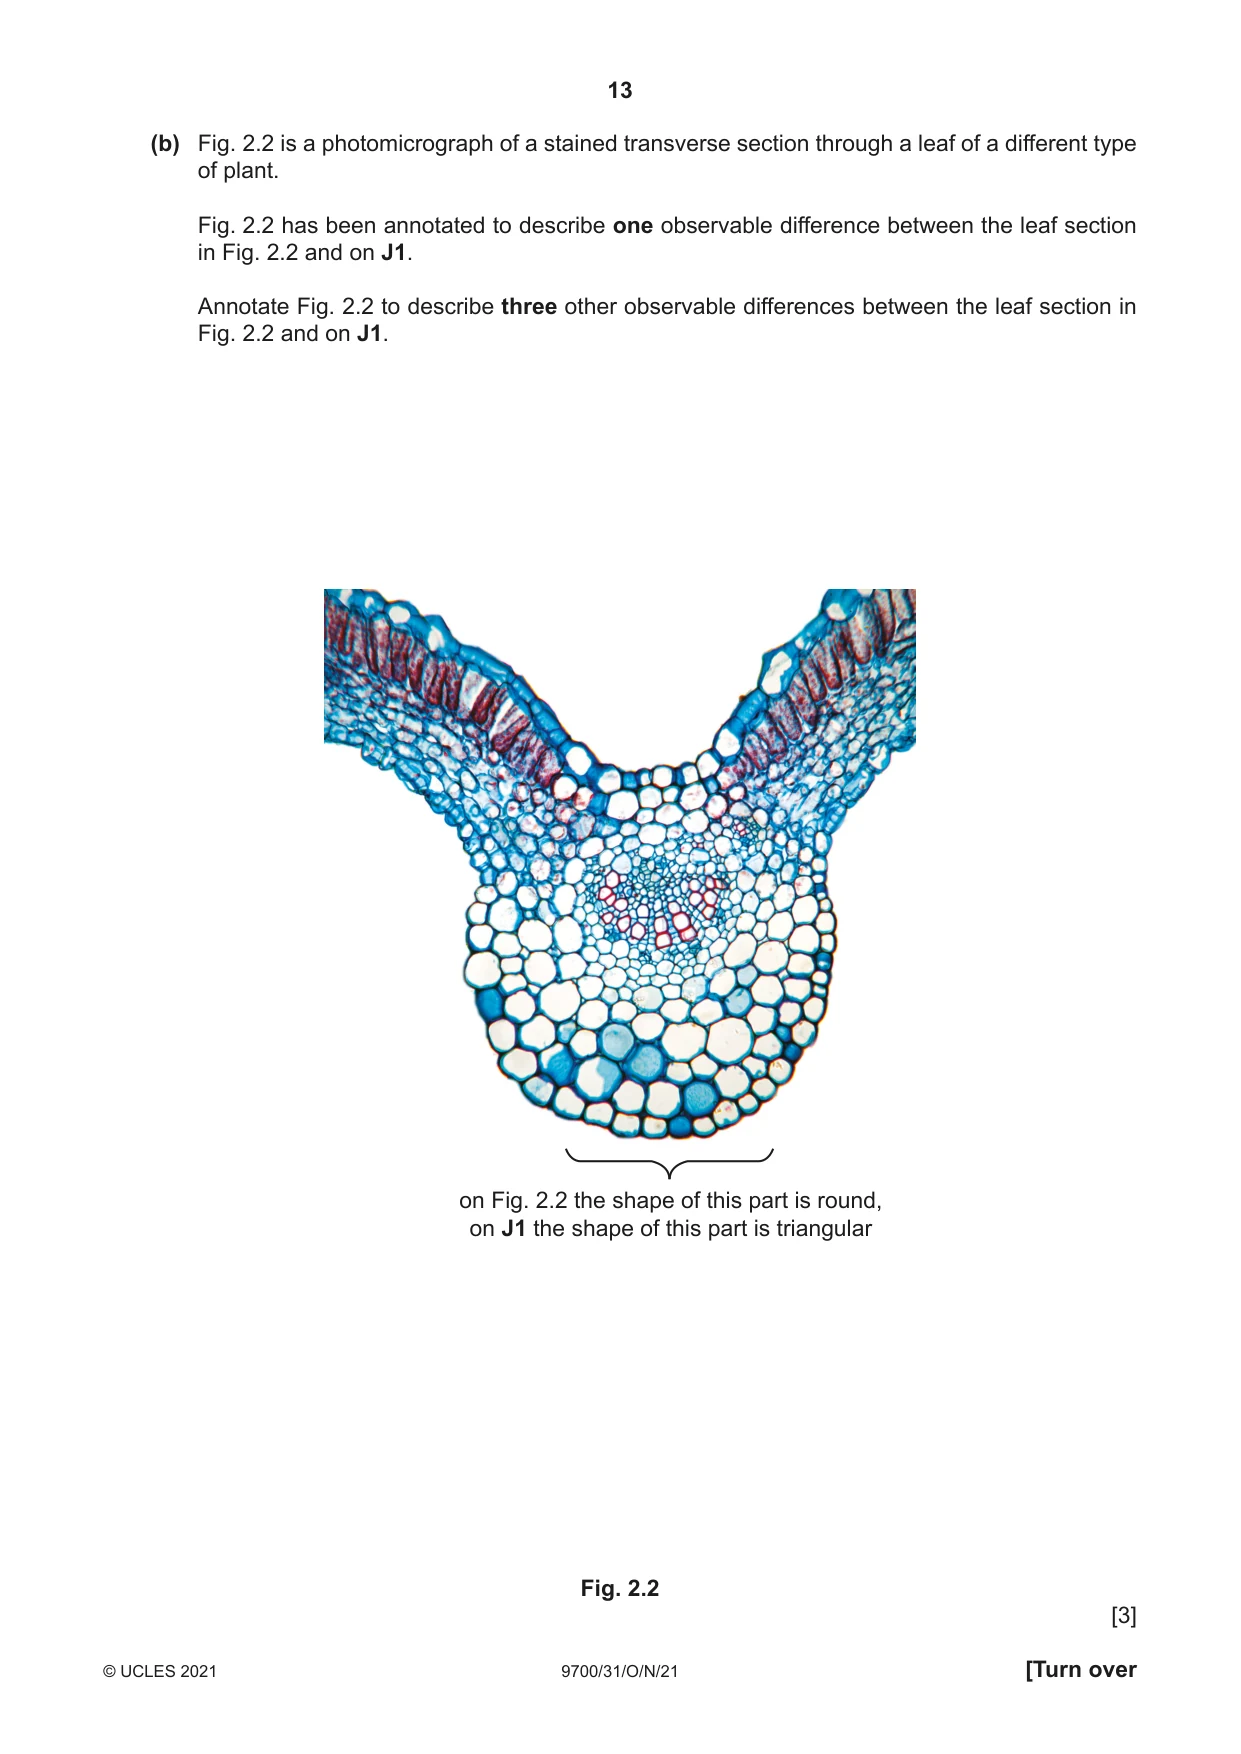
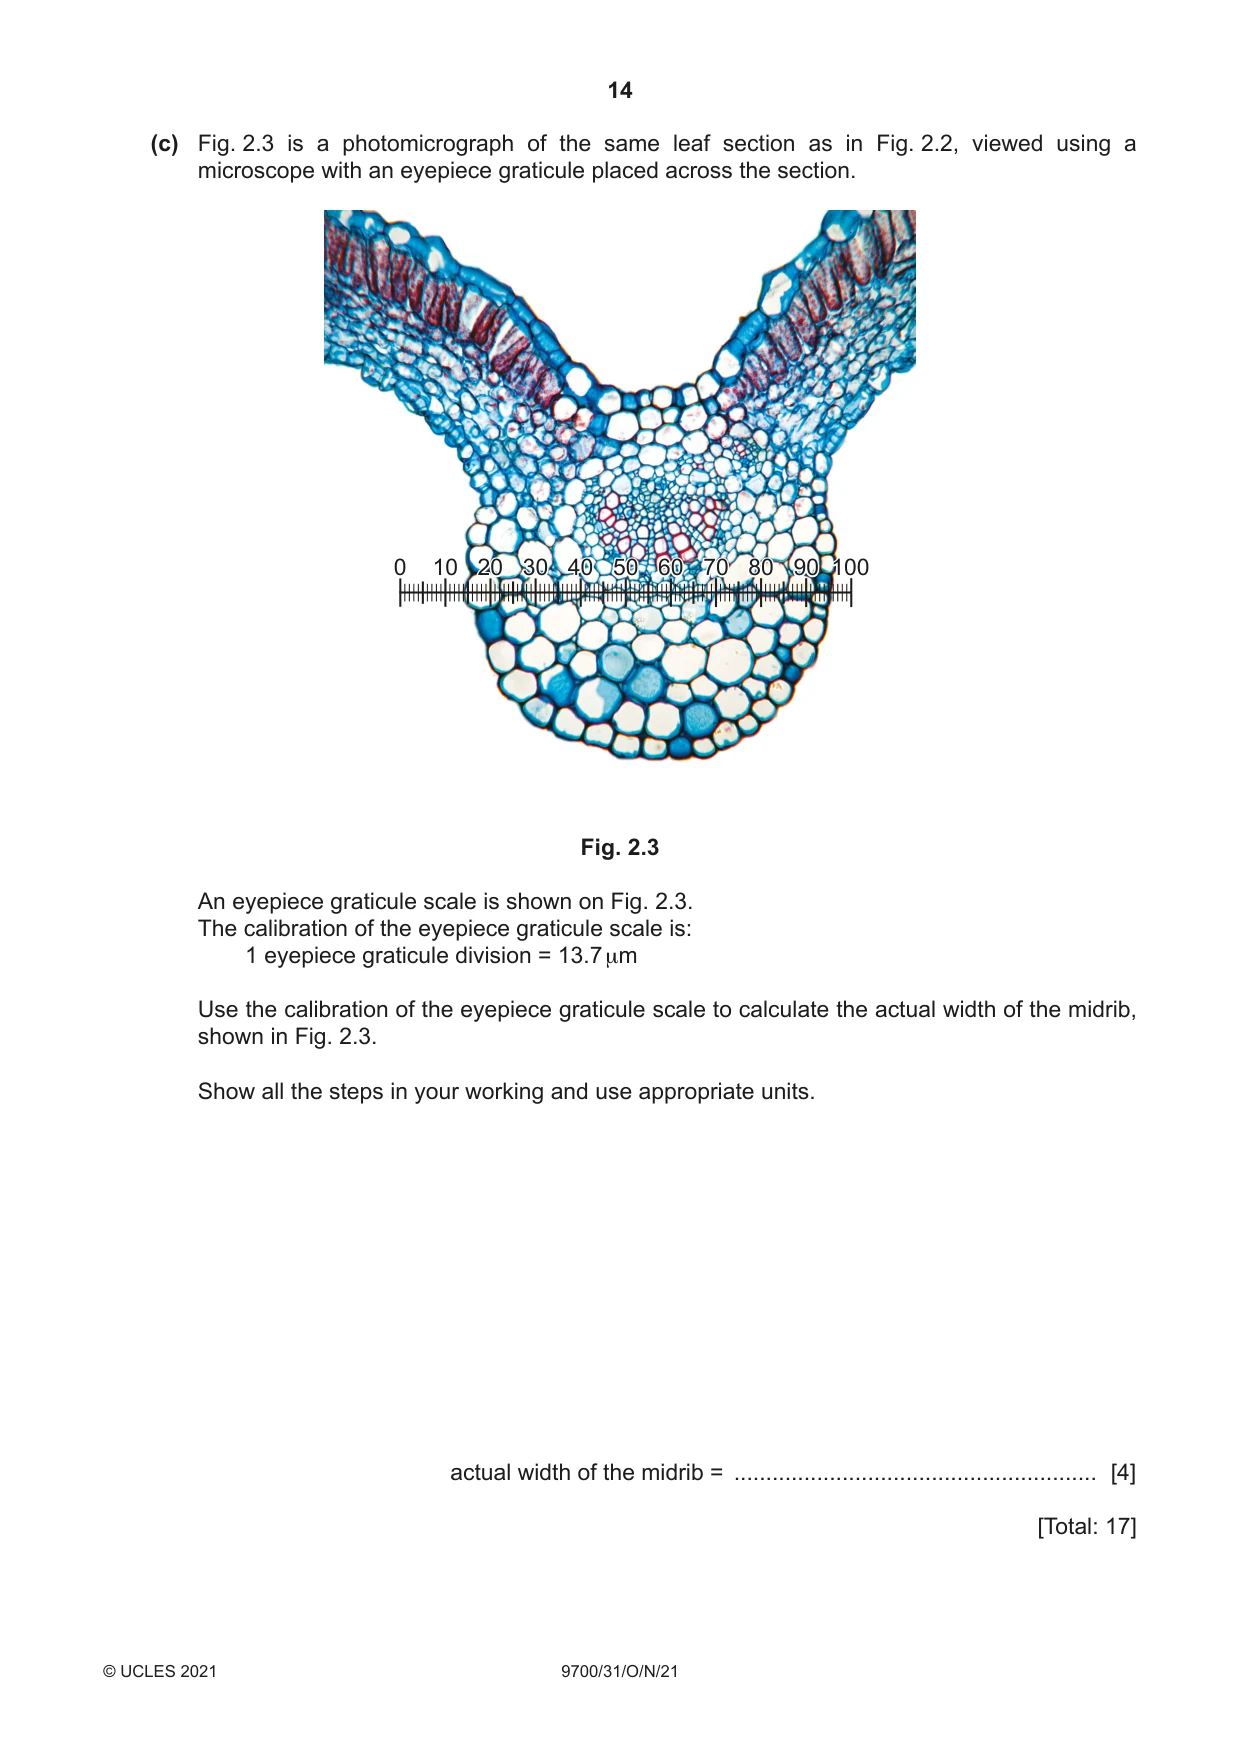
2 J1 is a slide of a stained transverse section through a plant leaf. (a) Set up the microscope so that you can observe the section on J1. Observe the different tissues in the area on J1 shown by the shaded region in Fig. 2.1 (midrib). shaded region Fig. 2.1 Use a sharp pencil for drawing. (i) Draw a large plan diagram of the area of the section on J1 shown by the shaded region in Fig. 2.1. Your drawing should show the correct shapes and proportions of the different tissues. Use one ruled label line and label to identify the cuticle. [5] (ii) Observe the cells in the layer below the upper epidermis of the midrib of the section on J1. Select four adjacent cells that make up this tissue. Each cell must touch at least one of the other cells. • Make a large drawing of this line of four cells. • Use one ruled label line and label to identify the cell wall of one cell. [5] (b) Fig. 2.2 is a photomicrograph of a stained transverse section through a leaf of a different type of plant. Fig. 2.2 has been annotated to describe one observable difference between the leaf section in Fig. 2.2 and on J1. Annotate Fig. 2.2 to describe three other observable differences between the leaf section in Fig. 2.2 and on J1. on Fig. 2.2 the shape of this part is round, on J1 the shape of this part is triangular Fig. 2.2 [3]
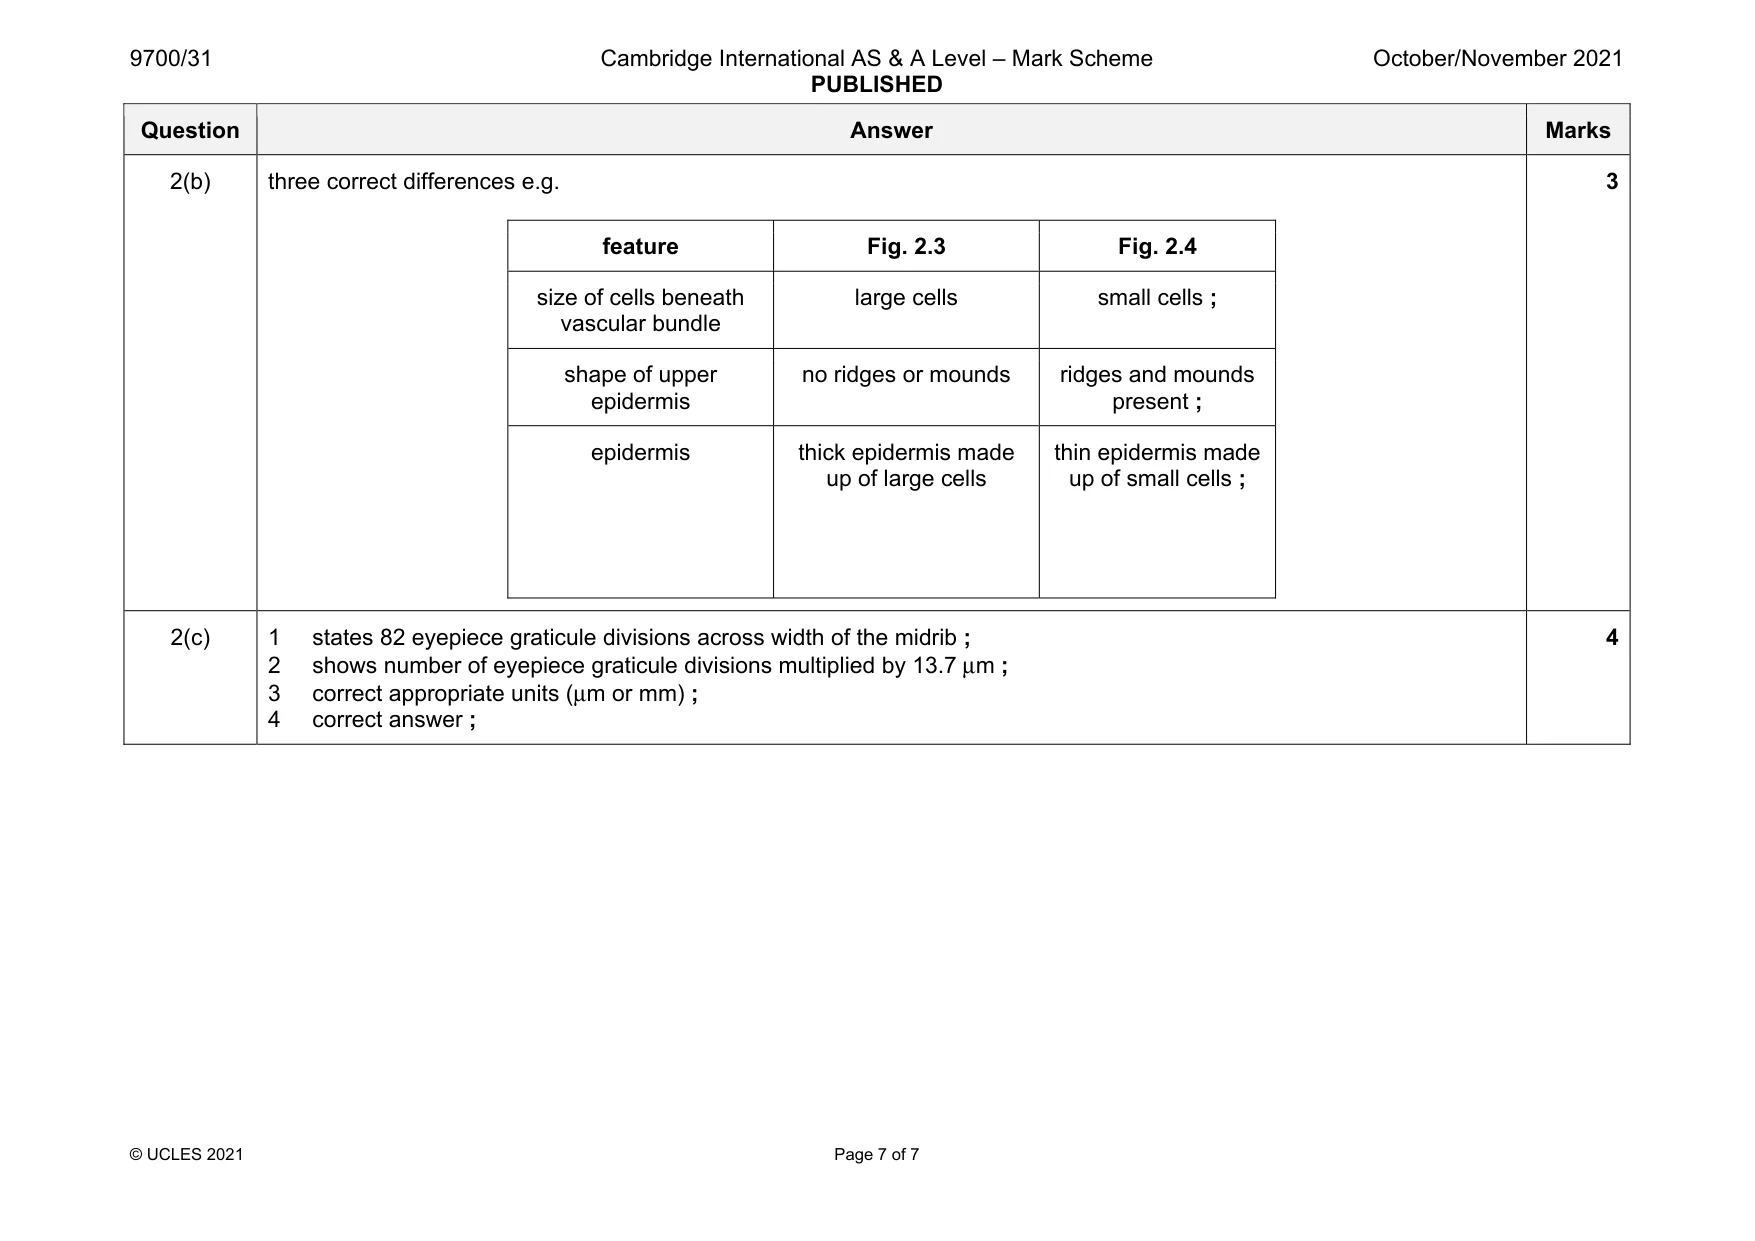
Mark scheme: 2(a)(i) 1 minimum size and no shading ; 2 no cells and has drawn correct region ; 3 shows details of layer above vascular bundle ; 4 draws subdivision of vascular bundle ; 5 label line and label to cuticle ; 5 2(a)(ii) 1 minimum size and all lines continuous and thin ; 2 draws only four cells and each cell touches at least one other cell ; 3 two lines drawn around each cell and three lines where cells touch ; 4 draws correct shape of cells ; 5 label line and label to cell wall ; 5 Question Answer Marks 2(b) three correct differences e.g. feature Fig. 2.3 Fig. 2.4 size of cells beneath vascular bundle large cells small cells ; shape of upper epidermis no ridges or mounds ridges and mounds present ; epidermis thick epidermis made up of large cells thin epidermis made up of small cells ; 3 2(c) 1 states 82 eyepiece graticule divisions across width of the midrib ; 2 shows number of eyepiece graticule divisions multiplied by 13.7 μm ; 3 correct appropriate units (μm or mm) ; 4 correct answer ; 4
What was in this paper
The subtopics covered by these 2 questions, and how many questions each got. Open one in a new tab to see every Cambridge question on it.
What you needed in this session
Cambridge’s own grade thresholds for 2021 Oct/Nov, Paper 3 · Variant 1. A higher threshold means an easier paper — the bar moves with how the cohort did.