Cambridge A Level Biology 9700 — 2021 Oct/Nov Paper 3 · Variant 4
9700/34/O/N/21 · 2 questions · 40 marks · ≈45 min
The question paper and its mark scheme, free to read here and free to download. This is Cambridge’s own paper, exactly as it was sat.
Question paper16 pages


Mark scheme8 pages
Answers below. Sit the paper first if you are practising.
Questions as text
Q1 · Visking tubing is a selectively permeable membrane, similar to a cell membrane
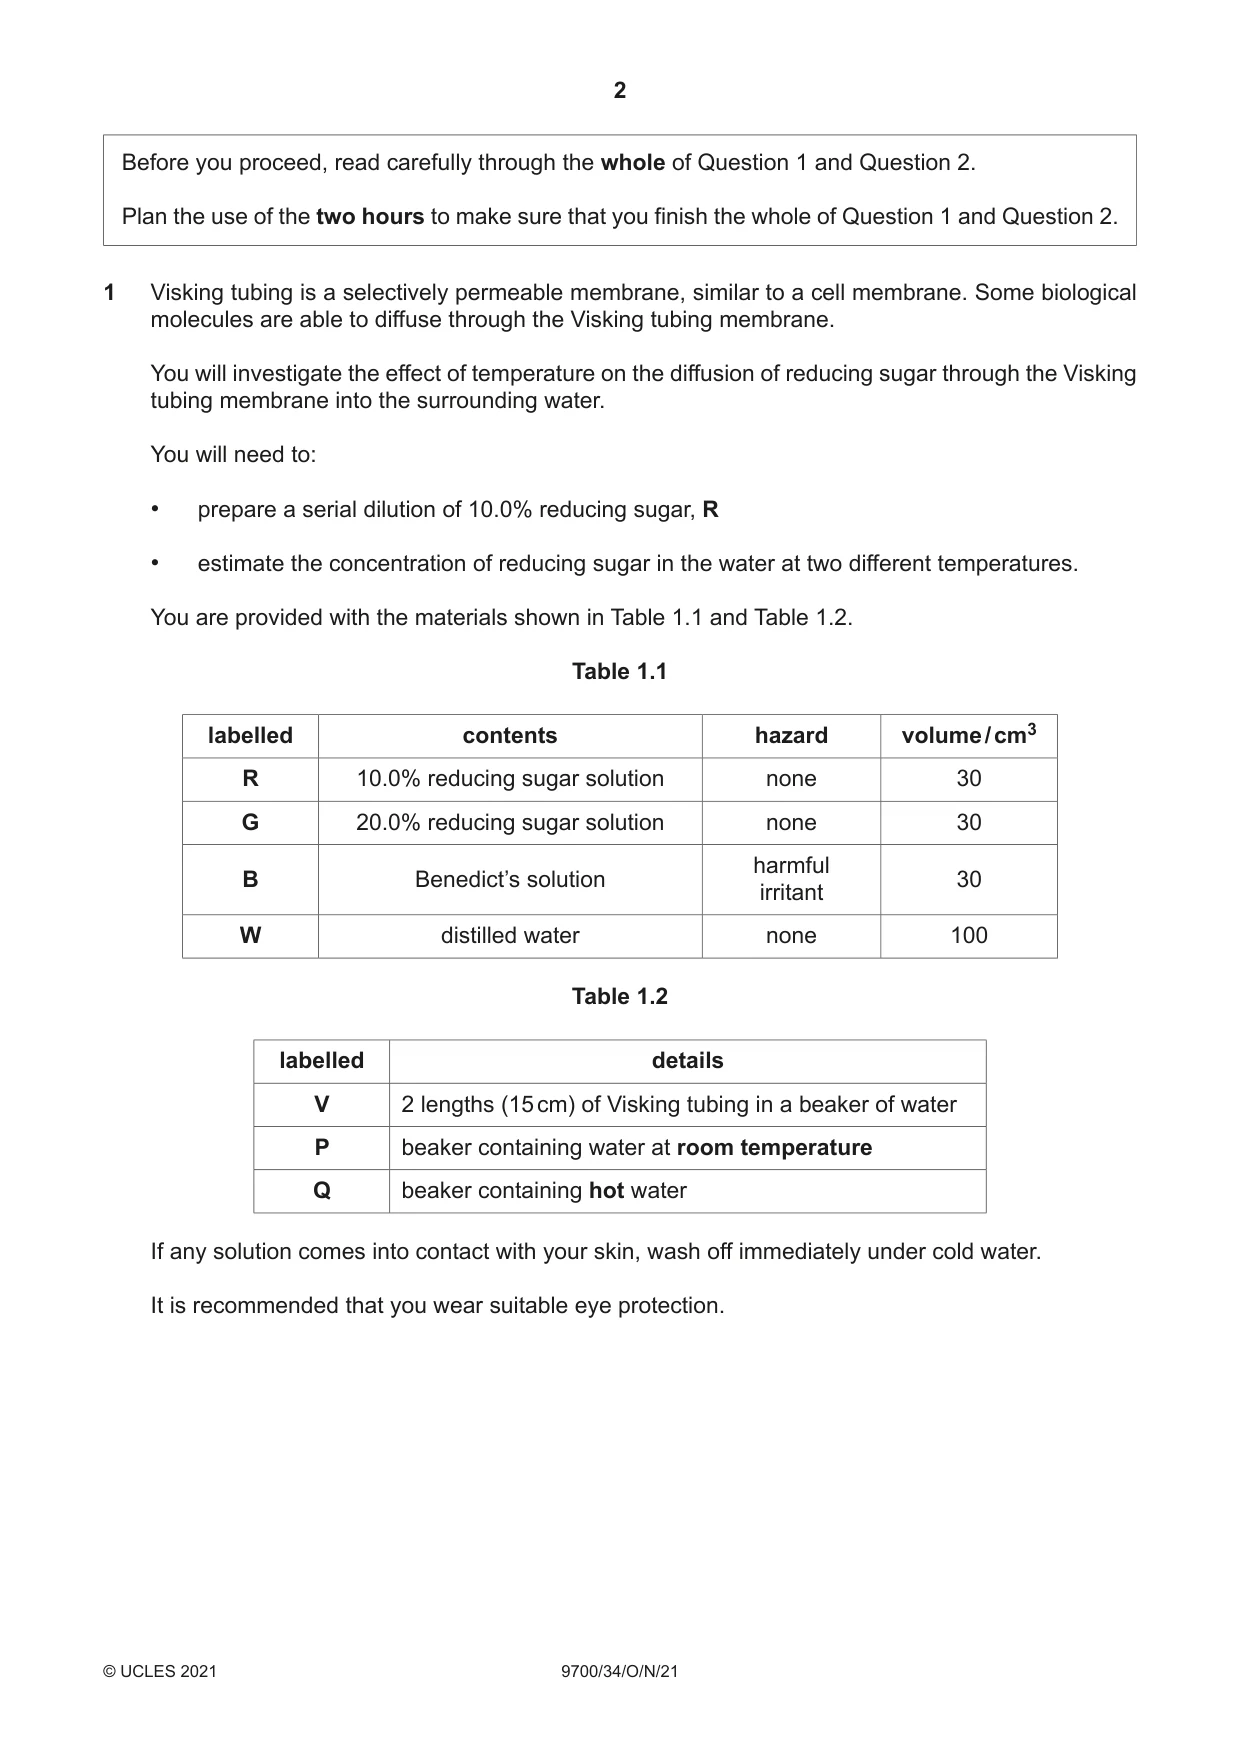
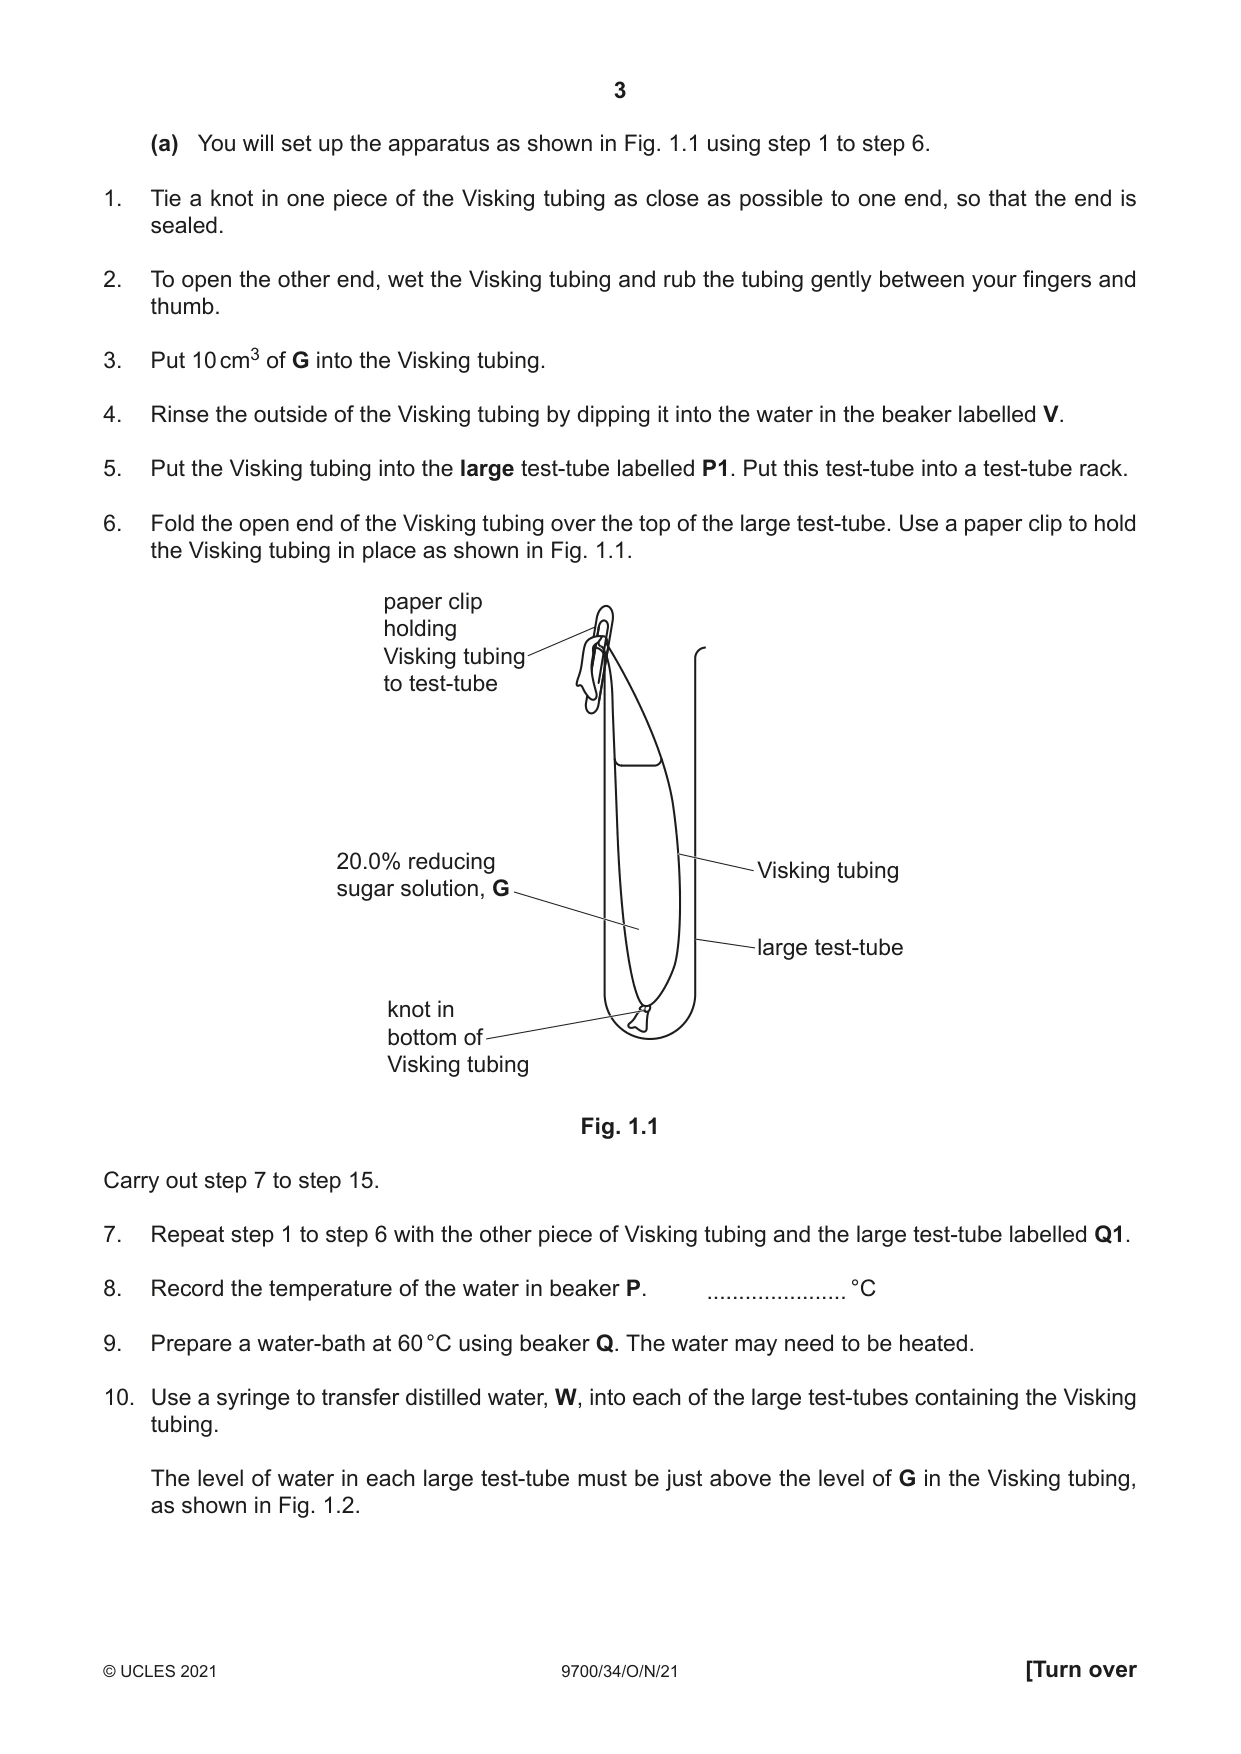
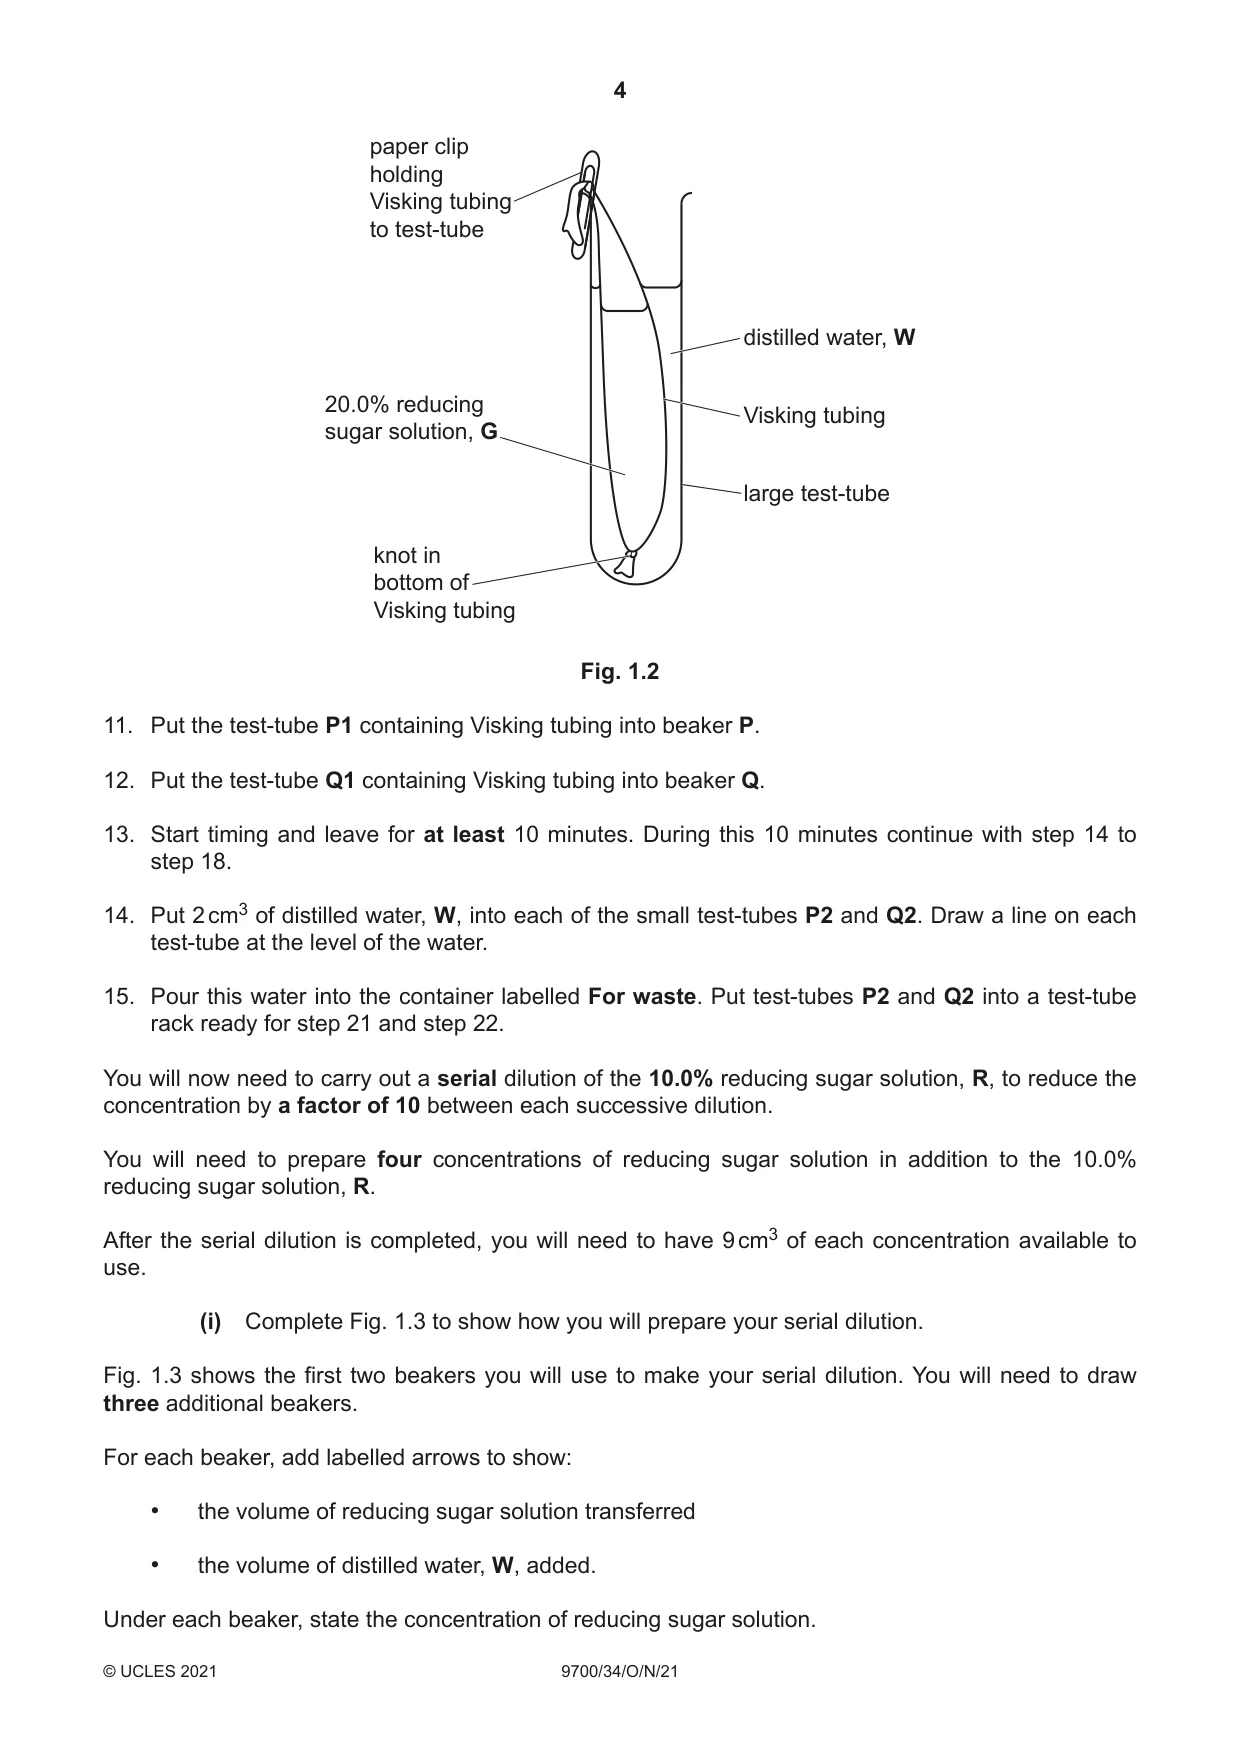
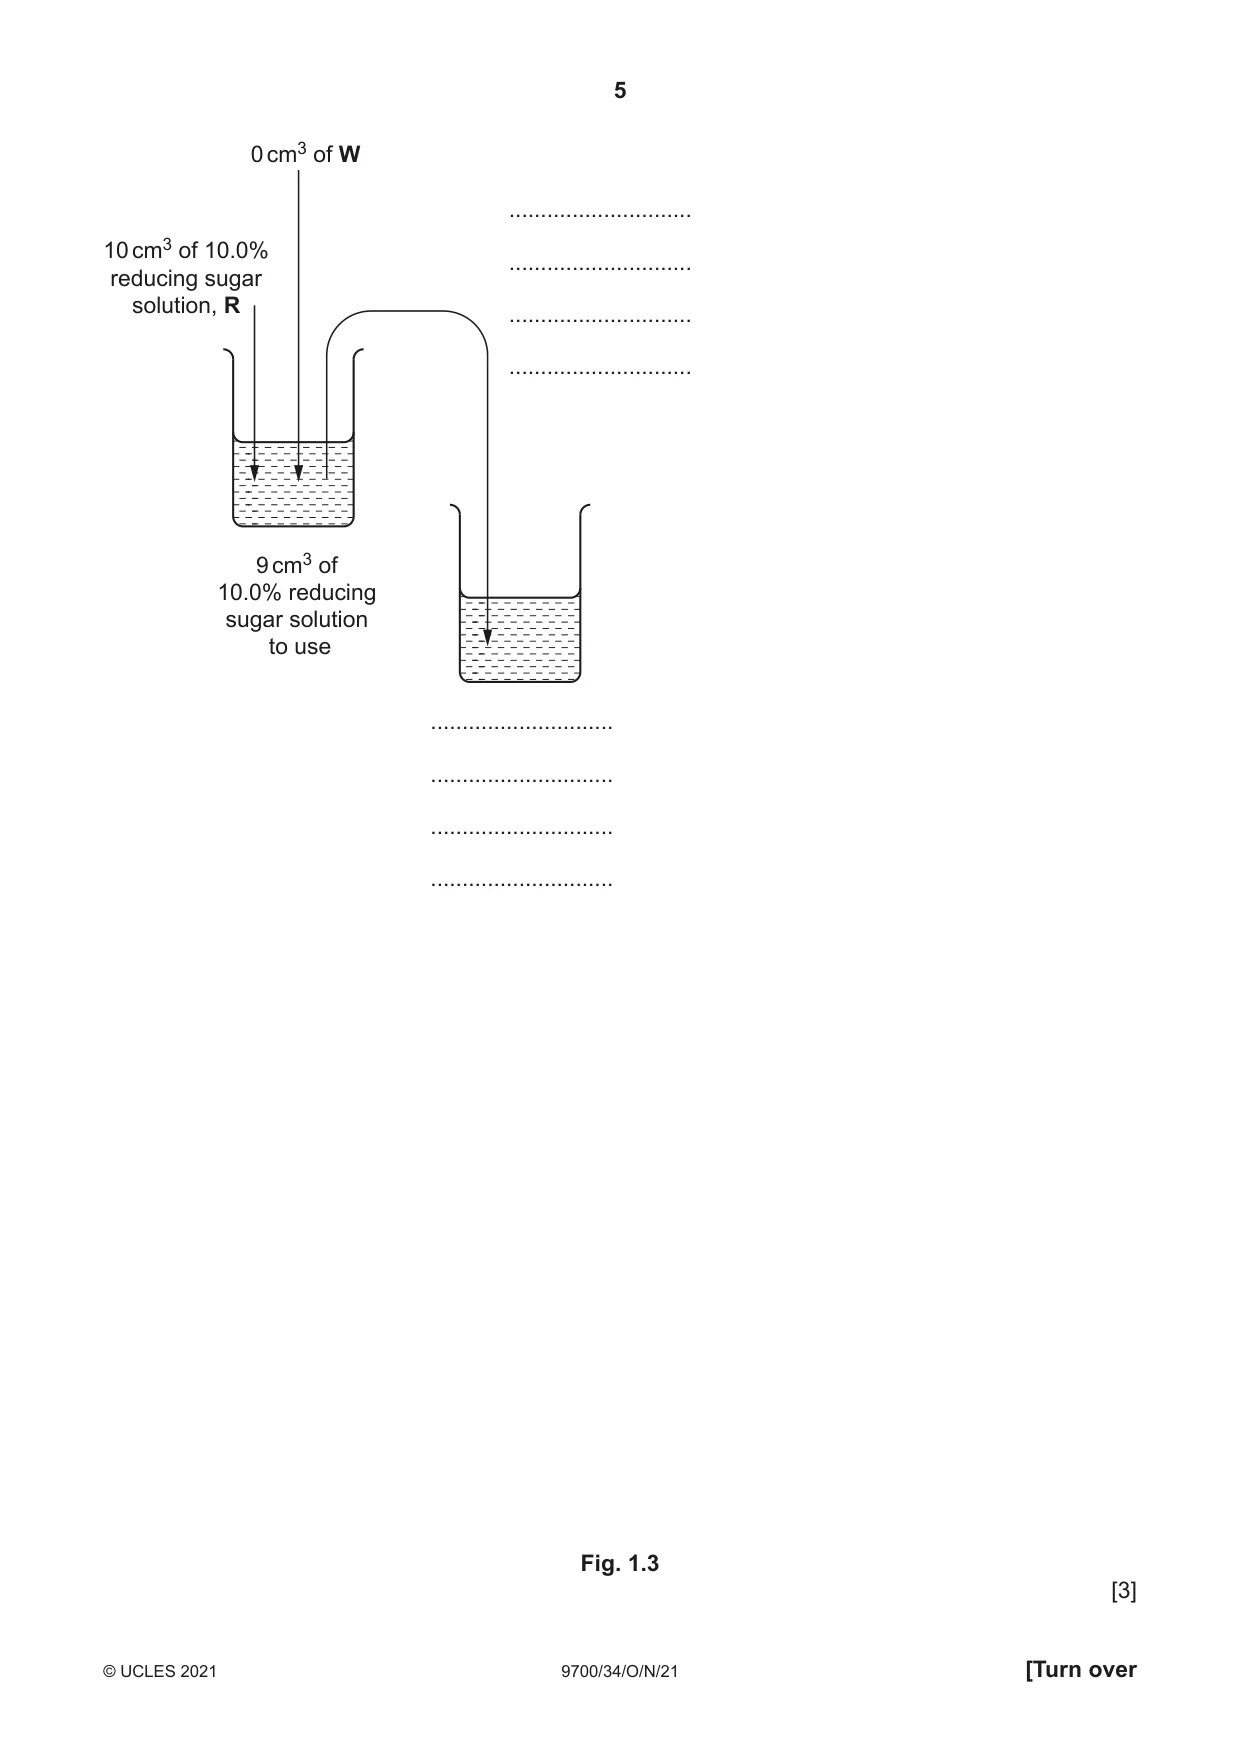
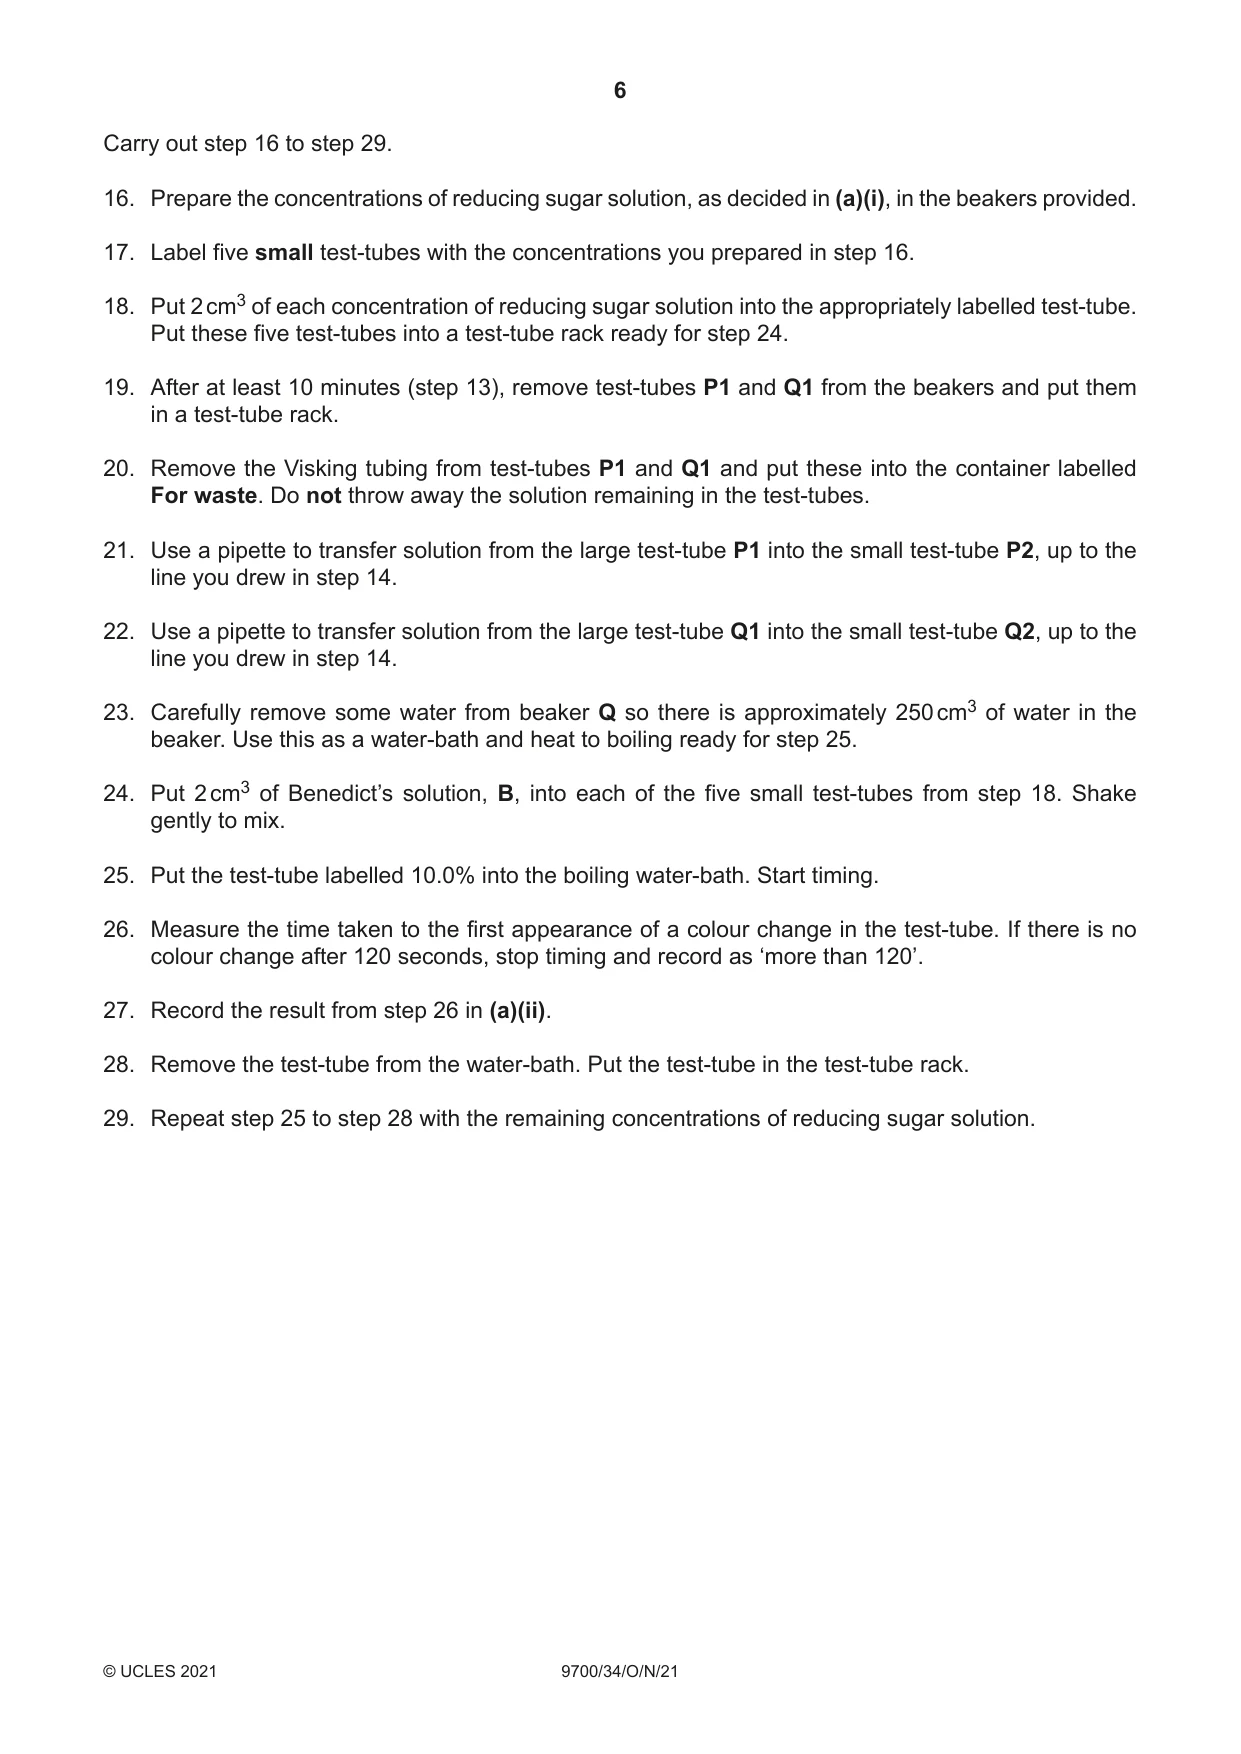
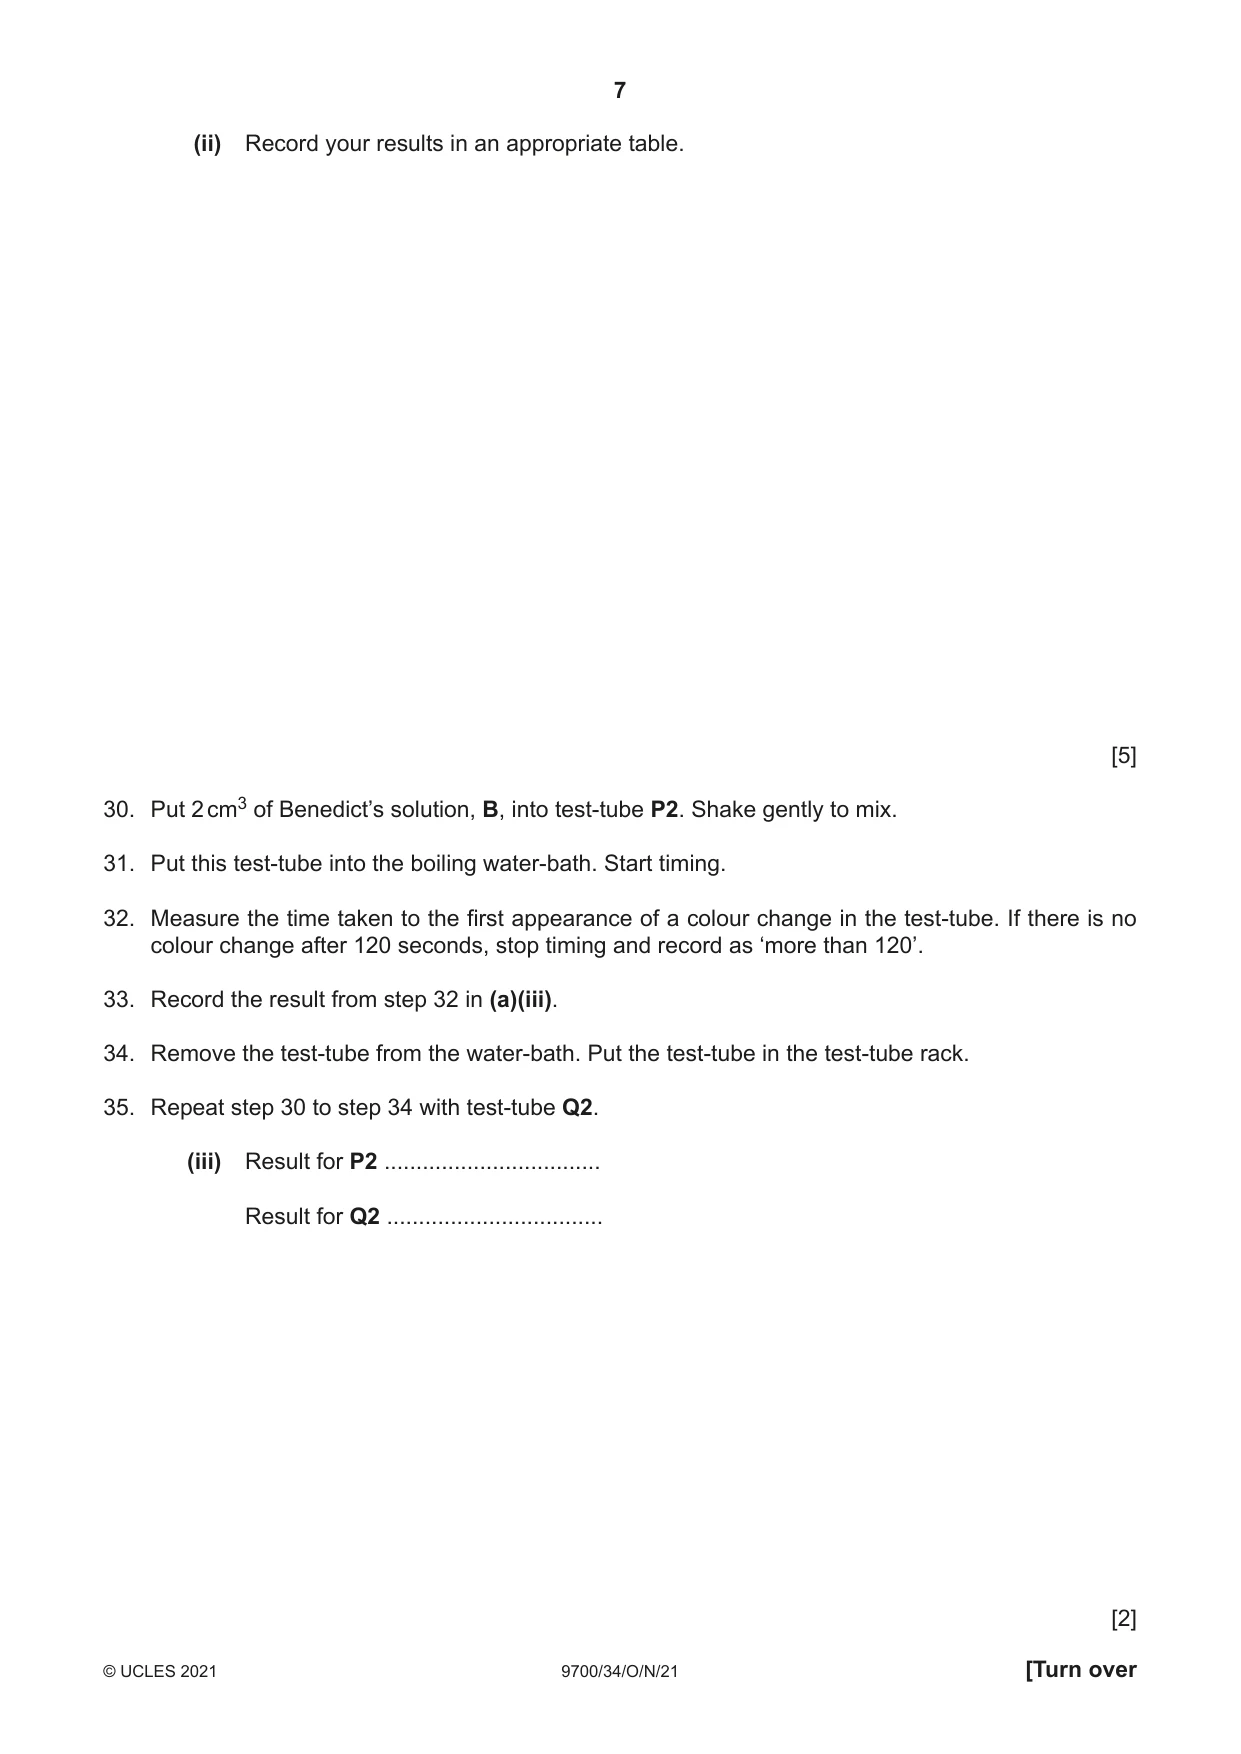
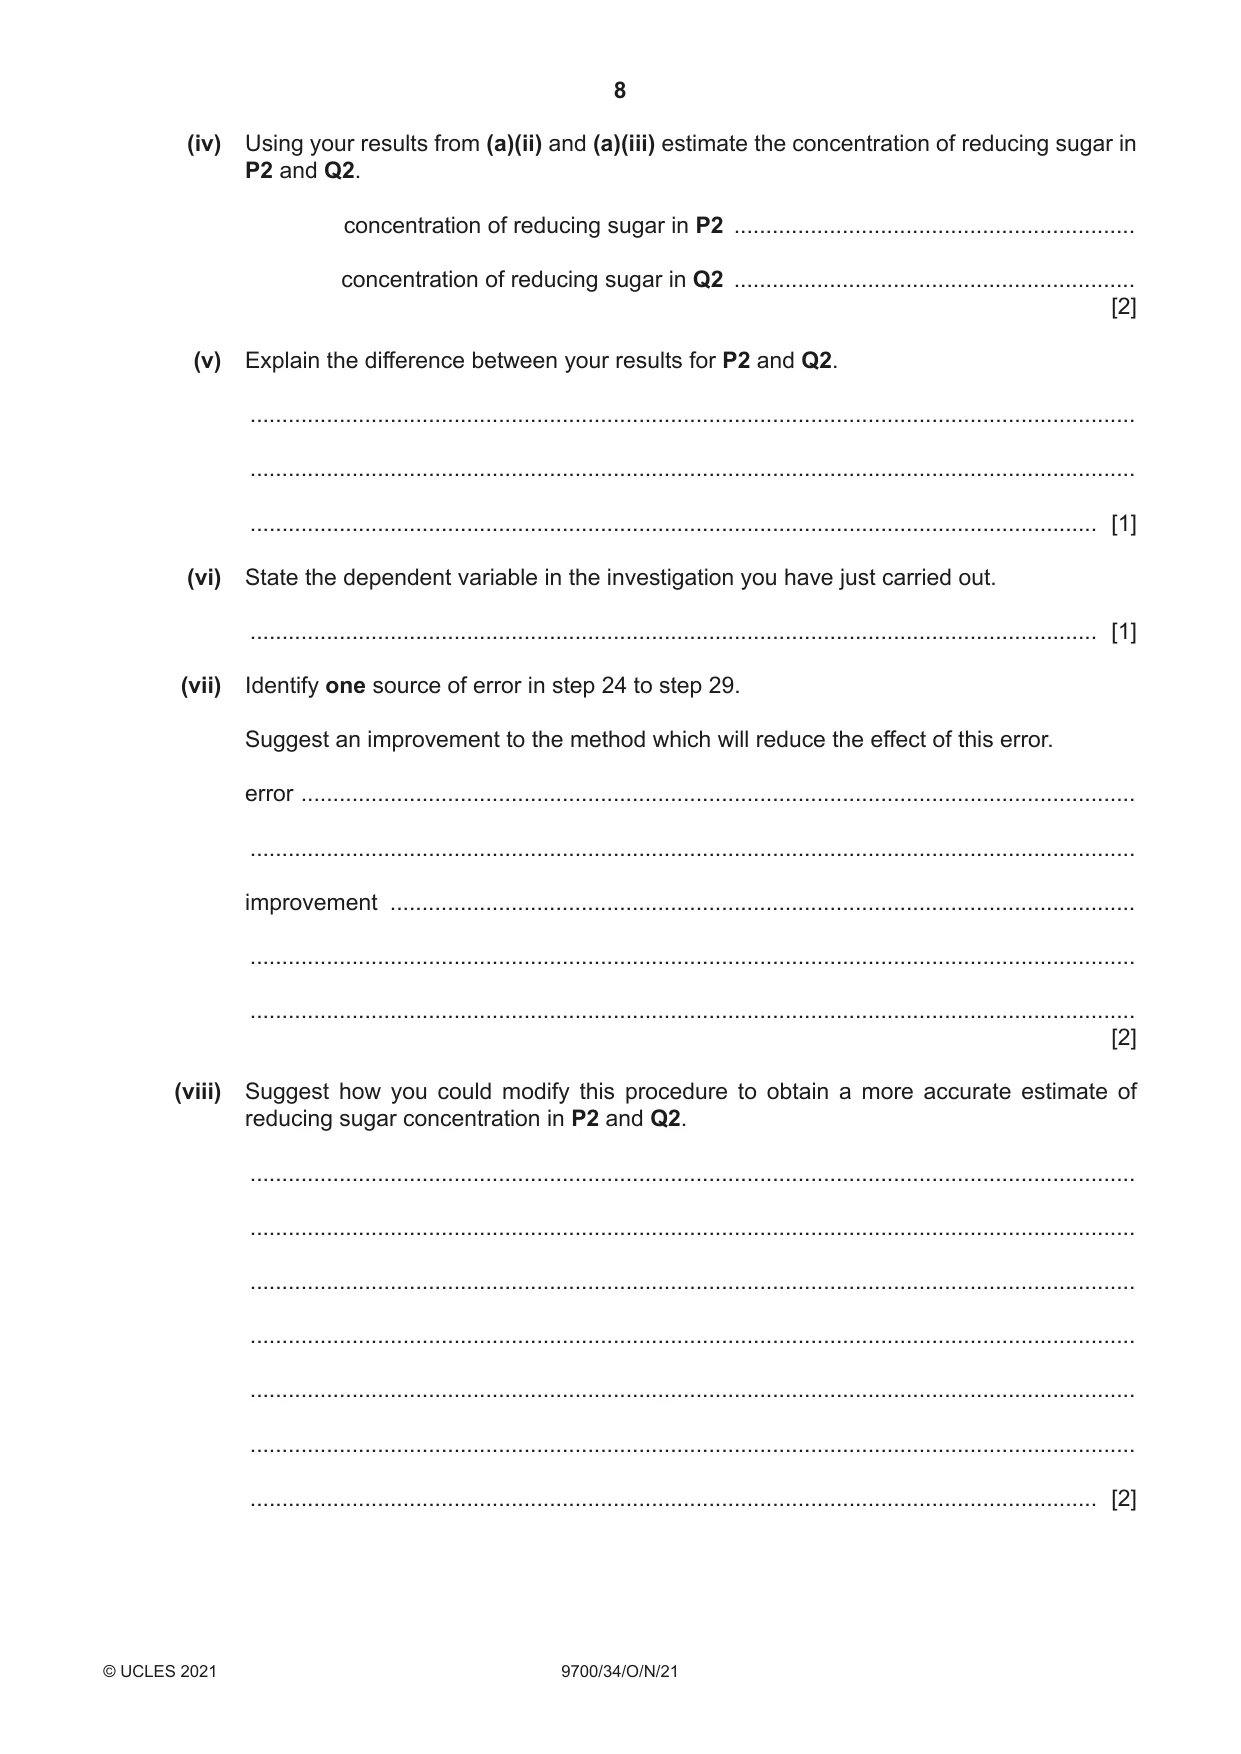
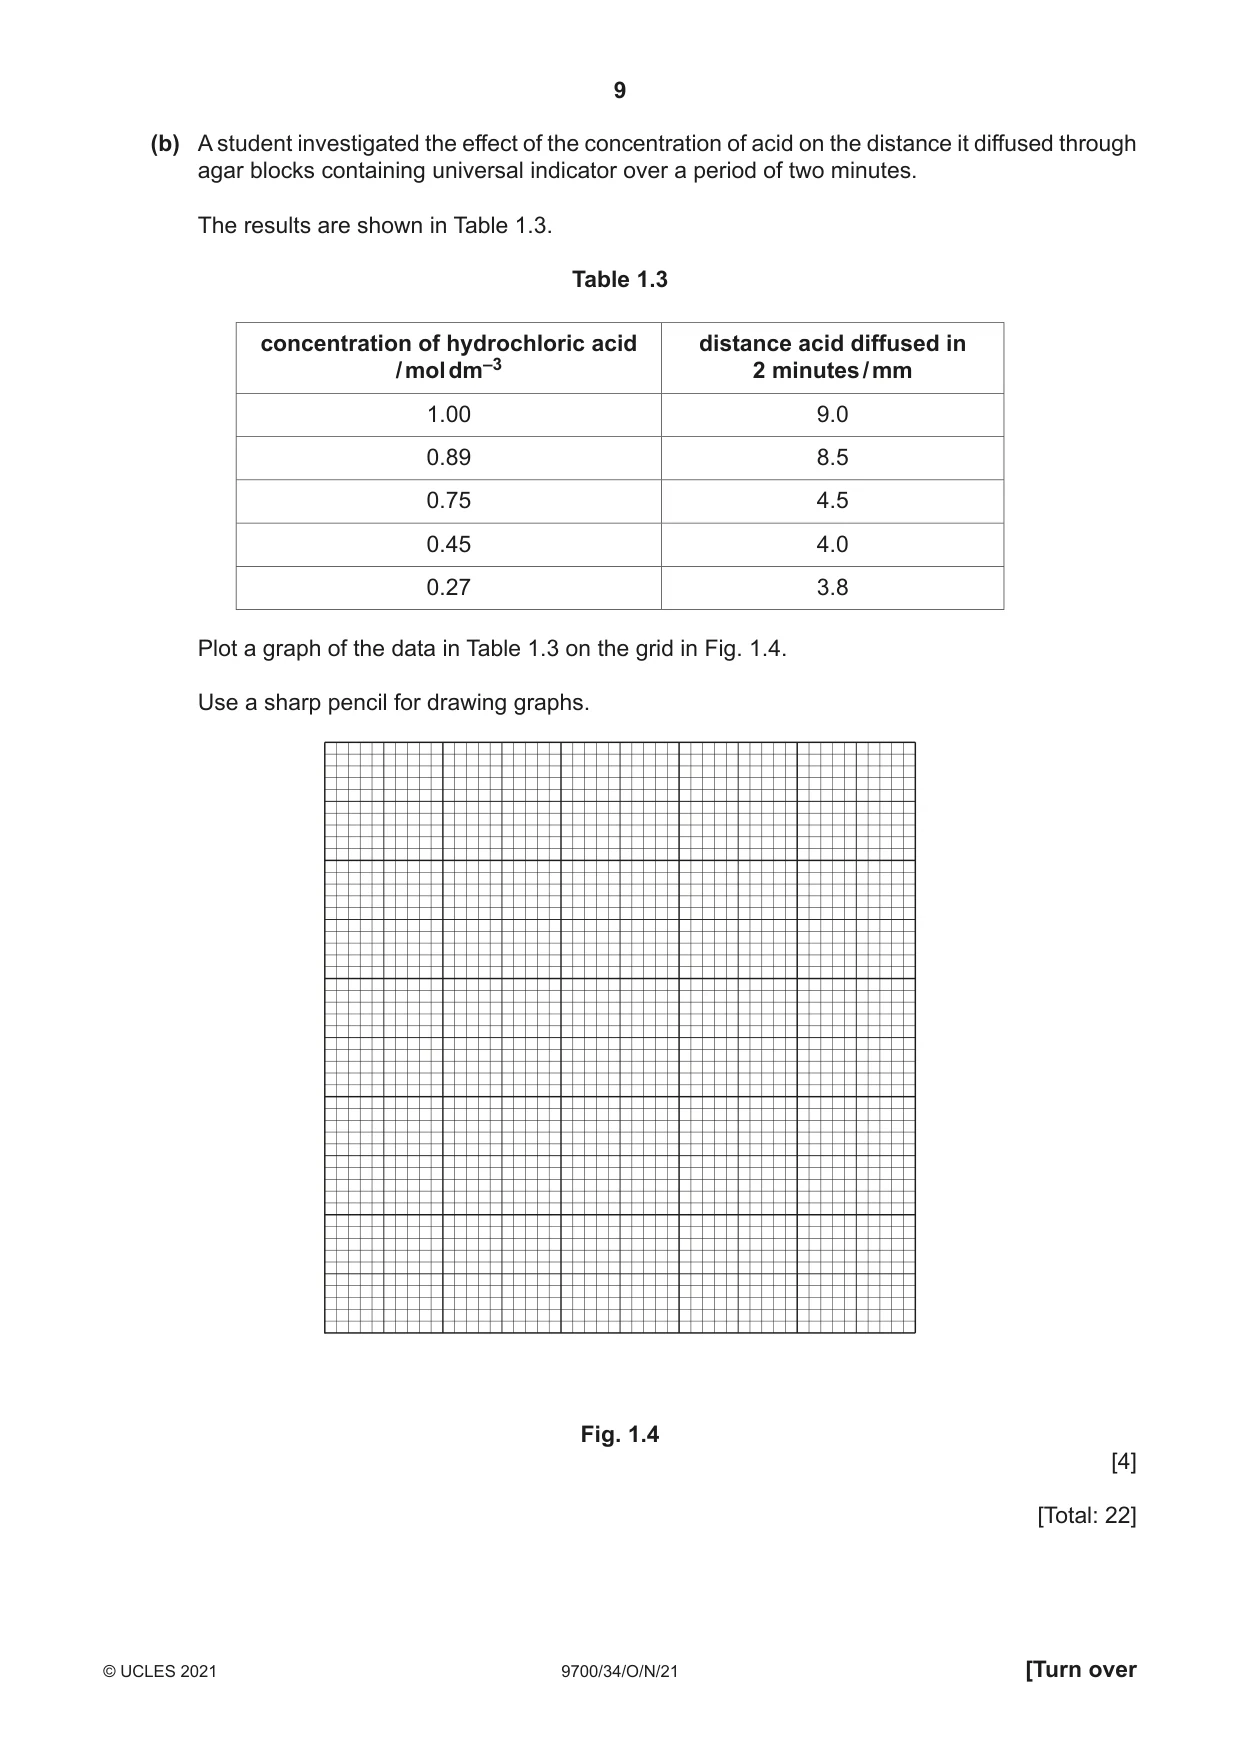
1 Visking tubing is a selectively permeable membrane, similar to a cell membrane. Some biological molecules are able to diffuse through the Visking tubing membrane. You will investigate the effect of temperature on the diffusion of reducing sugar through the Visking tubing membrane into the surrounding water. You will need to: • prepare a serial dilution of 10.0% reducing sugar, R • estimate the concentration of reducing sugar in the water at two different temperatures. You are provided with the materials shown in Table 1.1 and Table 1.2. Table 1.1 labelled contents hazard volume / cm3 R 10.0% reducing sugar solution none 30 G 20.0% reducing sugar solution none 30 harmful B Benedict’s solution 30 irritant W distilled water none 100 Table 1.2 labelled details V 2 lengths (15 cm) of Visking tubing in a beaker of water P beaker containing water at room temperature Q beaker containing hot water If any solution comes into contact with your skin, wash off immediately under cold water. It is recommended that you wear suitable eye protection. (a) You will set up the apparatus as shown in Fig. 1.1 using step 1 to step 6. 1. Tie a knot in one piece of the Visking tubing as close as possible to one end, so that the end is sealed. 2. To open the other end, wet the Visking tubing and rub the tubing gently between your fingers and thumb. 3. Put 10 cm3 of G into the Visking tubing. 4. Rinse the outside of the Visking tubing by dipping it into the water in the beaker labelled V. 5. Put the Visking tubing into the large test-tube labelled P1. Put this test-tube into a test-tube rack. 6. Fold the open end of the Visking tubing over the top of the large test-tube. Use a paper clip to hold the Visking tubing in place as shown in Fig. 1.1. paper clip holding Visking tubing to test-tube 20.0% reducing Visking tubing sugar solution, G large test-tube knot in bottom of Visking tubing Fig. 1.1 Carry out step 7 to step 15. 7. Repeat step 1 to step 6 with the other piece of Visking tubing and the large test-tube labelled Q1. 8. Record the temperature of the water in beaker P. ...................... °C 9. Prepare a water-bath at 60 °C using beaker Q. The water may need to be heated. 10. Use a syringe to transfer distilled water, W, into each of the large test-tubes containing the Visking tubing. The level of water in each large test-tube must be just above the level of G in the Visking tubing, as shown in Fig. 1.2. paper clip holding Visking tubing to test-tube distilled water, W 20.0% reducing Visking tubing sugar solution, G large test-tube knot in bottom of Visking tubing Fig. 1.2 11. Put the test-tube P1 containing Visking tubing into beaker P. 12. Put the test-tube Q1 containing Visking tubing into beaker Q. 13. Start timing and leave for at least 10 minutes. During this 10 minutes continue with step 14 to step 18. 14. Put 2 cm3 of distilled water, W, into each of the small test-tubes P2 and Q2. Draw a line on each test-tube at the level of the water. 15. Pour this water into the container labelled For waste. Put test-tubes P2 and Q2 into a test-tube rack ready for step 21 and step 22. You will now need to carry out a serial dilution of the 10.0% reducing sugar solution, R, to reduce the concentration by a factor of 10 between each successive dilution. You will need to prepare four concentrations of reducing sugar solution in addition to the 10.0% reducing sugar solution, R. After the serial dilution is completed, you will need to have 9 cm3 of each concentration available to use. (i) Complete Fig. 1.3 to show how you will prepare your serial dilution. Fig. 1.3 shows the first two beakers you will use to make your serial dilution. You will need to draw three additional beakers. For each beaker, add labelled arrows to show: • the volume of reducing sugar solution transferred • the volume of distilled water, W, added. Under each beaker, state the concentration of reducing sugar solution. 0 cm3 of W ............................. 10 cm3 of 10.0% ............................. reducing sugar solution, R ............................. ............................. 9 cm3 of 10.0% reducing sugar solution to use ............................. ............................. ............................. ............................. Fig. 1.3 [3] Carry out step 16 to step 29. 16. Prepare the concentrations of reducing sugar solution, as decided in (a)(i), in the beakers provided. 17. Label five small test-tubes with the concentrations you prepared in step 16. 18. Put 2 cm3 of each concentration of reducing sugar solution into the appropriately labelled test-tube. Put these five test-tubes into a test-tube rack ready for step 24. 19. After at least 10 minutes (step 13), remove test-tubes P1 and Q1 from the beakers and put them in a test-tube rack. 20. Remove the Visking tubing from test-tubes P1 and Q1 and put these into the container labelled For waste. Do not throw away the solution remaining in the test-tubes. 21. Use a pipette to transfer solution from the large test-tube P1 into the small test-tube P2, up to the line you drew in step 14. 22. Use a pipette to transfer solution from the large test-tube Q1 into the small test-tube Q2, up to the line you drew in step 14. 23. Carefully remove some water from beaker Q so there is approximately 250 cm3 of water in the beaker. Use this as a water-bath and heat to boiling ready for step 25. 24. Put 2 cm3 of Benedict’s solution, B, into each of the five small test-tubes from step 18. Shake gently to mix. 25. Put the test-tube labelled 10.0% into the boiling water-bath. Start timing. 26. Measure the time taken to the first appearance of a colour change in the test-tube. If there is no colour change after 120 seconds, stop timing and record as ‘more than 120’. 27. Record the result from step 26 in (a)(ii). 28. Remove the test-tube from the water-bath. Put the test-tube in the test-tube rack. 29. Repeat step 25 to step 28 with the remaining concentrations of reducing sugar solution. (ii) Record your results in an appropriate table. [5] 30. Put 2 cm3 of Benedict’s solution, B, into test-tube P2. Shake gently to mix. 31. Put this test-tube into the boiling water-bath. Start timing. 32. Measure the time taken to the first appearance of a colour change in the test-tube. If there is no colour change after 120 seconds, stop timing and record as ‘more than 120’. 33. Record the result from step 32 in (a)(iii). 34. Remove the test-tube from the water-bath. Put the test-tube in the test-tube rack. 35. Repeat step 30 to step 34 with test-tube Q2. (iii) Result for P2 .................................. Result for Q2 .................................. [2] (iv) Using your results from (a)(ii) and (a)(iii) estimate the concentration of reducing sugar in P2 and Q2. concentration of reducing sugar in P2 ............................................................... concentration of reducing sugar in Q2 ............................................................... [2] (v) Explain the difference between your results for P2 and Q2. ........................................................................................................................................... ........................................................................................................................................... ..................................................................................................................................... [1] (vi) State the dependent variable in the investigation you have just carried out. ..................................................................................................................................... [1] (vii) Identify one source of error in step 24 to step 29. Suggest an improvement to the method which will reduce the effect of this error. error ................................................................................................................................... ........................................................................................................................................... improvement ..................................................................................................................... ........................................................................................................................................... ........................................................................................................................................... [2] (viii) Suggest how you could modify this procedure to obtain a more accurate estimate of reducing sugar concentration in P2 and Q2. ........................................................................................................................................... ........................................................................................................................................... ........................................................................................................................................... ........................................................................................................................................... ........................................................................................................................................... ........................................................................................................................................... ..................................................................................................................................... [2] (b) A student investigated the effect of the concentration of acid on the distance it diffused through agar blocks containing universal indicator over a period of two minutes. The results are shown in Table 1.3. Table 1.3 concentration of hydrochloric acid distance acid diffused in / mol dm–3 2 minutes / mm 1.00 9.0 0.89 8.5 0.75 4.5 0.45 4.0 0.27 3.8 Plot a graph of the data in Table 1.3 on the grid in Fig. 1.4. Use a sharp pencil for drawing graphs. Fig. 1.4 [4] [Total: 22]
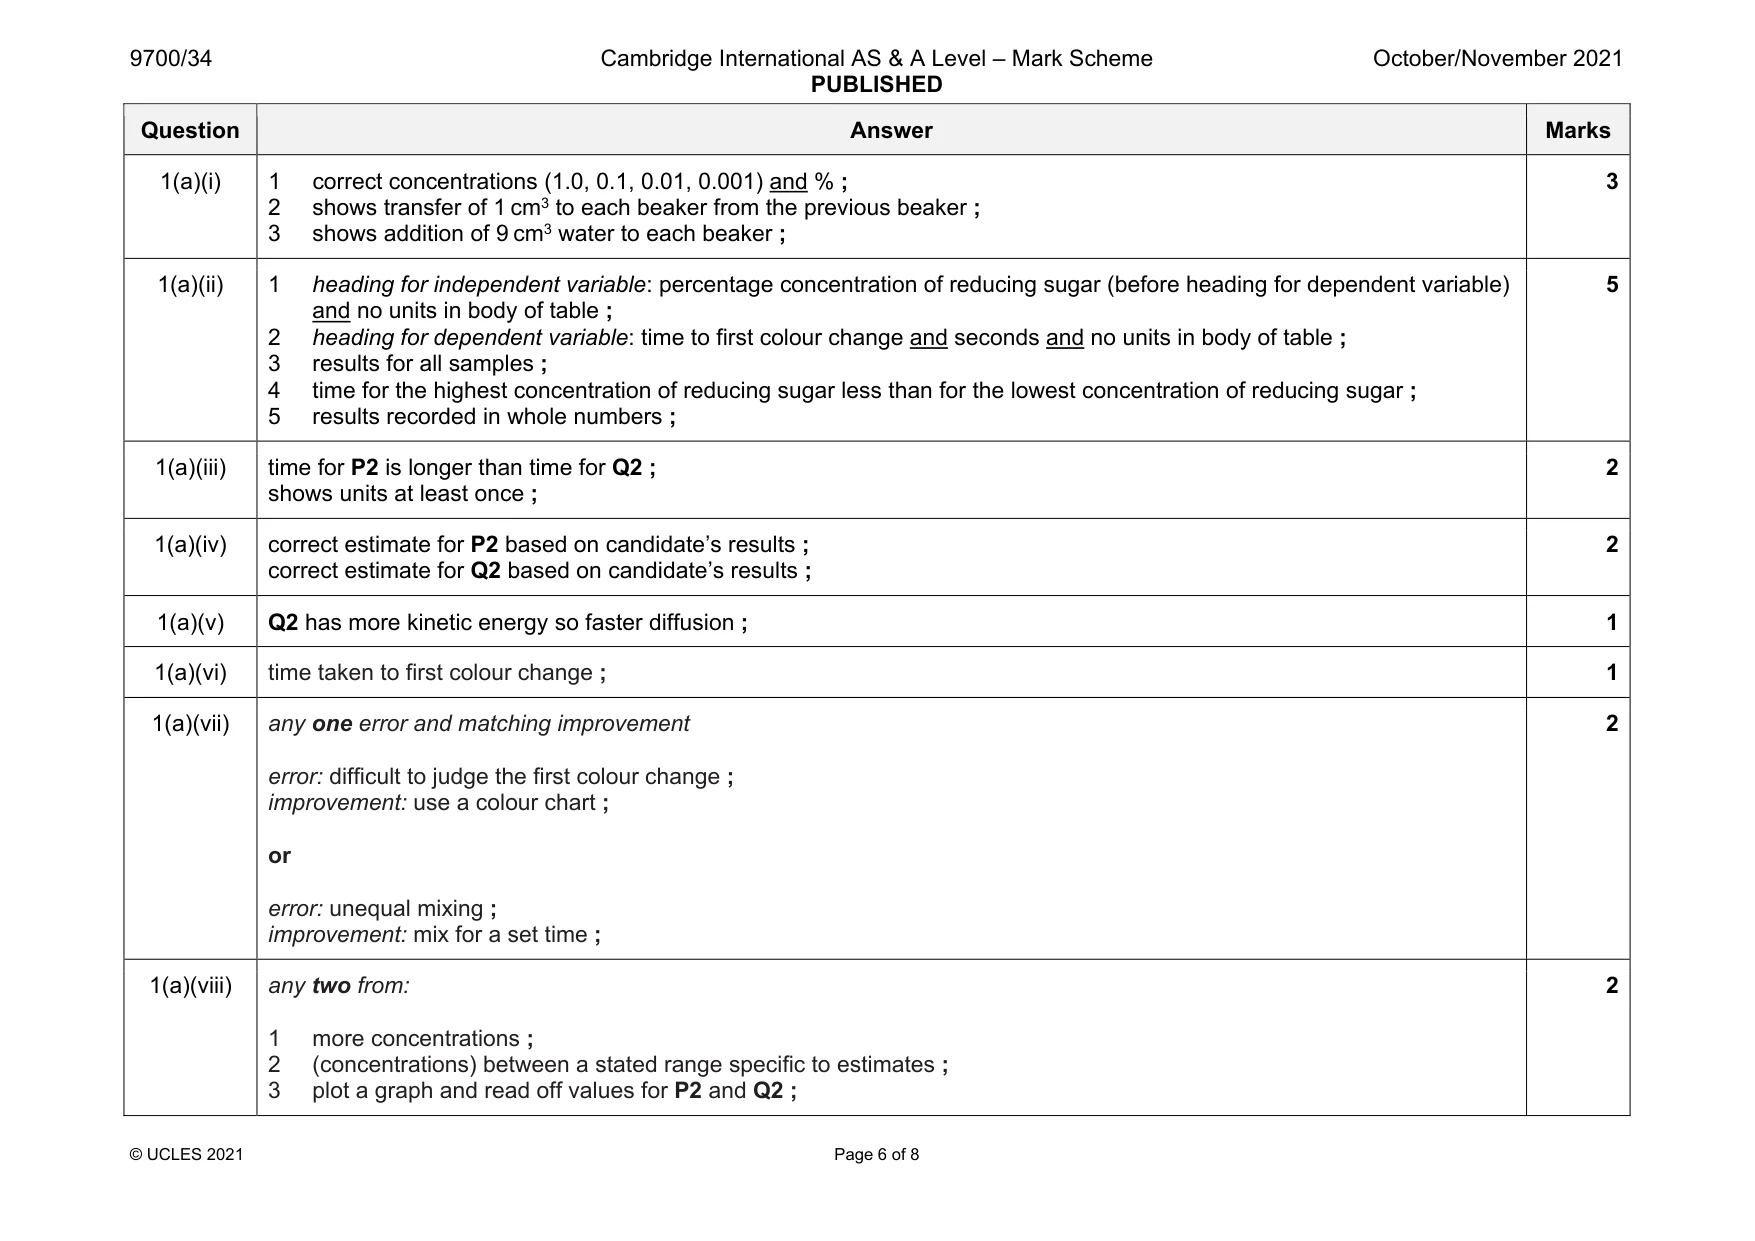
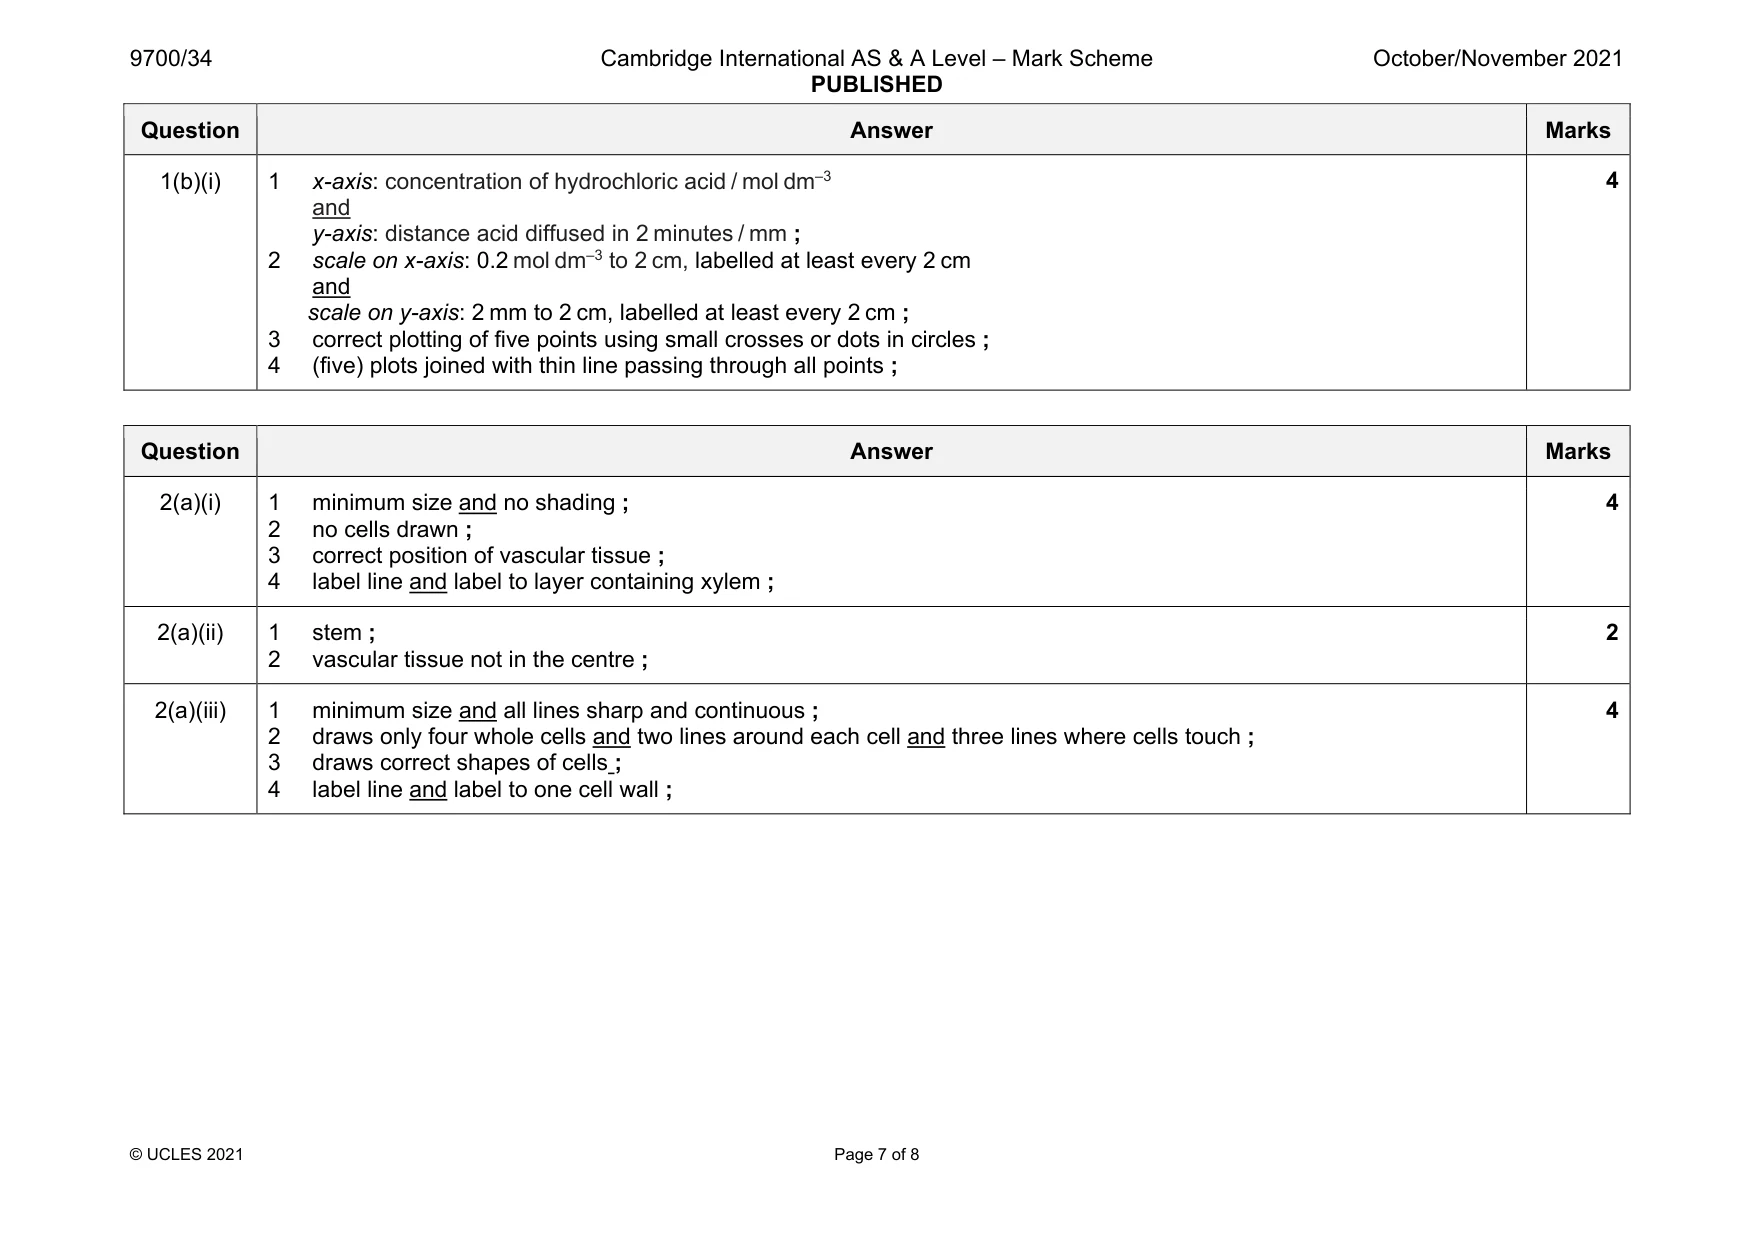
Mark scheme: 1(a)(i) 1 correct concentrations (1.0, 0.1, 0.01, 0.001) and % ; 2 shows transfer of 1 cm3 to each beaker from the previous beaker ; 3 shows addition of 9 cm3 water to each beaker ; 3 1(a)(ii) 1 heading for independent variable: percentage concentration of reducing sugar (before heading for dependent variable) and no units in body of table ; 2 heading for dependent variable: time to first colour change and seconds and no units in body of table ; 3 results for all samples ; 4 time for the highest concentration of reducing sugar less than for the lowest concentration of reducing sugar ; 5 results recorded in whole numbers ; 5 1(a)(iii) time for P2 is longer than time for Q2 ; shows units at least once ; 2 1(a)(iv) correct estimate for P2 based on candidate’s results ; correct estimate for Q2 based on candidate’s results ; 2 1(a)(v) Q2 has more kinetic energy so faster diffusion ; 1 1(a)(vi) time taken to first colour change ; 1 1(a)(vii) any one error and matching improvement error: difficult to judge the first colour change ; improvement: use a colour chart ; or error: unequal mixing ; improvement: mix for a set time ; 2 1(a)(viii) any two from: 1 more concentrations ; 2 (concentrations) between a stated range specific to estimates ; 3 plot a graph and read off values for P2 and Q2 ; 2 Question Answer Marks 1(b)(i) 1 x-axis: concentration of hydrochloric acid / mol dm–3 and y-axis: distance acid diffused in 2 minutes / mm ; 2 scale on x-axis: 0.2 mol dm–3 to 2 cm, labelled at least every 2 cm and scale on y-axis: 2 mm to 2 cm, labelled at least every 2 cm ; 3 correct plotting of five points using small crosses or dots in circles ; 4 (five) plots joined with thin line passing through all points ; 4
Q2 · L1 is a slide of a stained transverse section through a plant organ
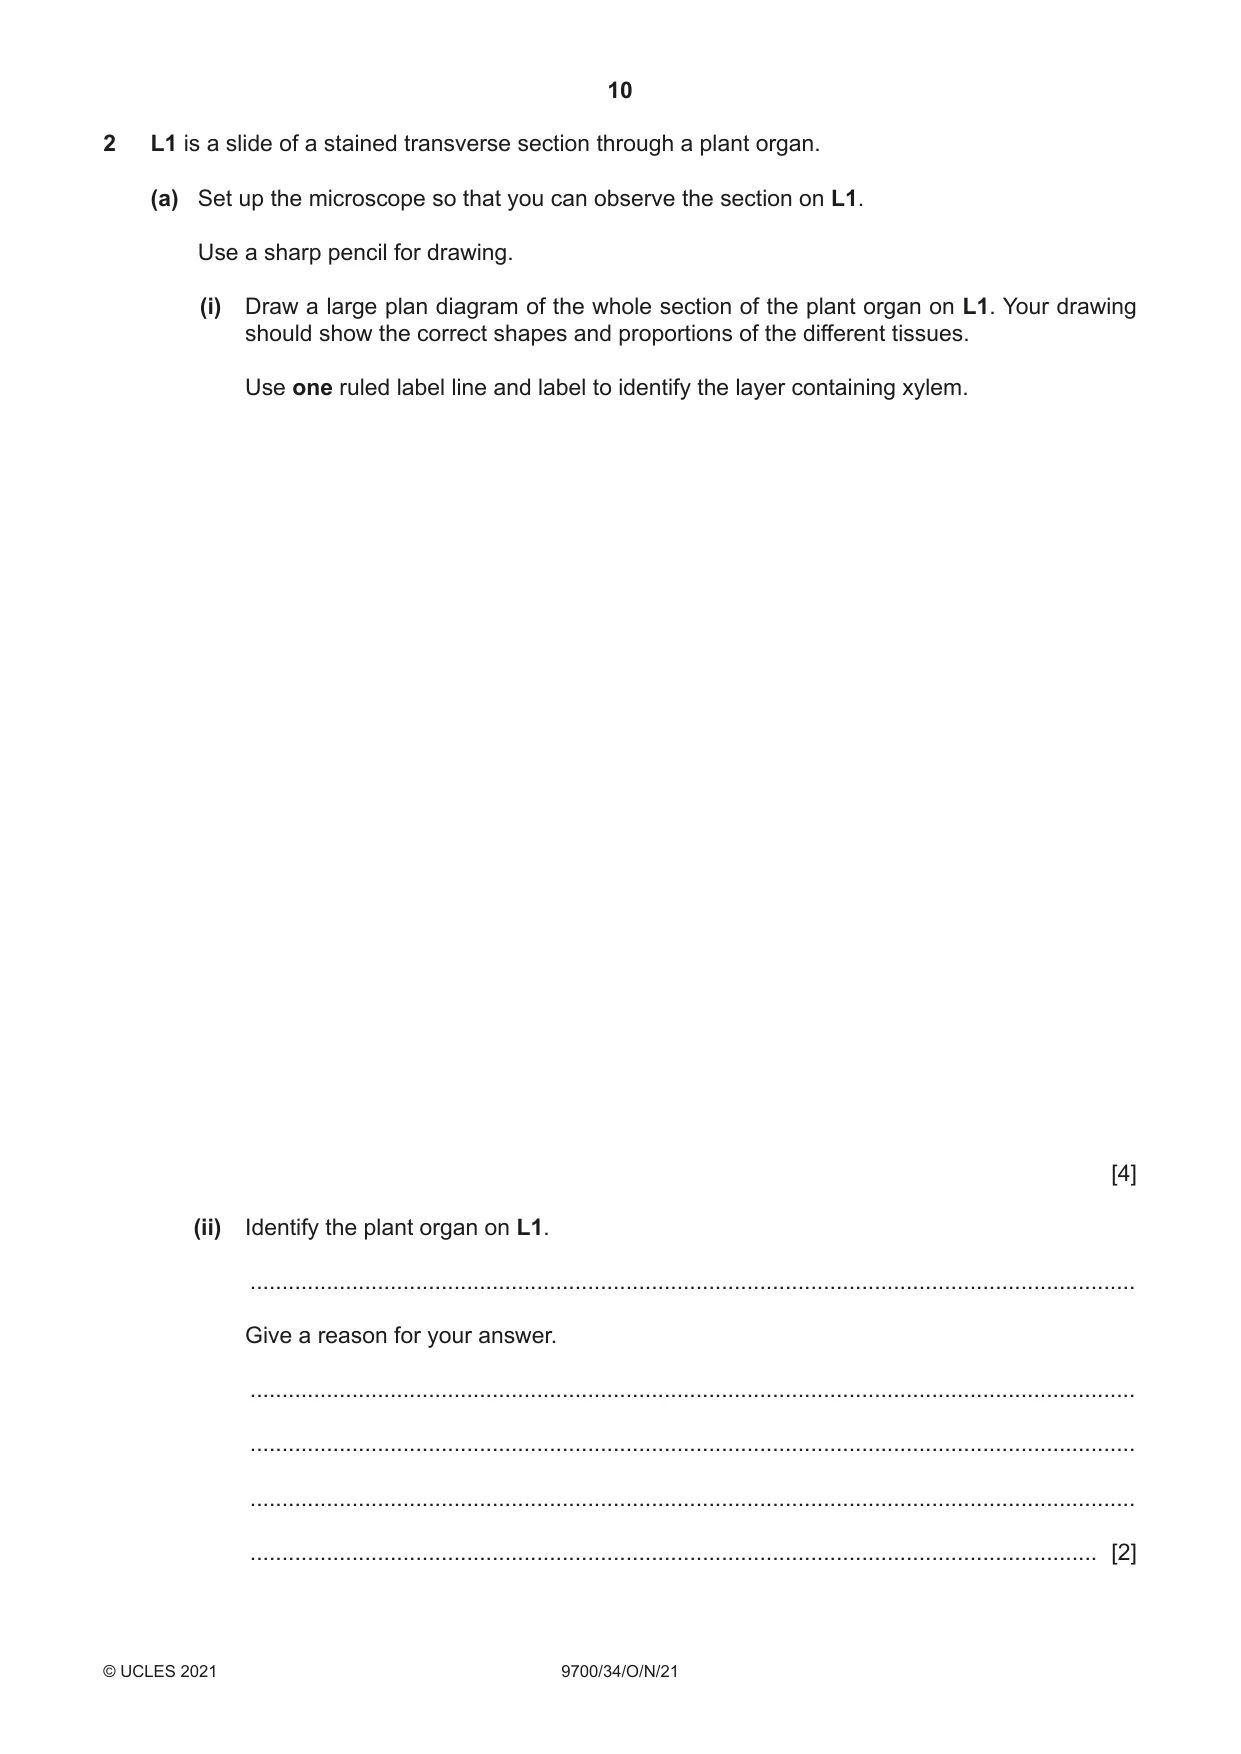
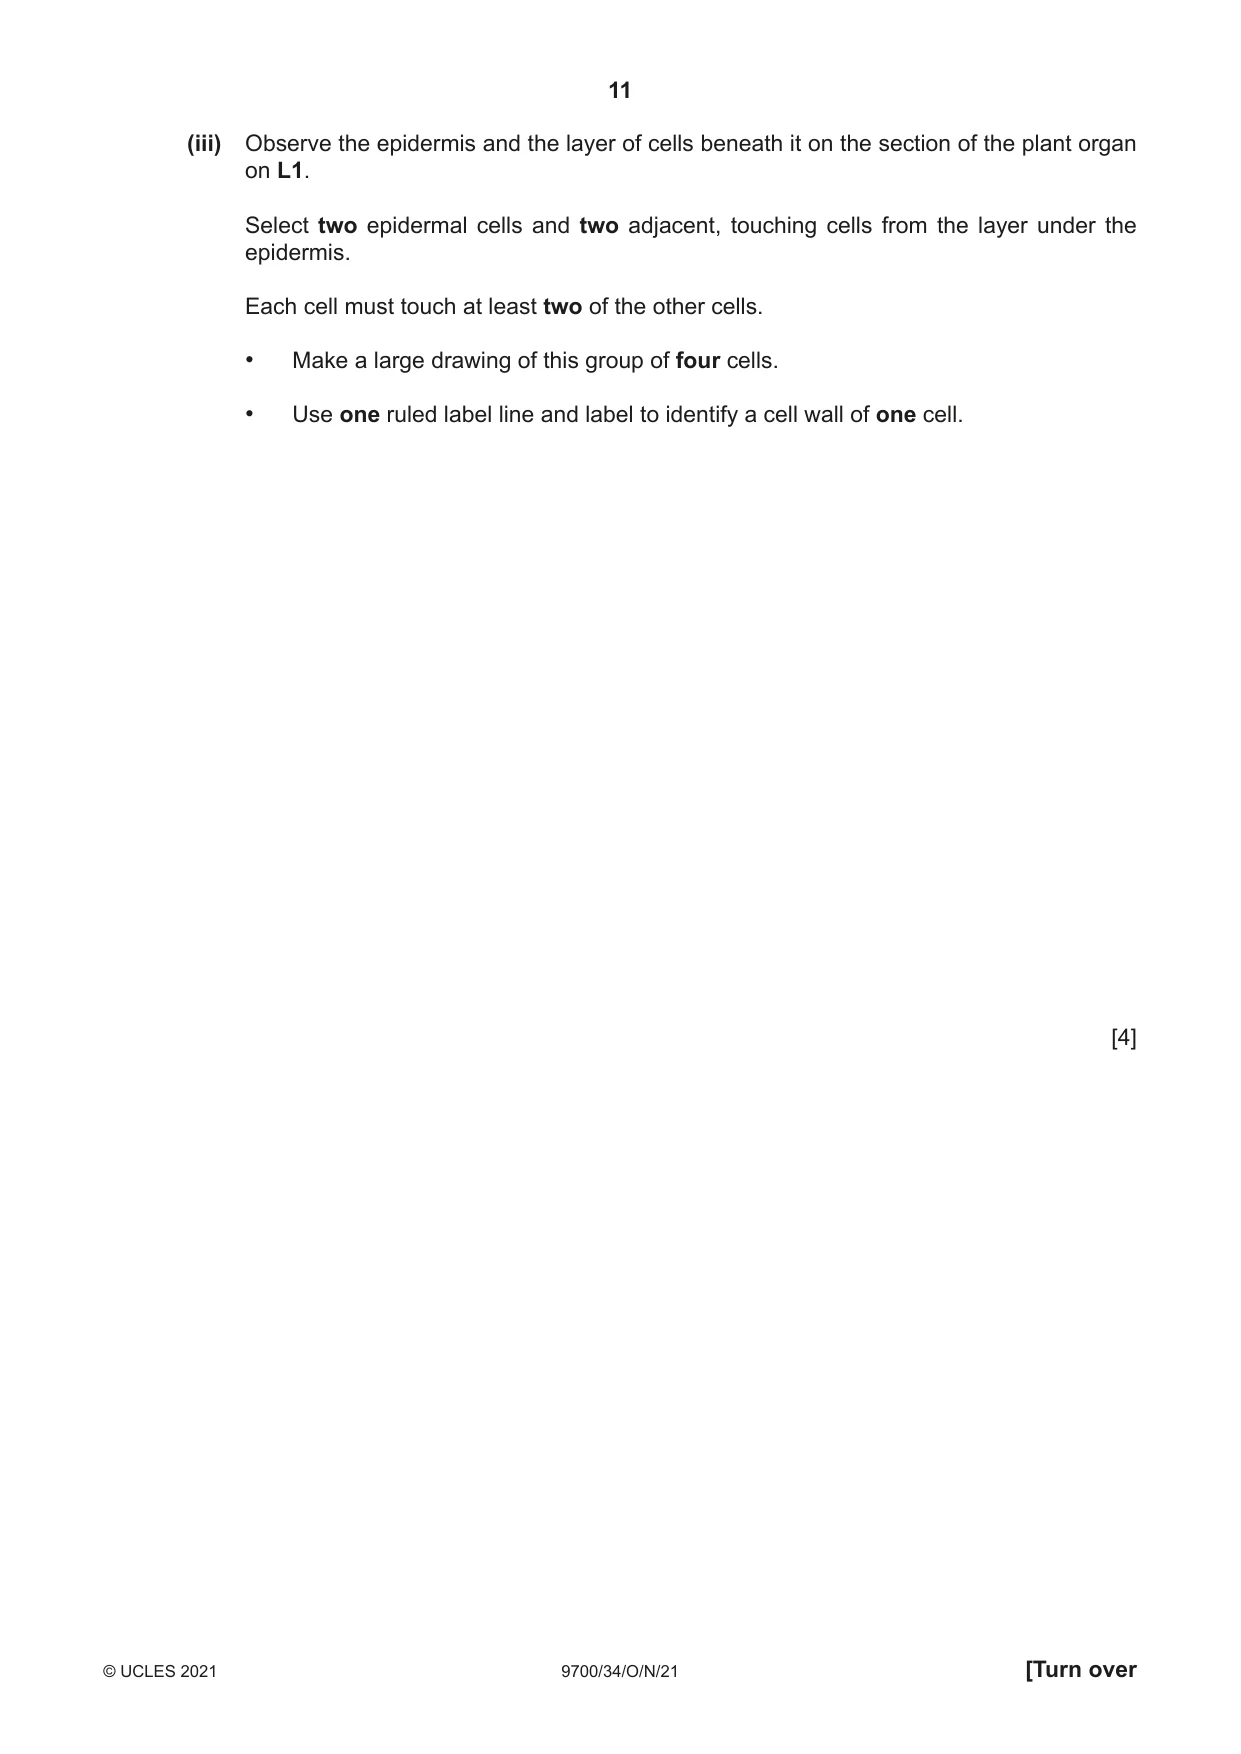
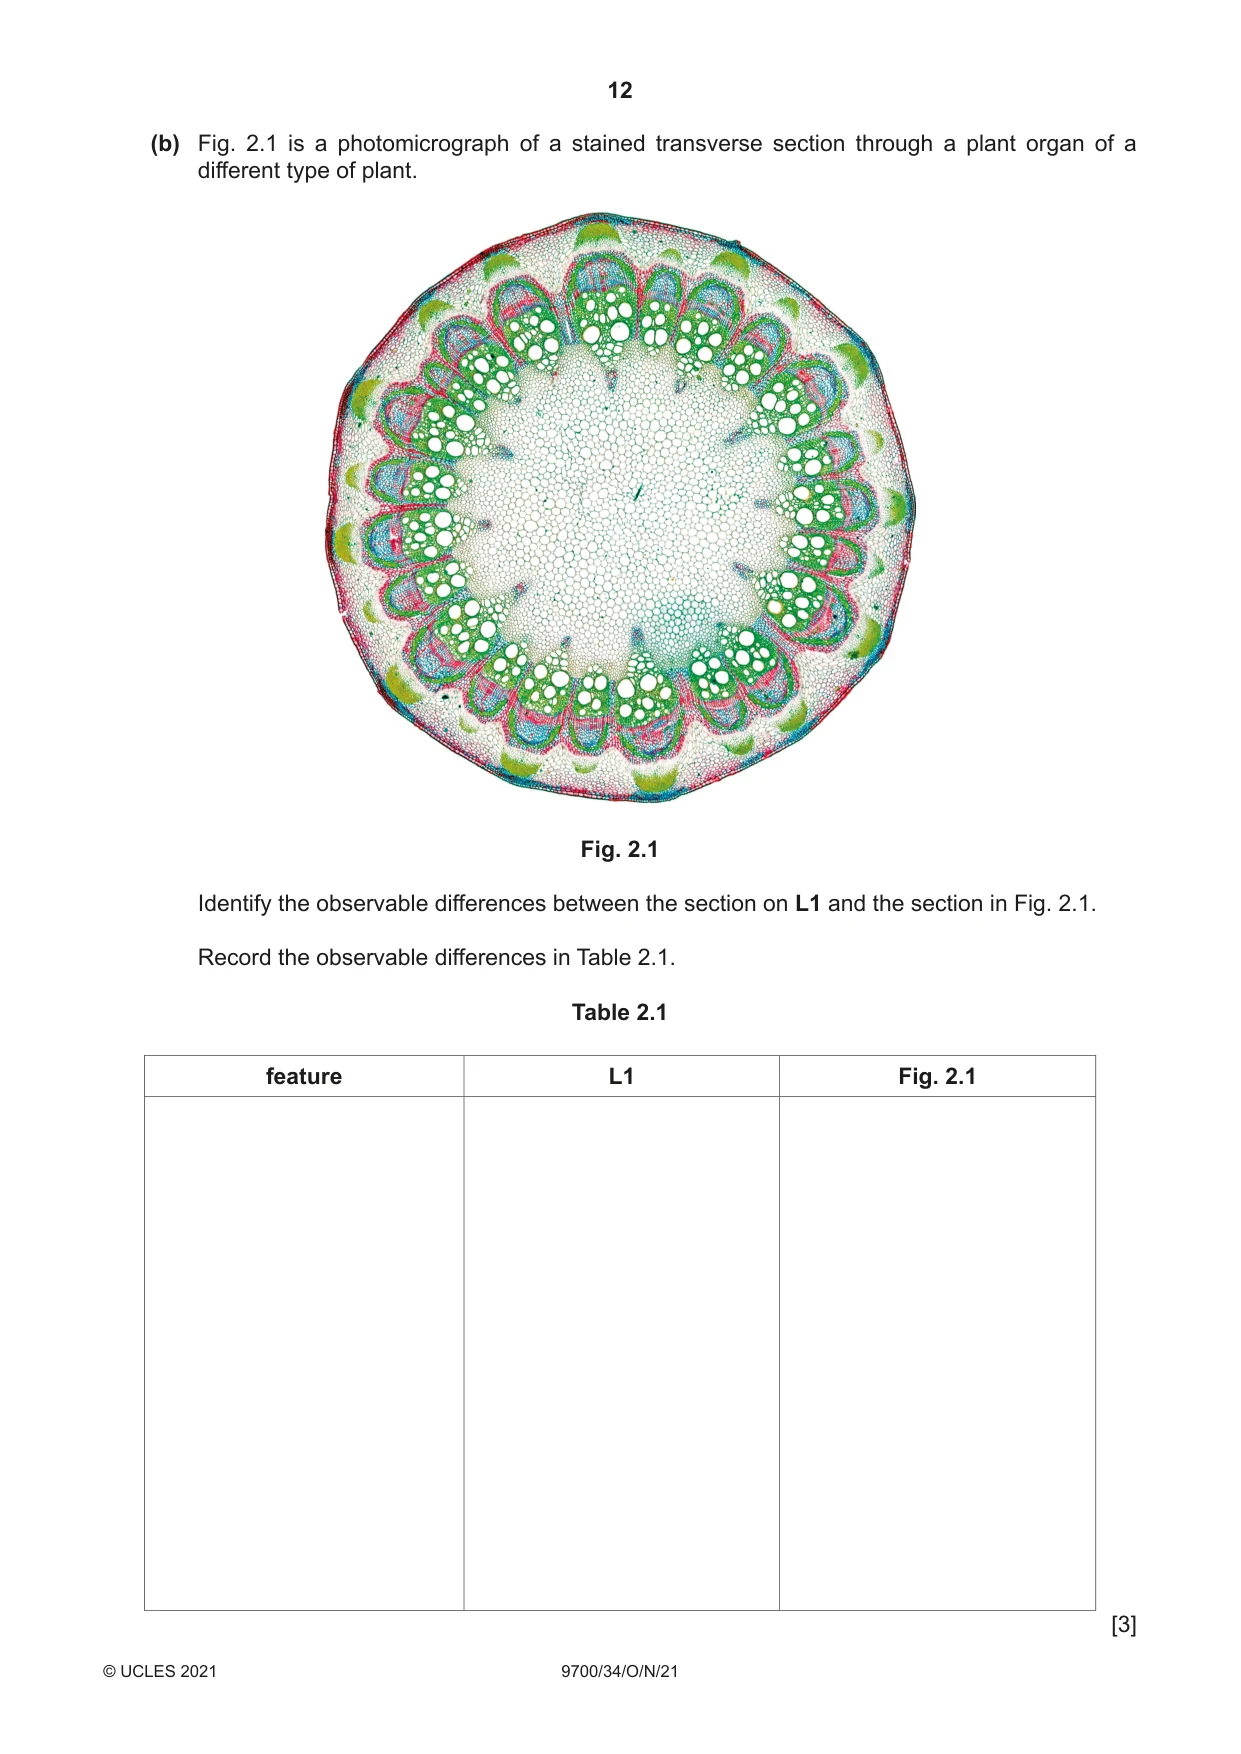
2 L1 is a slide of a stained transverse section through a plant organ. (a) Set up the microscope so that you can observe the section on L1. Use a sharp pencil for drawing. (i) Draw a large plan diagram of the whole section of the plant organ on L1. Your drawing should show the correct shapes and proportions of the different tissues. Use one ruled label line and label to identify the layer containing xylem. [4] (ii) Identify the plant organ on L1. ........................................................................................................................................... Give a reason for your answer. ........................................................................................................................................... ........................................................................................................................................... ........................................................................................................................................... ..................................................................................................................................... [2] (iii) Observe the epidermis and the layer of cells beneath it on the section of the plant organ on L1. Select two epidermal cells and two adjacent, touching cells from the layer under the epidermis. Each cell must touch at least two of the other cells. • Make a large drawing of this group of four cells. • Use one ruled label line and label to identify a cell wall of one cell. [4] (b) Fig. 2.1 is a photomicrograph of a stained transverse section through a plant organ of a different type of plant. Fig. 2.1 Identify the observable differences between the section on L1 and the section in Fig. 2.1. Record the observable differences in Table 2.1. Table 2.1 feature L1 Fig. 2.1 [3]
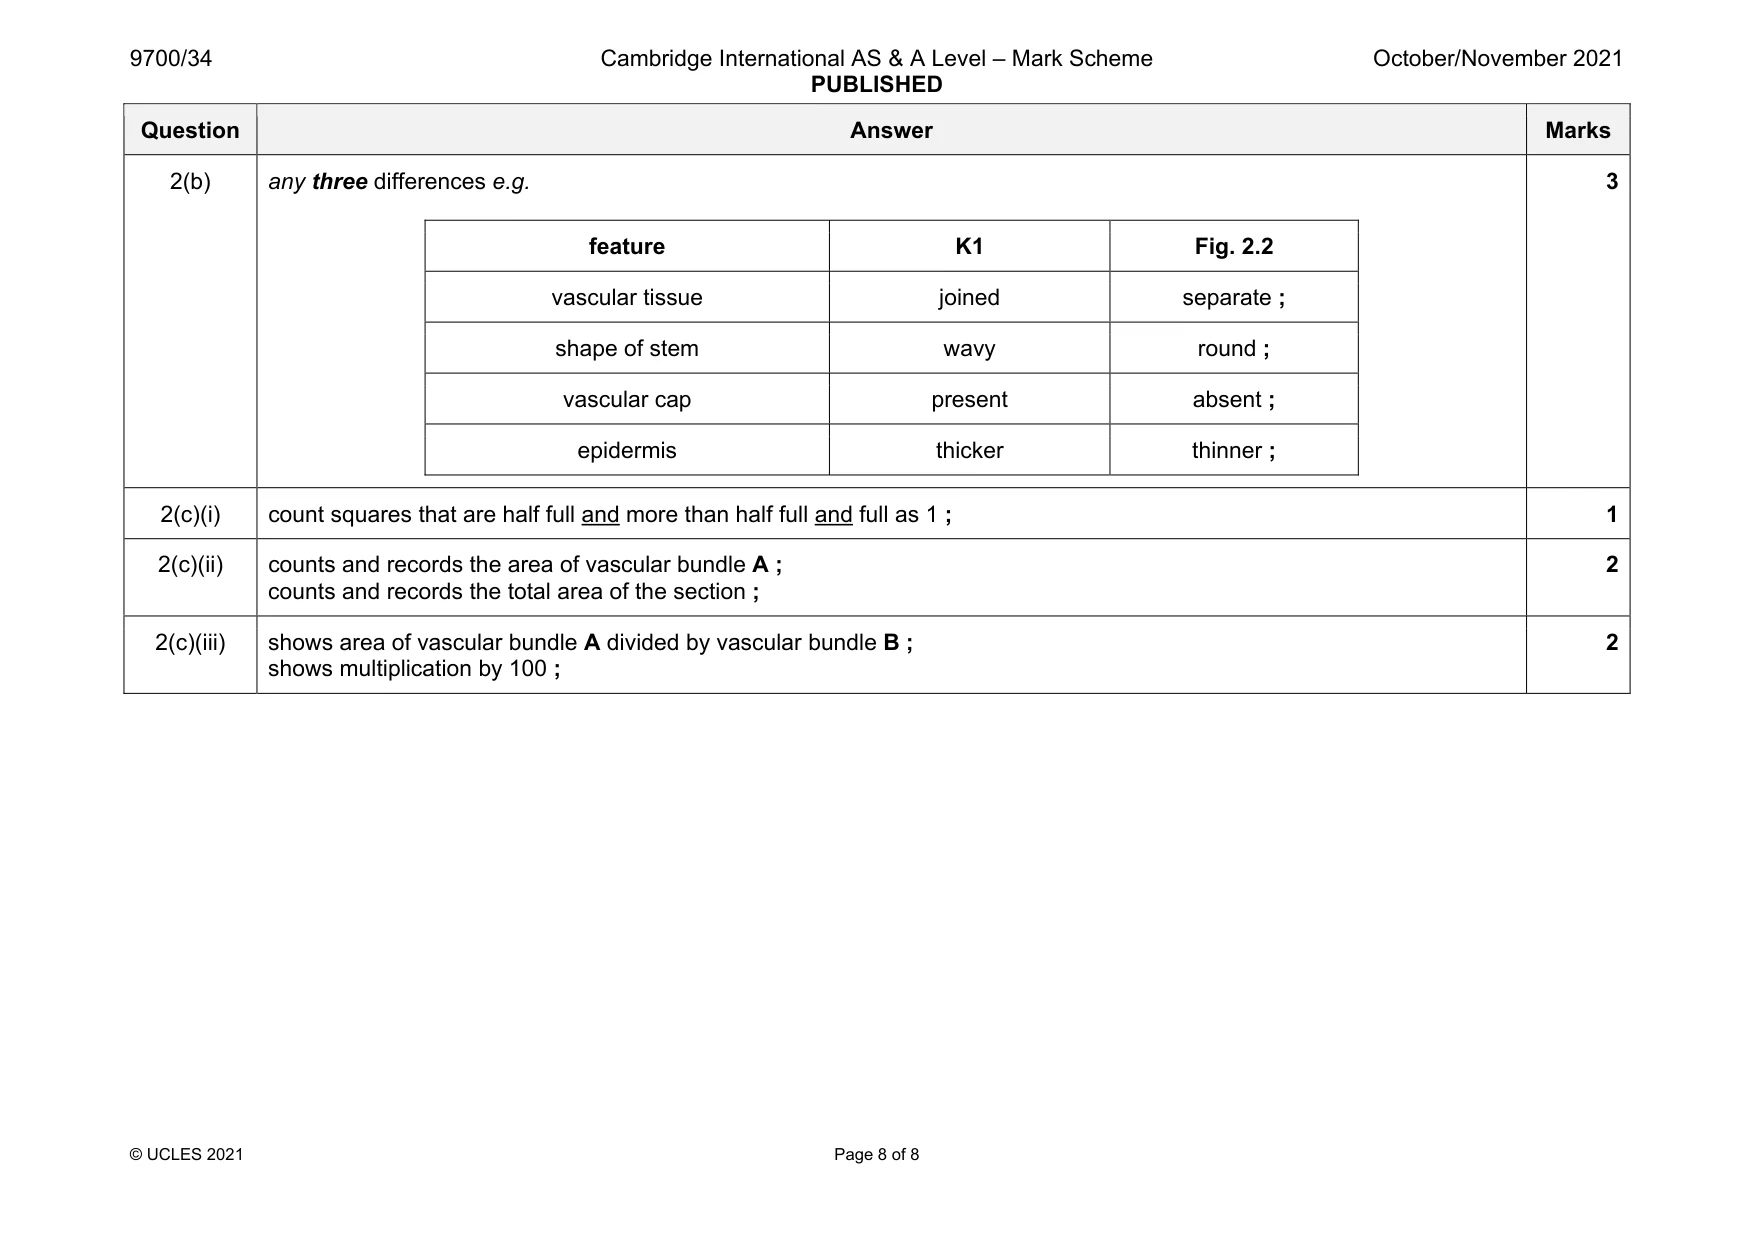
Mark scheme: 2(a)(i) 1 minimum size and no shading ; 2 no cells drawn ; 3 correct position of vascular tissue ; 4 label line and label to layer containing xylem ; 4 2(a)(ii) 1 stem ; 2 vascular tissue not in the centre ; 2 2(a)(iii) 1 minimum size and all lines sharp and continuous ; 2 draws only four whole cells and two lines around each cell and three lines where cells touch ; 3 draws correct shapes of cells ; 4 label line and label to one cell wall ; 4 Question Answer Marks 2(b) any three differences e.g. feature K1 Fig. 2.2 vascular tissue joined separate ; shape of stem wavy round ; vascular cap present absent ; epidermis thicker thinner ; 3 2(c)(i) count squares that are half full and more than half full and full as 1 ; 1 2(c)(ii) counts and records the area of vascular bundle A ; counts and records the total area of the section ; 2 2(c)(iii) shows area of vascular bundle A divided by vascular bundle B ; shows multiplication by 100 ; 2
What was in this paper
The subtopics covered by these 2 questions, and how many questions each got. Open one in a new tab to see every Cambridge question on it.
What you needed in this session
Cambridge’s own grade thresholds for 2021 Oct/Nov, Paper 3 · Variant 4. A higher threshold means an easier paper — the bar moves with how the cohort did.