Cambridge A Level Biology 9700 — 2021 May/June Paper 3 · Variant 4
9700/34/M/J/21 · 2 questions · 40 marks · ≈45 min
The question paper and its mark scheme, free to read here and free to download. This is Cambridge’s own paper, exactly as it was sat.
Question paper16 pages

Mark scheme7 pages
Answers below. Sit the paper first if you are practising.

Questions as text
Q1 · Yeast cells contain the enzyme catalase which catalyses the breakdown of hydrogen…
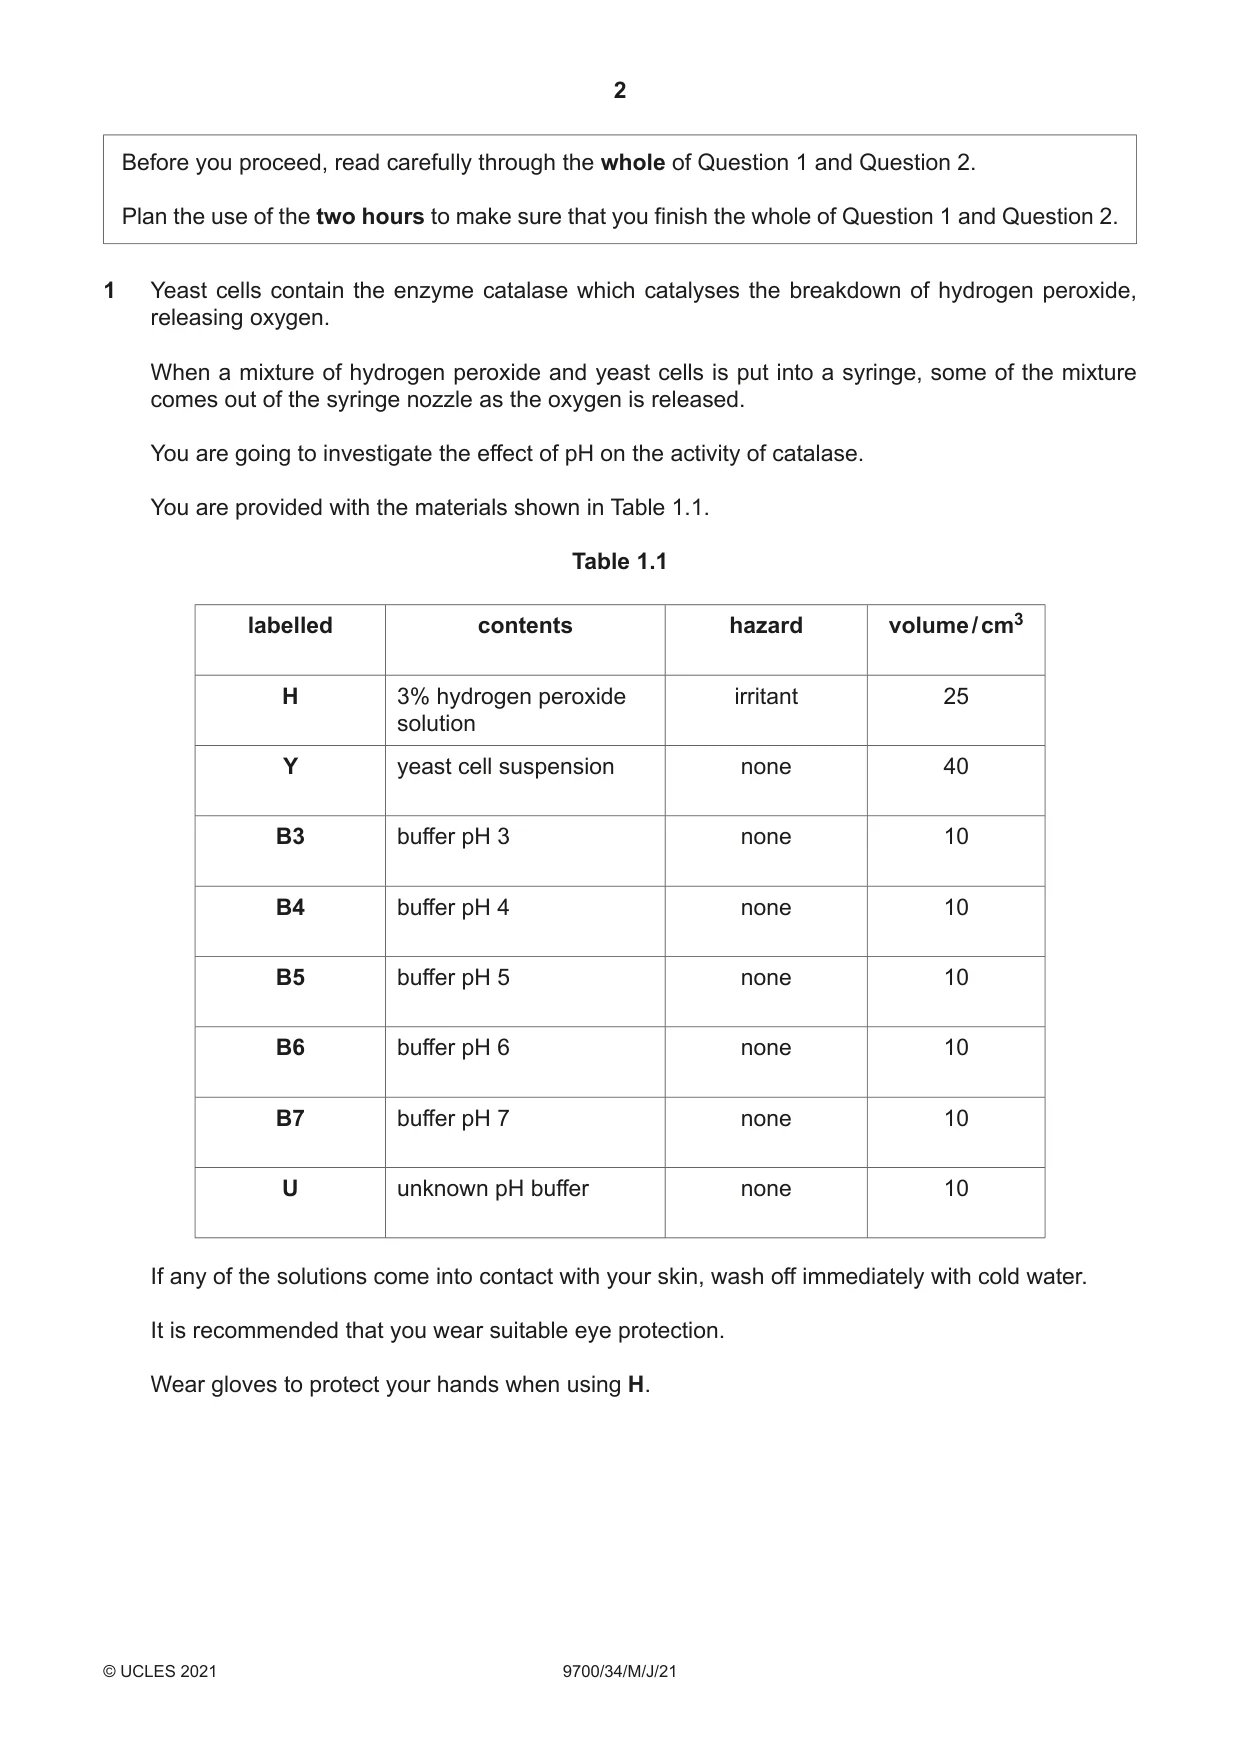
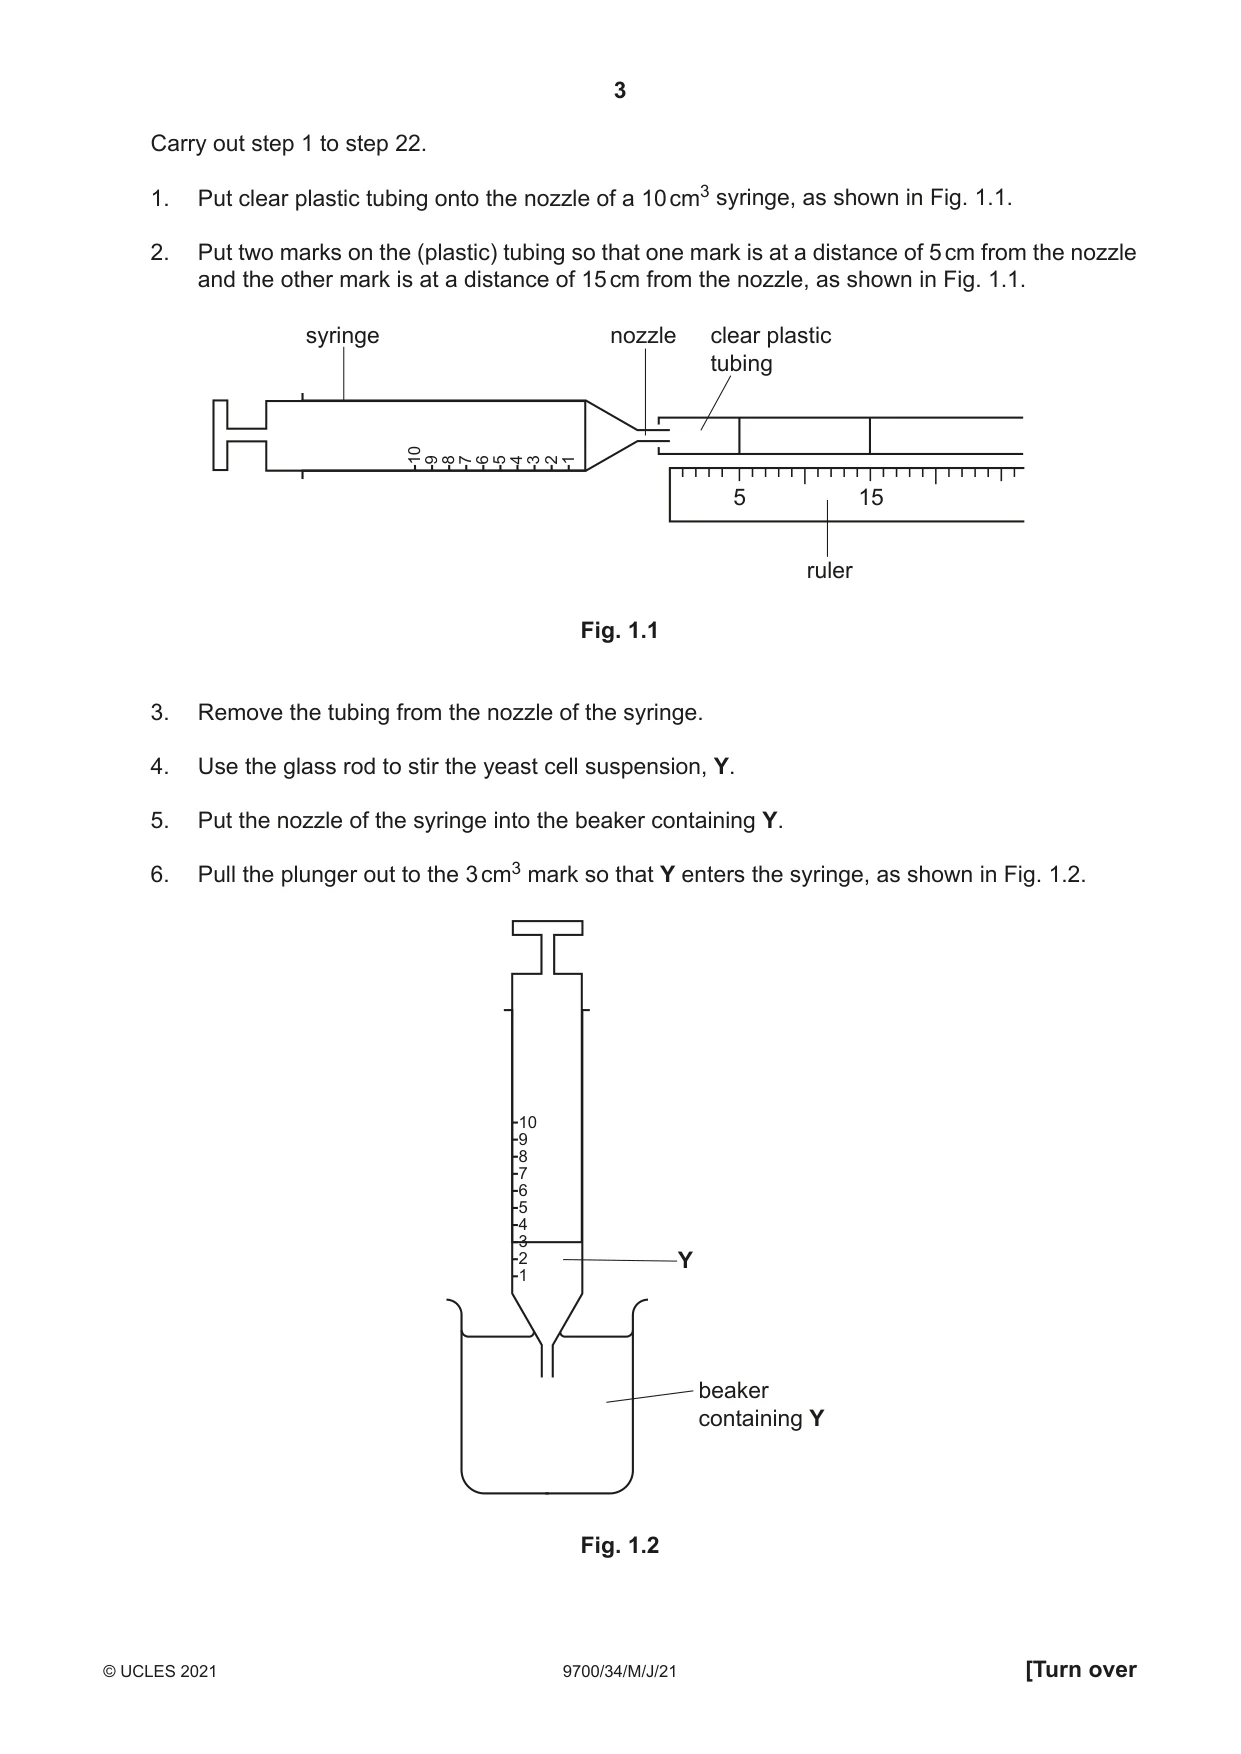
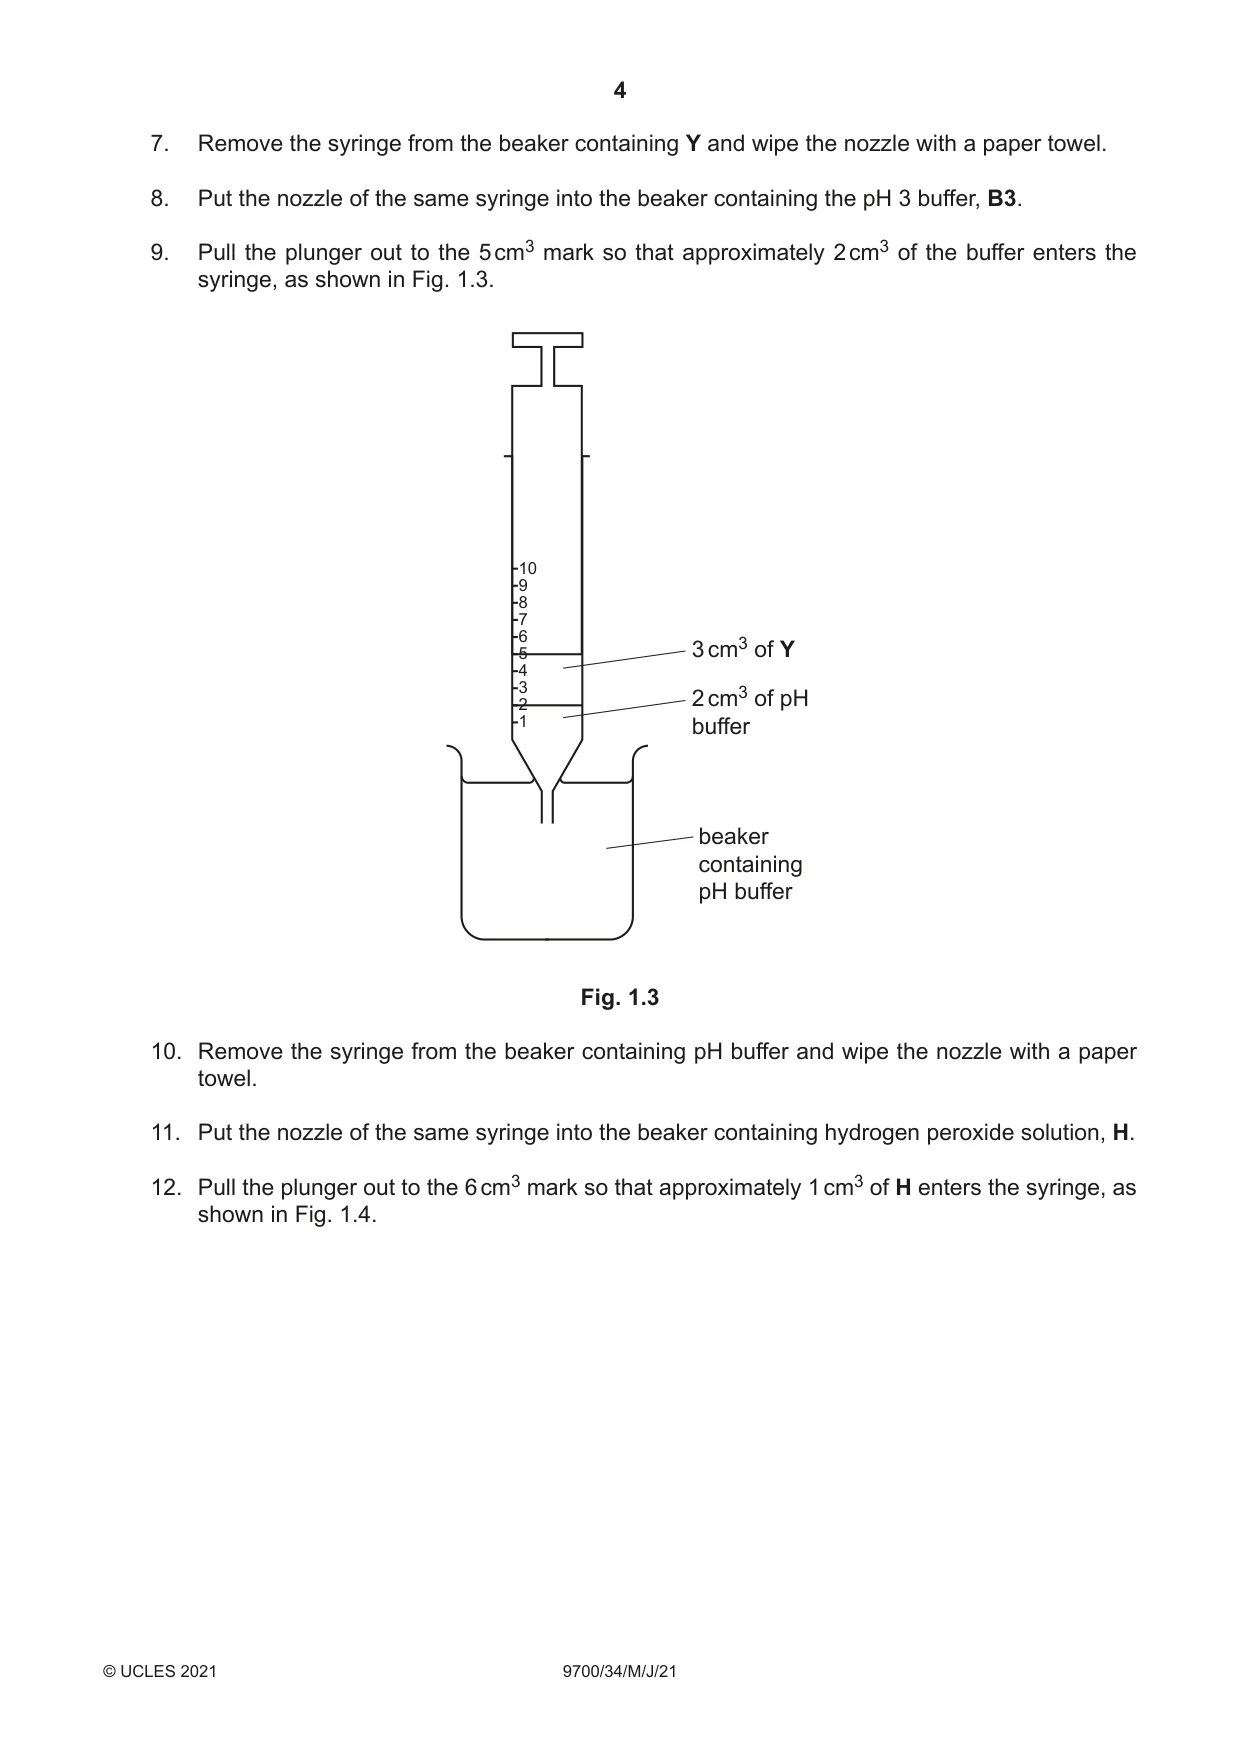
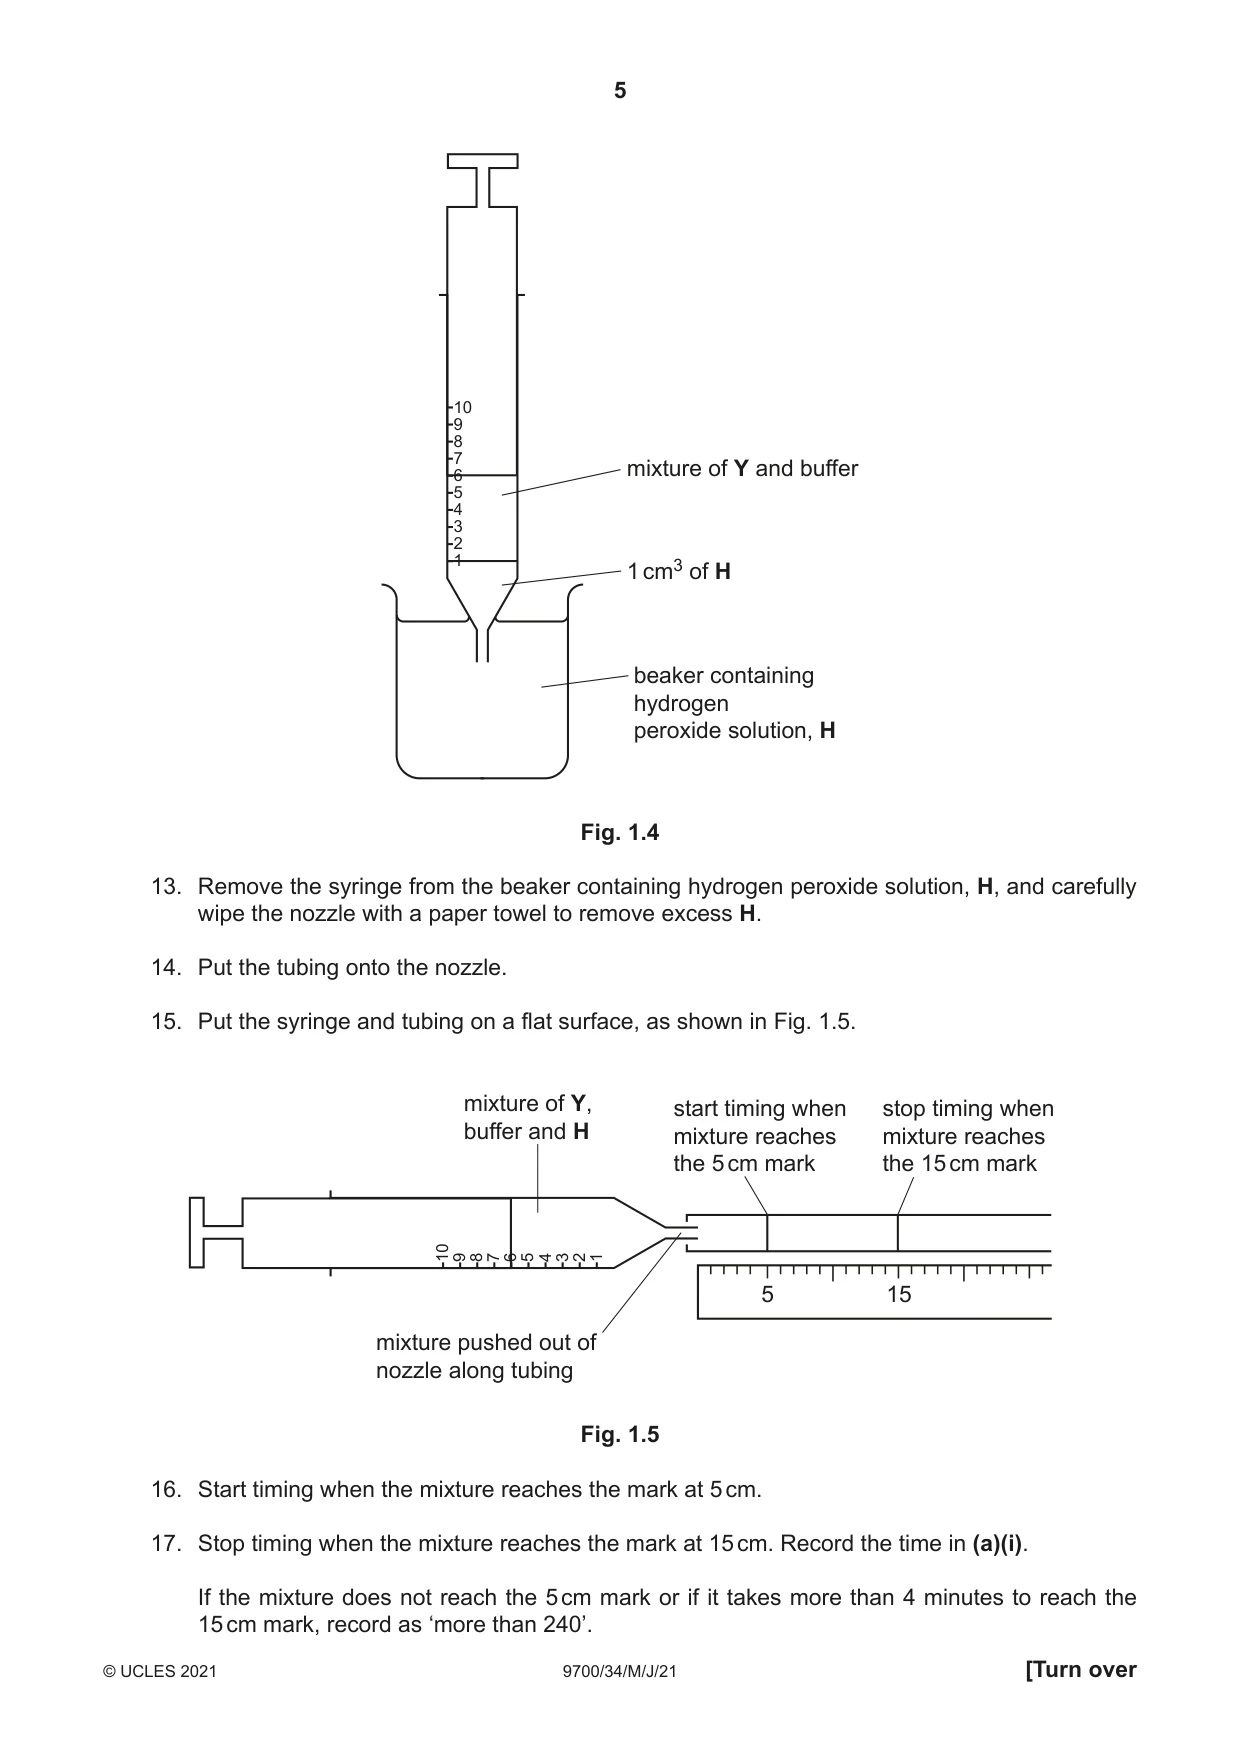
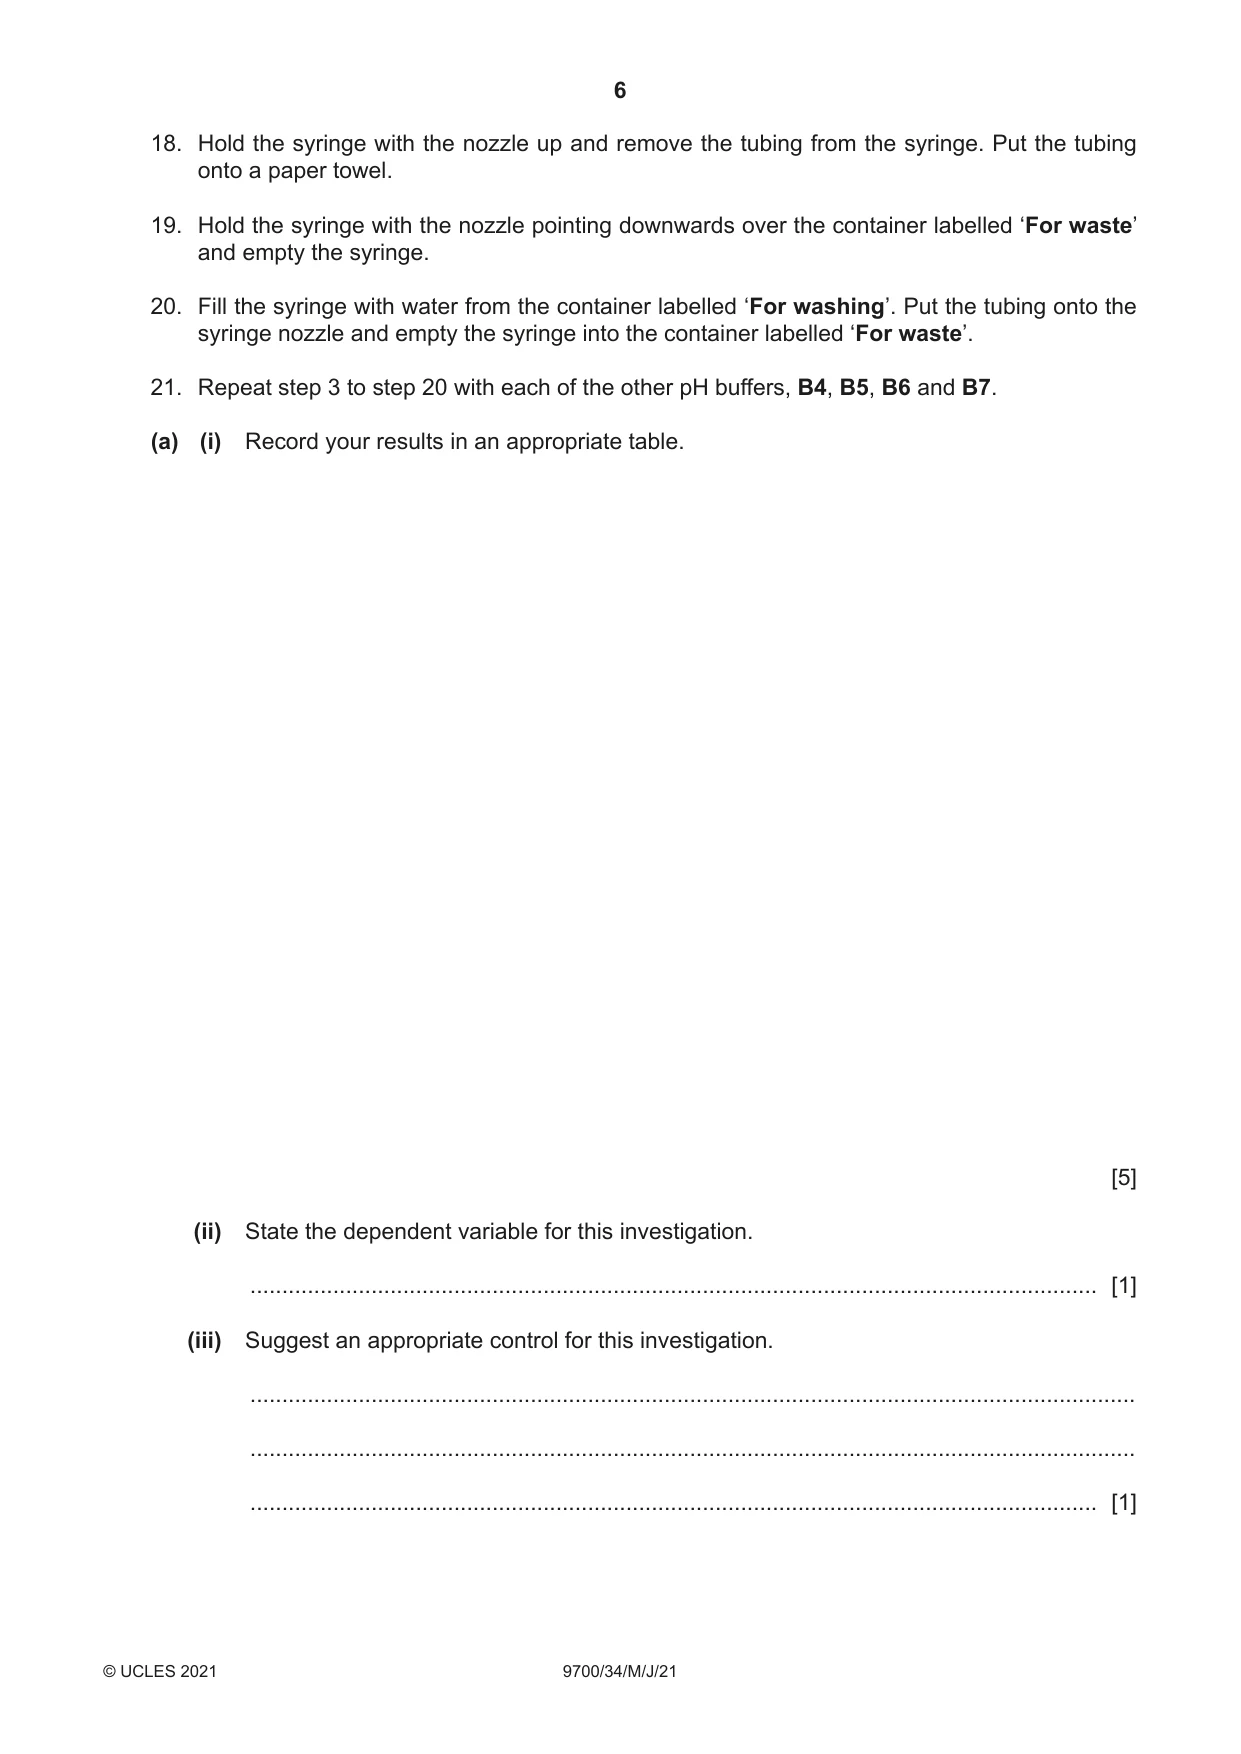
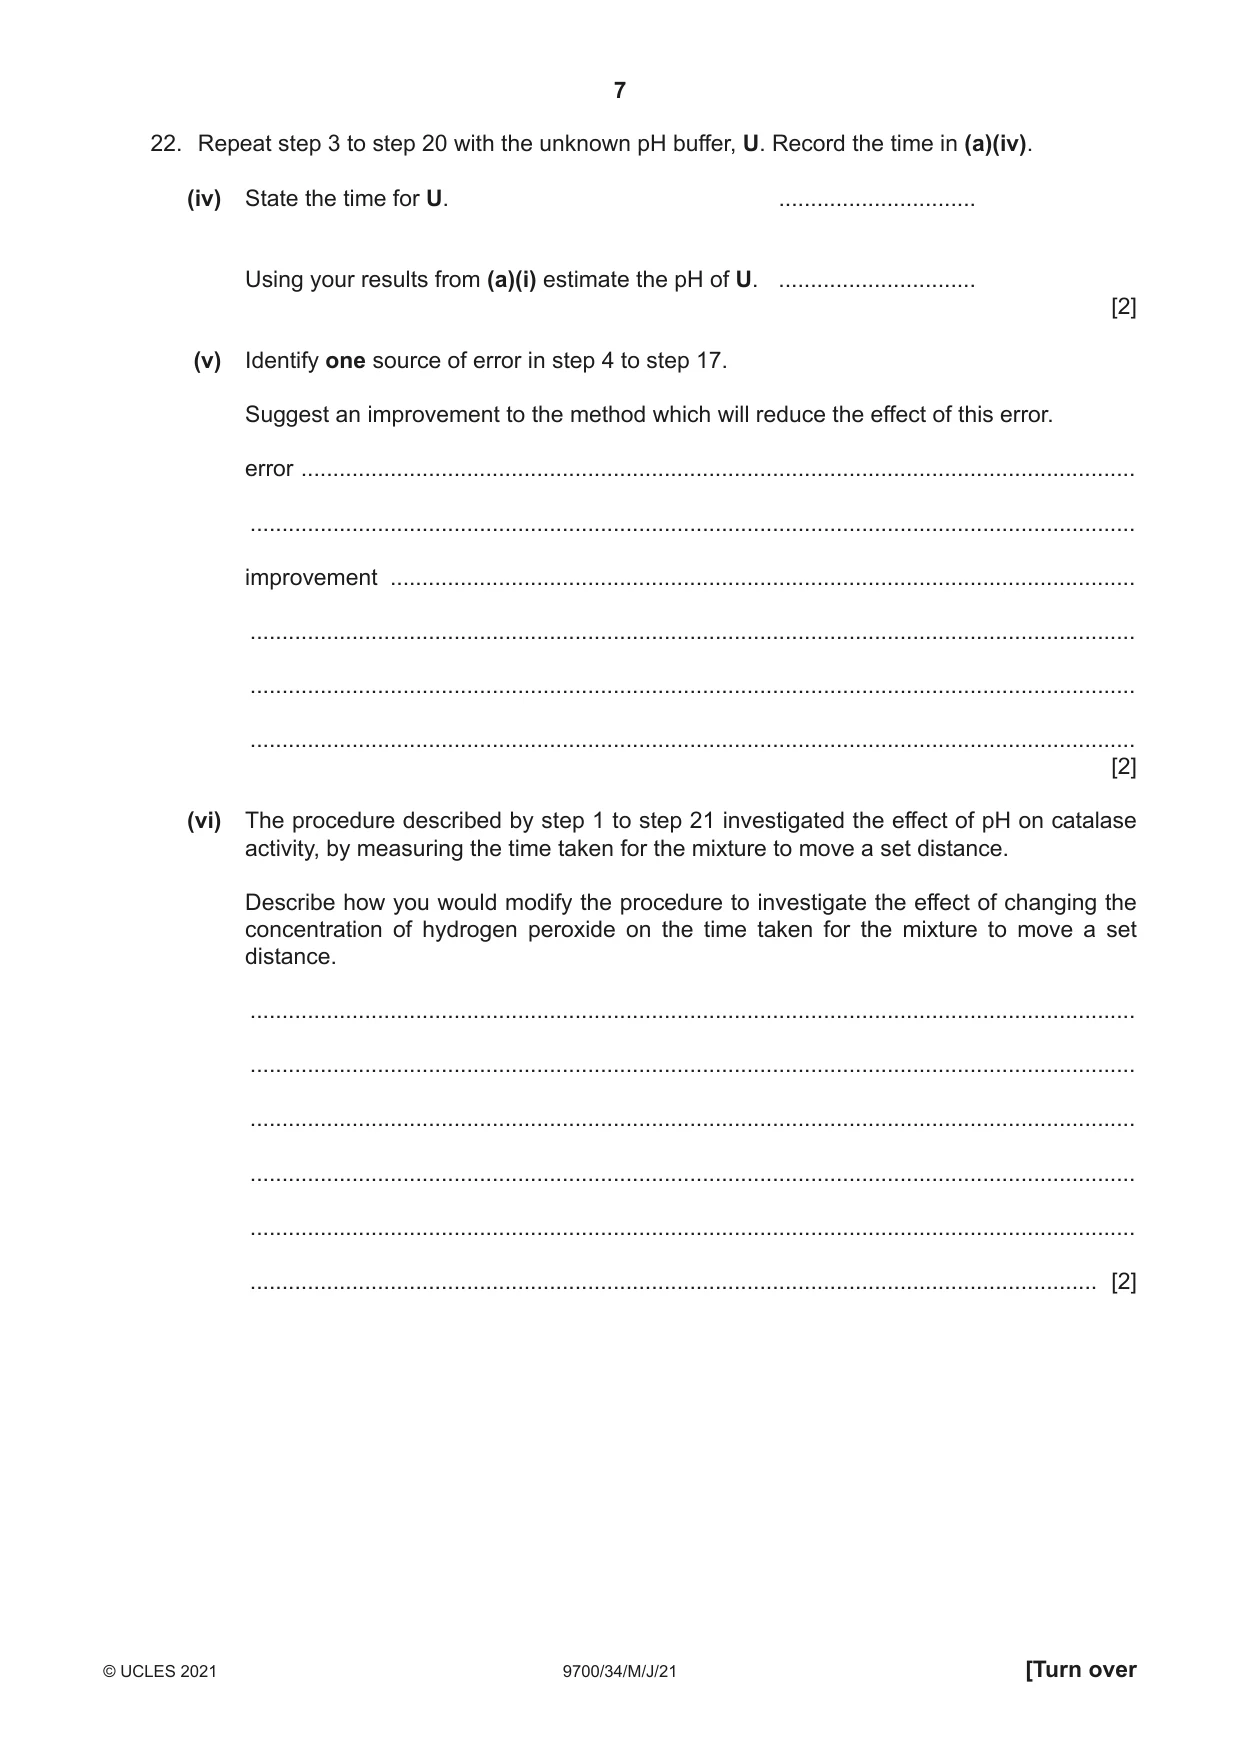
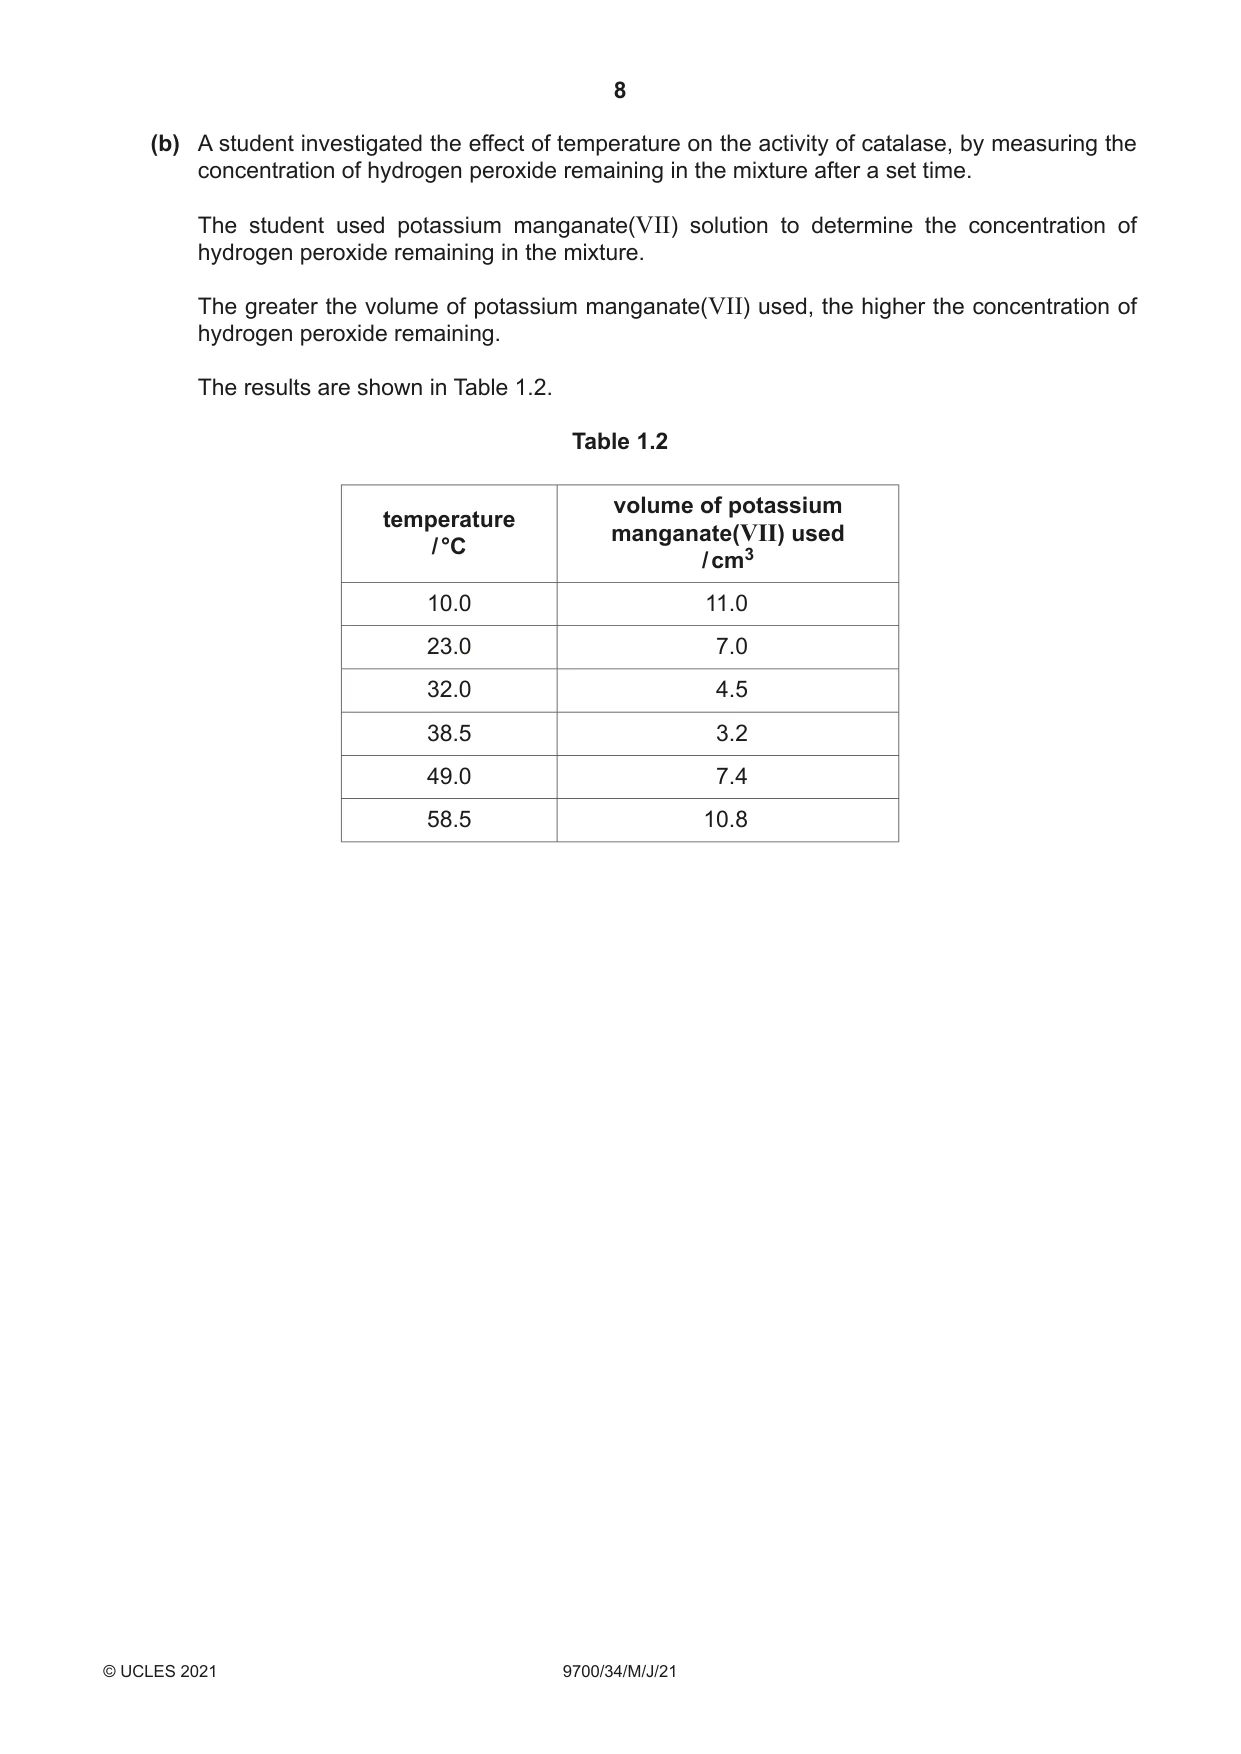
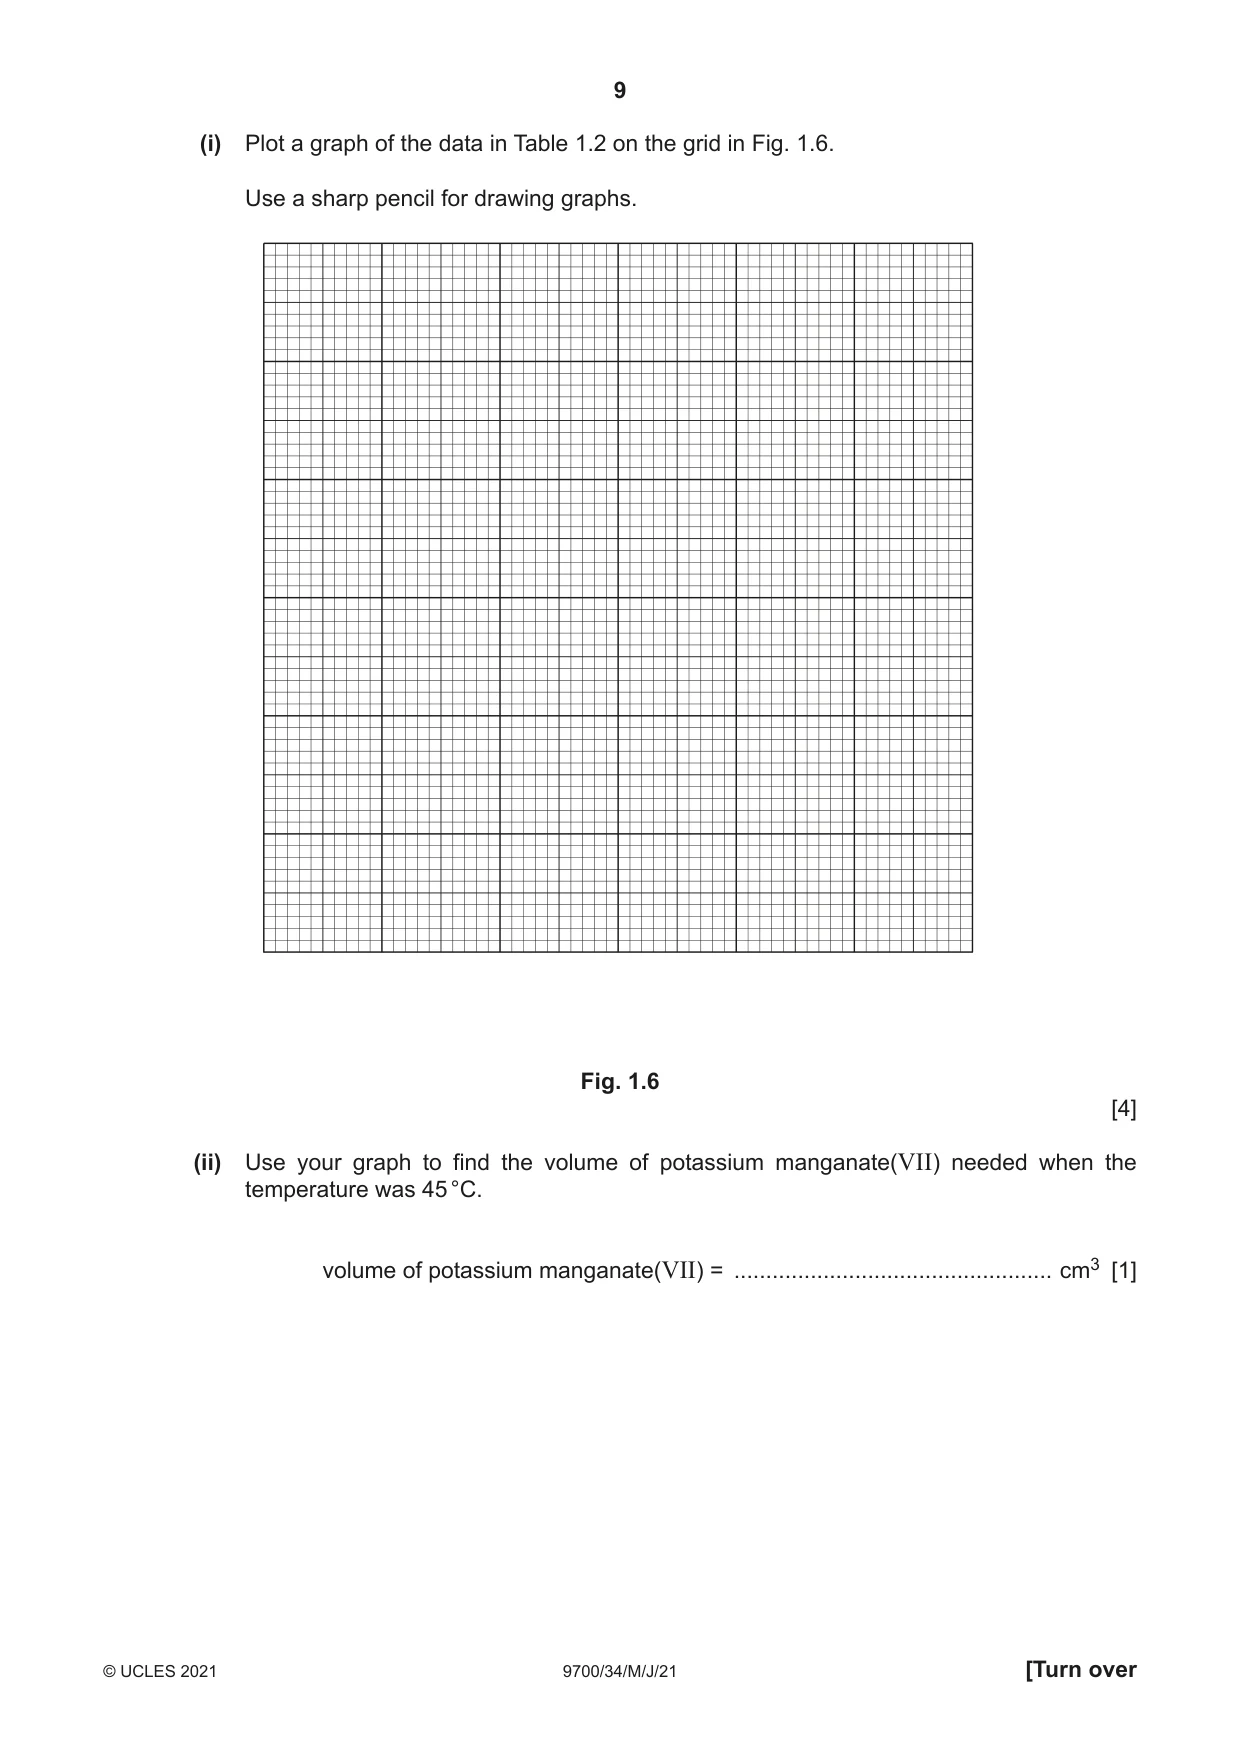
1 Yeast cells contain the enzyme catalase which catalyses the breakdown of hydrogen peroxide, releasing oxygen. When a mixture of hydrogen peroxide and yeast cells is put into a syringe, some of the mixture comes out of the syringe nozzle as the oxygen is released. You are going to investigate the effect of pH on the activity of catalase. You are provided with the materials shown in Table 1.1. Table 1.1 labelled contents hazard volume / cm3 H 3% hydrogen peroxide irritant 25 solution Y yeast cell suspension none 40 B3 buffer pH 3 none 10 B4 buffer pH 4 none 10 B5 buffer pH 5 none 10 B6 buffer pH 6 none 10 B7 buffer pH 7 none 10 U unknown pH buffer none 10 If any of the solutions come into contact with your skin, wash off immediately with cold water. It is recommended that you wear suitable eye protection. Wear gloves to protect your hands when using H. Carry out step 1 to step 22. 1. Put clear plastic tubing onto the nozzle of a 10 cm3 syringe, as shown in Fig. 1.1. 2. Put two marks on the (plastic) tubing so that one mark is at a distance of 5 cm from the nozzle and the other mark is at a distance of 15 cm from the nozzle, as shown in Fig. 1.1. syringe nozzle clear plastic tubing 10987654321 5 15 ruler Fig. 1.1 3. Remove the tubing from the nozzle of the syringe. 4. Use the glass rod to stir the yeast cell suspension, Y. 5. Put the nozzle of the syringe into the beaker containing Y. 6. Pull the plunger out to the 3 cm3 mark so that Y enters the syringe, as shown in Fig. 1.2. 10 9 8 7 6 5 4 3 2 Y 1 beaker containing Y Fig. 1.2 7. Remove the syringe from the beaker containing Y and wipe the nozzle with a paper towel. 8. Put the nozzle of the same syringe into the beaker containing the pH 3 buffer, B3. 9. Pull the plunger out to the 5 cm3 mark so that approximately 2 cm3 of the buffer enters the syringe, as shown in Fig. 1.3. 10 9 8 7 6 5 3 cm3 of Y 4 3 2 2 cm3 of pH 1 buffer beaker containing pH buffer Fig. 1.3 10. Remove the syringe from the beaker containing pH buffer and wipe the nozzle with a paper towel. 11. Put the nozzle of the same syringe into the beaker containing hydrogen peroxide solution, H. 12. Pull the plunger out to the 6 cm3 mark so that approximately 1 cm3 of H enters the syringe, as shown in Fig. 1.4. 10 9 8 7 6 mixture of Y and buffer 5 4 3 2 1 1 cm3 of H beaker containing hydrogen peroxide solution, H Fig. 1.4 13. Remove the syringe from the beaker containing hydrogen peroxide solution, H, and carefully wipe the nozzle with a paper towel to remove excess H. 14. Put the tubing onto the nozzle. 15. Put the syringe and tubing on a flat surface, as shown in Fig. 1.5. mixture of Y, start timing when stop timing when buffer and H mixture reaches mixture reaches the 5 cm mark the 15 cm mark 10987654321 5 15 mixture pushed out of nozzle along tubing Fig. 1.5 16. Start timing when the mixture reaches the mark at 5 cm. 17. Stop timing when the mixture reaches the mark at 15 cm. Record the time in (a)(i). If the mixture does not reach the 5 cm mark or if it takes more than 4 minutes to reach the 15 cm mark, record as ‘more than 240’. 18. Hold the syringe with the nozzle up and remove the tubing from the syringe. Put the tubing onto a paper towel. 19. Hold the syringe with the nozzle pointing downwards over the container labelled ‘For waste’ and empty the syringe. 20. Fill the syringe with water from the container labelled ‘For washing’. Put the tubing onto the syringe nozzle and empty the syringe into the container labelled ‘For waste’. 21. Repeat step 3 to step 20 with each of the other pH buffers, B4, B5, B6 and B7. (a) (i) Record your results in an appropriate table. [5] (ii) State the dependent variable for this investigation. ..................................................................................................................................... [1] (iii) Suggest an appropriate control for this investigation. ........................................................................................................................................... ........................................................................................................................................... ..................................................................................................................................... [1] 22. Repeat step 3 to step 20 with the unknown pH buffer, U. Record the time in (a)(iv). (iv) State the time for U. ............................... Using your results from (a)(i) estimate the pH of U. ............................... [2] (v) Identify one source of error in step 4 to step 17. Suggest an improvement to the method which will reduce the effect of this error. error ................................................................................................................................... ........................................................................................................................................... improvement ..................................................................................................................... ........................................................................................................................................... ........................................................................................................................................... ........................................................................................................................................... [2] (vi) The procedure described by step 1 to step 21 investigated the effect of pH on catalase activity, by measuring the time taken for the mixture to move a set distance. Describe how you would modify the procedure to investigate the effect of changing the concentration of hydrogen peroxide on the time taken for the mixture to move a set distance. ........................................................................................................................................... ........................................................................................................................................... ........................................................................................................................................... ........................................................................................................................................... ........................................................................................................................................... ..................................................................................................................................... [2] (b) A student investigated the effect of temperature on the activity of catalase, by measuring the concentration of hydrogen peroxide remaining in the mixture after a set time. The student used potassium manganate(VII) solution to determine the concentration of hydrogen peroxide remaining in the mixture. The greater the volume of potassium manganate(VII) used, the higher the concentration of hydrogen peroxide remaining. The results are shown in Table 1.2. Table 1.2 volume of potassium temperature manganate(VII) used / °C / cm3 10.0 11.0 23.0 7.0 32.0 4.5 38.5 3.2 49.0 7.4 58.5 10.8 (i) Plot a graph of the data in Table 1.2 on the grid in Fig. 1.6. Use a sharp pencil for drawing graphs. Fig. 1.6 [4] (ii) Use your graph to find the volume of potassium manganate(VII) needed when the temperature was 45 °C. volume of potassium manganate(VII) = .................................................. cm3 [1] (iii) Suggest an explanation for the difference in concentration of hydrogen peroxide remaining at 38.5 °C and at 58.5 °C. ........................................................................................................................................... ........................................................................................................................................... ........................................................................................................................................... ........................................................................................................................................... ........................................................................................................................................... ........................................................................................................................................... ..................................................................................................................................... [2] [Total: 20]
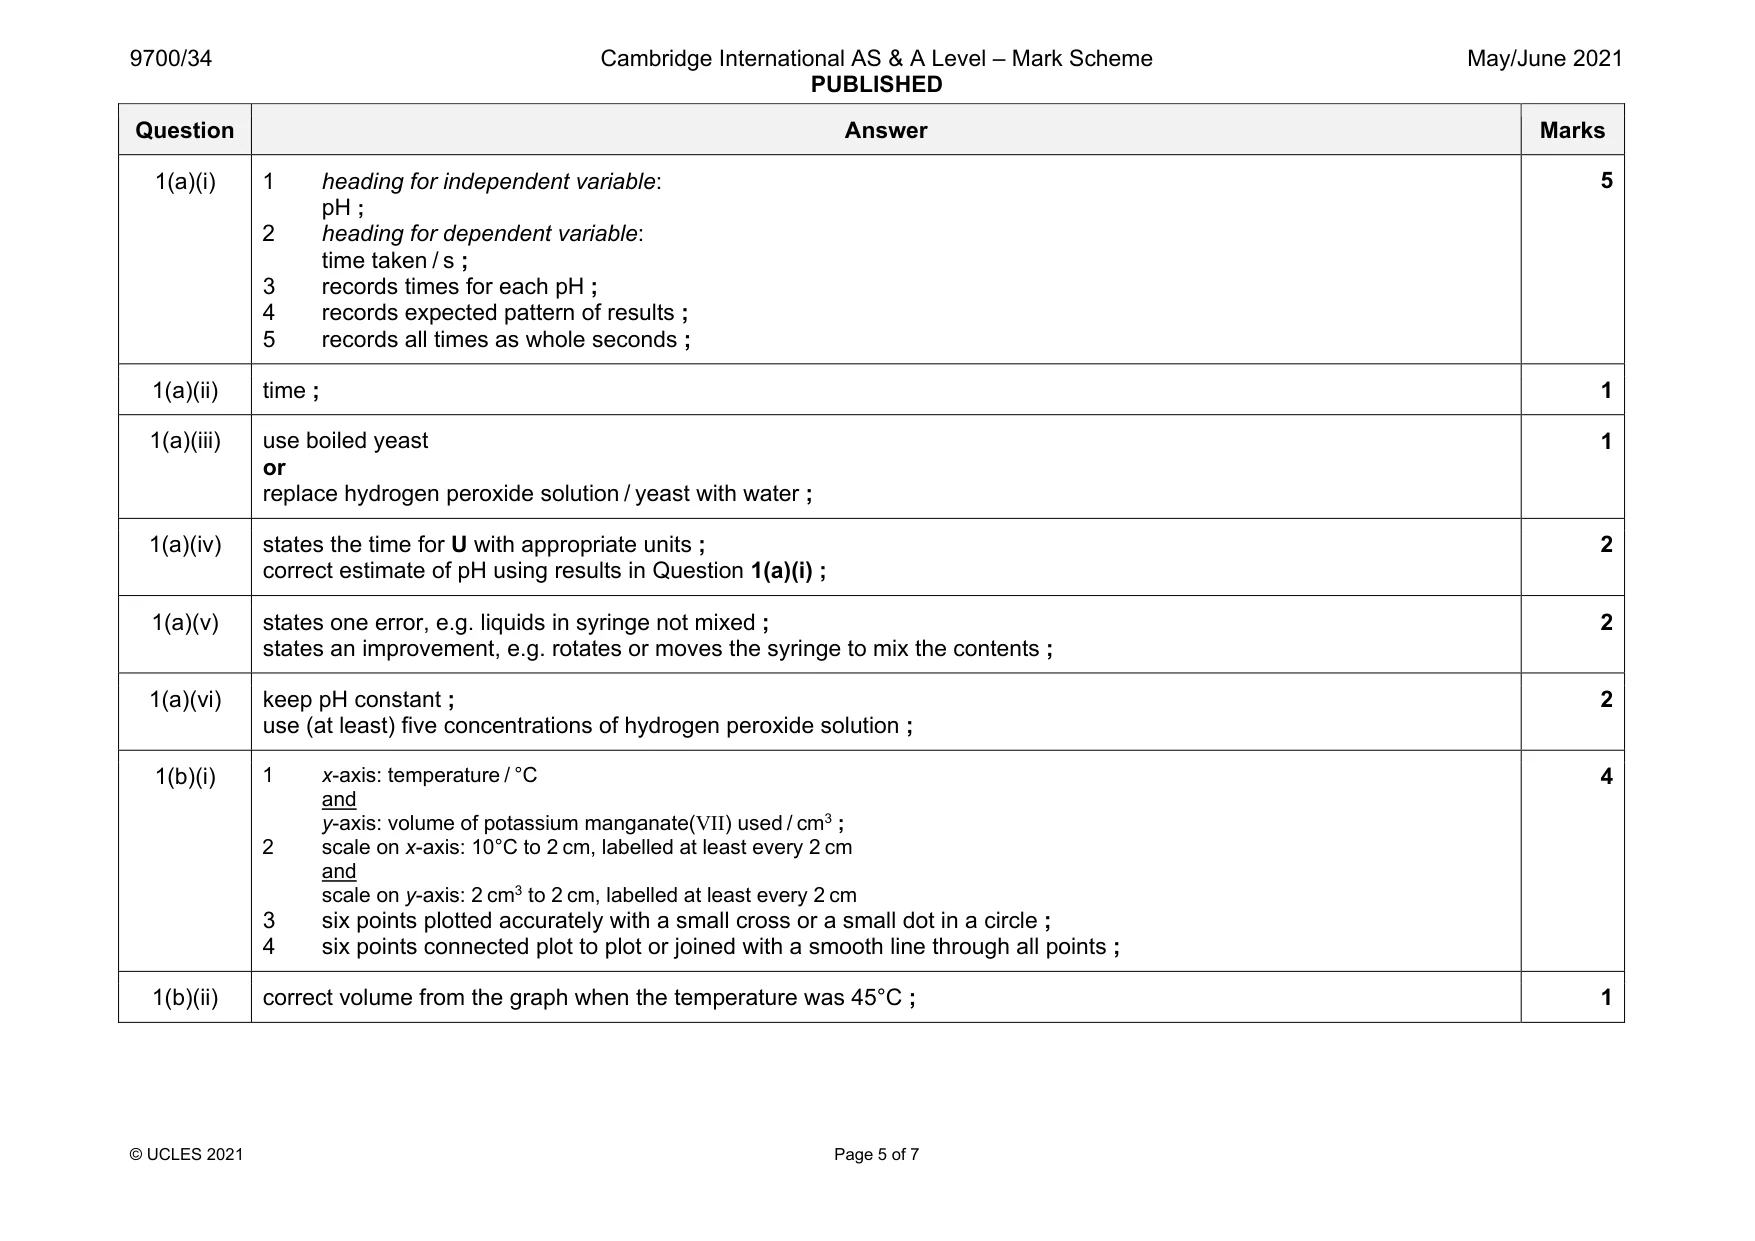
Mark scheme: 1(a)(i) 1 heading for independent variable: pH ; 2 heading for dependent variable: time taken / s ; 3 records times for each pH ; 4 records expected pattern of results ; 5 records all times as whole seconds ; 1(a)(ii) time ; 1 1(a)(iii) use boiled yeast or replace hydrogen peroxide solution / yeast with water ; 1 1(a)(iv) states the time for U with appropriate units ; correct estimate of pH using results in Question 1(a)(i) ; 2 1(a)(v) states one error, e.g. liquids in syringe not mixed ; states an improvement, e.g. rotates or moves the syringe to mix the contents ; 2 1(a)(vi) keep pH constant ; use (at least) five concentrations of hydrogen peroxide solution ; 2 1(b)(i) 1 x-axis: temperature / °C and y-axis: volume of potassium manganate(VII) used / cm3 ; 2 scale on x-axis: 10°C to 2 cm, labelled at least every 2 cm and scale on y-axis: 2 cm3 to 2 cm, labelled at least every 2 cm 3 six points plotted accurately with a small cross or a small dot in a circle ; 4 six points connected plot to plot or joined with a smooth line through all points ; 4 1(b)(ii) correct volume from the graph when the temperature was 45°C ; 1 Question Answer Marks 1(b)(iii) any two from: 1 (at 58.5°C) more hydrogen peroxide remaining ; 2 fewer enzyme substrate complexes ; 3 enzyme becoming denatured ; 2 6
Q2 · M1 is a slide of a stained transverse section through a plant root
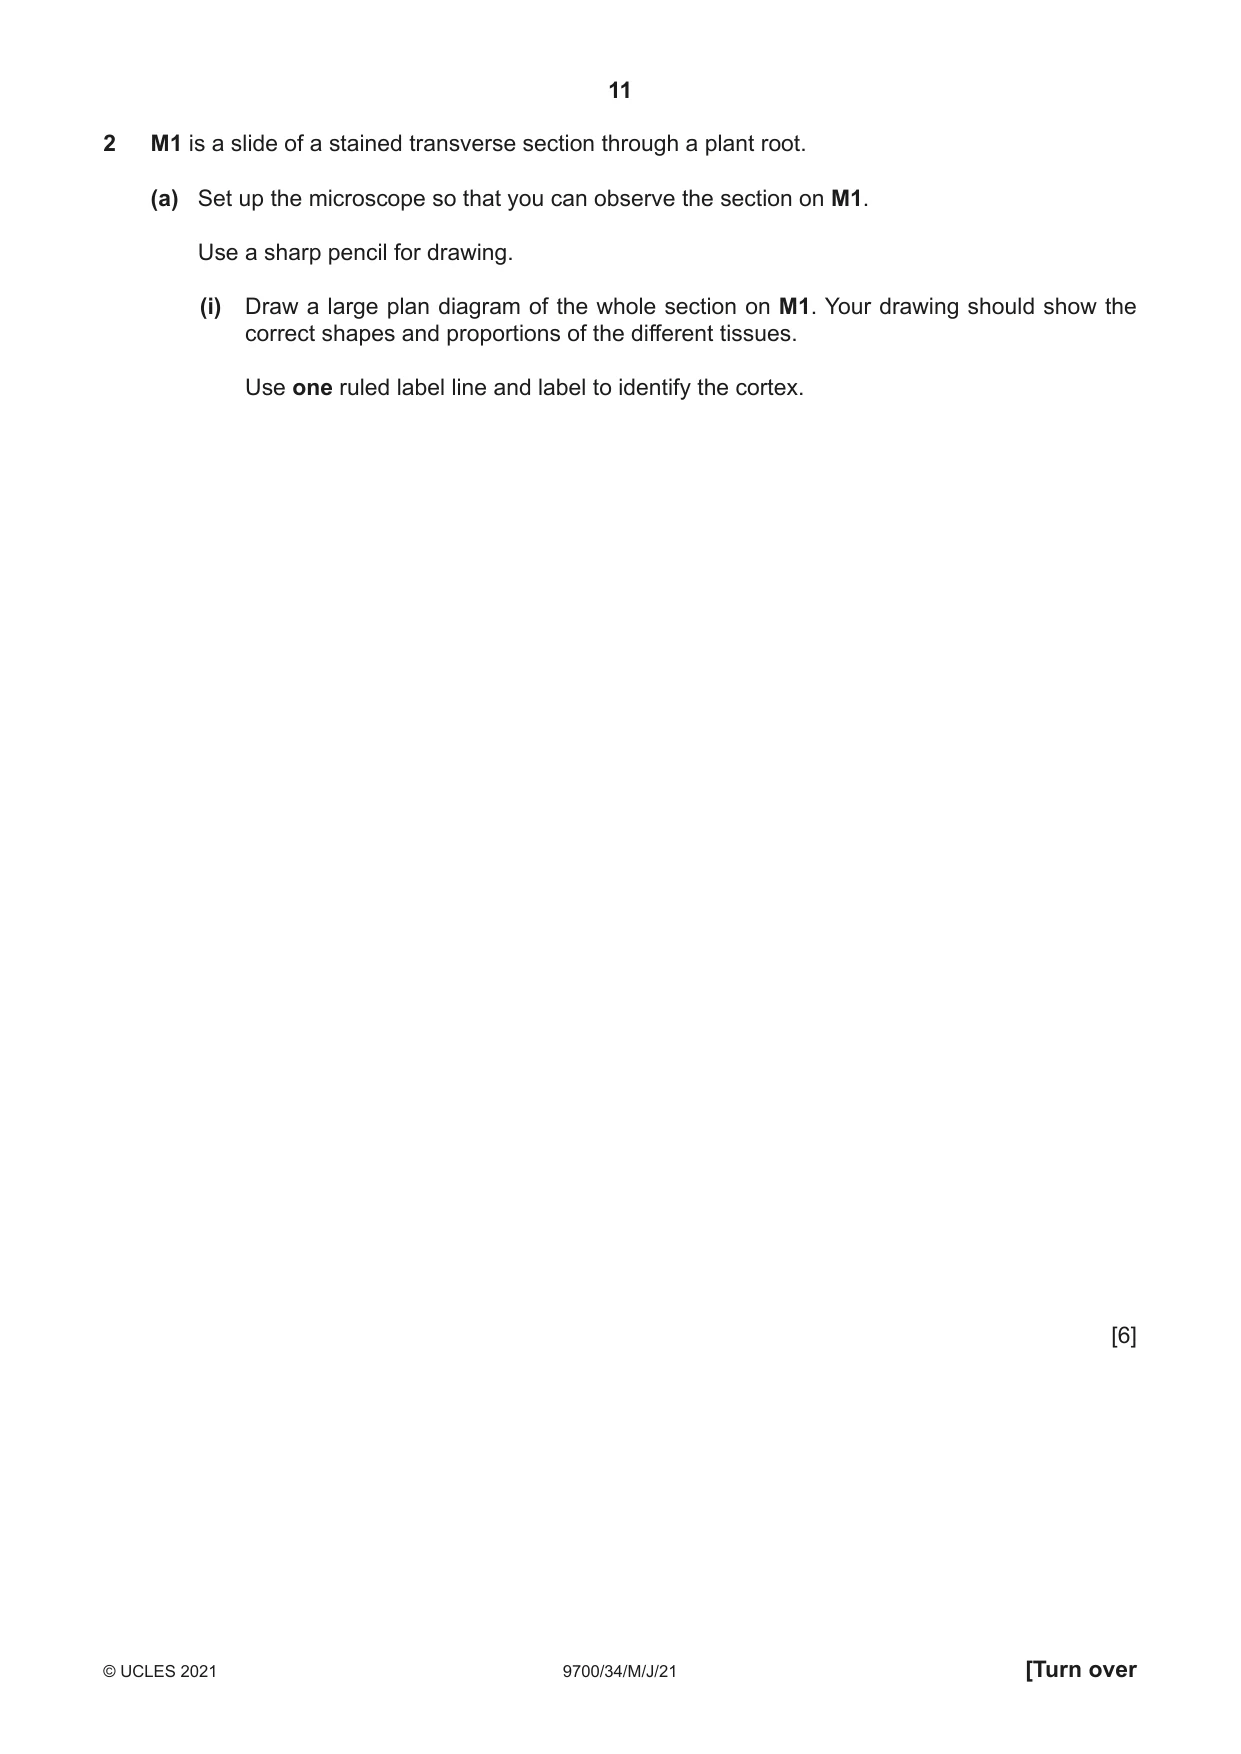
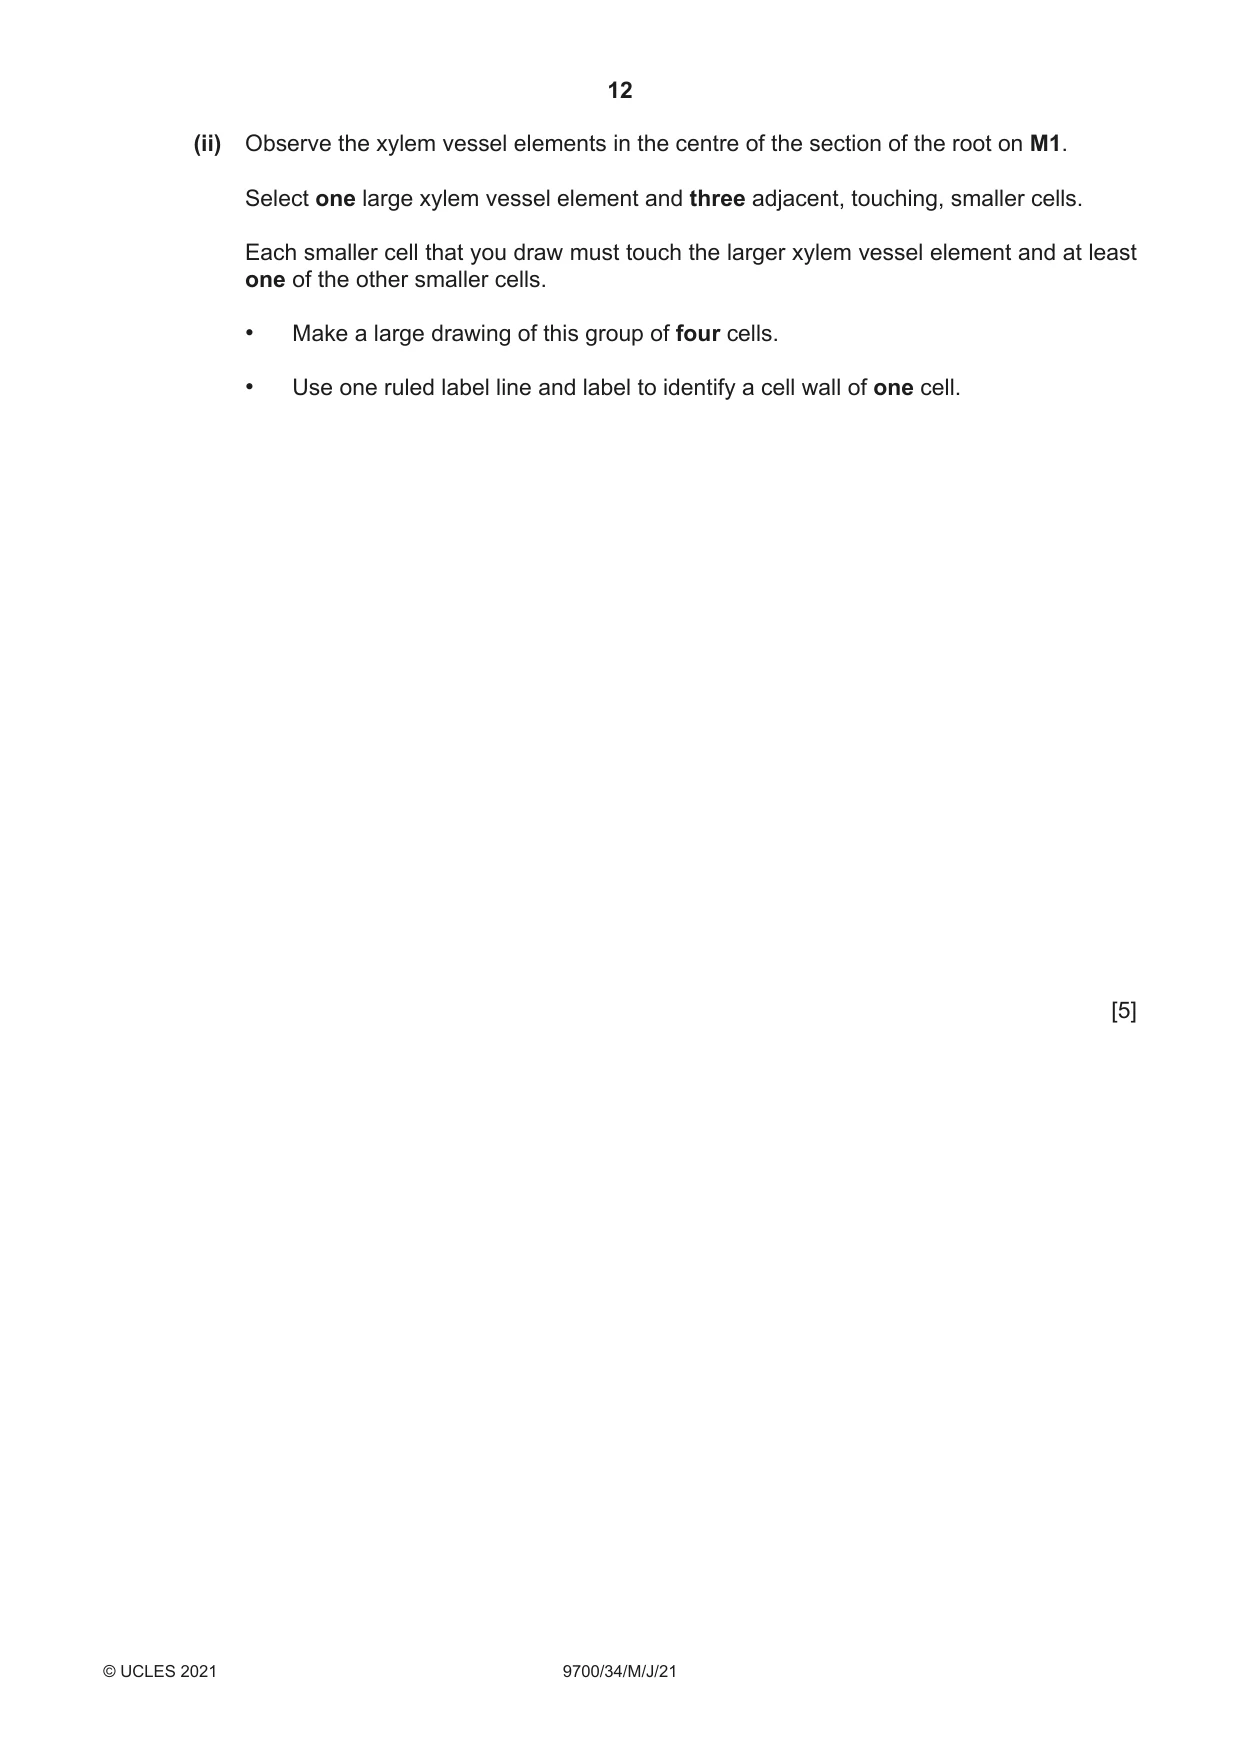
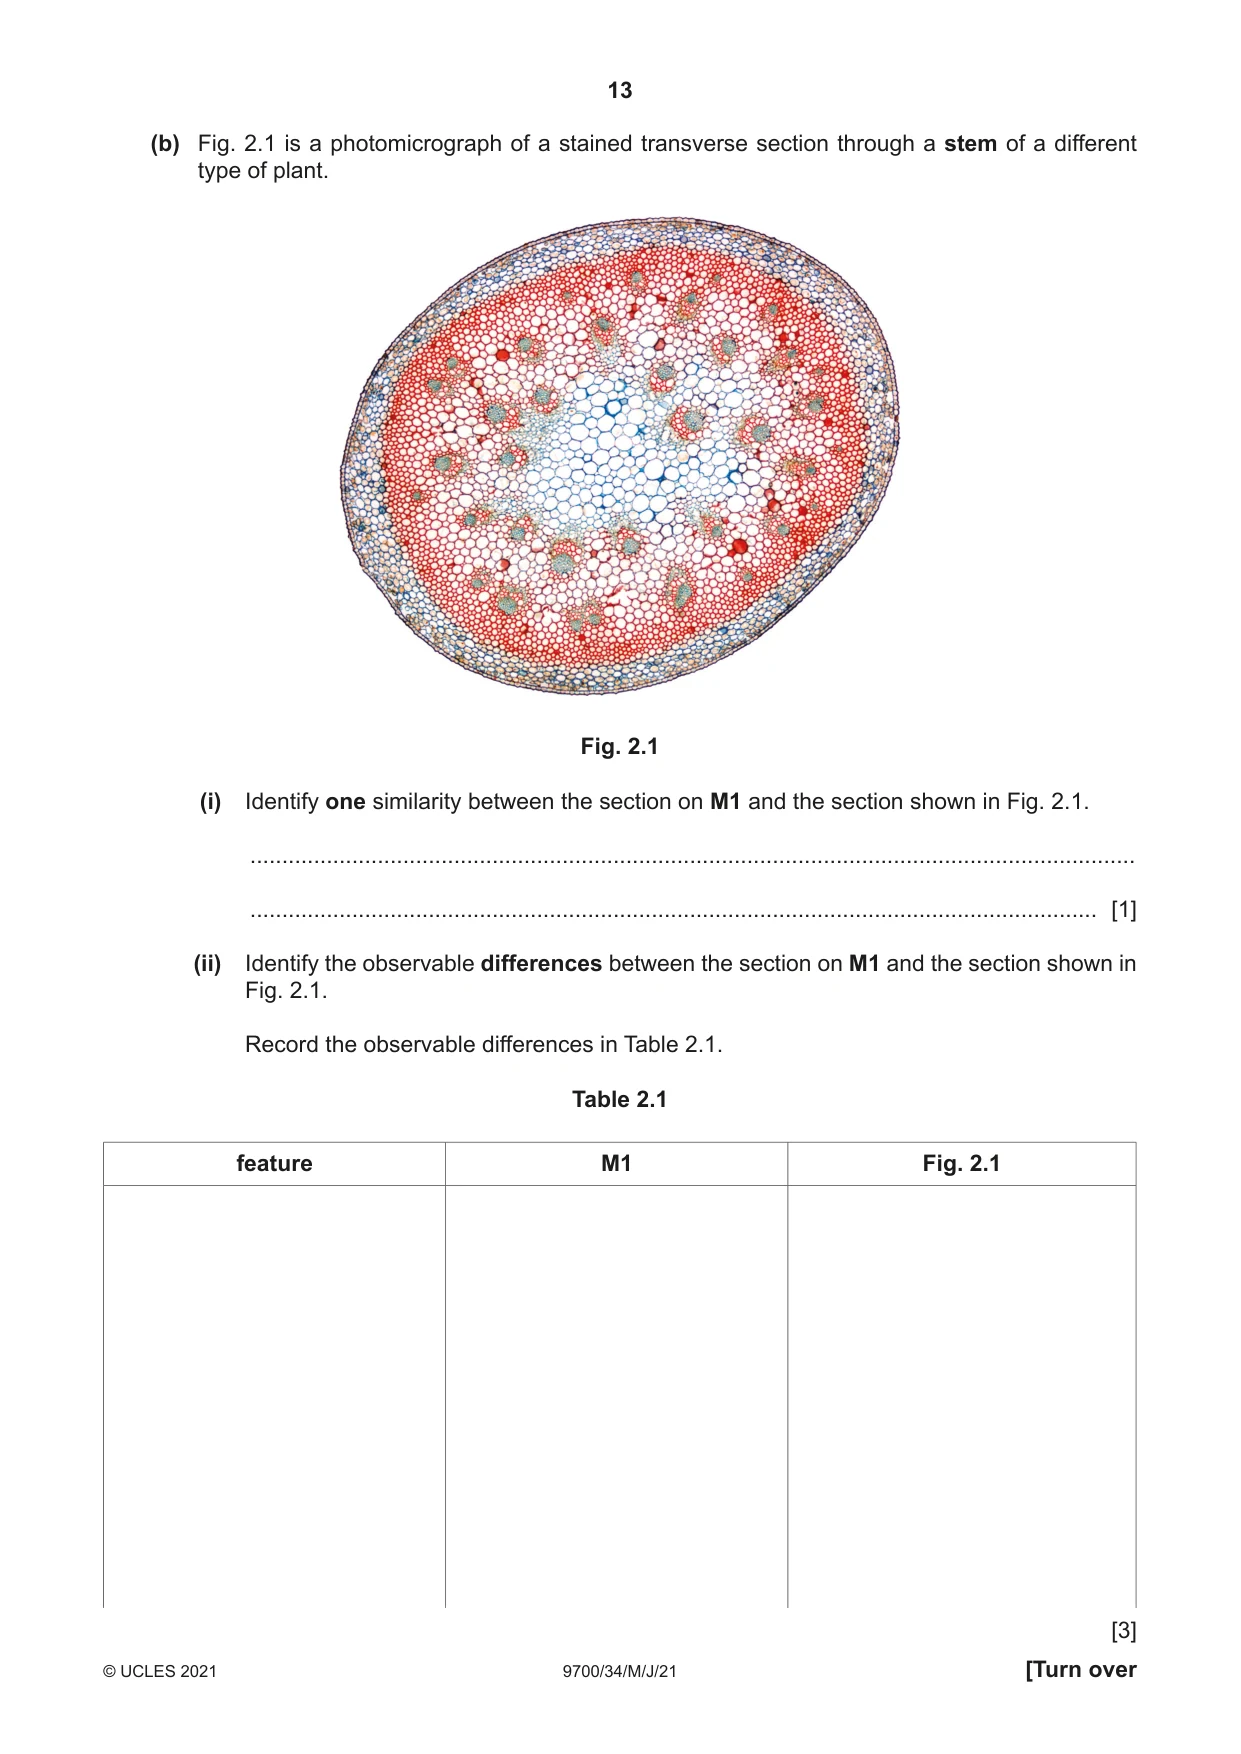
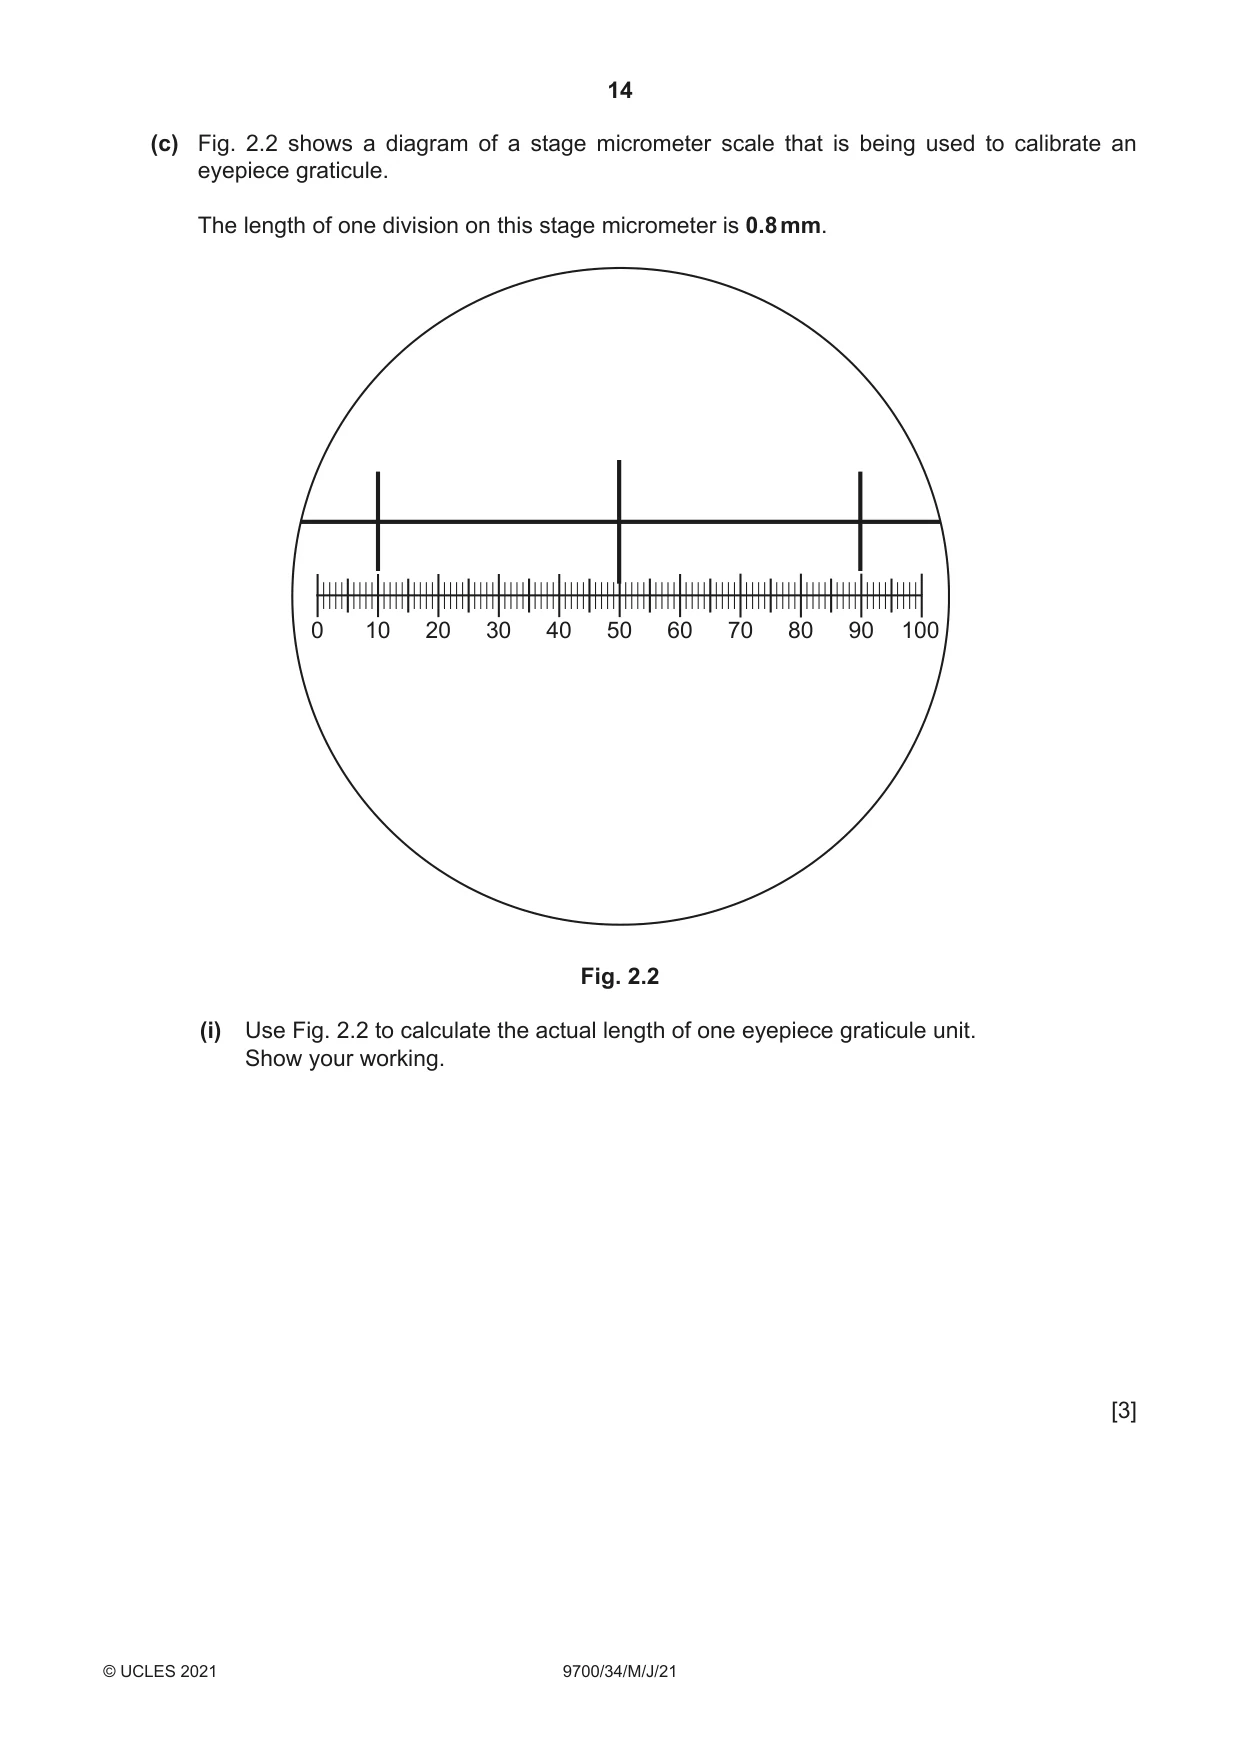
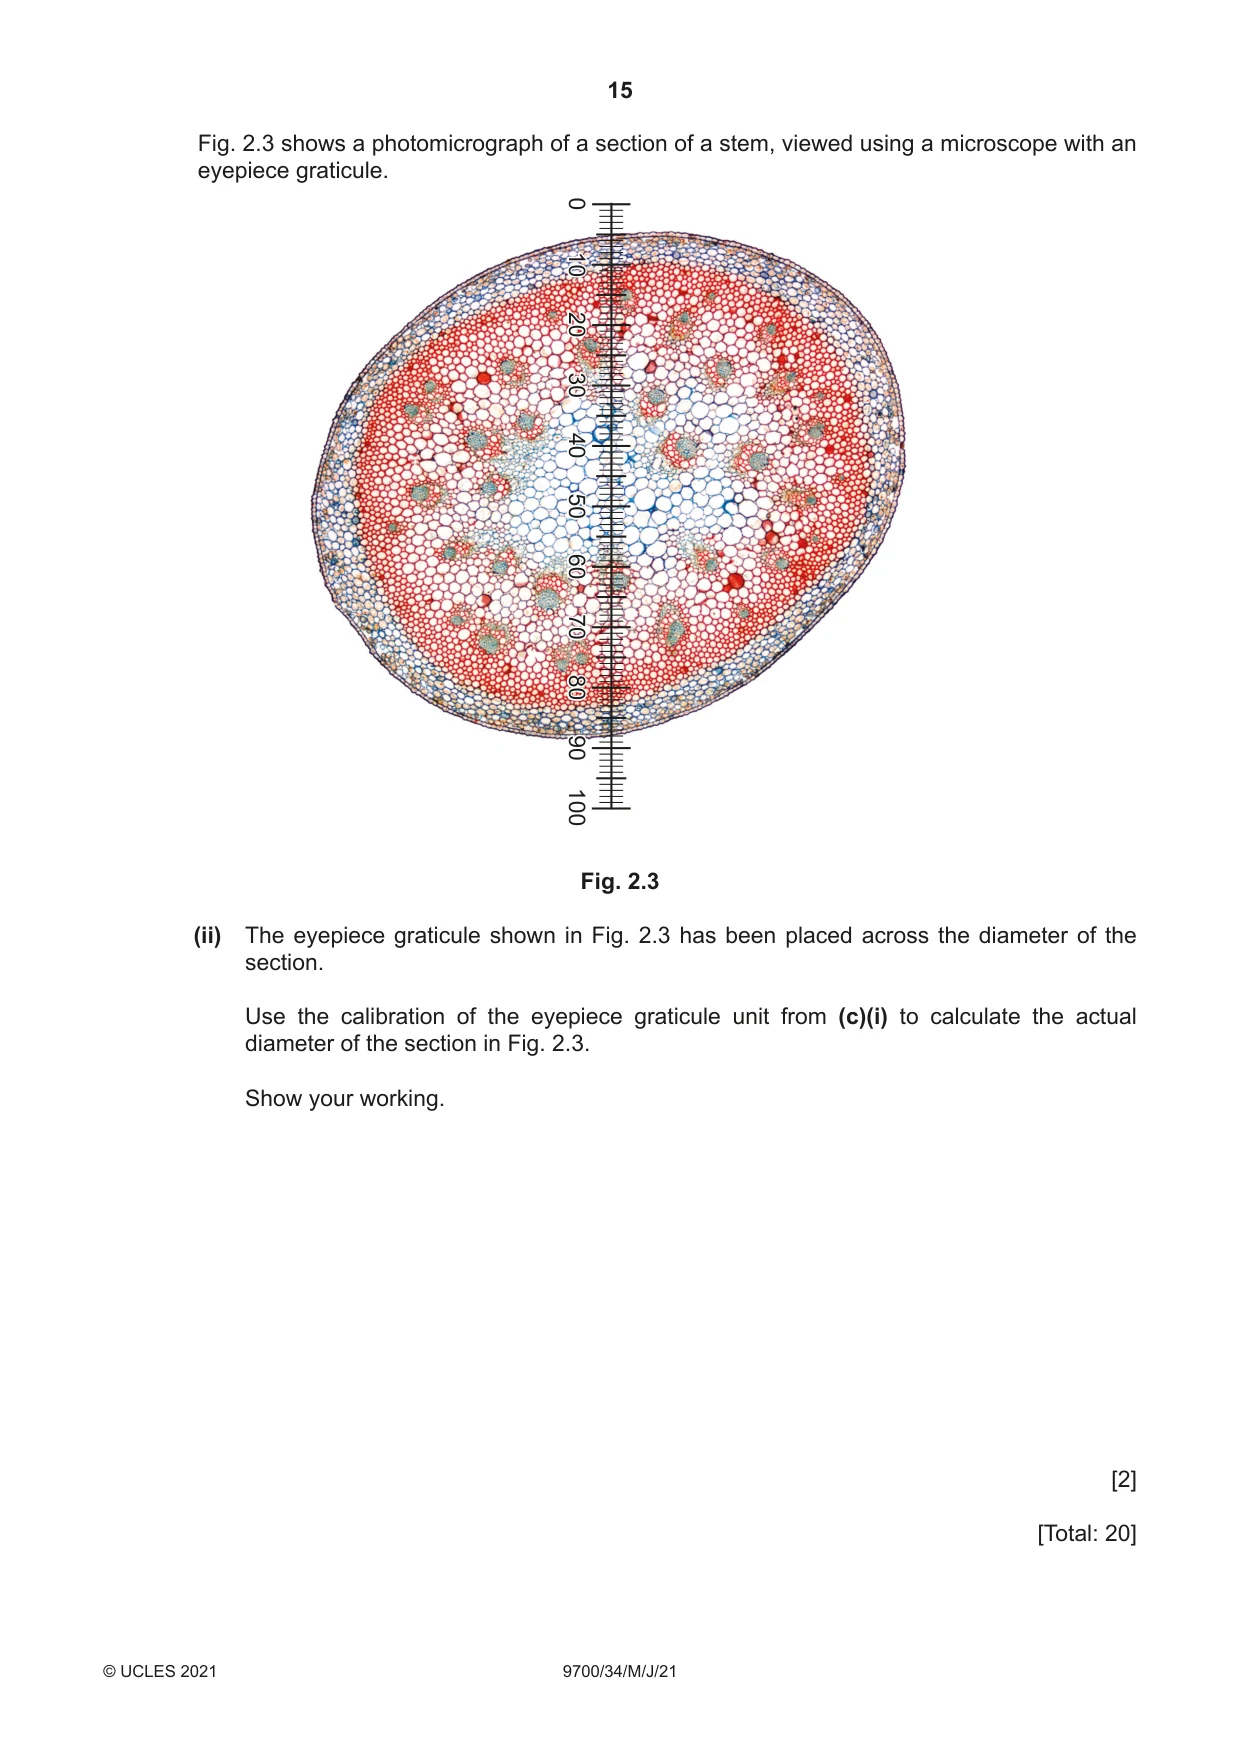
2 M1 is a slide of a stained transverse section through a plant root. (a) Set up the microscope so that you can observe the section on M1. Use a sharp pencil for drawing. (i) Draw a large plan diagram of the whole section on M1. Your drawing should show the correct shapes and proportions of the different tissues. Use one ruled label line and label to identify the cortex. [6] (ii) Observe the xylem vessel elements in the centre of the section of the root on M1. Select one large xylem vessel element and three adjacent, touching, smaller cells. Each smaller cell that you draw must touch the larger xylem vessel element and at least one of the other smaller cells. • Make a large drawing of this group of four cells. • Use one ruled label line and label to identify a cell wall of one cell. [5] (b) Fig. 2.1 is a photomicrograph of a stained transverse section through a stem of a different type of plant. Fig. 2.1 (i) Identify one similarity between the section on M1 and the section shown in Fig. 2.1. ........................................................................................................................................... ..................................................................................................................................... [1] (ii) Identify the observable differences between the section on M1 and the section shown in Fig. 2.1. Record the observable differences in Table 2.1. Table 2.1 feature M1 Fig. 2.1
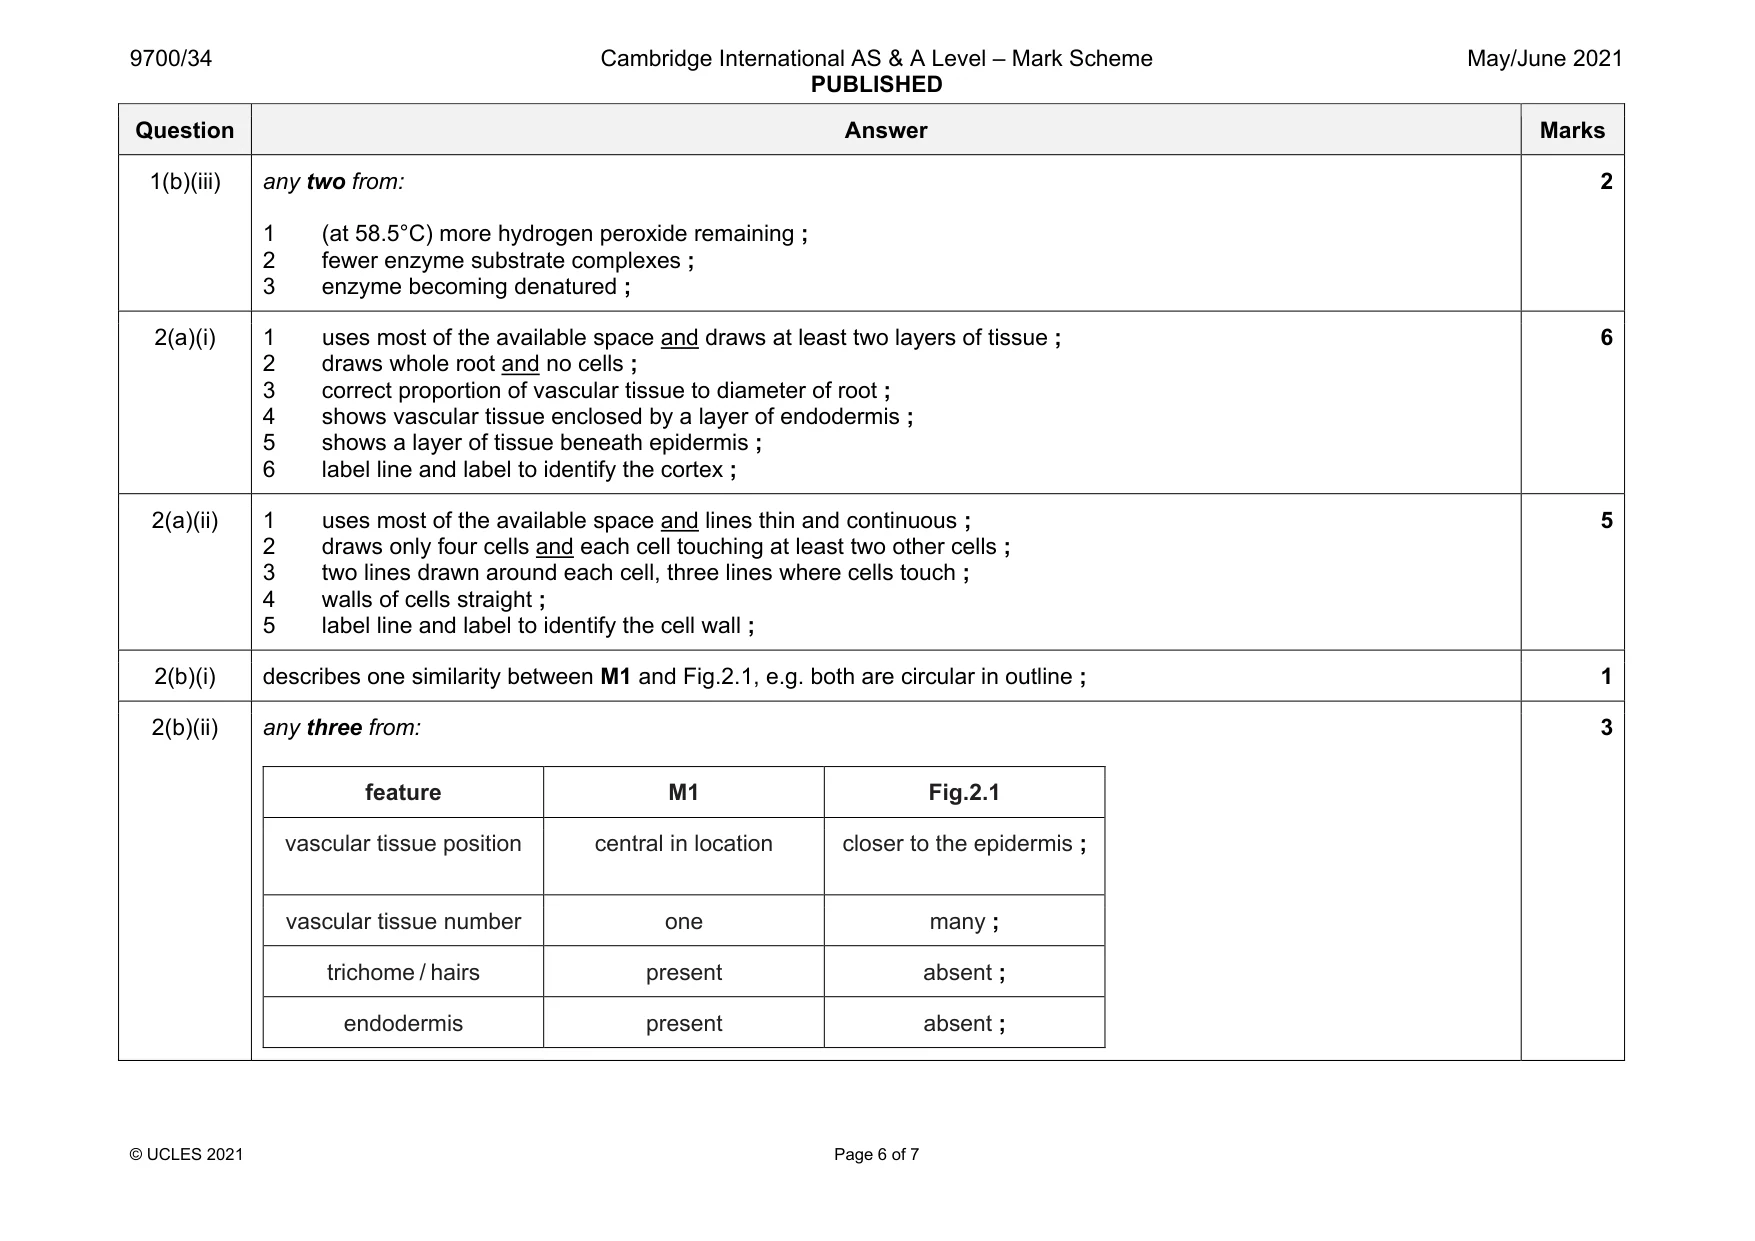
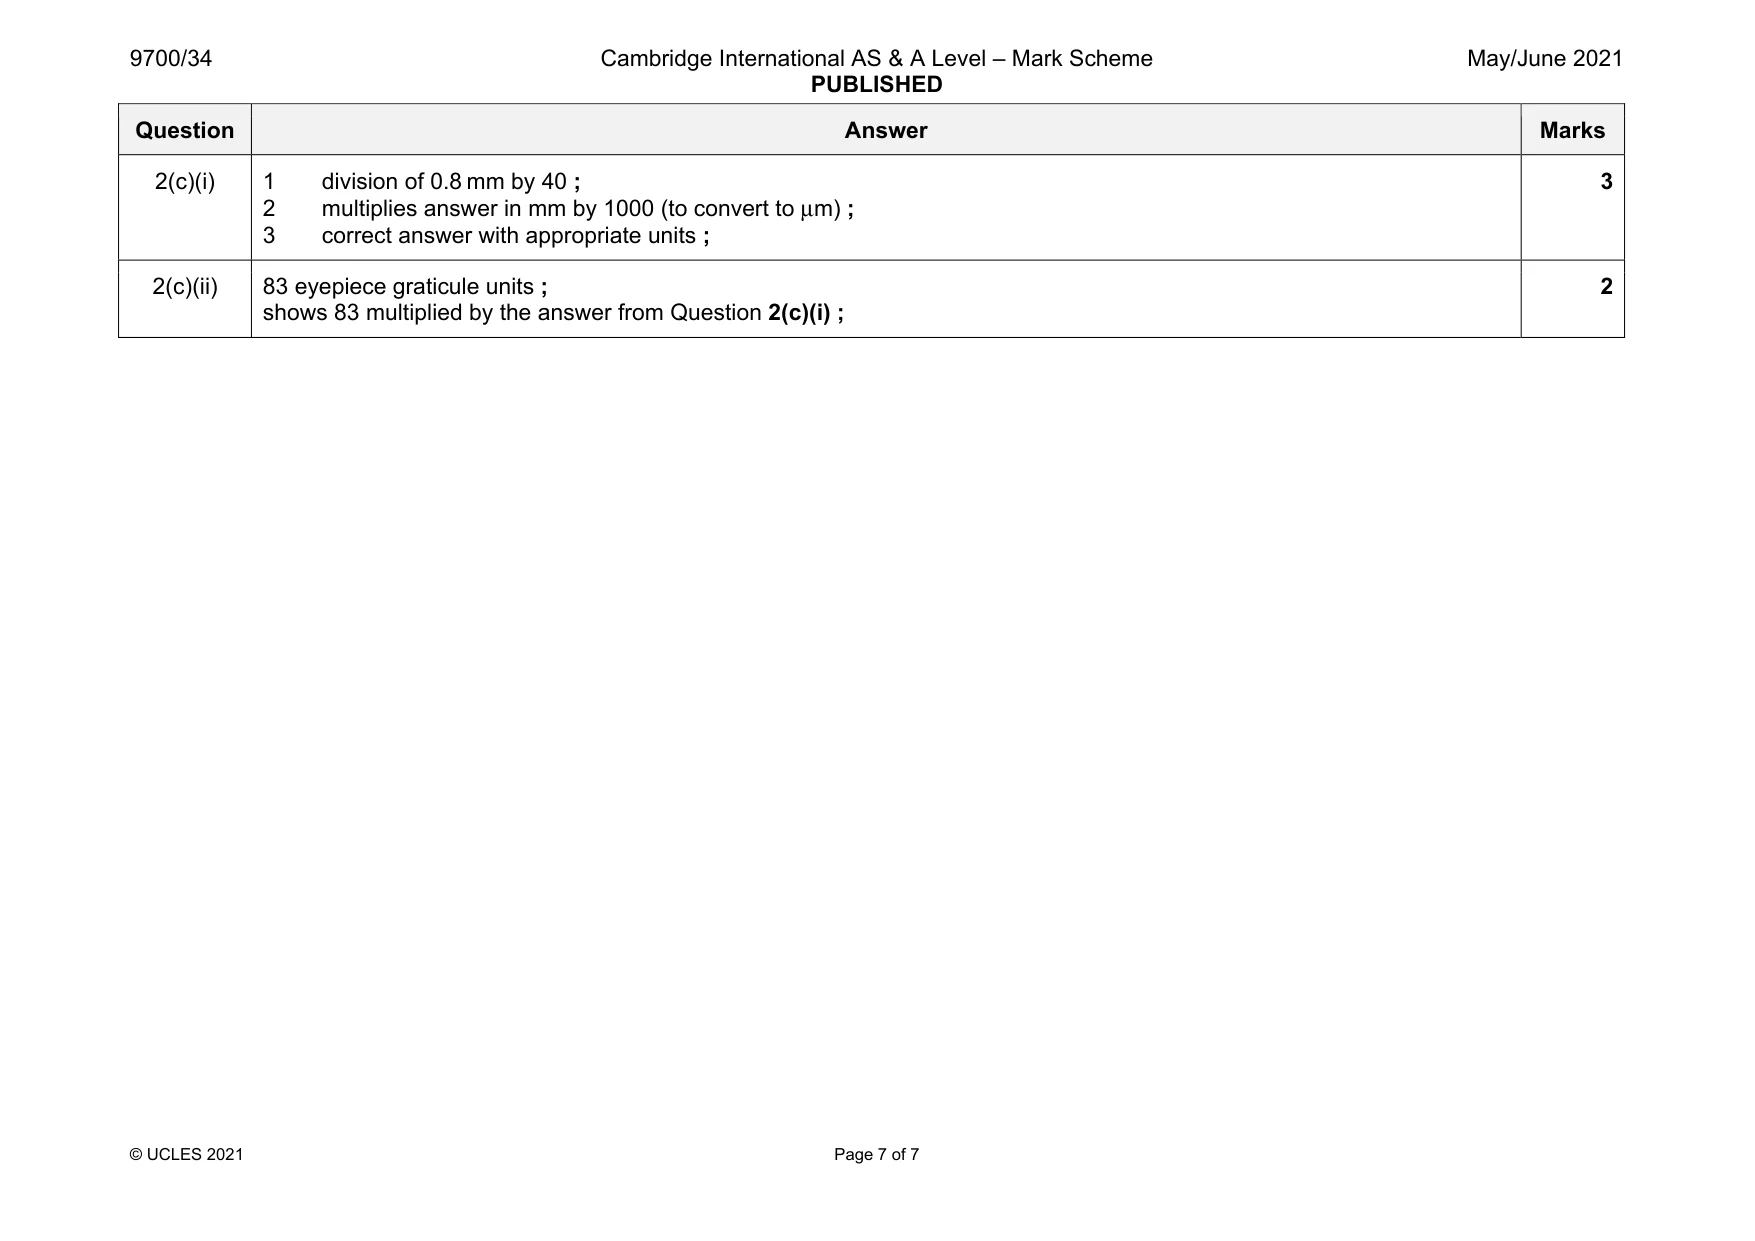
Mark scheme: 2(a)(i) 1 uses most of the available space and draws at least two layers of tissue ; 2 draws whole root and no cells ; 3 correct proportion of vascular tissue to diameter of root ; 4 shows vascular tissue enclosed by a layer of endodermis ; 5 shows a layer of tissue beneath epidermis ; 6 label line and label to identify the cortex ; 2(a)(ii) 1 uses most of the available space and lines thin and continuous ; 2 draws only four cells and each cell touching at least two other cells ; 3 two lines drawn around each cell, three lines where cells touch ; 4 walls of cells straight ; 5 label line and label to identify the cell wall ; 5 2(b)(i) describes one similarity between M1 and Fig.2.1, e.g. both are circular in outline ; 1 2(b)(ii) any three from: feature M1 Fig.2.1 vascular tissue position central in location closer to the epidermis ; vascular tissue number one many ; trichome / hairs present absent ; endodermis present absent ; 3 Question Answer Marks 2(c)(i) 1 division of 0.8 mm by 40 ; 2 multiplies answer in mm by 1000 (to convert to μm) ; 3 correct answer with appropriate units ; 3 2(c)(ii) 83 eyepiece graticule units ; shows 83 multiplied by the answer from Question 2(c)(i) ; 2
What was in this paper
The subtopics covered by these 2 questions, and how many questions each got. Open one in a new tab to see every Cambridge question on it.
What you needed in this session
Cambridge’s own grade thresholds for 2021 May/June, Paper 3 · Variant 4. A higher threshold means an easier paper — the bar moves with how the cohort did.