Cambridge A Level Biology 9700 — 2020 Oct/Nov Paper 5 · Variant 2
9700/52/O/N/20 · 2 questions · 30 marks · ≈34 min
The question paper and its mark scheme, free to read here and free to download. This is Cambridge’s own paper, exactly as it was sat.
Question paper12 pages




Mark scheme11 pages
Answers below. Sit the paper first if you are practising.
Questions as text
Q1 · Some students observed a flowering plant and noticed that the flower was supported by a…
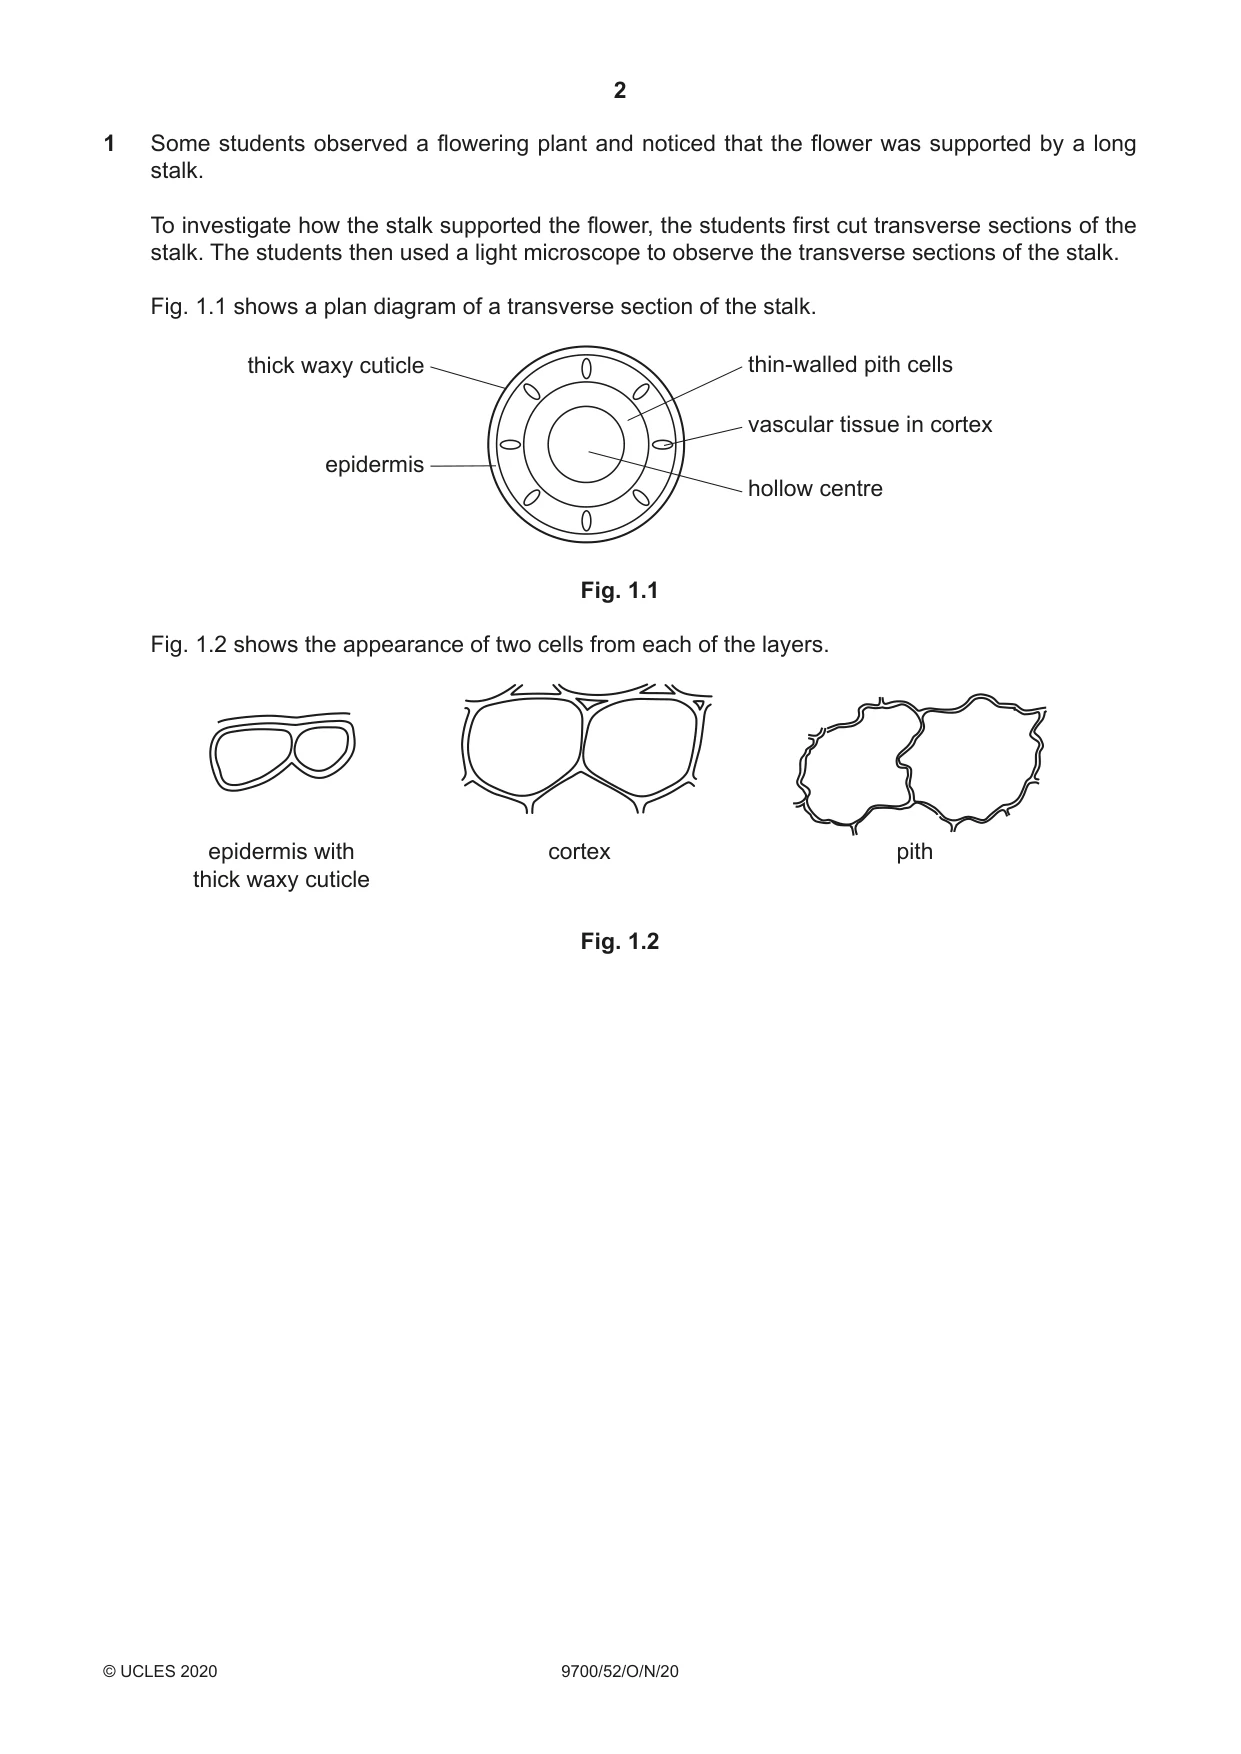
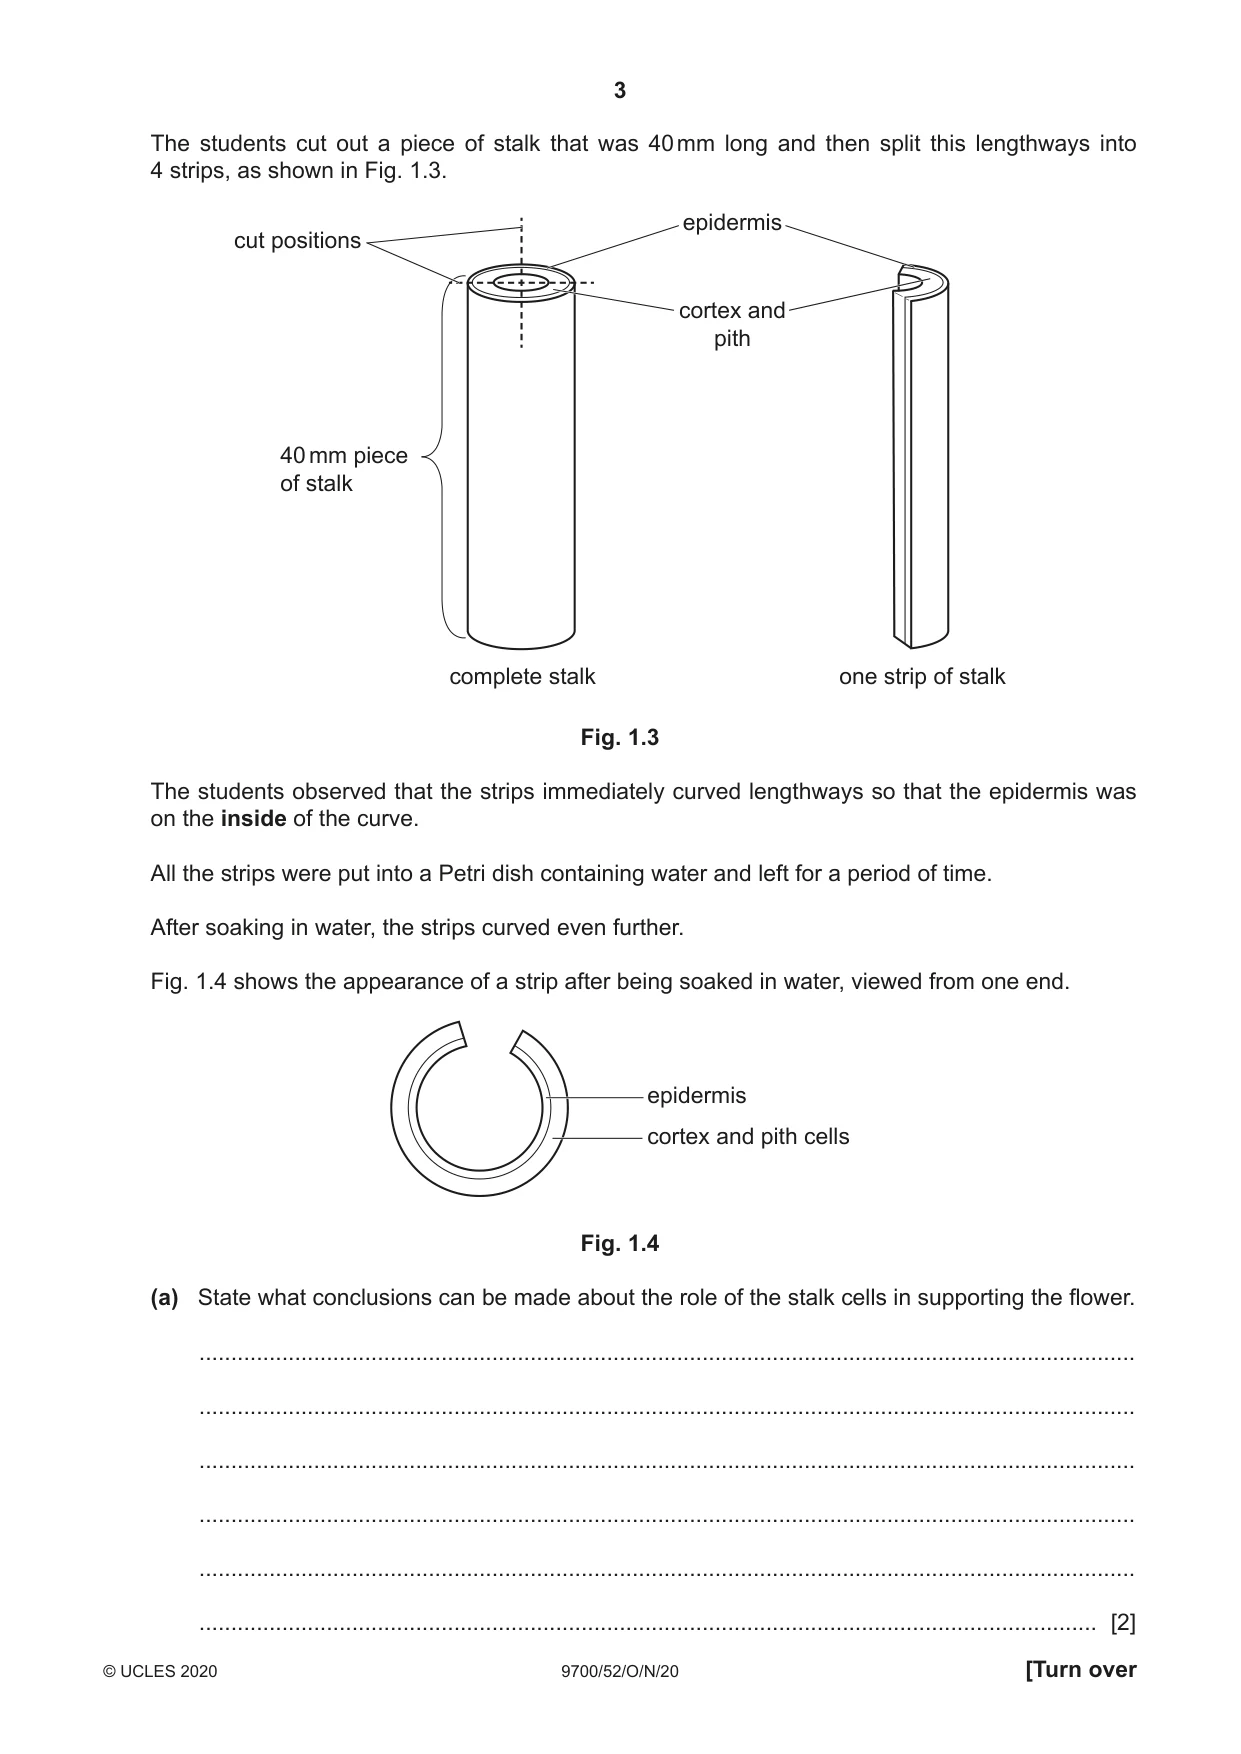
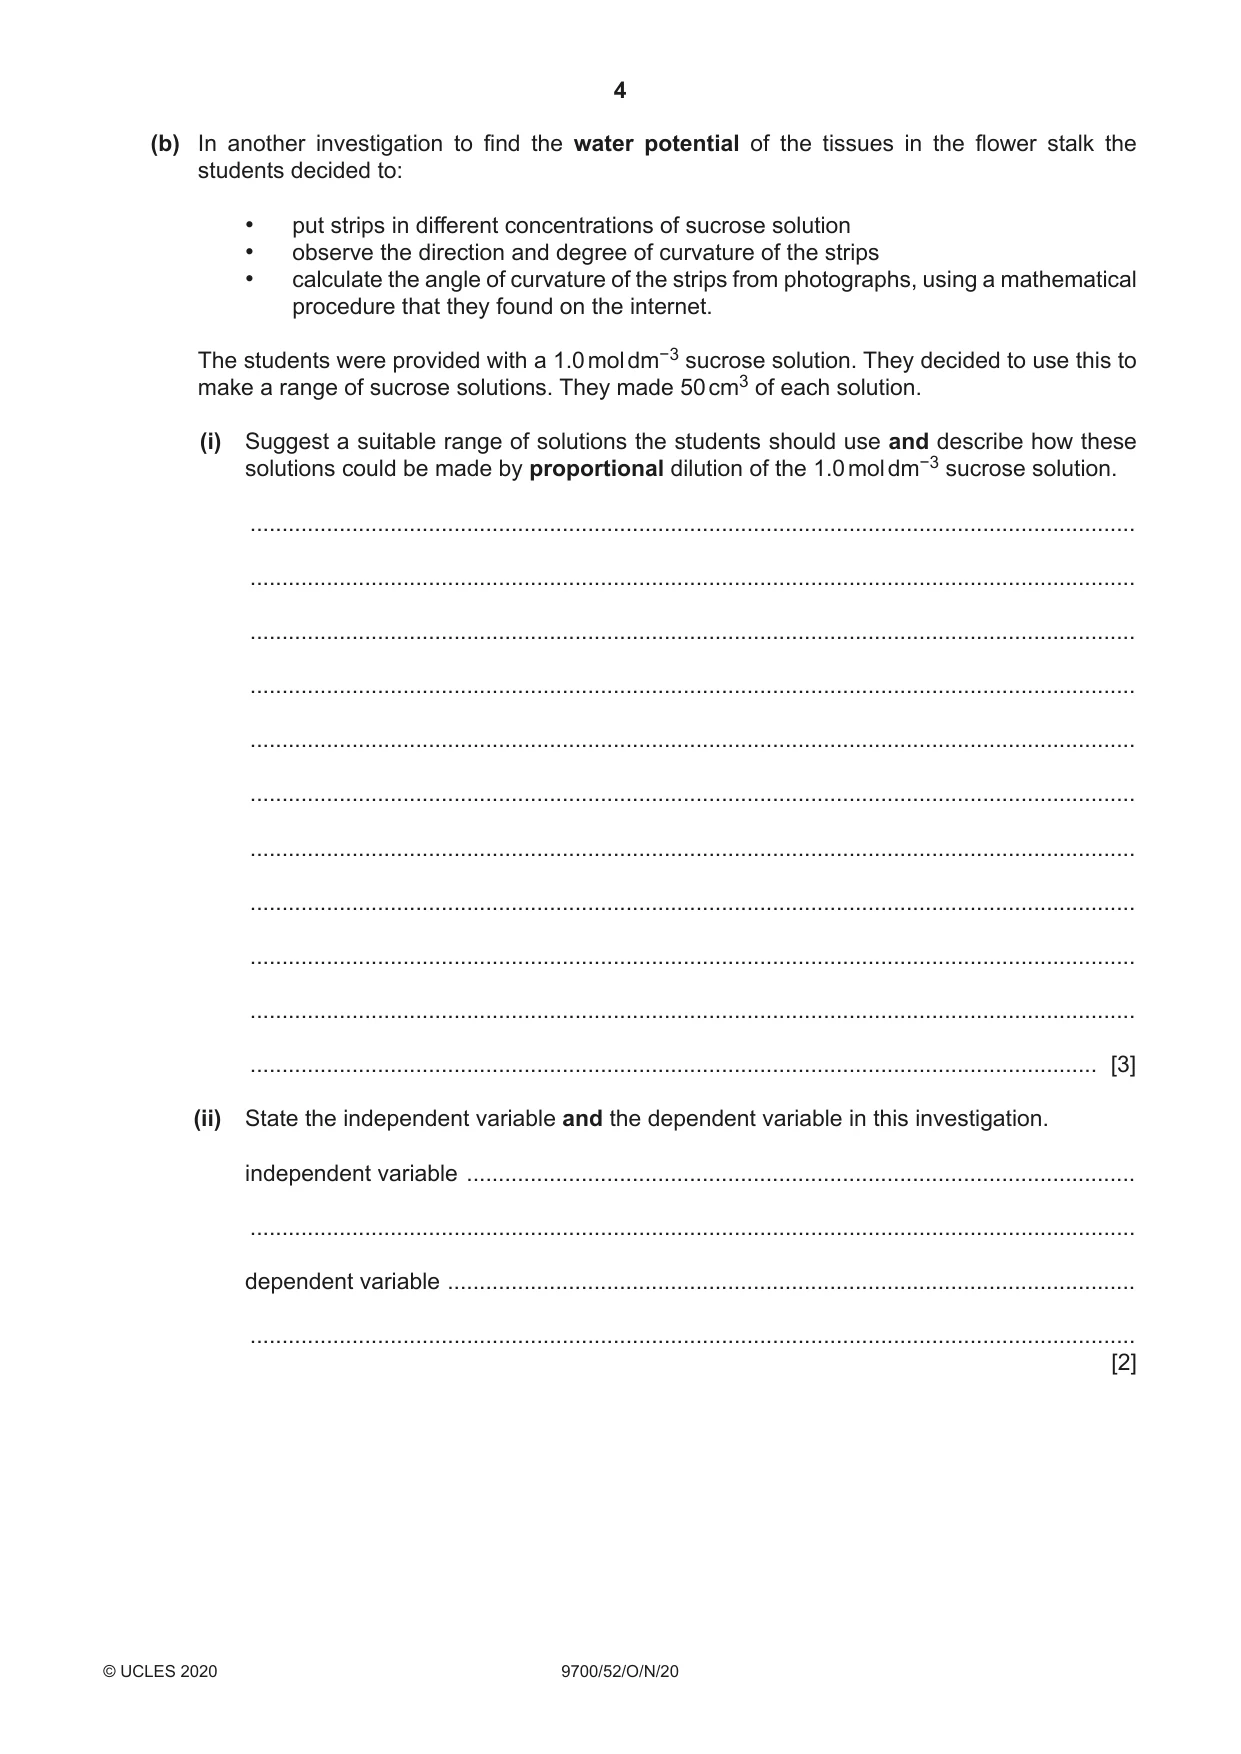
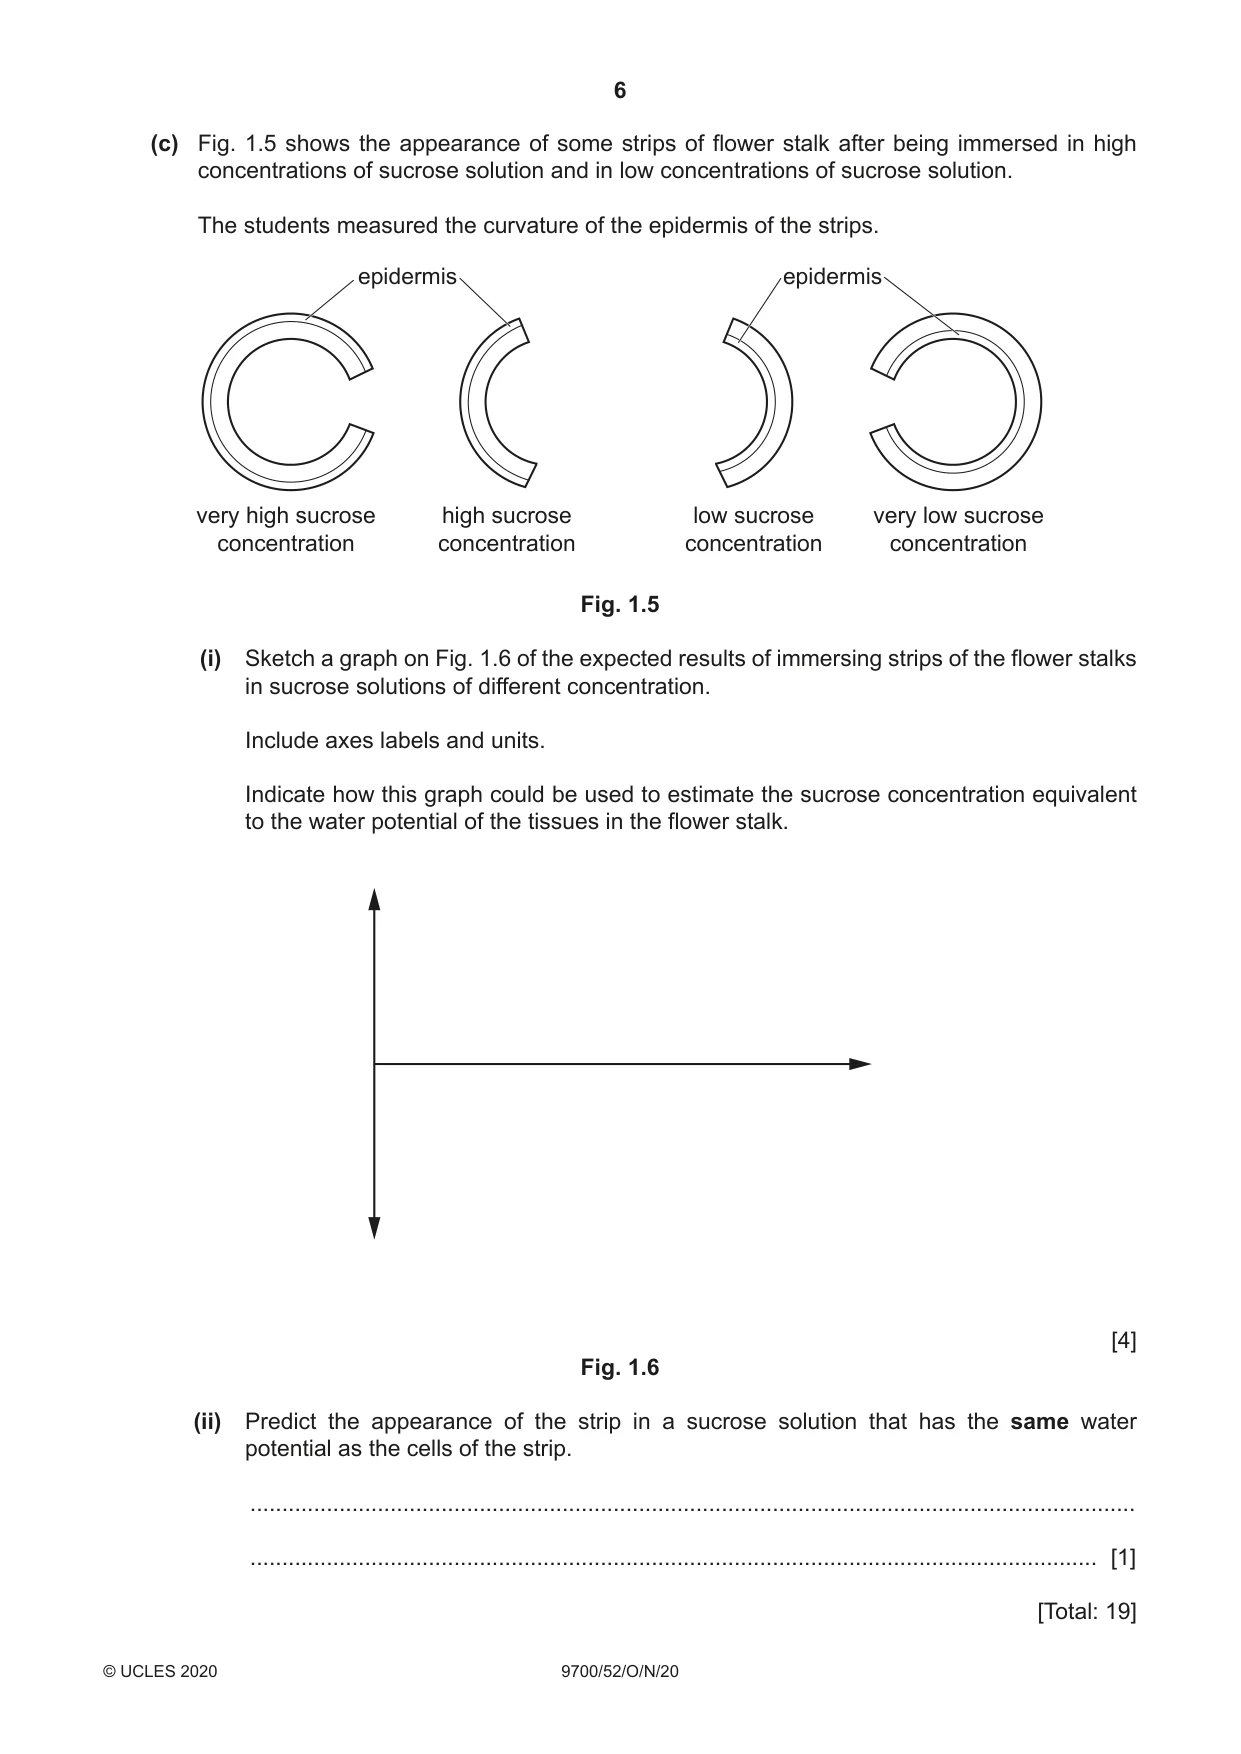
1 Some students observed a flowering plant and noticed that the flower was supported by a long stalk. To investigate how the stalk supported the flower, the students first cut transverse sections of the stalk. The students then used a light microscope to observe the transverse sections of the stalk. Fig. 1.1 shows a plan diagram of a transverse section of the stalk. thick waxy cuticle thin-walled pith cells vascular tissue in cortex epidermis hollow centre Fig. 1.1 Fig. 1.2 shows the appearance of two cells from each of the layers. epidermis with cortex pith thick waxy cuticle Fig. 1.2 The students cut out a piece of stalk that was 40 mm long and then split this lengthways into 4 strips, as shown in Fig. 1.3. epidermis cut positions cortex and pith 40 mm piece of stalk complete stalk one strip of stalk Fig. 1.3 The students observed that the strips immediately curved lengthways so that the epidermis was on the inside of the curve. All the strips were put into a Petri dish containing water and left for a period of time. After soaking in water, the strips curved even further. Fig. 1.4 shows the appearance of a strip after being soaked in water, viewed from one end. epidermis cortex and pith cells Fig. 1.4 (a) State what conclusions can be made about the role of the stalk cells in supporting the flower. ................................................................................................................................................... ................................................................................................................................................... ................................................................................................................................................... ................................................................................................................................................... ................................................................................................................................................... ............................................................................................................................................. [2] (b) In another investigation to find the water potential of the tissues in the flower stalk the students decided to: • put strips in different concentrations of sucrose solution • observe the direction and degree of curvature of the strips • calculate the angle of curvature of the strips from photographs, using a mathematical procedure that they found on the internet. The students were provided with a 1.0 mol dm−3 sucrose solution. They decided to use this to make a range of sucrose solutions. They made 50 cm3 of each solution. (i) Suggest a suitable range of solutions the students should use and describe how these solutions could be made by proportional dilution of the 1.0 mol dm−3 sucrose solution. ........................................................................................................................................... ........................................................................................................................................... ........................................................................................................................................... ........................................................................................................................................... ........................................................................................................................................... ........................................................................................................................................... ........................................................................................................................................... ........................................................................................................................................... ........................................................................................................................................... ........................................................................................................................................... ..................................................................................................................................... [3] (ii) State the independent variable and the dependent variable in this investigation. independent variable ......................................................................................................... ........................................................................................................................................... dependent variable ............................................................................................................ ........................................................................................................................................... [2] (iii) Using the different sucrose solutions from (b)(i), describe a method the students could use to collect the data needed to estimate the water potential of the tissues in the flower stalk. Do not include details of how to make the sucrose solutions. Your method should be set out in a logical order and be detailed enough to let another person follow it. ........................................................................................................................................... ........................................................................................................................................... ........................................................................................................................................... ........................................................................................................................................... ........................................................................................................................................... ........................................................................................................................................... ........................................................................................................................................... ........................................................................................................................................... ........................................................................................................................................... ........................................................................................................................................... ........................................................................................................................................... ........................................................................................................................................... ........................................................................................................................................... ........................................................................................................................................... ........................................................................................................................................... ........................................................................................................................................... ........................................................................................................................................... ........................................................................................................................................... ........................................................................................................................................... ........................................................................................................................................... ........................................................................................................................................... ........................................................................................................................................... ........................................................................................................................................... ..................................................................................................................................... [7] (c) Fig. 1.5 shows the appearance of some strips of flower stalk after being immersed in high concentrations of sucrose solution and in low concentrations of sucrose solution. The students measured the curvature of the epidermis of the strips. epidermis epidermis very high sucrose high sucrose low sucrose very low sucrose concentration concentration concentration concentration Fig. 1.5 (i) Sketch a graph on Fig. 1.6 of the expected results of immersing strips of the flower stalks in sucrose solutions of different concentration. Include axes labels and units. Indicate how this graph could be used to estimate the sucrose concentration equivalent to the water potential of the tissues in the flower stalk. [4] Fig. 1.6 (ii) Predict the appearance of the strip in a sucrose solution that has the same water potential as the cells of the strip. ........................................................................................................................................... ..................................................................................................................................... [1] [Total: 19]
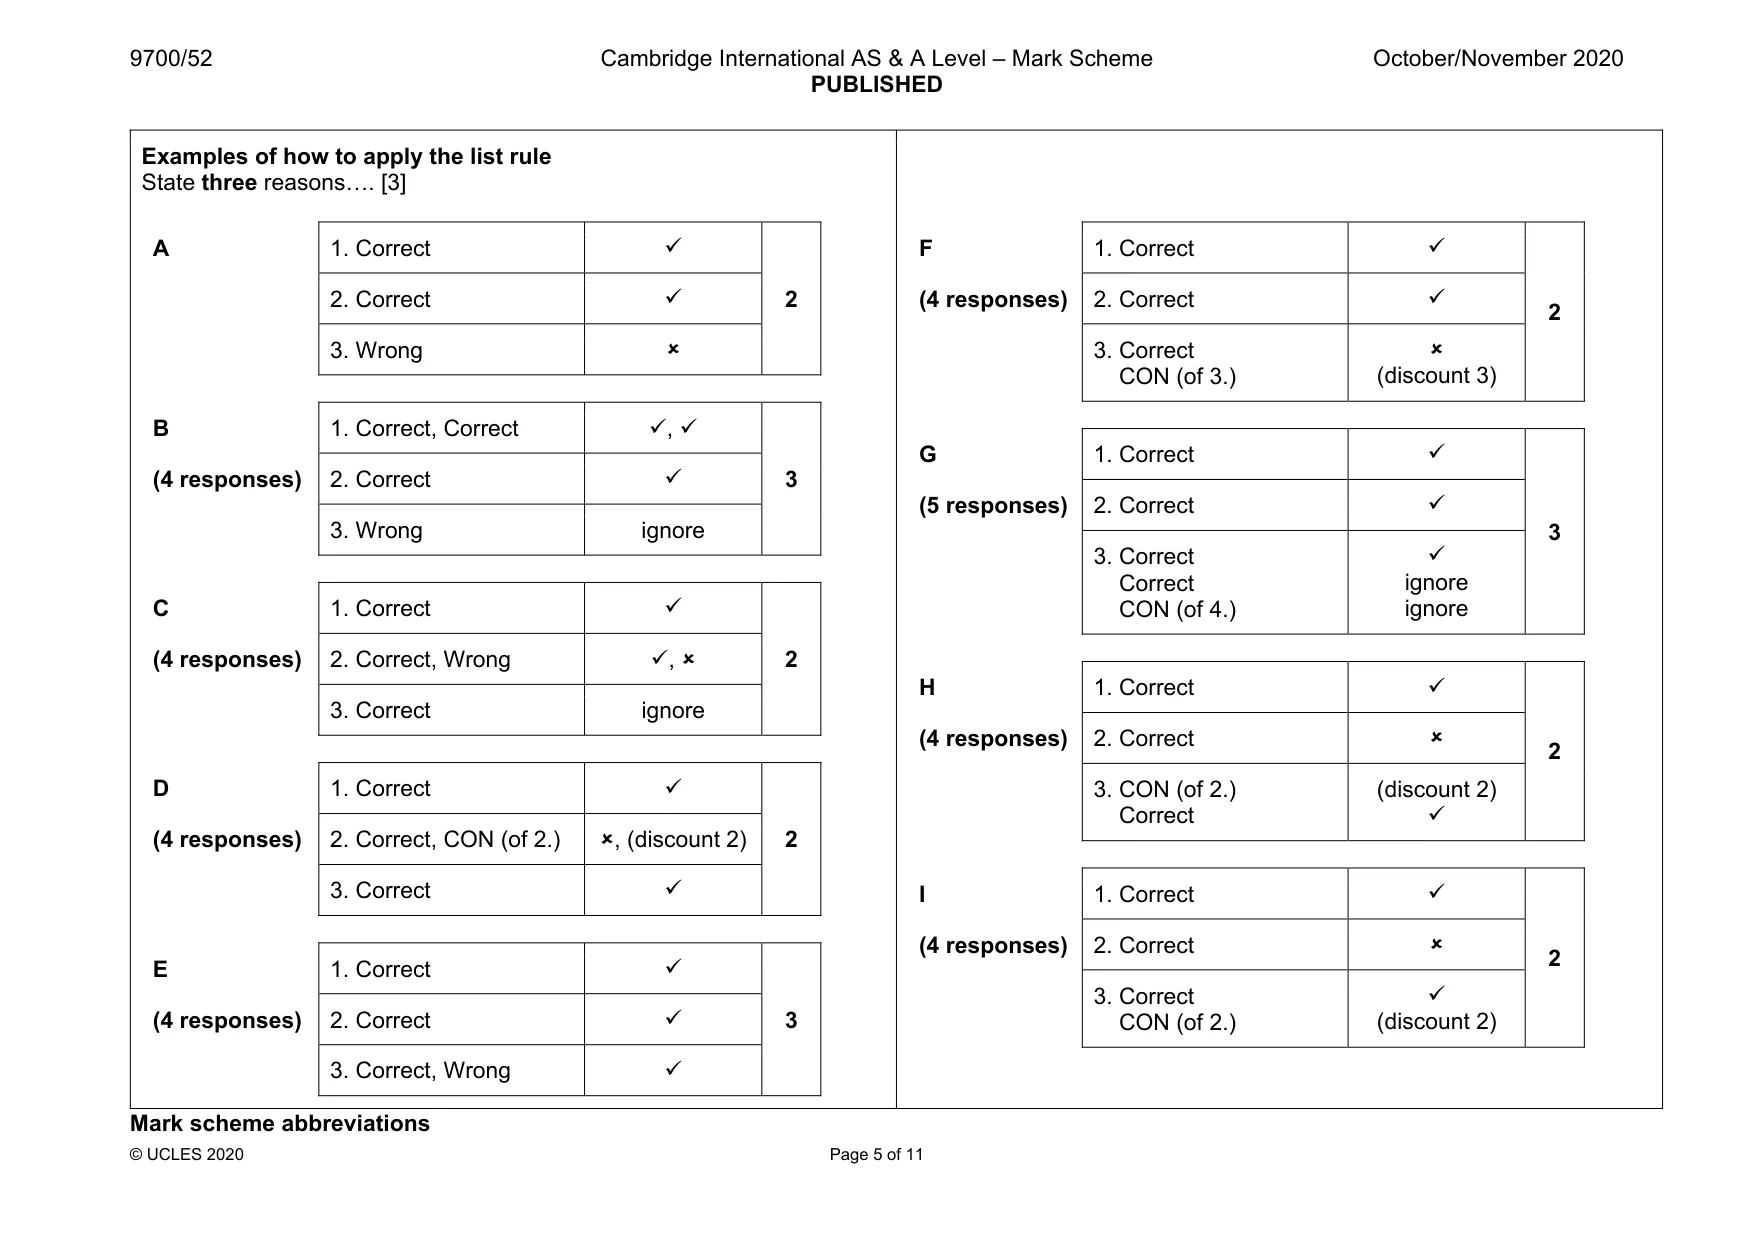
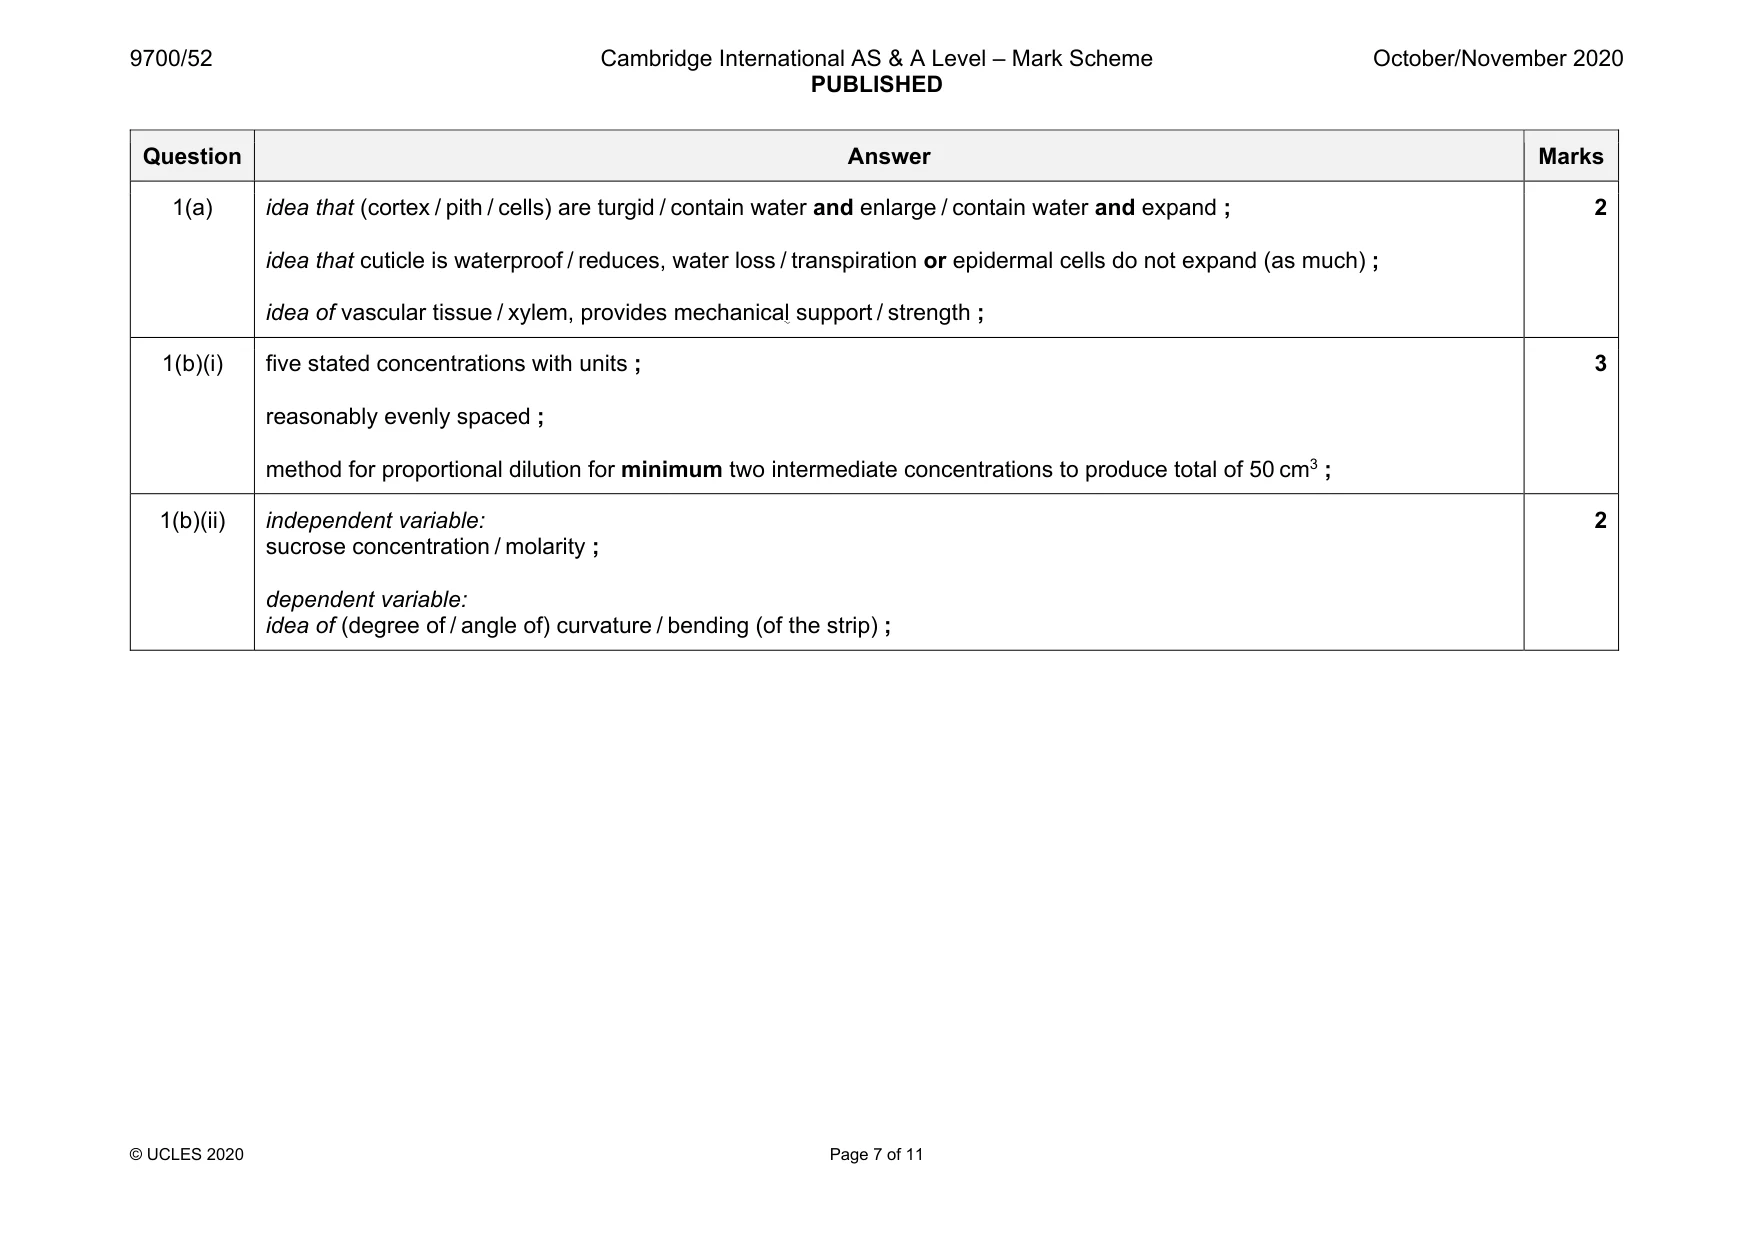
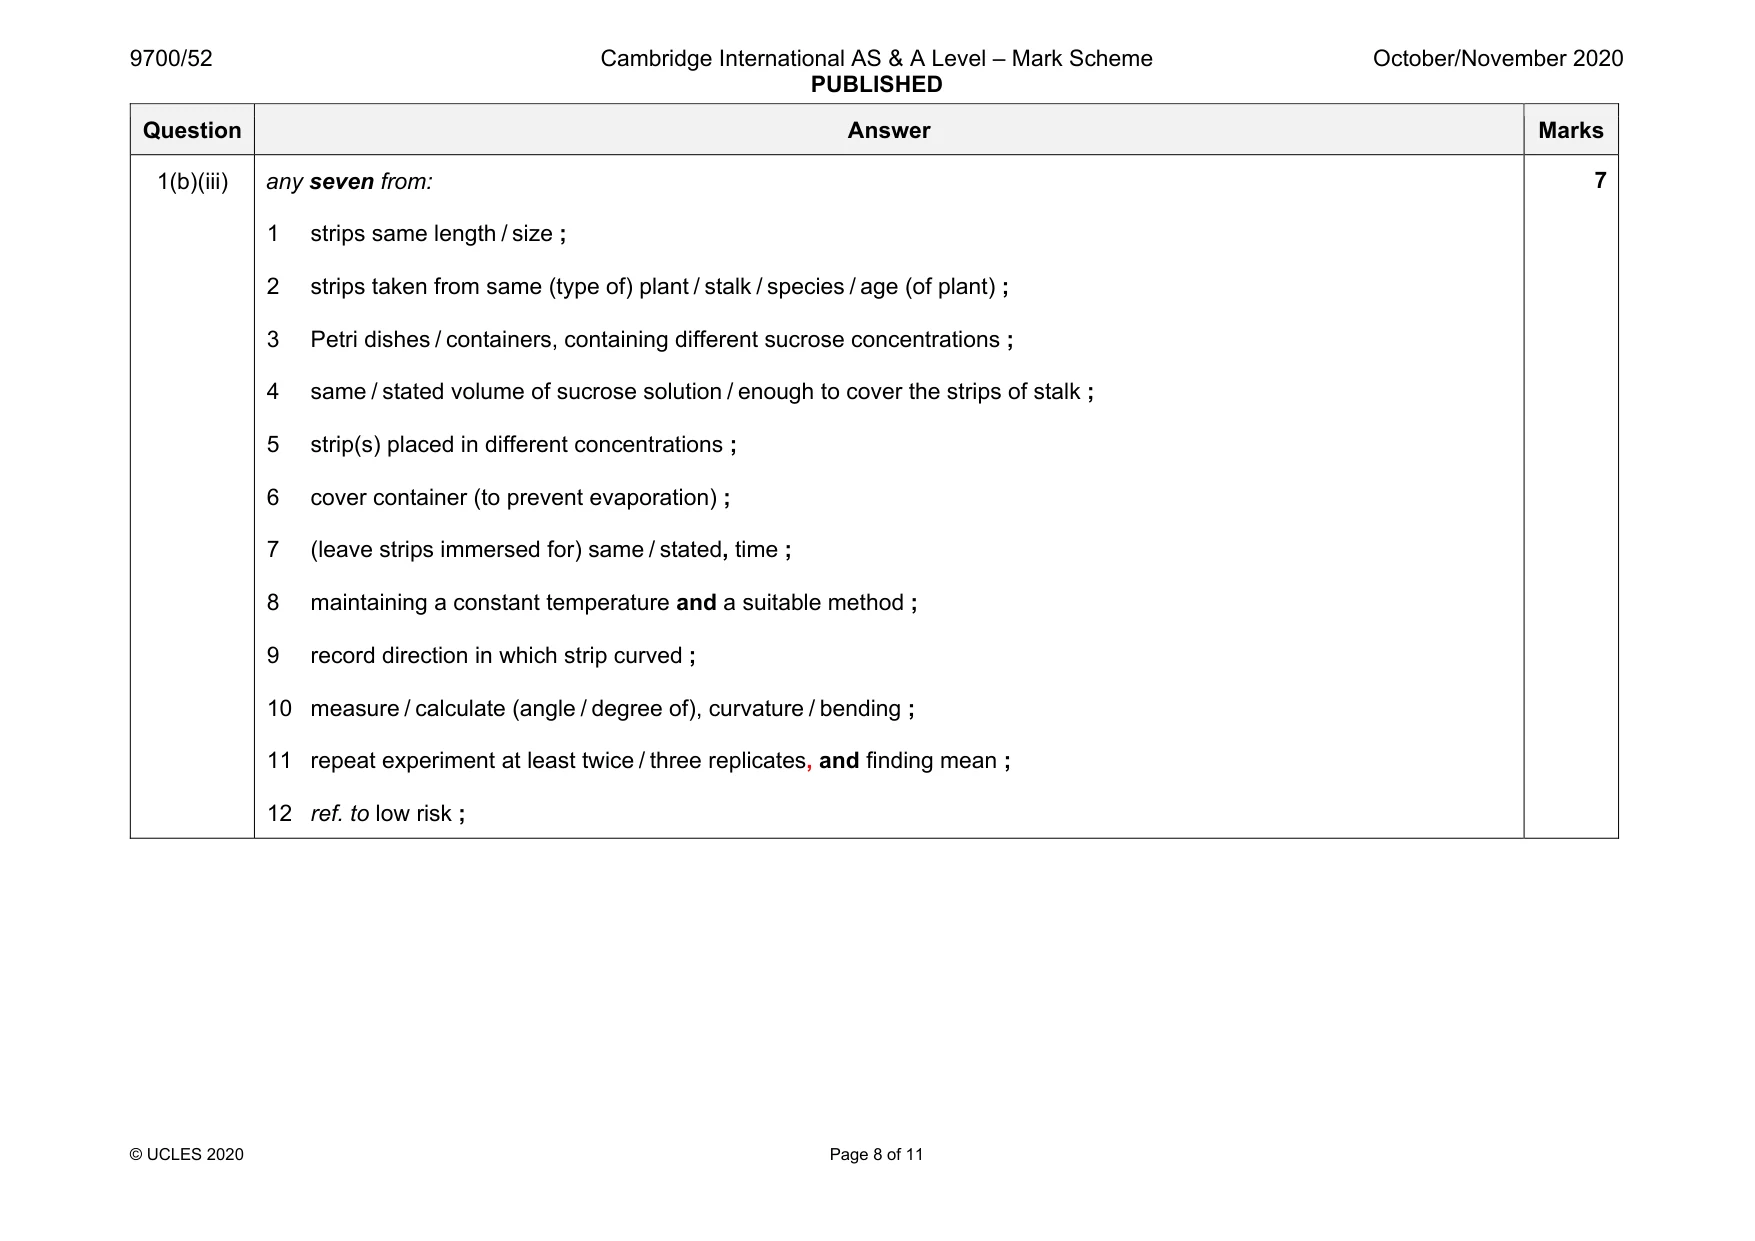
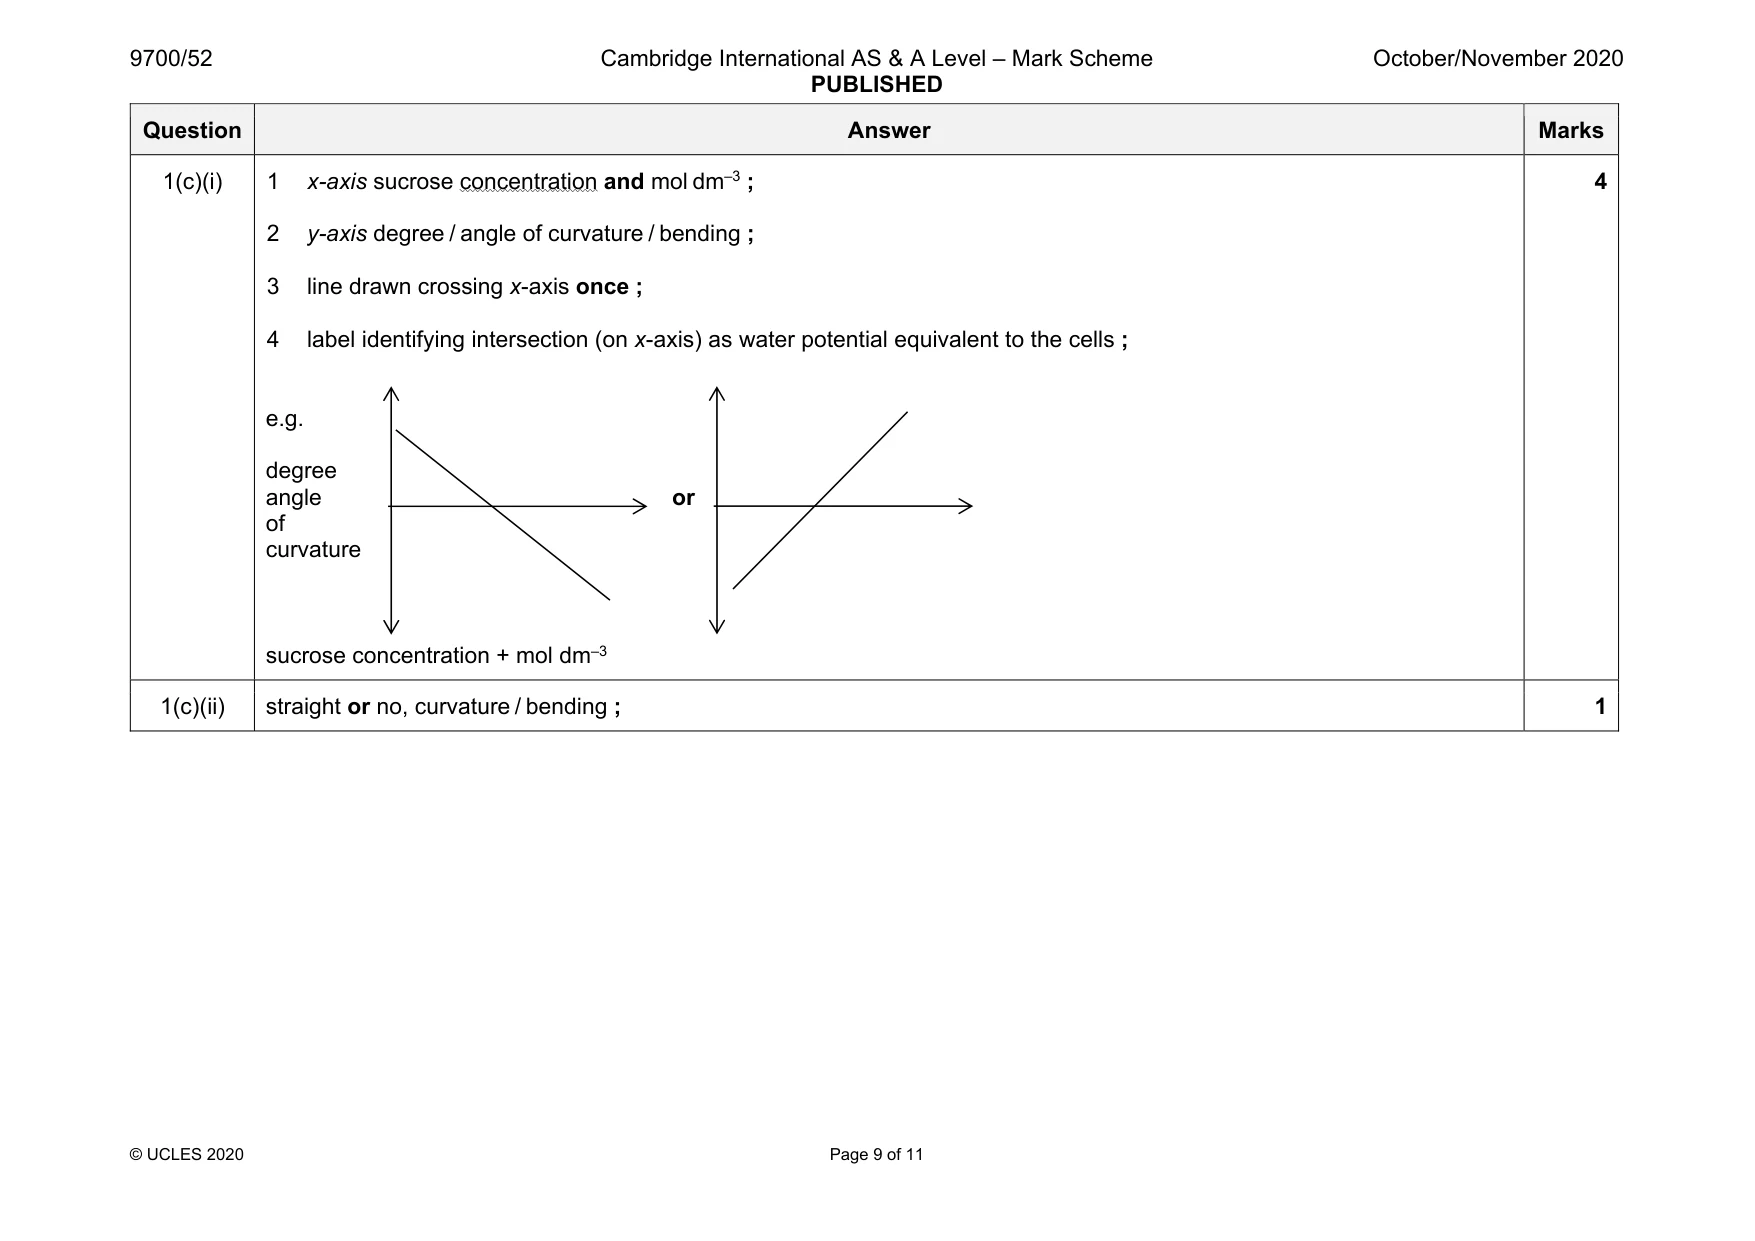
Mark scheme: 1(a) idea that (cortex / pith / cells) are turgid / contain water and enlarge / contain water and expand ; idea that cuticle is waterproof / reduces, water loss / transpiration or epidermal cells do not expand (as much) ; idea of vascular tissue / xylem, provides mechanical support / strength ; 2 1(b)(i) five stated concentrations with units ; reasonably evenly spaced ; method for proportional dilution for minimum two intermediate concentrations to produce total of 50 cm3 ; 3 1(b)(ii) independent variable: sucrose concentration / molarity ; dependent variable: idea of (degree of / angle of) curvature / bending (of the strip) ; 2 Question Answer Marks 1(b)(iii) any seven from: 1 strips same length / size ; 2 strips taken from same (type of) plant / stalk / species / age (of plant) ; 3 Petri dishes / containers, containing different sucrose concentrations ; 4 same / stated volume of sucrose solution / enough to cover the strips of stalk ; 5 strip(s) placed in different concentrations ; 6 cover container (to prevent evaporation) ; 7 (leave strips immersed for) same / stated, time ; 8 maintaining a constant temperature and a suitable method ; 9 record direction in which strip curved ; 10 measure / calculate (angle / degree of), curvature / bending ; 11 repeat experiment at least twice / three replicates, and finding mean ; 12 ref. to low risk ; 7 Question Answer Marks 1(c)(i) 1 x-axis sucrose concentration and mol dm–3 ; 2 y-axis degree / angle of curvature / bending ; 3 line drawn crossing x-axis once ; 4 label identifying intersection (on x-axis) as water potential equivalent to the cells ; e.g. degree angle or of curvature sucrose concentration + mol dm–3 4 1(c)(ii) straight or no, curvature / bending ; 1
Q2 · Water hyacinth, Eichhornia crassipes, is a plant that grows on the surface of waterways…
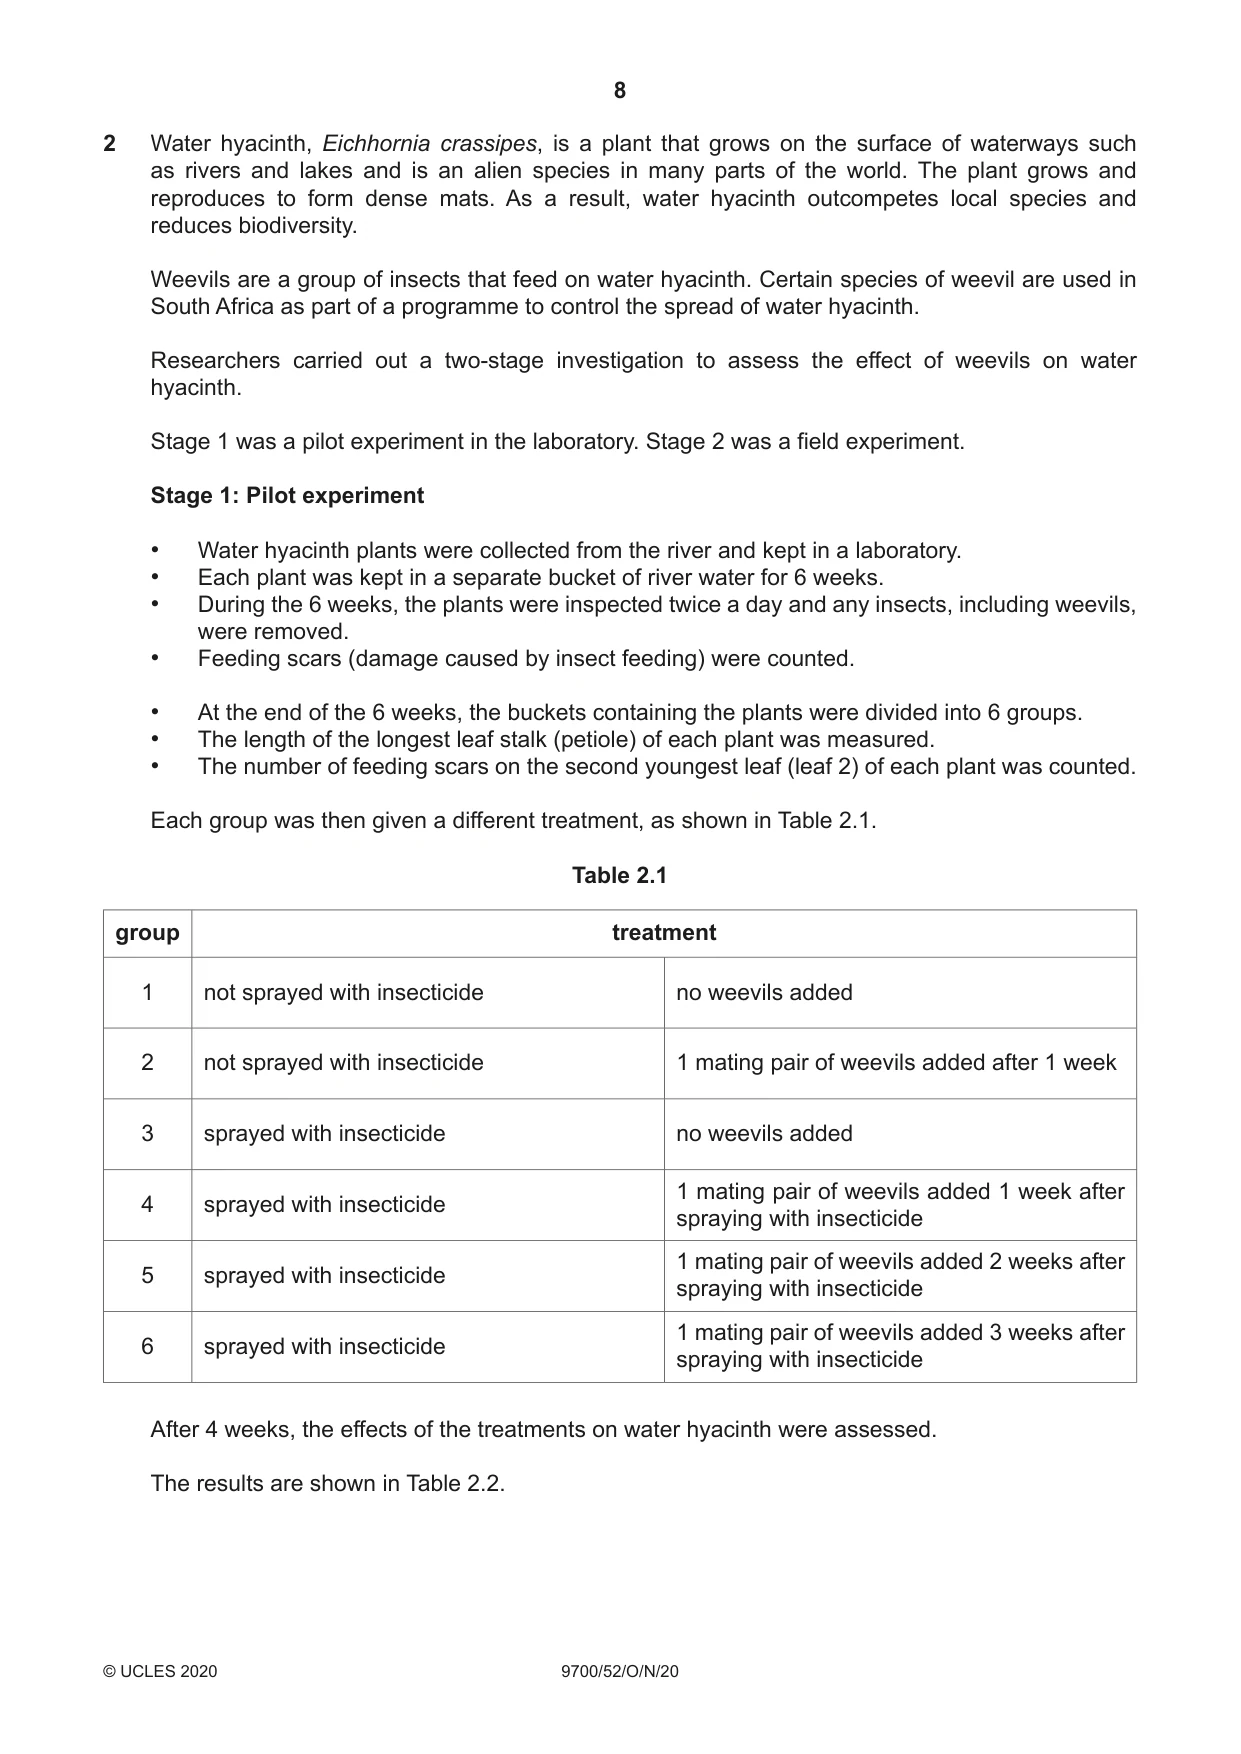
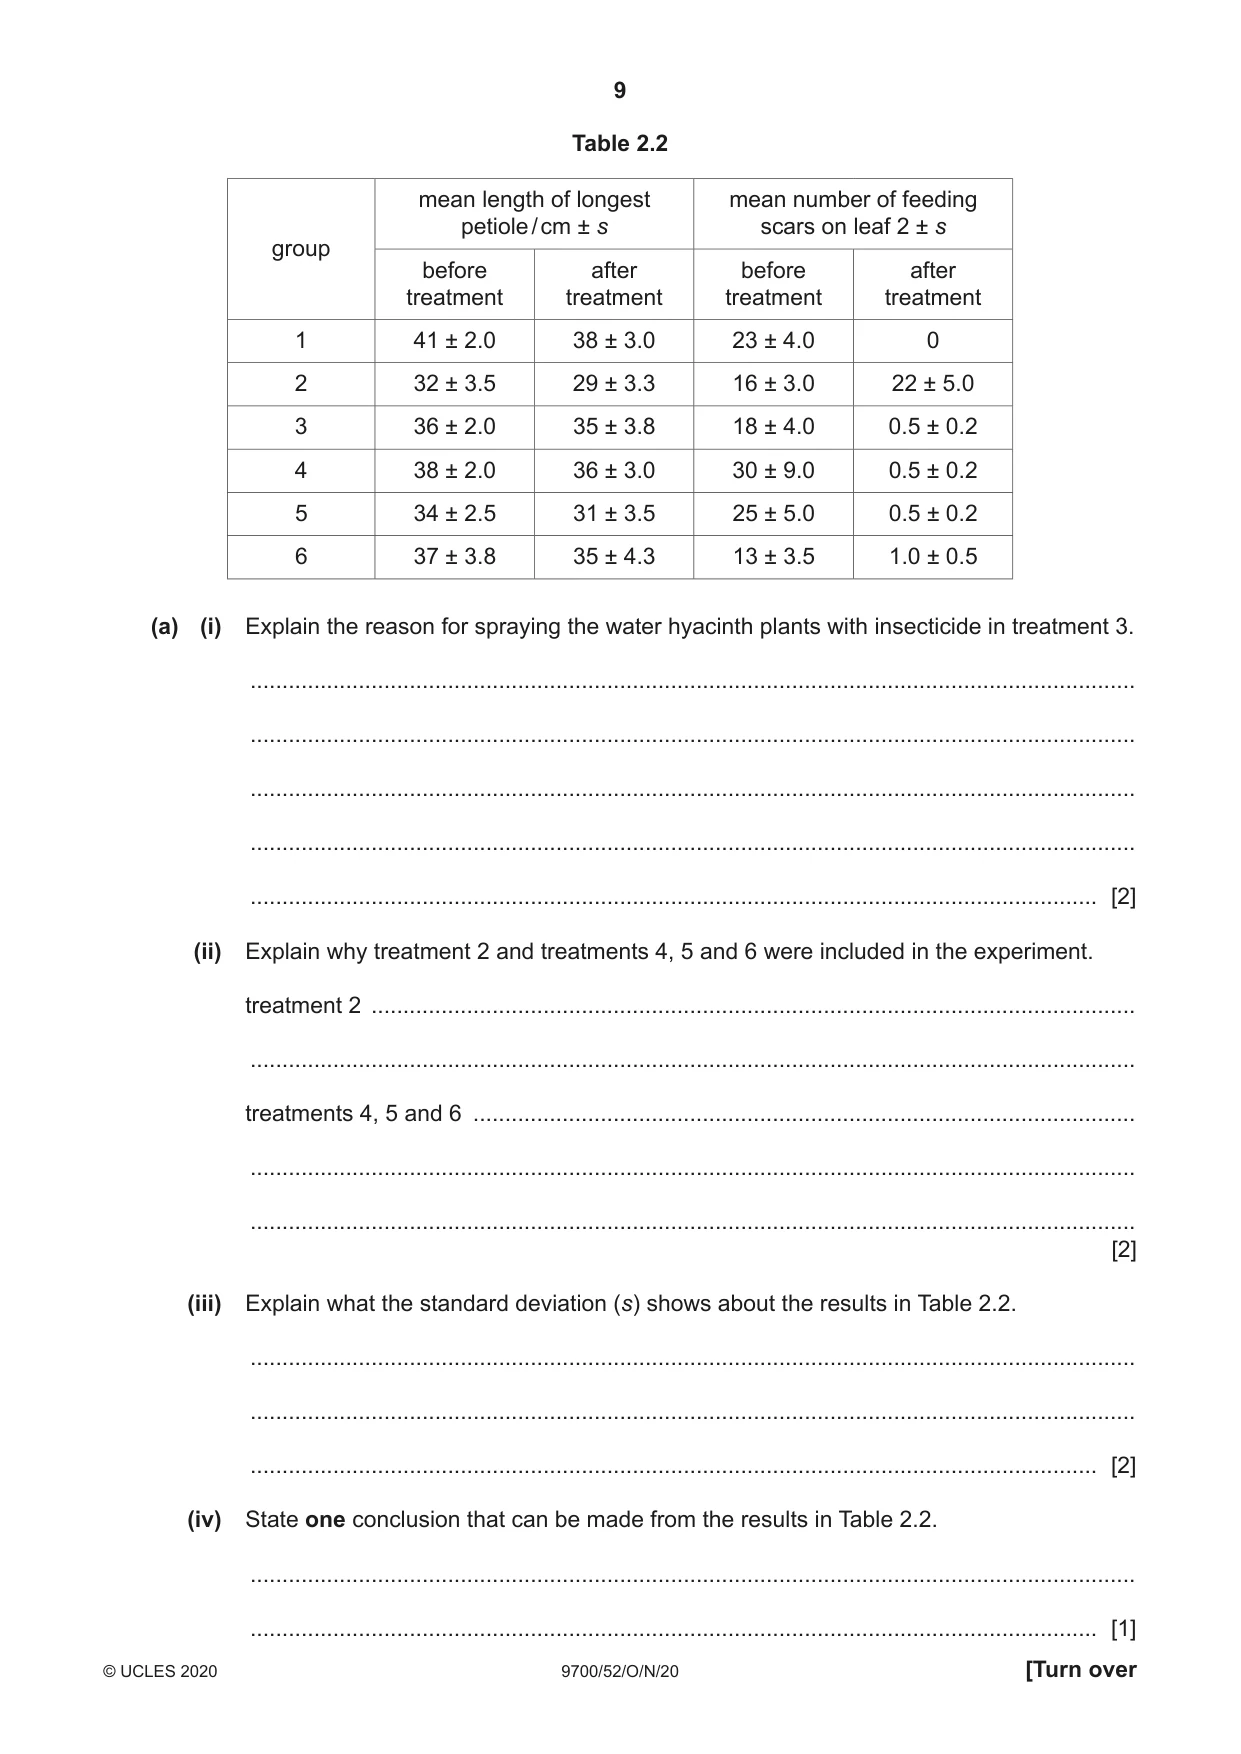
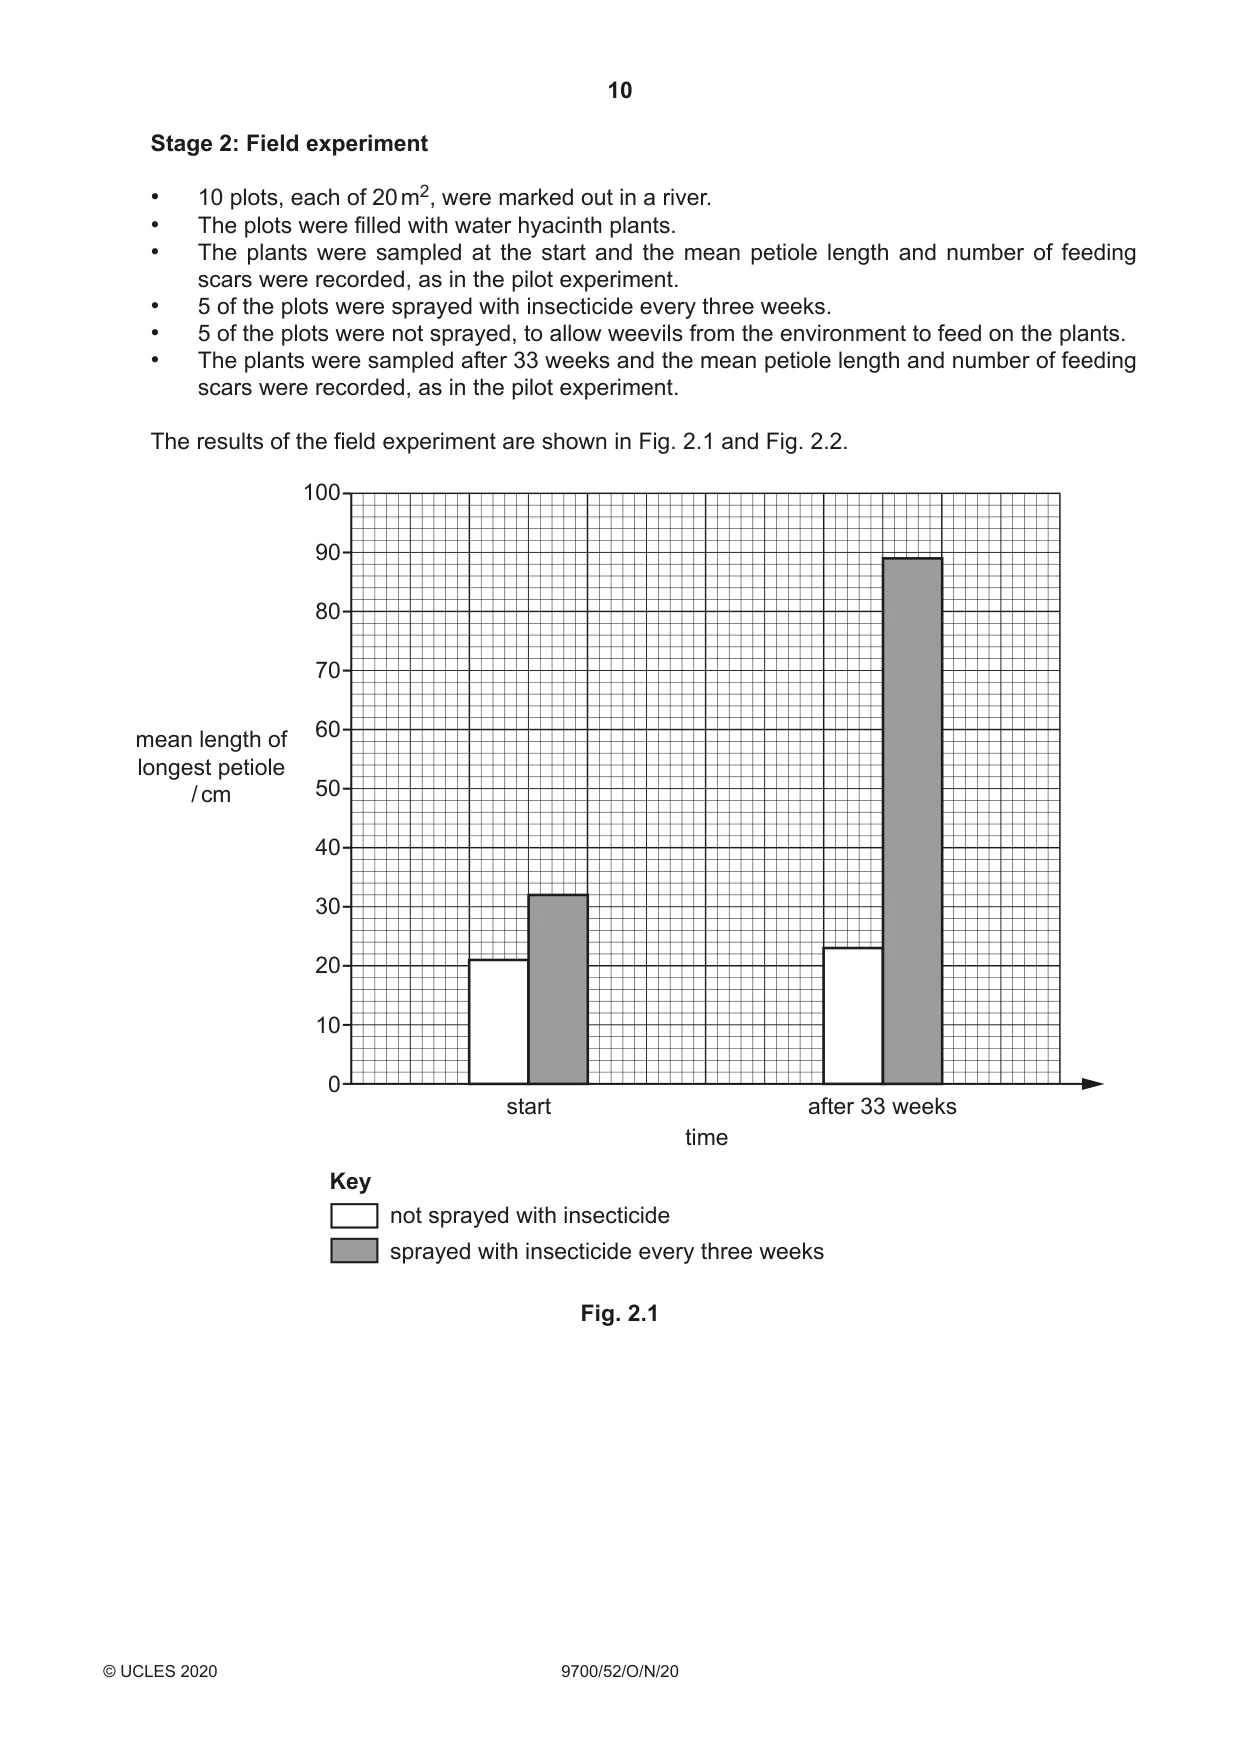
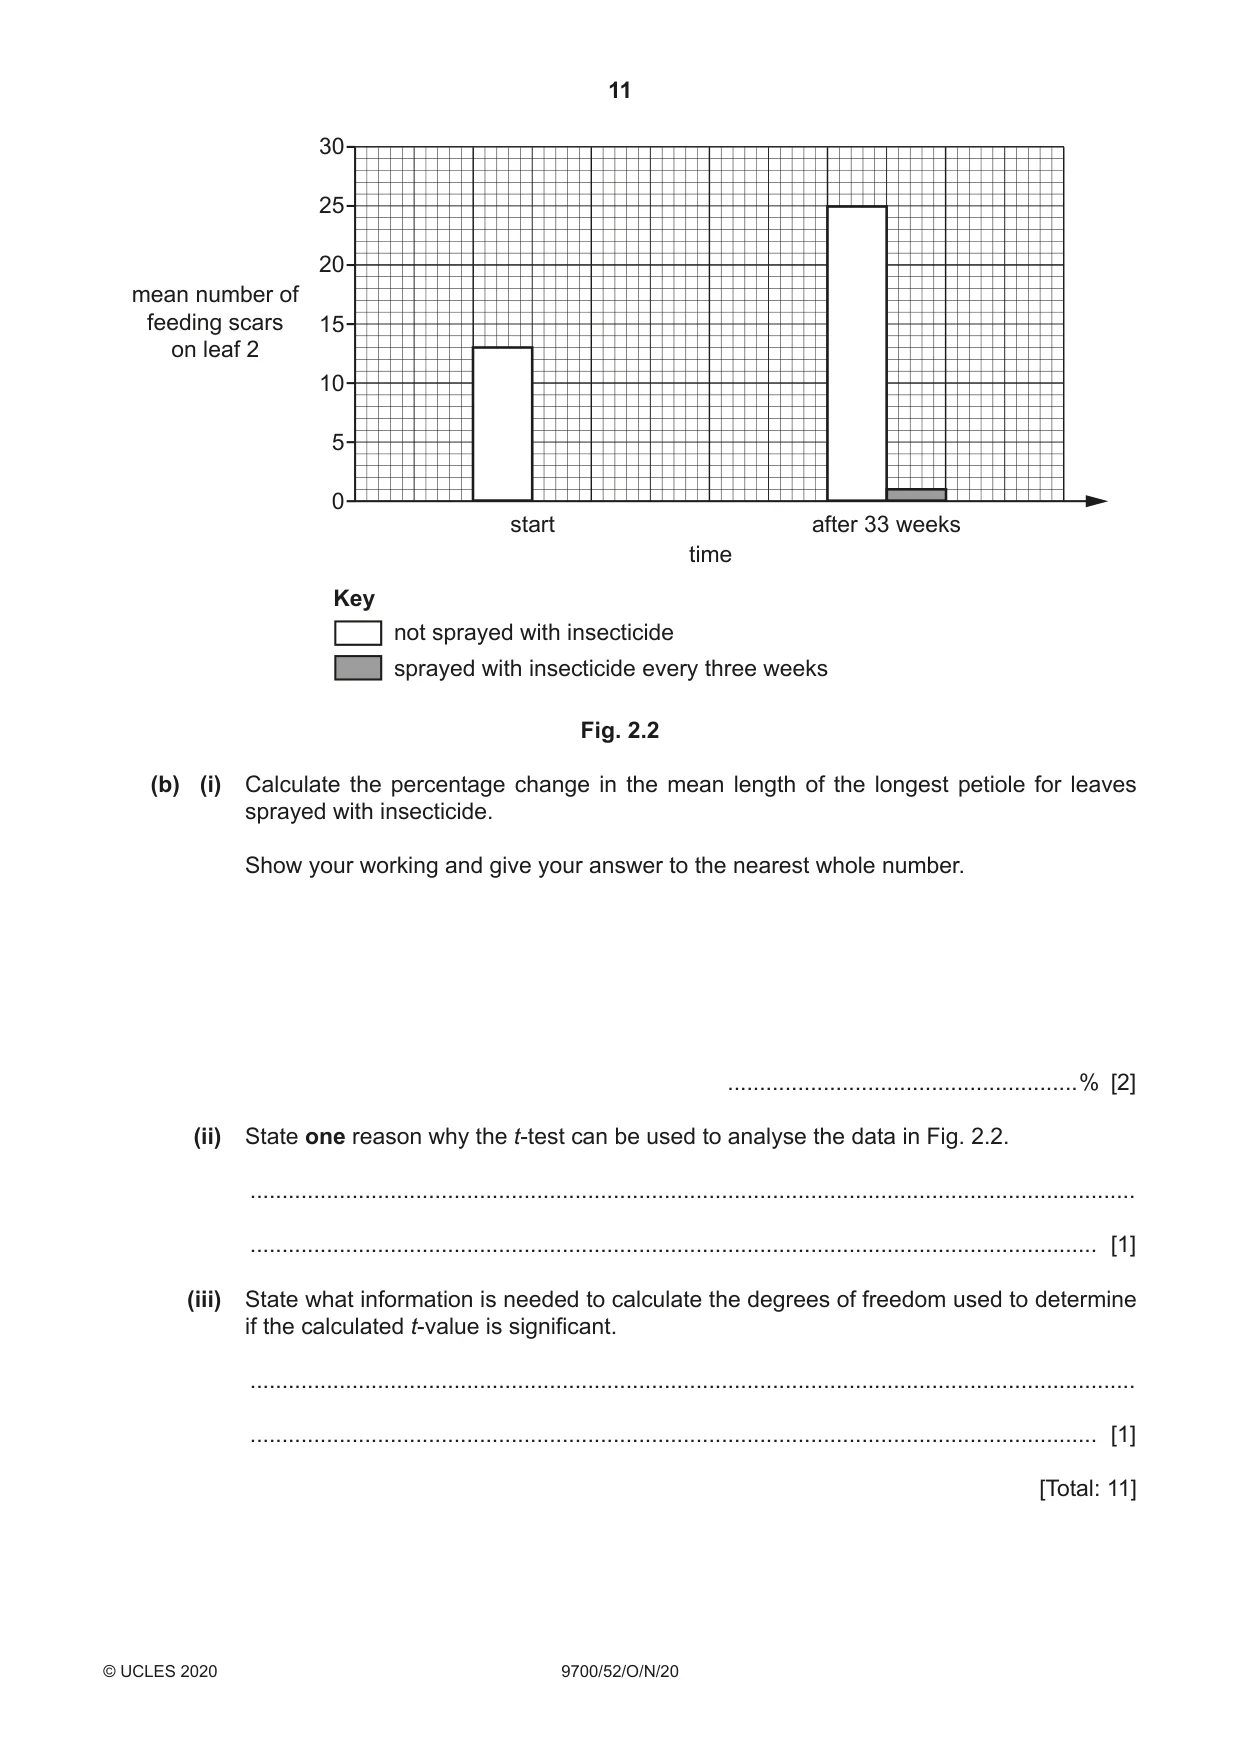
2 Water hyacinth, Eichhornia crassipes, is a plant that grows on the surface of waterways such as rivers and lakes and is an alien species in many parts of the world. The plant grows and reproduces to form dense mats. As a result, water hyacinth outcompetes local species and reduces biodiversity. Weevils are a group of insects that feed on water hyacinth. Certain species of weevil are used in South Africa as part of a programme to control the spread of water hyacinth. Researchers carried out a two-stage investigation to assess the effect of weevils on water hyacinth. Stage 1 was a pilot experiment in the laboratory. Stage 2 was a field experiment. Stage 1: Pilot experiment • Water hyacinth plants were collected from the river and kept in a laboratory. • Each plant was kept in a separate bucket of river water for 6 weeks. • During the 6 weeks, the plants were inspected twice a day and any insects, including weevils, were removed. • Feeding scars (damage caused by insect feeding) were counted. • At the end of the 6 weeks, the buckets containing the plants were divided into 6 groups. • The length of the longest leaf stalk (petiole) of each plant was measured. • The number of feeding scars on the second youngest leaf (leaf 2) of each plant was counted. Each group was then given a different treatment, as shown in Table 2.1. Table 2.1 group treatment 1 not sprayed with insecticide no weevils added 2 not sprayed with insecticide 1 mating pair of weevils added after 1 week 3 sprayed with insecticide no weevils added 1 mating pair of weevils added 1 week after 4 sprayed with insecticide spraying with insecticide 1 mating pair of weevils added 2 weeks after 5 sprayed with insecticide spraying with insecticide 1 mating pair of weevils added 3 weeks after 6 sprayed with insecticide spraying with insecticide After 4 weeks, the effects of the treatments on water hyacinth were assessed. The results are shown in Table 2.2. Table 2.2 mean length of longest mean number of feeding petiole / cm ± s scars on leaf 2 ± s group before after before after treatment treatment treatment treatment 1 41 ± 2.0 38 ± 3.0 23 ± 4.0 0 2 32 ± 3.5 29 ± 3.3 16 ± 3.0 22 ± 5.0 3 36 ± 2.0 35 ± 3.8 18 ± 4.0 0.5 ± 0.2 4 38 ± 2.0 36 ± 3.0 30 ± 9.0 0.5 ± 0.2 5 34 ± 2.5 31 ± 3.5 25 ± 5.0 0.5 ± 0.2 6 37 ± 3.8 35 ± 4.3 13 ± 3.5 1.0 ± 0.5 (a) (i) Explain the reason for spraying the water hyacinth plants with insecticide in treatment 3. ........................................................................................................................................... ........................................................................................................................................... ........................................................................................................................................... ........................................................................................................................................... ..................................................................................................................................... [2] (ii) Explain why treatment 2 and treatments 4, 5 and 6 were included in the experiment. treatment 2 ........................................................................................................................ ........................................................................................................................................... treatments 4, 5 and 6 ........................................................................................................ ........................................................................................................................................... ........................................................................................................................................... [2] (iii) Explain what the standard deviation (s) shows about the results in Table 2.2. ........................................................................................................................................... ........................................................................................................................................... ..................................................................................................................................... [2] (iv) State one conclusion that can be made from the results in Table 2.2. ........................................................................................................................................... ..................................................................................................................................... [1] Stage 2: Field experiment • 10 plots, each of 20 m2, were marked out in a river. • The plots were filled with water hyacinth plants. • The plants were sampled at the start and the mean petiole length and number of feeding scars were recorded, as in the pilot experiment. • 5 of the plots were sprayed with insecticide every three weeks. • 5 of the plots were not sprayed, to allow weevils from the environment to feed on the plants. • The plants were sampled after 33 weeks and the mean petiole length and number of feeding scars were recorded, as in the pilot experiment. The results of the field experiment are shown in Fig. 2.1 and Fig. 2.2. 100 90 80 70 60mean length of longest petiole / cm 50 40 30 20 10 0 start after 33 weeks time Key not sprayed with insecticide sprayed with insecticide every three weeks Fig. 2.1
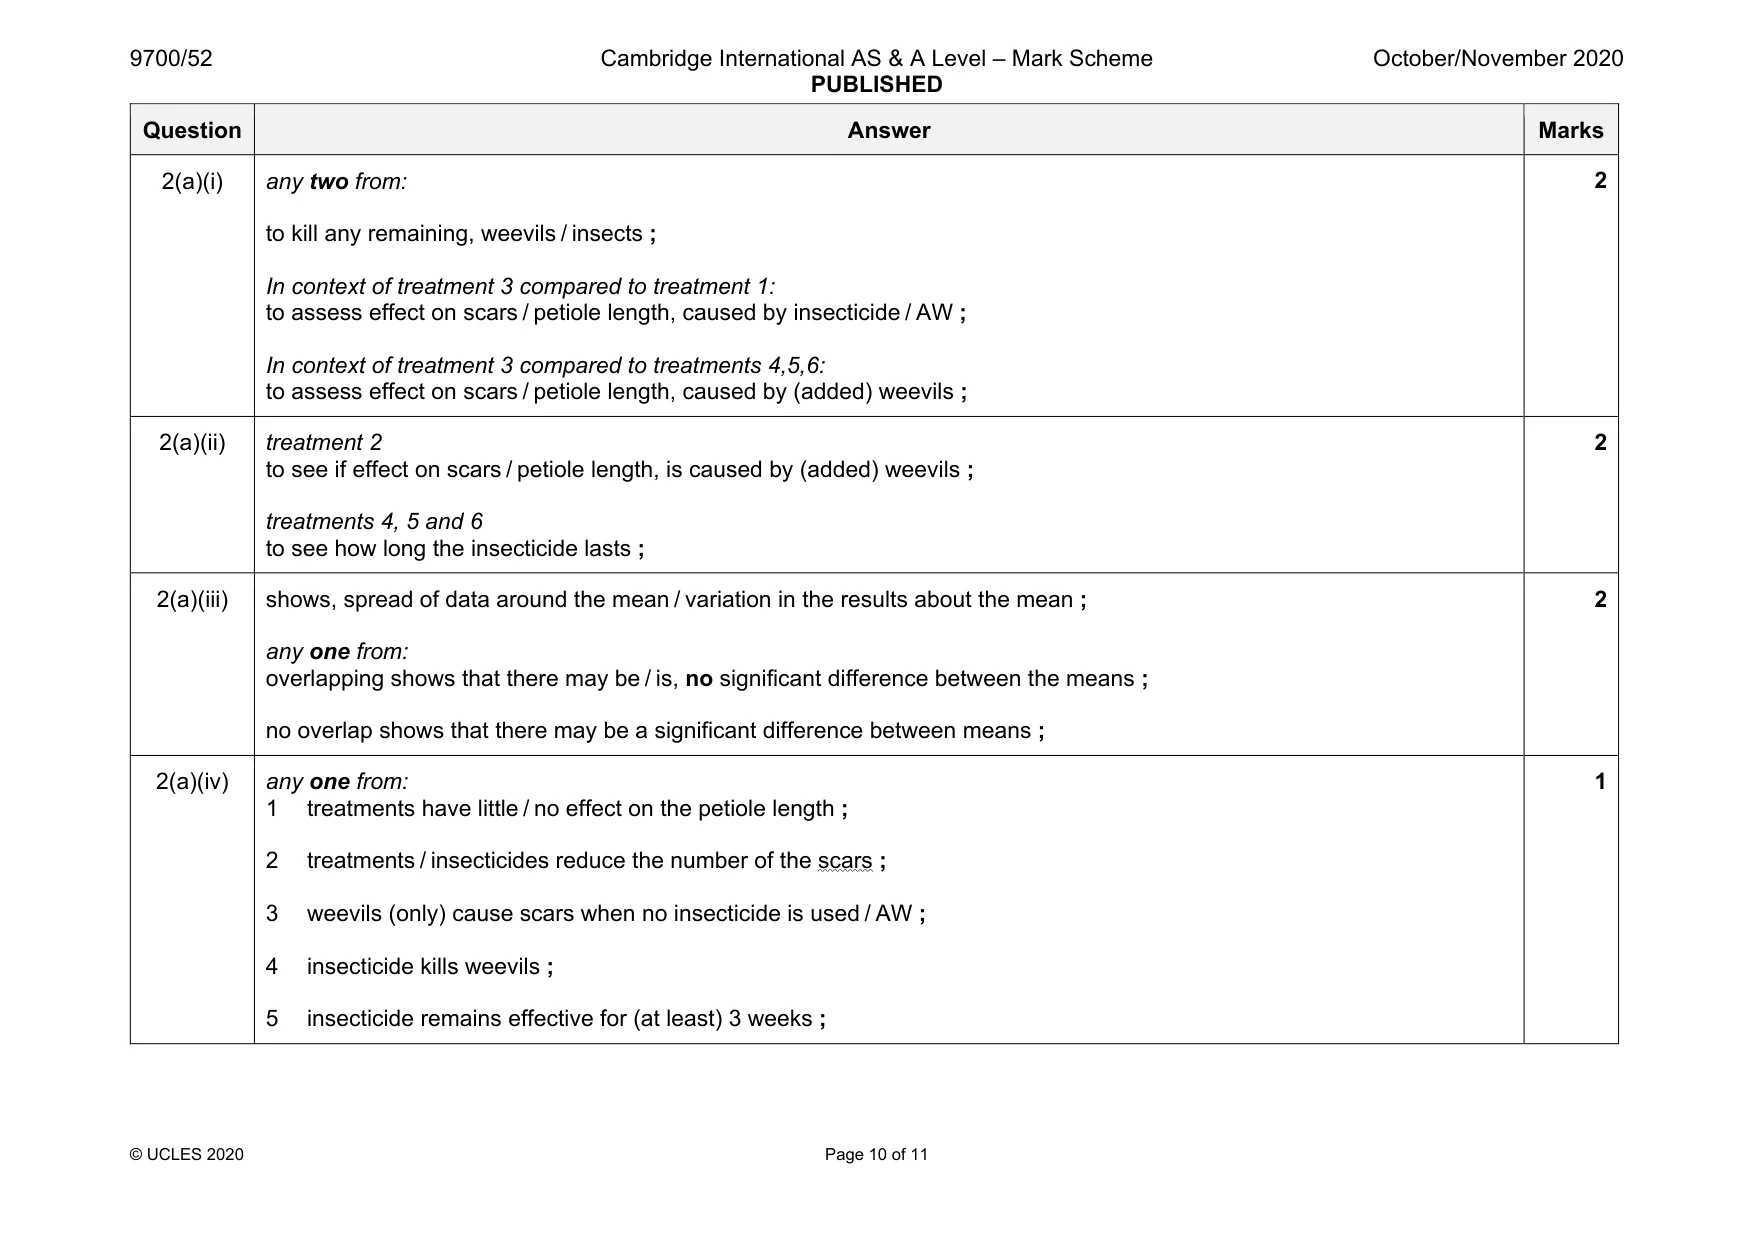
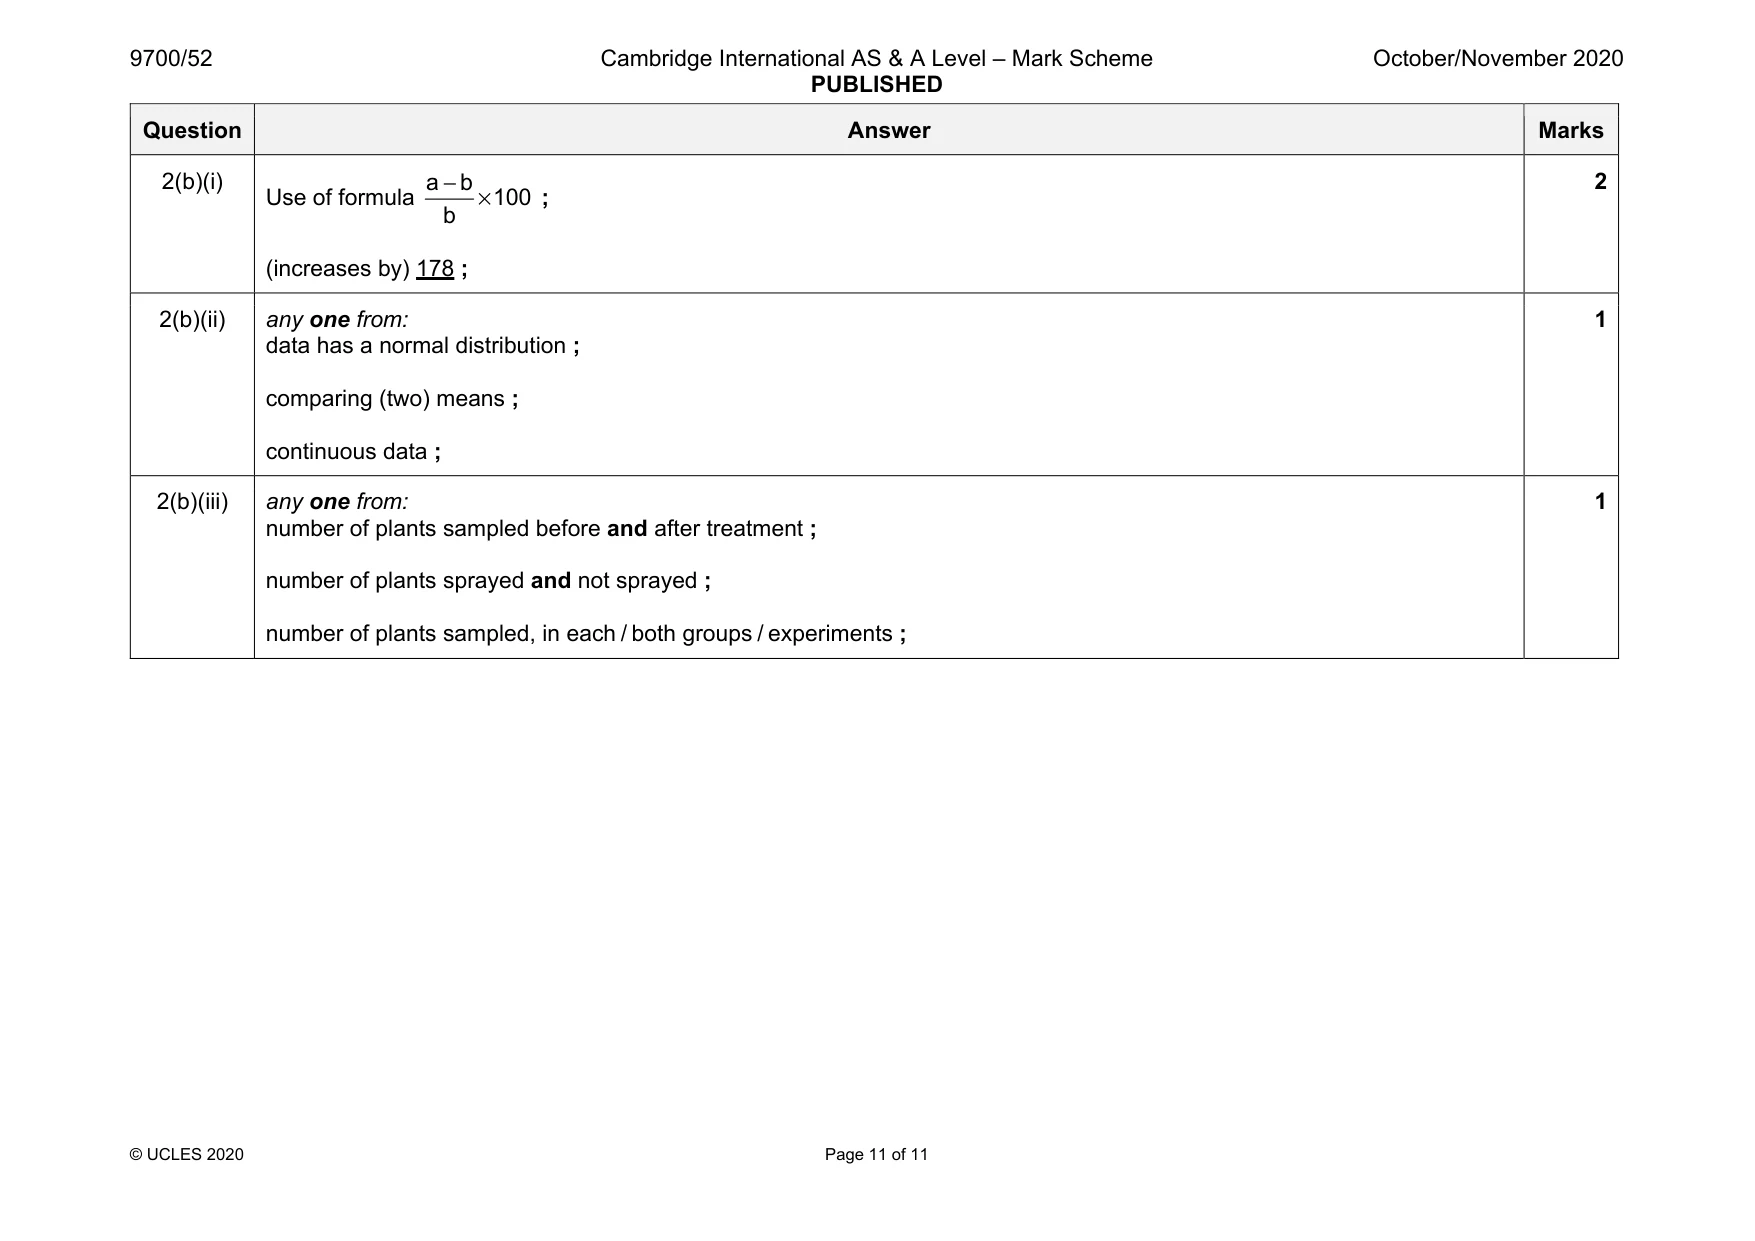
Mark scheme: 2(a)(i) any two from: to kill any remaining, weevils / insects ; In context of treatment 3 compared to treatment 1: to assess effect on scars / petiole length, caused by insecticide / AW ; In context of treatment 3 compared to treatments 4,5,6: to assess effect on scars / petiole length, caused by (added) weevils ; 2(a)(ii) treatment 2 to see if effect on scars / petiole length, is caused by (added) weevils ; treatments 4, 5 and 6 to see how long the insecticide lasts ; 2 2(a)(iii) shows, spread of data around the mean / variation in the results about the mean ; any one from: overlapping shows that there may be / is, no significant difference between the means ; no overlap shows that there may be a significant difference between means ; 2 2(a)(iv) any one from: 1 treatments have little / no effect on the petiole length ; 2 treatments / insecticides reduce the number of the scars ; 3 weevils (only) cause scars when no insecticide is used / AW ; 4 insecticide kills weevils ; 5 insecticide remains effective for (at least) 3 weeks ; 1 Question Answer Marks 2(b)(i) Use of formula a b 100 b − × ; (increases by) 178 ; 2 2(b)(ii) any one from: data has a normal distribution ; comparing (two) means ; continuous data ; 1 2(b)(iii) any one from: number of plants sampled before and after treatment ; number of plants sprayed and not sprayed ; number of plants sampled, in each / both groups / experiments ; 1
What was in this paper
The subtopics covered by these 2 questions, and how many questions each got. Open one in a new tab to see every Cambridge question on it.
What you needed in this session
Cambridge’s own grade thresholds for 2020 Oct/Nov, Paper 5 · Variant 2. A higher threshold means an easier paper — the bar moves with how the cohort did.