Cambridge A Level Biology 9700 — 2020 Oct/Nov Paper 5 · Variant 3
9700/53/O/N/20 · 2 questions · 30 marks · ≈34 min
The question paper and its mark scheme, free to read here and free to download. This is Cambridge’s own paper, exactly as it was sat.
Question paper12 pages


Mark scheme11 pages
Answers below. Sit the paper first if you are practising.
Questions as text
Q1 · Two methods of estimating the water potential of plant tissue are described
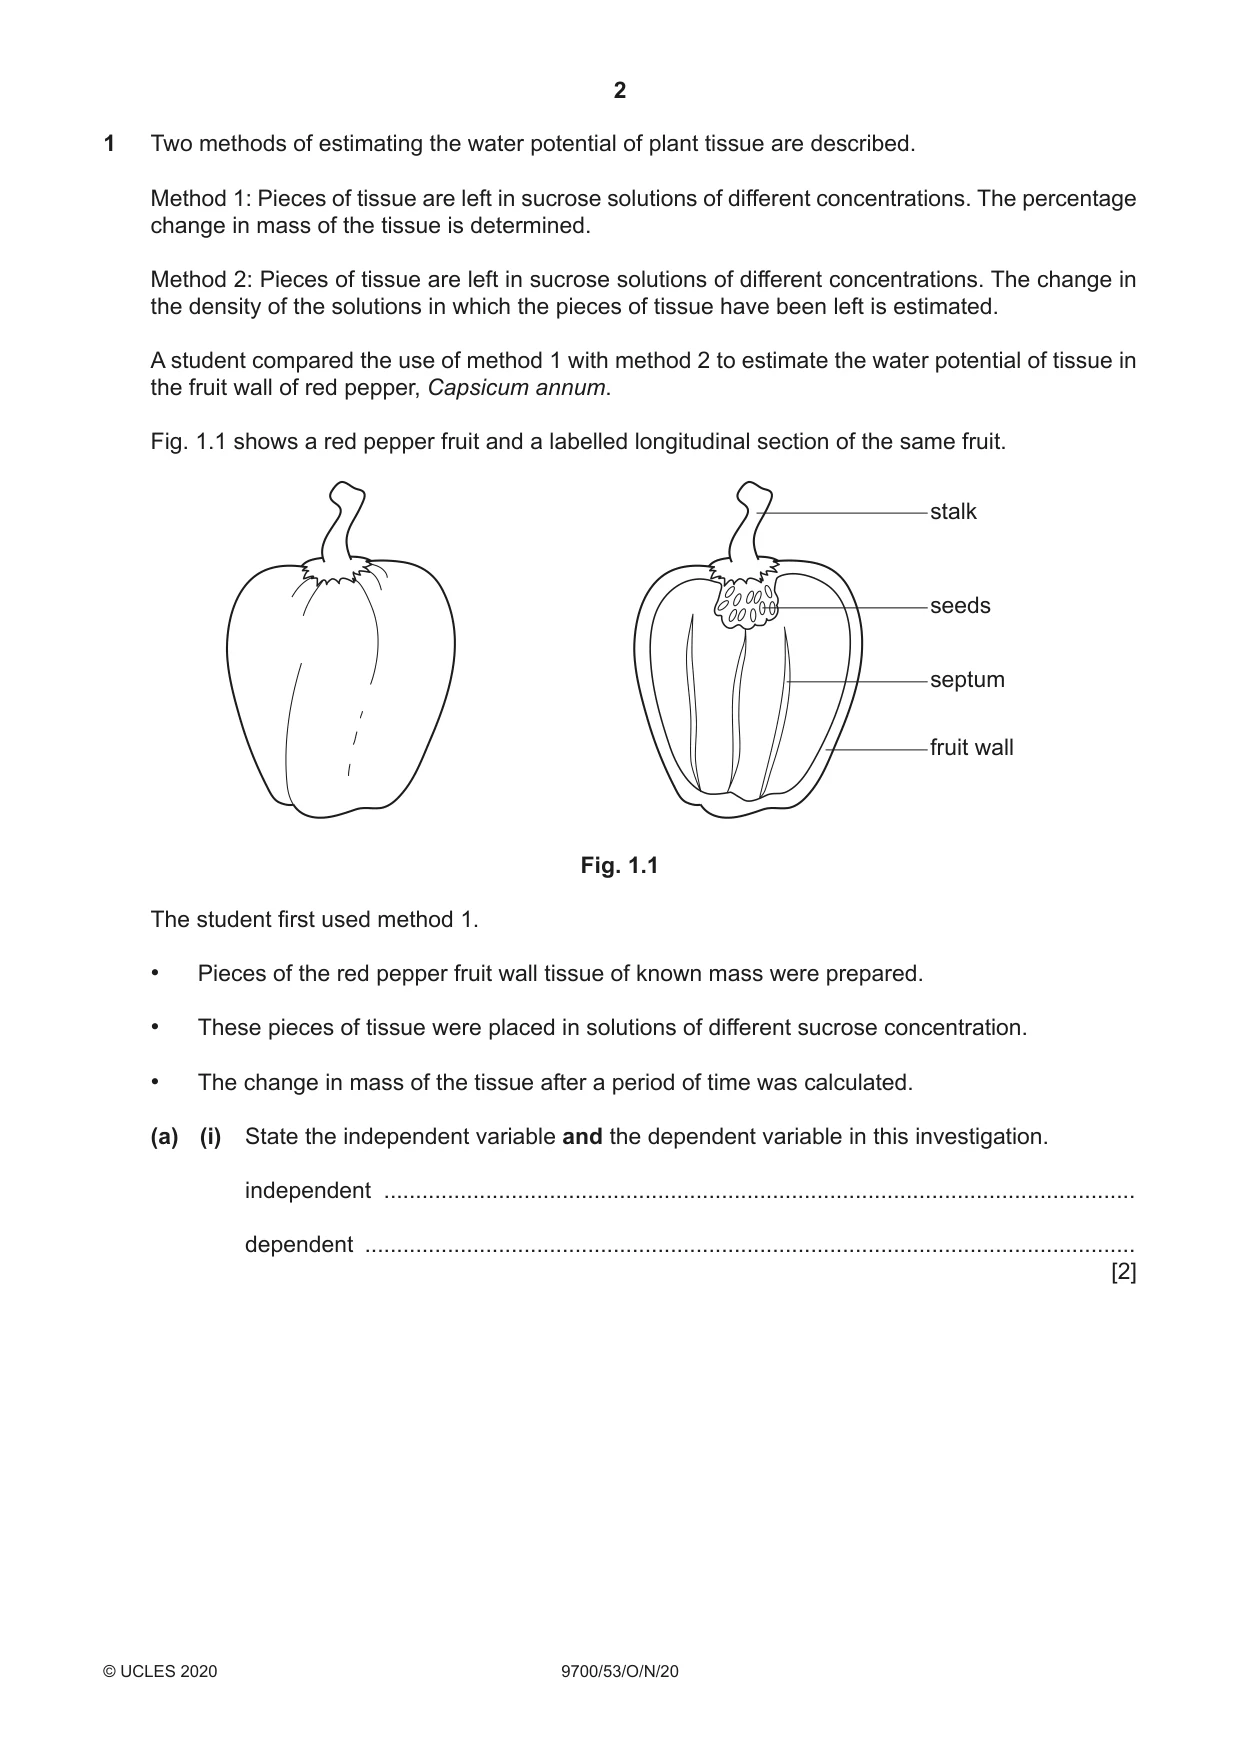
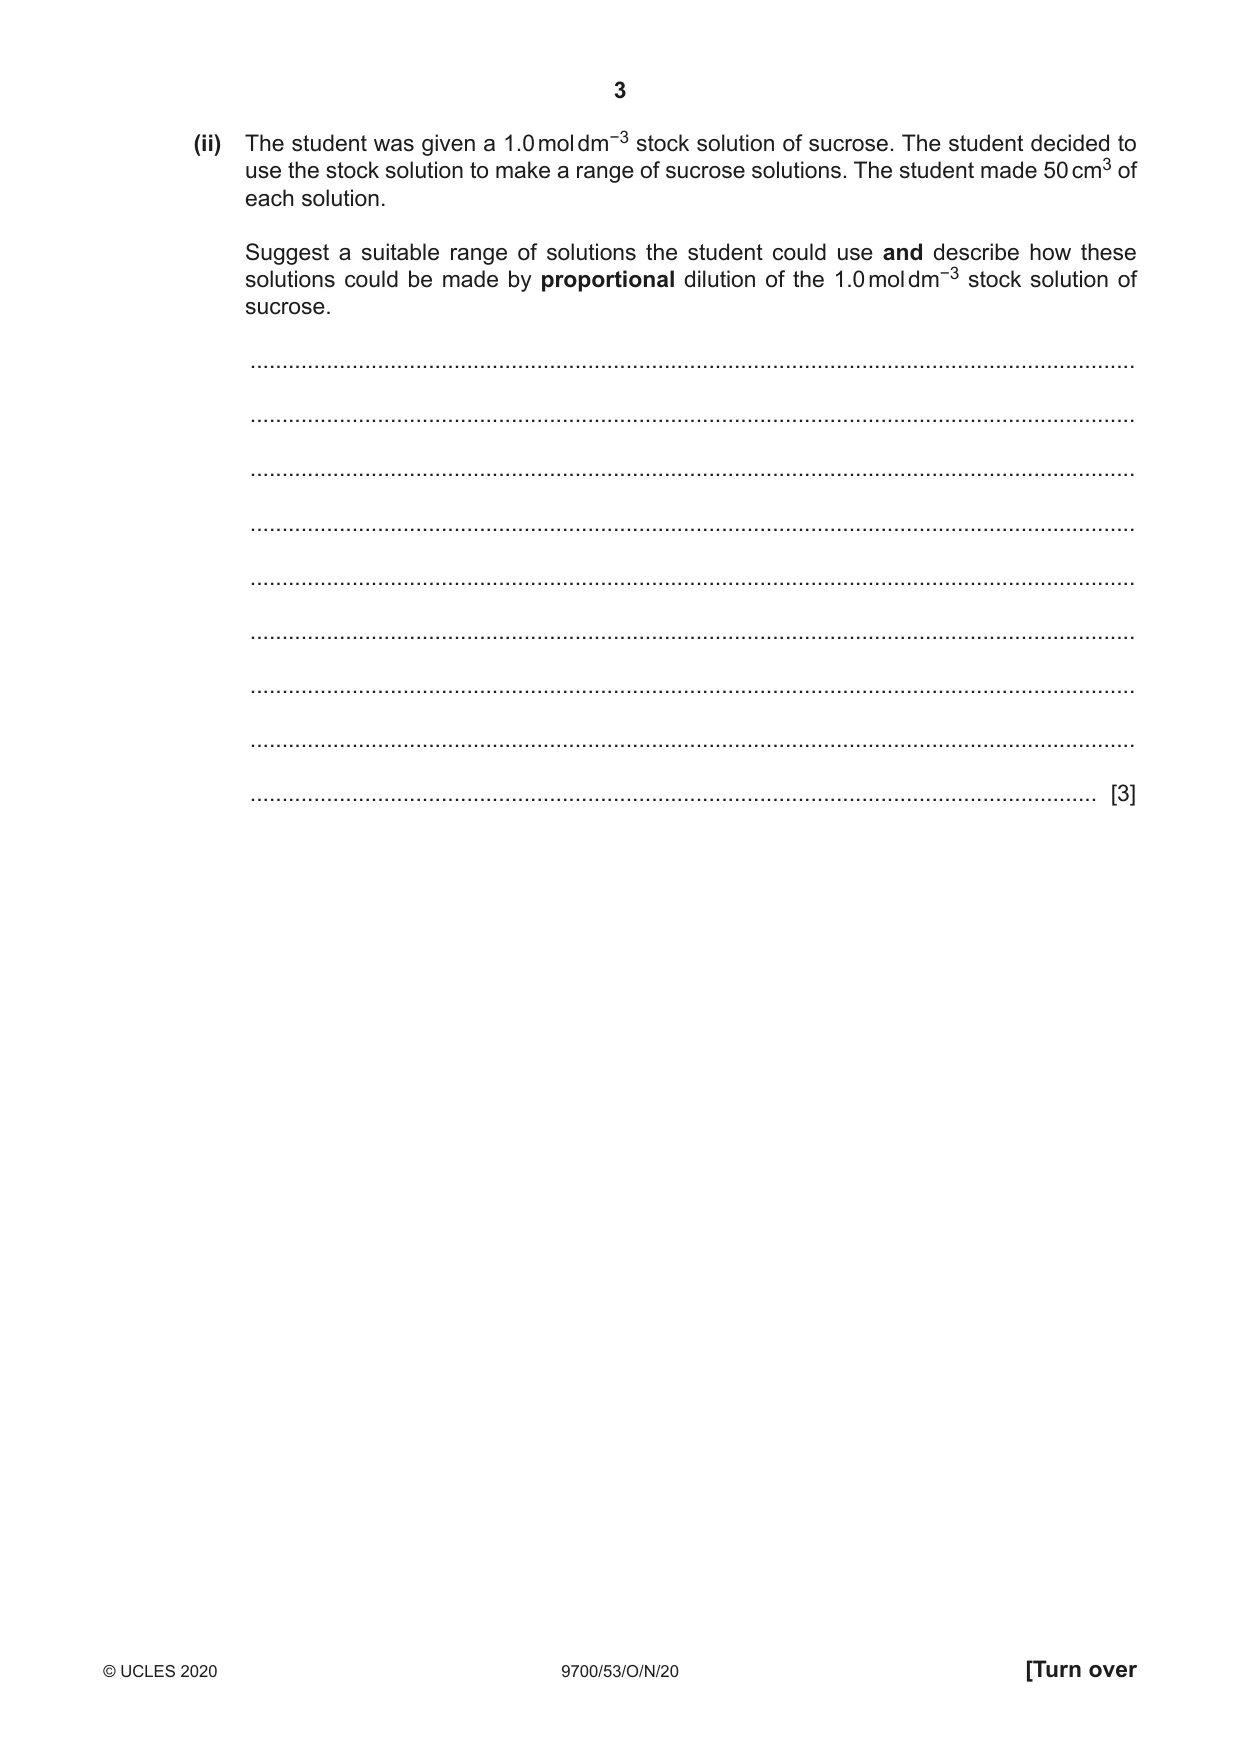
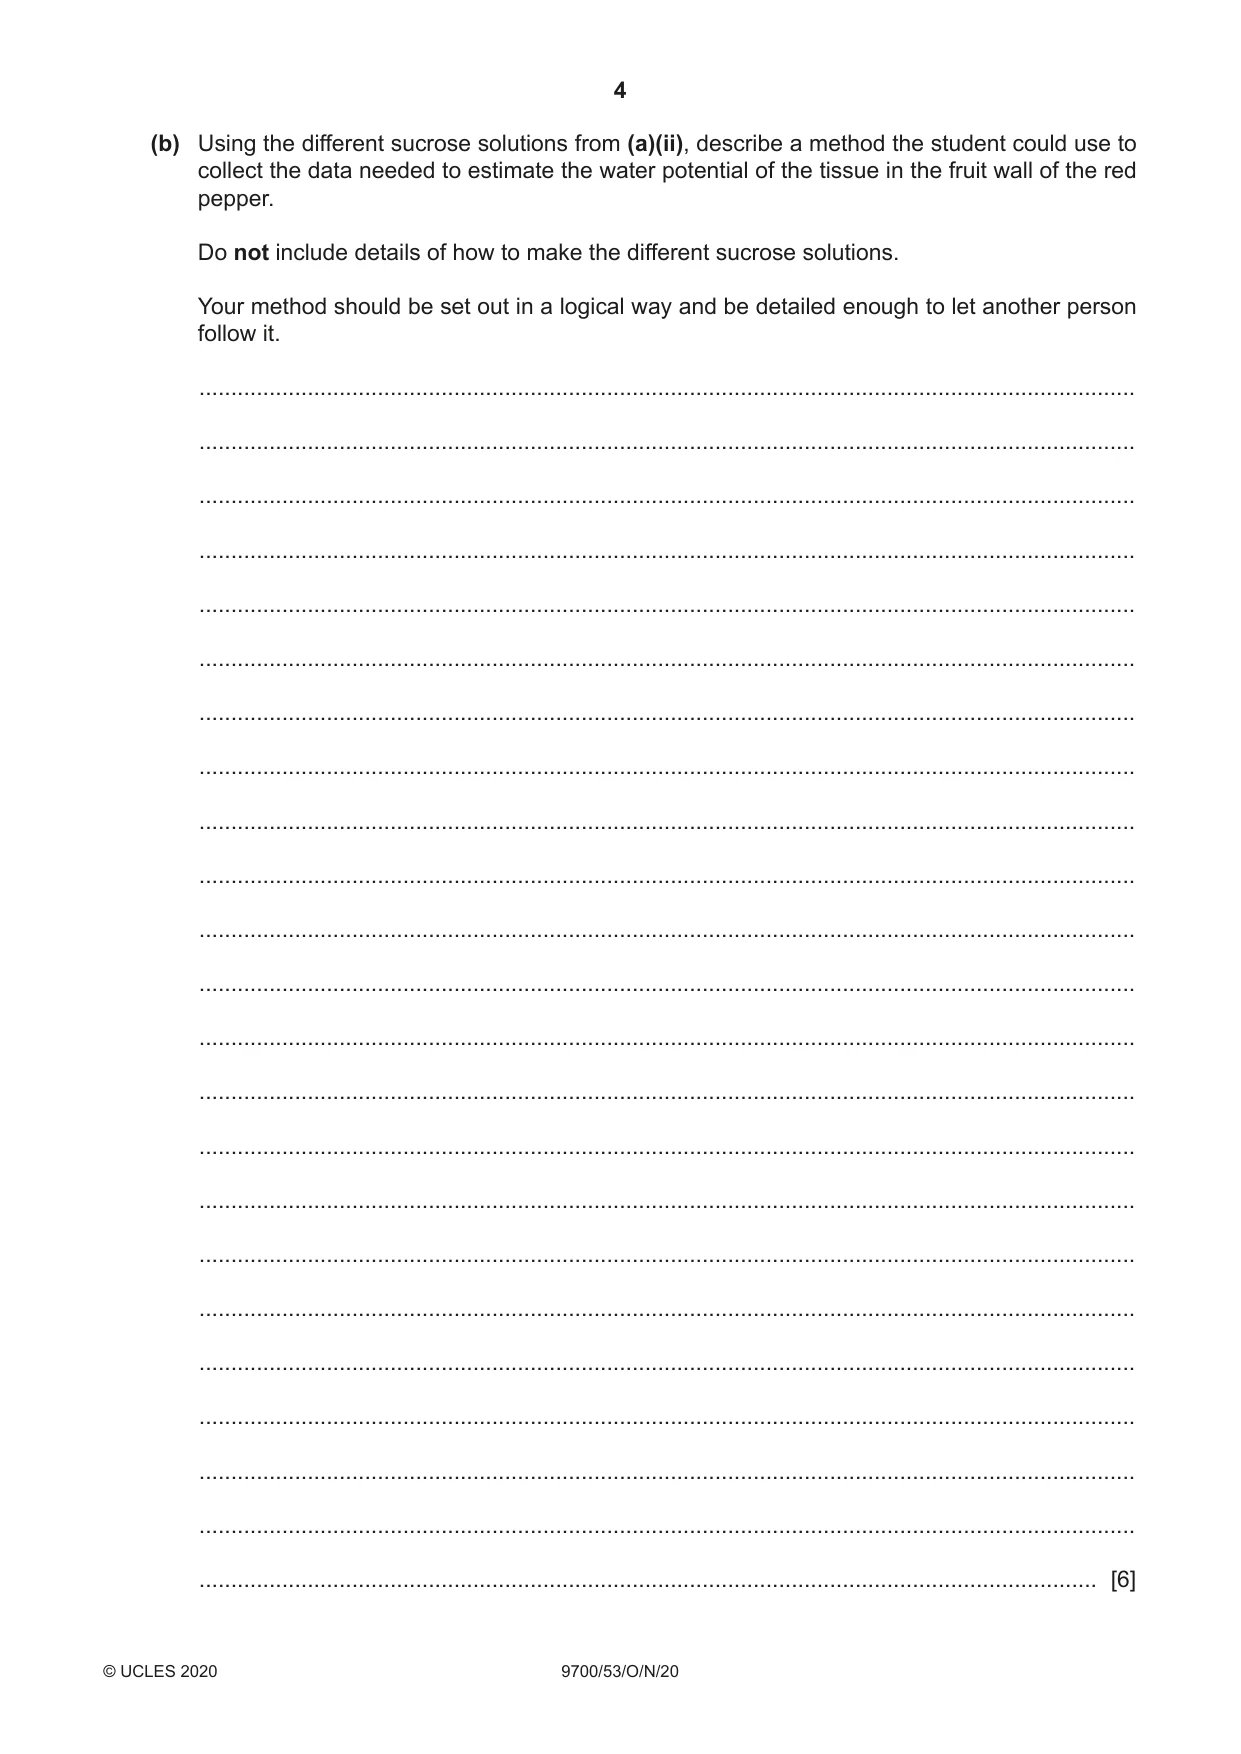
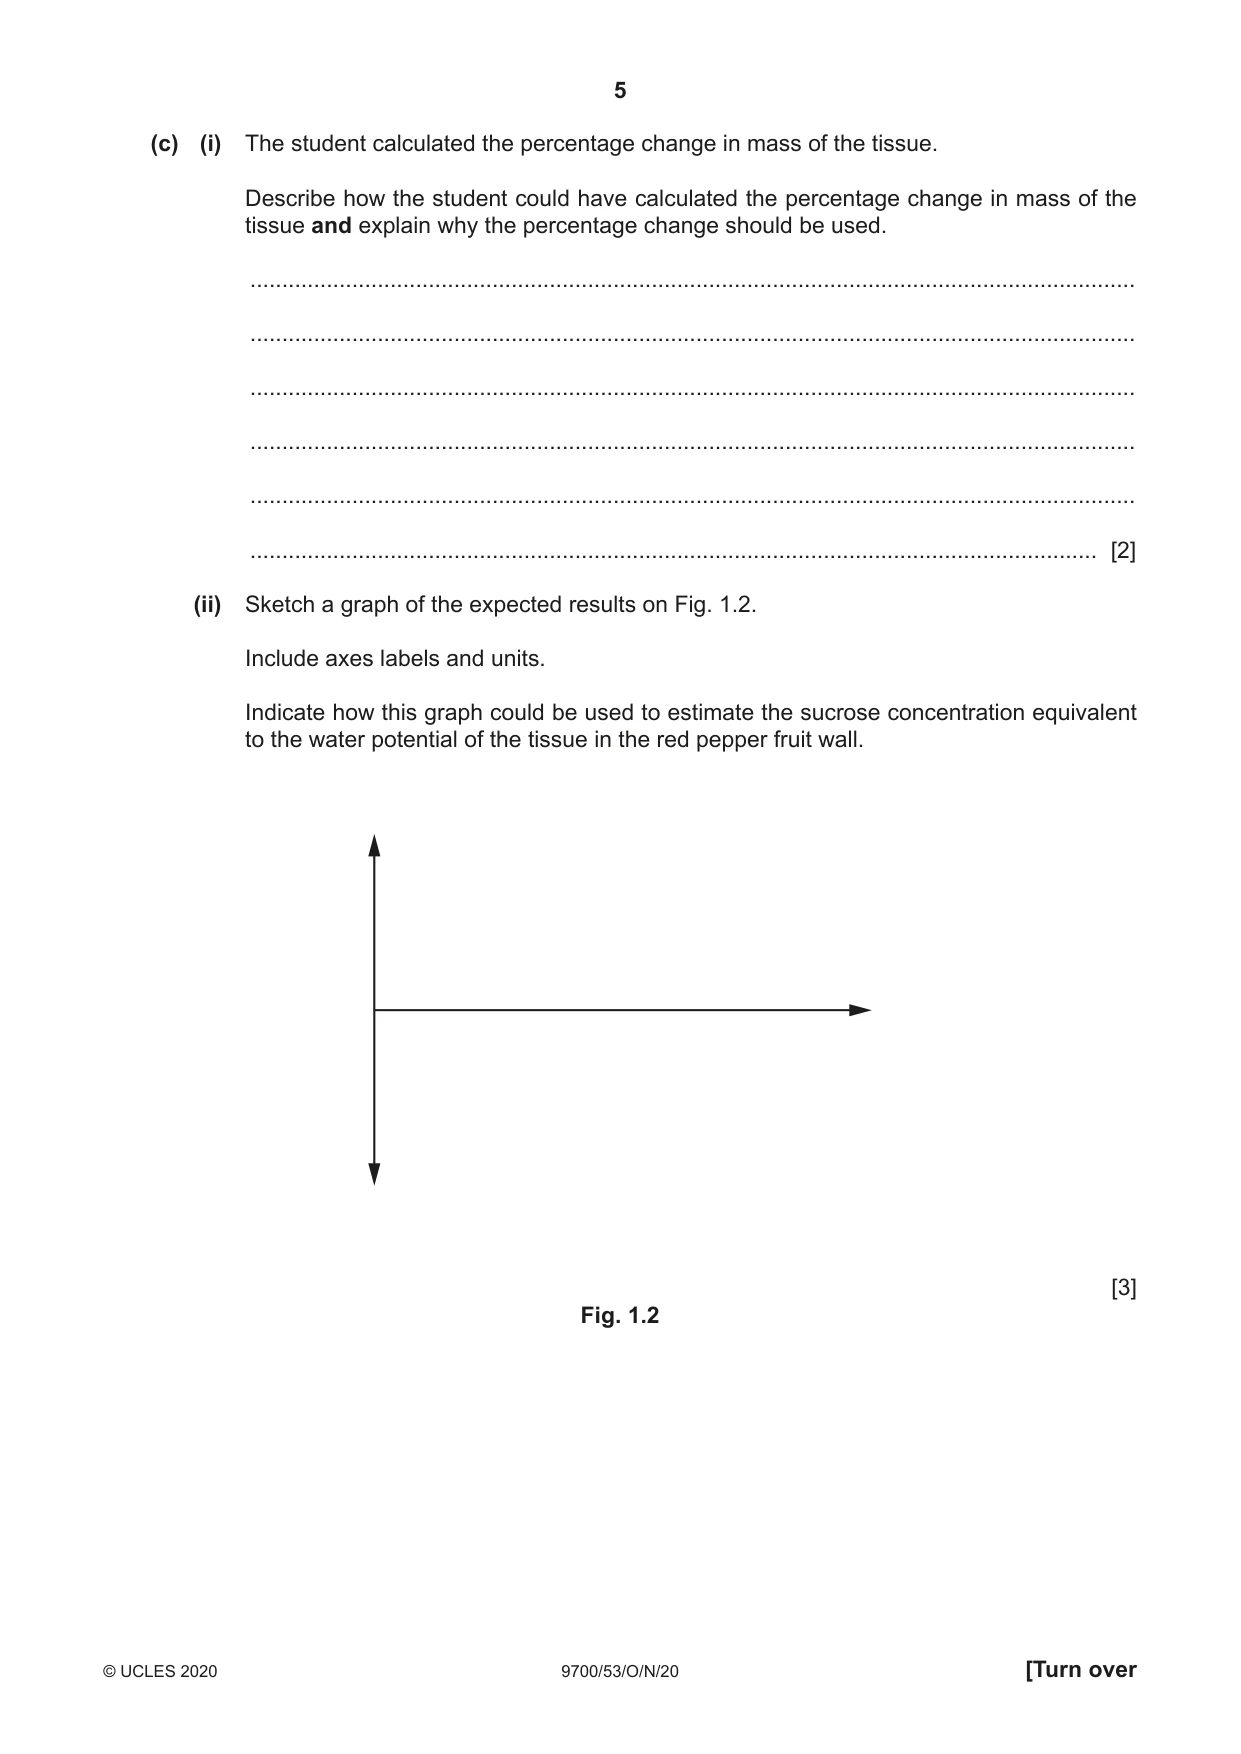
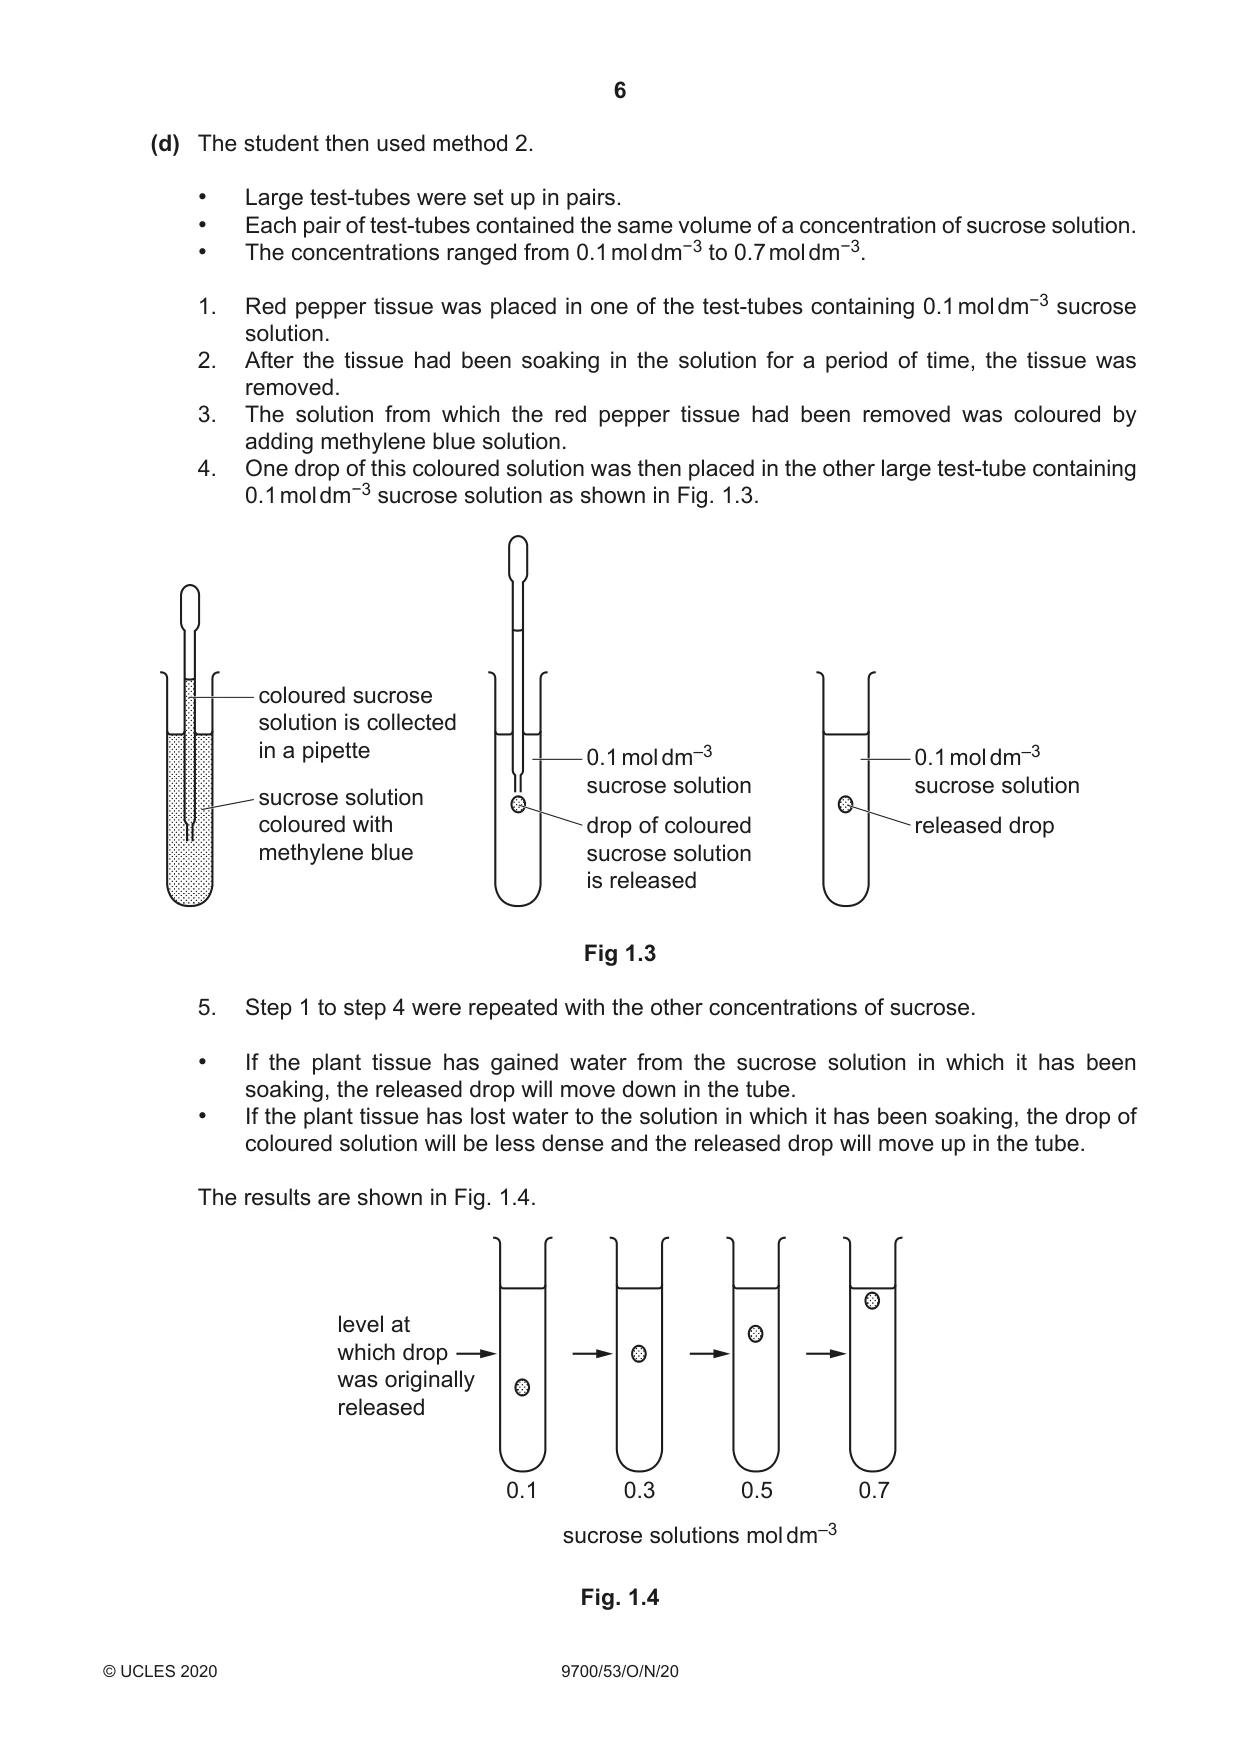
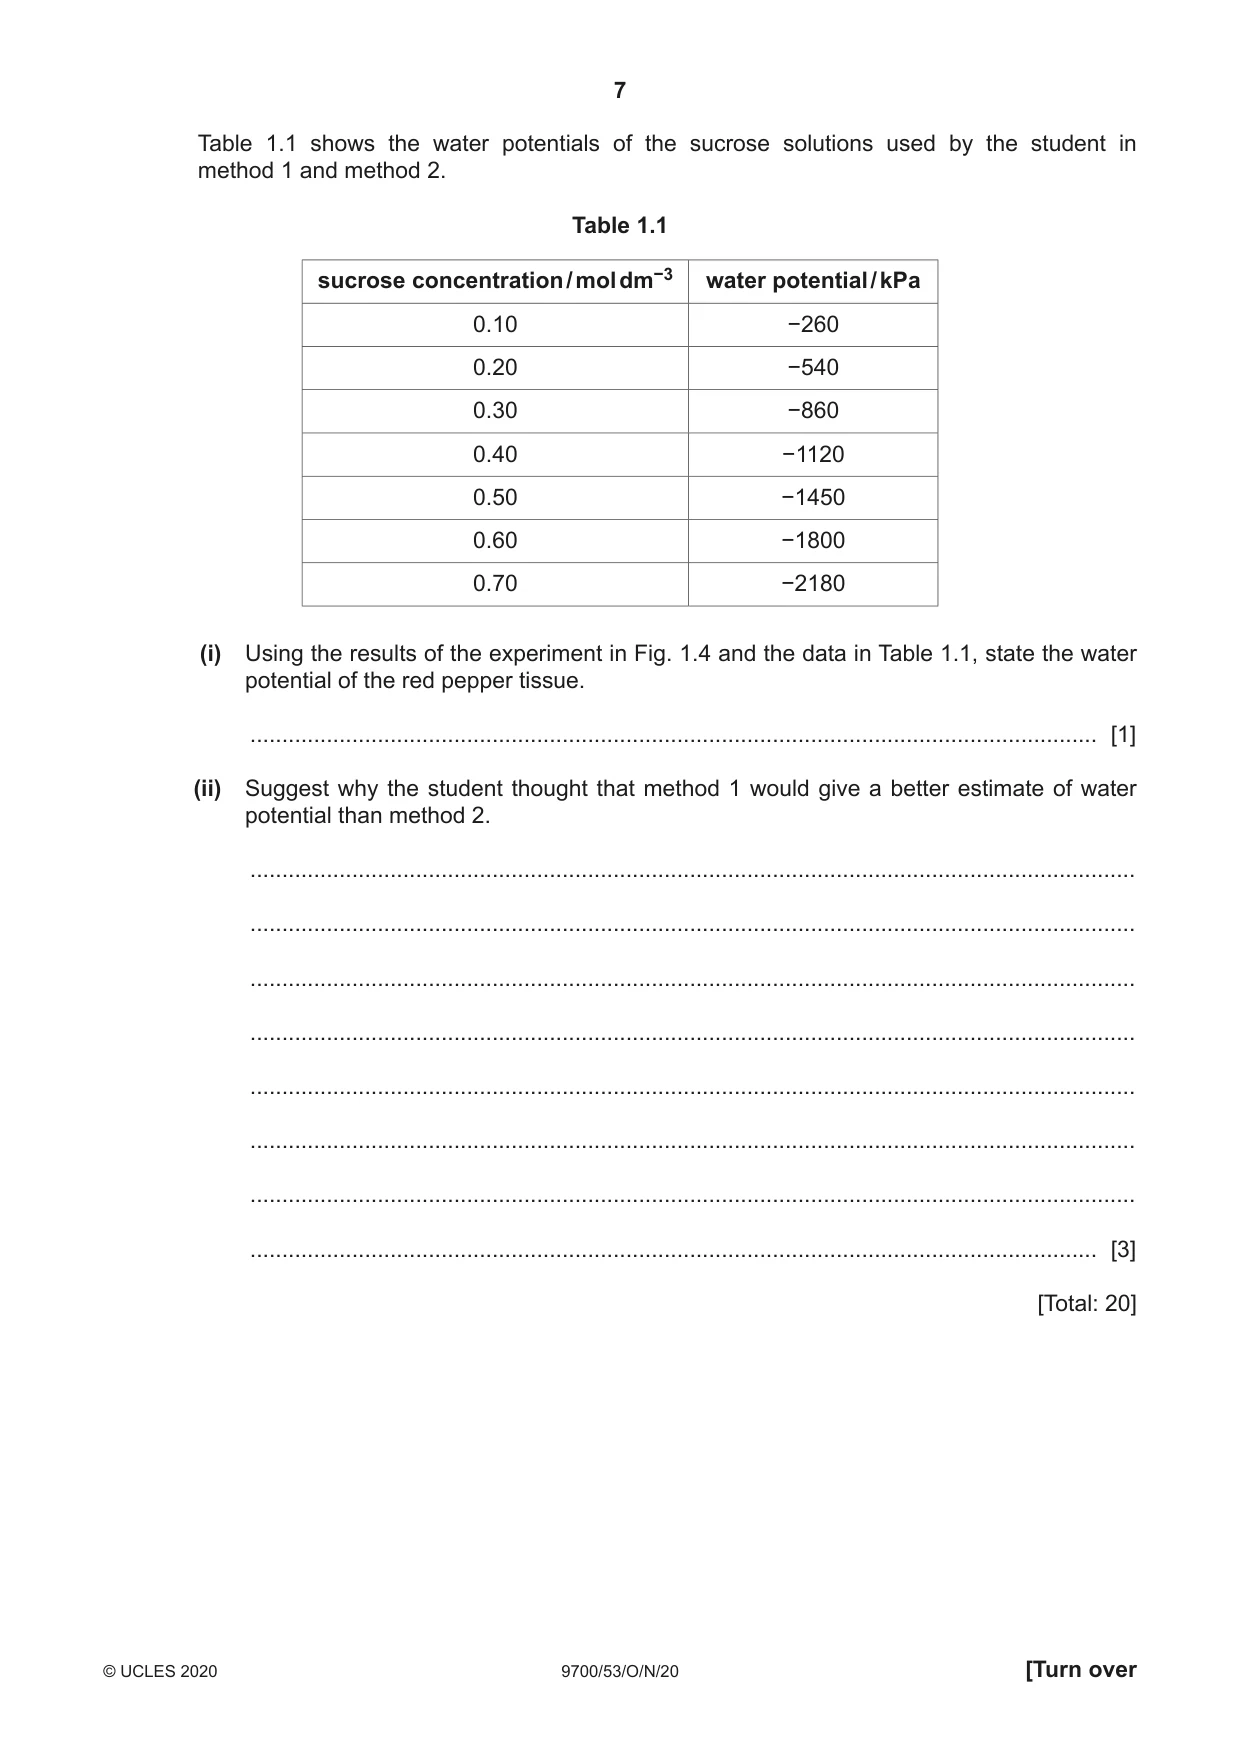
1 Two methods of estimating the water potential of plant tissue are described. Method 1: Pieces of tissue are left in sucrose solutions of different concentrations. The percentage change in mass of the tissue is determined. Method 2: Pieces of tissue are left in sucrose solutions of different concentrations. The change in the density of the solutions in which the pieces of tissue have been left is estimated. A student compared the use of method 1 with method 2 to estimate the water potential of tissue in the fruit wall of red pepper, Capsicum annum. Fig. 1.1 shows a red pepper fruit and a labelled longitudinal section of the same fruit. stalk seeds septum fruit wall Fig. 1.1 The student first used method 1. • Pieces of the red pepper fruit wall tissue of known mass were prepared. • These pieces of tissue were placed in solutions of different sucrose concentration. • The change in mass of the tissue after a period of time was calculated. (a) (i) State the independent variable and the dependent variable in this investigation. independent ...................................................................................................................... dependent ......................................................................................................................... [2] (ii) The student was given a 1.0 mol dm−3 stock solution of sucrose. The student decided to use the stock solution to make a range of sucrose solutions. The student made 50 cm3 of each solution. Suggest a suitable range of solutions the student could use and describe how these solutions could be made by proportional dilution of the 1.0 mol dm−3 stock solution of sucrose. ........................................................................................................................................... ........................................................................................................................................... ........................................................................................................................................... ........................................................................................................................................... ........................................................................................................................................... ........................................................................................................................................... ........................................................................................................................................... ........................................................................................................................................... ..................................................................................................................................... [3] (b) Using the different sucrose solutions from (a)(ii), describe a method the student could use to collect the data needed to estimate the water potential of the tissue in the fruit wall of the red pepper. Do not include details of how to make the different sucrose solutions. Your method should be set out in a logical way and be detailed enough to let another person follow it. ................................................................................................................................................... ................................................................................................................................................... ................................................................................................................................................... ................................................................................................................................................... ................................................................................................................................................... ................................................................................................................................................... ................................................................................................................................................... ................................................................................................................................................... ................................................................................................................................................... ................................................................................................................................................... ................................................................................................................................................... ................................................................................................................................................... ................................................................................................................................................... ................................................................................................................................................... ................................................................................................................................................... ................................................................................................................................................... ................................................................................................................................................... ................................................................................................................................................... ................................................................................................................................................... ................................................................................................................................................... ................................................................................................................................................... ................................................................................................................................................... ............................................................................................................................................. [6] (c) (i) The student calculated the percentage change in mass of the tissue. Describe how the student could have calculated the percentage change in mass of the tissue and explain why the percentage change should be used. ........................................................................................................................................... ........................................................................................................................................... ........................................................................................................................................... ........................................................................................................................................... ........................................................................................................................................... ..................................................................................................................................... [2] (ii) Sketch a graph of the expected results on Fig. 1.2. Include axes labels and units. Indicate how this graph could be used to estimate the sucrose concentration equivalent to the water potential of the tissue in the red pepper fruit wall. [3] Fig. 1.2 (d) The student then used method 2. • Large test-tubes were set up in pairs. • Each pair of test-tubes contained the same volume of a concentration of sucrose solution. • The concentrations ranged from 0.1 mol dm−3 to 0.7 mol dm−3. 1. Red pepper tissue was placed in one of the test-tubes containing 0.1 mol dm−3 sucrose solution. 2. After the tissue had been soaking in the solution for a period of time, the tissue was removed. 3. The solution from which the red pepper tissue had been removed was coloured by adding methylene blue solution. 4. One drop of this coloured solution was then placed in the other large test-tube containing 0.1 mol dm−3 sucrose solution as shown in Fig. 1.3. coloured sucrose solution is collected in a pipette 0.1 mol dm–3 0.1 mol dm–3 sucrose solution sucrose solution sucrose solution coloured with drop of coloured released drop methylene blue sucrose solution is released Fig 1.3 5. Step 1 to step 4 were repeated with the other concentrations of sucrose. • If the plant tissue has gained water from the sucrose solution in which it has been soaking, the released drop will move down in the tube. • If the plant tissue has lost water to the solution in which it has been soaking, the drop of coloured solution will be less dense and the released drop will move up in the tube. The results are shown in Fig. 1.4. level at which drop was originally released 0.1 0.3 0.5 0.7 sucrose solutions mol dm–3 Fig. 1.4 Table 1.1 shows the water potentials of the sucrose solutions used by the student in method 1 and method 2. Table 1.1 sucrose concentration / mol dm−3 water potential / kPa 0.10 −260 0.20 −540 0.30 −860 0.40 −1120 0.50 −1450 0.60 −1800 0.70 −2180 (i) Using the results of the experiment in Fig. 1.4 and the data in Table 1.1, state the water potential of the red pepper tissue. ..................................................................................................................................... [1] (ii) Suggest why the student thought that method 1 would give a better estimate of water potential than method 2. ........................................................................................................................................... ........................................................................................................................................... ........................................................................................................................................... ........................................................................................................................................... ........................................................................................................................................... ........................................................................................................................................... ........................................................................................................................................... ..................................................................................................................................... [3] [Total: 20]
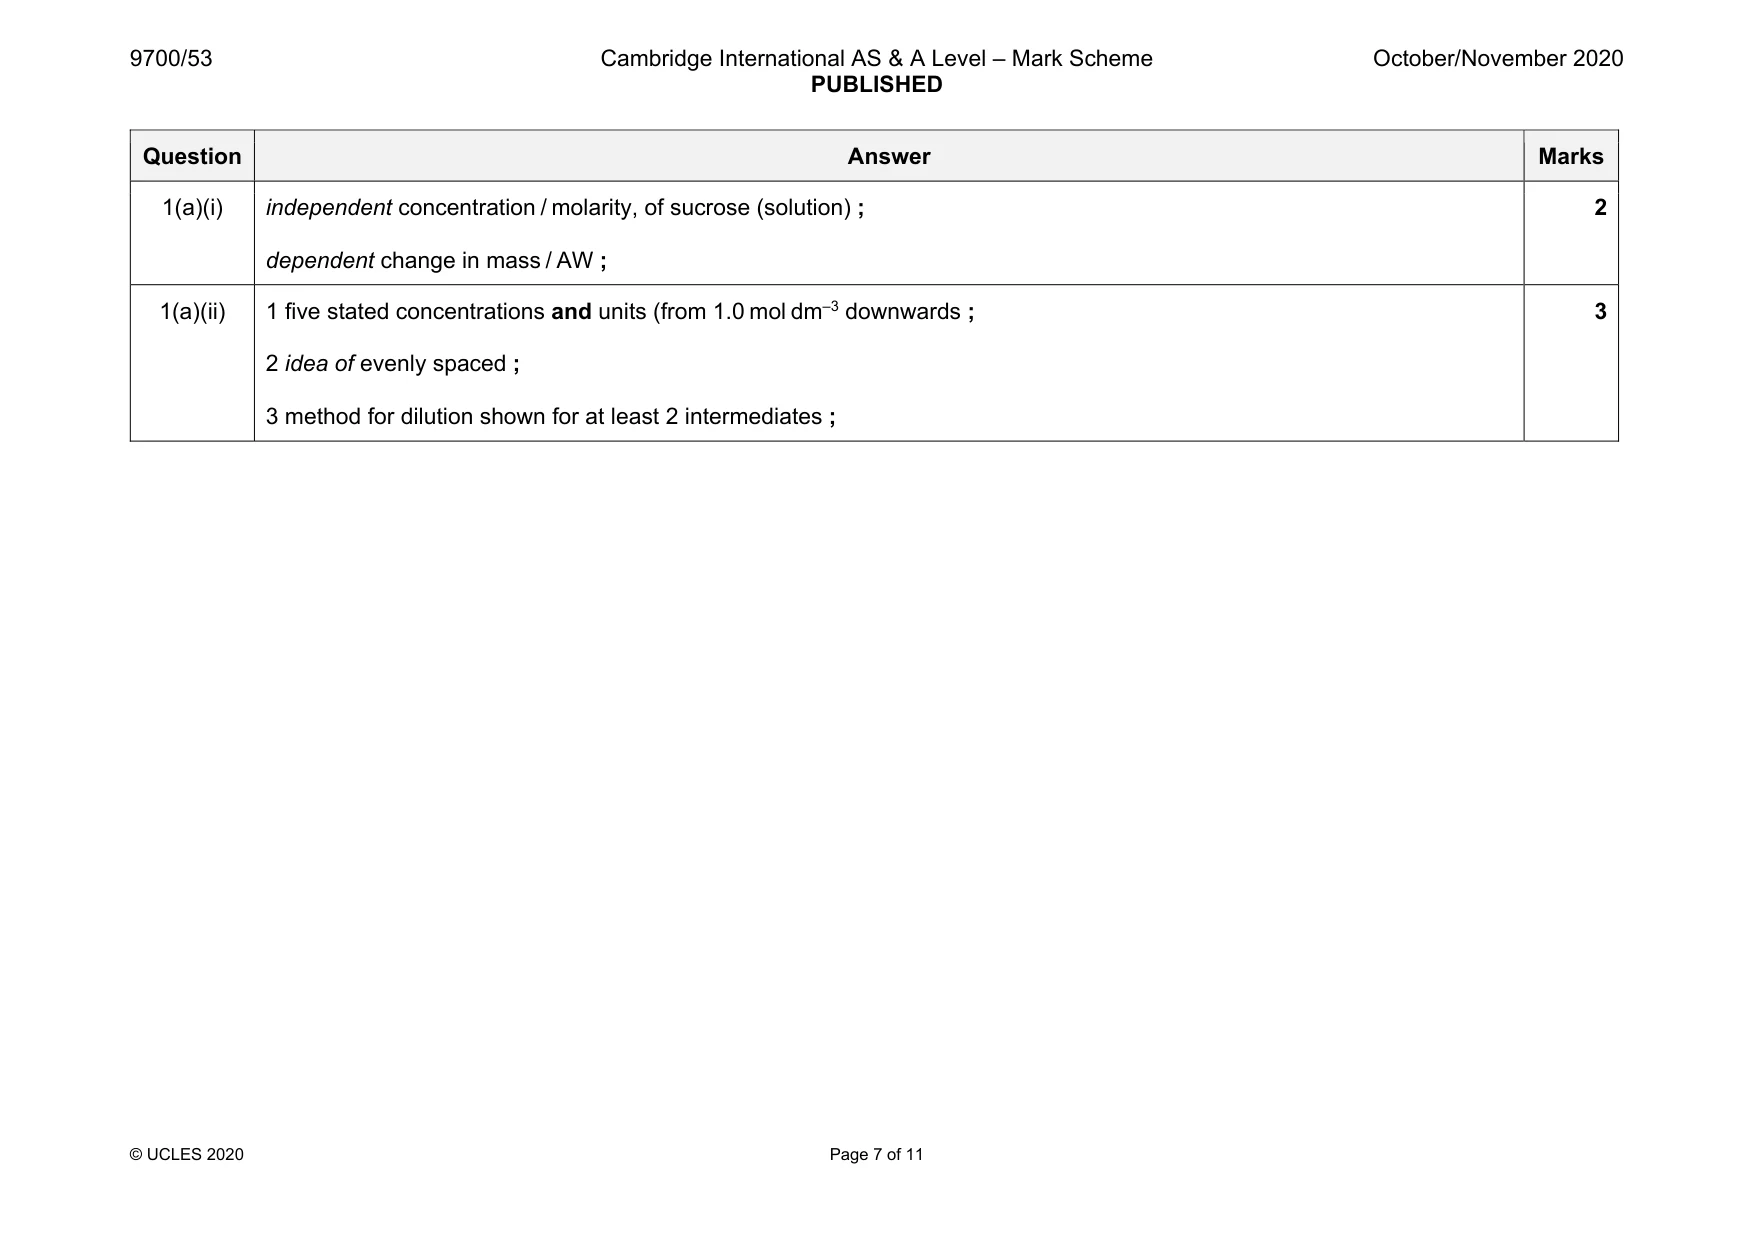
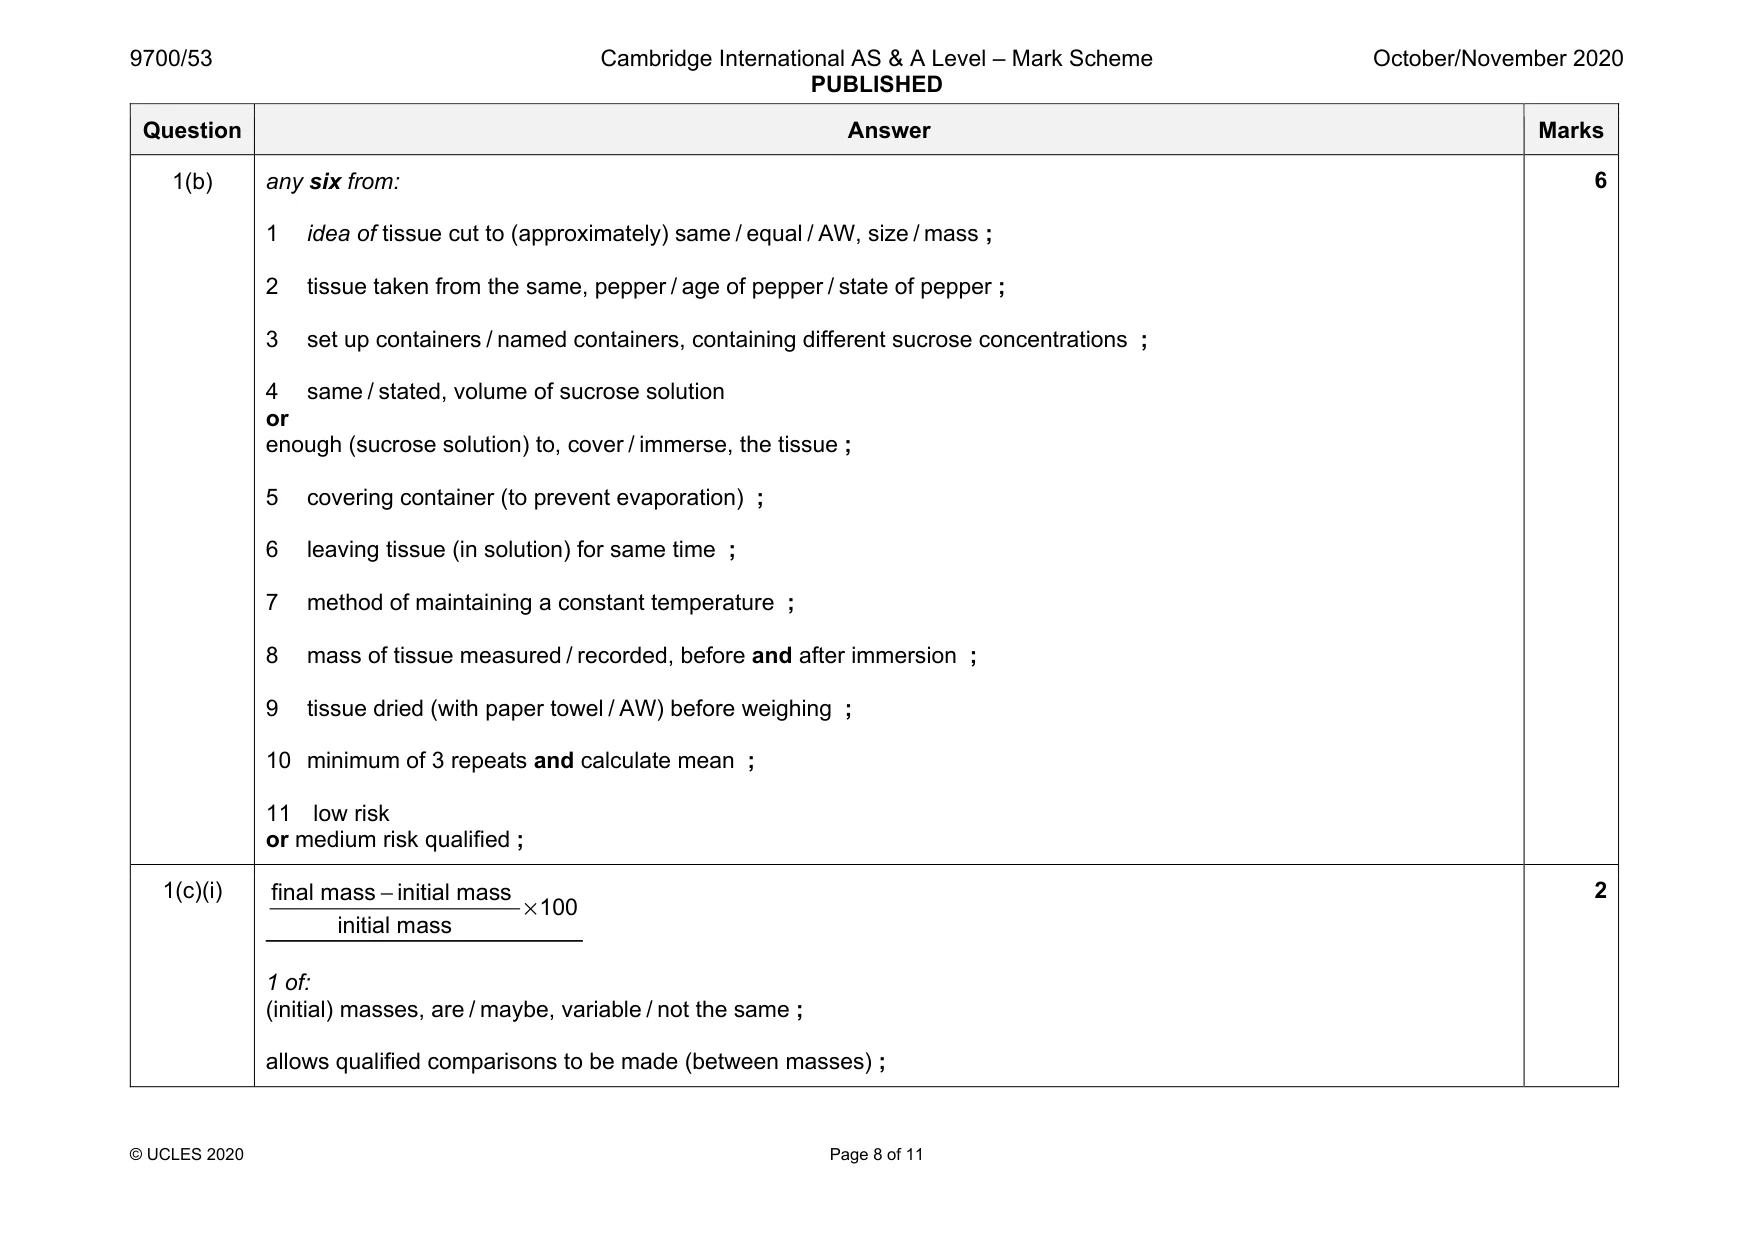
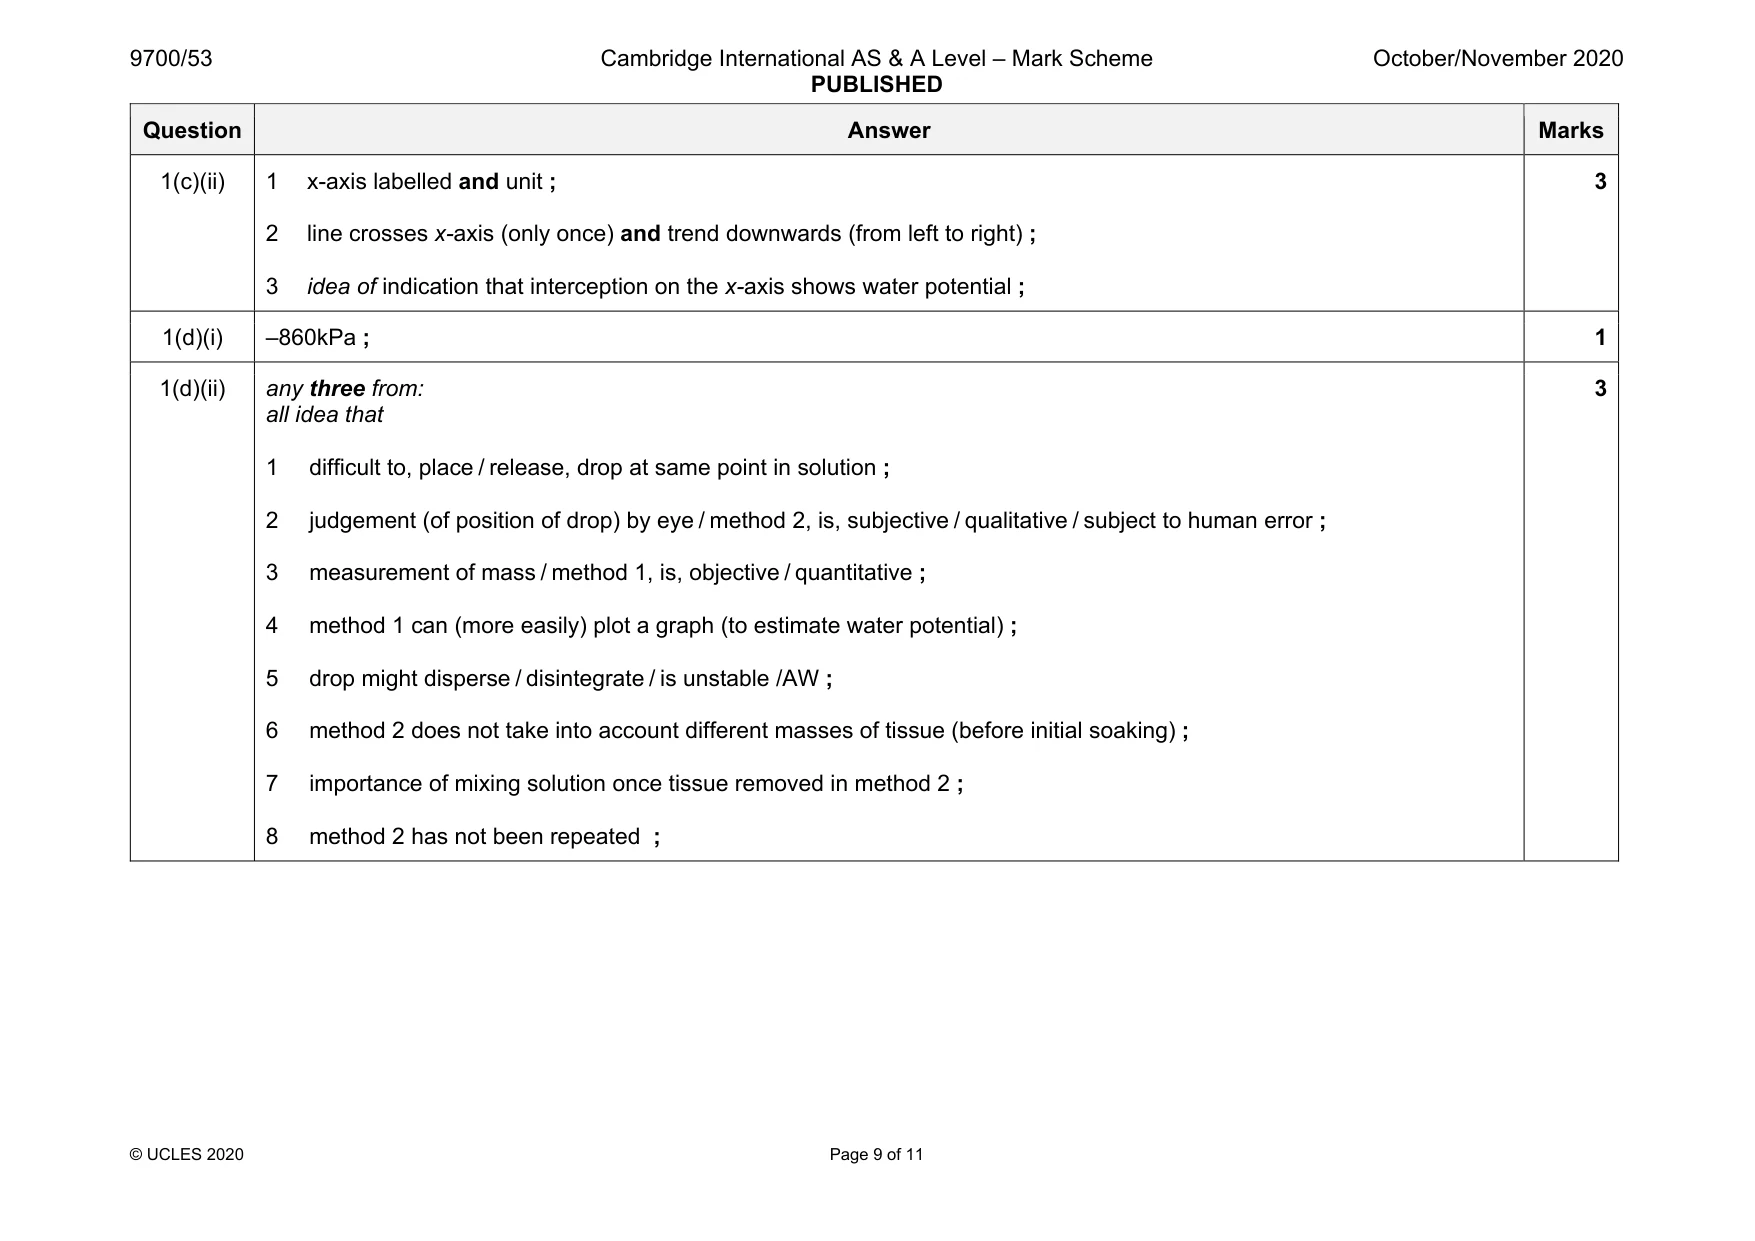
Mark scheme: 1(a)(i) independent concentration / molarity, of sucrose (solution) ; dependent change in mass / AW ; 2 1(a)(ii) 1 five stated concentrations and units (from 1.0 mol dm–3 downwards ; 2 idea of evenly spaced ; 3 method for dilution shown for at least 2 intermediates ; 3 Question Answer Marks 1(b) any six from: 1 idea of tissue cut to (approximately) same / equal / AW, size / mass ; 2 tissue taken from the same, pepper / age of pepper / state of pepper ; 3 set up containers / named containers, containing different sucrose concentrations ; 4 same / stated, volume of sucrose solution or enough (sucrose solution) to, cover / immerse, the tissue ; 5 covering container (to prevent evaporation) ; 6 leaving tissue (in solution) for same time ; 7 method of maintaining a constant temperature ; 8 mass of tissue measured / recorded, before and after immersion ; 9 tissue dried (with paper towel / AW) before weighing ; 10 minimum of 3 repeats and calculate mean ; 11 low risk or medium risk qualified ; 6 1(c)(i) − × final mass initial mass 100 initial mass 1 of: (initial) masses, are / maybe, variable / not the same ; allows qualified comparisons to be made (between masses) ; 2 Question Answer Marks 1(c)(ii) 1 x-axis labelled and unit ; 2 line crosses x-axis (only once) and trend downwards (from left to right) ; 3 idea of indication that interception on the x-axis shows water potential ; 3 1(d)(i) –860kPa ; 1 1(d)(ii) any three from: all idea that 1 difficult to, place / release, drop at same point in solution ; 2 judgement (of position of drop) by eye / method 2, is, subjective / qualitative / subject to human error ; 3 measurement of mass / method 1, is, objective / quantitative ; 4 method 1 can (more easily) plot a graph (to estimate water potential) ; 5 drop might disperse / disintegrate / is unstable /AW ; 6 method 2 does not take into account different masses of tissue (before initial soaking) ; 7 importance of mixing solution once tissue removed in method 2 ; 8 method 2 has not been repeated ; 3
Q2 · Biodiversity is important in maintaining the stability of an ecosystem
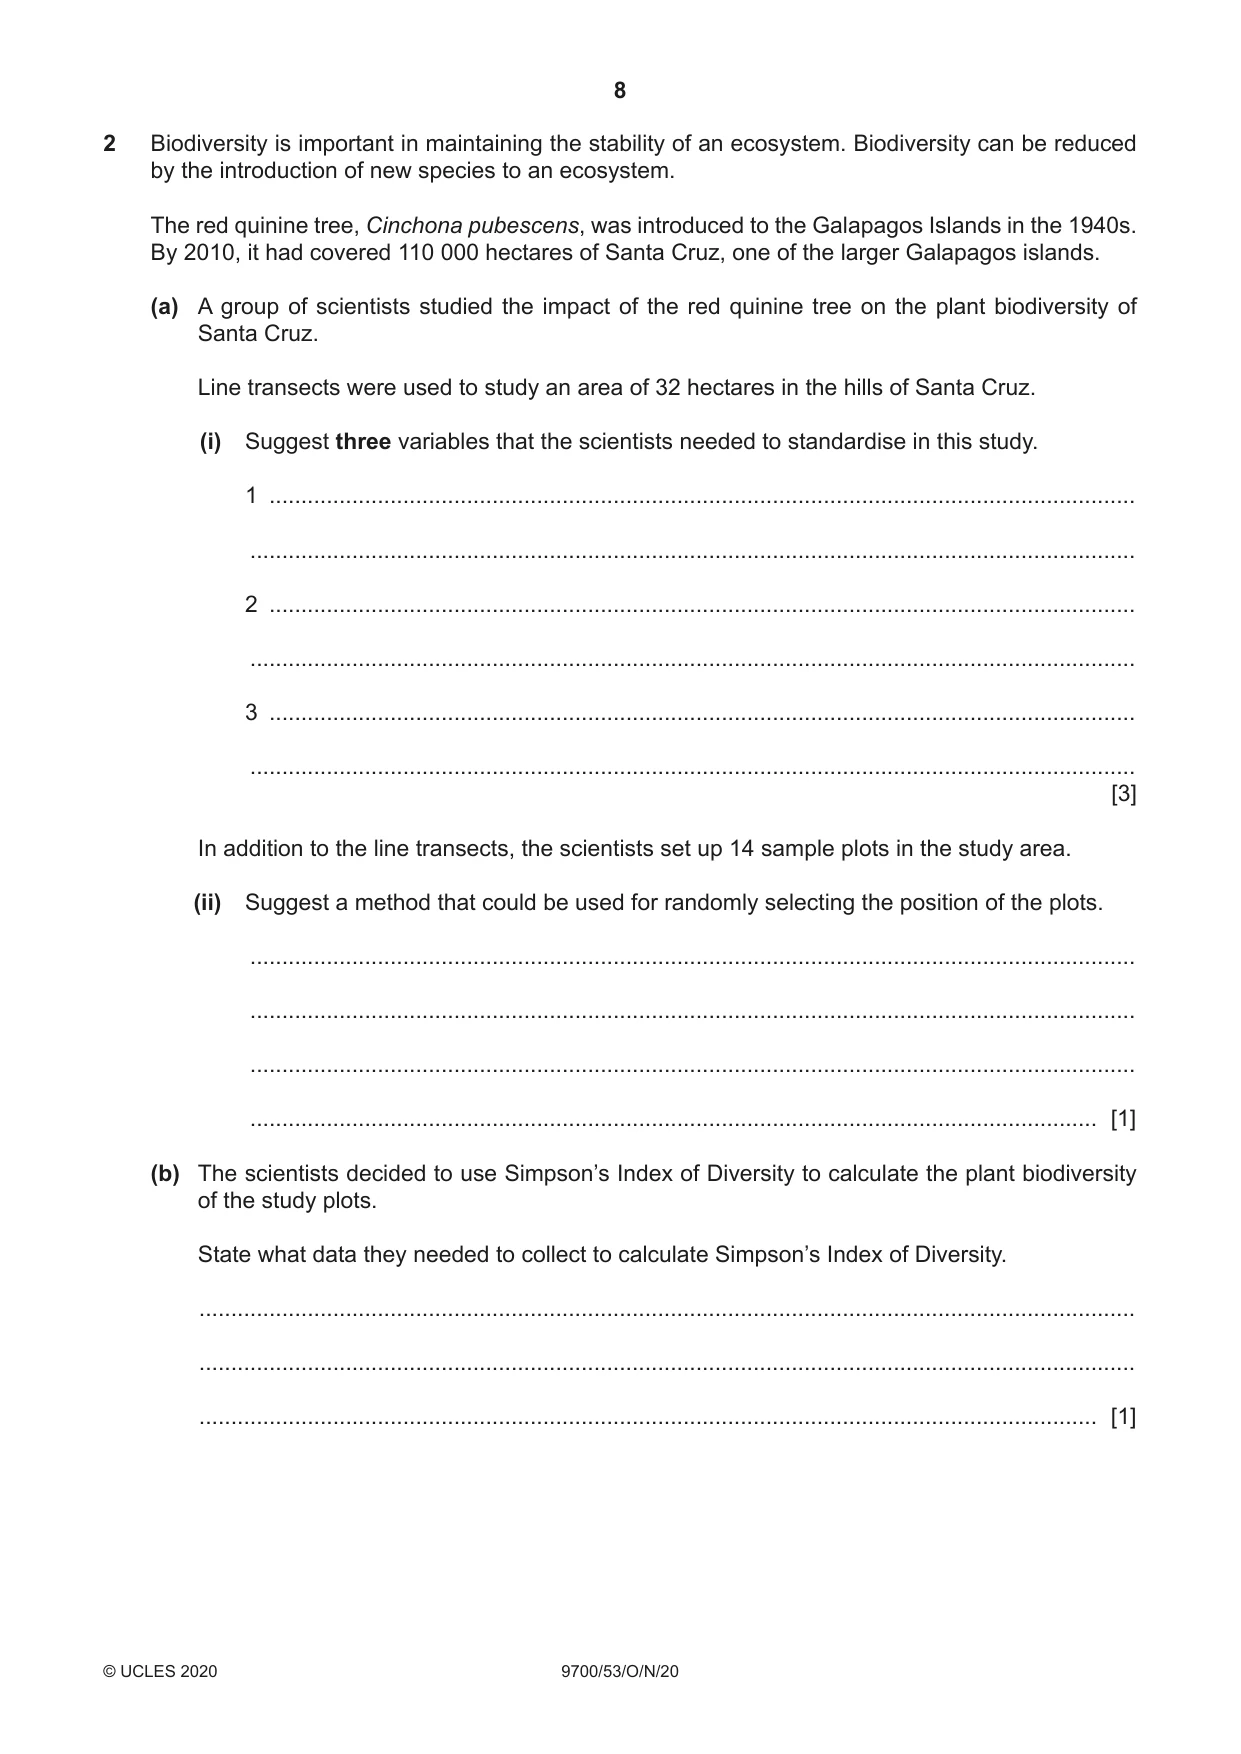
2 Biodiversity is important in maintaining the stability of an ecosystem. Biodiversity can be reduced by the introduction of new species to an ecosystem. The red quinine tree, Cinchona pubescens, was introduced to the Galapagos Islands in the 1940s. By 2010, it had covered 110 000 hectares of Santa Cruz, one of the larger Galapagos islands. (a) A group of scientists studied the impact of the red quinine tree on the plant biodiversity of Santa Cruz. Line transects were used to study an area of 32 hectares in the hills of Santa Cruz. (i) Suggest three variables that the scientists needed to standardise in this study. 1 ........................................................................................................................................ ........................................................................................................................................... 2 ........................................................................................................................................ ........................................................................................................................................... 3 ........................................................................................................................................ ........................................................................................................................................... [3] In addition to the line transects, the scientists set up 14 sample plots in the study area. (ii) Suggest a method that could be used for randomly selecting the position of the plots. ........................................................................................................................................... ........................................................................................................................................... ........................................................................................................................................... ..................................................................................................................................... [1] (b) The scientists decided to use Simpson’s Index of Diversity to calculate the plant biodiversity of the study plots. State what data they needed to collect to calculate Simpson’s Index of Diversity. ................................................................................................................................................... ................................................................................................................................................... ............................................................................................................................................. [1] (c) Over a 7-year period the scientists measured the: • ground covered by red quinine trees • ground covered by other plant species • ground not covered by plants. Fig. 2.1 shows the results. 80 60 ground cover 40 (arbitrary units) 20 0 other plant species red quinine trees no plants Key 1998 2003 2005 Fig. 2.1 Calculate the percentage change in the ground covered by red quinine trees in the plots from 1998 to 2005. ...................................................... % [1] (d) The scientists suggested the hypothesis: The presence of red quinine trees in the hills of Santa Cruz causes a decrease in biodiversity. The scientists carried out statistical tests on their studies of species diversity. The probability values (p) from the results of the statistical tests are shown in Table 2.1. Table 2.1 value of p decrease in species diversity 1998–2003 < 0.001 decrease in species diversity 2003–2005 > 0.05 Evaluate the data in Fig. 2.1 and Table 2.1 and discuss the extent to which the data supports or does not support this hypothesis. ................................................................................................................................................... ................................................................................................................................................... ................................................................................................................................................... ................................................................................................................................................... ................................................................................................................................................... ................................................................................................................................................... ................................................................................................................................................... ................................................................................................................................................... ................................................................................................................................................... ................................................................................................................................................... ............................................................................................................................................. [4] [Total:10]
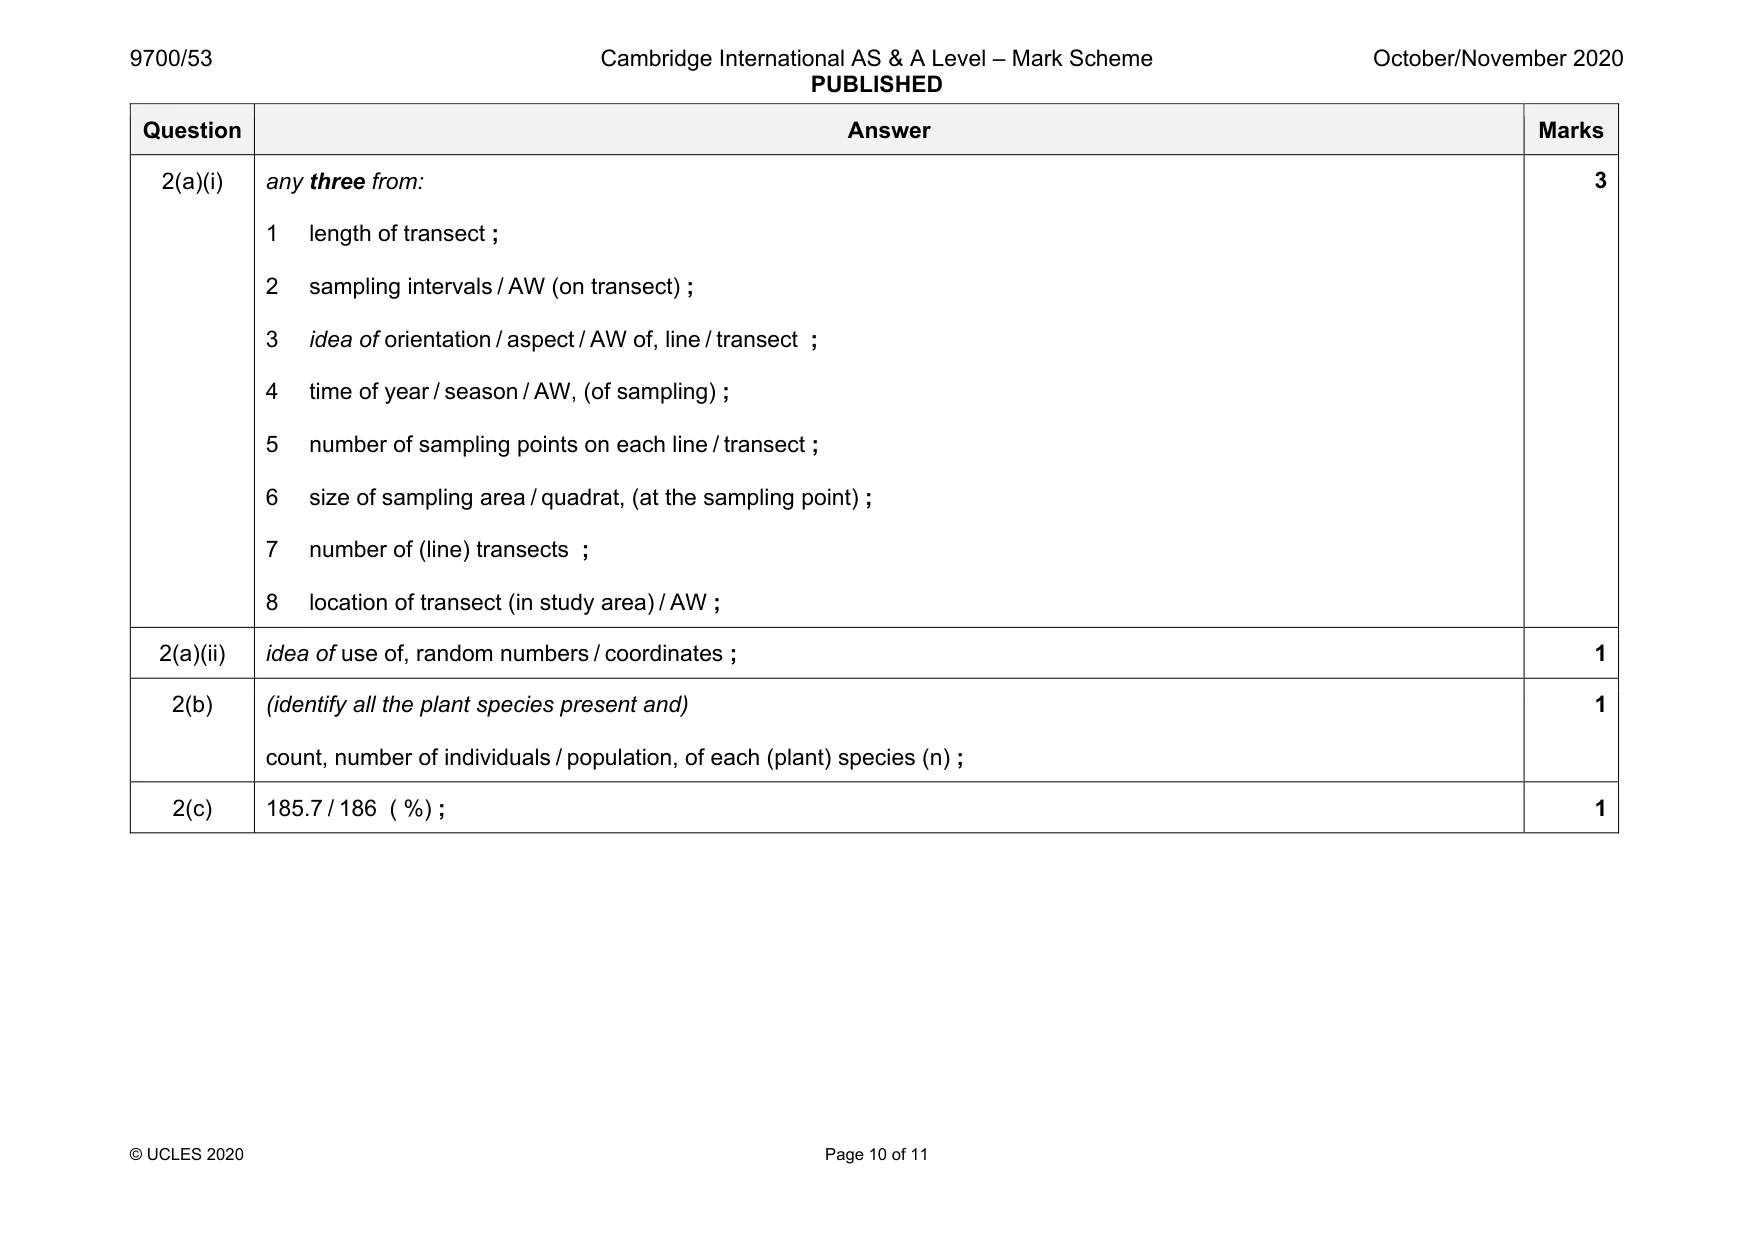
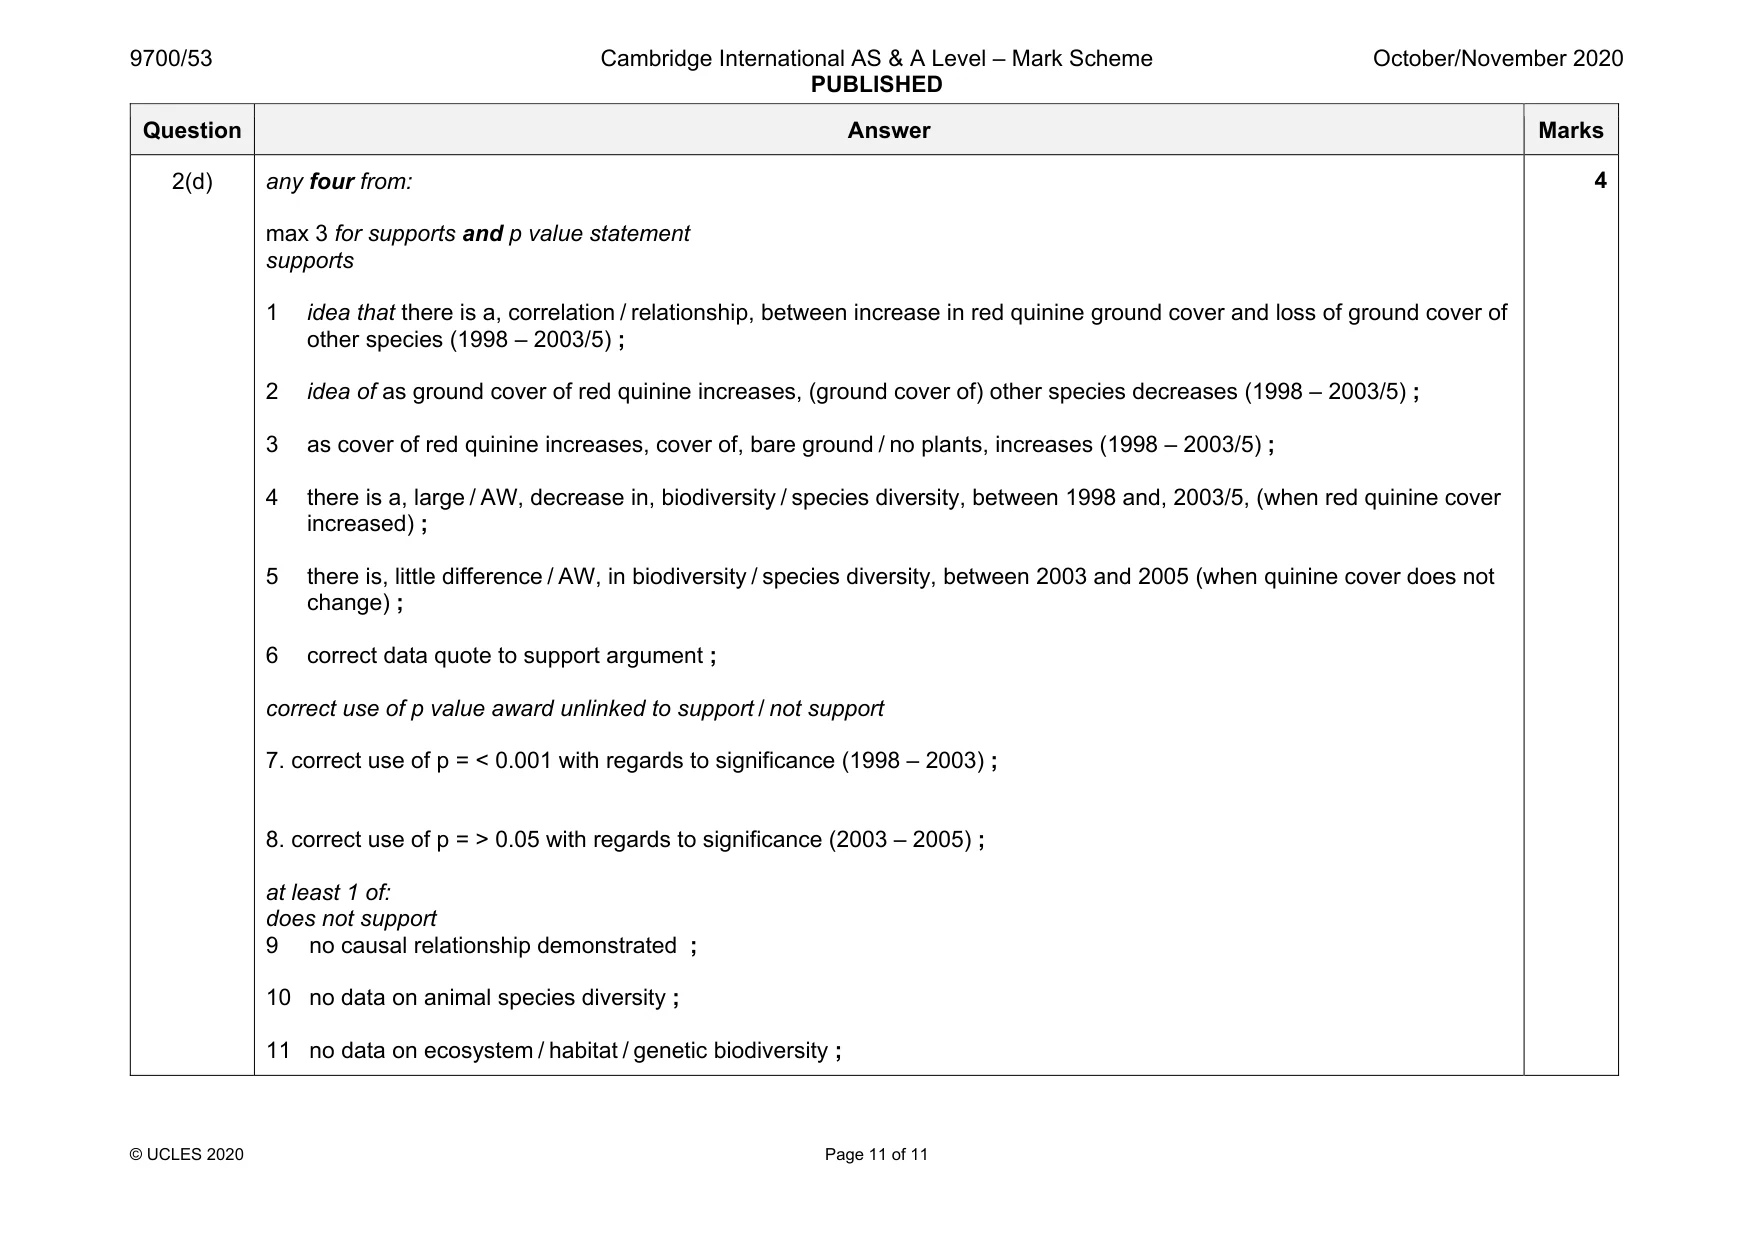
Mark scheme: 2(a)(i) any three from: 1 length of transect ; 2 sampling intervals / AW (on transect) ; 3 idea of orientation / aspect / AW of, line / transect ; 4 time of year / season / AW, (of sampling) ; 5 number of sampling points on each line / transect ; 6 size of sampling area / quadrat, (at the sampling point) ; 7 number of (line) transects ; 8 location of transect (in study area) / AW ; 2(a)(ii) idea of use of, random numbers / coordinates ; 1 2(b) (identify all the plant species present and) count, number of individuals / population, of each (plant) species (n) ; 1 2(c) 185.7 / 186 ( %) ; 1 Question Answer Marks 2(d) any four from: max 3 for supports and p value statement supports 1 idea that there is a, correlation / relationship, between increase in red quinine ground cover and loss of ground cover of other species (1998 – 2003/5) ; 2 idea of as ground cover of red quinine increases, (ground cover of) other species decreases (1998 – 2003/5) ; 3 as cover of red quinine increases, cover of, bare ground / no plants, increases (1998 – 2003/5) ; 4 there is a, large / AW, decrease in, biodiversity / species diversity, between 1998 and, 2003/5, (when red quinine cover increased) ; 5 there is, little difference / AW, in biodiversity / species diversity, between 2003 and 2005 (when quinine cover does not change) ; 6 correct data quote to support argument ; correct use of p value award unlinked to support / not support 7. correct use of p = < 0.001 with regards to significance (1998 – 2003) ; 8. correct use of p = > 0.05 with regards to significance (2003 – 2005) ; at least 1 of: does not support 9 no causal relationship demonstrated ; 10 no data on animal species diversity ; 11 no data on ecosystem / habitat / genetic biodiversity ; 4
What was in this paper
The subtopics covered by these 2 questions, and how many questions each got. Open one in a new tab to see every Cambridge question on it.
What you needed in this session
Cambridge’s own grade thresholds for 2020 Oct/Nov, Paper 5 · Variant 3. A higher threshold means an easier paper — the bar moves with how the cohort did.