Cambridge A Level Biology 9700 — 2020 Feb/March Paper 4 · Variant 2
9700/42/F/M/20 · 10 questions · 100 marks · ≈113 min
The question paper and its mark scheme, free to read here and free to download. This is Cambridge’s own paper, exactly as it was sat.
Question paper28 pages







Mark scheme23 pages
Answers below. Sit the paper first if you are practising.
Questions as text
Q1 · Part of the wall of a proximal convoluted tubule (pct) in a kidney nephron
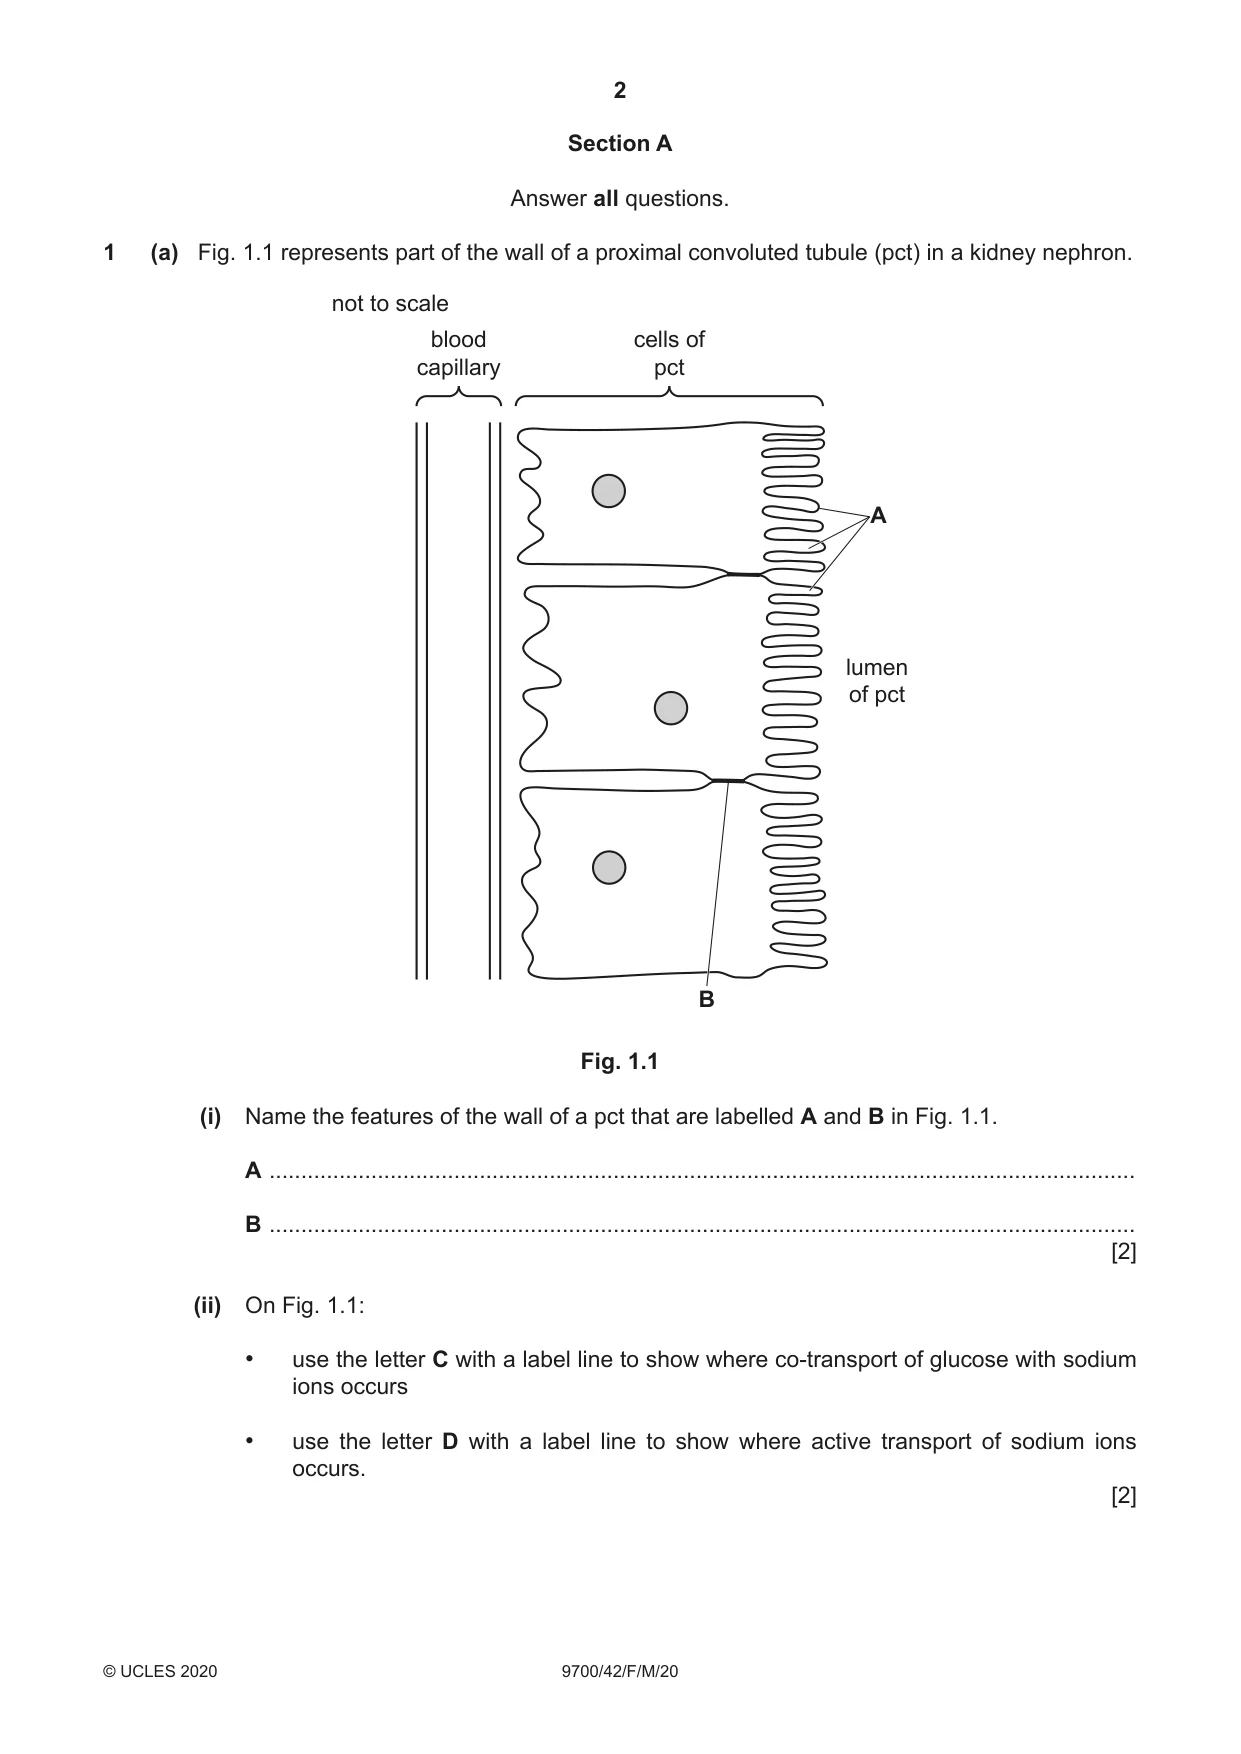
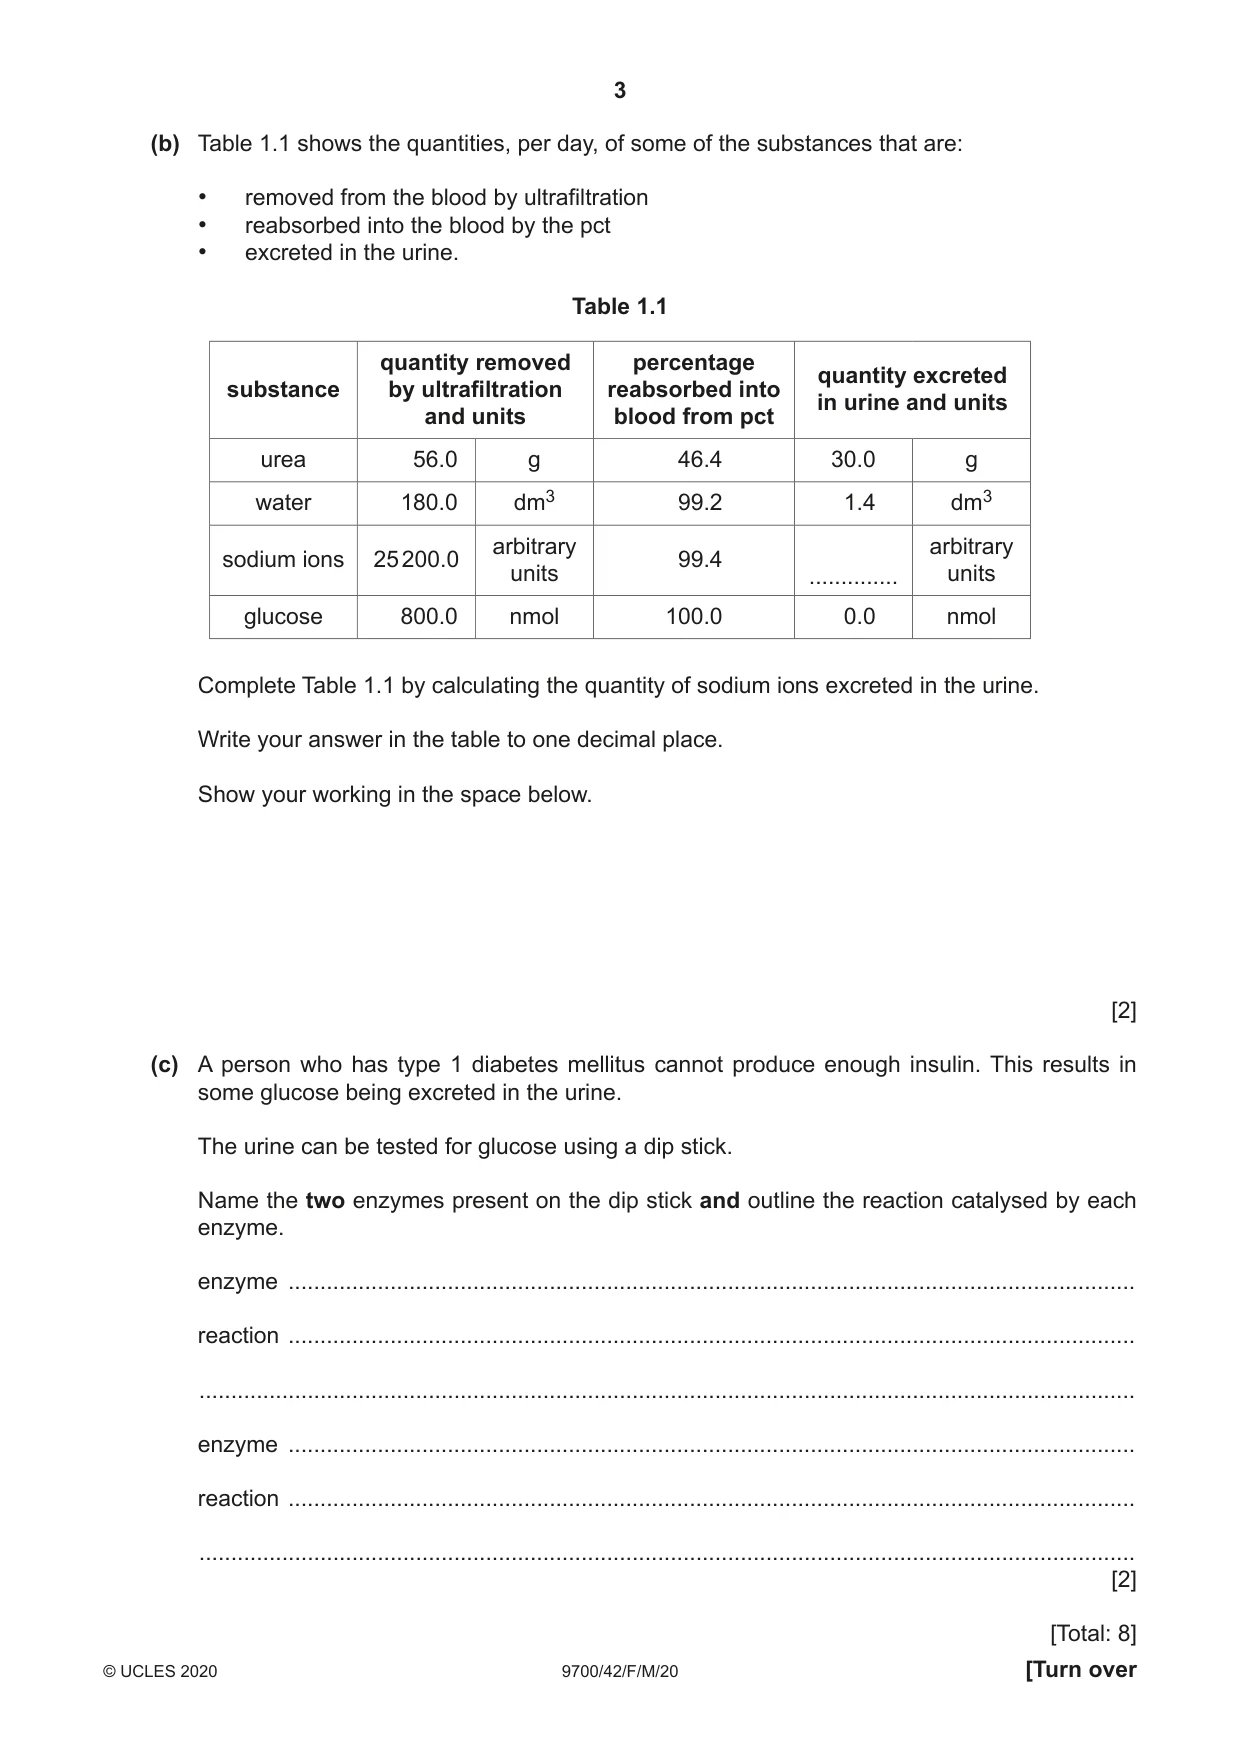
1 (a) Fig. 1.1 represents part of the wall of a proximal convoluted tubule (pct) in a kidney nephron. not to scale blood cells of capillary pct A lumen of pct B Fig. 1.1 (i) Name the features of the wall of a pct that are labelled A and B in Fig. 1.1. A ........................................................................................................................................ B ........................................................................................................................................ [2] (ii) On Fig. 1.1: • use the letter C with a label line to show where co-transport of glucose with sodium ions occurs • use the letter D with a label line to show where active transport of sodium ions occurs. [2] (b) Table 1.1 shows the quantities, per day, of some of the substances that are: • removed from the blood by ultrafiltration • reabsorbed into the blood by the pct • excreted in the urine. Table 1.1 quantity removed percentage quantity excreted substance by ultrafiltration reabsorbed into in urine and units and units blood from pct urea 56.0 g 46.4 30.0 g water 180.0 dm3 99.2 1.4 dm3 arbitrary arbitrary sodium ions 25 200.0 99.4 units .............. units glucose 800.0 nmol 100.0 0.0 nmol Complete Table 1.1 by calculating the quantity of sodium ions excreted in the urine. Write your answer in the table to one decimal place. Show your working in the space below. [2] (c) A person who has type 1 diabetes mellitus cannot produce enough insulin. This results in some glucose being excreted in the urine. The urine can be tested for glucose using a dip stick. Name the two enzymes present on the dip stick and outline the reaction catalysed by each enzyme. enzyme ..................................................................................................................................... reaction ..................................................................................................................................... ................................................................................................................................................... enzyme ..................................................................................................................................... reaction ..................................................................................................................................... ................................................................................................................................................... [2] [Total: 8]
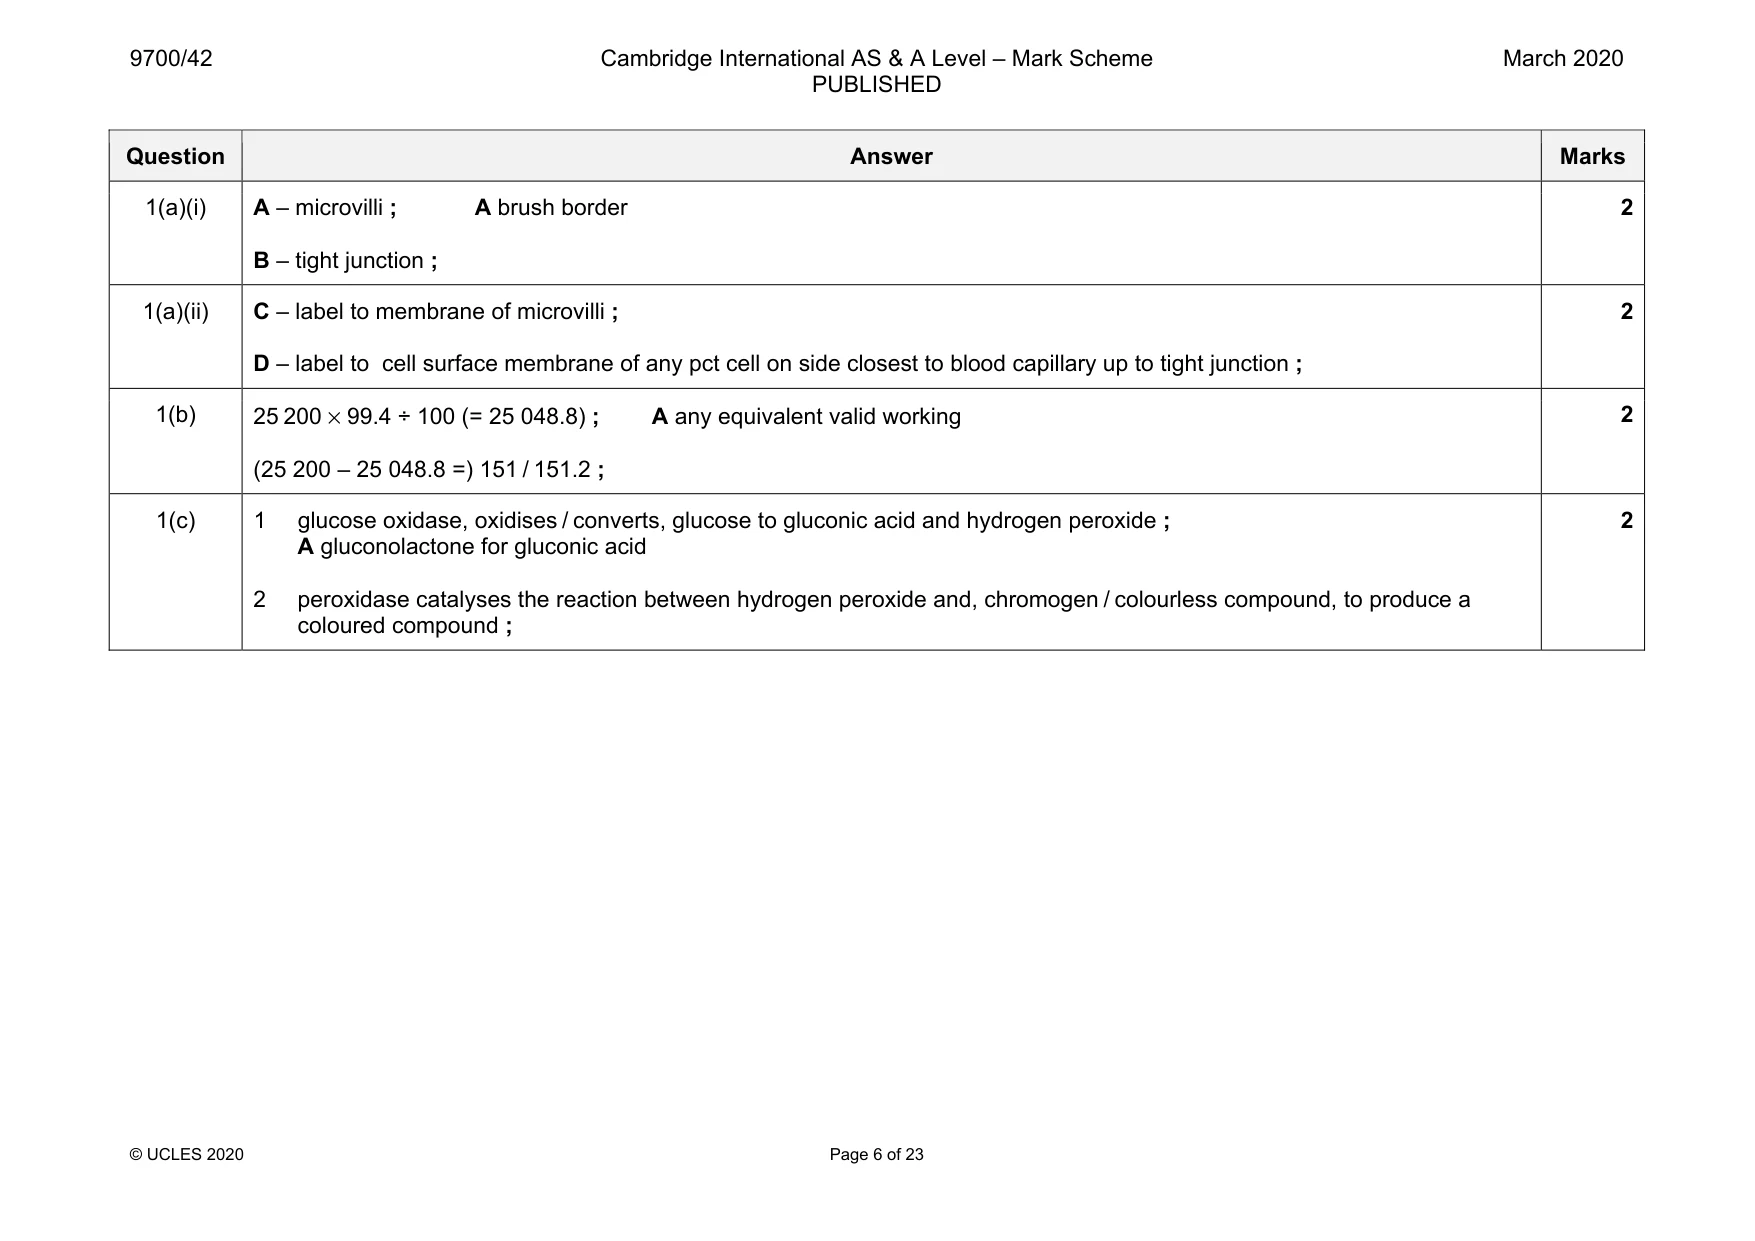
Mark scheme: 1(a)(i) A – microvilli ; A brush border B – tight junction ; 2 1(a)(ii) C – label to membrane of microvilli ; D – label to cell surface membrane of any pct cell on side closest to blood capillary up to tight junction ; 2 1(b) 25 200 × 99.4 ÷ 100 (= 25 048.8) ; A any equivalent valid working (25 200 – 25 048.8 =) 151 / 151.2 ; 2 1(c) 1 glucose oxidase, oxidises / converts, glucose to gluconic acid and hydrogen peroxide ; A gluconolactone for gluconic acid 2 peroxidase catalyses the reaction between hydrogen peroxide and, chromogen / colourless compound, to produce a coloured compound ; 2
Q2 · Severe combined immunodeficiency (SCID) is a group of life-threatening diseases
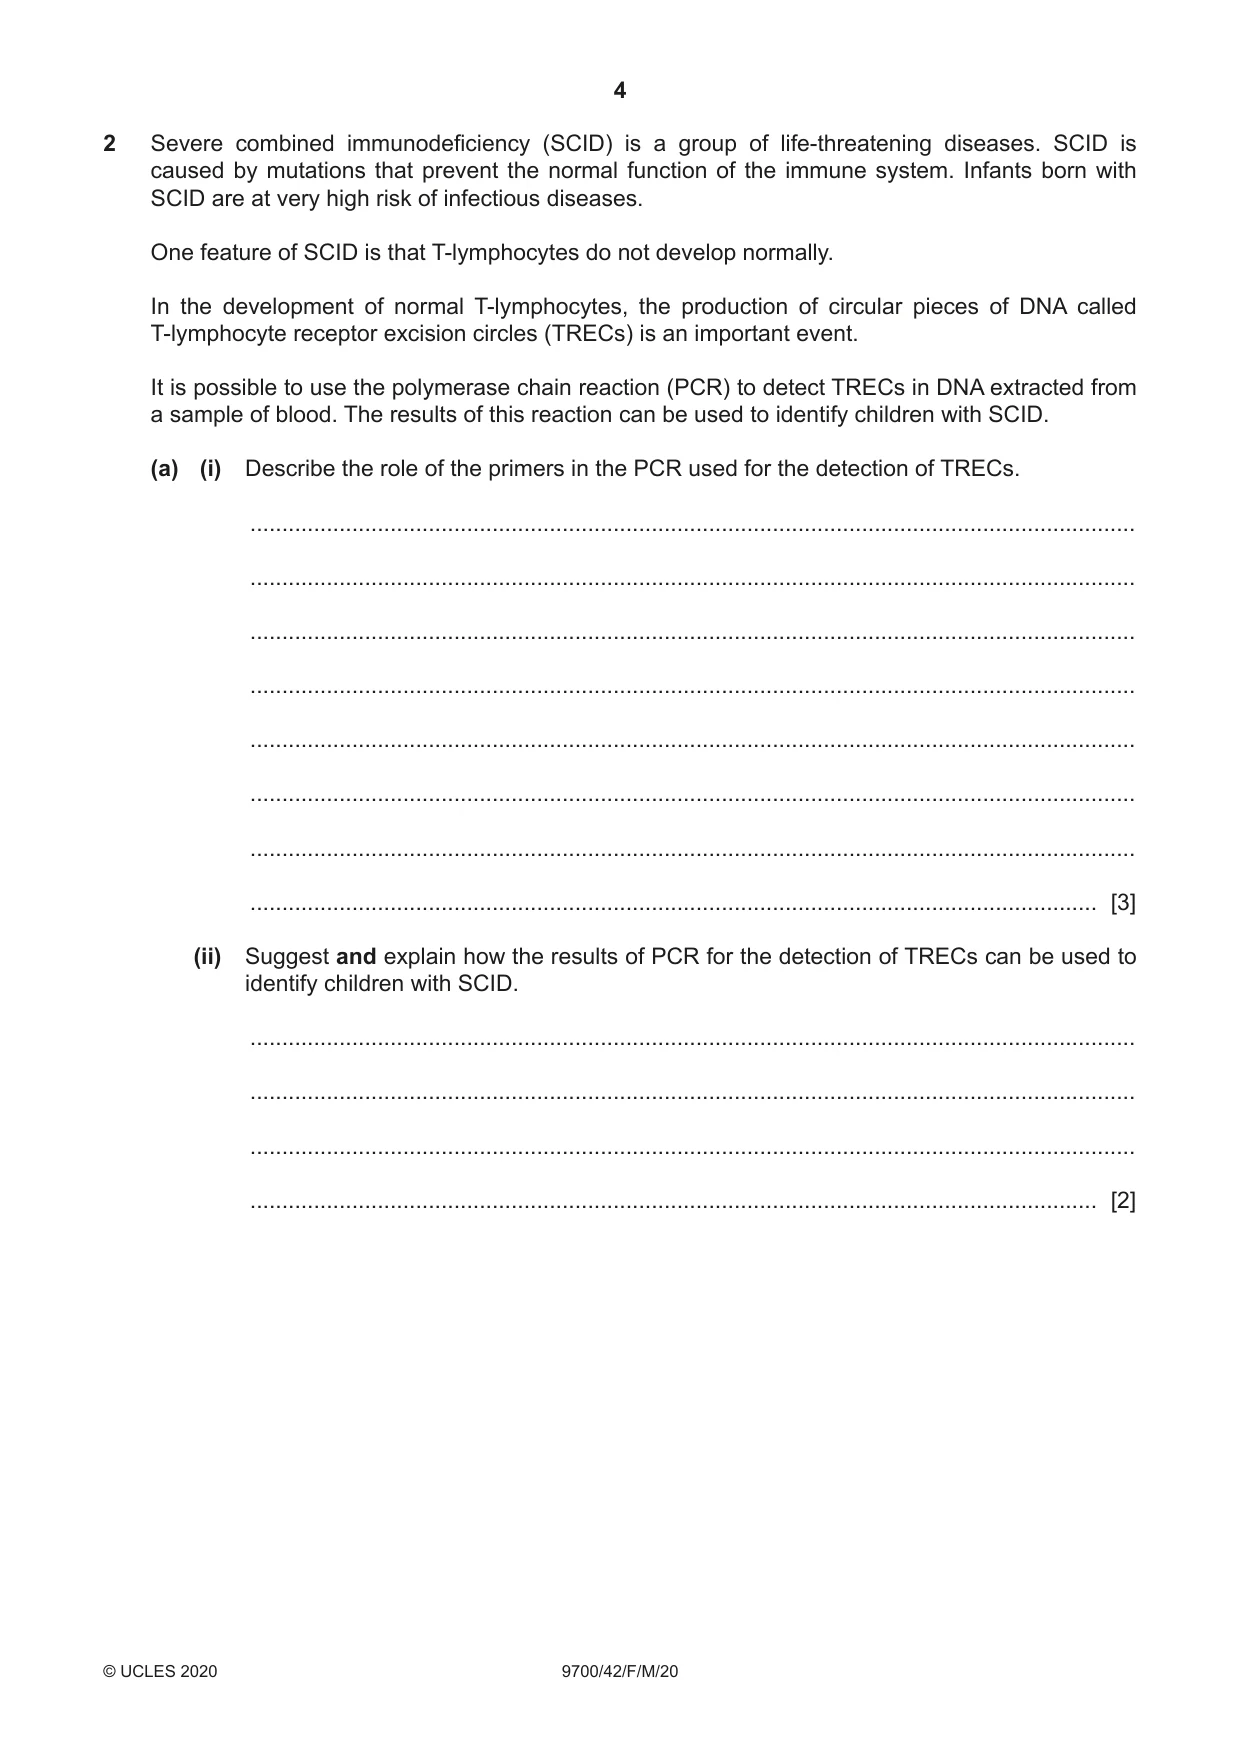
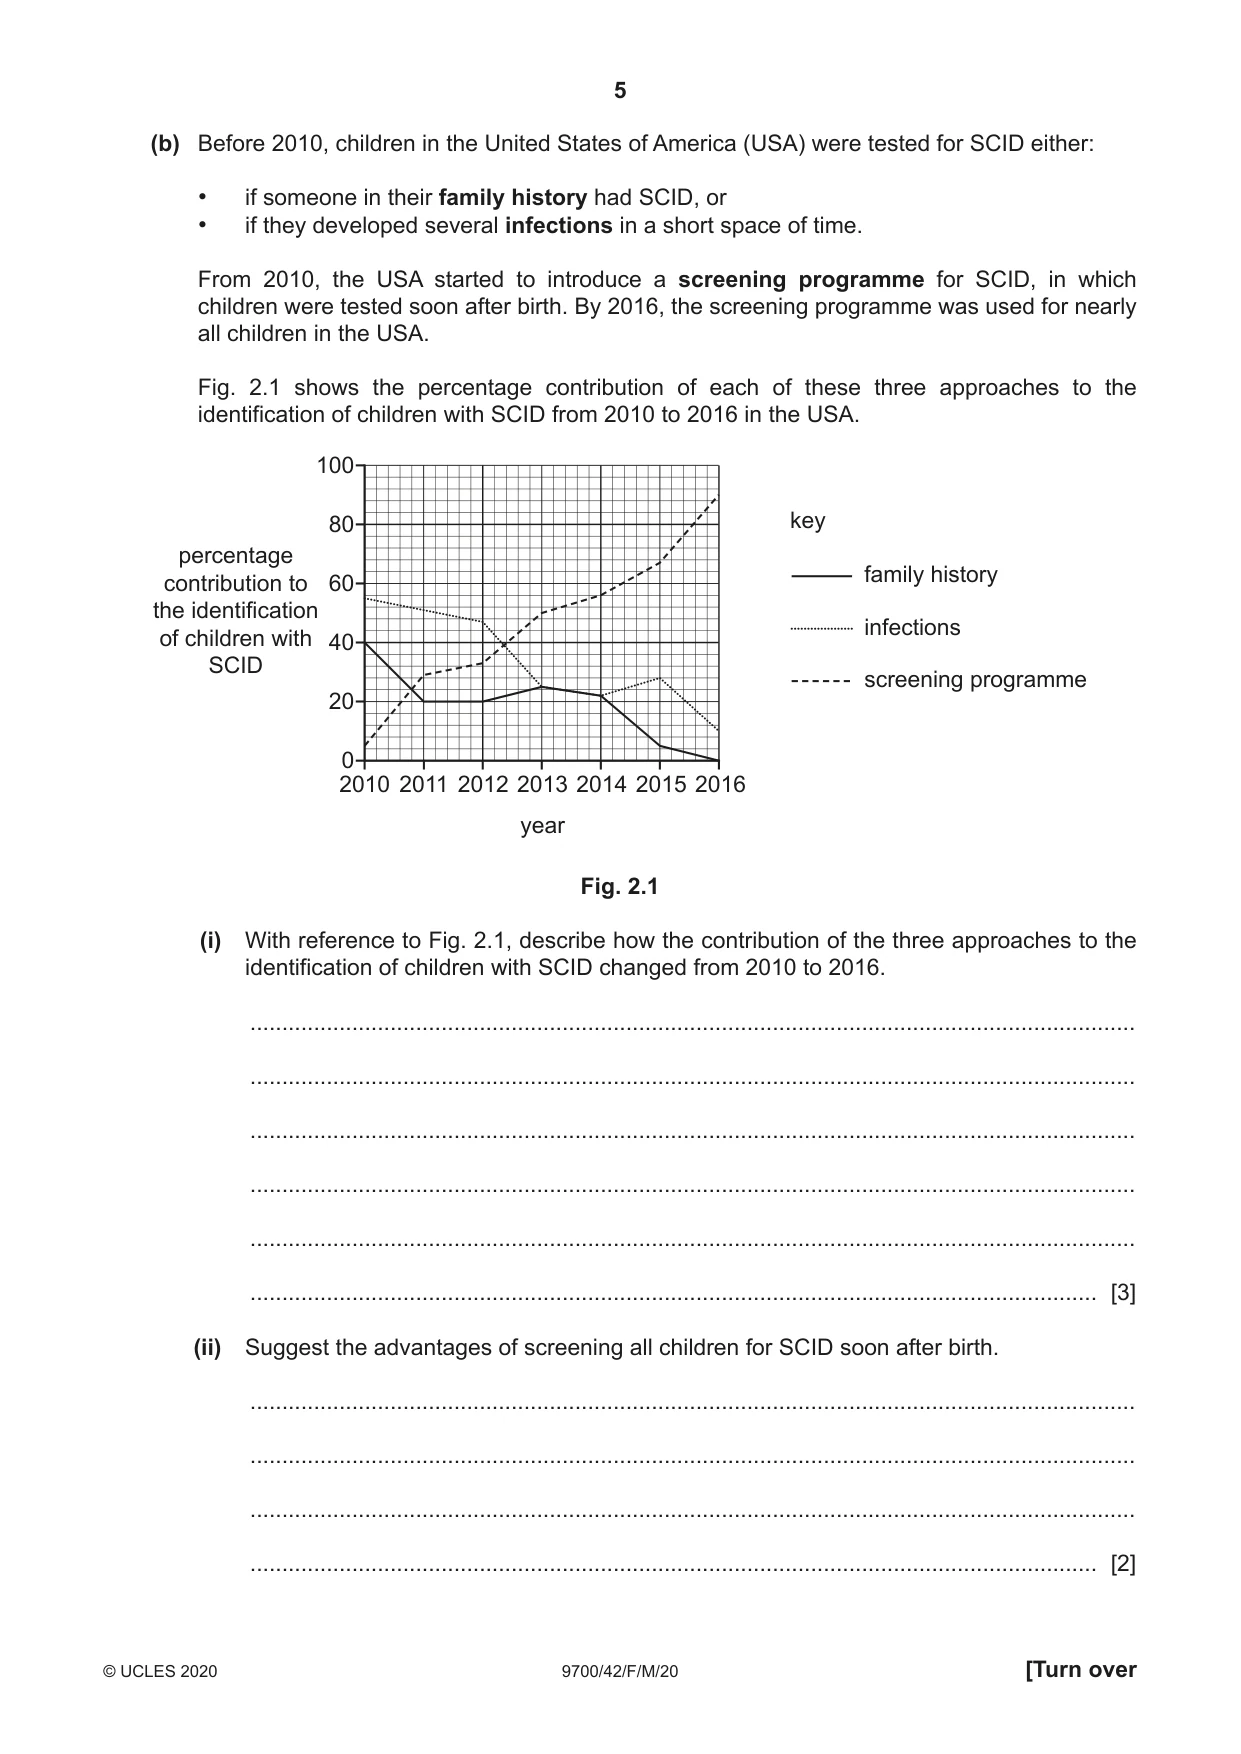
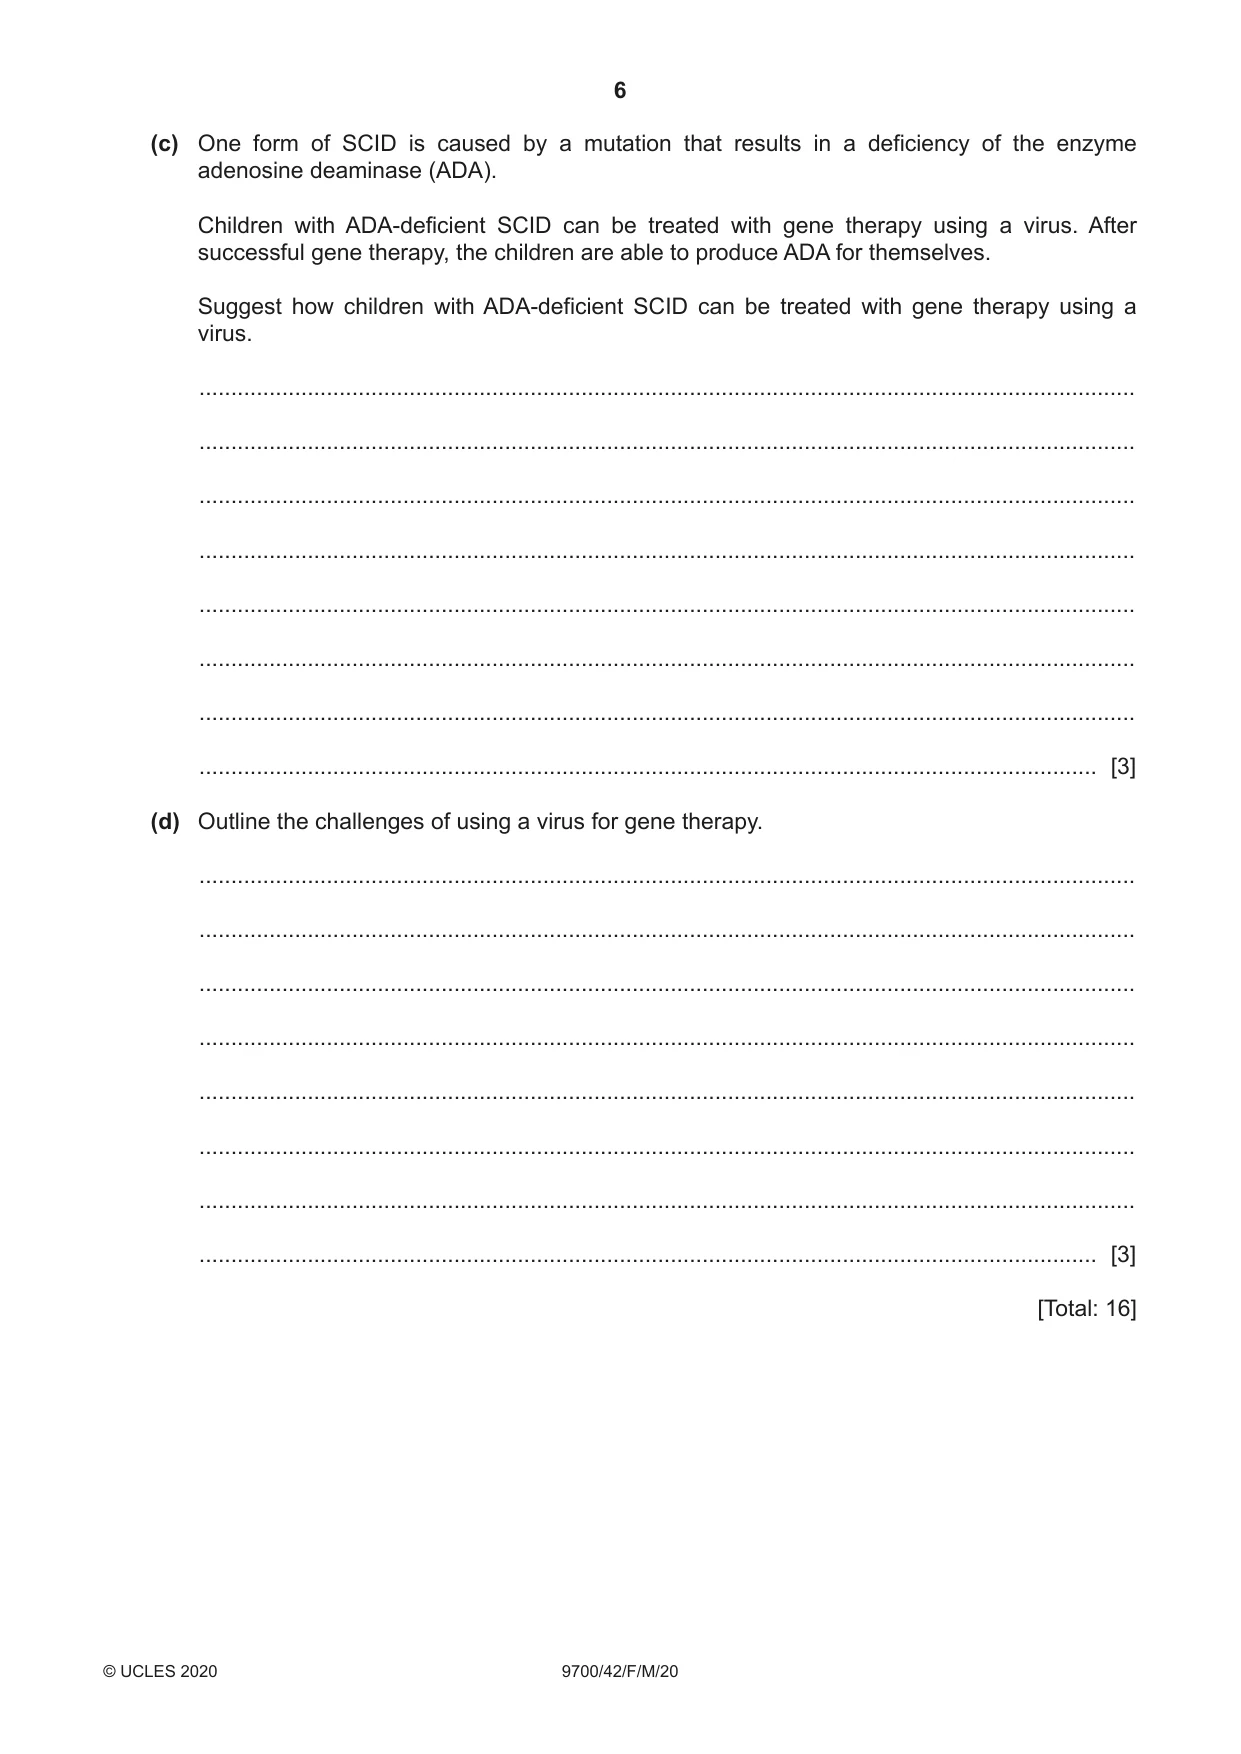
2 Severe combined immunodeficiency (SCID) is a group of life-threatening diseases. SCID is caused by mutations that prevent the normal function of the immune system. Infants born with SCID are at very high risk of infectious diseases. One feature of SCID is that T-lymphocytes do not develop normally. In the development of normal T-lymphocytes, the production of circular pieces of DNA called T-lymphocyte receptor excision circles (TRECs) is an important event. It is possible to use the polymerase chain reaction (PCR) to detect TRECs in DNA extracted from a sample of blood. The results of this reaction can be used to identify children with SCID. (a) (i) Describe the role of the primers in the PCR used for the detection of TRECs. ........................................................................................................................................... ........................................................................................................................................... ........................................................................................................................................... ........................................................................................................................................... ........................................................................................................................................... ........................................................................................................................................... ........................................................................................................................................... ..................................................................................................................................... [3] (ii) Suggest and explain how the results of PCR for the detection of TRECs can be used to identify children with SCID. ........................................................................................................................................... ........................................................................................................................................... ........................................................................................................................................... ..................................................................................................................................... [2] (b) Before 2010, children in the United States of America (USA) were tested for SCID either: • if someone in their family history had SCID, or • if they developed several infections in a short space of time. From 2010, the USA started to introduce a screening programme for SCID, in which children were tested soon after birth. By 2016, the screening programme was used for nearly all children in the USA. Fig. 2.1 shows the percentage contribution of each of these three approaches to the identification of children with SCID from 2010 to 2016 in the USA. 100 80 key percentage family history contribution to 60 the identification infections of children with 40 SCID screening programme 20 0 2010 2011 2012 2013 2014 2015 2016 year Fig. 2.1 (i) With reference to Fig. 2.1, describe how the contribution of the three approaches to the identification of children with SCID changed from 2010 to 2016. ........................................................................................................................................... ........................................................................................................................................... ........................................................................................................................................... ........................................................................................................................................... ........................................................................................................................................... ..................................................................................................................................... [3] (ii) Suggest the advantages of screening all children for SCID soon after birth. ........................................................................................................................................... ........................................................................................................................................... ........................................................................................................................................... ..................................................................................................................................... [2] (c) One form of SCID is caused by a mutation that results in a deficiency of the enzyme adenosine deaminase (ADA). Children with ADA-deficient SCID can be treated with gene therapy using a virus. After successful gene therapy, the children are able to produce ADA for themselves. Suggest how children with ADA-deficient SCID can be treated with gene therapy using a virus. ................................................................................................................................................... ................................................................................................................................................... ................................................................................................................................................... ................................................................................................................................................... ................................................................................................................................................... ................................................................................................................................................... ................................................................................................................................................... ............................................................................................................................................. [3] (d) Outline the challenges of using a virus for gene therapy. ................................................................................................................................................... ................................................................................................................................................... ................................................................................................................................................... ................................................................................................................................................... ................................................................................................................................................... ................................................................................................................................................... ................................................................................................................................................... ............................................................................................................................................. [3] [Total: 16] Question 3 starts on page 8
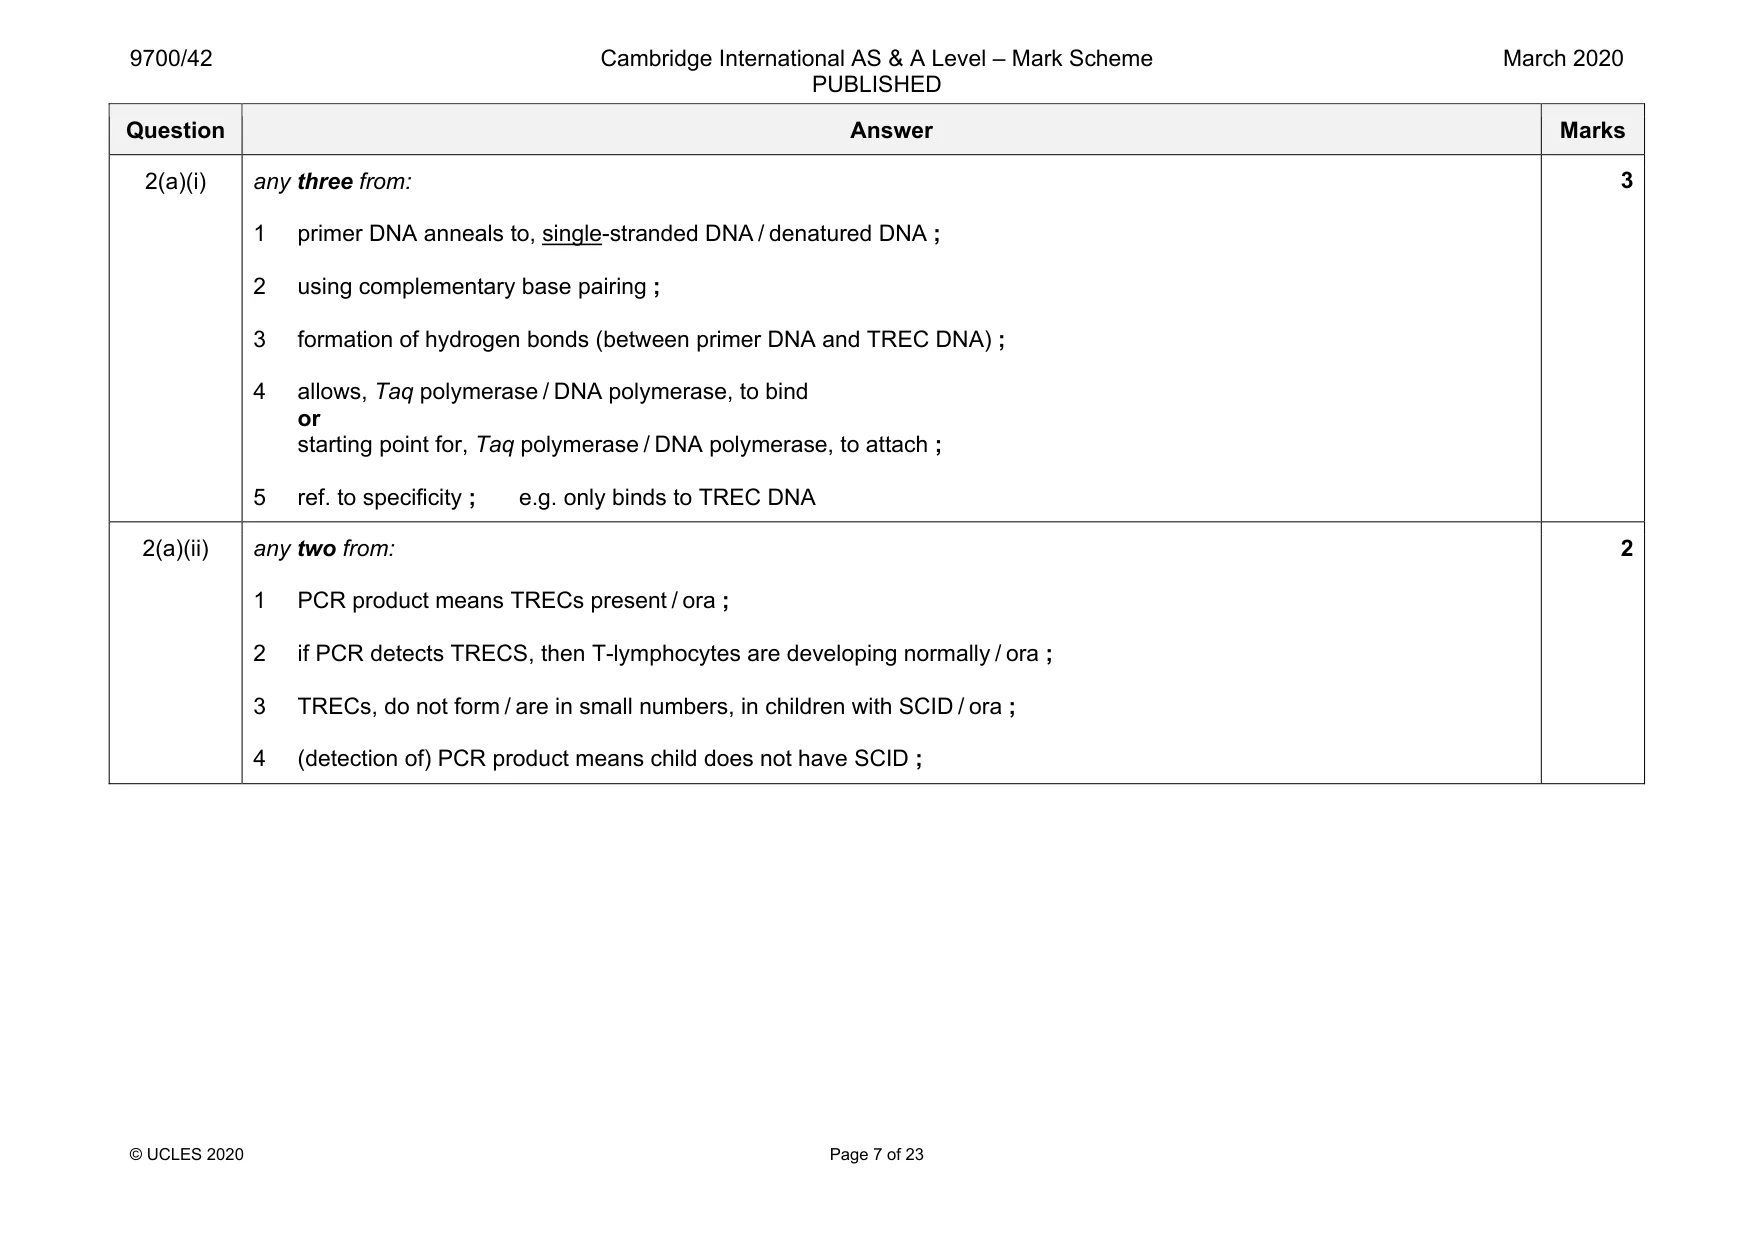
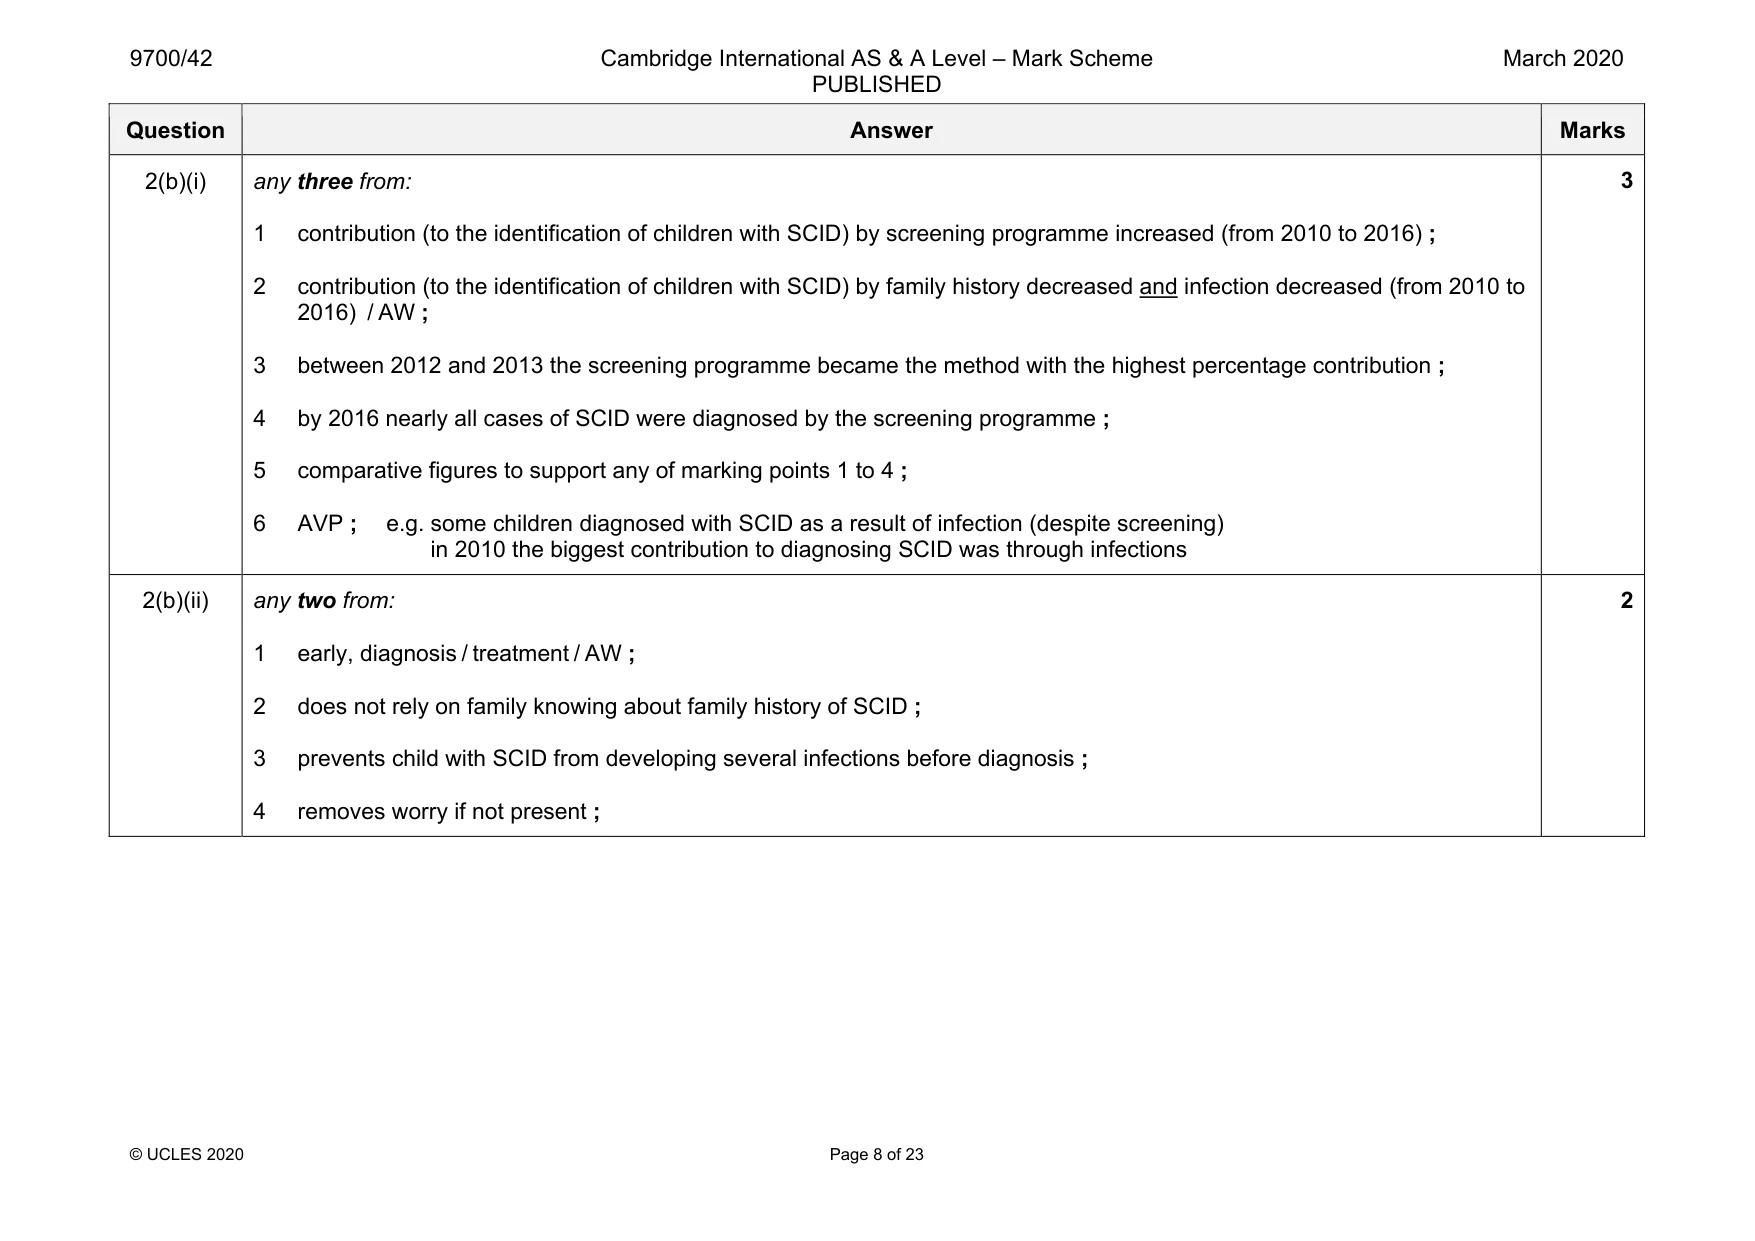
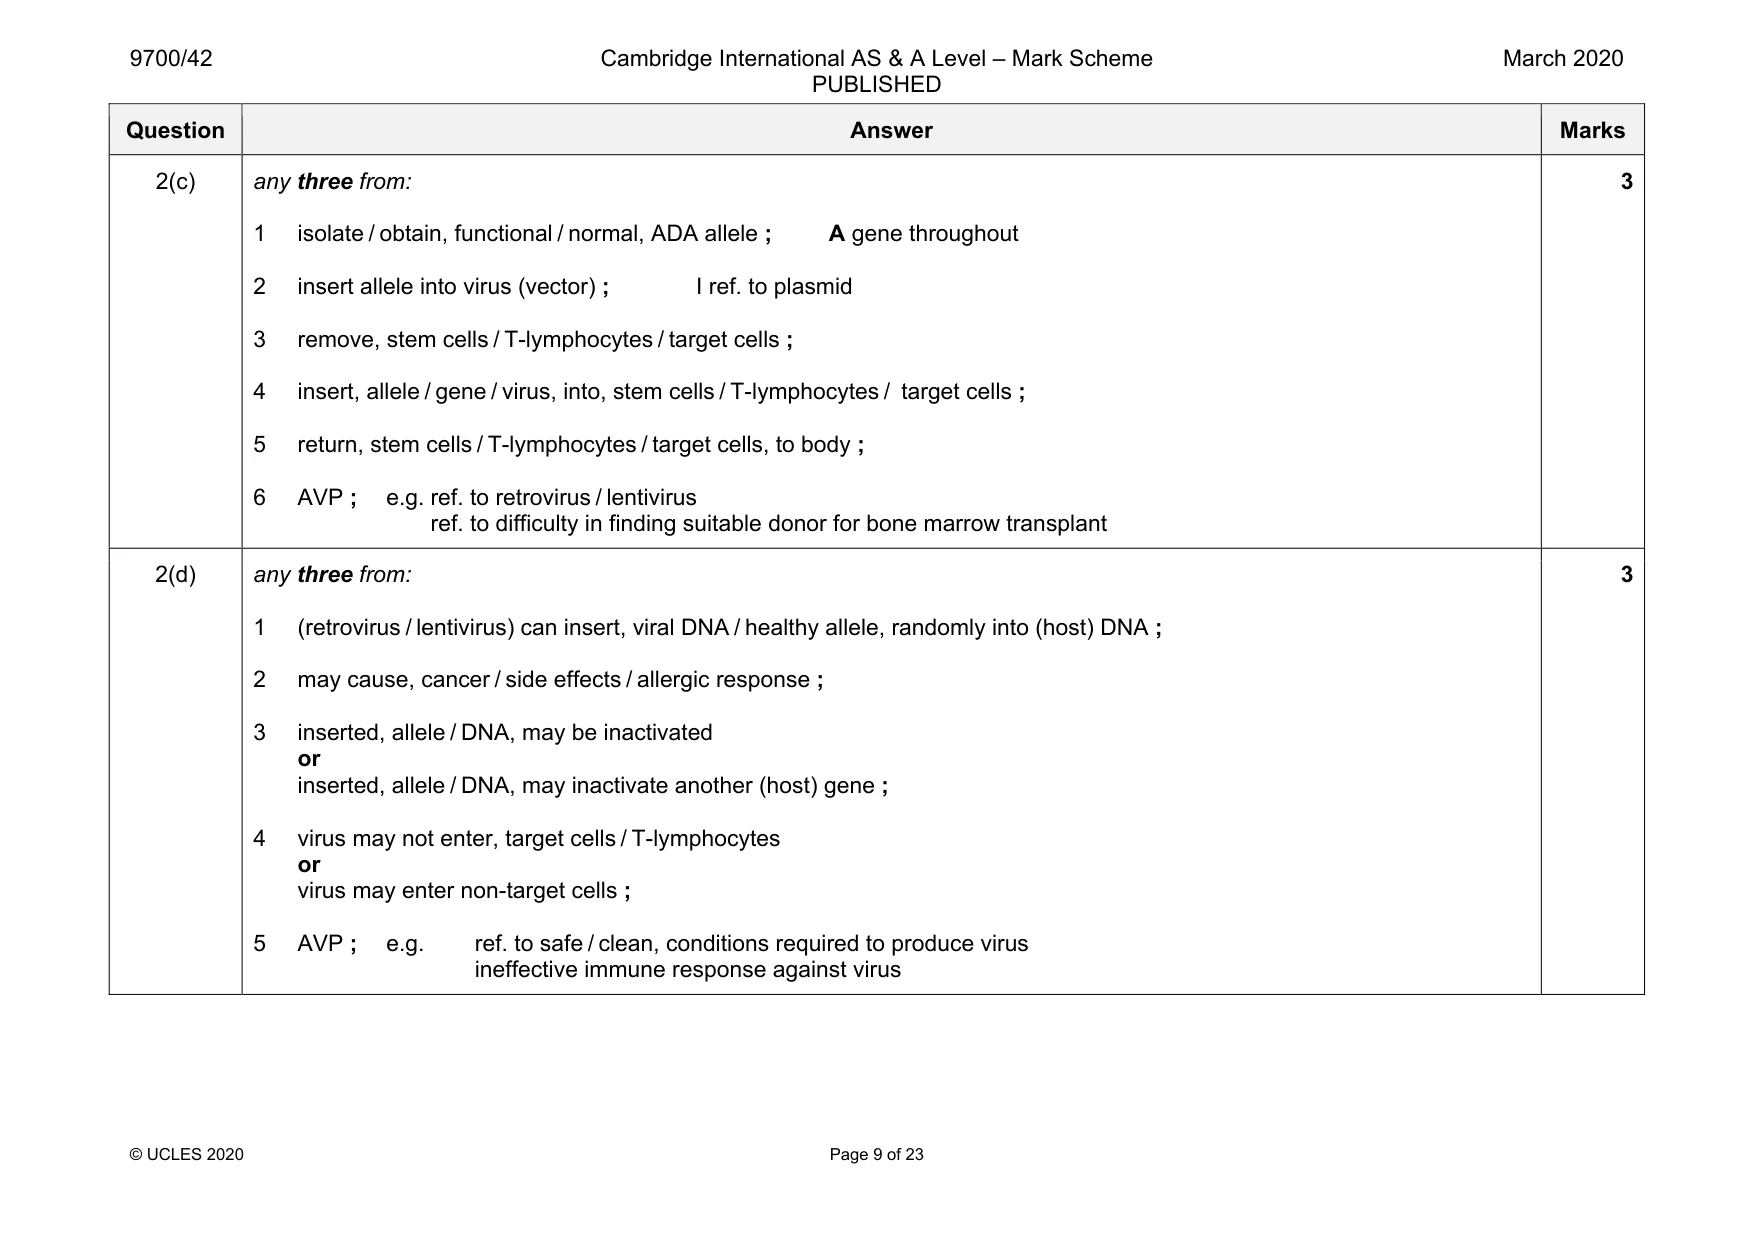
Mark scheme: 2(a)(i) any three from: 1 primer DNA anneals to, single-stranded DNA / denatured DNA ; 2 using complementary base pairing ; 3 formation of hydrogen bonds (between primer DNA and TREC DNA) ; 4 allows, Taq polymerase / DNA polymerase, to bind or starting point for, Taq polymerase / DNA polymerase, to attach ; 5 ref. to specificity ; e.g. only binds to TREC DNA 2(a)(ii) any two from: 1 PCR product means TRECs present / ora ; 2 if PCR detects TRECS, then T-lymphocytes are developing normally / ora ; 3 TRECs, do not form / are in small numbers, in children with SCID / ora ; 4 (detection of) PCR product means child does not have SCID ; 2 Question Answer Marks 2(b)(i) any three from: 1 contribution (to the identification of children with SCID) by screening programme increased (from 2010 to 2016) ; 2 contribution (to the identification of children with SCID) by family history decreased and infection decreased (from 2010 to 2016) / AW ; 3 between 2012 and 2013 the screening programme became the method with the highest percentage contribution ; 4 by 2016 nearly all cases of SCID were diagnosed by the screening programme ; 5 comparative figures to support any of marking points 1 to 4 ; 6 AVP ; e.g. some children diagnosed with SCID as a result of infection (despite screening) in 2010 the biggest contribution to diagnosing SCID was through infections 3 2(b)(ii) any two from: 1 early, diagnosis / treatment / AW ; 2 does not rely on family knowing about family history of SCID ; 3 prevents child with SCID from developing several infections before diagnosis ; 4 removes worry if not present ; 2 Question Answer Marks 2(c) any three from: 1 isolate / obtain, functional / normal, ADA allele ; A gene throughout 2 insert allele into virus (vector) ; I ref. to plasmid 3 remove, stem cells / T-lymphocytes / target cells ; 4 insert, allele / gene / virus, into, stem cells / T-lymphocytes / target cells ; 5 return, stem cells / T-lymphocytes / target cells, to body ; 6 AVP ; e.g. ref. to retrovirus / lentivirus ref. to difficulty in finding suitable donor for bone marrow transplant 3 2(d) any three from: 1 (retrovirus / lentivirus) can insert, viral DNA / healthy allele, randomly into (host) DNA ; 2 may cause, cancer / side effects / allergic response ; 3 inserted, allele / DNA, may be inactivated or inserted, allele / DNA, may inactivate another (host) gene ; 4 virus may not enter, target cells / T-lymphocytes or virus may enter non-target cells ; 5 AVP ; e.g. ref. to safe / clean, conditions required to produce virus ineffective immune response against virus 3
Q3 · Flowers of the common morning-glory plant, Ipomoea purpurea, can have several different…
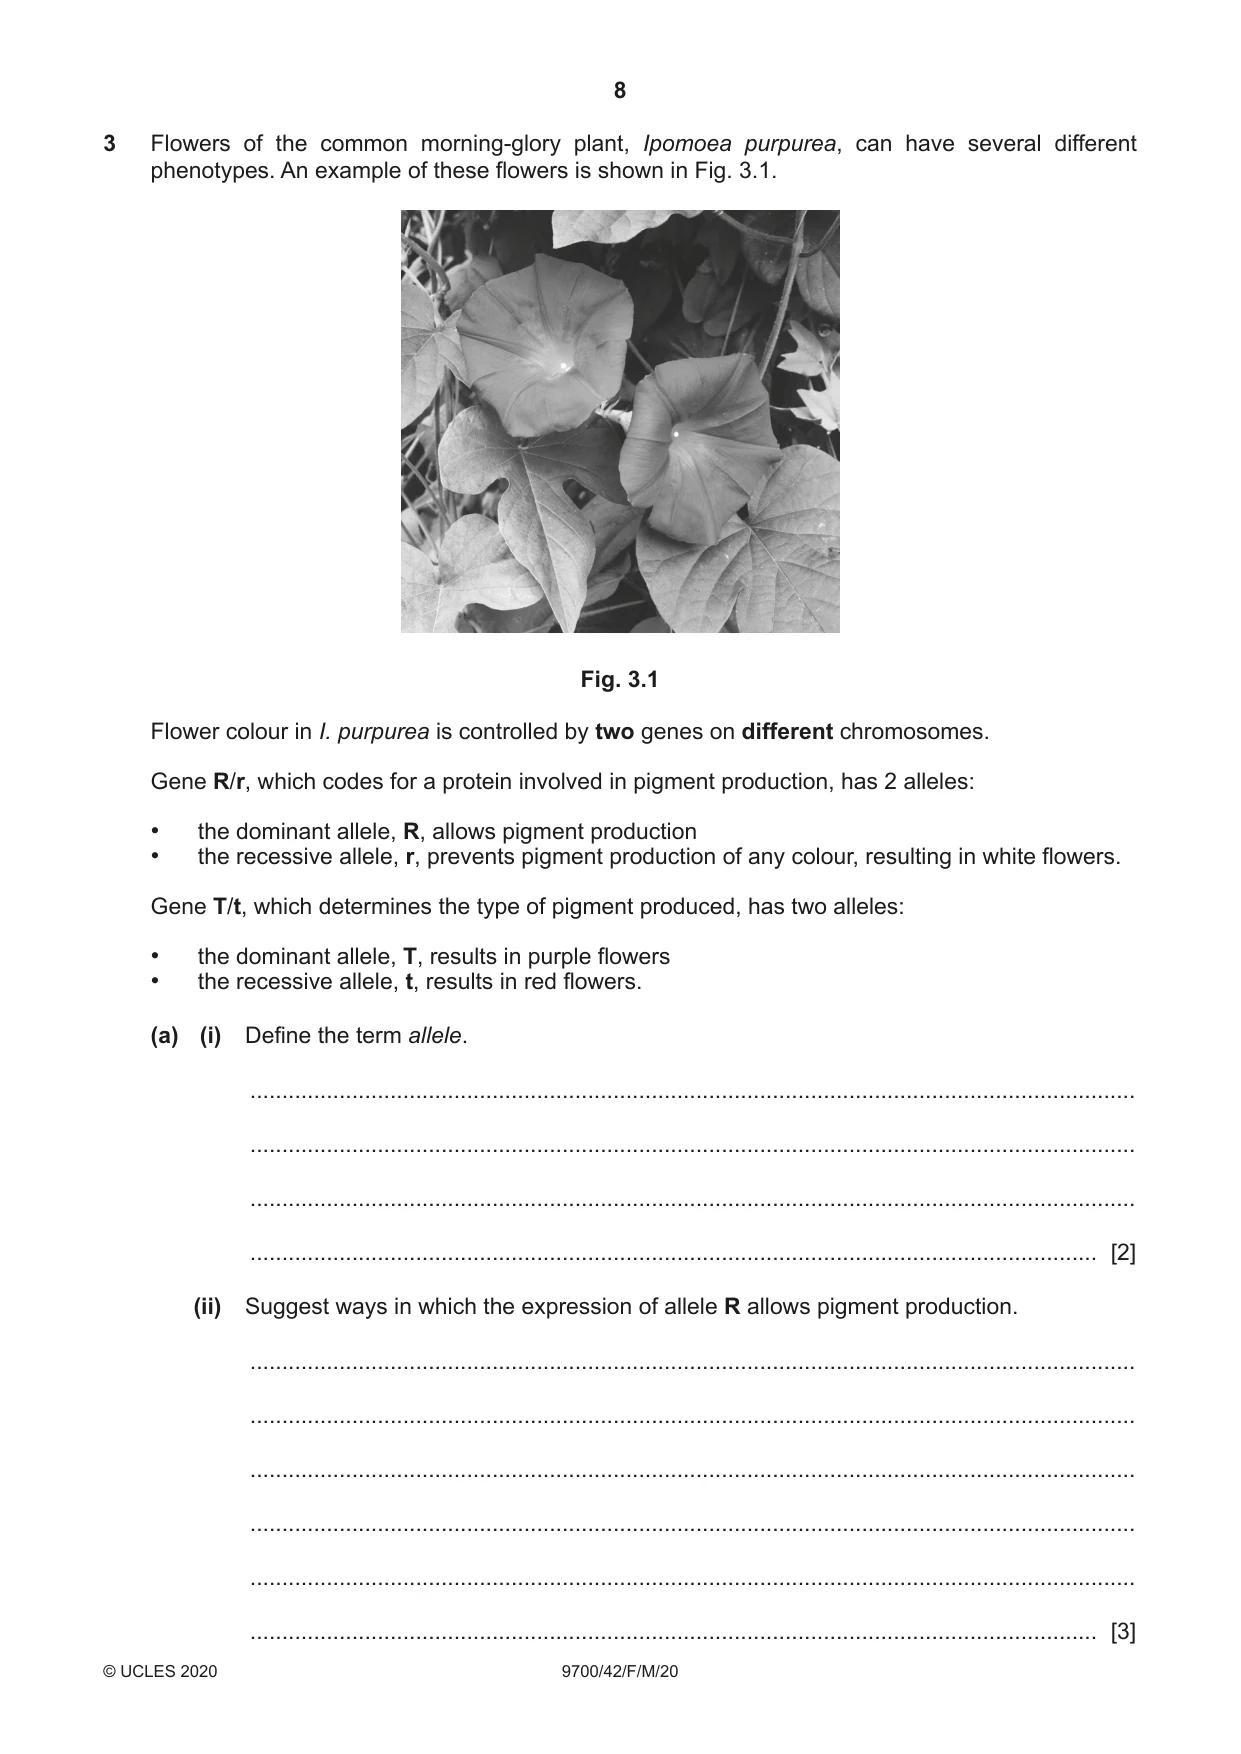
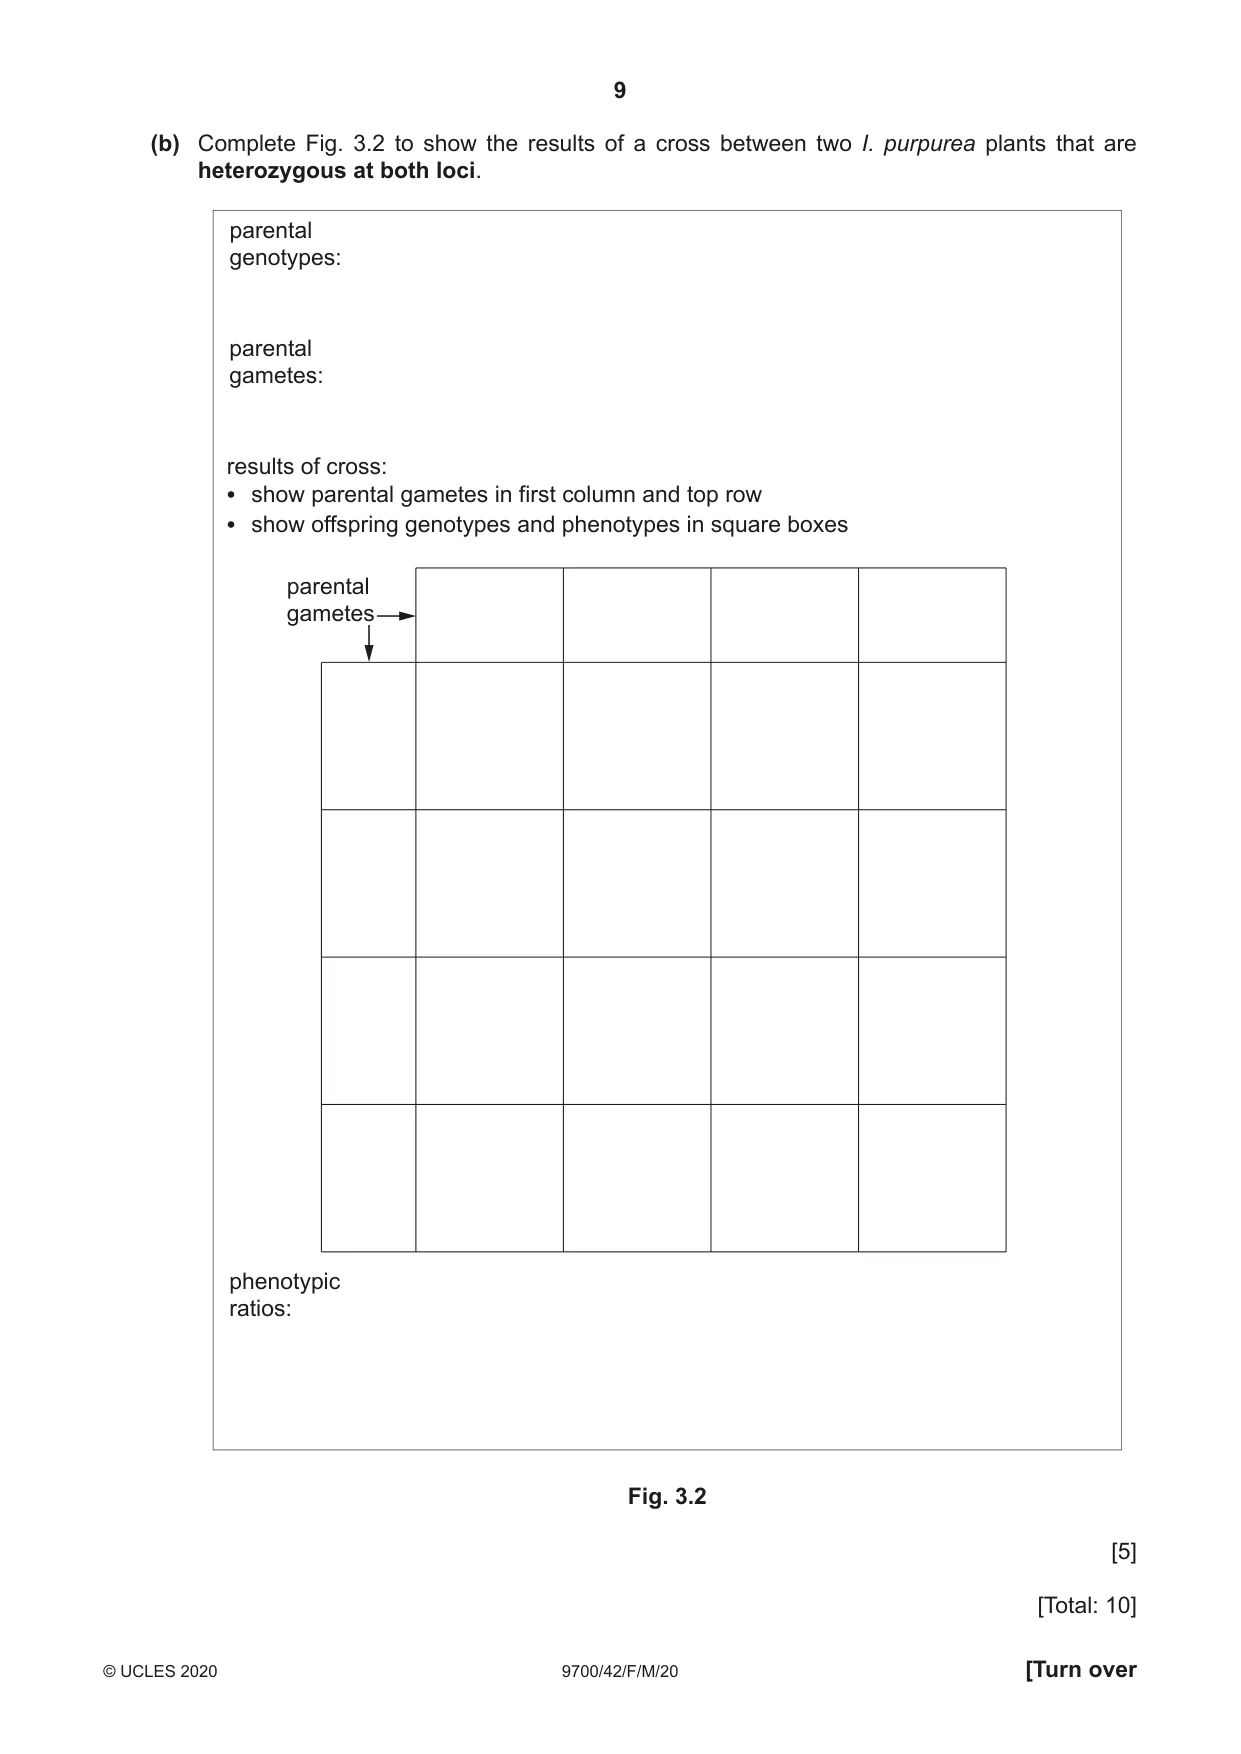
3 Flowers of the common morning-glory plant, Ipomoea purpurea, can have several different phenotypes. An example of these flowers is shown in Fig. 3.1. Fig. 3.1 Flower colour in I. purpurea is controlled by two genes on different chromosomes. Gene R/r, which codes for a protein involved in pigment production, has 2 alleles: • the dominant allele, R, allows pigment production • the recessive allele, r, prevents pigment production of any colour, resulting in white flowers. Gene T/t, which determines the type of pigment produced, has two alleles: • the dominant allele, T, results in purple flowers • the recessive allele, t, results in red flowers. (a) (i) Define the term allele. ........................................................................................................................................... ........................................................................................................................................... ........................................................................................................................................... ..................................................................................................................................... [2] (ii) Suggest ways in which the expression of allele R allows pigment production. ........................................................................................................................................... ........................................................................................................................................... ........................................................................................................................................... ........................................................................................................................................... ........................................................................................................................................... ..................................................................................................................................... [3] (b) Complete Fig. 3.2 to show the results of a cross between two I. purpurea plants that are heterozygous at both loci. parental genotypes: parental gametes: results of cross: • show parental gametes in first column and top row • show offspring genotypes and phenotypes in square boxes parental gametes phenotypic ratios: Fig. 3.2 [5] [Total: 10]
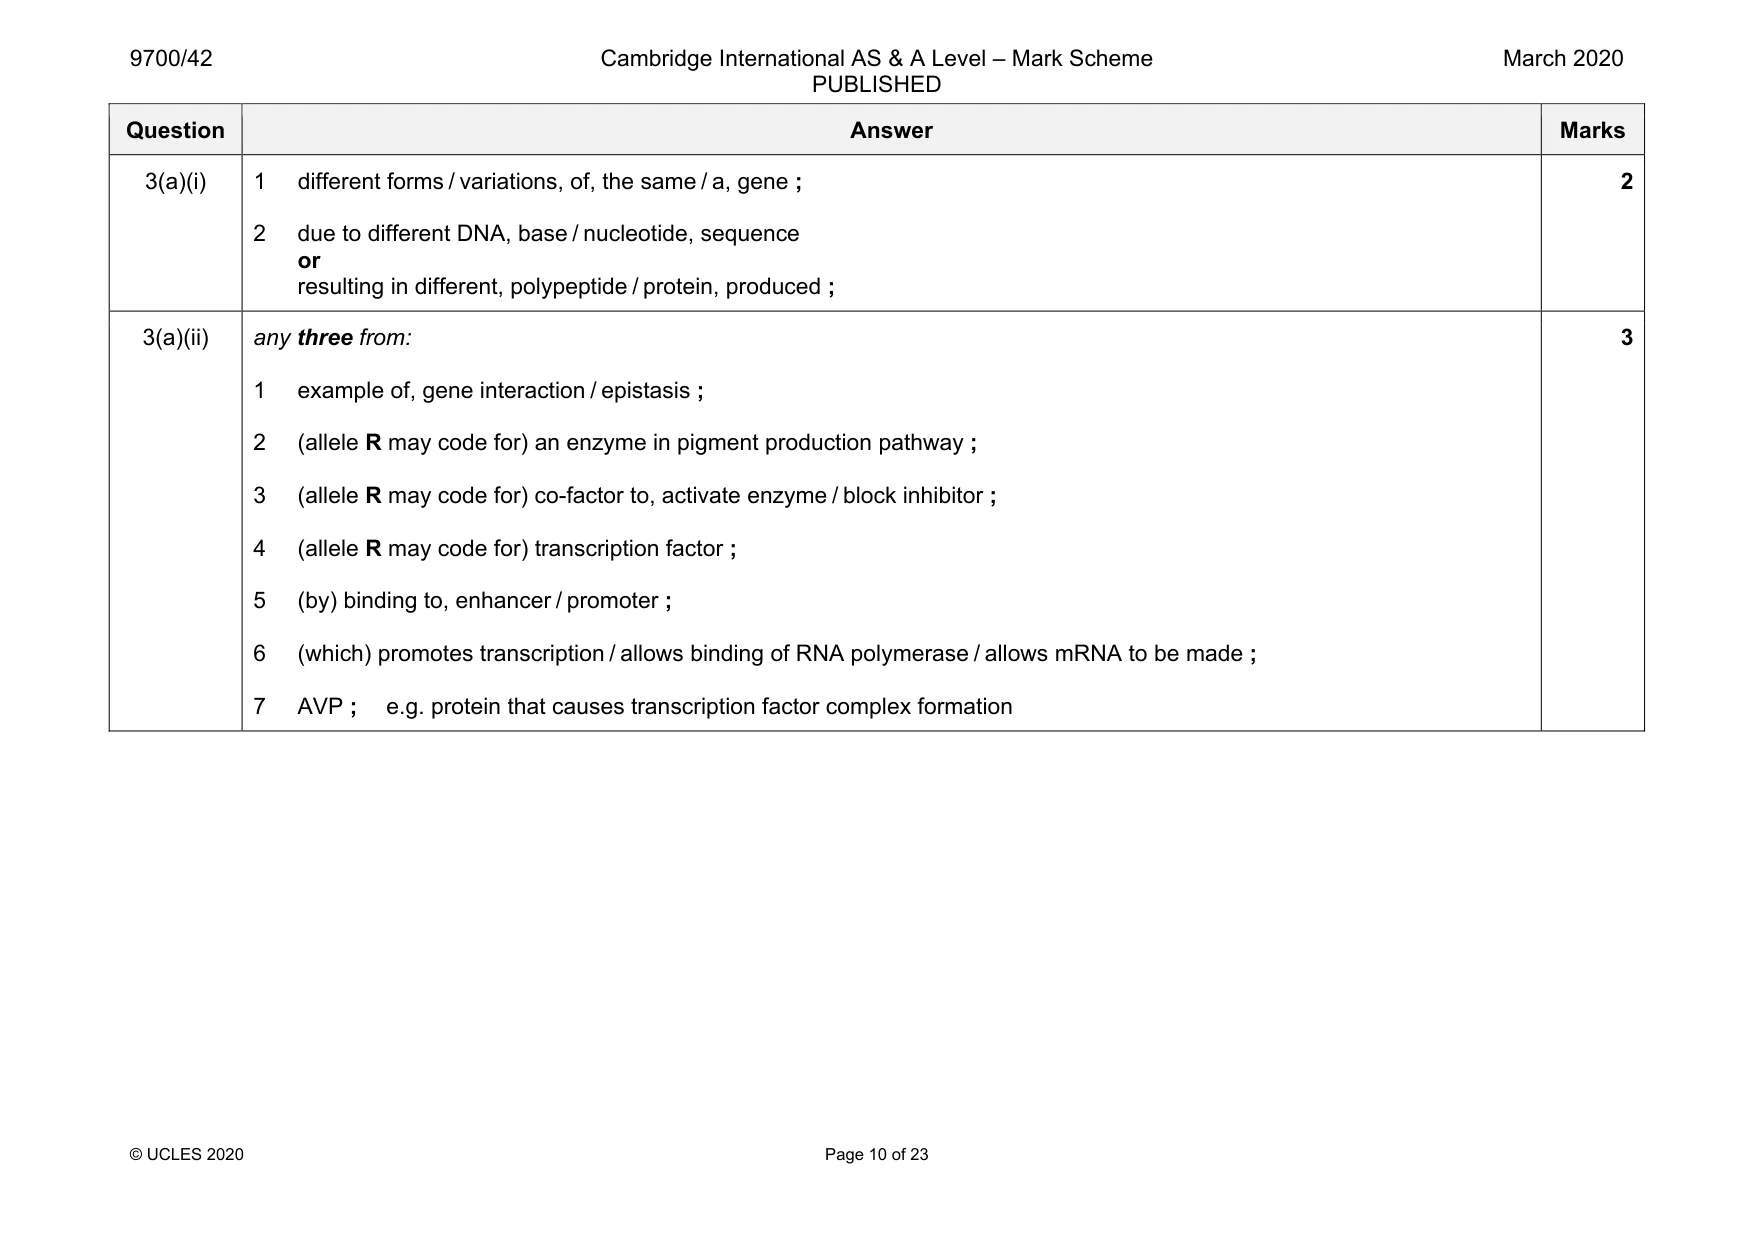
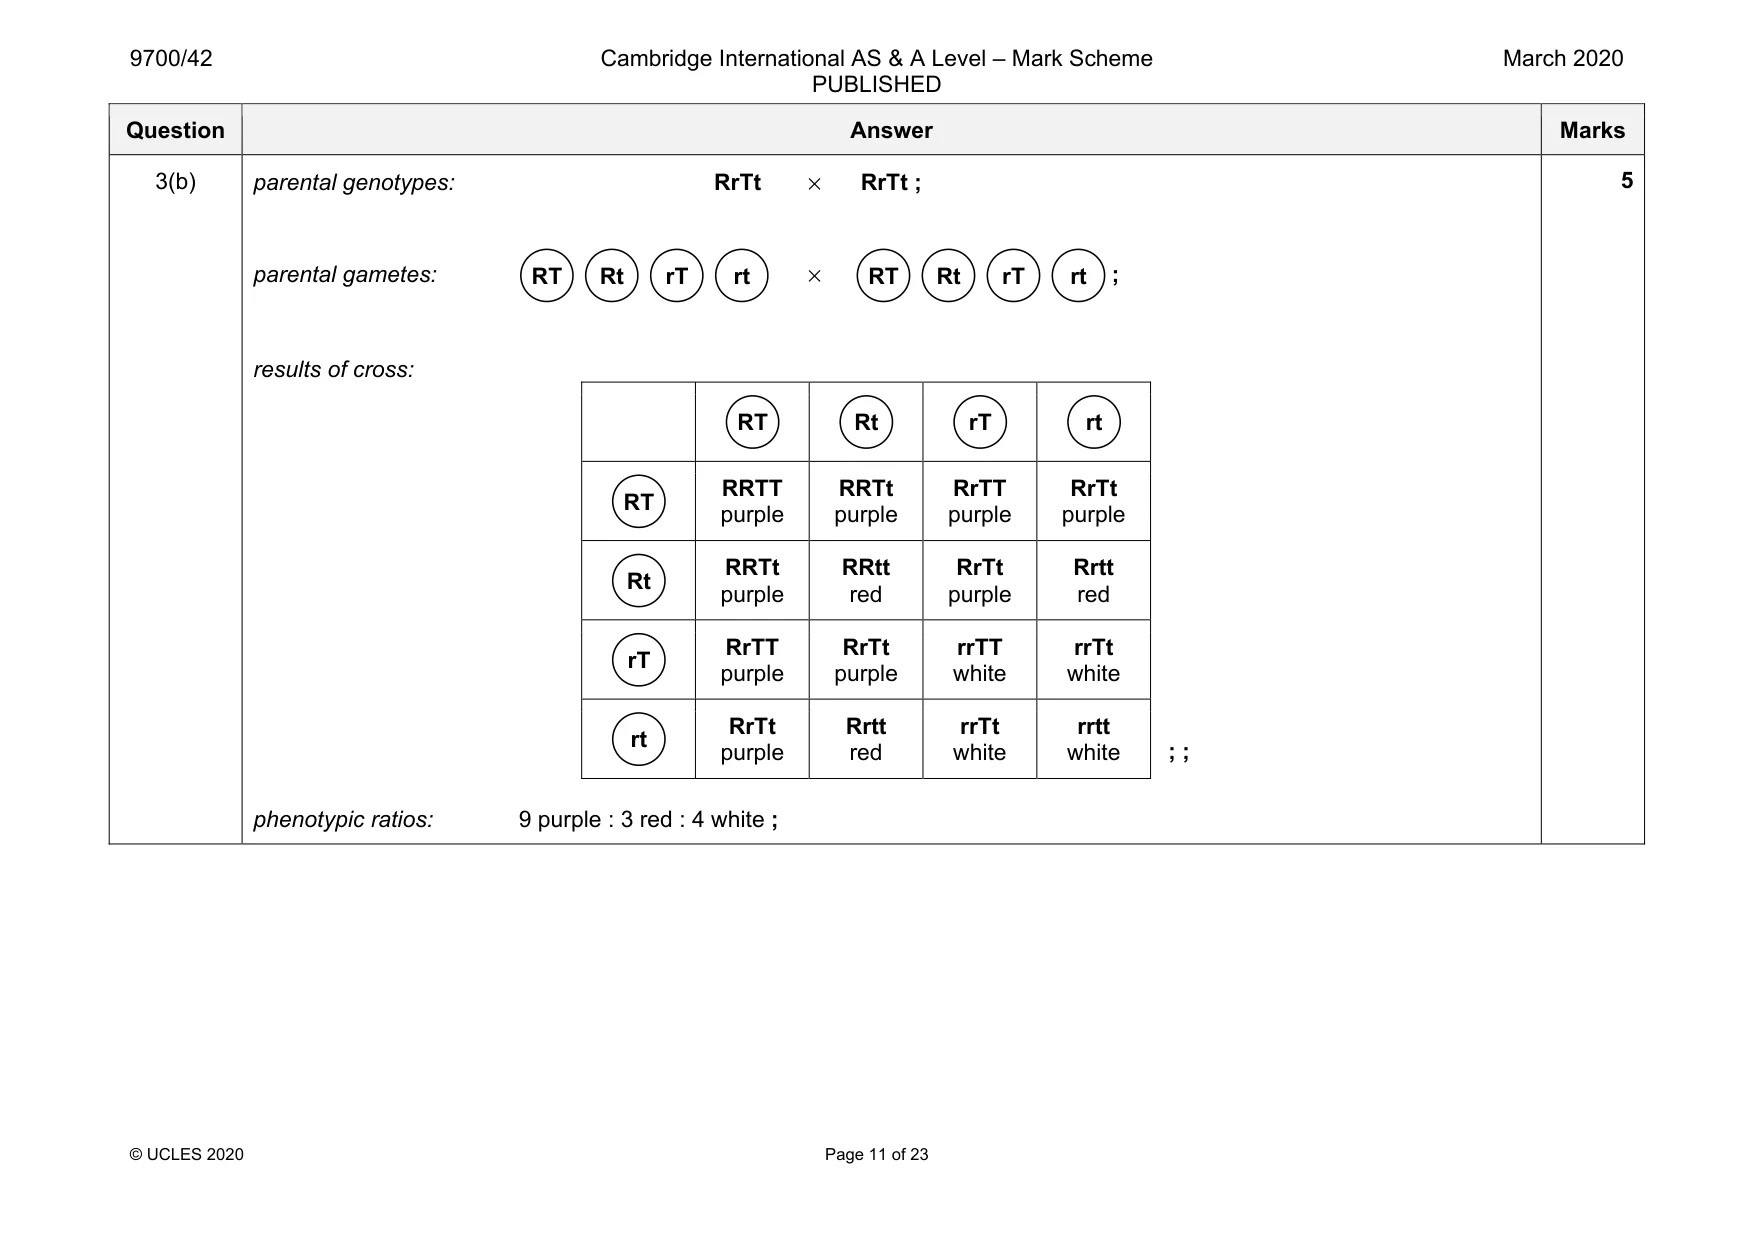
Mark scheme: 3(a)(i) 1 different forms / variations, of, the same / a, gene ; 2 due to different DNA, base / nucleotide, sequence or resulting in different, polypeptide / protein, produced ; 2 3(a)(ii) any three from: 1 example of, gene interaction / epistasis ; 2 (allele R may code for) an enzyme in pigment production pathway ; 3 (allele R may code for) co-factor to, activate enzyme / block inhibitor ; 4 (allele R may code for) transcription factor ; 5 (by) binding to, enhancer / promoter ; 6 (which) promotes transcription / allows binding of RNA polymerase / allows mRNA to be made ; 7 AVP ; e.g. protein that causes transcription factor complex formation 3 Question Answer Marks 3(b) parental genotypes: RrTt × RrTt ; parental gametes: × ; results of cross: RRTT purple RRTt purple RrTT purple RrTt purple RRTt purple RRtt red RrTt purple Rrtt red RrTT purple RrTt purple rrTT white rrTt white RrTt purple Rrtt red rrTt white rrtt white ; ; phenotypic ratios: 9 purple : 3 red : 4 white ; 5 rt rT Rt RT rt rT Rt RT rt rT Rt RT rt rT Rt RT
More questions on Passage of information from parents to offspring
Q4 · The rainbow trout, Oncorhynchus mykiss, is a fish that is bred in commercial fish farms
4 The rainbow trout, Oncorhynchus mykiss, is a fish that is bred in commercial fish farms. Rainbow trout that have a blue-silver colour are sold at a higher price than rainbow trout that have a brown colour. The number of fish with each of the different colours was recorded in a breeding population in one fish farm. • population total = 2936 • number of blue-silver fish = 1437 • number of brown fish = 1499 (a) The colour of rainbow trout is controlled by a single autosomal gene with two alleles, one dominant and one recessive. The blue-silver colour occurs when a fish is homozygous for the recessive allele. The formulae of the Hardy–Weinberg principle state that: p + q = 1 p2 + 2pq + q2 = 1 Use these formulae to calculate the expected number of brown fish that are homozygous, if the Hardy–Weinberg principle applies to this population. Show your working. answer = ............................................................... [3] (b) Some scientists suggested that the Hardy–Weinberg principle did not apply in this situation because the rainbow trout were being kept in a commercial fish farm. State two conditions that must be met by this commercial fish farm population for the Hardy–Weinberg principle to apply. ................................................................................................................................................... ................................................................................................................................................... ................................................................................................................................................... ............................................................................................................................................. [2] (c) Describe how selective breeding can be used to increase the proportion of rainbow trout with a blue-silver colour in commercial fish farms. ................................................................................................................................................... ................................................................................................................................................... ................................................................................................................................................... ................................................................................................................................................... ................................................................................................................................................... ................................................................................................................................................... ................................................................................................................................................... ................................................................................................................................................... ............................................................................................................................................. [4] (d) The Atlantic salmon, Salmo salar, can be genetically modified (GM). GM Atlantic salmon are bred in commercial fish farms for food production. In 2017, GM Atlantic salmon bred in Canada became the first GM animal to enter the human food chain. Explain how the genetic modification of the Atlantic salmon can be used to increase food production. ................................................................................................................................................... ................................................................................................................................................... ................................................................................................................................................... ................................................................................................................................................... ................................................................................................................................................... ............................................................................................................................................. [2] [Total: 11]
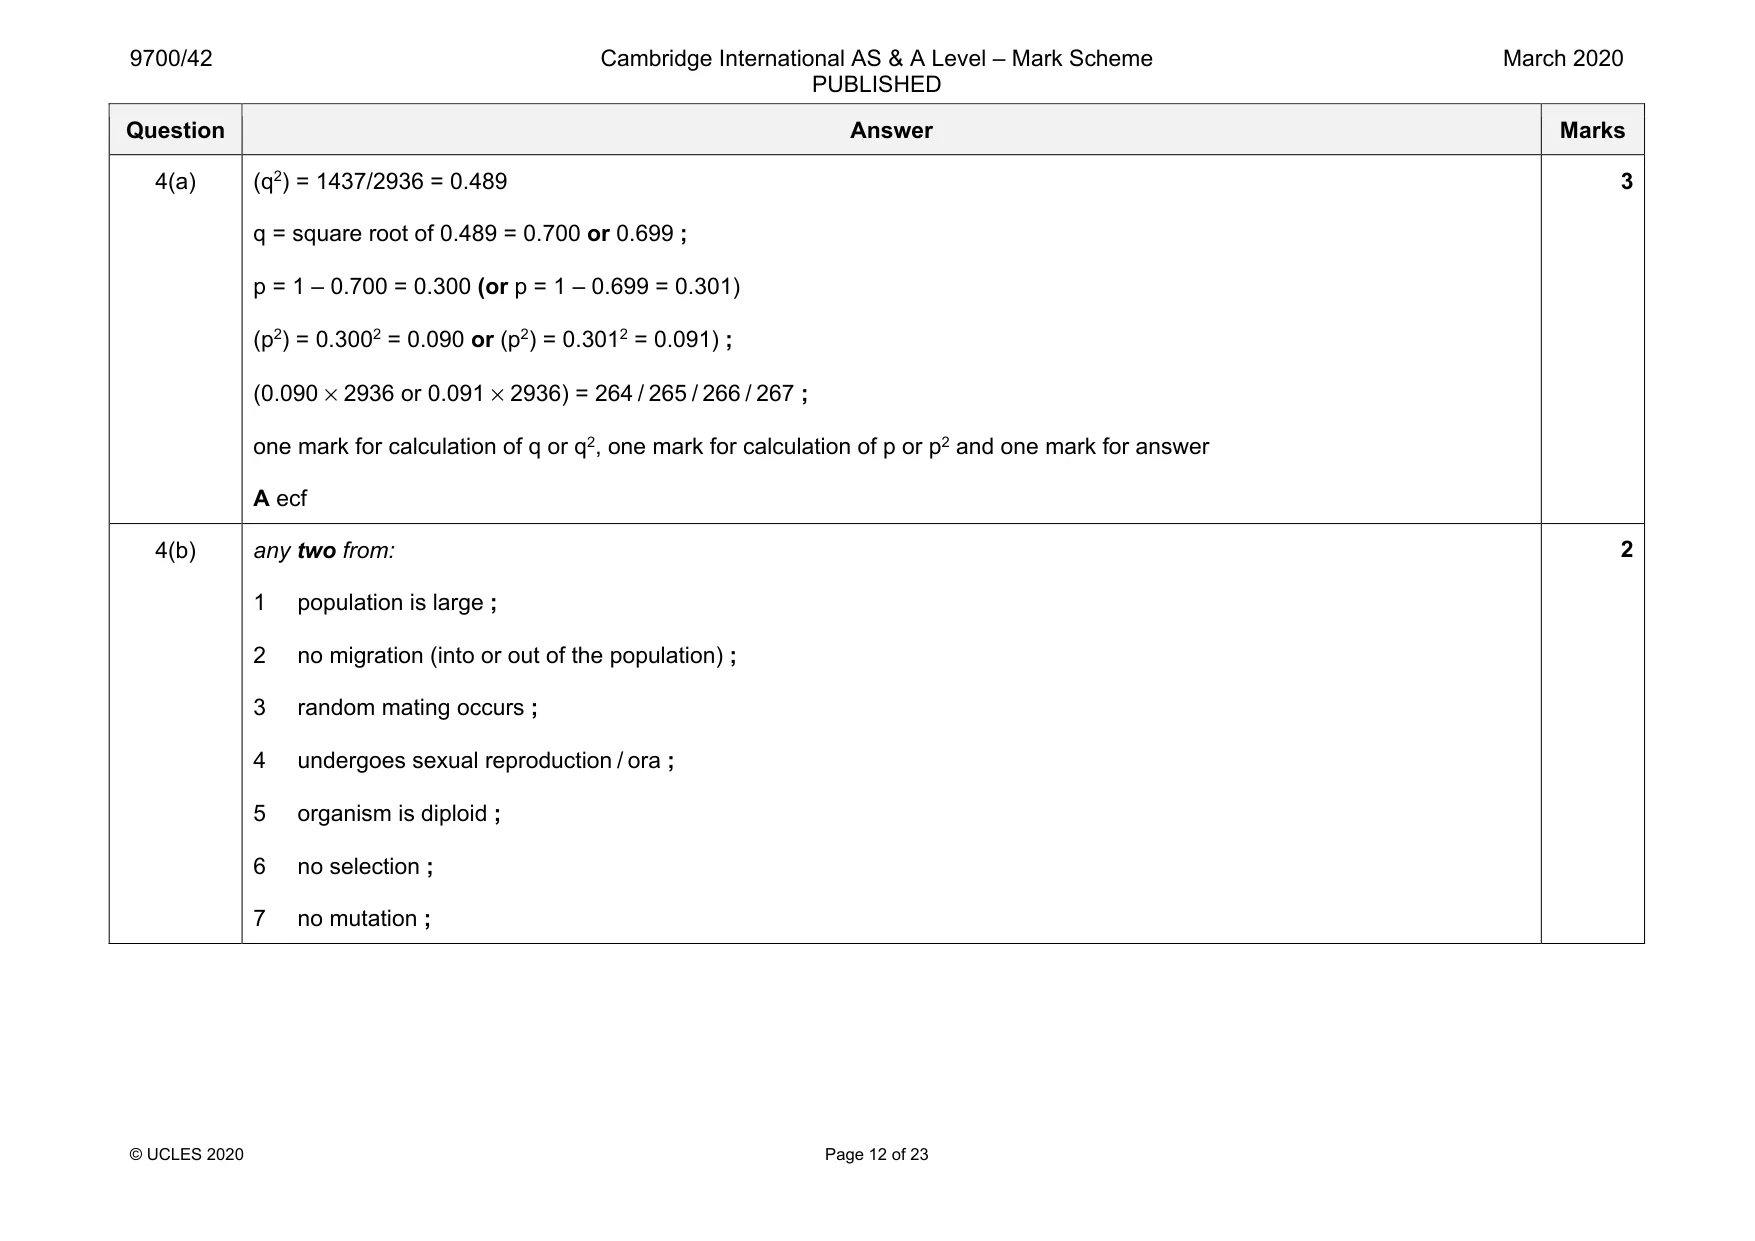
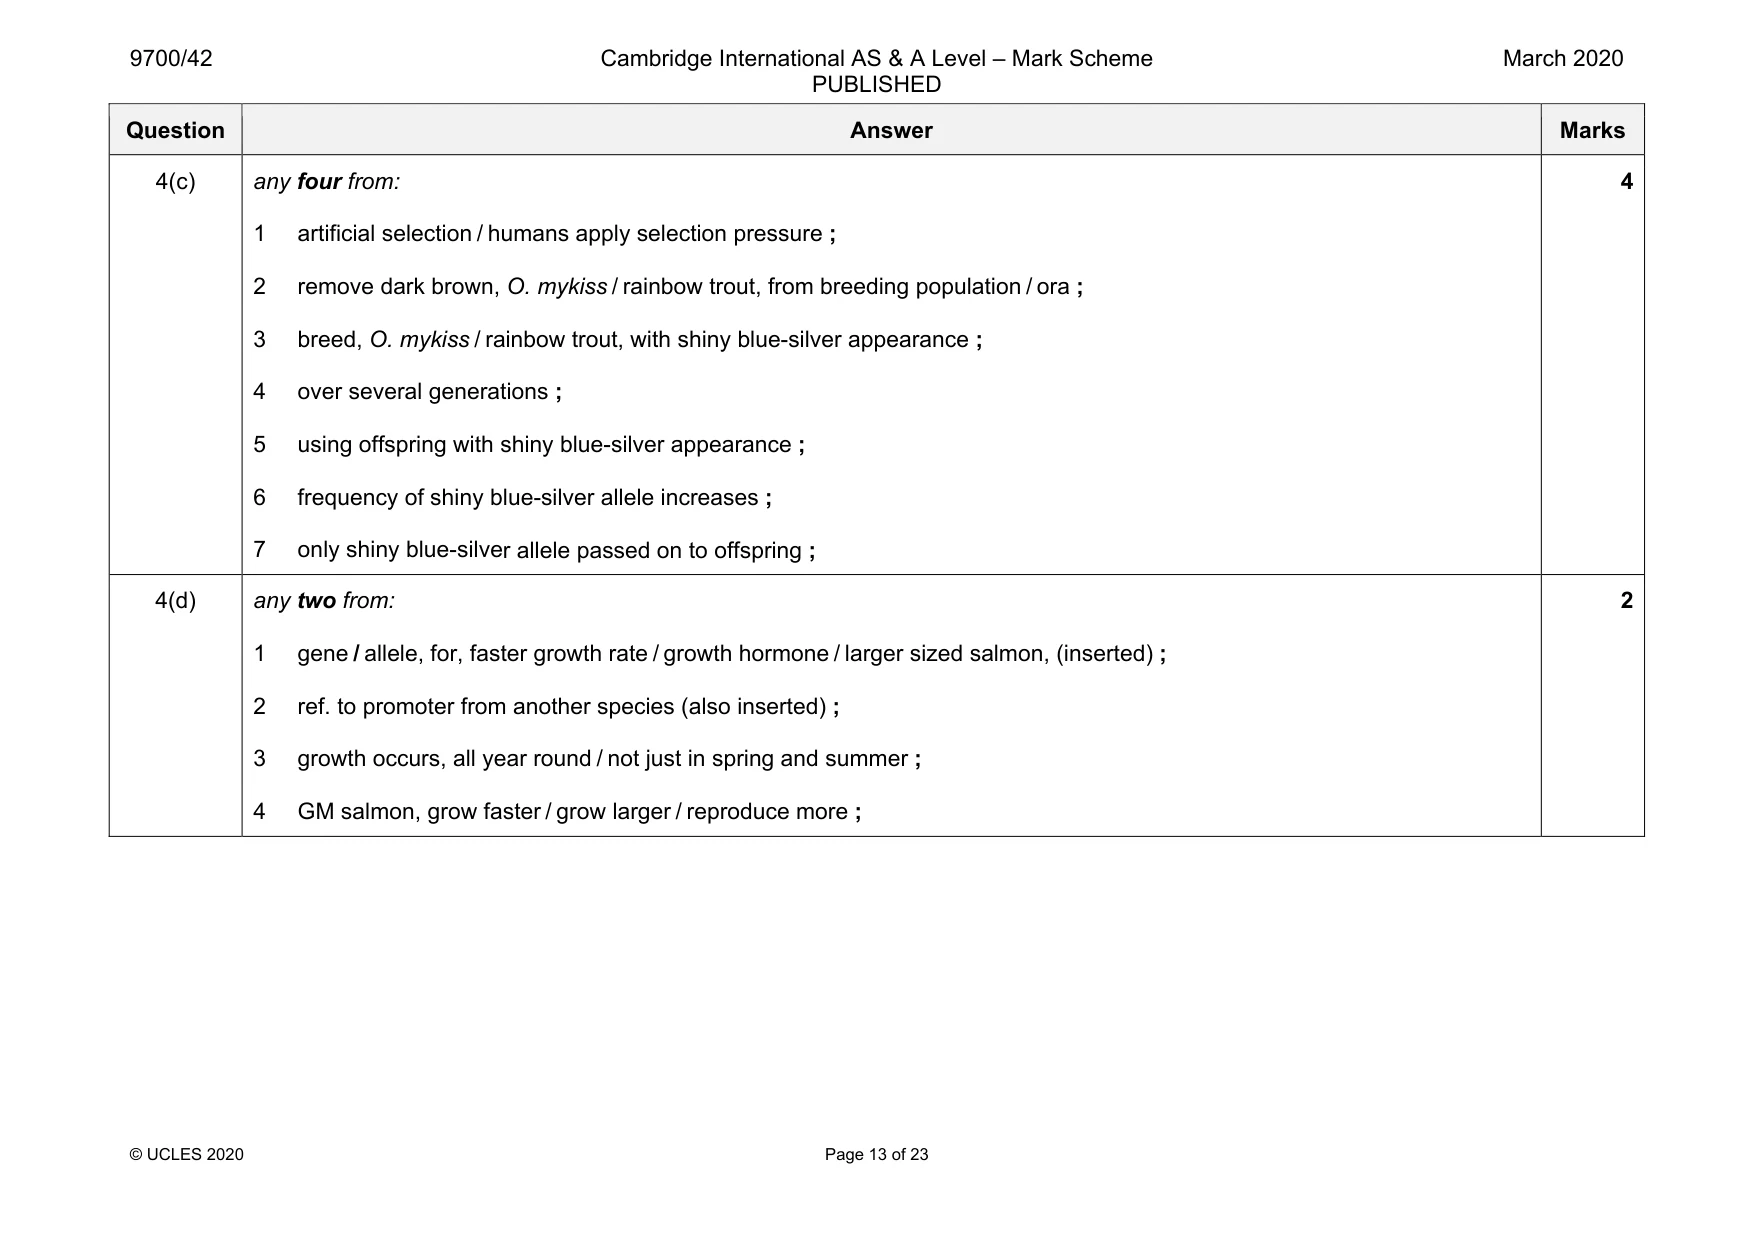
Mark scheme: 4(a) (q2) = 1437/2936 = 0.489 q = square root of 0.489 = 0.700 or 0.699 ; p = 1 – 0.700 = 0.300 (or p = 1 – 0.699 = 0.301) (p2) = 0.3002 = 0.090 or (p2) = 0.3012 = 0.091) ; (0.090 × 2936 or 0.091 × 2936) = 264 / 265 / 266 / 267 ; one mark for calculation of q or q2, one mark for calculation of p or p2 and one mark for answer A ecf 3 4(b) any two from: 1 population is large ; 2 no migration (into or out of the population) ; 3 random mating occurs ; 4 undergoes sexual reproduction / ora ; 5 organism is diploid ; 6 no selection ; 7 no mutation ; 2 Question Answer Marks 4(c) any four from: 1 artificial selection / humans apply selection pressure ; 2 remove dark brown, O. mykiss / rainbow trout, from breeding population / ora ; 3 breed, O. mykiss / rainbow trout, with shiny blue-silver appearance ; 4 over several generations ; 5 using offspring with shiny blue-silver appearance ; 6 frequency of shiny blue-silver allele increases ; 7 only shiny blue-silver allele passed on to offspring ; 4 4(d) any two from: 1 gene / allele, for, faster growth rate / growth hormone / larger sized salmon, (inserted) ; 2 ref. to promoter from another species (also inserted) ; 3 growth occurs, all year round / not just in spring and summer ; 4 GM salmon, grow faster / grow larger / reproduce more ; 2
Q5 · To identify the function of a gene, scientists can insert (add) a copy of the gene into a…
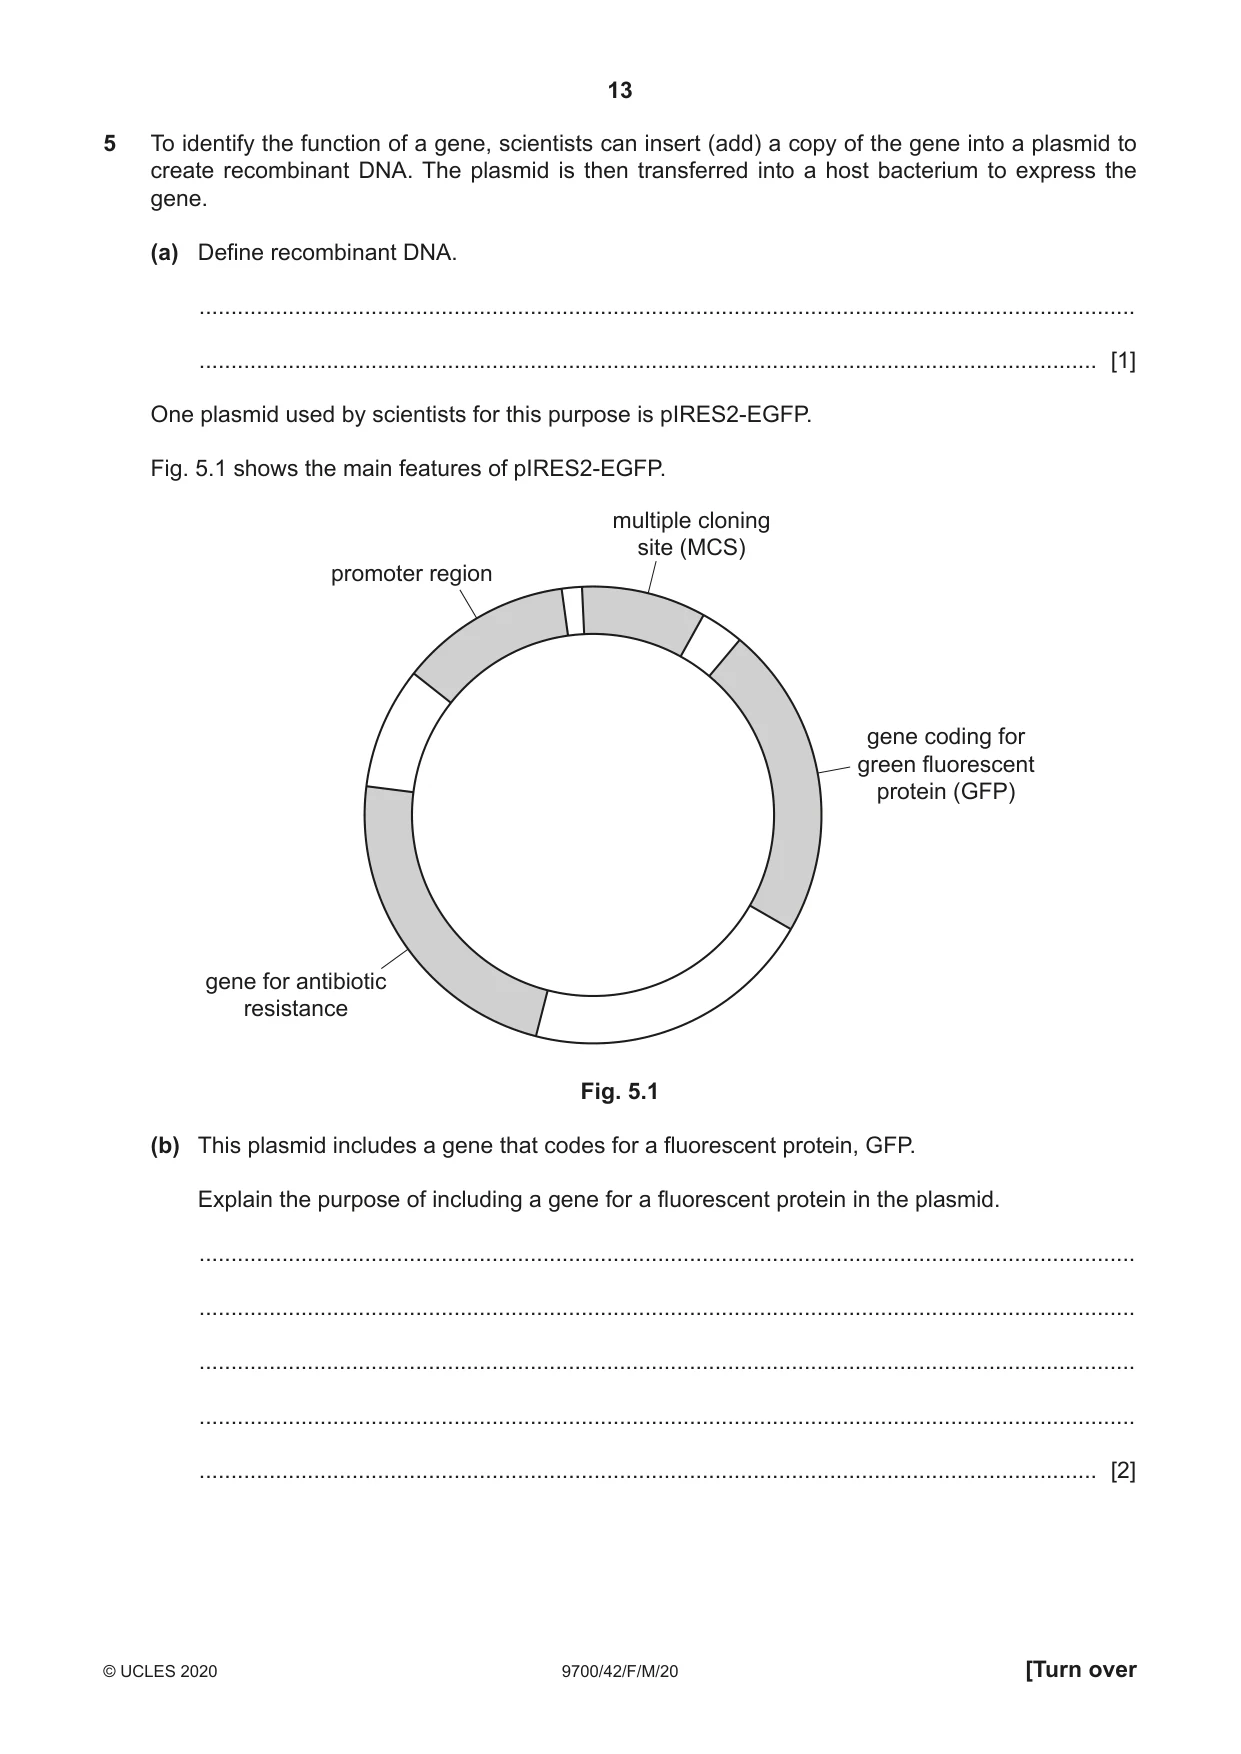
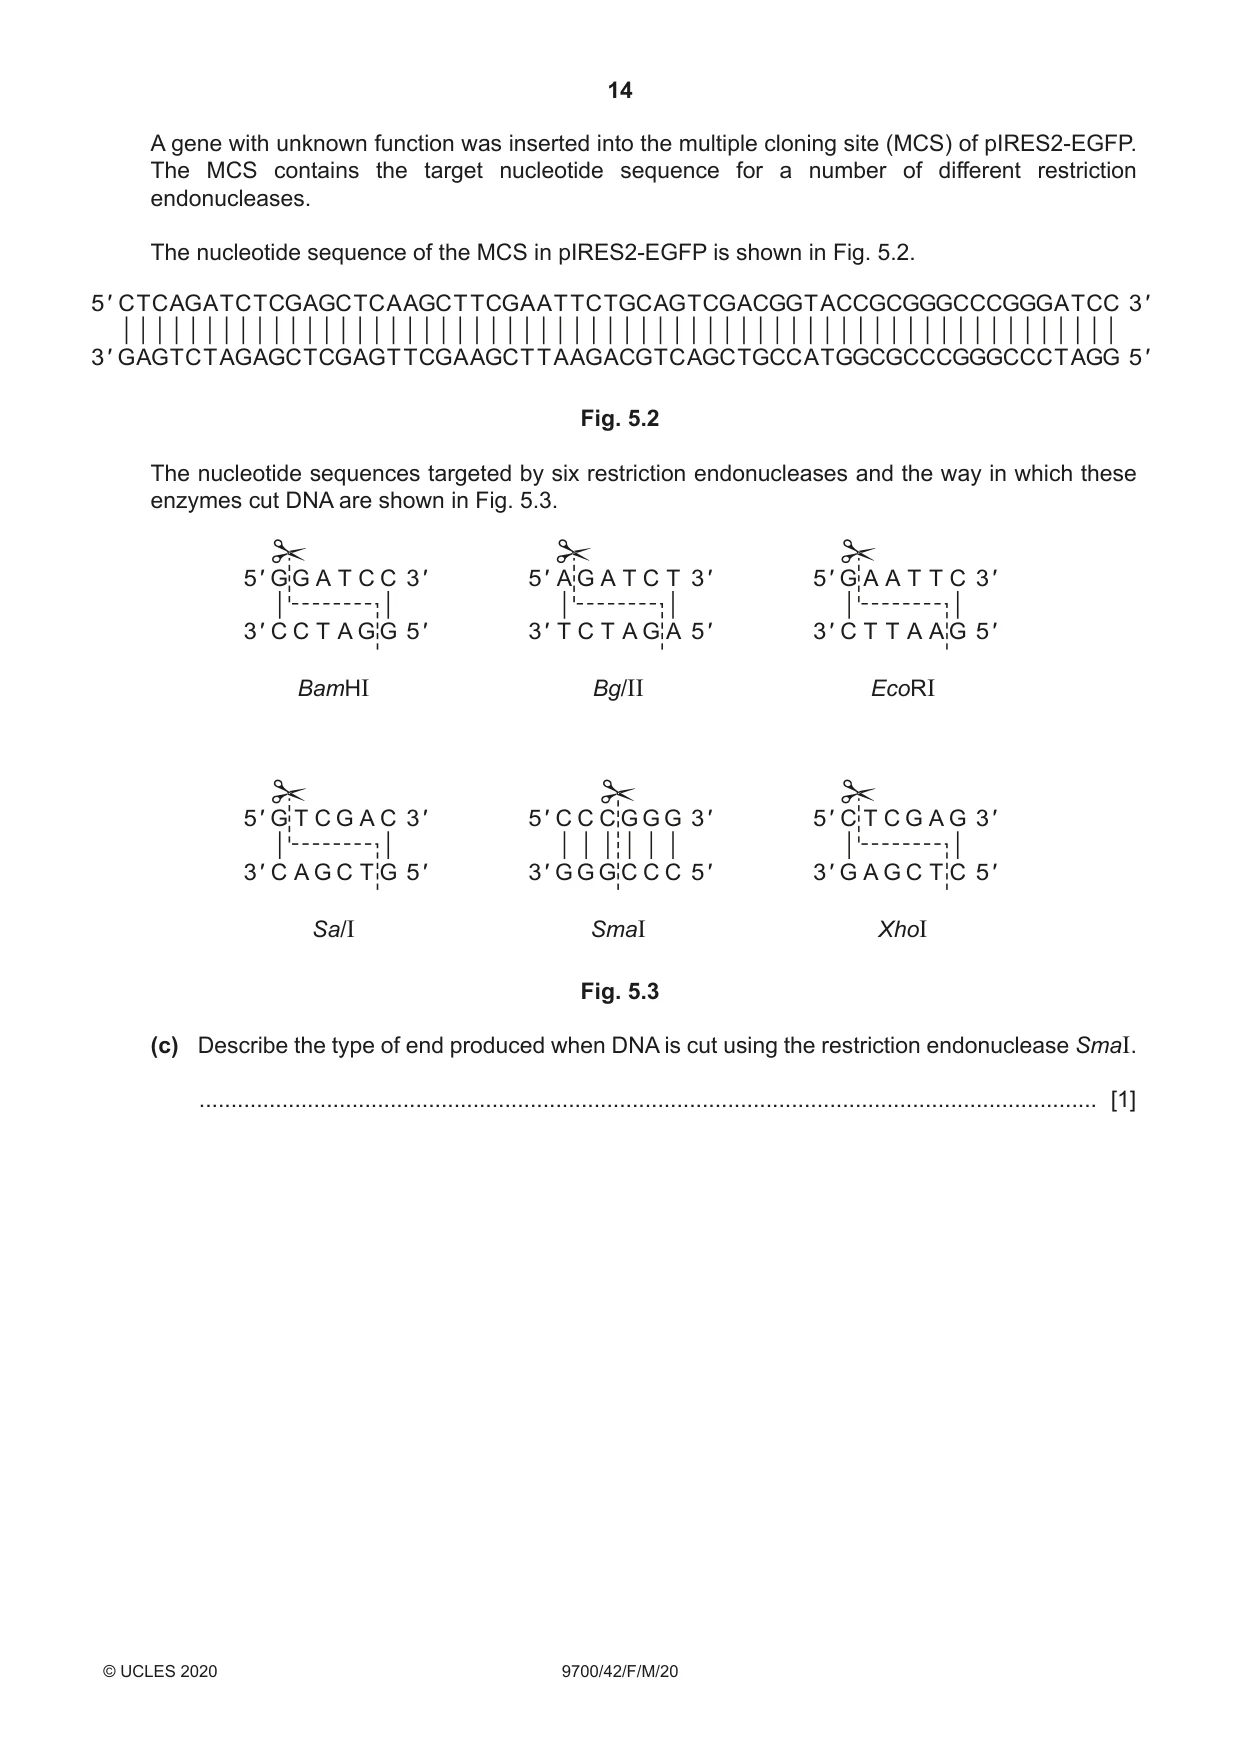
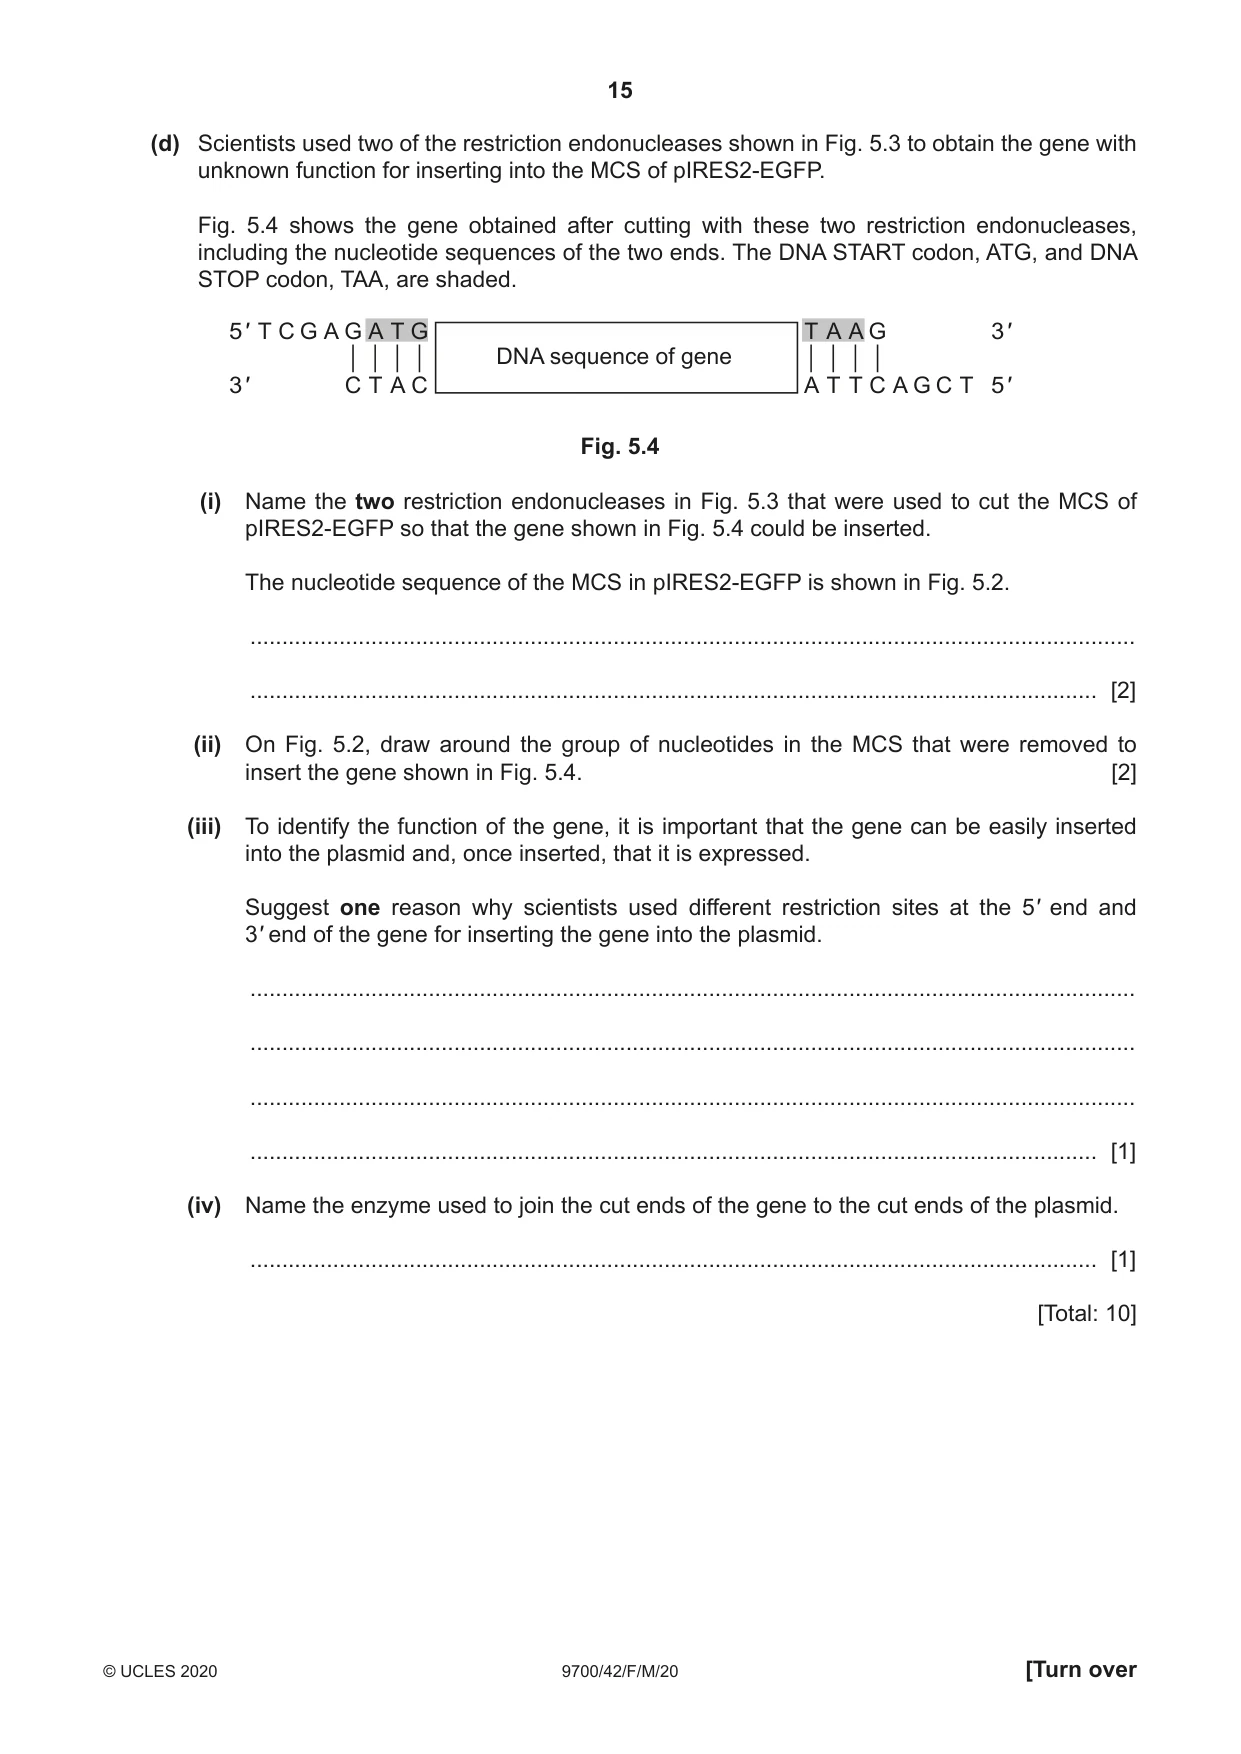
5 To identify the function of a gene, scientists can insert (add) a copy of the gene into a plasmid to create recombinant DNA. The plasmid is then transferred into a host bacterium to express the gene. (a) Define recombinant DNA. ................................................................................................................................................... ............................................................................................................................................. [1] One plasmid used by scientists for this purpose is pIRES2-EGFP. Fig. 5.1 shows the main features of pIRES2-EGFP. multiple cloning site (MCS) promoter region gene coding for green fluorescent protein (GFP) gene for antibiotic resistance Fig. 5.1 (b) This plasmid includes a gene that codes for a fluorescent protein, GFP. Explain the purpose of including a gene for a fluorescent protein in the plasmid. ................................................................................................................................................... ................................................................................................................................................... ................................................................................................................................................... ................................................................................................................................................... ............................................................................................................................................. [2] A gene with unknown function was inserted into the multiple cloning site (MCS) of pIRES2-EGFP. The MCS contains the target nucleotide sequence for a number of different restriction endonucleases. The nucleotide sequence of the MCS in pIRES2-EGFP is shown in Fig. 5.2. 5' C T C AG A T C T CG AGC T C A AGC T T CG A A T T C T GC AG T CG A CGG T A C CGCGGGC C CGGG A T C C 3' 3' G AG T C T AG AGC T CG AG T T CG A AGC T T A AG A CG T C AGC T GC C A T GGCGC C CGGGC C C T AGG 5' Fig. 5.2 The nucleotide sequences targeted by six restriction endonucleases and the way in which these enzymes cut DNA are shown in Fig. 5.3. 5' G G A T C C 3' 5' A G A T C T 3' 5' G A A T T C 3' 3' C C T A G G 5' 3' T C T A G A 5' 3' C T T A A G 5' BamHI Bg/II EcoRI 5' G T C G A C 3' 5' C C C G G G 3' 5' C T C G A G 3' 3' C A G C T G 5' 3' G G G C C C 5' 3' G A G C T C 5' Sa/I SmaI XhoI Fig. 5.3 (c) Describe the type of end produced when DNA is cut using the restriction endonuclease SmaI. ............................................................................................................................................. [1] (d) Scientists used two of the restriction endonucleases shown in Fig. 5.3 to obtain the gene with unknown function for inserting into the MCS of pIRES2-EGFP. Fig. 5.4 shows the gene obtained after cutting with these two restriction endonucleases, including the nucleotide sequences of the two ends. The DNA START codon, ATG, and DNA STOP codon, TAA, are shaded. 5' T C G A G A T G T A A G 3' DNA sequence of gene 3' C T A C A T T C A G C T 5' Fig. 5.4 (i) Name the two restriction endonucleases in Fig. 5.3 that were used to cut the MCS of pIRES2-EGFP so that the gene shown in Fig. 5.4 could be inserted. The nucleotide sequence of the MCS in pIRES2-EGFP is shown in Fig. 5.2. ........................................................................................................................................... ..................................................................................................................................... [2] (ii) On Fig. 5.2, draw around the group of nucleotides in the MCS that were removed to insert the gene shown in Fig. 5.4. [2] (iii) To identify the function of the gene, it is important that the gene can be easily inserted into the plasmid and, once inserted, that it is expressed. Suggest one reason why scientists used different restriction sites at the 5' end and 3' end of the gene for inserting the gene into the plasmid. ........................................................................................................................................... ........................................................................................................................................... ........................................................................................................................................... ..................................................................................................................................... [1] (iv) Name the enzyme used to join the cut ends of the gene to the cut ends of the plasmid. ..................................................................................................................................... [1] [Total: 10]
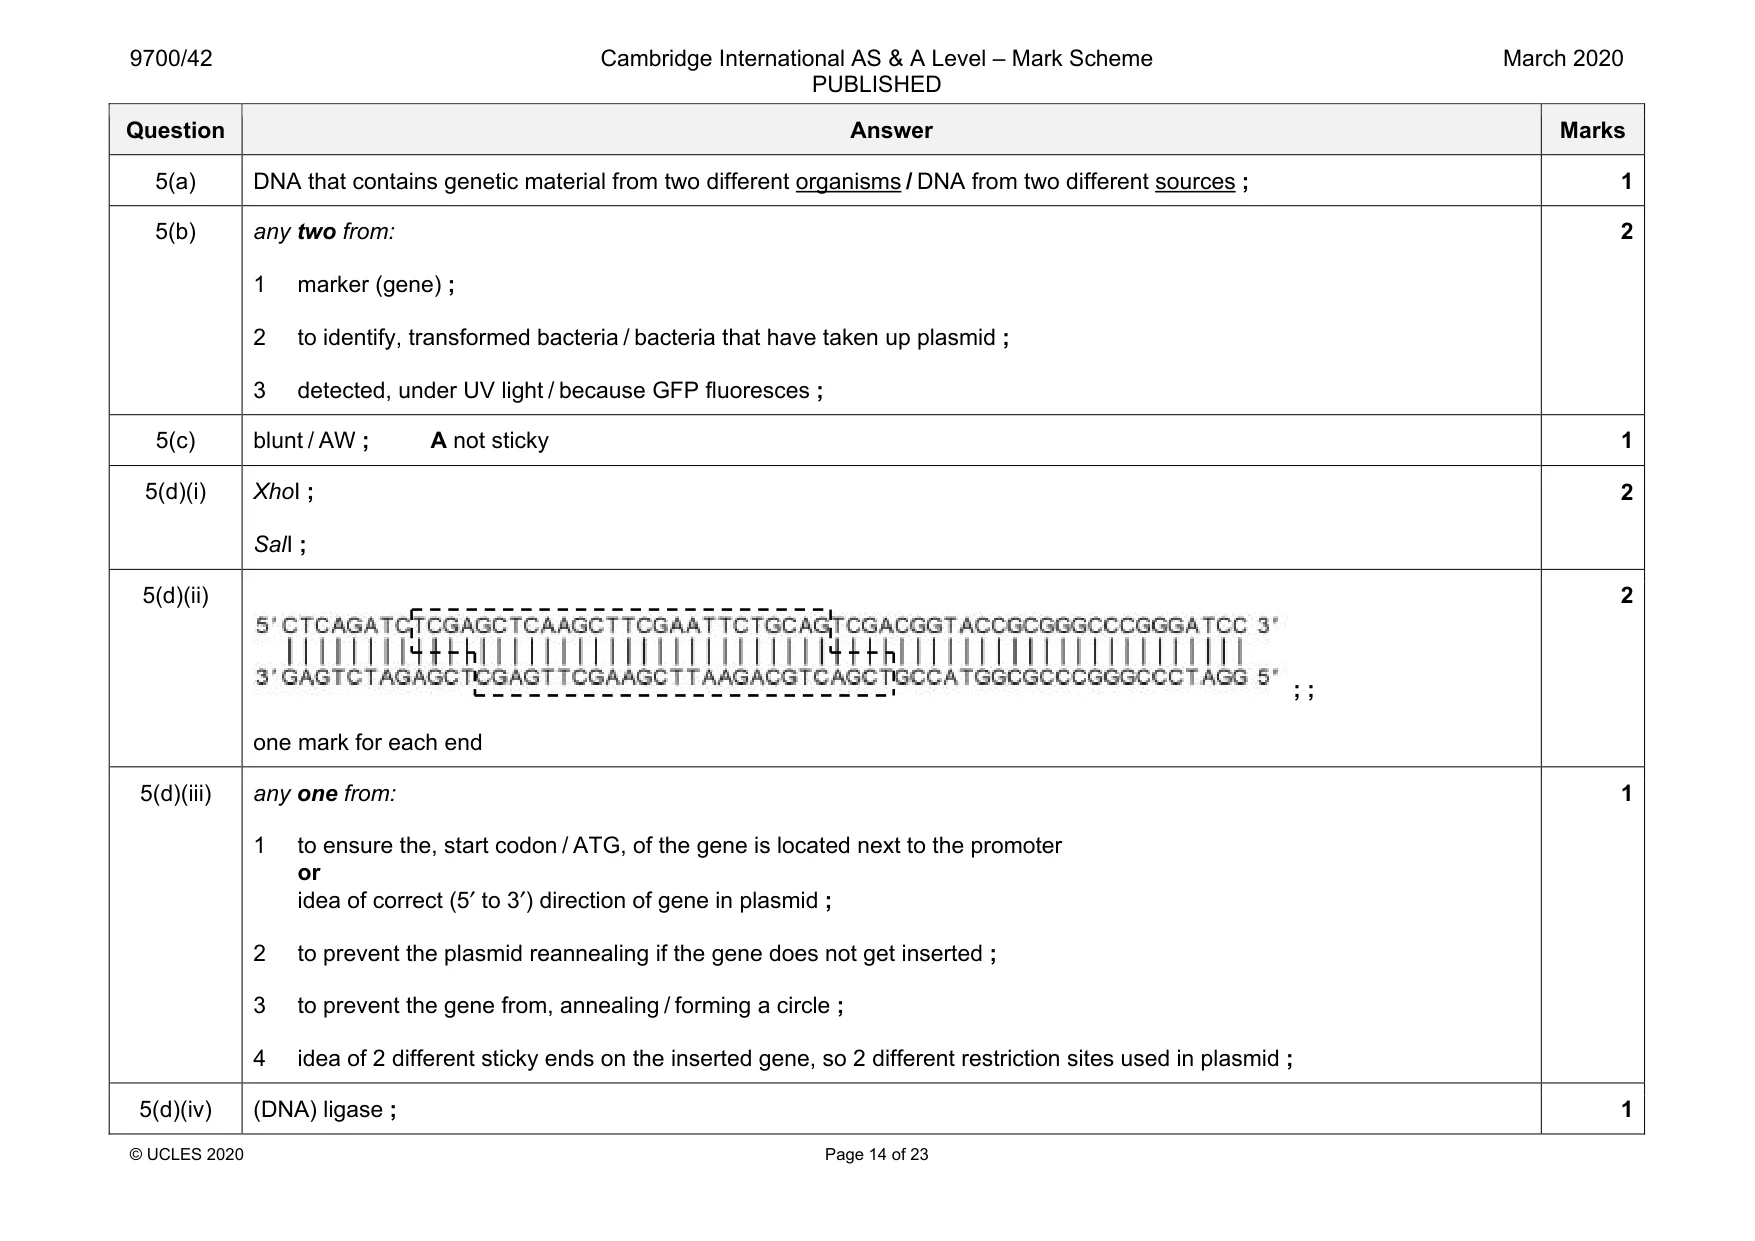
Mark scheme: 5(a) DNA that contains genetic material from two different organisms / DNA from two different sources ; 1 5(b) any two from: 1 marker (gene) ; 2 to identify, transformed bacteria / bacteria that have taken up plasmid ; 3 detected, under UV light / because GFP fluoresces ; 2 5(c) blunt / AW ; A not sticky 1 5(d)(i) XhoI ; SalI ; 2 5(d)(ii) ; ; one mark for each end 2 5(d)(iii) any one from: 1 to ensure the, start codon / ATG, of the gene is located next to the promoter or idea of correct (5′ to 3′) direction of gene in plasmid ; 2 to prevent the plasmid reannealing if the gene does not get inserted ; 3 to prevent the gene from, annealing / forming a circle ; 4 idea of 2 different sticky ends on the inserted gene, so 2 different restriction sites used in plasmid ; 1 5(d)(iv) (DNA) ligase ; 1
Q6 · The sea otter, Enhydra lutris, is a marine mammal that lives on the coasts of the North…
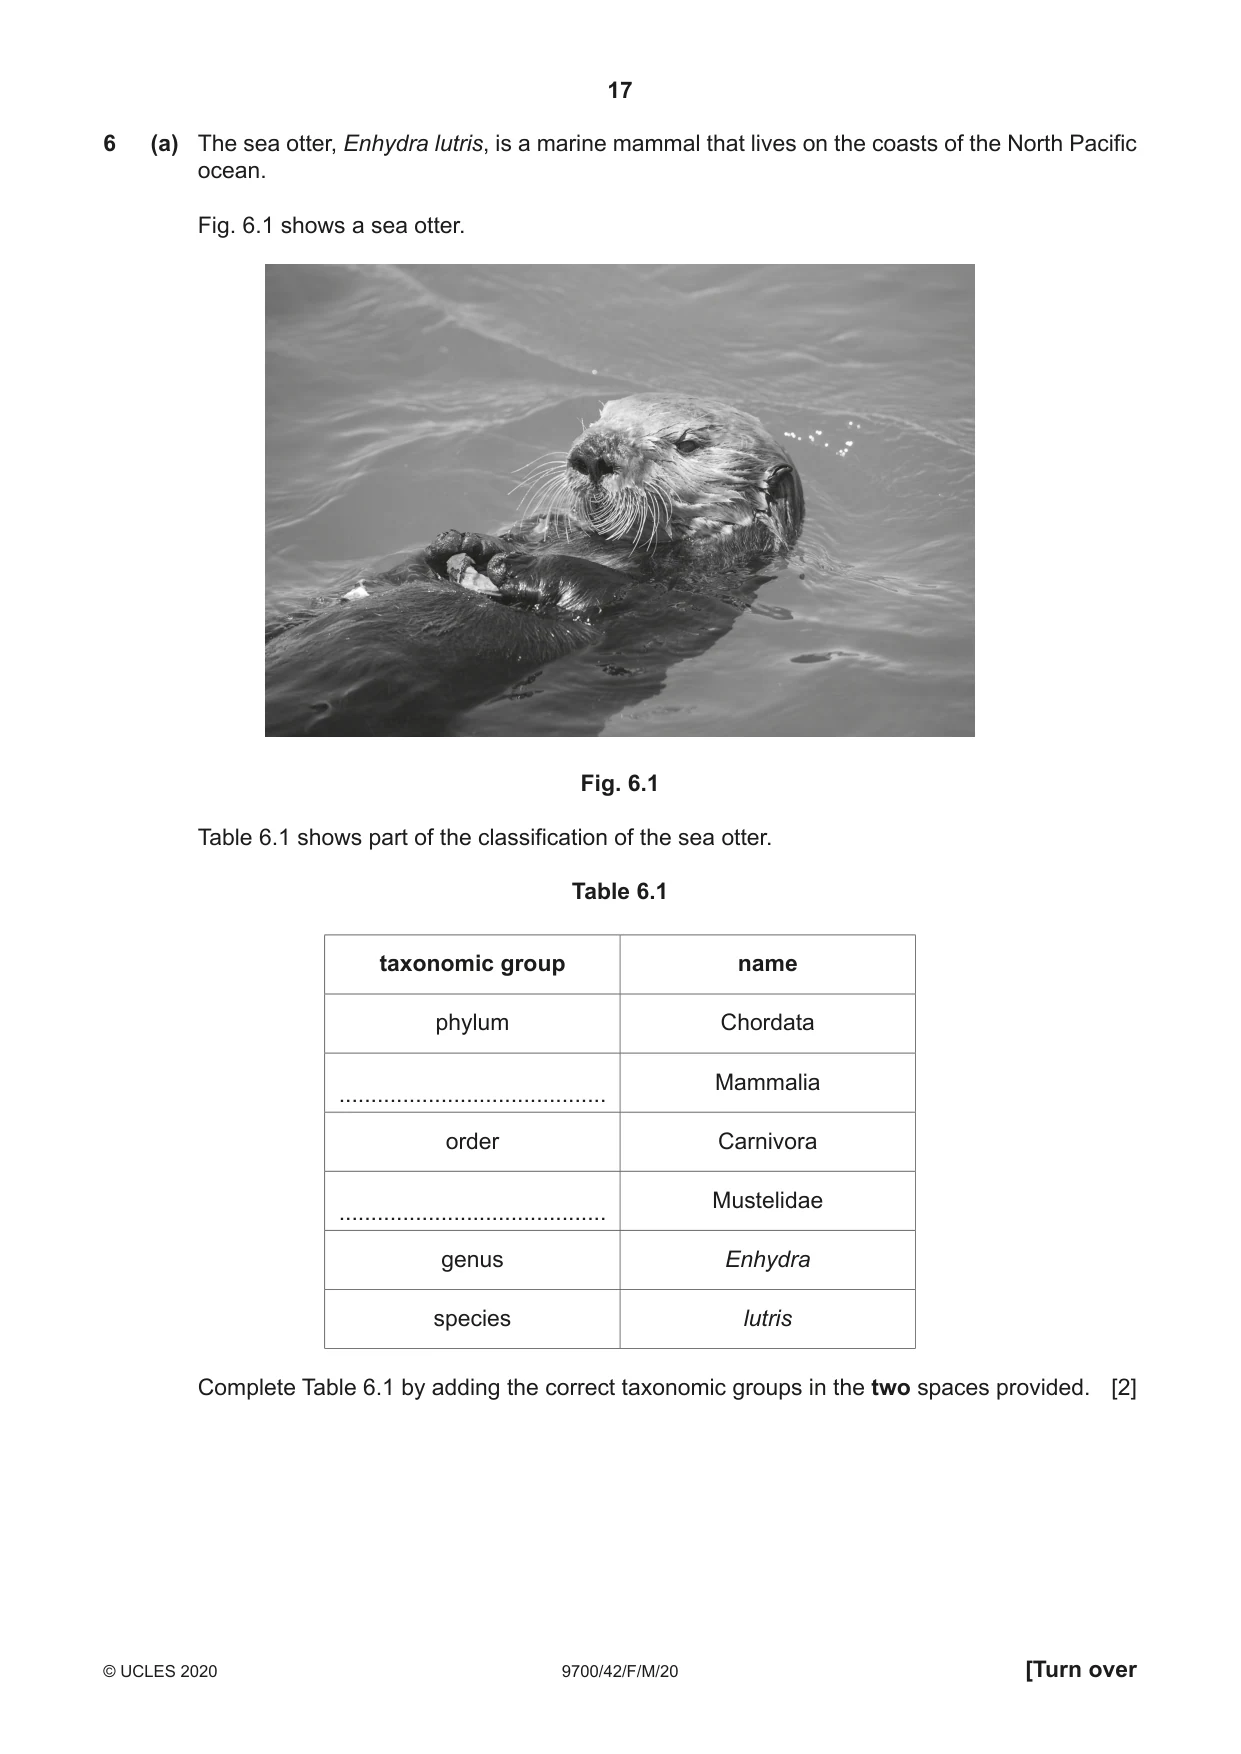
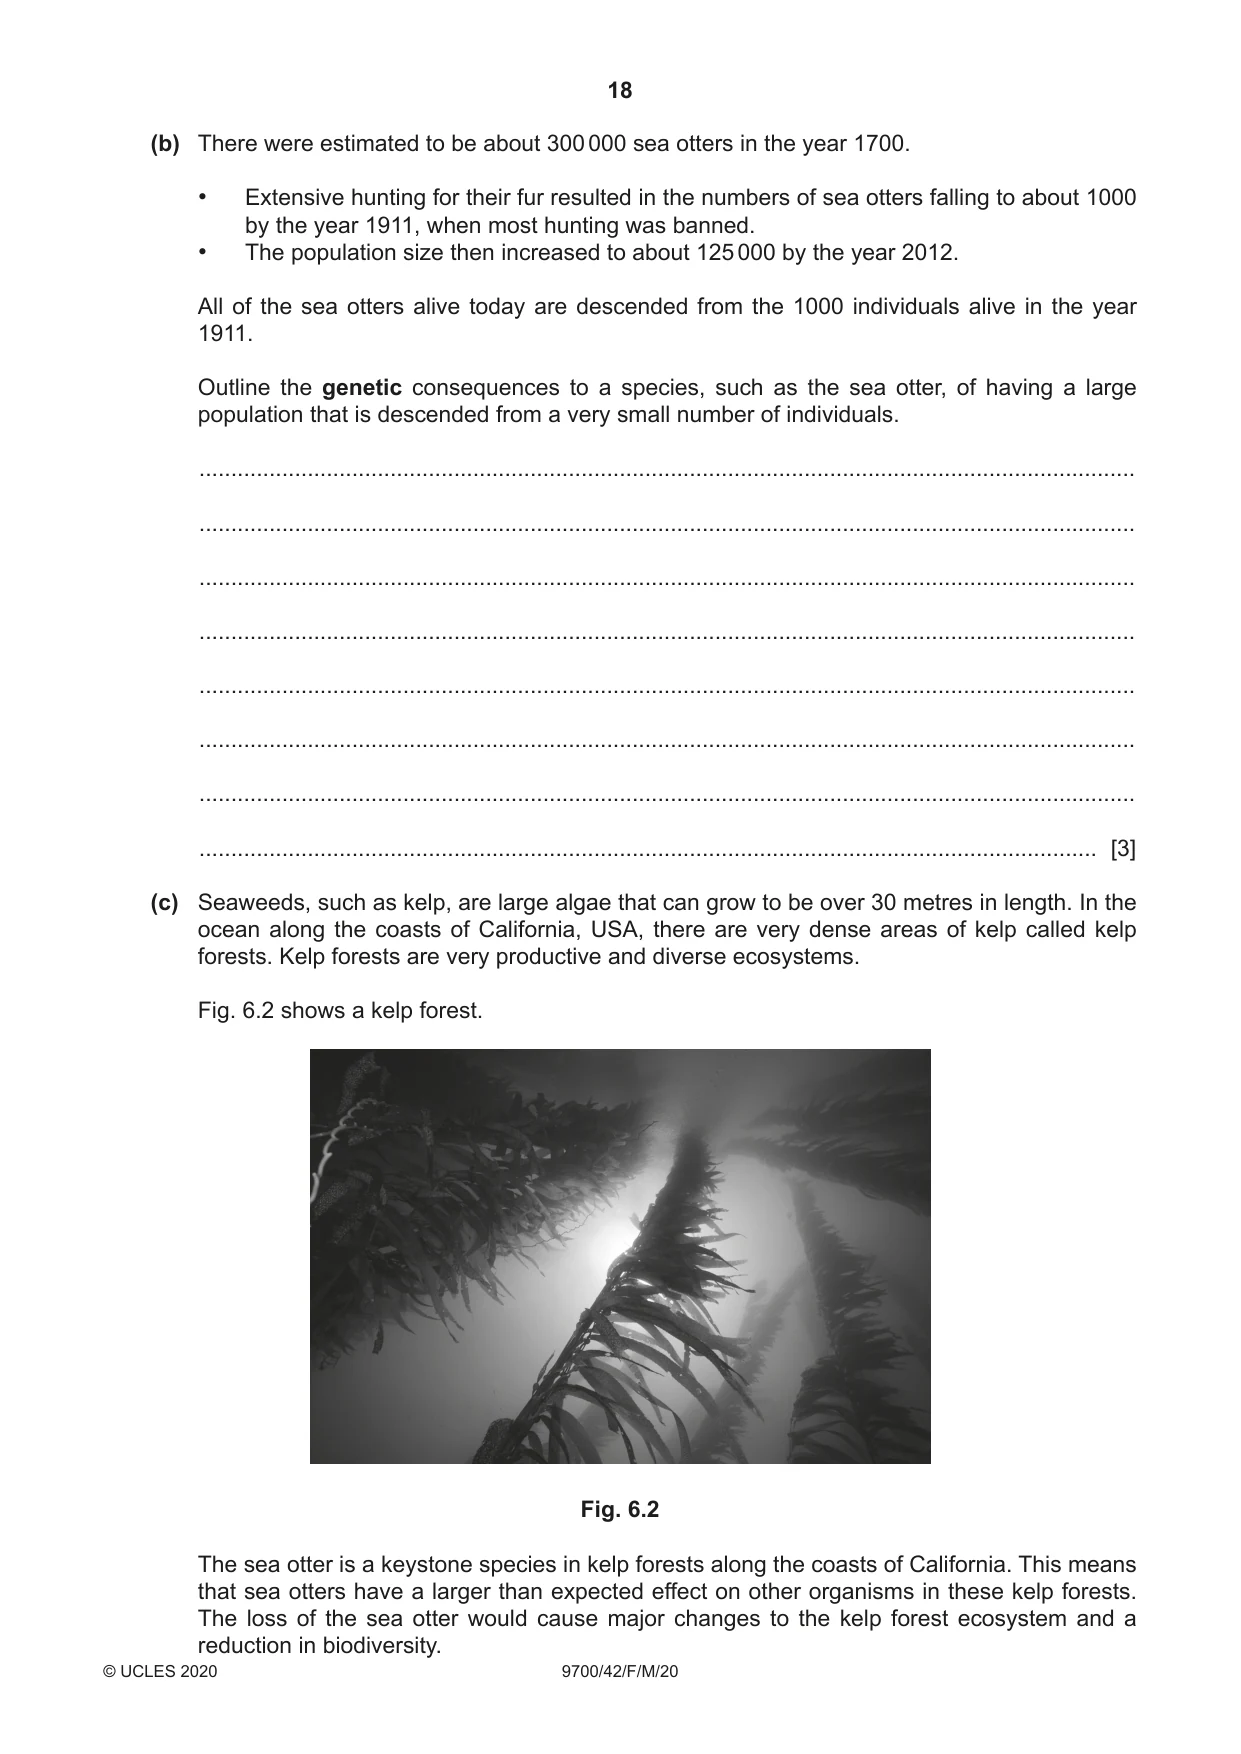
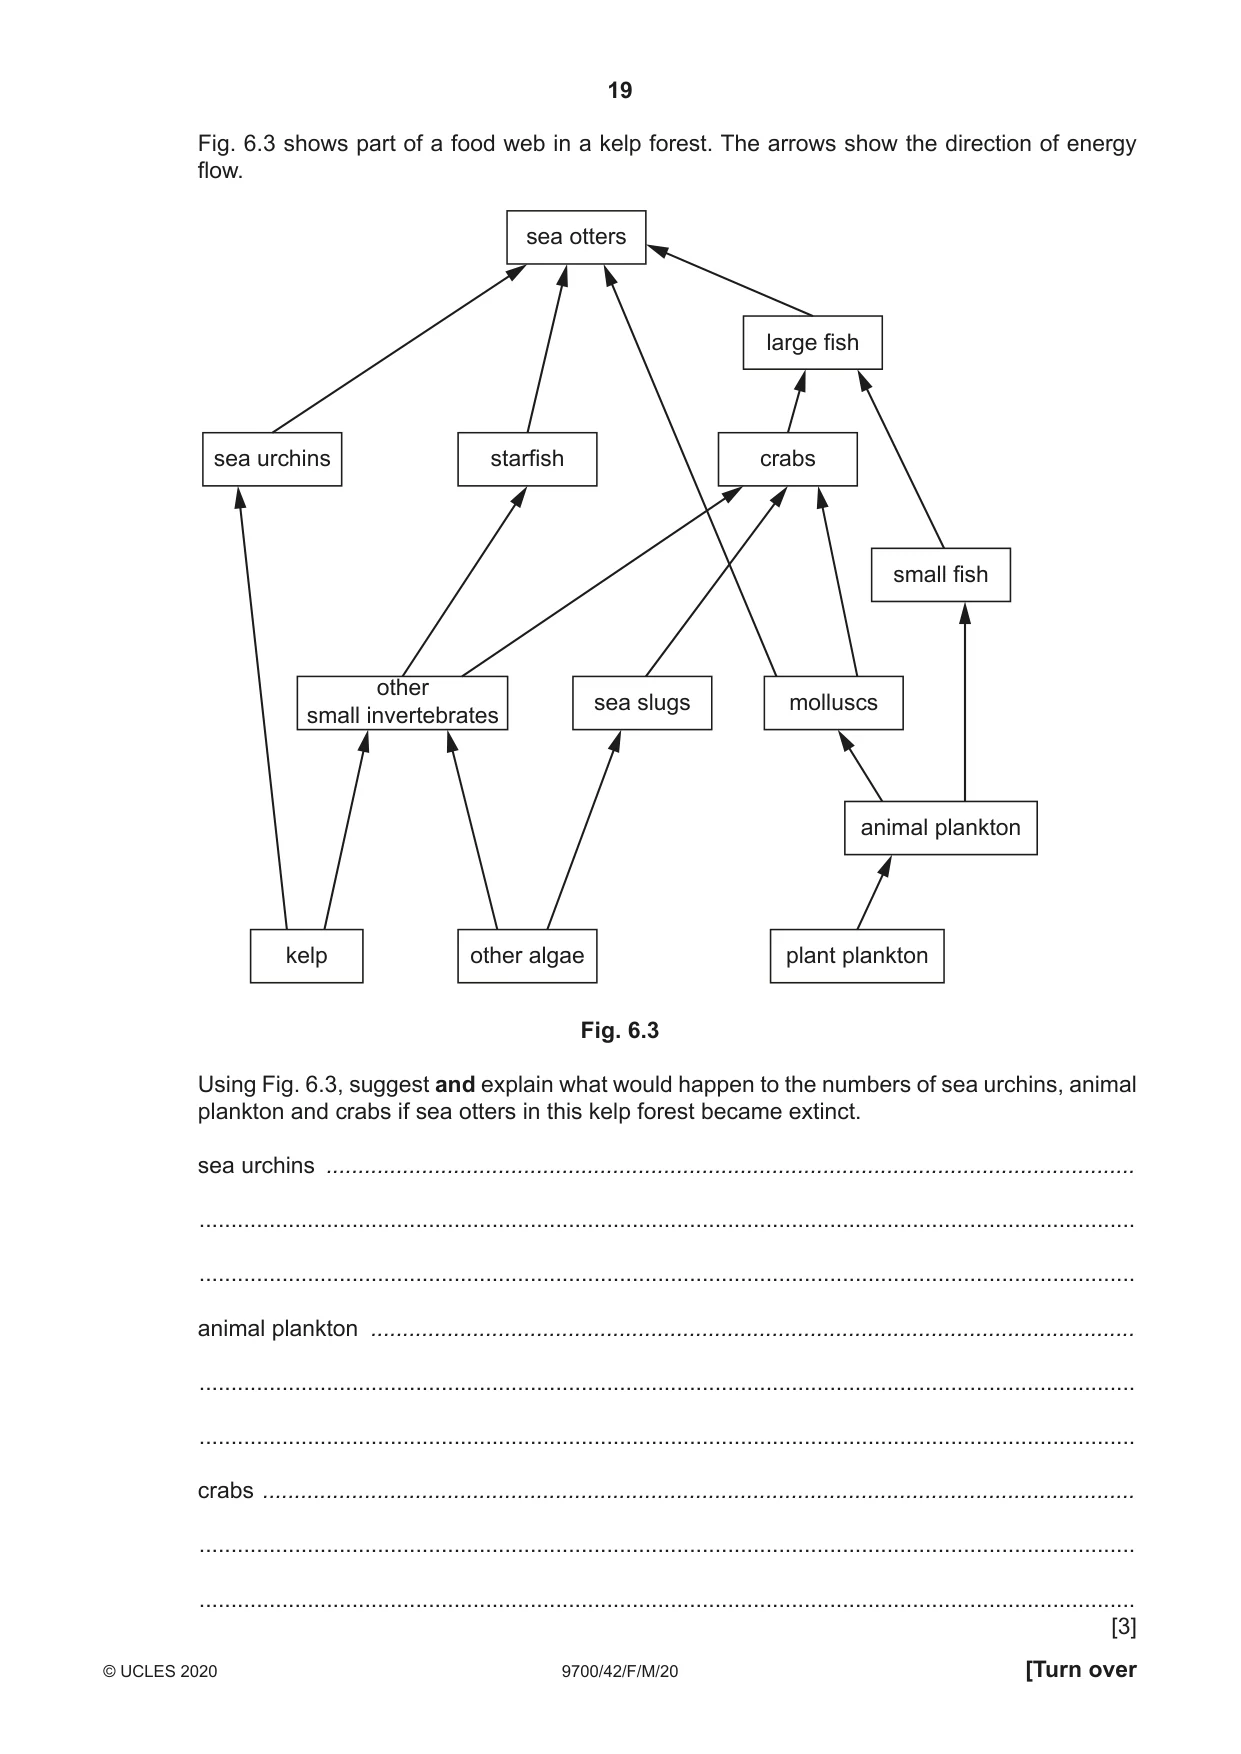
6 (a) The sea otter, Enhydra lutris, is a marine mammal that lives on the coasts of the North Pacific ocean. Fig. 6.1 shows a sea otter. Fig. 6.1 Table 6.1 shows part of the classification of the sea otter. Table 6.1 taxonomic group name phylum Chordata Mammalia .......................................... order Carnivora Mustelidae .......................................... genus Enhydra species lutris Complete Table 6.1 by adding the correct taxonomic groups in the two spaces provided. [2] (b) There were estimated to be about 300 000 sea otters in the year 1700. • Extensive hunting for their fur resulted in the numbers of sea otters falling to about 1000 by the year 1911, when most hunting was banned. • The population size then increased to about 125 000 by the year 2012. All of the sea otters alive today are descended from the 1000 individuals alive in the year 1911. Outline the genetic consequences to a species, such as the sea otter, of having a large population that is descended from a very small number of individuals. ................................................................................................................................................... ................................................................................................................................................... ................................................................................................................................................... ................................................................................................................................................... ................................................................................................................................................... ................................................................................................................................................... ................................................................................................................................................... ............................................................................................................................................. [3] (c) Seaweeds, such as kelp, are large algae that can grow to be over 30 metres in length. In the ocean along the coasts of California, USA, there are very dense areas of kelp called kelp forests. Kelp forests are very productive and diverse ecosystems. Fig. 6.2 shows a kelp forest. Fig. 6.2 The sea otter is a keystone species in kelp forests along the coasts of California. This means that sea otters have a larger than expected effect on other organisms in these kelp forests. The loss of the sea otter would cause major changes to the kelp forest ecosystem and a reduction in biodiversity. Fig. 6.3 shows part of a food web in a kelp forest. The arrows show the direction of energy flow. sea otters large fish sea urchins starfish crabs small fish other sea slugs molluscs small invertebrates animal plankton kelp other algae plant plankton Fig. 6.3 Using Fig. 6.3, suggest and explain what would happen to the numbers of sea urchins, animal plankton and crabs if sea otters in this kelp forest became extinct. sea urchins ............................................................................................................................... ................................................................................................................................................... ................................................................................................................................................... animal plankton ........................................................................................................................ ................................................................................................................................................... ................................................................................................................................................... crabs ......................................................................................................................................... ................................................................................................................................................... ................................................................................................................................................... [3] (d) Sea otters may spend up to five minutes under water while searching for food. During this time, respiration in anaerobic conditions takes place. When a sea otter first returns to the surface of the ocean, its breathing is faster and deeper than normal. Explain why its breathing is faster and deeper than normal. ................................................................................................................................................... ................................................................................................................................................... ................................................................................................................................................... ................................................................................................................................................... ................................................................................................................................................... ................................................................................................................................................... ................................................................................................................................................... ............................................................................................................................................. [3] (e) The striated muscle of the sea otter is composed of fibres called myofibrils. Myofibrils are made of units called sarcomeres. Describe the proteins that are involved in the contraction of a sarcomere. ................................................................................................................................................... ................................................................................................................................................... ................................................................................................................................................... ................................................................................................................................................... ................................................................................................................................................... ................................................................................................................................................... ................................................................................................................................................... ............................................................................................................................................. [4] [Total: 15]
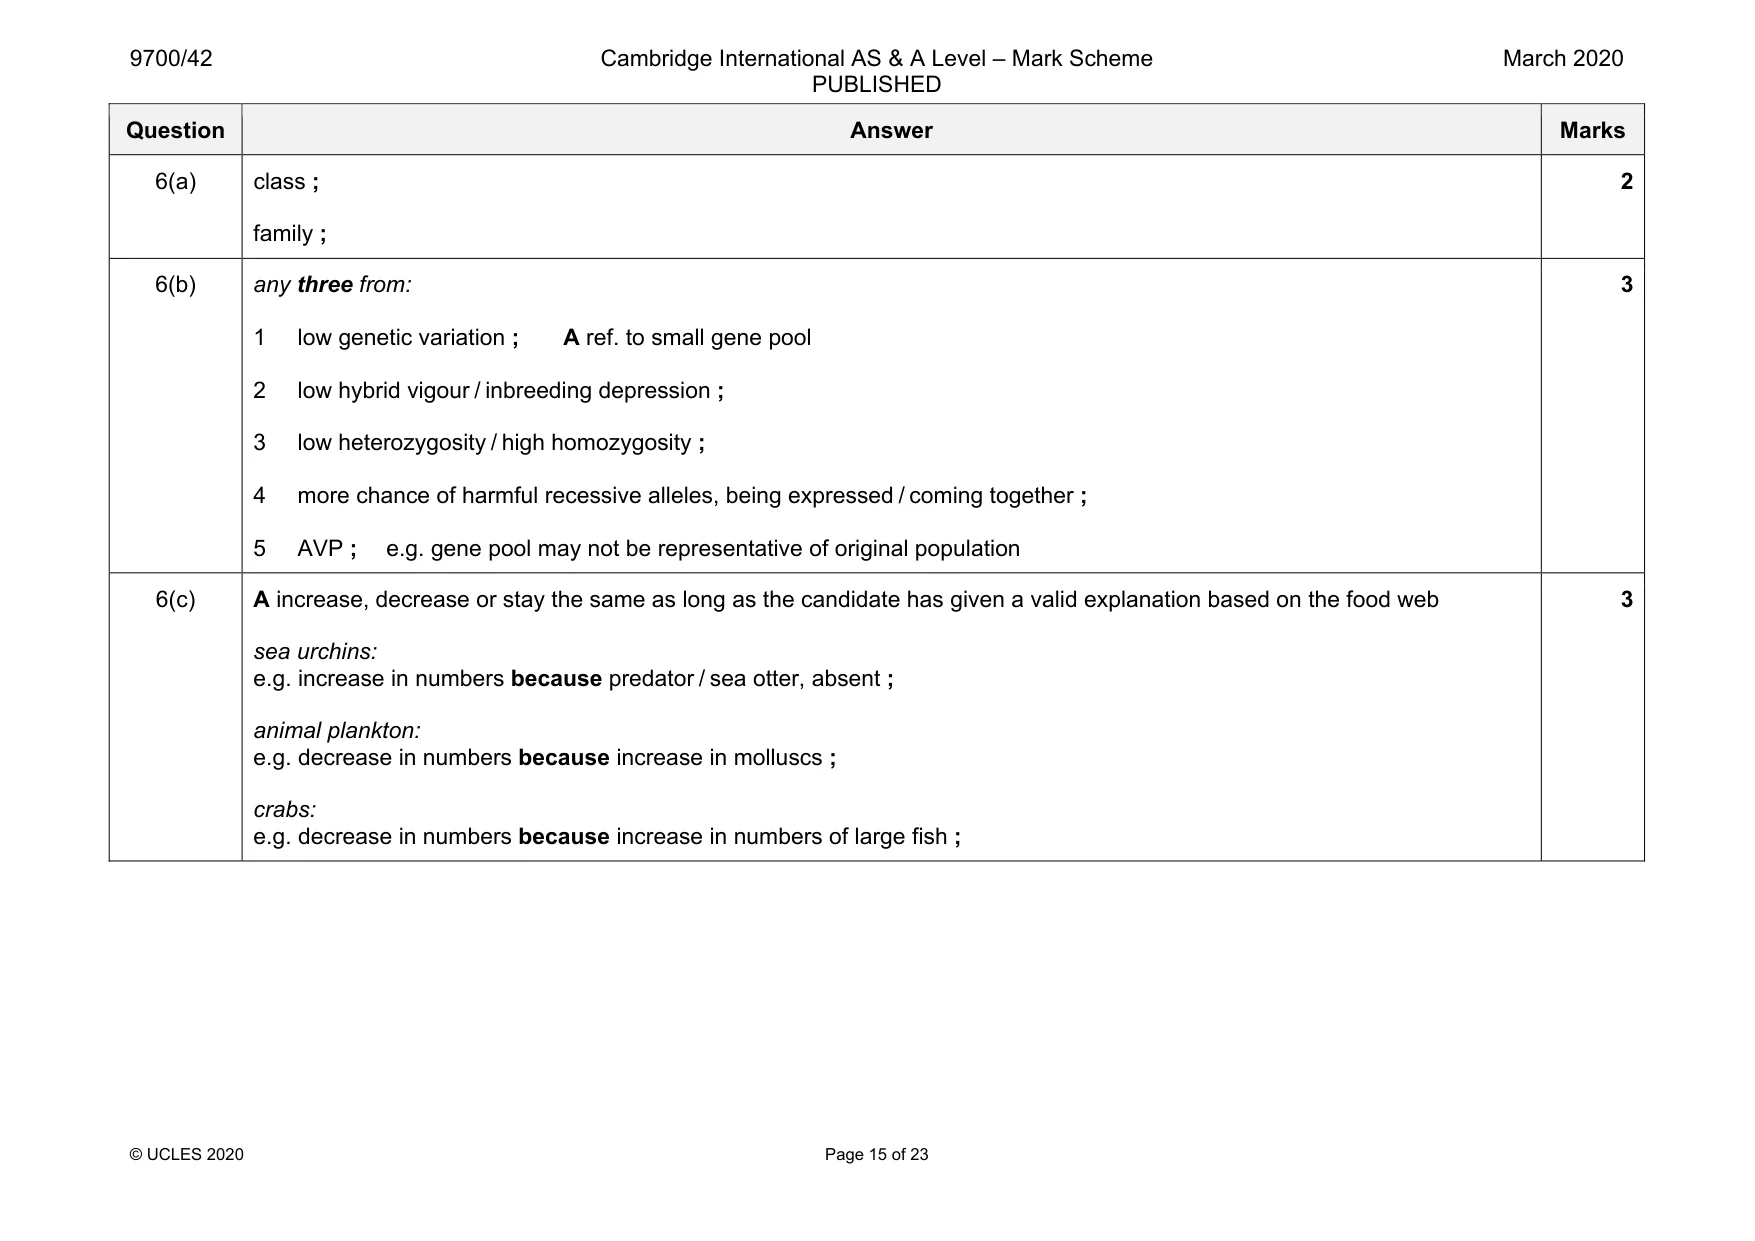
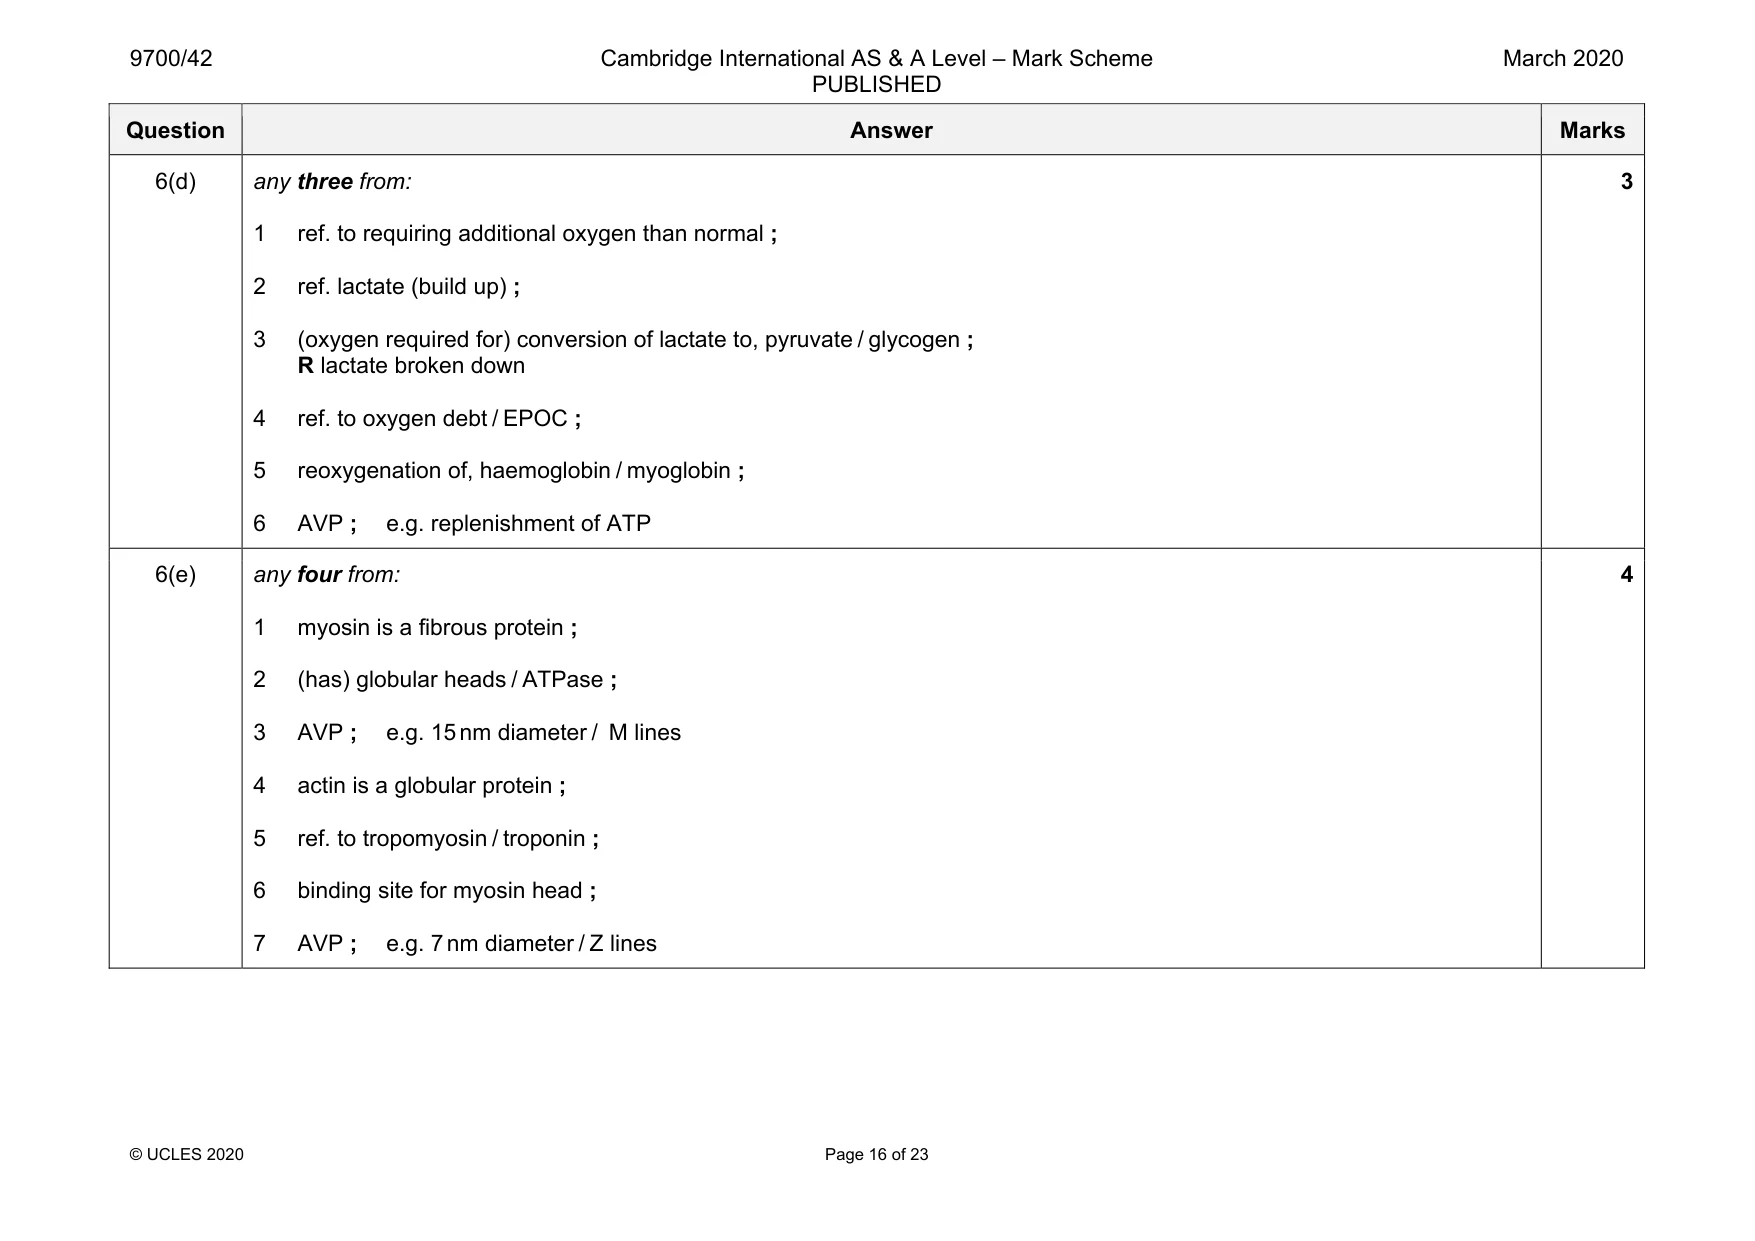
Mark scheme: 6(a) class ; family ; 2 6(b) any three from: 1 low genetic variation ; A ref. to small gene pool 2 low hybrid vigour / inbreeding depression ; 3 low heterozygosity / high homozygosity ; 4 more chance of harmful recessive alleles, being expressed / coming together ; 5 AVP ; e.g. gene pool may not be representative of original population 3 6(c) A increase, decrease or stay the same as long as the candidate has given a valid explanation based on the food web sea urchins: e.g. increase in numbers because predator / sea otter, absent ; animal plankton: e.g. decrease in numbers because increase in molluscs ; crabs: e.g. decrease in numbers because increase in numbers of large fish ; 3 Question Answer Marks 6(d) any three from: 1 ref. to requiring additional oxygen than normal ; 2 ref. lactate (build up) ; 3 (oxygen required for) conversion of lactate to, pyruvate / glycogen ; R lactate broken down 4 ref. to oxygen debt / EPOC ; 5 reoxygenation of, haemoglobin / myoglobin ; 6 AVP ; e.g. replenishment of ATP 3 6(e) any four from: 1 myosin is a fibrous protein ; 2 (has) globular heads / ATPase ; 3 AVP ; e.g. 15 nm diameter / M lines 4 actin is a globular protein ; 5 ref. to tropomyosin / troponin ; 6 binding site for myosin head ; 7 AVP ; e.g. 7 nm diameter / Z lines 4
Question 7
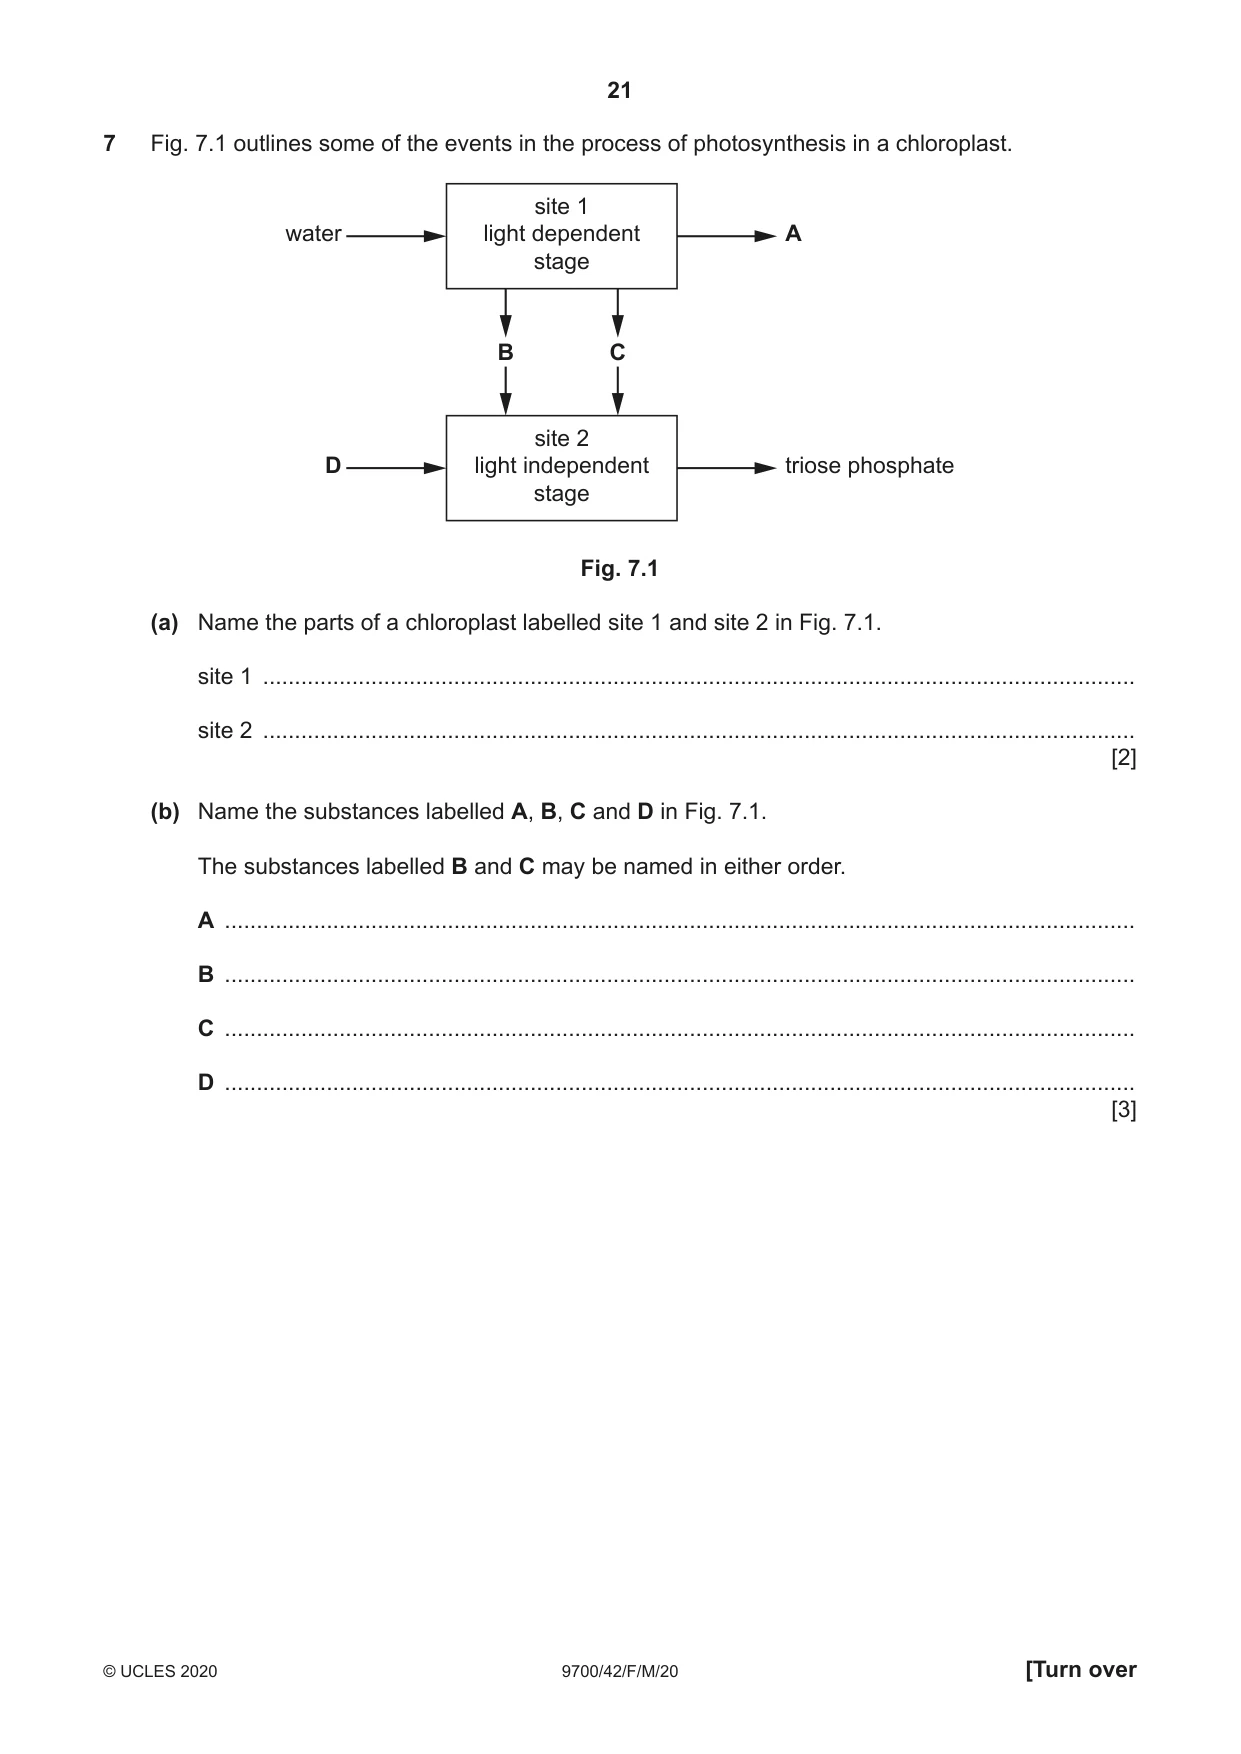
7 Fig. 7.1 outlines some of the events in the process of photosynthesis in a chloroplast. site 1 water light dependent A stage B C site 2 D light independent triose phosphate stage Fig. 7.1 (a) Name the parts of a chloroplast labelled site 1 and site 2 in Fig. 7.1. site 1 ......................................................................................................................................... site 2 ......................................................................................................................................... [2] (b) Name the substances labelled A, B, C and D in Fig. 7.1. The substances labelled B and C may be named in either order. A ............................................................................................................................................... B ............................................................................................................................................... C ............................................................................................................................................... D ............................................................................................................................................... [3] (c) Most of the triose phosphate produced in the light independent stage is used to regenerate RuBP so that the Calvin cycle can continue. Some of the triose phosphate is used to make other organic compounds with a range of functions. State three different functions of these other organic compounds in a plant cell and give one example of an organic compound for each function. function ..................................................................................................................................... ................................................................................................................................................... compound ................................................................................................................................. function ..................................................................................................................................... ................................................................................................................................................... compound ................................................................................................................................. function ..................................................................................................................................... ................................................................................................................................................... compound ................................................................................................................................. [3] [Total: 8]
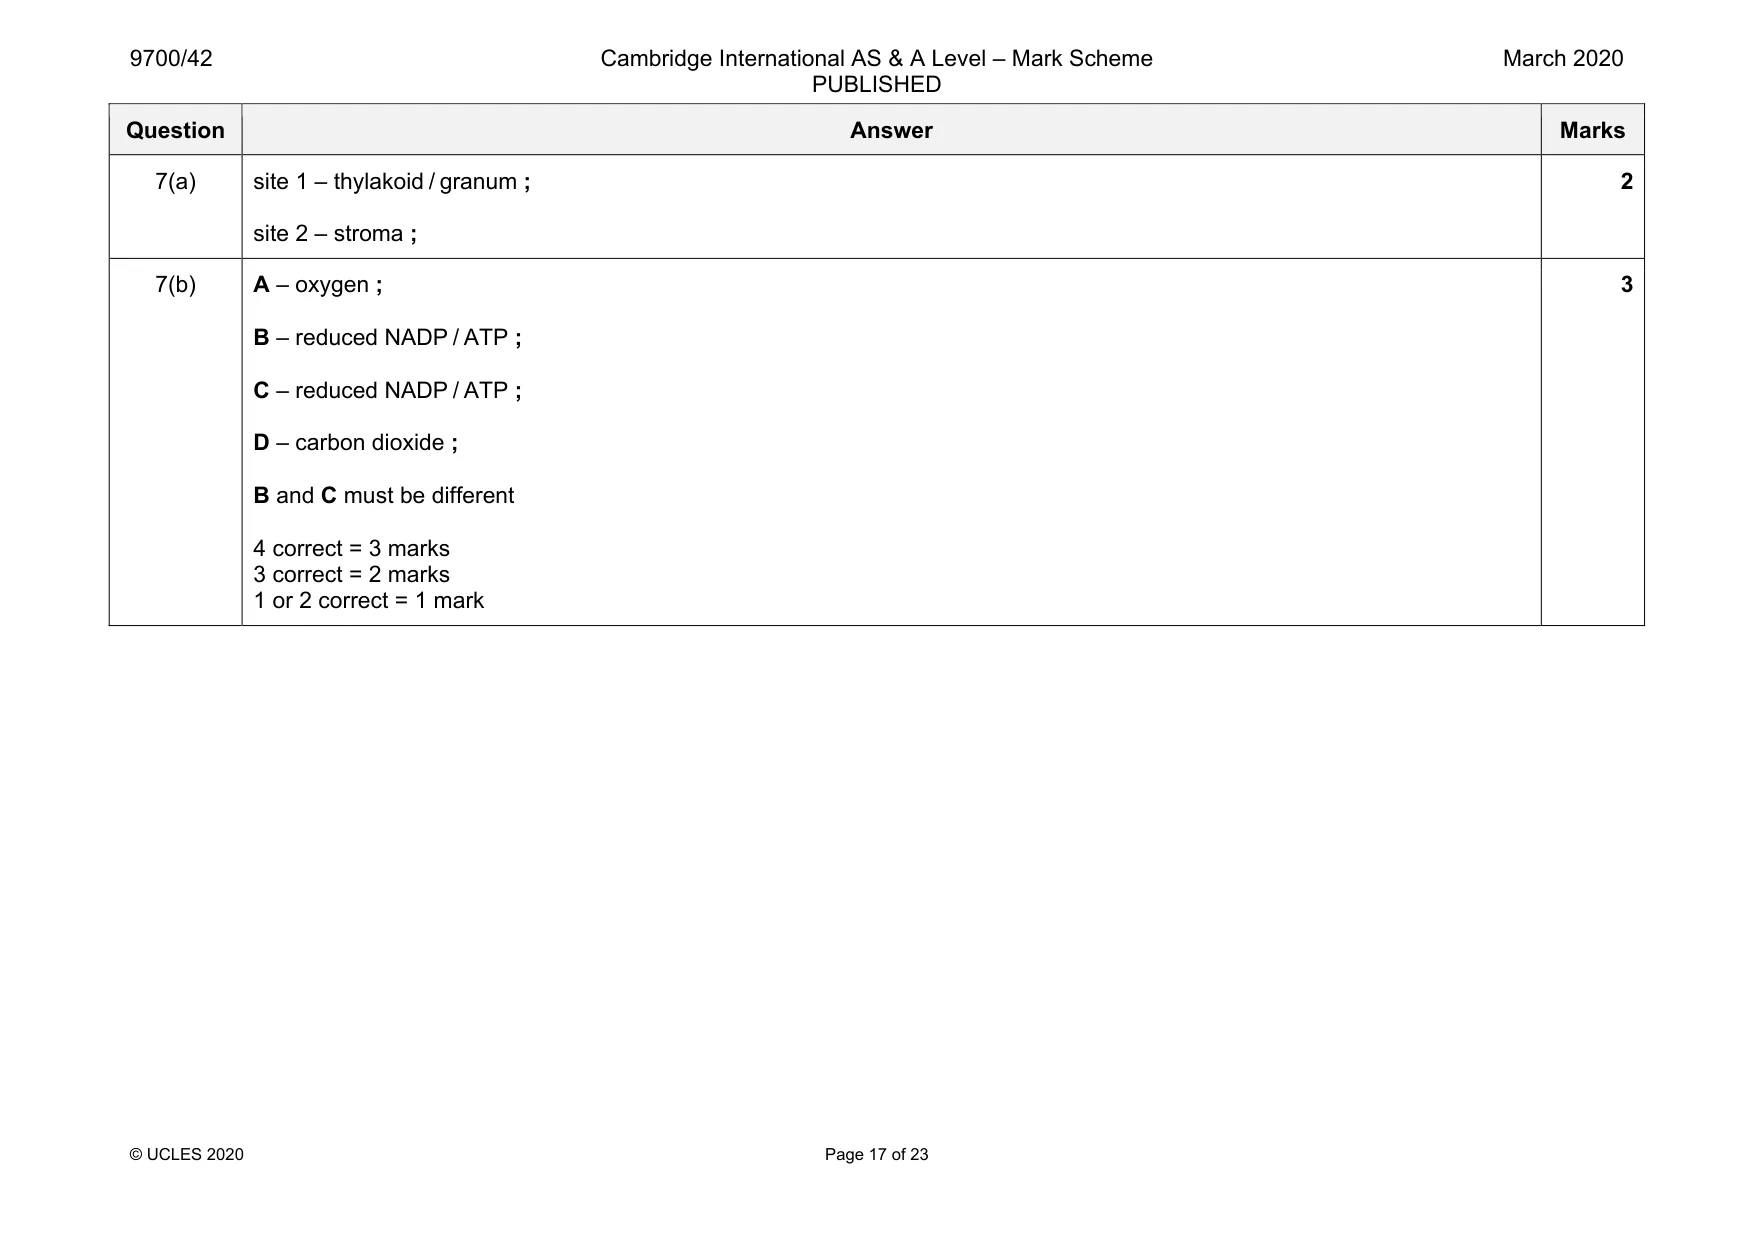
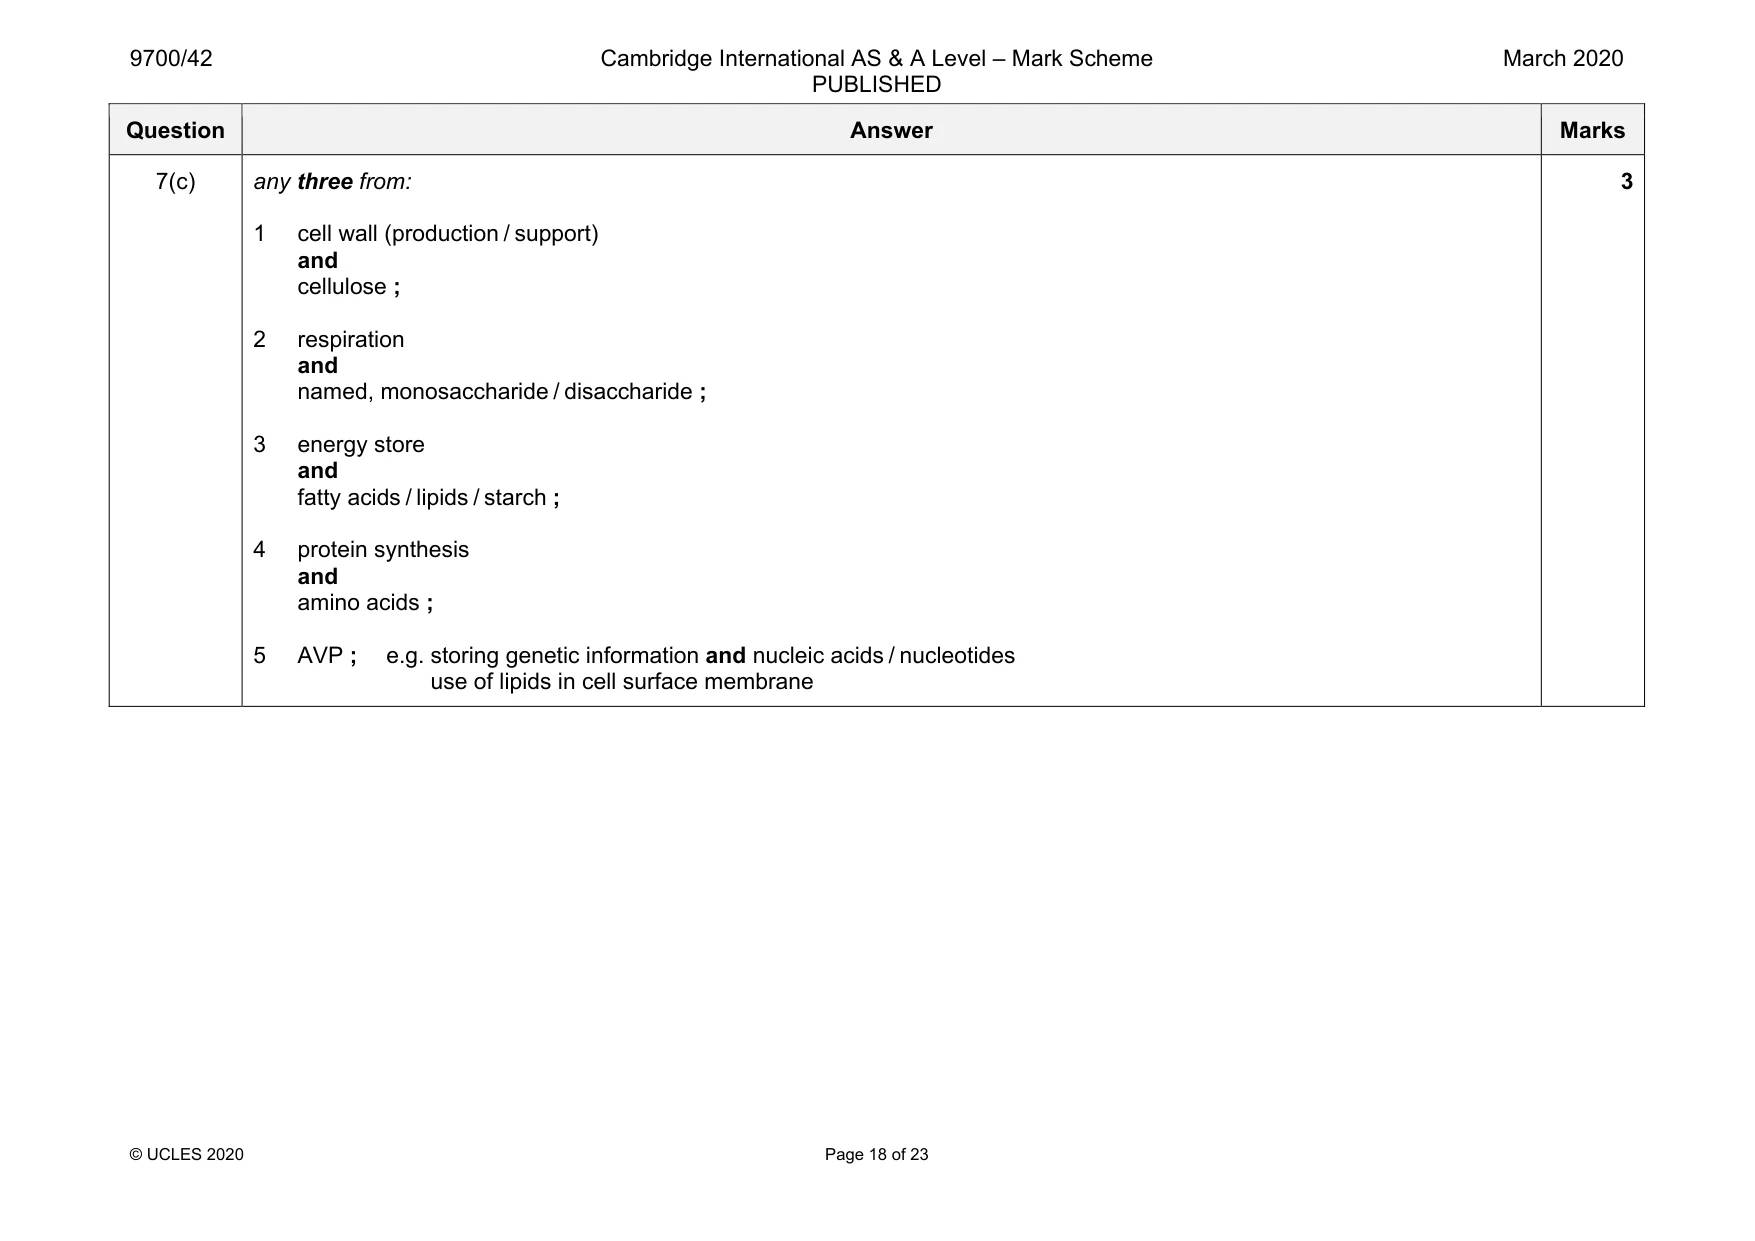
Mark scheme: 7(a) site 1 – thylakoid / granum ; site 2 – stroma ; 2 7(b) A – oxygen ; B – reduced NADP / ATP ; C – reduced NADP / ATP ; D – carbon dioxide ; B and C must be different 4 correct = 3 marks 3 correct = 2 marks 1 or 2 correct = 1 mark 3 Question Answer Marks 7(c) any three from: 1 cell wall (production / support) and cellulose ; 2 respiration and named, monosaccharide / disaccharide ; 3 energy store and fatty acids / lipids / starch ; 4 protein synthesis and amino acids ; 5 AVP ; e.g. storing genetic information and nucleic acids / nucleotides use of lipids in cell surface membrane 3
More questions on Photosynthesis as an energy transfer process
Q8 · Farmers can use insecticides to remove parasites from their sheep
8 Farmers can use insecticides to remove parasites from their sheep. Some of these insecticides act as inhibitors of the enzyme acetylcholinesterase. (a) Suggest and explain how an inhibitor of acetylcholinesterase could work. ................................................................................................................................................... ................................................................................................................................................... ................................................................................................................................................... ................................................................................................................................................... ................................................................................................................................................... ................................................................................................................................................... ................................................................................................................................................... ................................................................................................................................................... ............................................................................................................................................. [3] (b) Acetylcholinesterase inhibitors affect nerve impulse conduction. Explain the effects of the inhibition of acetylcholinesterase at a synapse. ................................................................................................................................................... ................................................................................................................................................... ................................................................................................................................................... ................................................................................................................................................... ................................................................................................................................................... ................................................................................................................................................... ............................................................................................................................................. [3] (c) Suggest one way of reducing the effects of acetylcholinesterase inhibitors. ................................................................................................................................................... ................................................................................................................................................... ............................................................................................................................................. [1] [Total: 7]
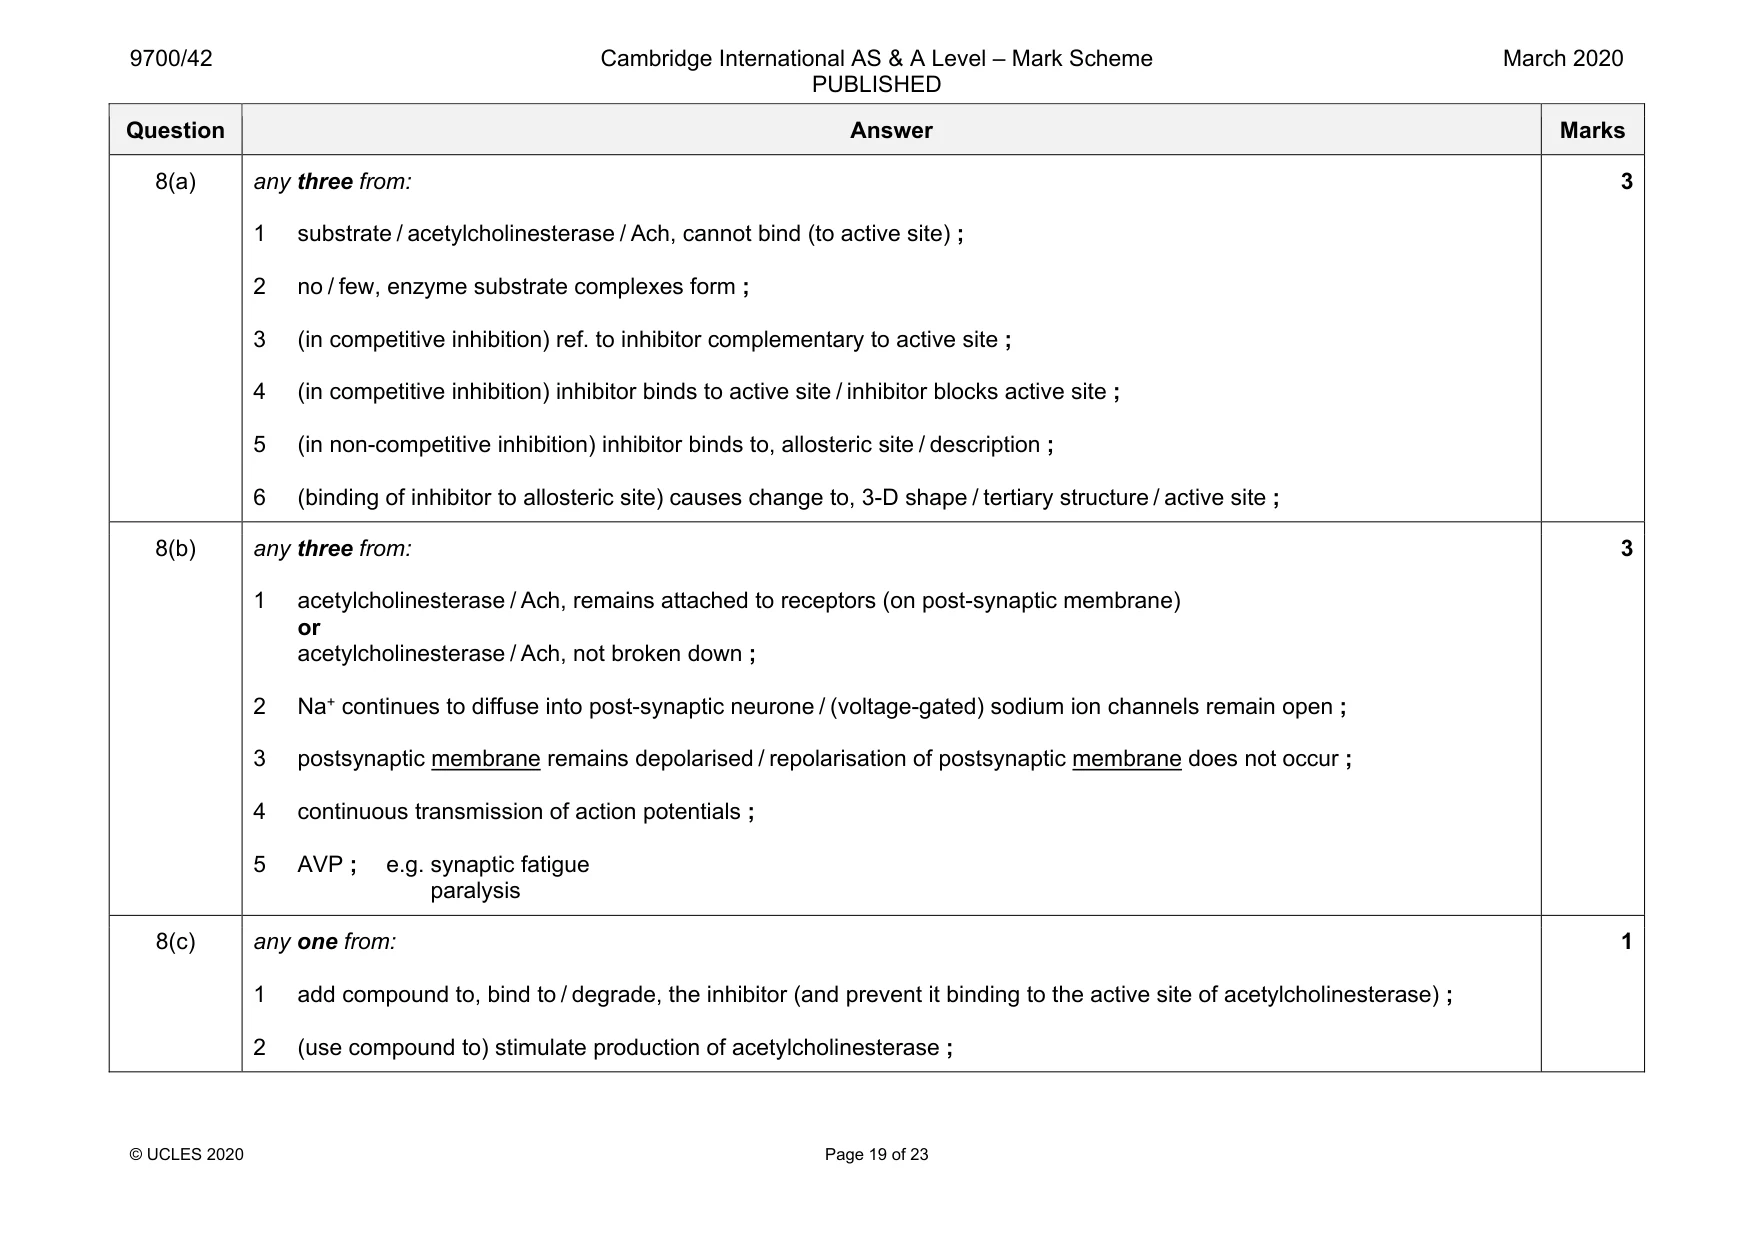
Mark scheme: 8(a) any three from: 1 substrate / acetylcholinesterase / Ach, cannot bind (to active site) ; 2 no / few, enzyme substrate complexes form ; 3 (in competitive inhibition) ref. to inhibitor complementary to active site ; 4 (in competitive inhibition) inhibitor binds to active site / inhibitor blocks active site ; 5 (in non-competitive inhibition) inhibitor binds to, allosteric site / description ; 6 (binding of inhibitor to allosteric site) causes change to, 3-D shape / tertiary structure / active site ; 3 8(b) any three from: 1 acetylcholinesterase / Ach, remains attached to receptors (on post-synaptic membrane) or acetylcholinesterase / Ach, not broken down ; 2 Na+ continues to diffuse into post-synaptic neurone / (voltage-gated) sodium ion channels remain open ; 3 postsynaptic membrane remains depolarised / repolarisation of postsynaptic membrane does not occur ; 4 continuous transmission of action potentials ; 5 AVP ; e.g. synaptic fatigue paralysis 3 8(c) any one from: 1 add compound to, bind to / degrade, the inhibitor (and prevent it binding to the active site of acetylcholinesterase) ; 2 (use compound to) stimulate production of acetylcholinesterase ; 1
Q9 · Explain how meiosis and fertilisation can result in genetic variation amongst offspring
9 (a) Explain how meiosis and fertilisation can result in genetic variation amongst offspring. [8] (b) Outline the effects of mutant alleles on the phenotype in albinism and haemophilia. [7] [Total: 15]
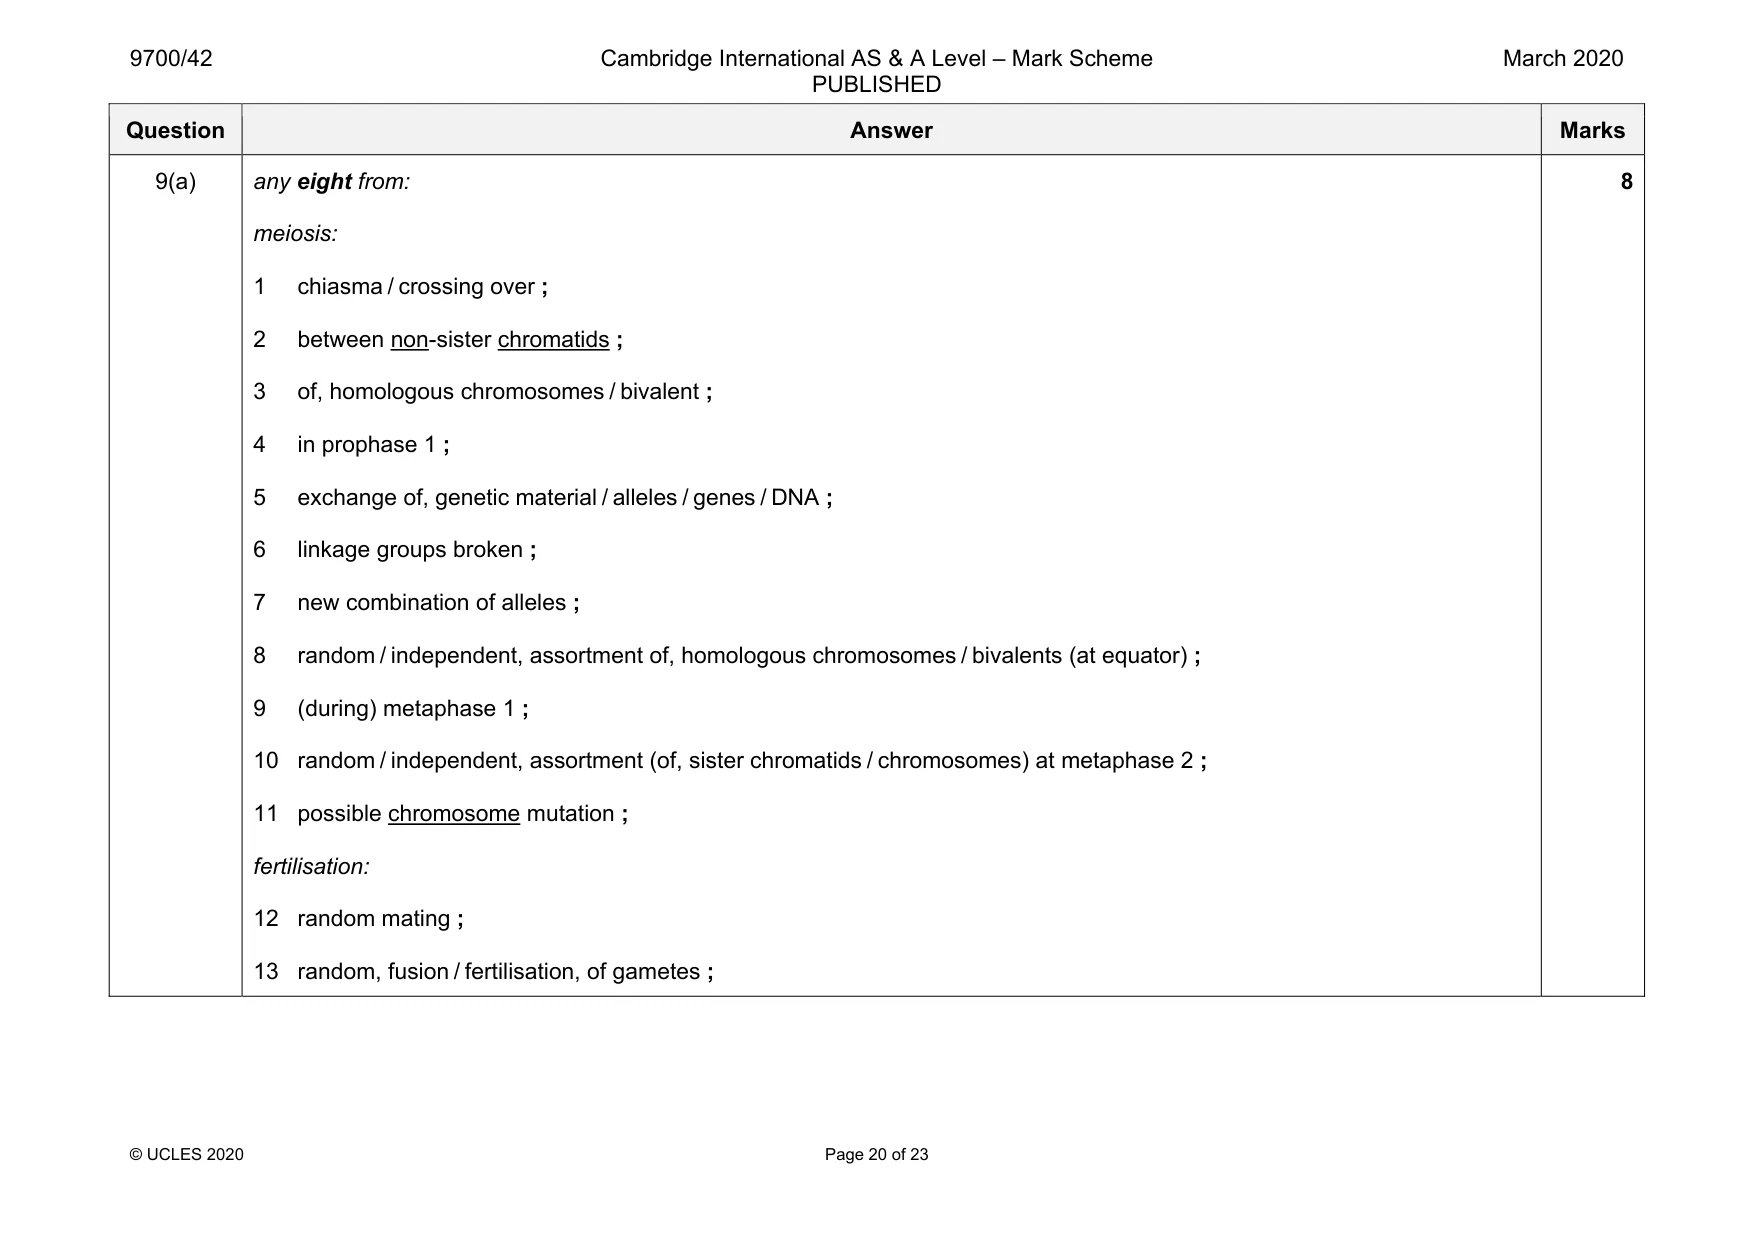
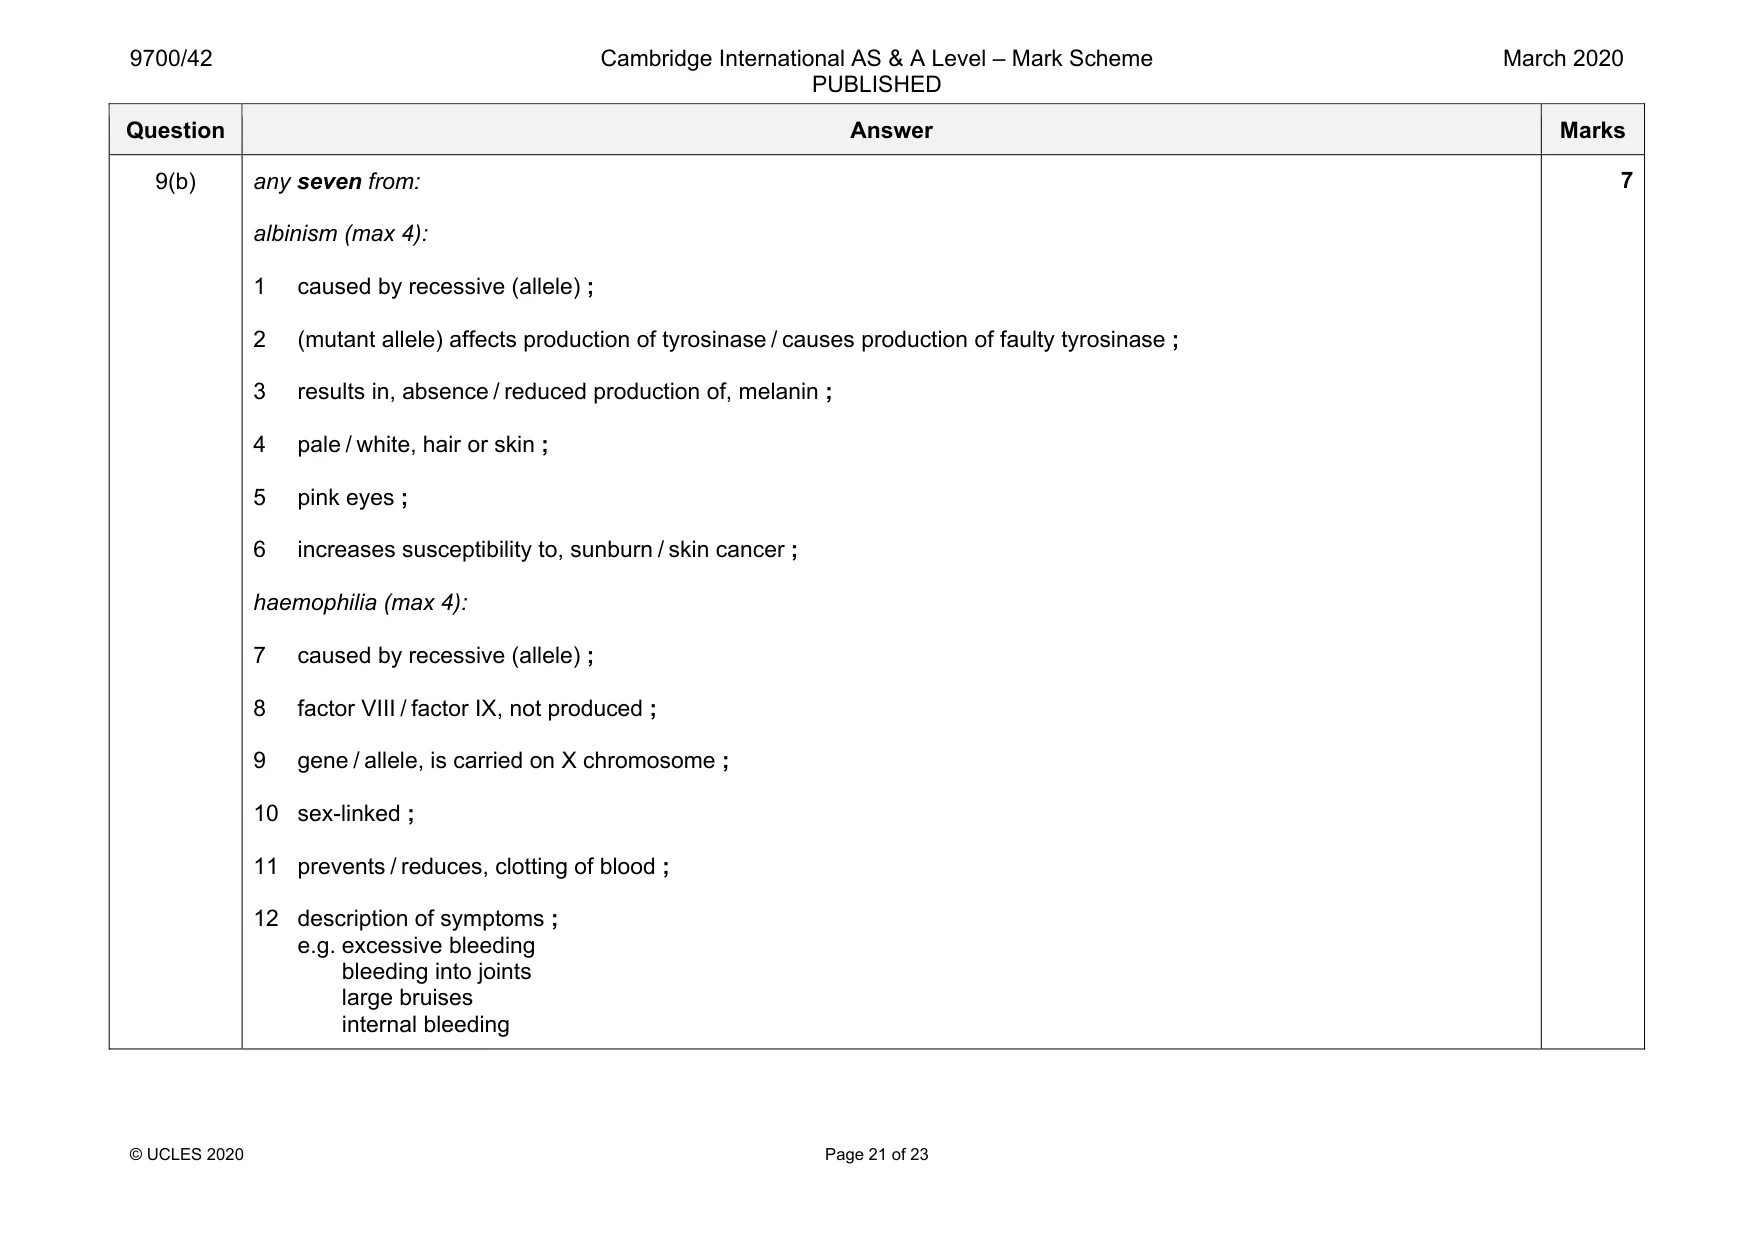
Mark scheme: 9(a) any eight from: meiosis: 1 chiasma / crossing over ; 2 between non-sister chromatids ; 3 of, homologous chromosomes / bivalent ; 4 in prophase 1 ; 5 exchange of, genetic material / alleles / genes / DNA ; 6 linkage groups broken ; 7 new combination of alleles ; 8 random / independent, assortment of, homologous chromosomes / bivalents (at equator) ; 9 (during) metaphase 1 ; 10 random / independent, assortment (of, sister chromatids / chromosomes) at metaphase 2 ; 11 possible chromosome mutation ; fertilisation: 12 random mating ; 13 random, fusion / fertilisation, of gametes ; 8 Question Answer Marks 9(b) any seven from: albinism (max 4): 1 caused by recessive (allele) ; 2 (mutant allele) affects production of tyrosinase / causes production of faulty tyrosinase ; 3 results in, absence / reduced production of, melanin ; 4 pale / white, hair or skin ; 5 pink eyes ; 6 increases susceptibility to, sunburn / skin cancer ; haemophilia (max 4): 7 caused by recessive (allele) ; 8 factor VIII / factor IX, not produced ; 9 gene / allele, is carried on X chromosome ; 10 sex-linked ; 11 prevents / reduces, clotting of blood ; 12 description of symptoms ; e.g. excessive bleeding bleeding into joints large bruises internal bleeding 7
Q10 · Describe how random sampling can be used to assess the distribution and abundance of…
10 (a) Describe how random sampling can be used to assess the distribution and abundance of plants in an area. [6] (b) Describe named examples of threats to the biodiversity of aquatic ecosystems and terrestrial ecosystems. [9] [Total: 15] .................................................................................................................................................................. .................................................................................................................................................................. .................................................................................................................................................................. .................................................................................................................................................................. .................................................................................................................................................................. .................................................................................................................................................................. .................................................................................................................................................................. .................................................................................................................................................................. .................................................................................................................................................................. .................................................................................................................................................................. .................................................................................................................................................................. .................................................................................................................................................................. .................................................................................................................................................................. .................................................................................................................................................................. .................................................................................................................................................................. .................................................................................................................................................................. .................................................................................................................................................................. .................................................................................................................................................................. .................................................................................................................................................................. .................................................................................................................................................................. .................................................................................................................................................................. .................................................................................................................................................................. .................................................................................................................................................................. .................................................................................................................................................................. .................................................................................................................................................................. .................................................................................................................................................................. .................................................................................................................................................................. .................................................................................................................................................................. .................................................................................................................................................................. .................................................................................................................................................................. .................................................................................................................................................................. .................................................................................................................................................................. .................................................................................................................................................................. .................................................................................................................................................................. .................................................................................................................................................................. .................................................................................................................................................................. .................................................................................................................................................................. .................................................................................................................................................................. .................................................................................................................................................................. .................................................................................................................................................................. .................................................................................................................................................................. .................................................................................................................................................................. .................................................................................................................................................................. .................................................................................................................................................................. .................................................................................................................................................................. .................................................................................................................................................................. .................................................................................................................................................................. .................................................................................................................................................................. .................................................................................................................................................................. .................................................................................................................................................................. .................................................................................................................................................................. .................................................................................................................................................................. .................................................................................................................................................................. .................................................................................................................................................................. .................................................................................................................................................................. .................................................................................................................................................................. .................................................................................................................................................................. .................................................................................................................................................................. .................................................................................................................................................................. .................................................................................................................................................................. .................................................................................................................................................................. .................................................................................................................................................................. .................................................................................................................................................................. .................................................................................................................................................................. .................................................................................................................................................................. .................................................................................................................................................................. .................................................................................................................................................................. .................................................................................................................................................................. .................................................................................................................................................................. .................................................................................................................................................................. .................................................................................................................................................................. .................................................................................................................................................................. ..................................................................................................................................................................
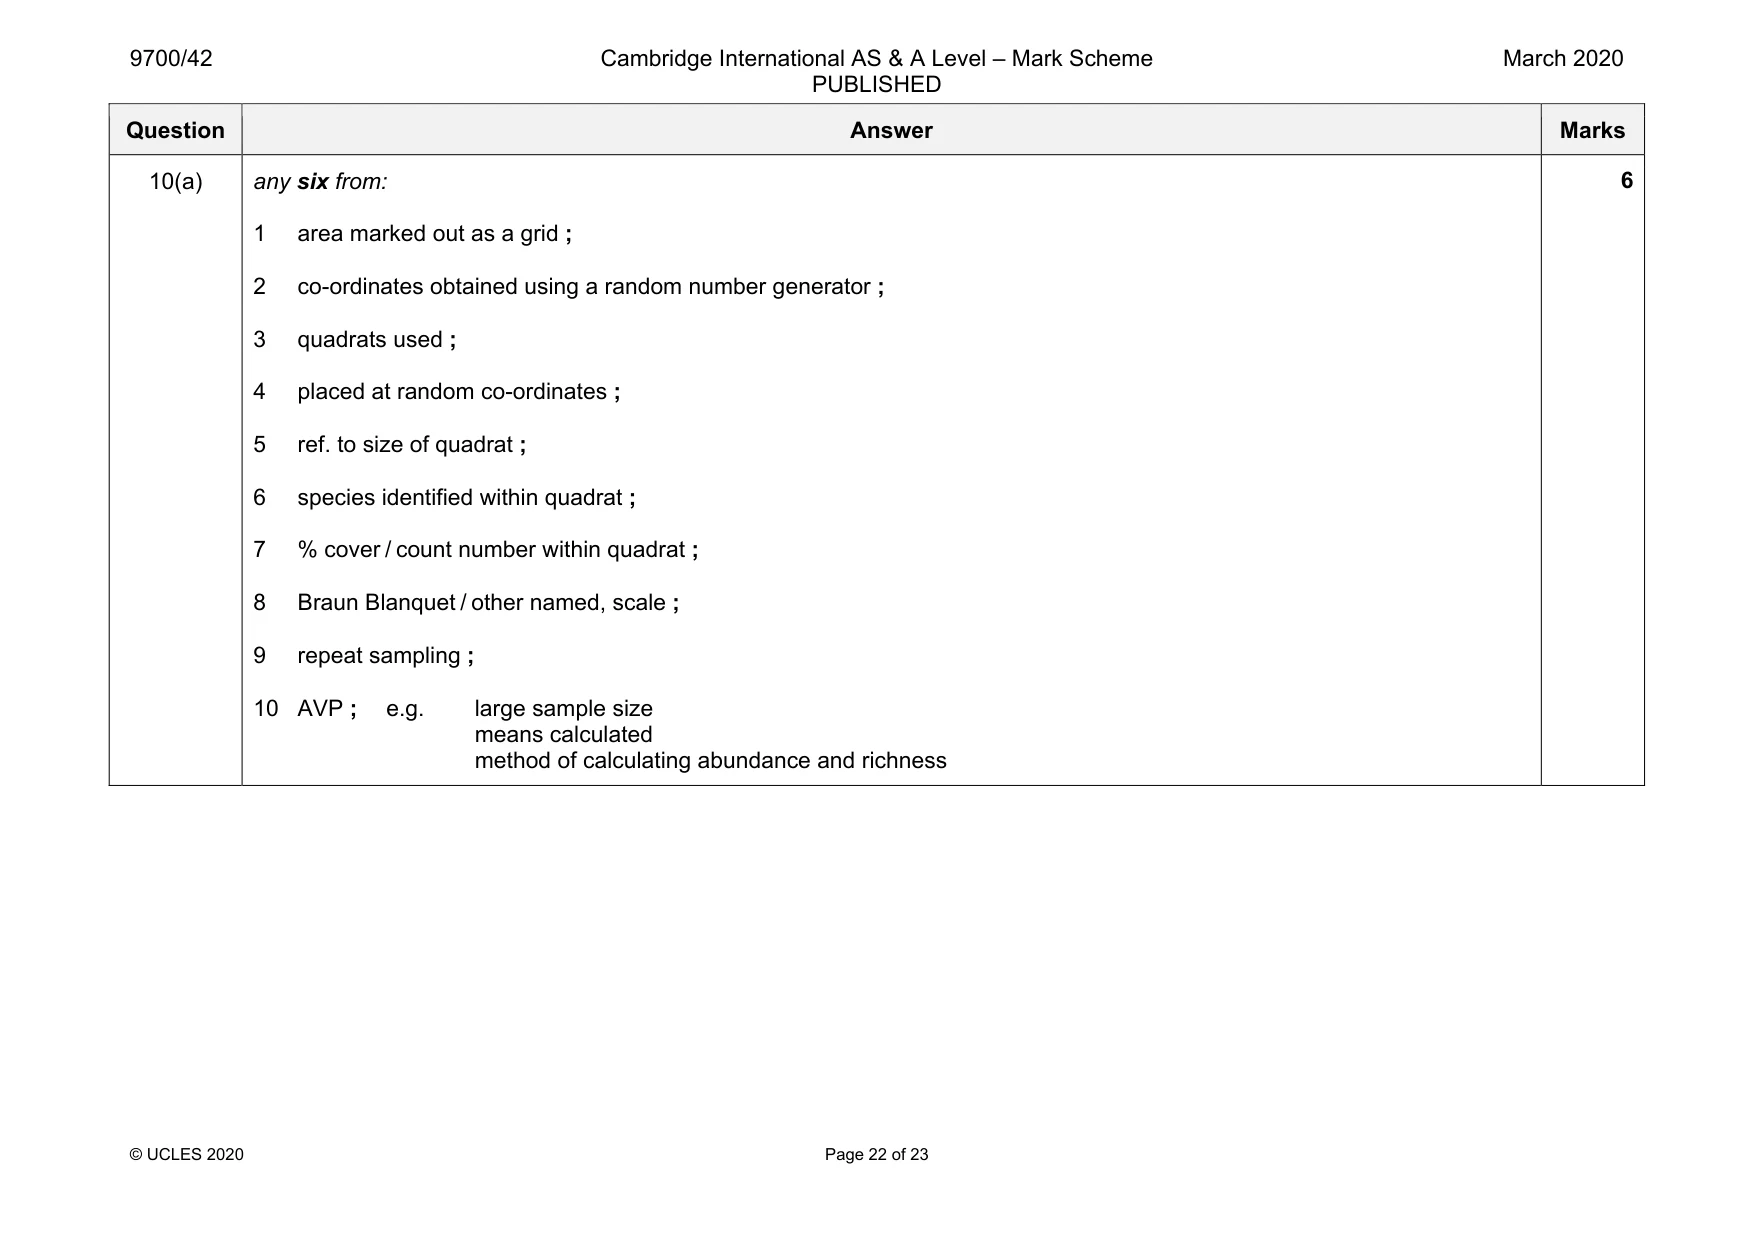
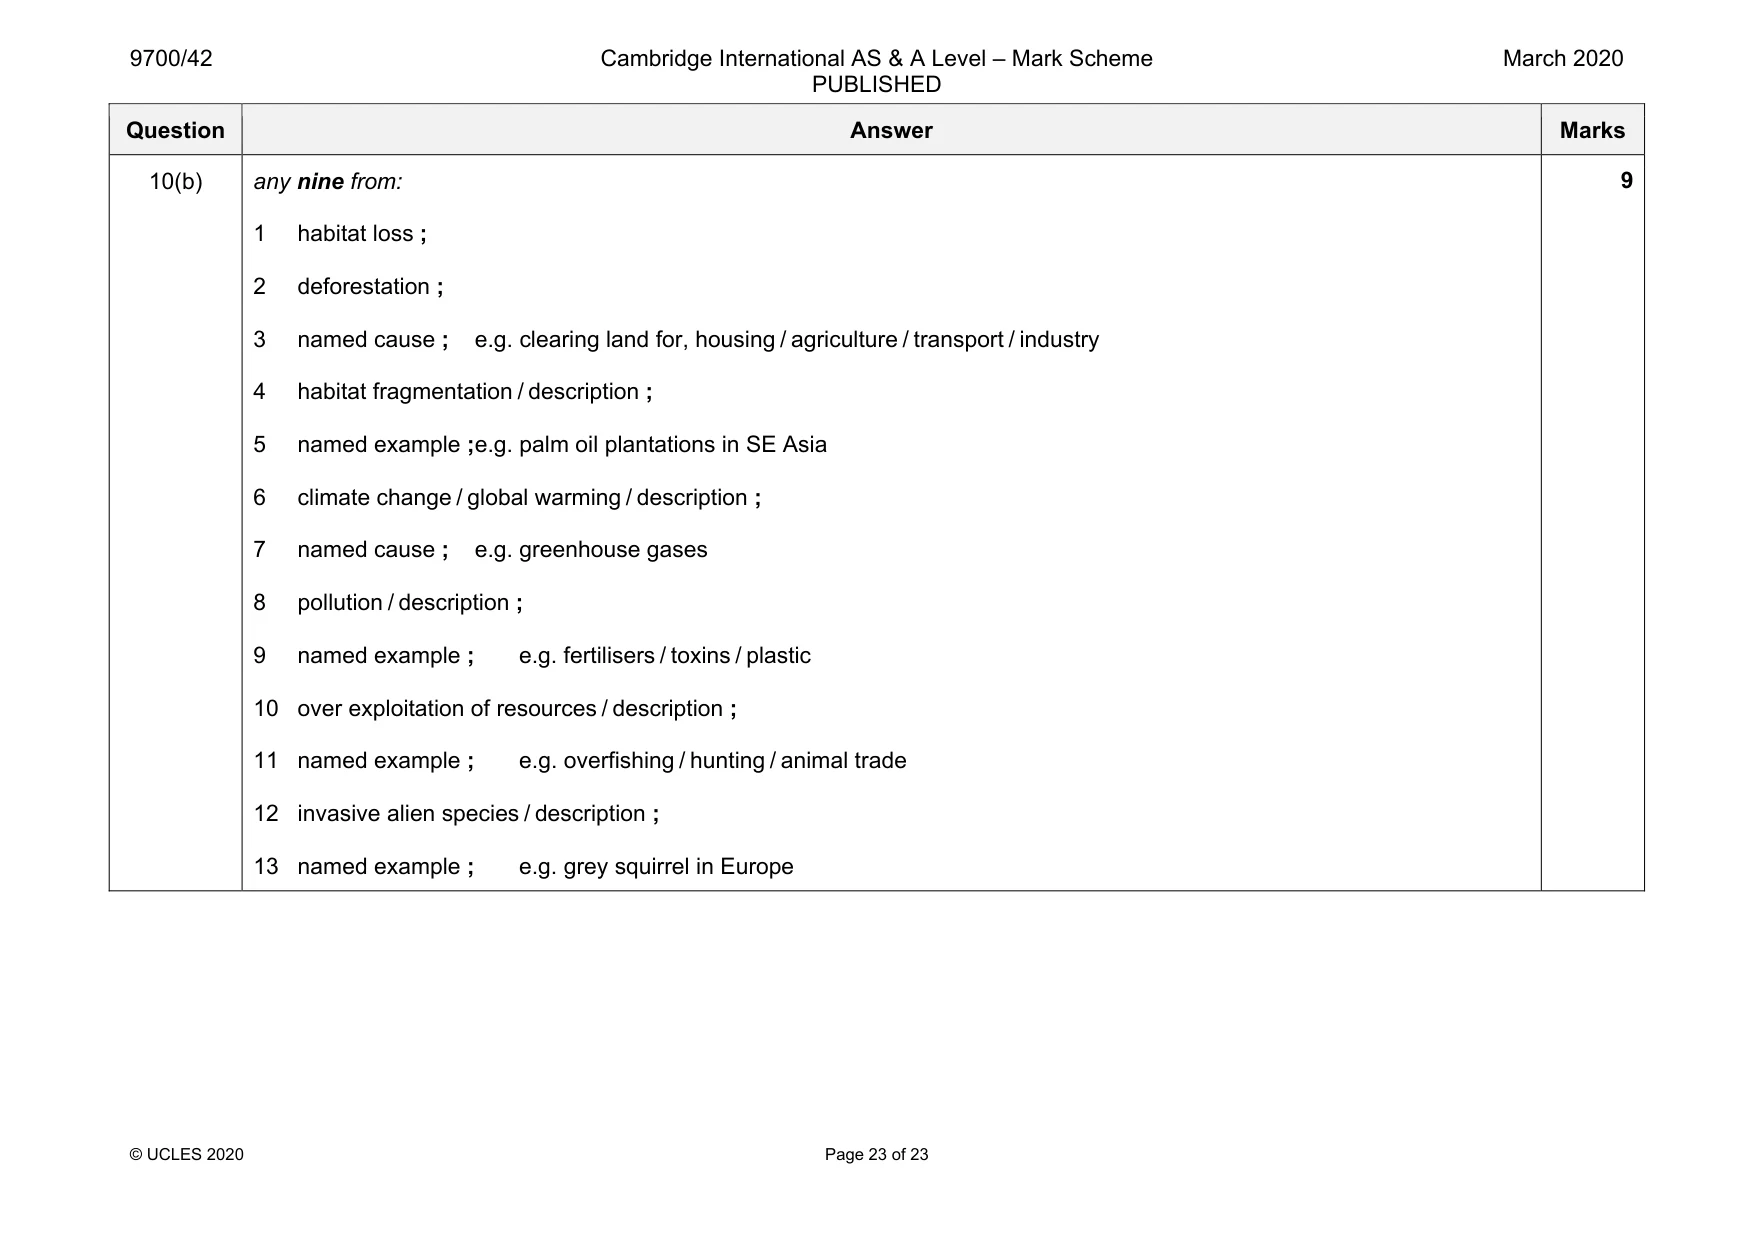
Mark scheme: 10(a) any six from: 1 area marked out as a grid ; 2 co-ordinates obtained using a random number generator ; 3 quadrats used ; 4 placed at random co-ordinates ; 5 ref. to size of quadrat ; 6 species identified within quadrat ; 7 % cover / count number within quadrat ; 8 Braun Blanquet / other named, scale ; 9 repeat sampling ; 10 AVP ; e.g. large sample size means calculated method of calculating abundance and richness Question Answer Marks 10(b) any nine from: 1 habitat loss ; 2 deforestation ; 3 named cause ; e.g. clearing land for, housing / agriculture / transport / industry 4 habitat fragmentation / description ; 5 named example ; e.g. palm oil plantations in SE Asia 6 climate change / global warming / description ; 7 named cause ; e.g. greenhouse gases 8 pollution / description ; 9 named example ; e.g. fertilisers / toxins / plastic 10 over exploitation of resources / description ; 11 named example ; e.g. overfishing / hunting / animal trade 12 invasive alien species / description ; 13 named example ; e.g. grey squirrel in Europe 9
What was in this paper
The subtopics covered by these 10 questions, and how many questions each got. Open one in a new tab to see every Cambridge question on it.
What you needed in this session
Cambridge’s own grade thresholds for 2020 Feb/March, Paper 4 · Variant 2. A higher threshold means an easier paper — the bar moves with how the cohort did.