Cambridge A Level Biology 9700 — 2020 Feb/March Paper 2 · Variant 2
9700/22/F/M/20 · 6 questions · 60 marks · ≈68 min
The question paper and its mark scheme, free to read here and free to download. This is Cambridge’s own paper, exactly as it was sat.
Question paper16 pages
Mark scheme13 pages
Answers below. Sit the paper first if you are practising.
Questions as text
Q1 · Phloem sap is transported from sources to sinks in phloem sieve tubes
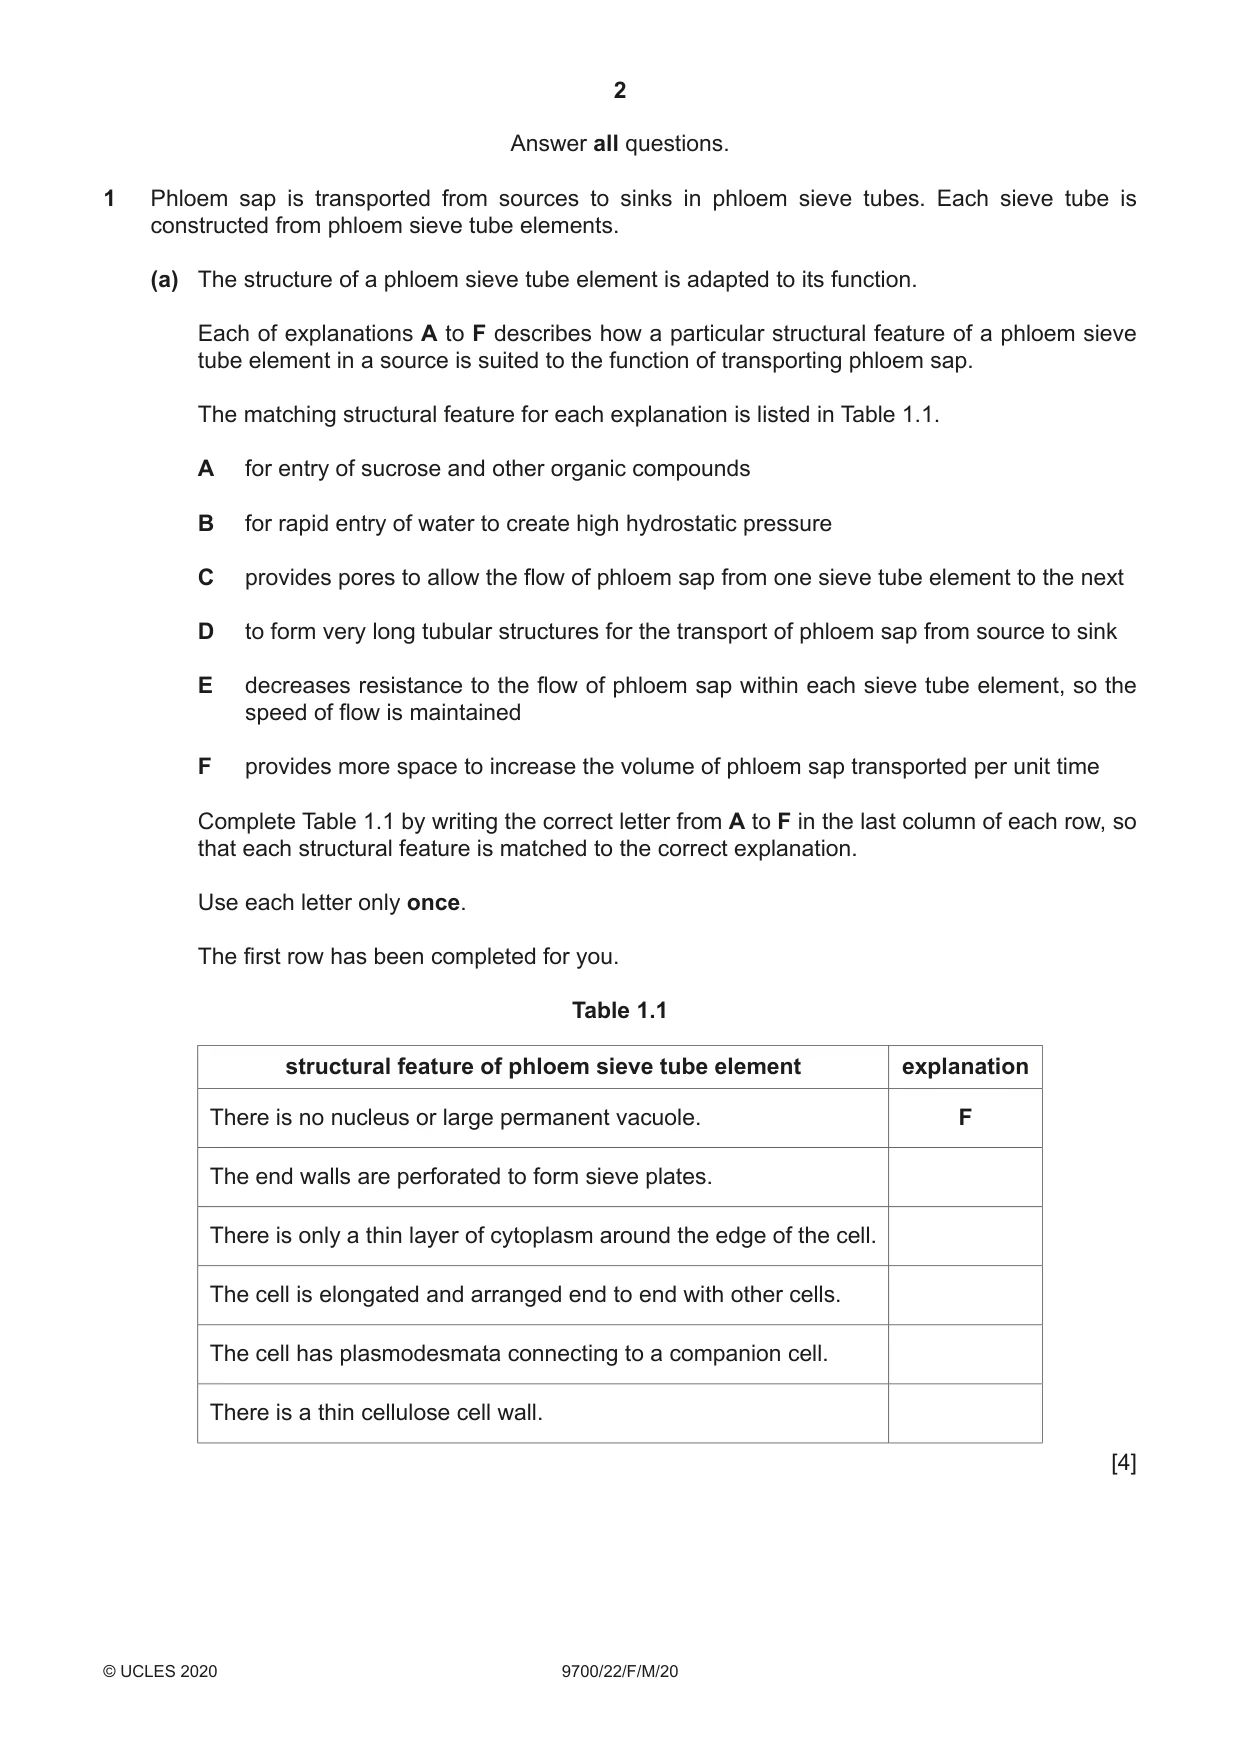
1 Phloem sap is transported from sources to sinks in phloem sieve tubes. Each sieve tube is constructed from phloem sieve tube elements. (a) The structure of a phloem sieve tube element is adapted to its function. Each of explanations A to F describes how a particular structural feature of a phloem sieve tube element in a source is suited to the function of transporting phloem sap. The matching structural feature for each explanation is listed in Table 1.1. A for entry of sucrose and other organic compounds B for rapid entry of water to create high hydrostatic pressure C provides pores to allow the flow of phloem sap from one sieve tube element to the next D to form very long tubular structures for the transport of phloem sap from source to sink E decreases resistance to the flow of phloem sap within each sieve tube element, so the speed of flow is maintained F provides more space to increase the volume of phloem sap transported per unit time Complete Table 1.1 by writing the correct letter from A to F in the last column of each row, so that each structural feature is matched to the correct explanation. Use each letter only once. The first row has been completed for you. Table 1.1 structural feature of phloem sieve tube element explanation There is no nucleus or large permanent vacuole. F The end walls are perforated to form sieve plates. There is only a thin layer of cytoplasm around the edge of the cell. The cell is elongated and arranged end to end with other cells. The cell has plasmodesmata connecting to a companion cell. There is a thin cellulose cell wall. [4] (b) At the sink, sucrose and other organic compounds are unloaded from the phloem sieve tube element. Explain why the process of unloading helps the mass flow of phloem sap from the source to the sink. ................................................................................................................................................... ................................................................................................................................................... ................................................................................................................................................... ................................................................................................................................................... ................................................................................................................................................... ................................................................................................................................................... ............................................................................................................................................. [3] [Total: 7]
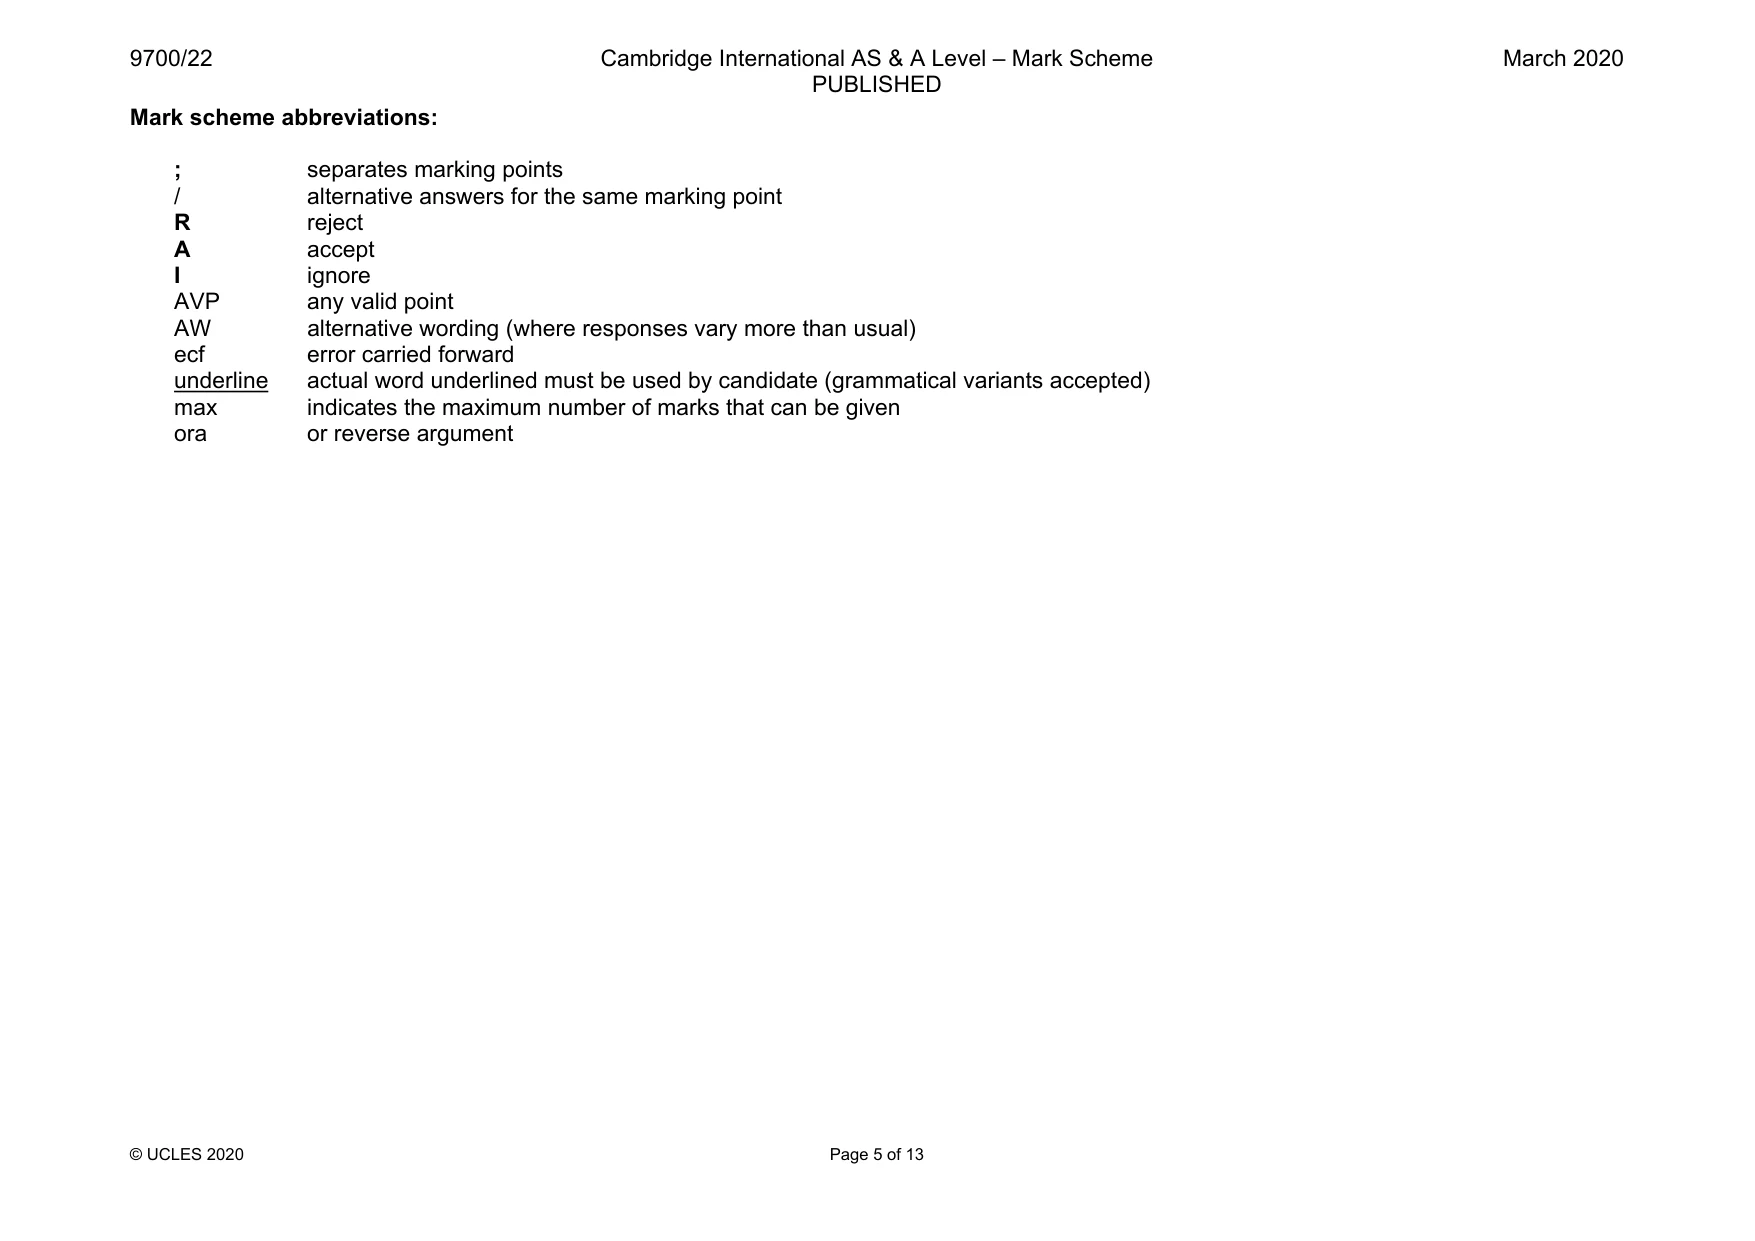
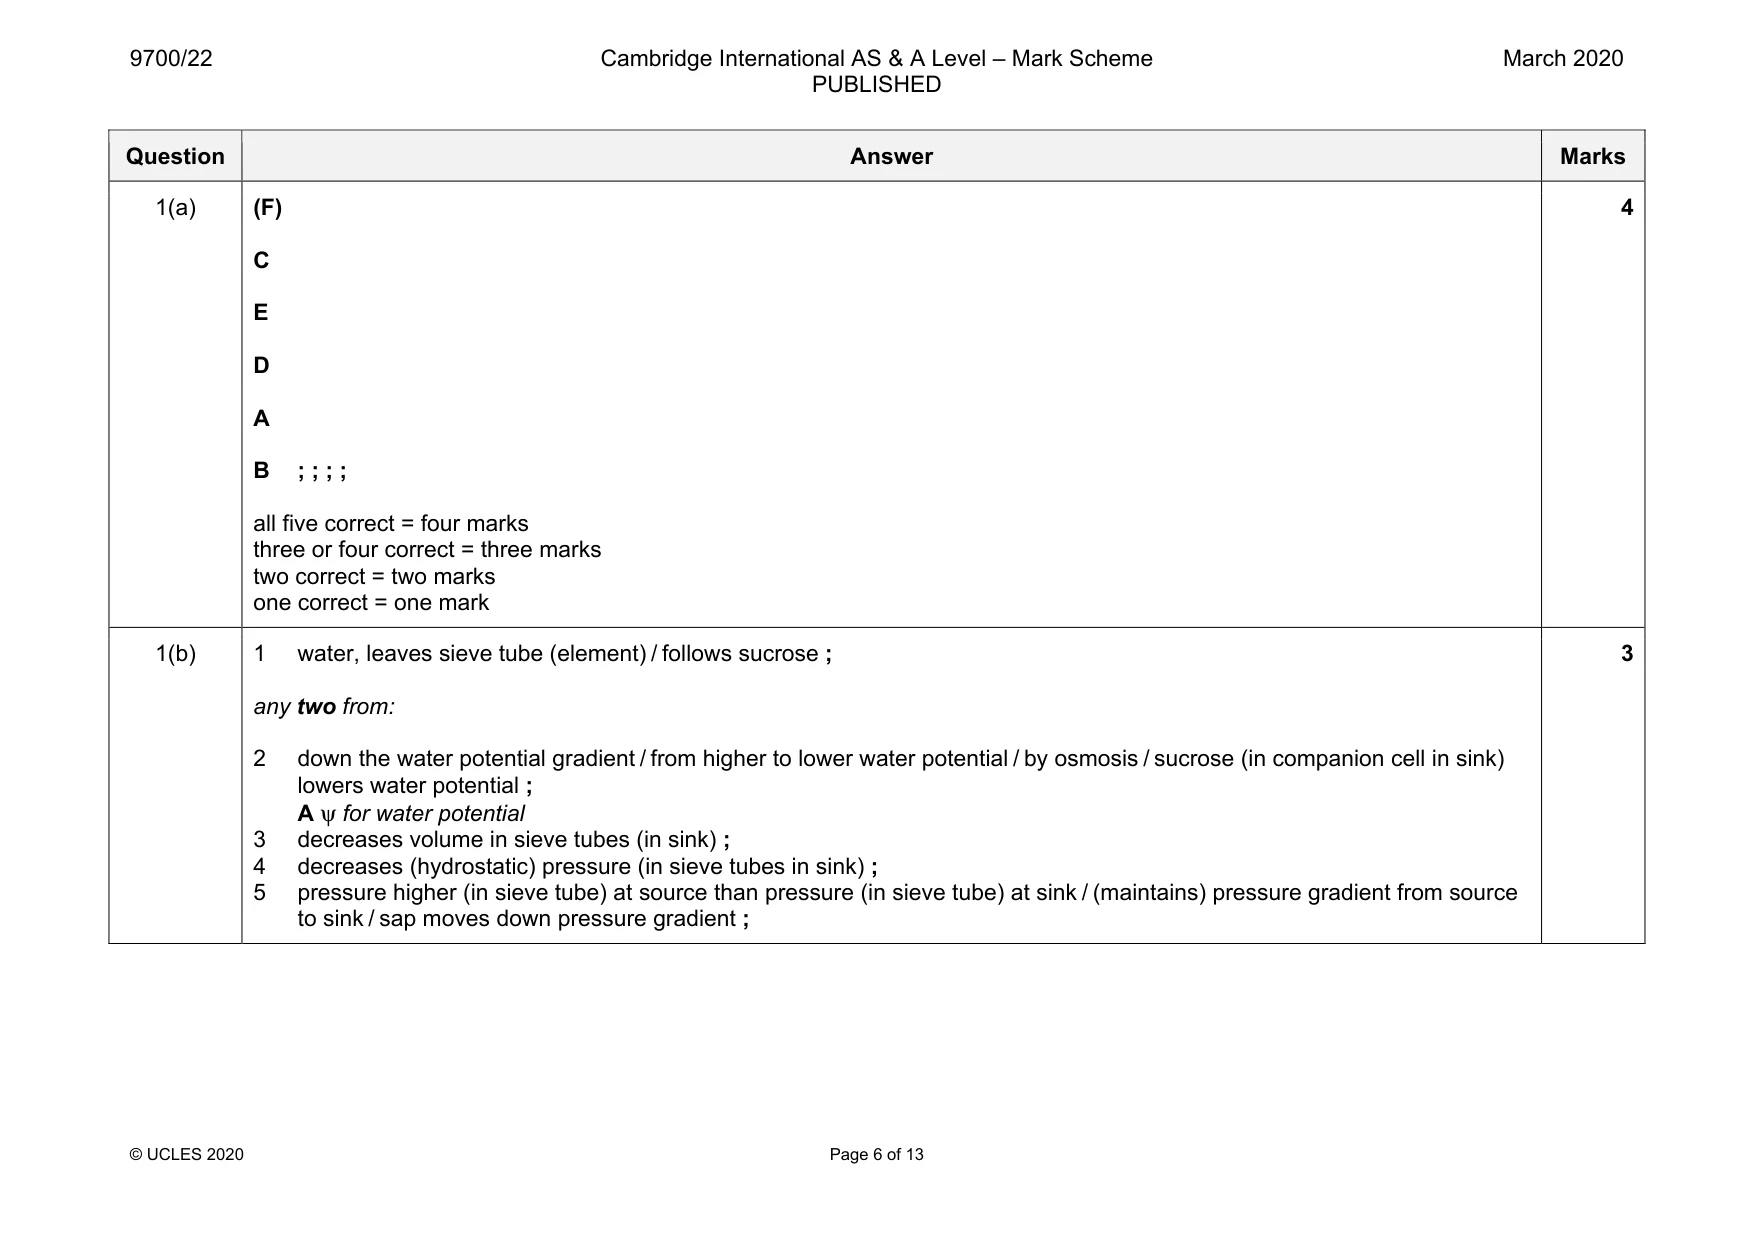
Mark scheme: 1(a) (F) C E D A B ; ; ; ; all five correct = four marks three or four correct = three marks two correct = two marks one correct = one mark 1(b) 1 water, leaves sieve tube (element) / follows sucrose ; any two from: 2 down the water potential gradient / from higher to lower water potential / by osmosis / sucrose (in companion cell in sink) lowers water potential ; A ψ for water potential 3 decreases volume in sieve tubes (in sink) ; 4 decreases (hydrostatic) pressure (in sieve tubes in sink) ; 5 pressure higher (in sieve tube) at source than pressure (in sieve tube) at sink / (maintains) pressure gradient from source to sink / sap moves down pressure gradient ; 3
Q2 · Phosphatidate phosphatase (PAP) enzymes have an important role in lipid metabolism
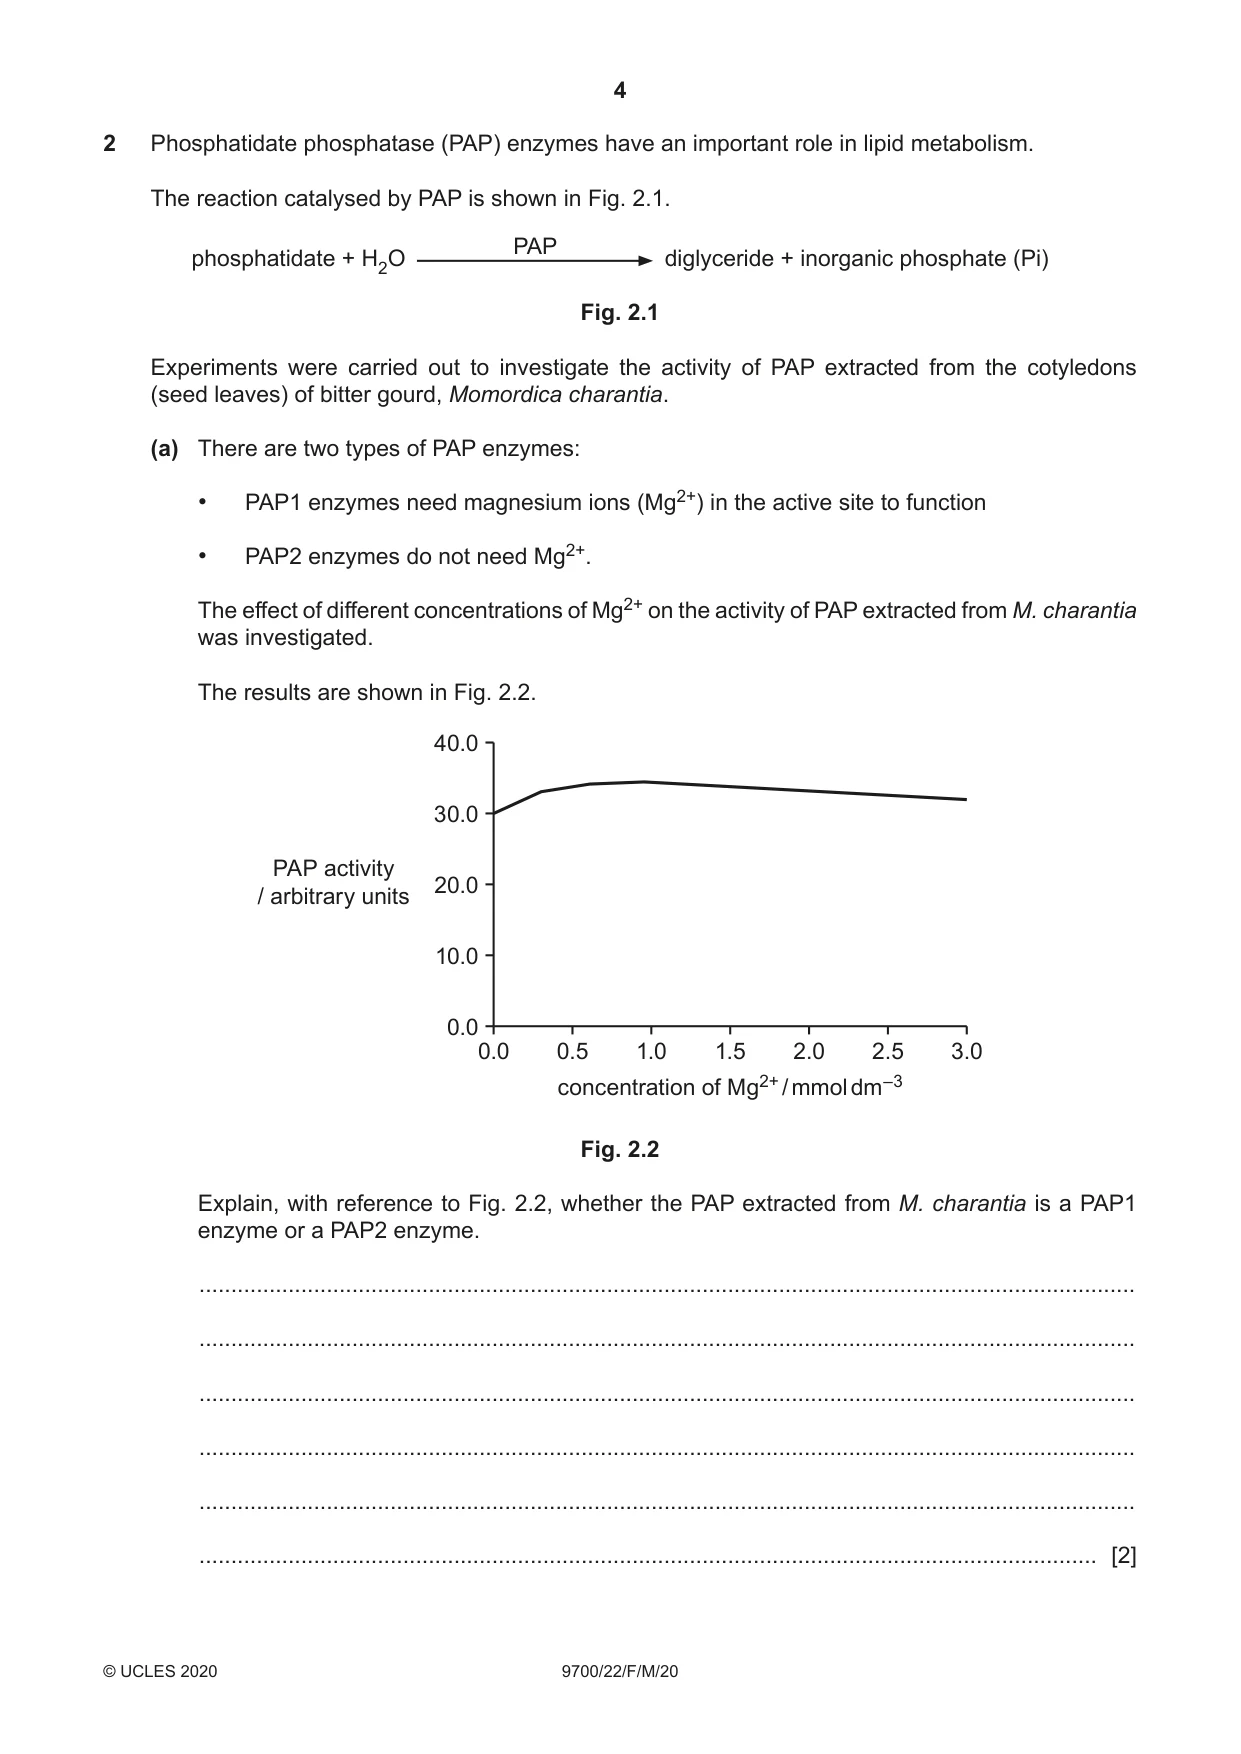
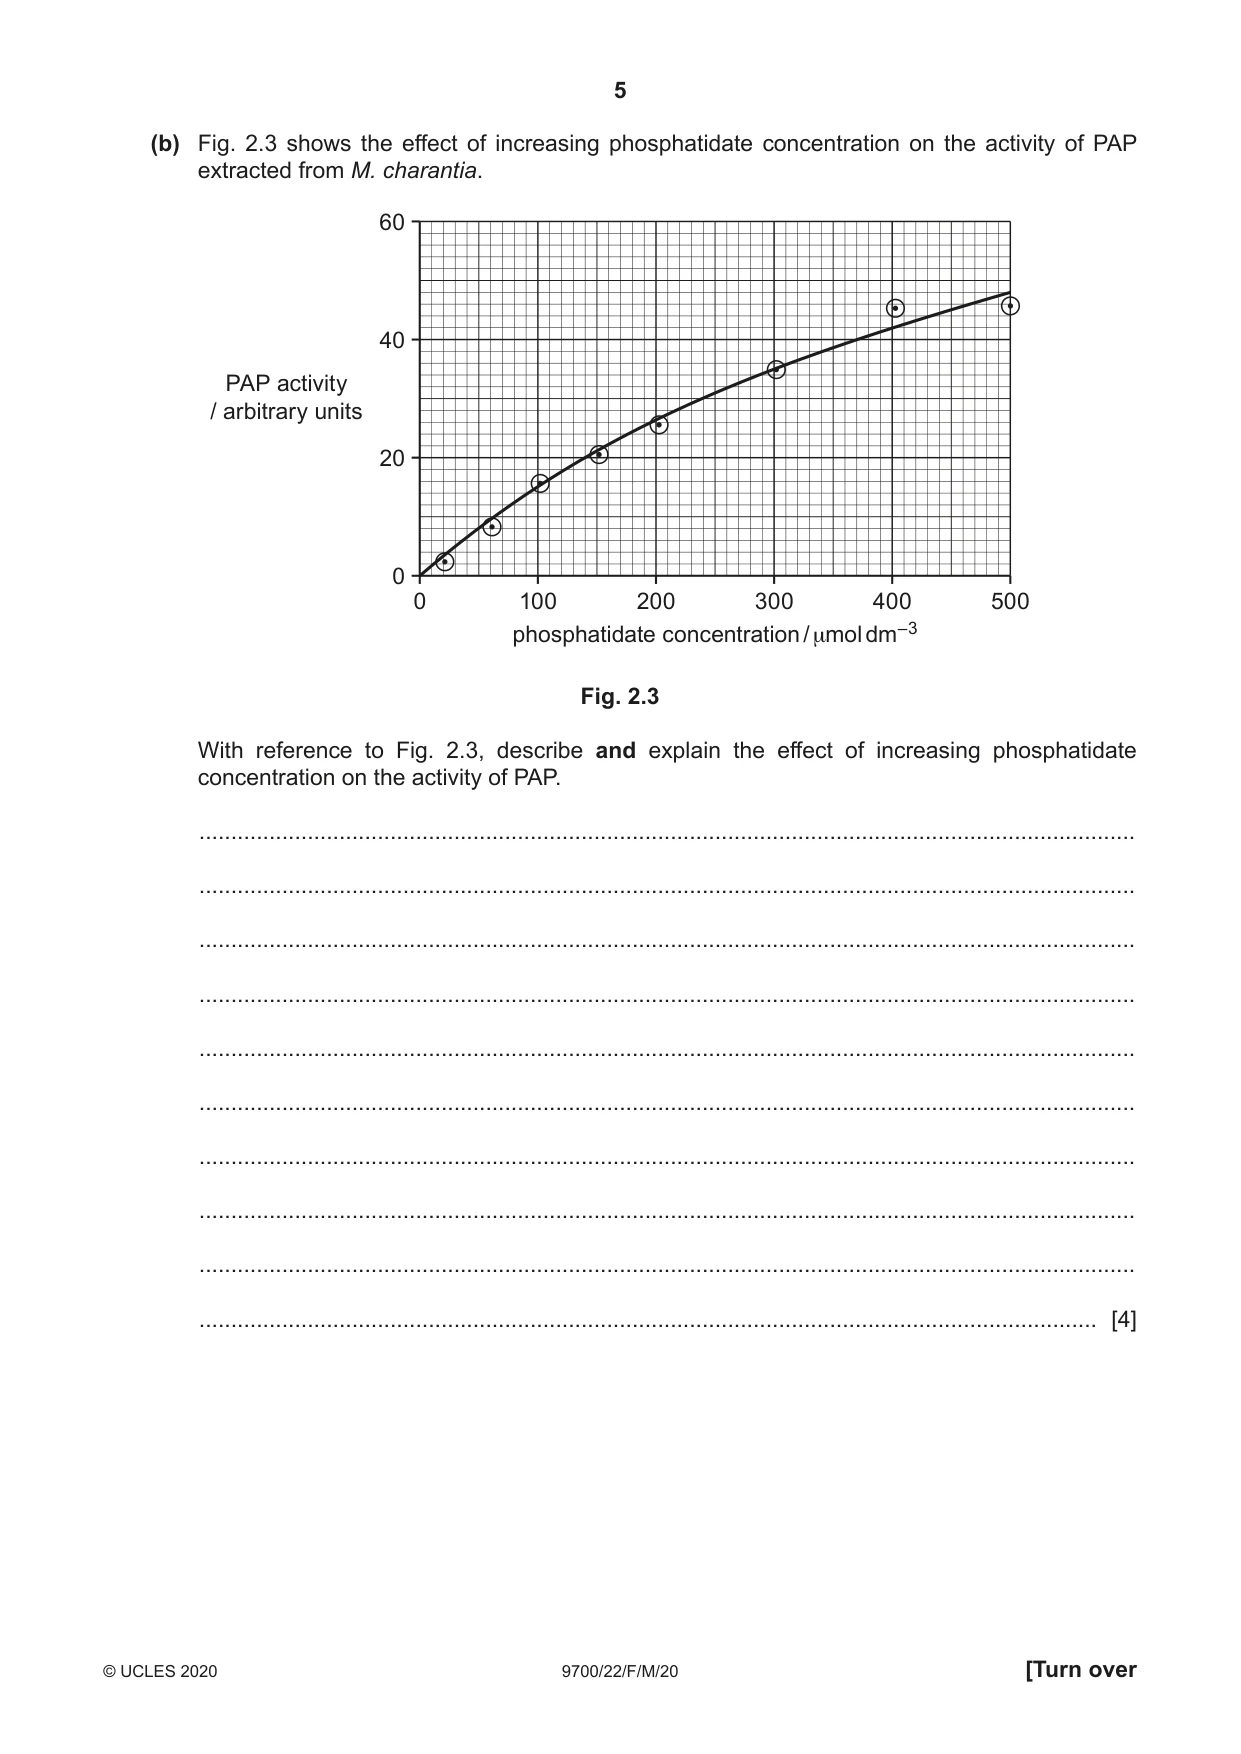
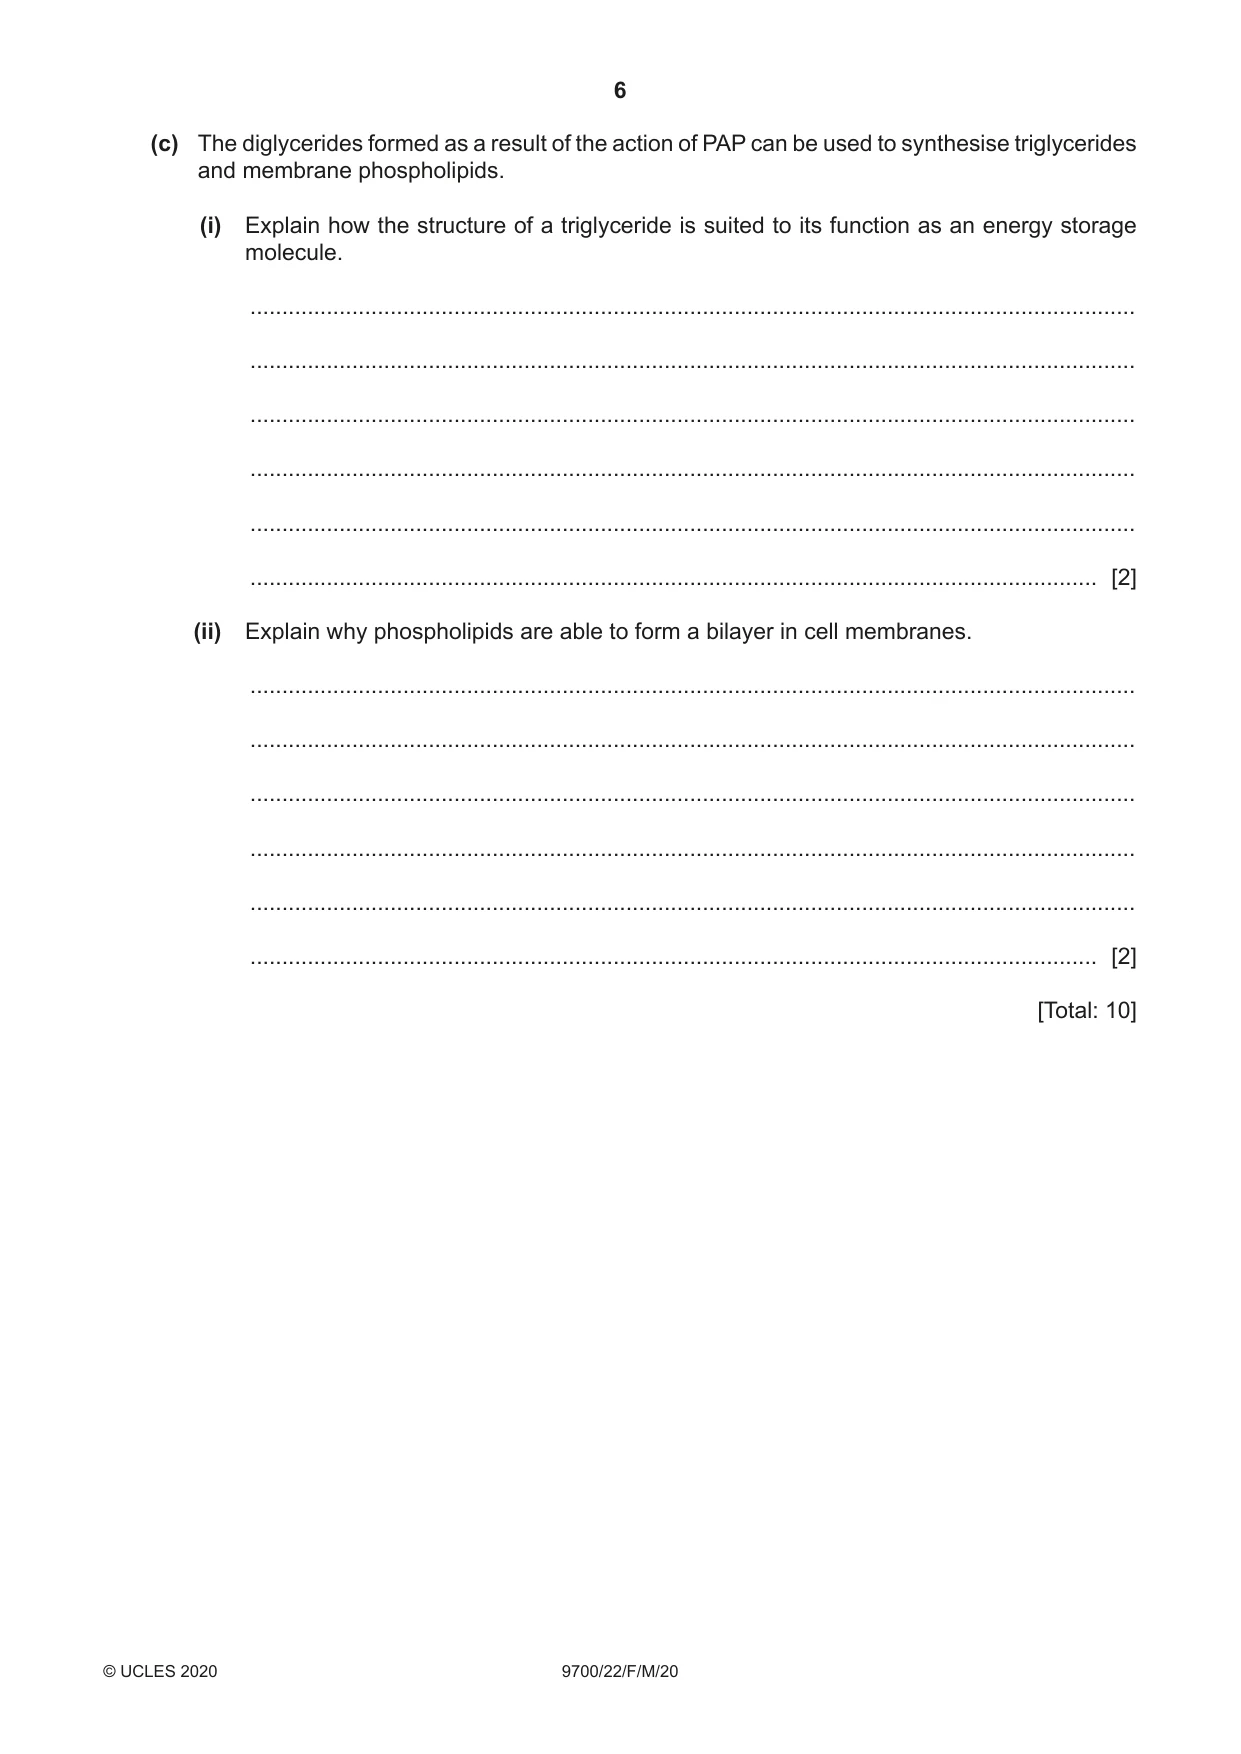
2 Phosphatidate phosphatase (PAP) enzymes have an important role in lipid metabolism. The reaction catalysed by PAP is shown in Fig. 2.1. PAP phosphatidate + H2O diglyceride + inorganic phosphate (Pi) Fig. 2.1 Experiments were carried out to investigate the activity of PAP extracted from the cotyledons (seed leaves) of bitter gourd, Momordica charantia. (a) There are two types of PAP enzymes: • PAP1 enzymes need magnesium ions (Mg2+) in the active site to function • PAP2 enzymes do not need Mg2+. The effect of different concentrations of Mg2+ on the activity of PAP extracted from M. charantia was investigated. The results are shown in Fig. 2.2. 40.0 30.0 PAP activity 20.0 / arbitrary units 10.0 0.0 0.0 0.5 1.0 1.5 2.0 2.5 3.0 concentration of Mg2+ / mmol dm–3 Fig. 2.2 Explain, with reference to Fig. 2.2, whether the PAP extracted from M. charantia is a PAP1 enzyme or a PAP2 enzyme. ................................................................................................................................................... ................................................................................................................................................... ................................................................................................................................................... ................................................................................................................................................... ................................................................................................................................................... ............................................................................................................................................. [2] (b) Fig. 2.3 shows the effect of increasing phosphatidate concentration on the activity of PAP extracted from M. charantia. 60 40 PAP activity / arbitrary units 20 0 0 100 200 300 400 500 phosphatidate concentration / μmol dm–3 Fig. 2.3 With reference to Fig. 2.3, describe and explain the effect of increasing phosphatidate concentration on the activity of PAP. ................................................................................................................................................... ................................................................................................................................................... ................................................................................................................................................... ................................................................................................................................................... ................................................................................................................................................... ................................................................................................................................................... ................................................................................................................................................... ................................................................................................................................................... ................................................................................................................................................... ............................................................................................................................................. [4] (c) The diglycerides formed as a result of the action of PAP can be used to synthesise triglycerides and membrane phospholipids. (i) Explain how the structure of a triglyceride is suited to its function as an energy storage molecule. ........................................................................................................................................... ........................................................................................................................................... ........................................................................................................................................... ........................................................................................................................................... ........................................................................................................................................... ..................................................................................................................................... [2] (ii) Explain why phospholipids are able to form a bilayer in cell membranes. ........................................................................................................................................... ........................................................................................................................................... ........................................................................................................................................... ........................................................................................................................................... ........................................................................................................................................... ..................................................................................................................................... [2] [Total: 10]
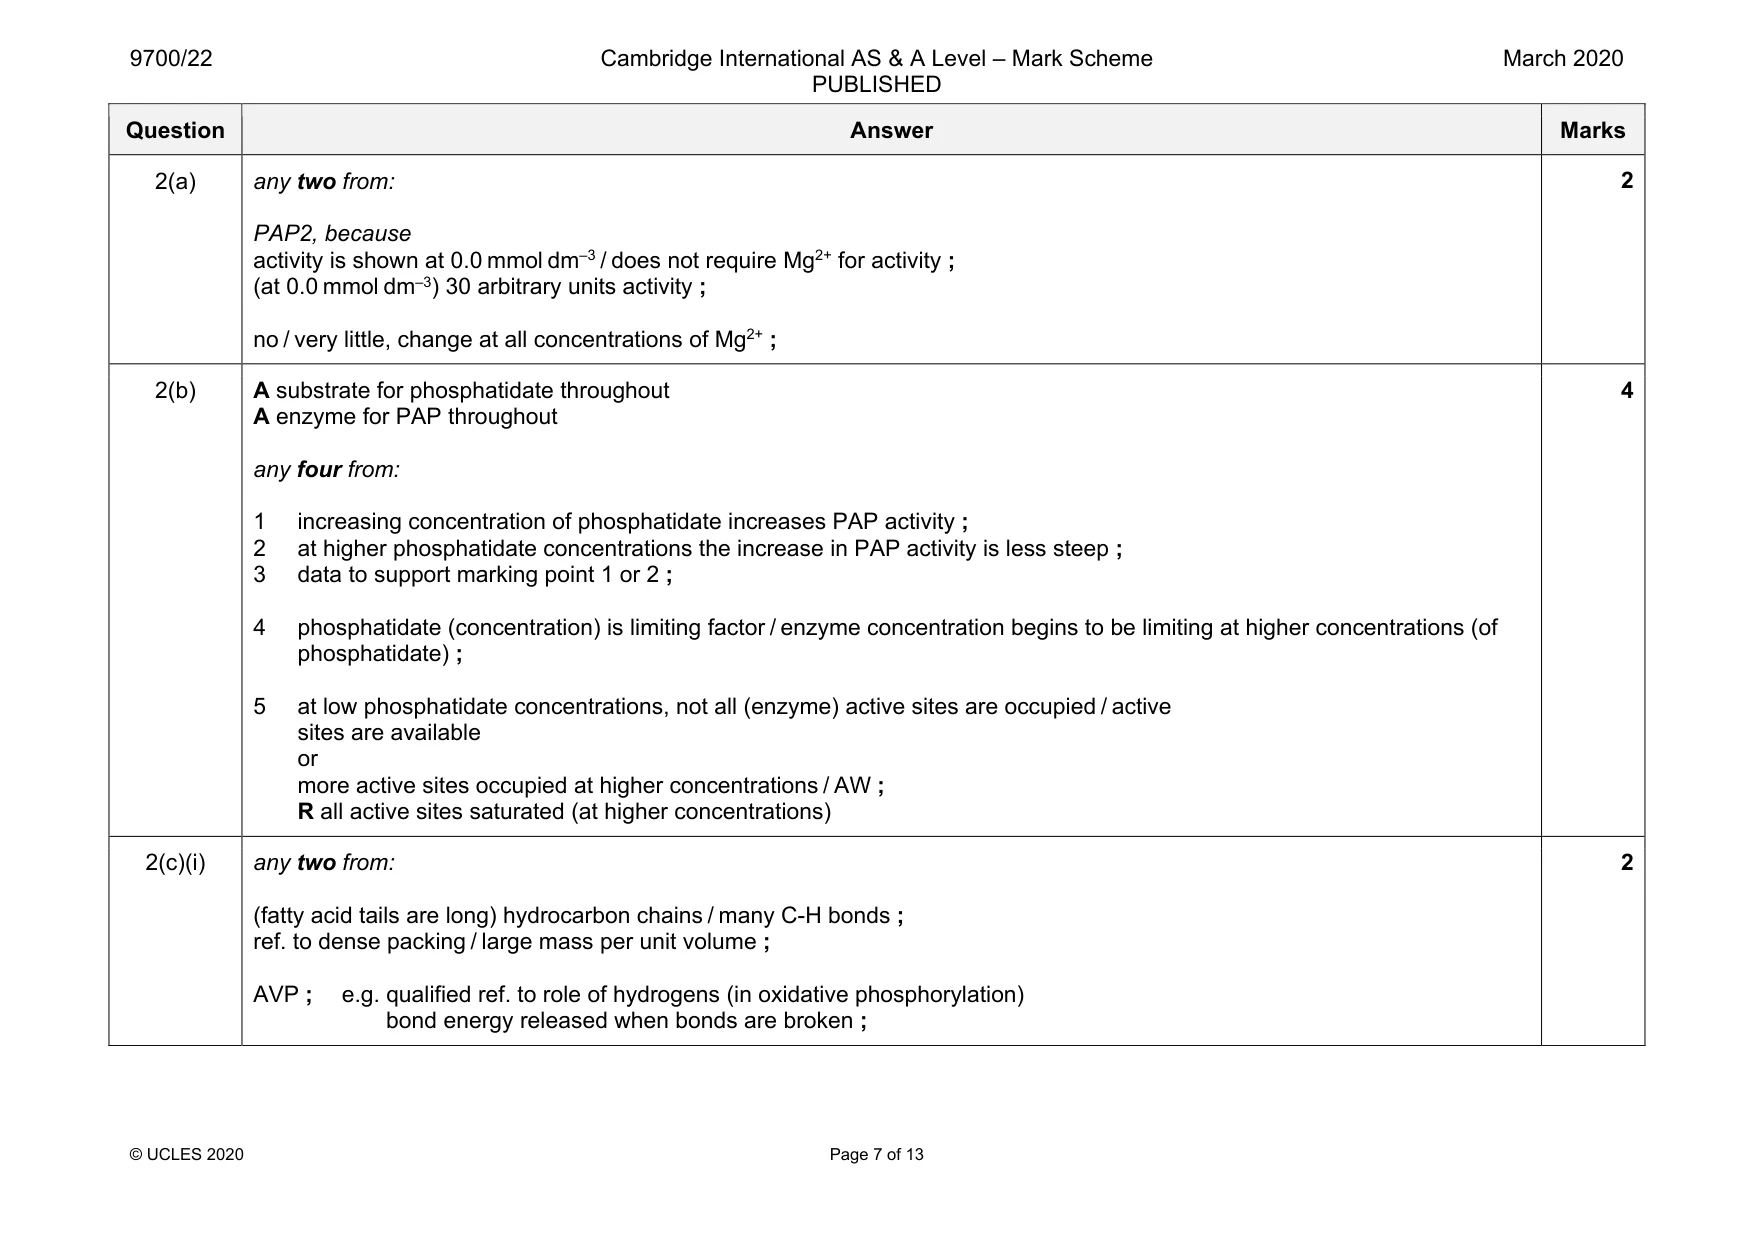
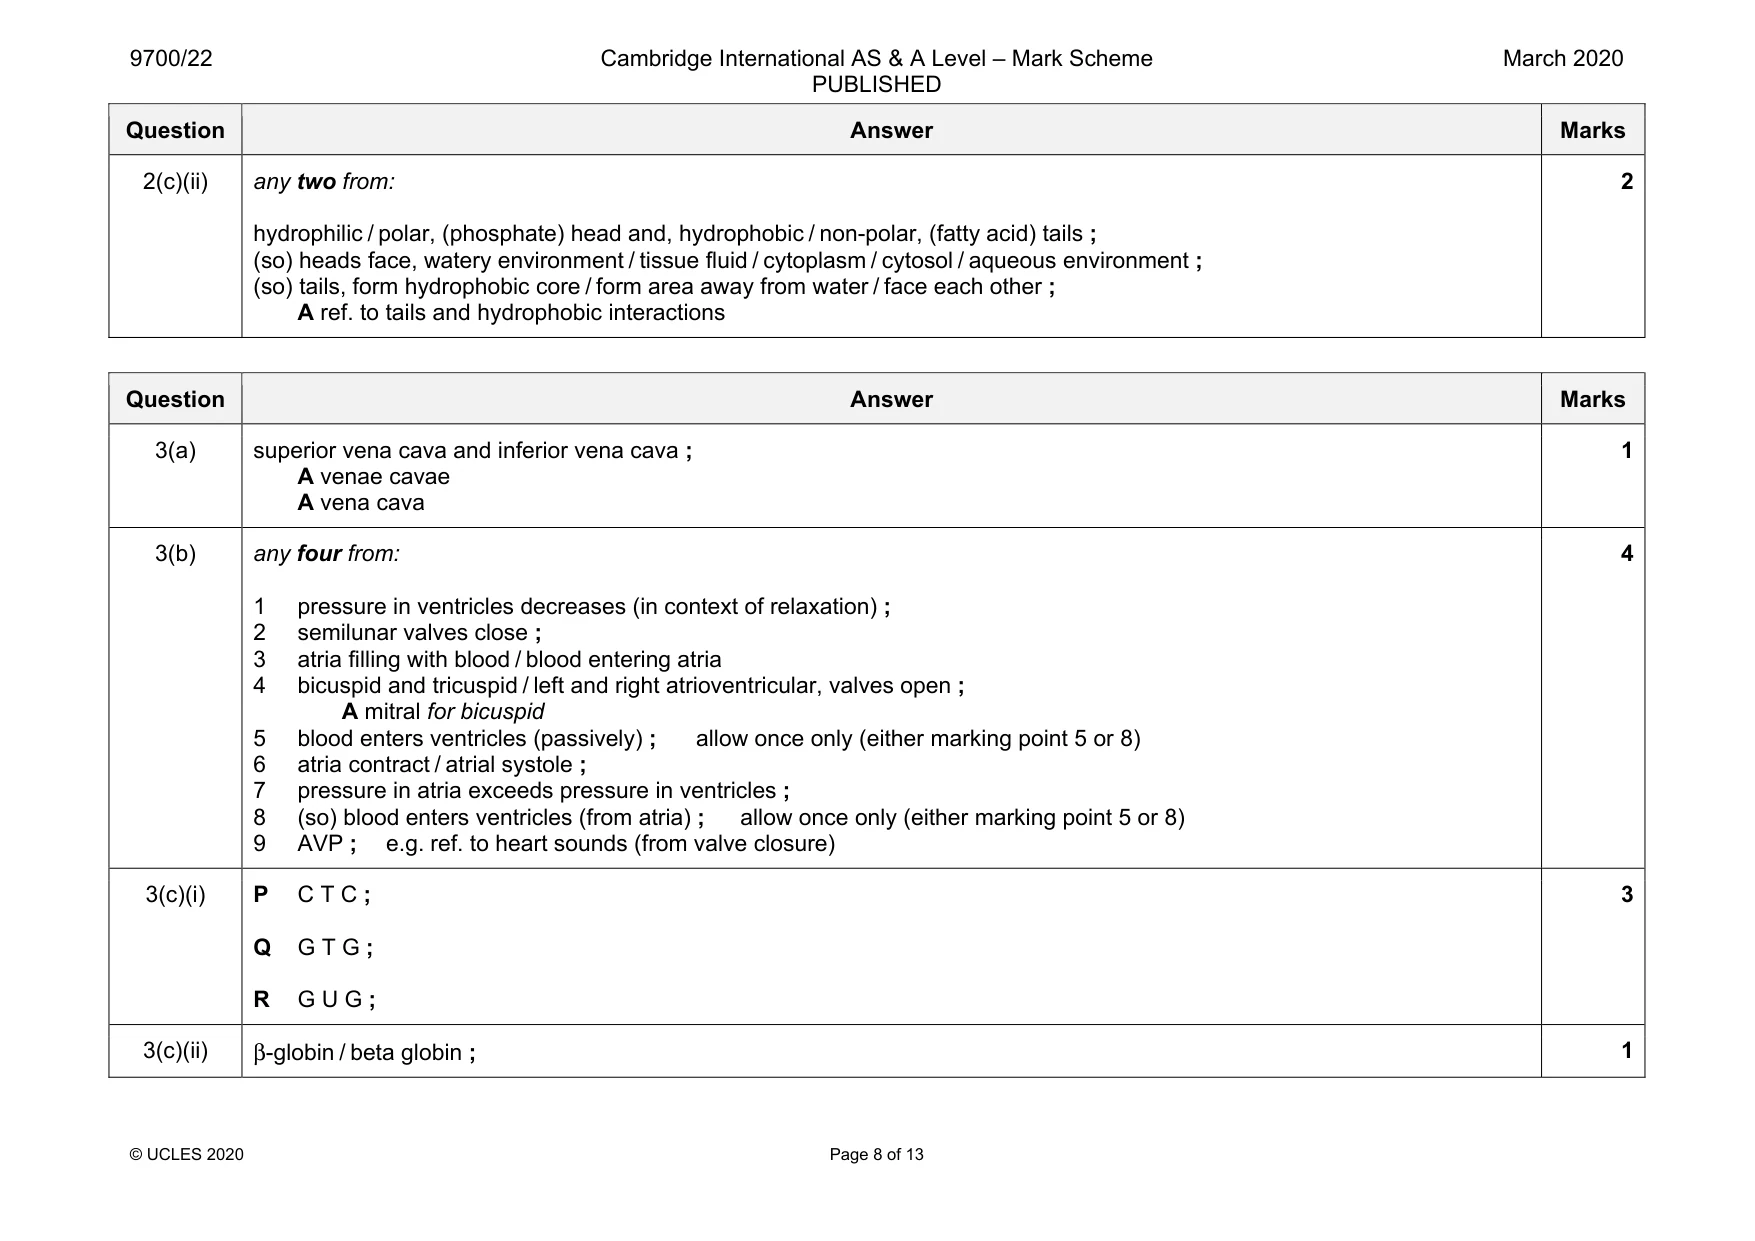
Mark scheme: 2(a) any two from: PAP2, because activity is shown at 0.0 mmol dm–3 / does not require Mg2+ for activity ; (at 0.0 mmol dm–3) 30 arbitrary units activity ; no / very little, change at all concentrations of Mg2+ ; 2(b) A substrate for phosphatidate throughout A enzyme for PAP throughout any four from: 1 increasing concentration of phosphatidate increases PAP activity ; 2 at higher phosphatidate concentrations the increase in PAP activity is less steep ; 3 data to support marking point 1 or 2 ; 4 phosphatidate (concentration) is limiting factor / enzyme concentration begins to be limiting at higher concentrations (of phosphatidate) ; 5 at low phosphatidate concentrations, not all (enzyme) active sites are occupied / active sites are available or more active sites occupied at higher concentrations / AW ; R all active sites saturated (at higher concentrations) 4 2(c)(i) any two from: (fatty acid tails are long) hydrocarbon chains / many C-H bonds ; ref. to dense packing / large mass per unit volume ; AVP ; e.g. qualified ref. to role of hydrogens (in oxidative phosphorylation) bond energy released when bonds are broken ; 2 Question Answer Marks 2(c)(ii) any two from: hydrophilic / polar, (phosphate) head and, hydrophobic / non-polar, (fatty acid) tails ; (so) heads face, watery environment / tissue fluid / cytoplasm / cytosol / aqueous environment ; (so) tails, form hydrophobic core / form area away from water / face each other ; A ref. to tails and hydrophobic interactions 2
Q3 · During one cardiac cycle: • blood enters the heart from the lungs and from the rest of…
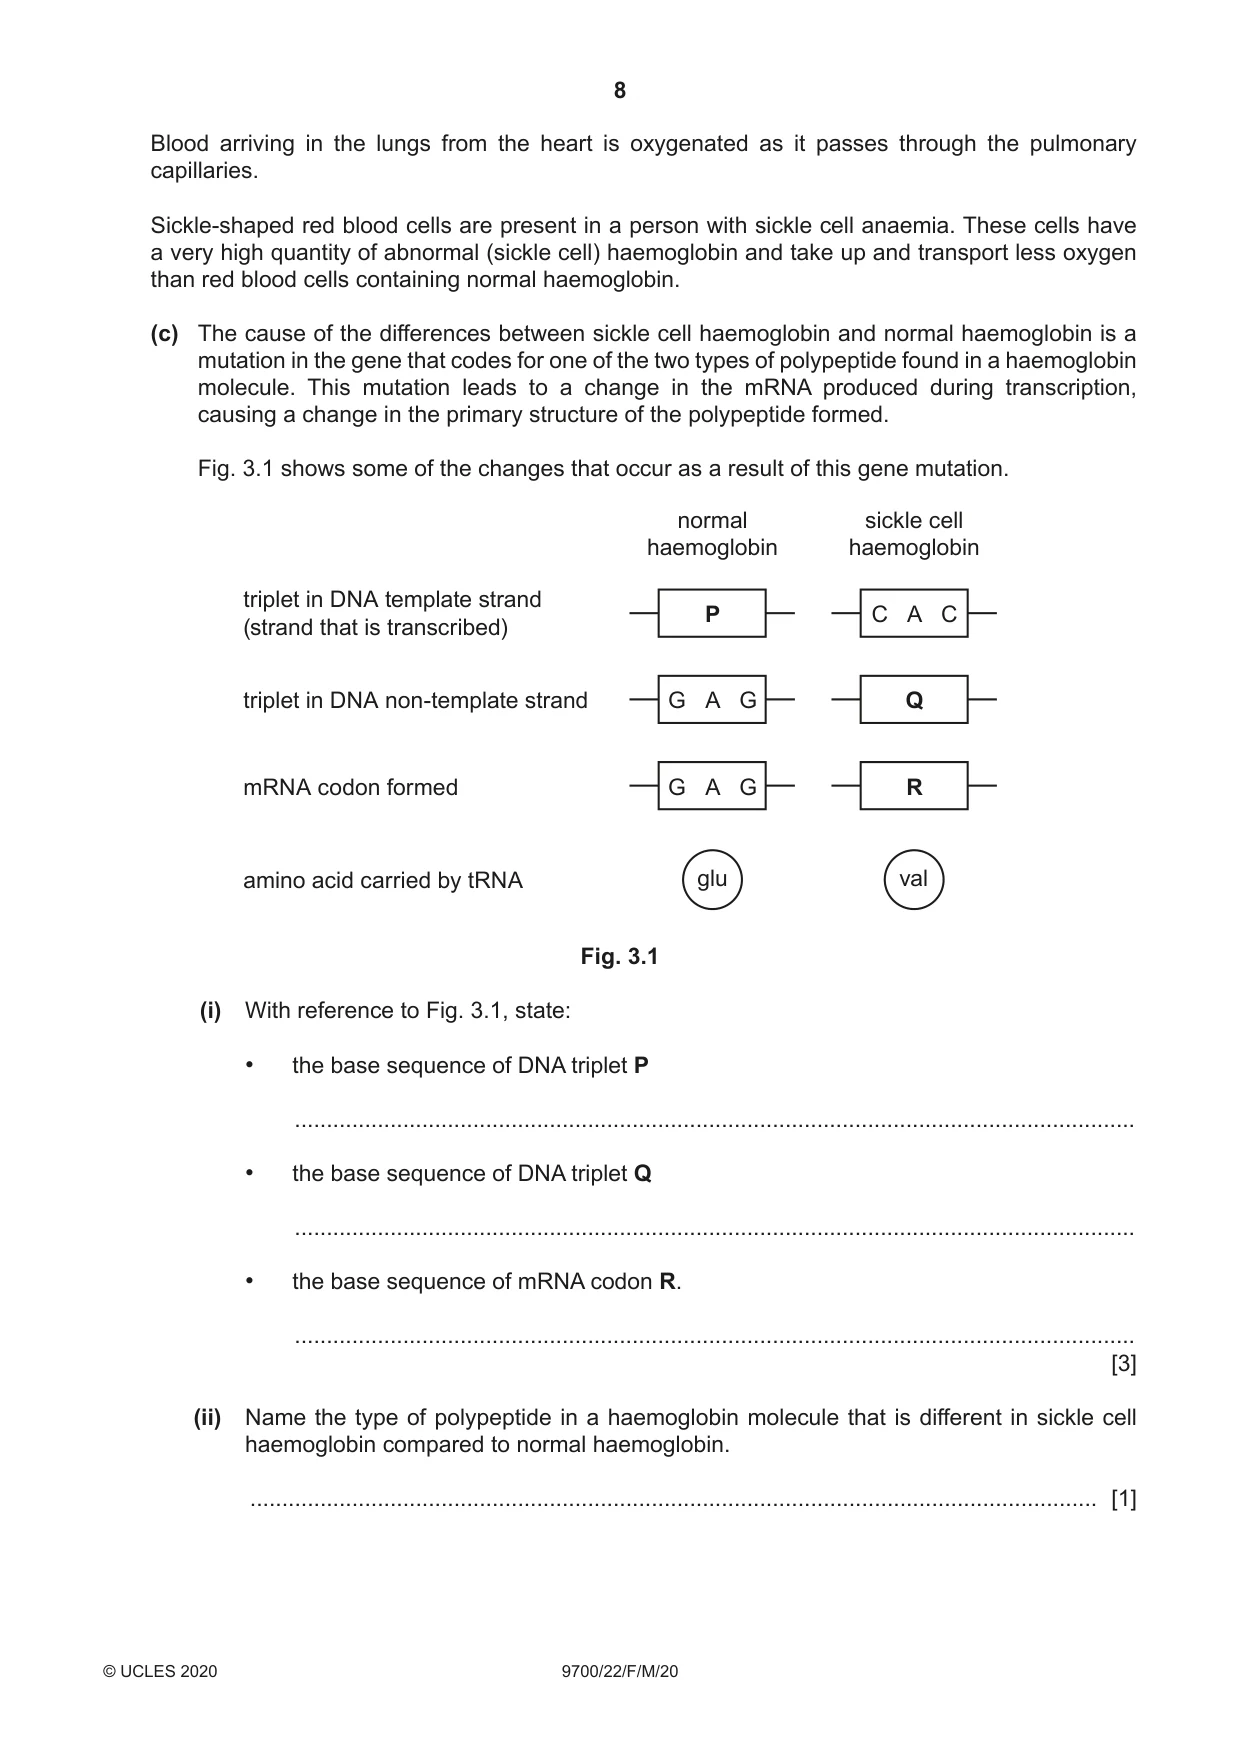
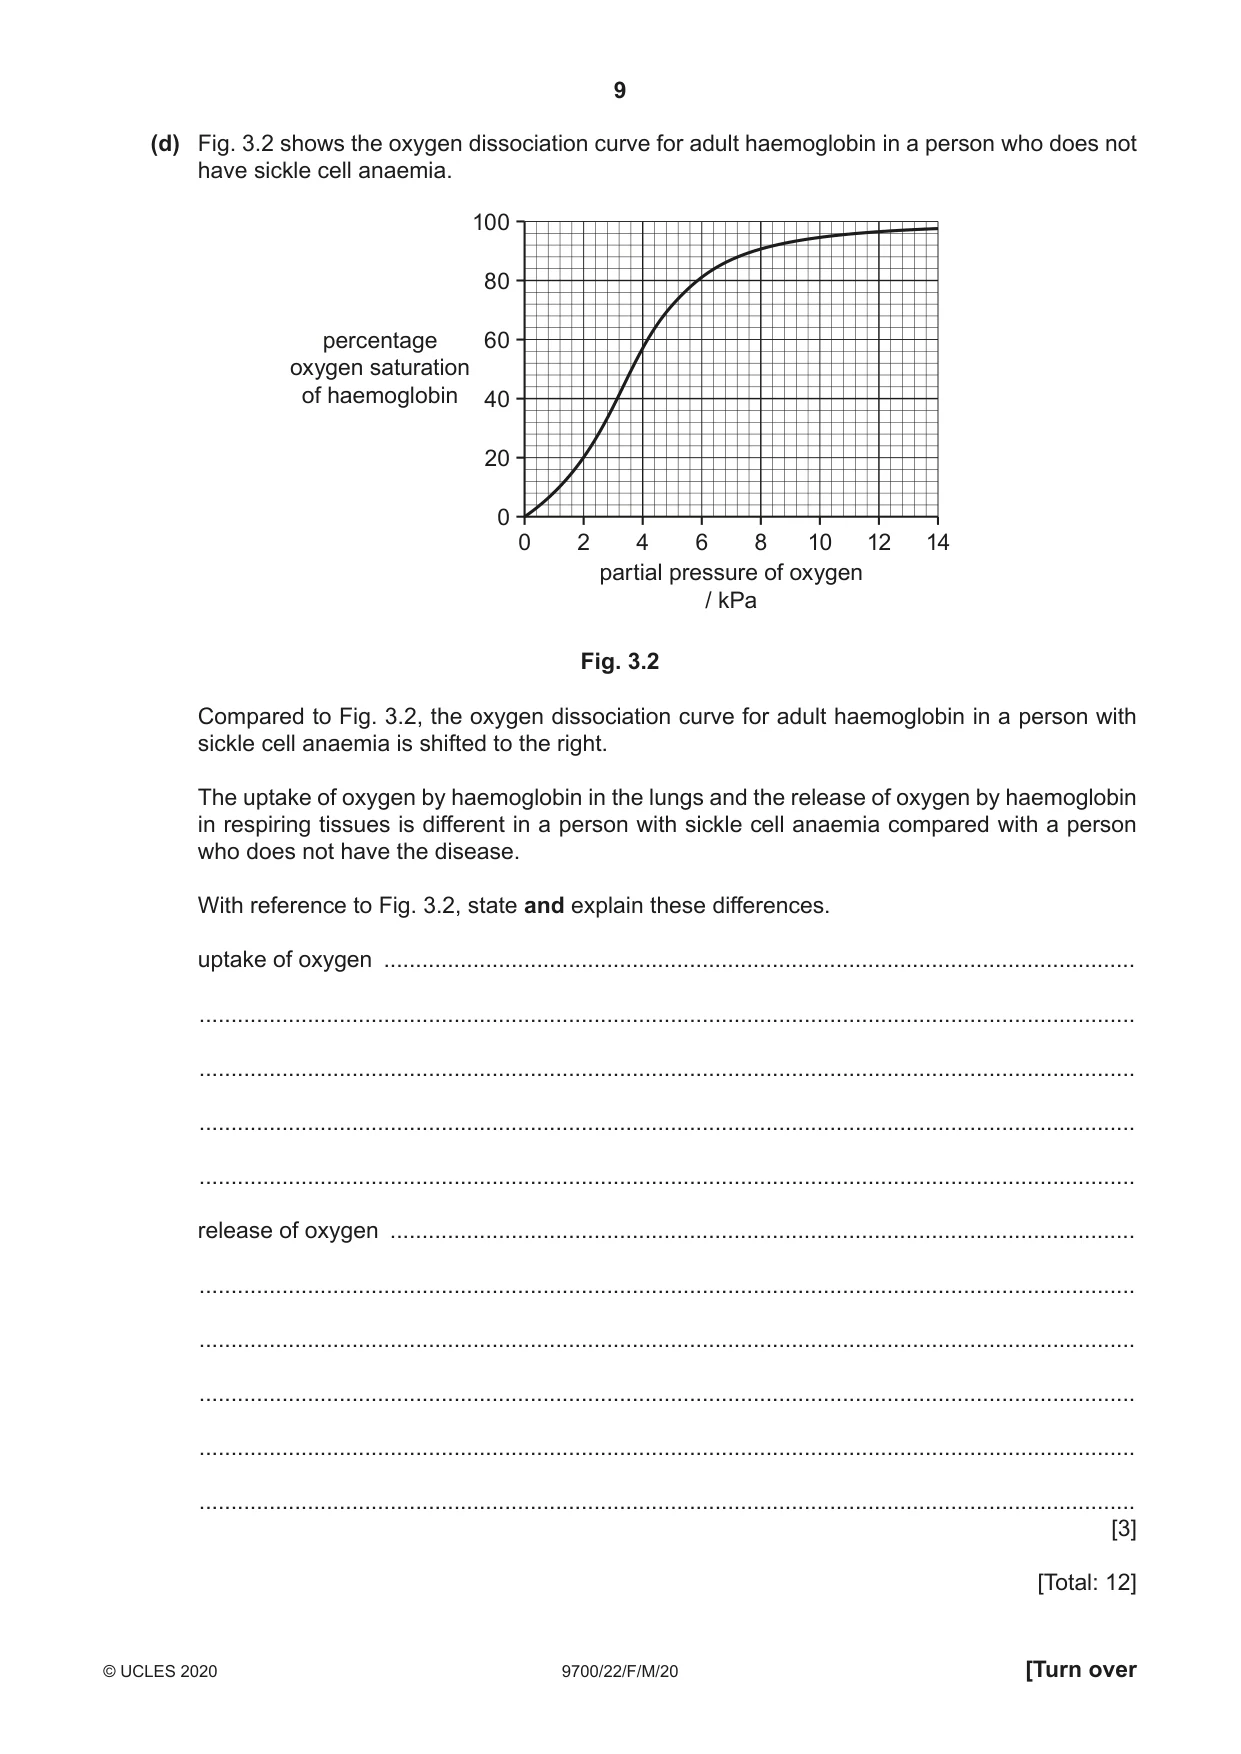
3 During one cardiac cycle: • blood enters the heart from the lungs and from the rest of the body • blood leaves the heart to be transported to the lungs and to the rest of the body. (a) Name the blood vessels entering the heart that bring blood from the rest of the body. ................................................................................................................................................... ............................................................................................................................................. [1] (b) One phase of the cardiac cycle is ventricular diastole (ventricular relaxation). A number of events occur in the heart during this phase. Outline and explain the events that occur in the heart during ventricular diastole. ................................................................................................................................................... ................................................................................................................................................... ................................................................................................................................................... ................................................................................................................................................... ................................................................................................................................................... ................................................................................................................................................... ................................................................................................................................................... ................................................................................................................................................... ................................................................................................................................................... ............................................................................................................................................. [4] Blood arriving in the lungs from the heart is oxygenated as it passes through the pulmonary capillaries. Sickle‑shaped red blood cells are present in a person with sickle cell anaemia. These cells have a very high quantity of abnormal (sickle cell) haemoglobin and take up and transport less oxygen than red blood cells containing normal haemoglobin. (c) The cause of the differences between sickle cell haemoglobin and normal haemoglobin is a mutation in the gene that codes for one of the two types of polypeptide found in a haemoglobin molecule. This mutation leads to a change in the mRNA produced during transcription, causing a change in the primary structure of the polypeptide formed. Fig. 3.1 shows some of the changes that occur as a result of this gene mutation. normal sickle cell haemoglobin haemoglobin triplet in DNA template strand P C A C (strand that is transcribed) triplet in DNA non-template strand G A G Q mRNA codon formed G A G R amino acid carried by tRNA glu val Fig. 3.1 (i) With reference to Fig. 3.1, state: • the base sequence of DNA triplet P .................................................................................................................................... • the base sequence of DNA triplet Q .................................................................................................................................... • the base sequence of mRNA codon R. .................................................................................................................................... [3] (ii) Name the type of polypeptide in a haemoglobin molecule that is different in sickle cell haemoglobin compared to normal haemoglobin. ..................................................................................................................................... [1] (d) Fig. 3.2 shows the oxygen dissociation curve for adult haemoglobin in a person who does not have sickle cell anaemia. 100 80 percentage 60 oxygen saturation of haemoglobin 40 20 0 0 2 4 6 8 10 12 14 partial pressure of oxygen / kPa Fig. 3.2 Compared to Fig. 3.2, the oxygen dissociation curve for adult haemoglobin in a person with sickle cell anaemia is shifted to the right. The uptake of oxygen by haemoglobin in the lungs and the release of oxygen by haemoglobin in respiring tissues is different in a person with sickle cell anaemia compared with a person who does not have the disease. With reference to Fig. 3.2, state and explain these differences. uptake of oxygen ...................................................................................................................... ................................................................................................................................................... ................................................................................................................................................... ................................................................................................................................................... ................................................................................................................................................... release of oxygen ..................................................................................................................... ................................................................................................................................................... ................................................................................................................................................... ................................................................................................................................................... ................................................................................................................................................... ................................................................................................................................................... [3] [Total: 12]
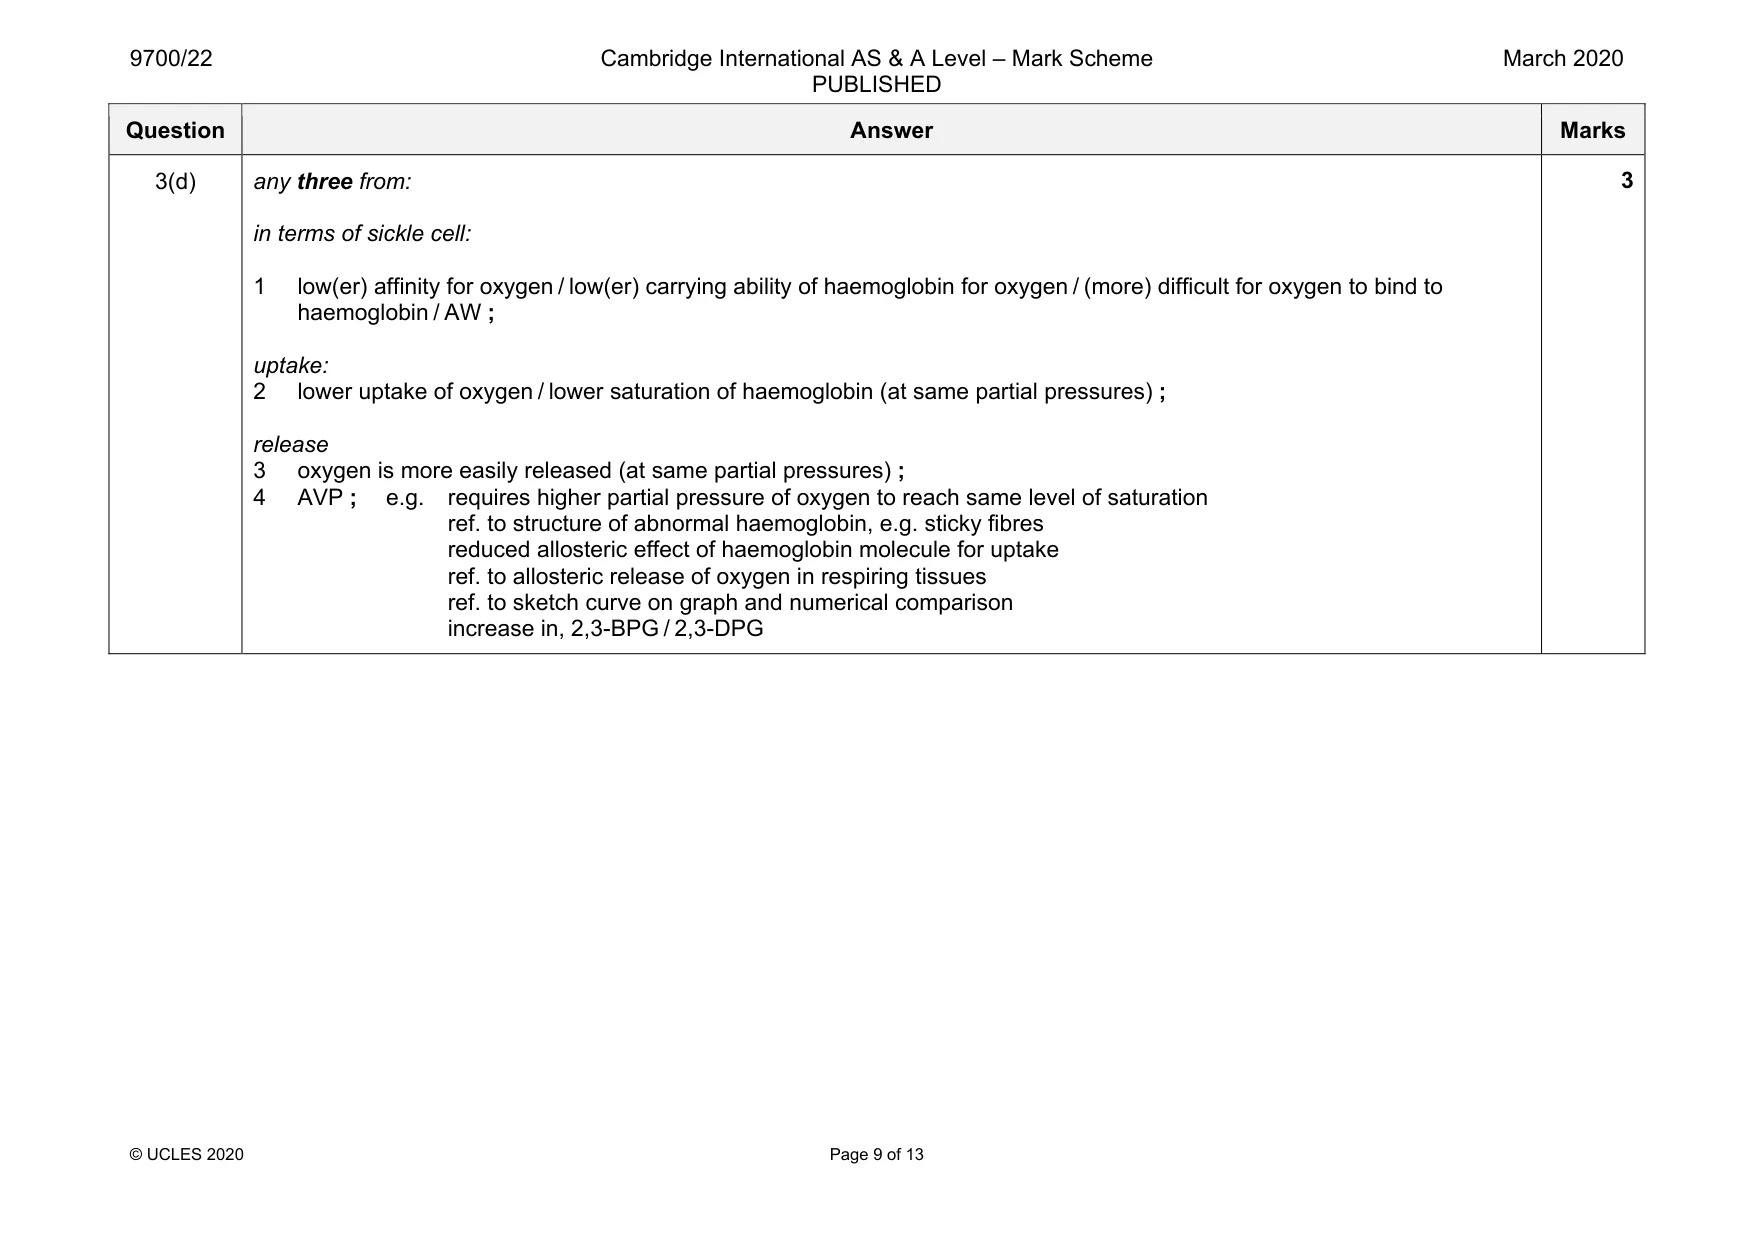
Mark scheme: 3(a) superior vena cava and inferior vena cava ; A venae cavae A vena cava 1 3(b) any four from: 1 pressure in ventricles decreases (in context of relaxation) ; 2 semilunar valves close ; 3 atria filling with blood / blood entering atria 4 bicuspid and tricuspid / left and right atrioventricular, valves open ; A mitral for bicuspid 5 blood enters ventricles (passively) ; allow once only (either marking point 5 or 8) 6 atria contract / atrial systole ; 7 pressure in atria exceeds pressure in ventricles ; 8 (so) blood enters ventricles (from atria) ; allow once only (either marking point 5 or 8) 9 AVP ; e.g. ref. to heart sounds (from valve closure) 4 3(c)(i) P C T C ; Q G T G ; R G U G ; 3 3(c)(ii) β-globin / beta globin ; 1 Question Answer Marks 3(d) any three from: in terms of sickle cell: 1 low(er) affinity for oxygen / low(er) carrying ability of haemoglobin for oxygen / (more) difficult for oxygen to bind to haemoglobin / AW ; uptake: 2 lower uptake of oxygen / lower saturation of haemoglobin (at same partial pressures) ; release 3 oxygen is more easily released (at same partial pressures) ; 4 AVP ; e.g. requires higher partial pressure of oxygen to reach same level of saturation ref. to structure of abnormal haemoglobin, e.g. sticky fibres reduced allosteric effect of haemoglobin molecule for uptake ref. to allosteric release of oxygen in respiring tissues ref. to sketch curve on graph and numerical comparison increase in, 2,3-BPG / 2,3-DPG 3
Q4 · When a section of lung tissue is viewed using a light microscope, it is possible to…
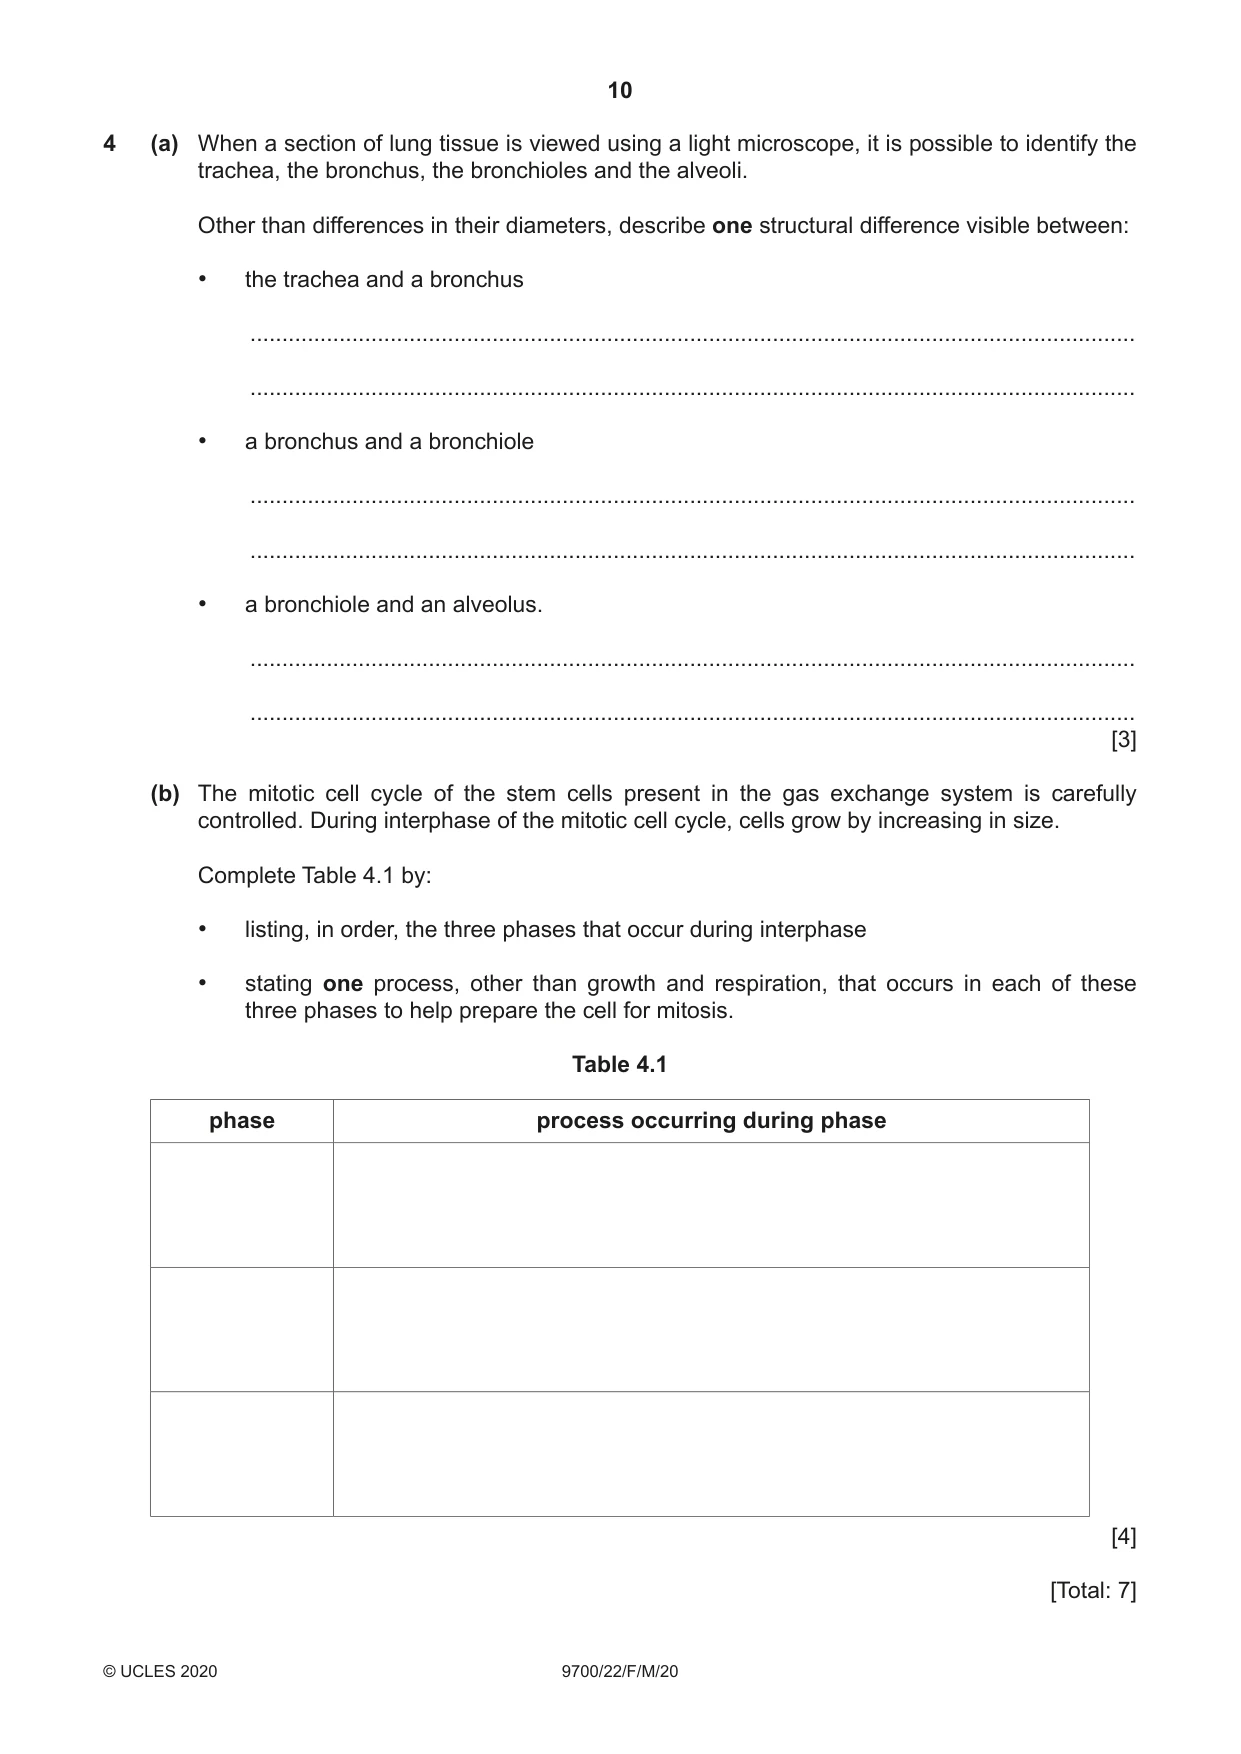
4 (a) When a section of lung tissue is viewed using a light microscope, it is possible to identify the trachea, the bronchus, the bronchioles and the alveoli. Other than differences in their diameters, describe one structural difference visible between: • the trachea and a bronchus ........................................................................................................................................... ........................................................................................................................................... • a bronchus and a bronchiole ........................................................................................................................................... ........................................................................................................................................... • a bronchiole and an alveolus. ........................................................................................................................................... ........................................................................................................................................... [3] (b) The mitotic cell cycle of the stem cells present in the gas exchange system is carefully controlled. During interphase of the mitotic cell cycle, cells grow by increasing in size. Complete Table 4.1 by: • listing, in order, the three phases that occur during interphase • stating one process, other than growth and respiration, that occurs in each of these three phases to help prepare the cell for mitosis. Table 4.1 phase process occurring during phase [4] [Total: 7]
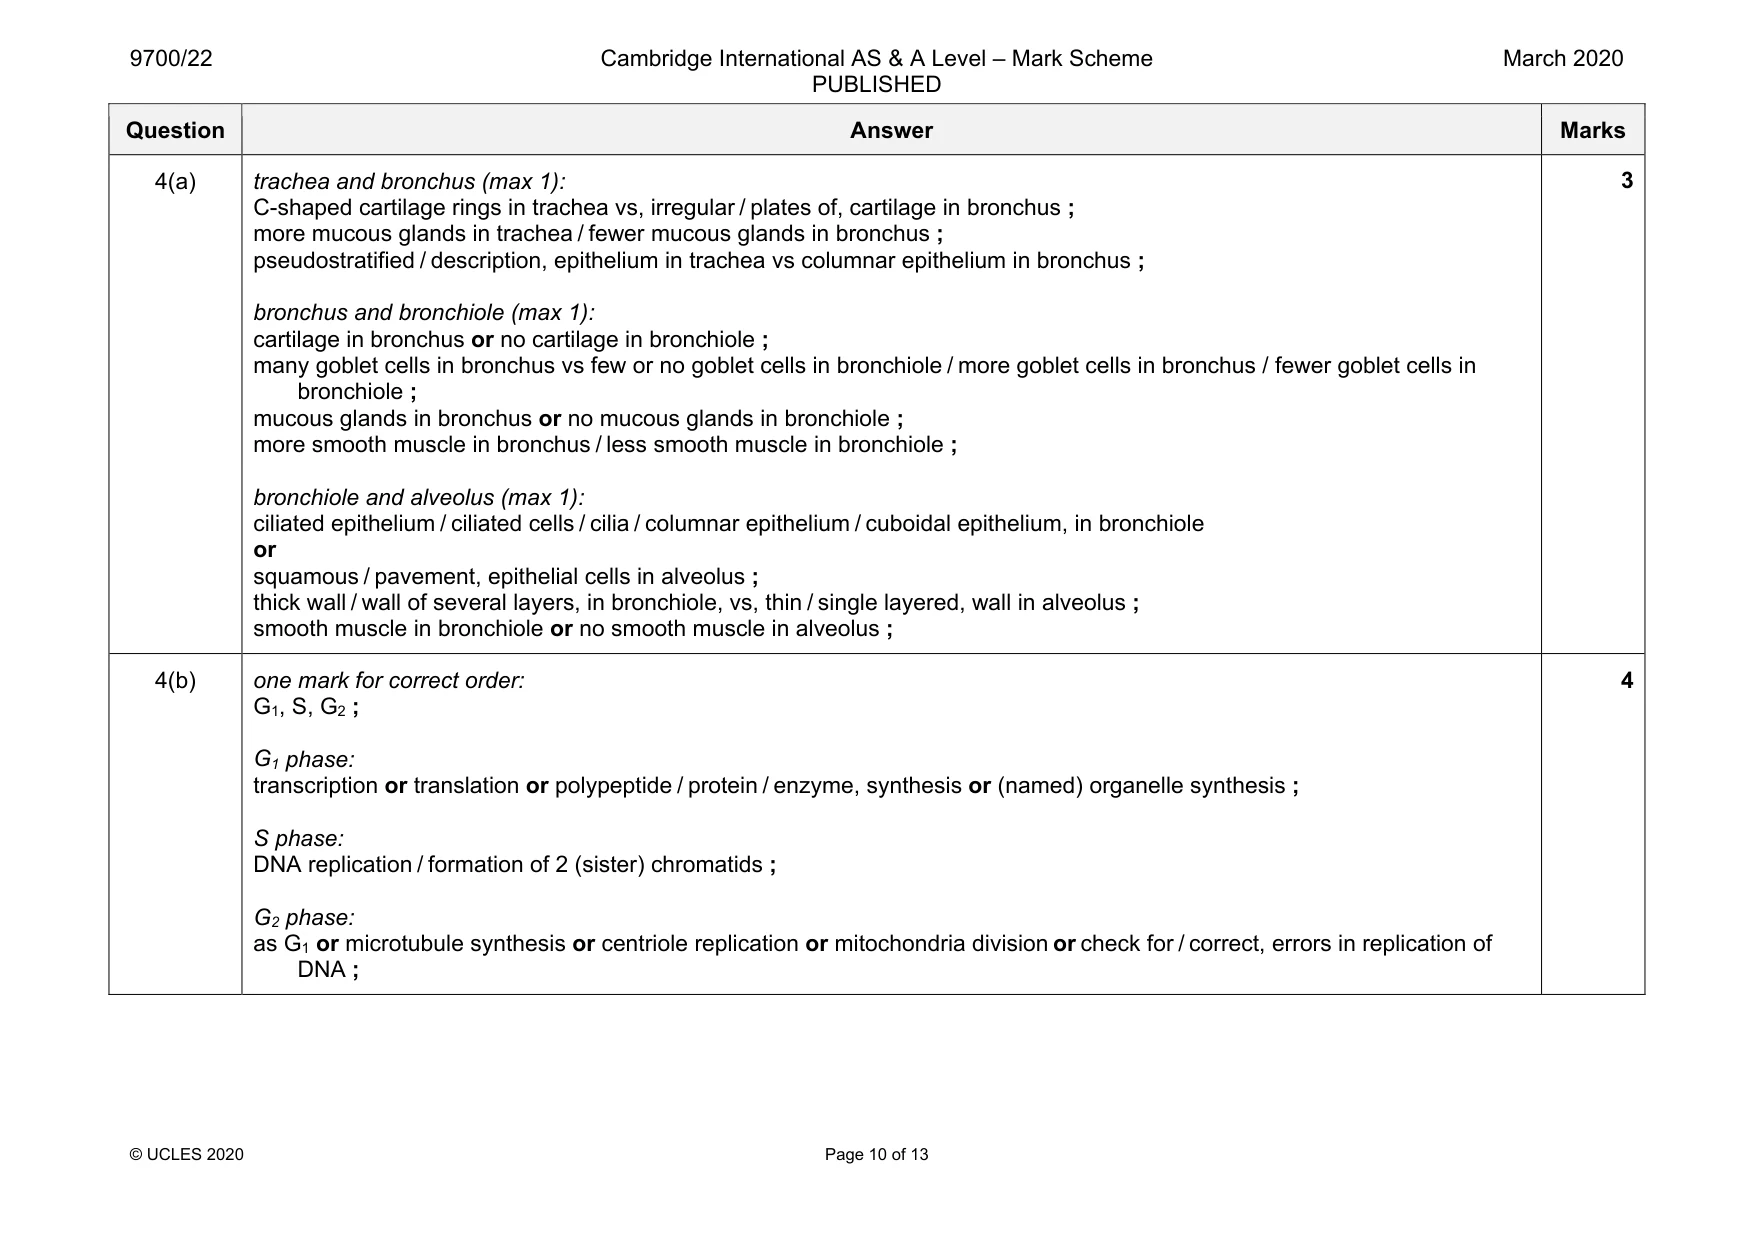
Mark scheme: 4(a) trachea and bronchus (max 1): C-shaped cartilage rings in trachea vs, irregular / plates of, cartilage in bronchus ; more mucous glands in trachea / fewer mucous glands in bronchus ; pseudostratified / description, epithelium in trachea vs columnar epithelium in bronchus ; bronchus and bronchiole (max 1): cartilage in bronchus or no cartilage in bronchiole ; many goblet cells in bronchus vs few or no goblet cells in bronchiole / more goblet cells in bronchus / fewer goblet cells in bronchiole ; mucous glands in bronchus or no mucous glands in bronchiole ; more smooth muscle in bronchus / less smooth muscle in bronchiole ; bronchiole and alveolus (max 1): ciliated epithelium / ciliated cells / cilia / columnar epithelium / cuboidal epithelium, in bronchiole or squamous / pavement, epithelial cells in alveolus ; thick wall / wall of several layers, in bronchiole, vs, thin / single layered, wall in alveolus ; smooth muscle in bronchiole or no smooth muscle in alveolus ; 4(b) one mark for correct order: G1, S, G2 ; G1 phase: transcription or translation or polypeptide / protein / enzyme, synthesis or (named) organelle synthesis ; S phase: DNA replication / formation of 2 (sister) chromatids ; G2 phase: as G1 or microtubule synthesis or centriole replication or mitochondria division or check for / correct, errors in replication of DNA ; 4
More questions on Replication and division of nuclei and cells
Q5 · Myasthenia gravis and HIV/AIDS both involve disorders of the immune system
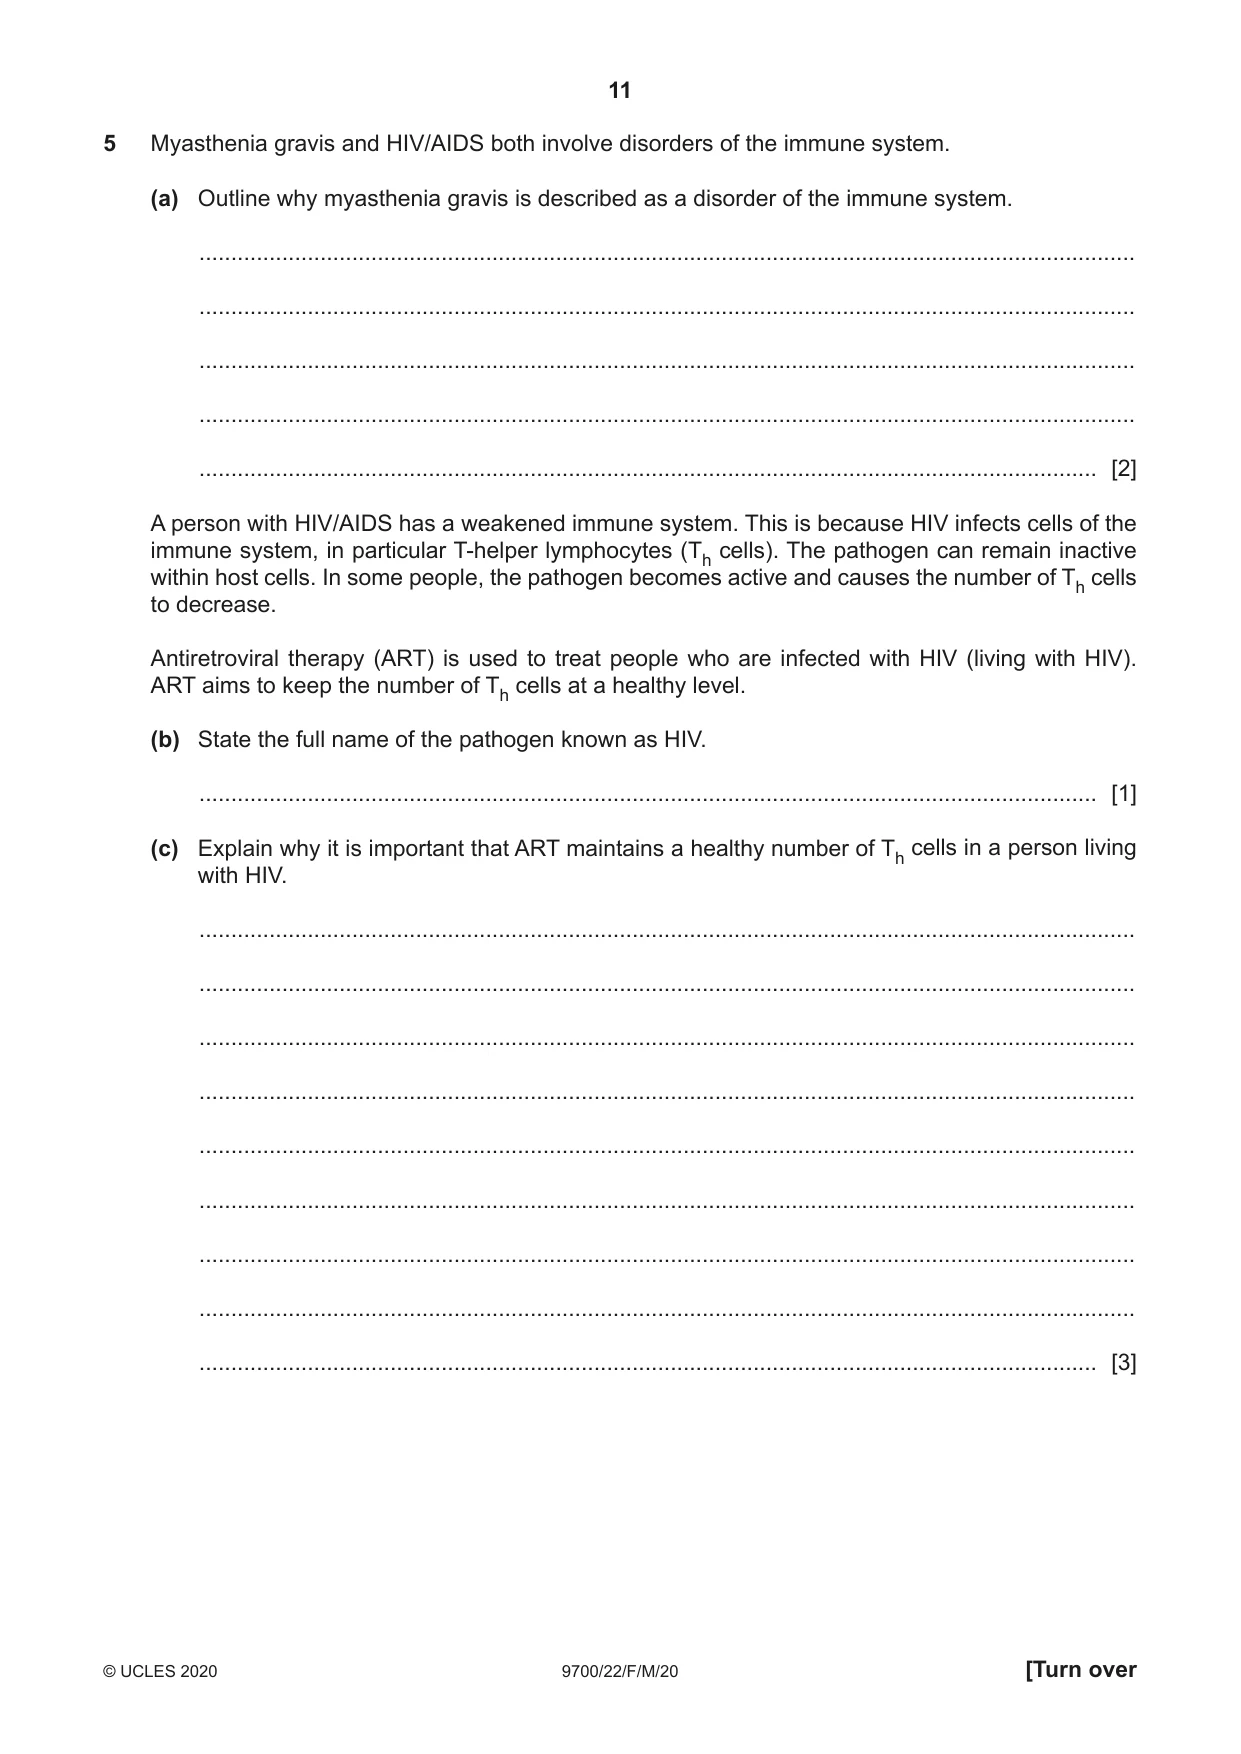
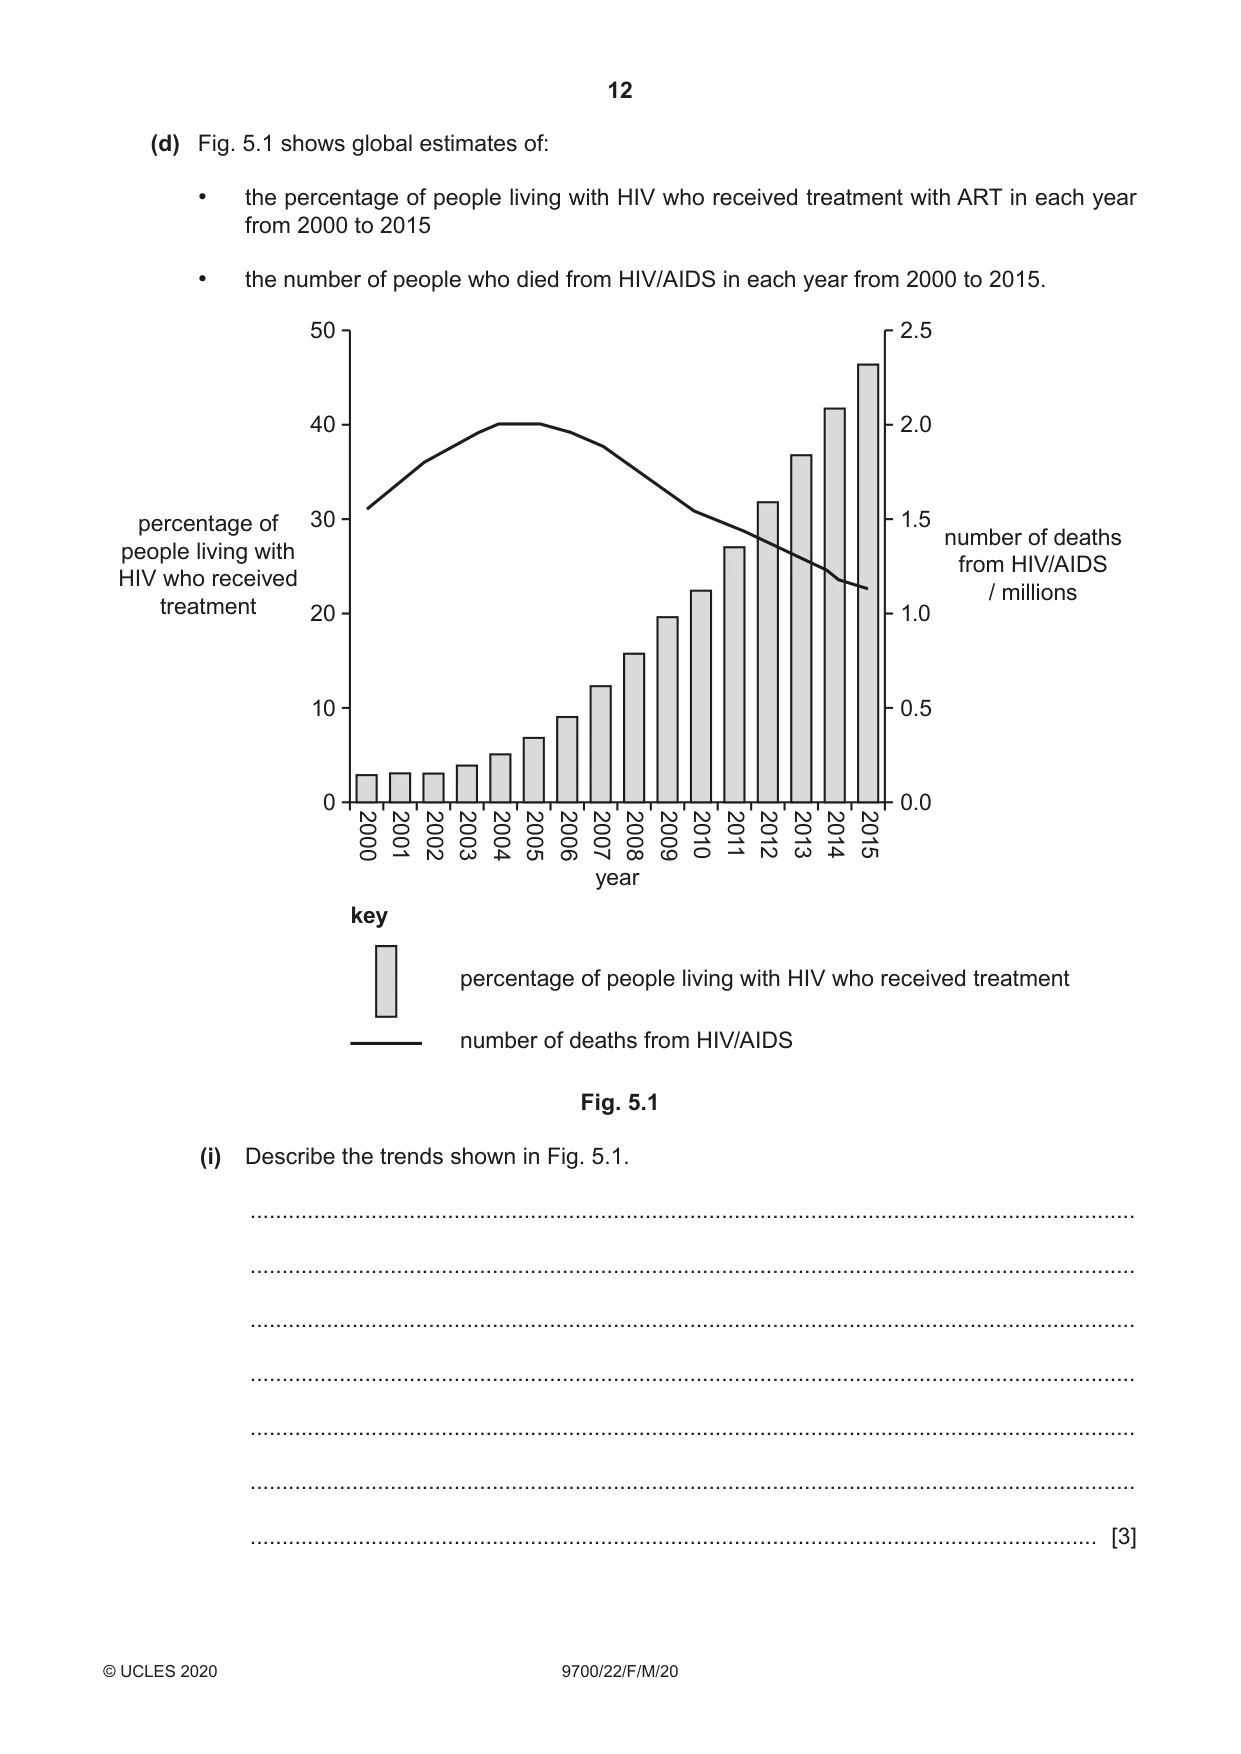
5 Myasthenia gravis and HIV/AIDS both involve disorders of the immune system. (a) Outline why myasthenia gravis is described as a disorder of the immune system. ................................................................................................................................................... ................................................................................................................................................... ................................................................................................................................................... ................................................................................................................................................... ............................................................................................................................................. [2] A person with HIV/AIDS has a weakened immune system. This is because HIV infects cells of the immune system, in particular T‑helper lymphocytes (Th cells). The pathogen can remain inactive within host cells. In some people, the pathogen becomes active and causes the number of Th cells to decrease. Antiretroviral therapy (ART) is used to treat people who are infected with HIV (living with HIV). ART aims to keep the number of Th cells at a healthy level. (b) State the full name of the pathogen known as HIV. ............................................................................................................................................. [1] (c) Explain why it is important that ART maintains a healthy number of Th cells in a person living with HIV. ................................................................................................................................................... ................................................................................................................................................... ................................................................................................................................................... ................................................................................................................................................... ................................................................................................................................................... ................................................................................................................................................... ................................................................................................................................................... ................................................................................................................................................... ............................................................................................................................................. [3] (d) Fig. 5.1 shows global estimates of: • the percentage of people living with HIV who received treatment with ART in each year from 2000 to 2015 • the number of people who died from HIV/AIDS in each year from 2000 to 2015. 50 2.5 40 2.0 percentage of 30 1.5 number of deathspeople living with from HIV/AIDSHIV who received / millions treatment 20 1.0 10 0.5 0 0.0 2000 2001 2002 2003 2004 2005 2006 2007 2008 2009 2010 2011 2012 2013 2014 2015 year key percentage of people living with HIV who received treatment number of deaths from HIV/AIDS Fig. 5.1 (i) Describe the trends shown in Fig. 5.1. ........................................................................................................................................... ........................................................................................................................................... ........................................................................................................................................... ........................................................................................................................................... ........................................................................................................................................... ........................................................................................................................................... ..................................................................................................................................... [3] (ii) It is recommended that ART is given to all people living with HIV. Some countries that support this recommendation find it difficult to provide ART to everyone living with HIV. Other than the high cost of treatment, suggest two reasons why it is difficult to provide ART to everyone living with HIV. ........................................................................................................................................... ........................................................................................................................................... ........................................................................................................................................... ........................................................................................................................................... ........................................................................................................................................... ........................................................................................................................................... ..................................................................................................................................... [2] [Total: 11]
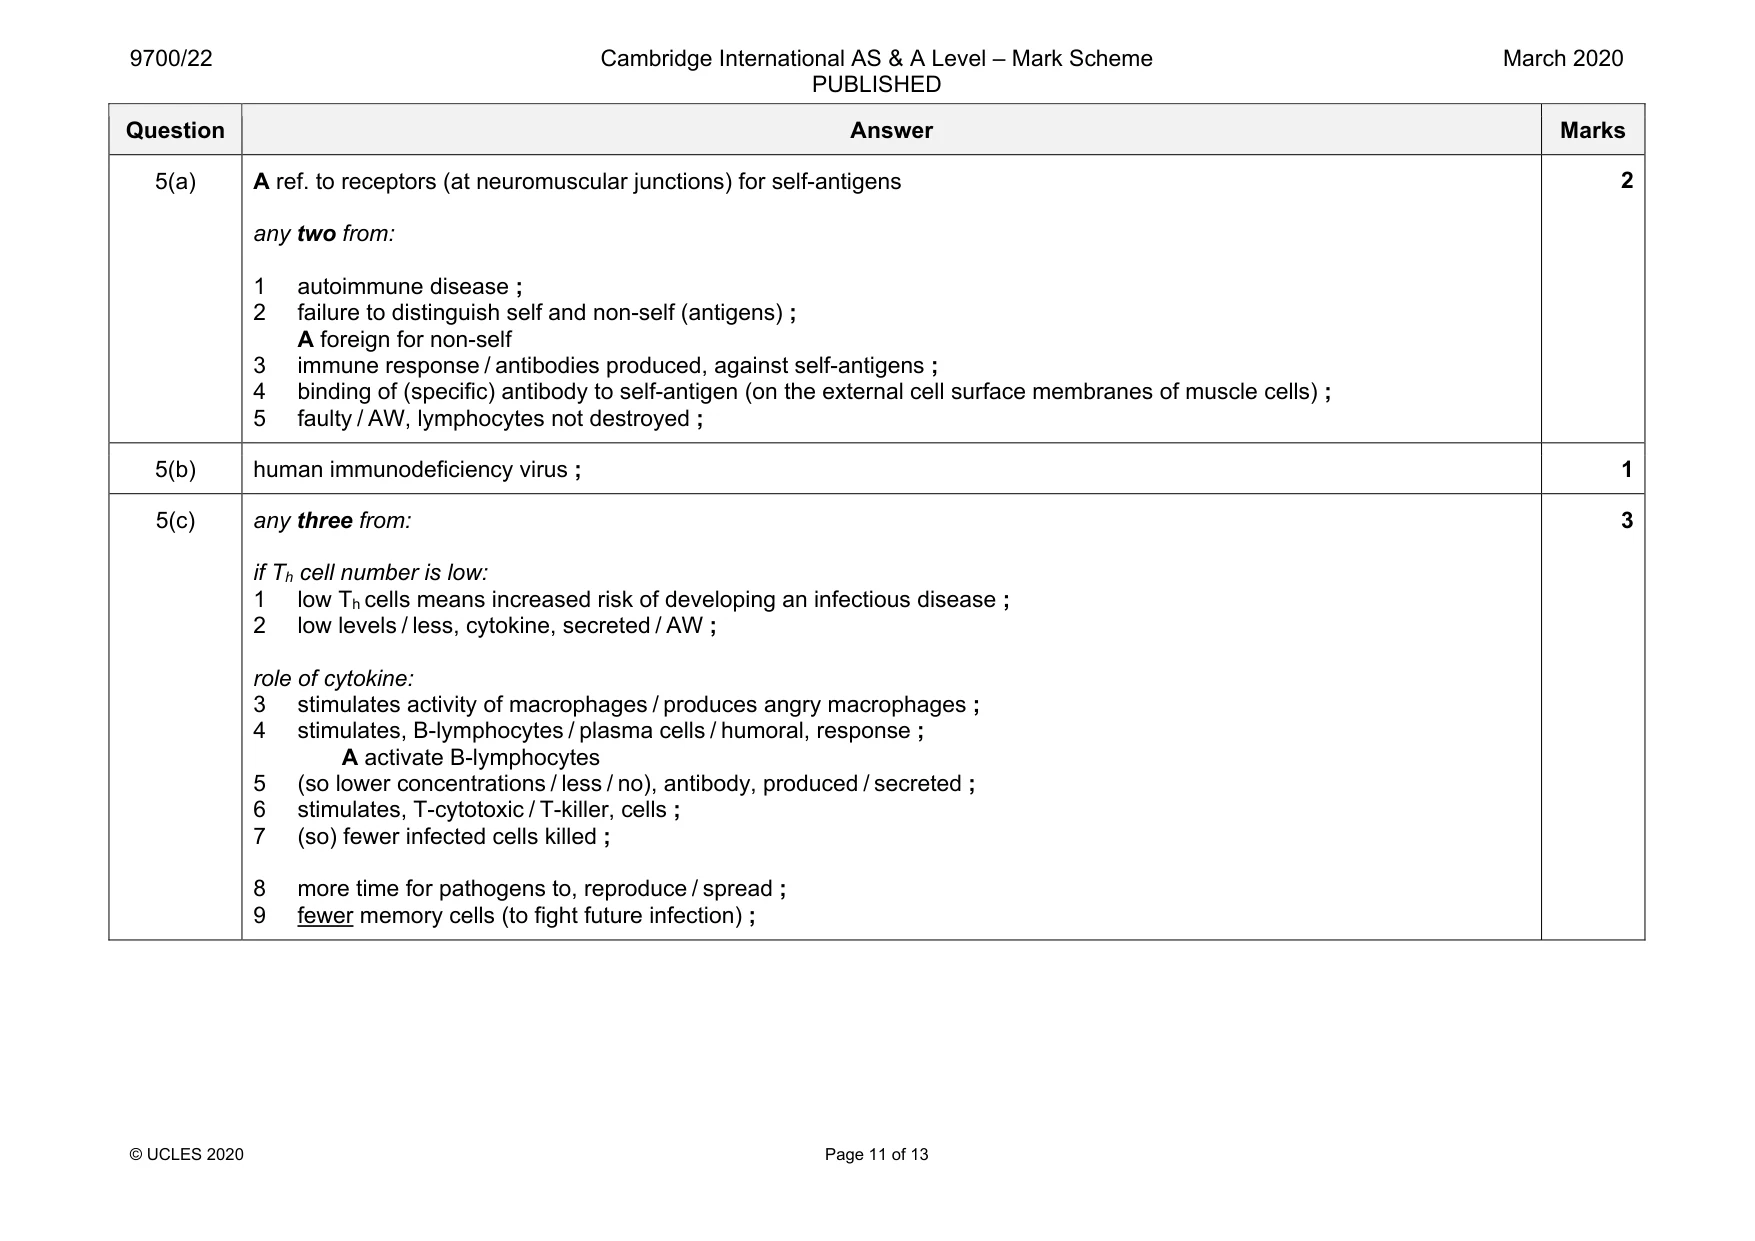
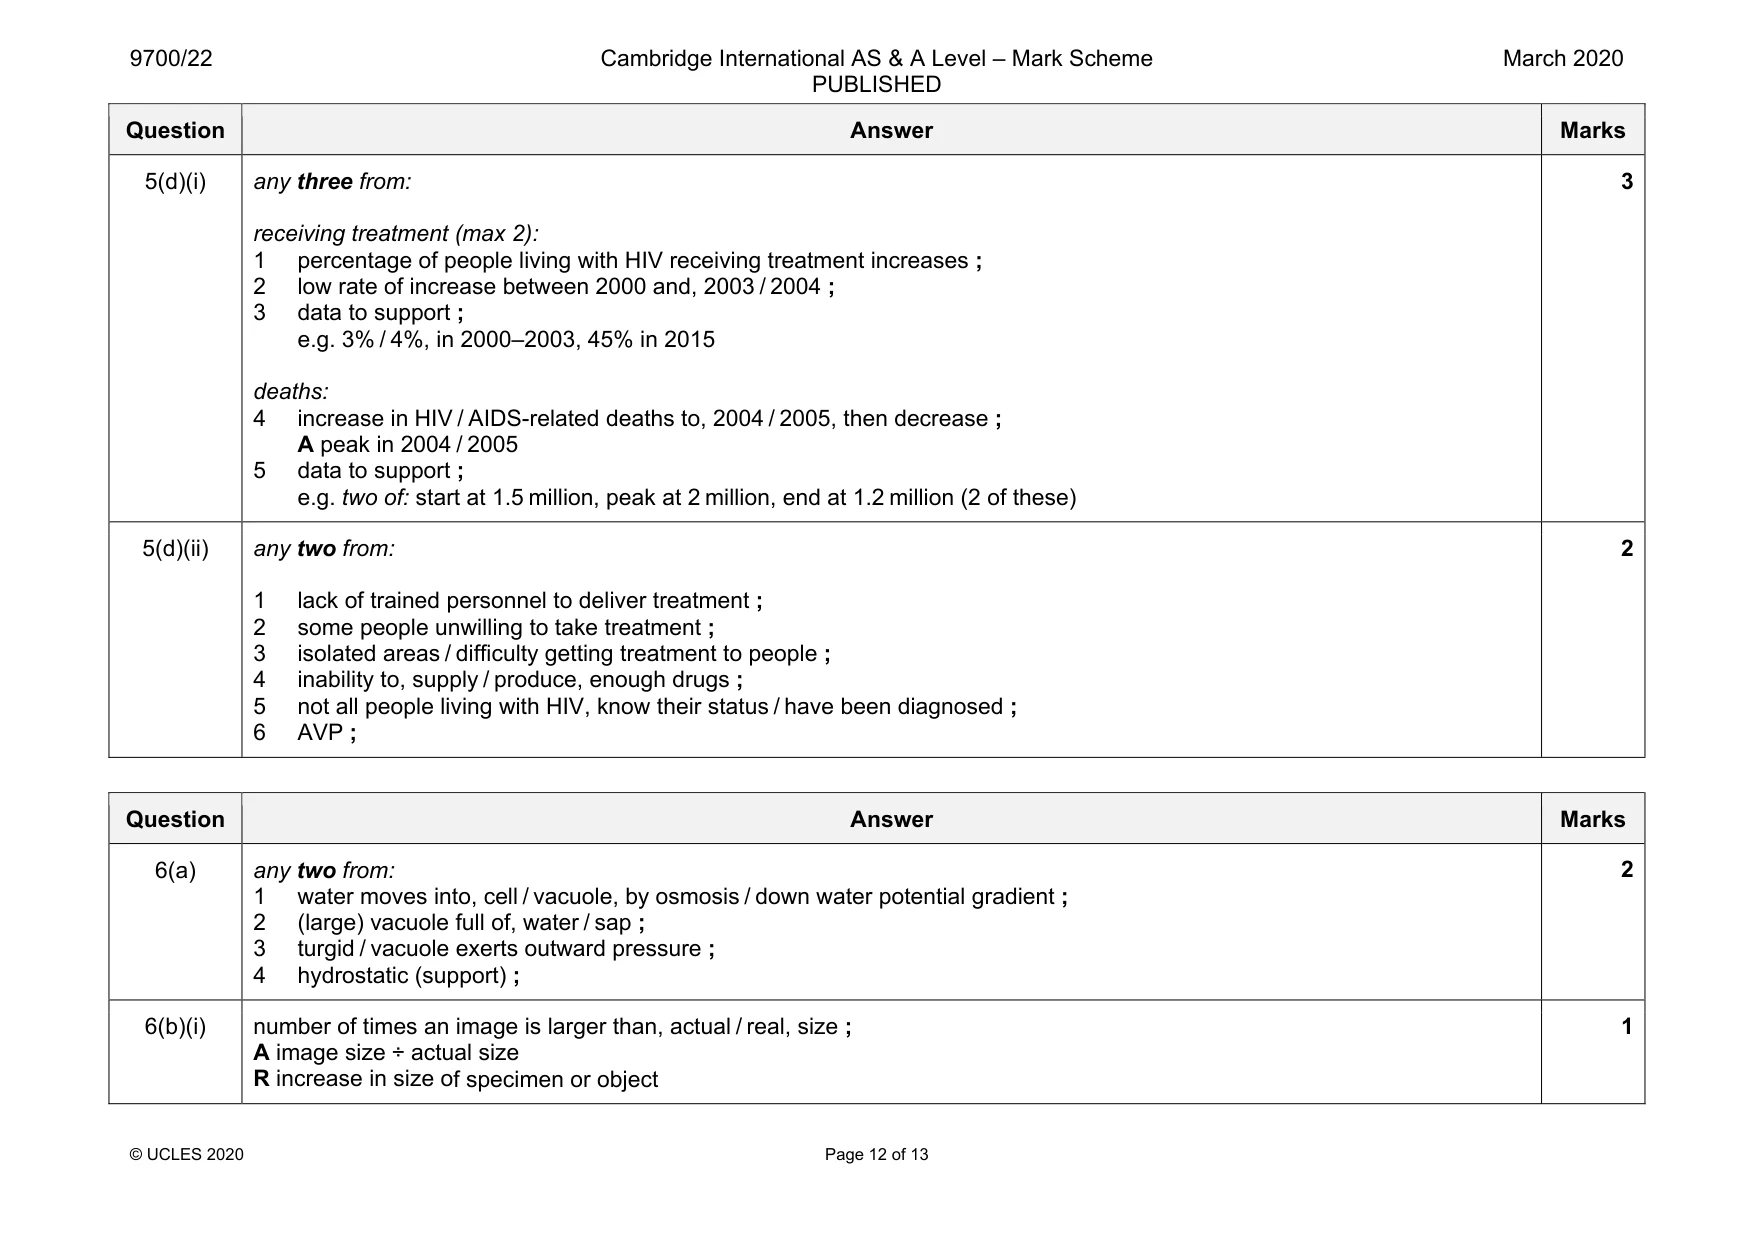
Mark scheme: 5(a) A ref. to receptors (at neuromuscular junctions) for self-antigens any two from: 1 autoimmune disease ; 2 failure to distinguish self and non-self (antigens) ; A foreign for non-self 3 immune response / antibodies produced, against self-antigens ; 4 binding of (specific) antibody to self-antigen (on the external cell surface membranes of muscle cells) ; 5 faulty / AW, lymphocytes not destroyed ; 5(b) human immunodeficiency virus ; 1 5(c) any three from: if Th cell number is low: 1 low Th cells means increased risk of developing an infectious disease ; 2 low levels / less, cytokine, secreted / AW ; role of cytokine: 3 stimulates activity of macrophages / produces angry macrophages ; 4 stimulates, B-lymphocytes / plasma cells / humoral, response ; A activate B-lymphocytes 5 (so lower concentrations / less / no), antibody, produced / secreted ; 6 stimulates, T-cytotoxic / T-killer, cells ; 7 (so) fewer infected cells killed ; 8 more time for pathogens to, reproduce / spread ; 9 fewer memory cells (to fight future infection) ; 3 Question Answer Marks 5(d)(i) any three from: receiving treatment (max 2): 1 percentage of people living with HIV receiving treatment increases ; 2 low rate of increase between 2000 and, 2003 / 2004 ; 3 data to support ; e.g. 3% / 4%, in 2000–2003, 45% in 2015 deaths: 4 increase in HIV / AIDS-related deaths to, 2004 / 2005, then decrease ; A peak in 2004 / 2005 5 data to support ; e.g. two of: start at 1.5 million, peak at 2 million, end at 1.2 million (2 of these) 3 5(d)(ii) any two from: 1 lack of trained personnel to deliver treatment ; 2 some people unwilling to take treatment ; 3 isolated areas / difficulty getting treatment to people ; 4 inability to, supply / produce, enough drugs ; 5 not all people living with HIV, know their status / have been diagnosed ; 6 AVP ; 2
Q6 · A transmission electron micrograph of a plant parenchyma cell
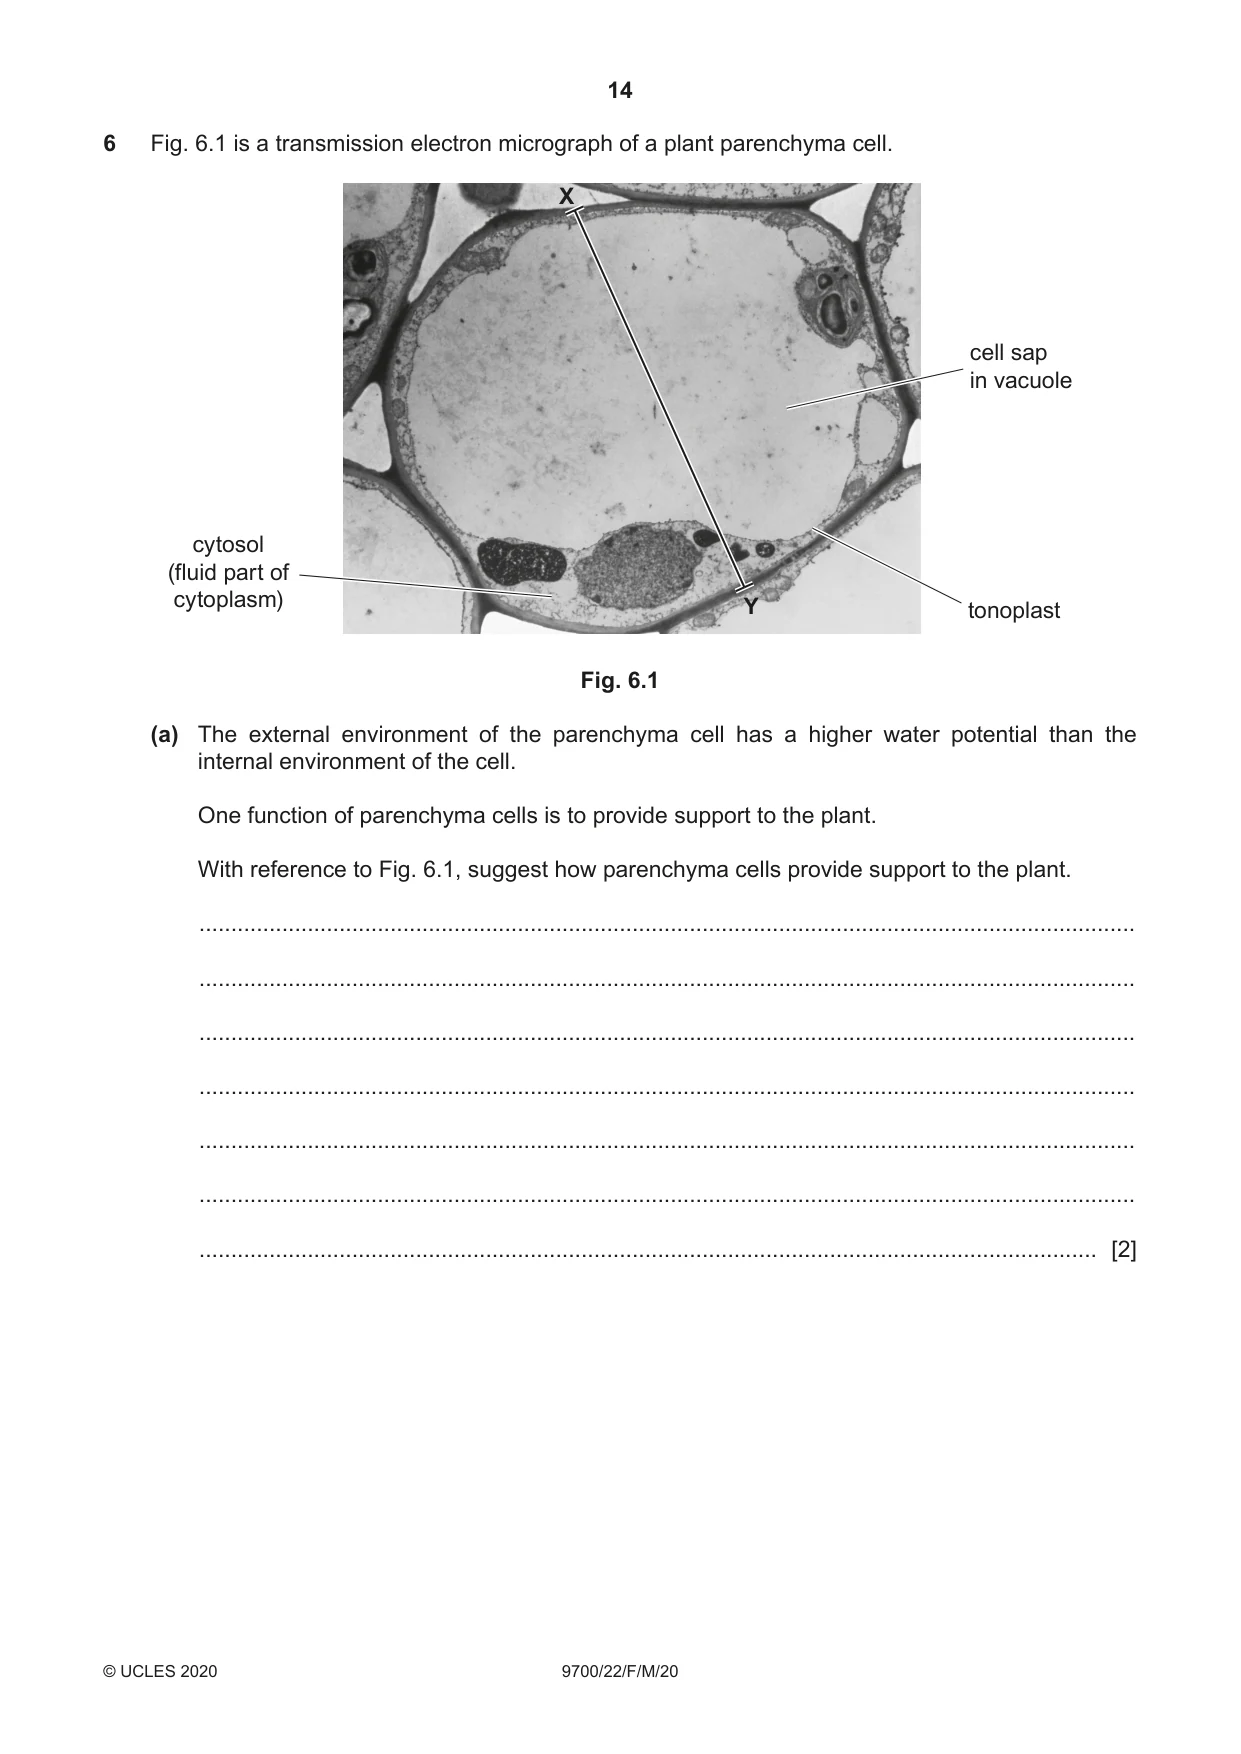
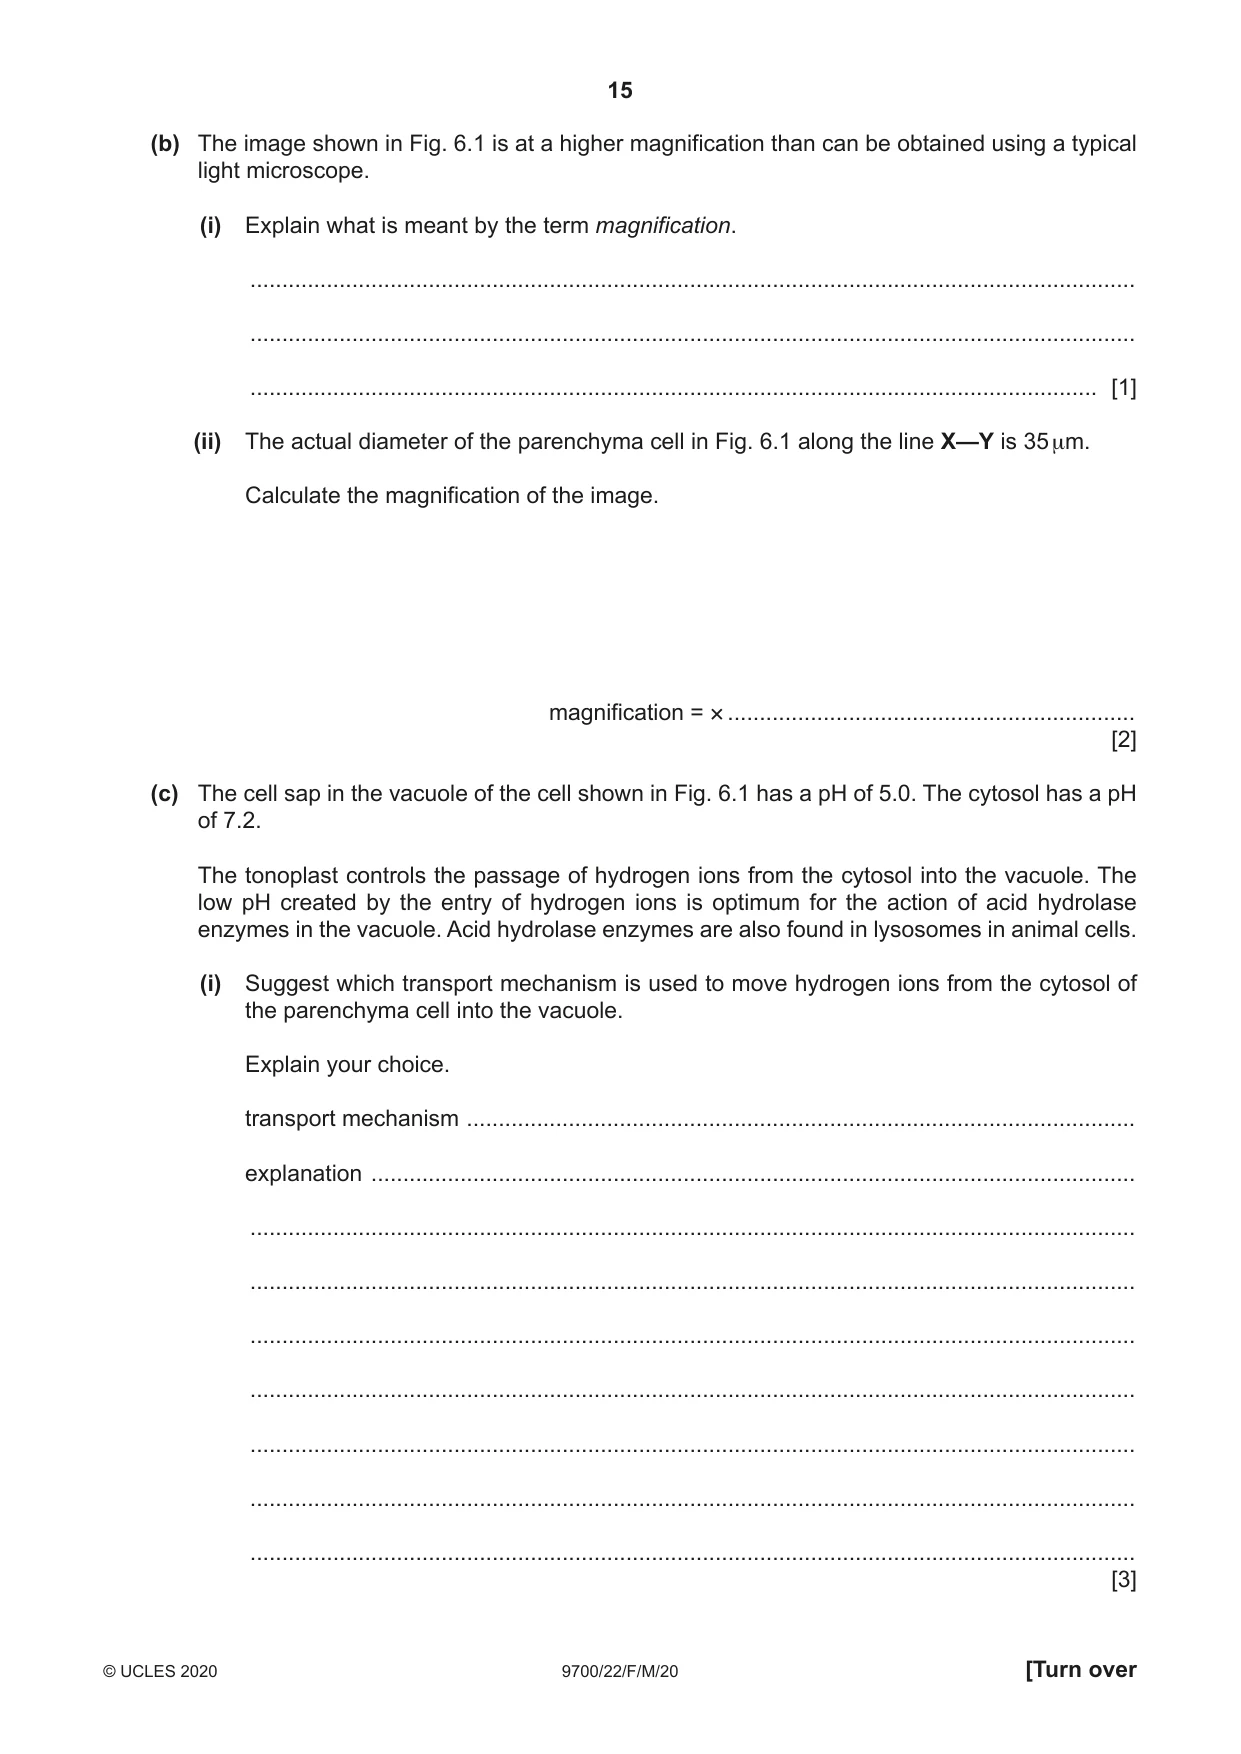
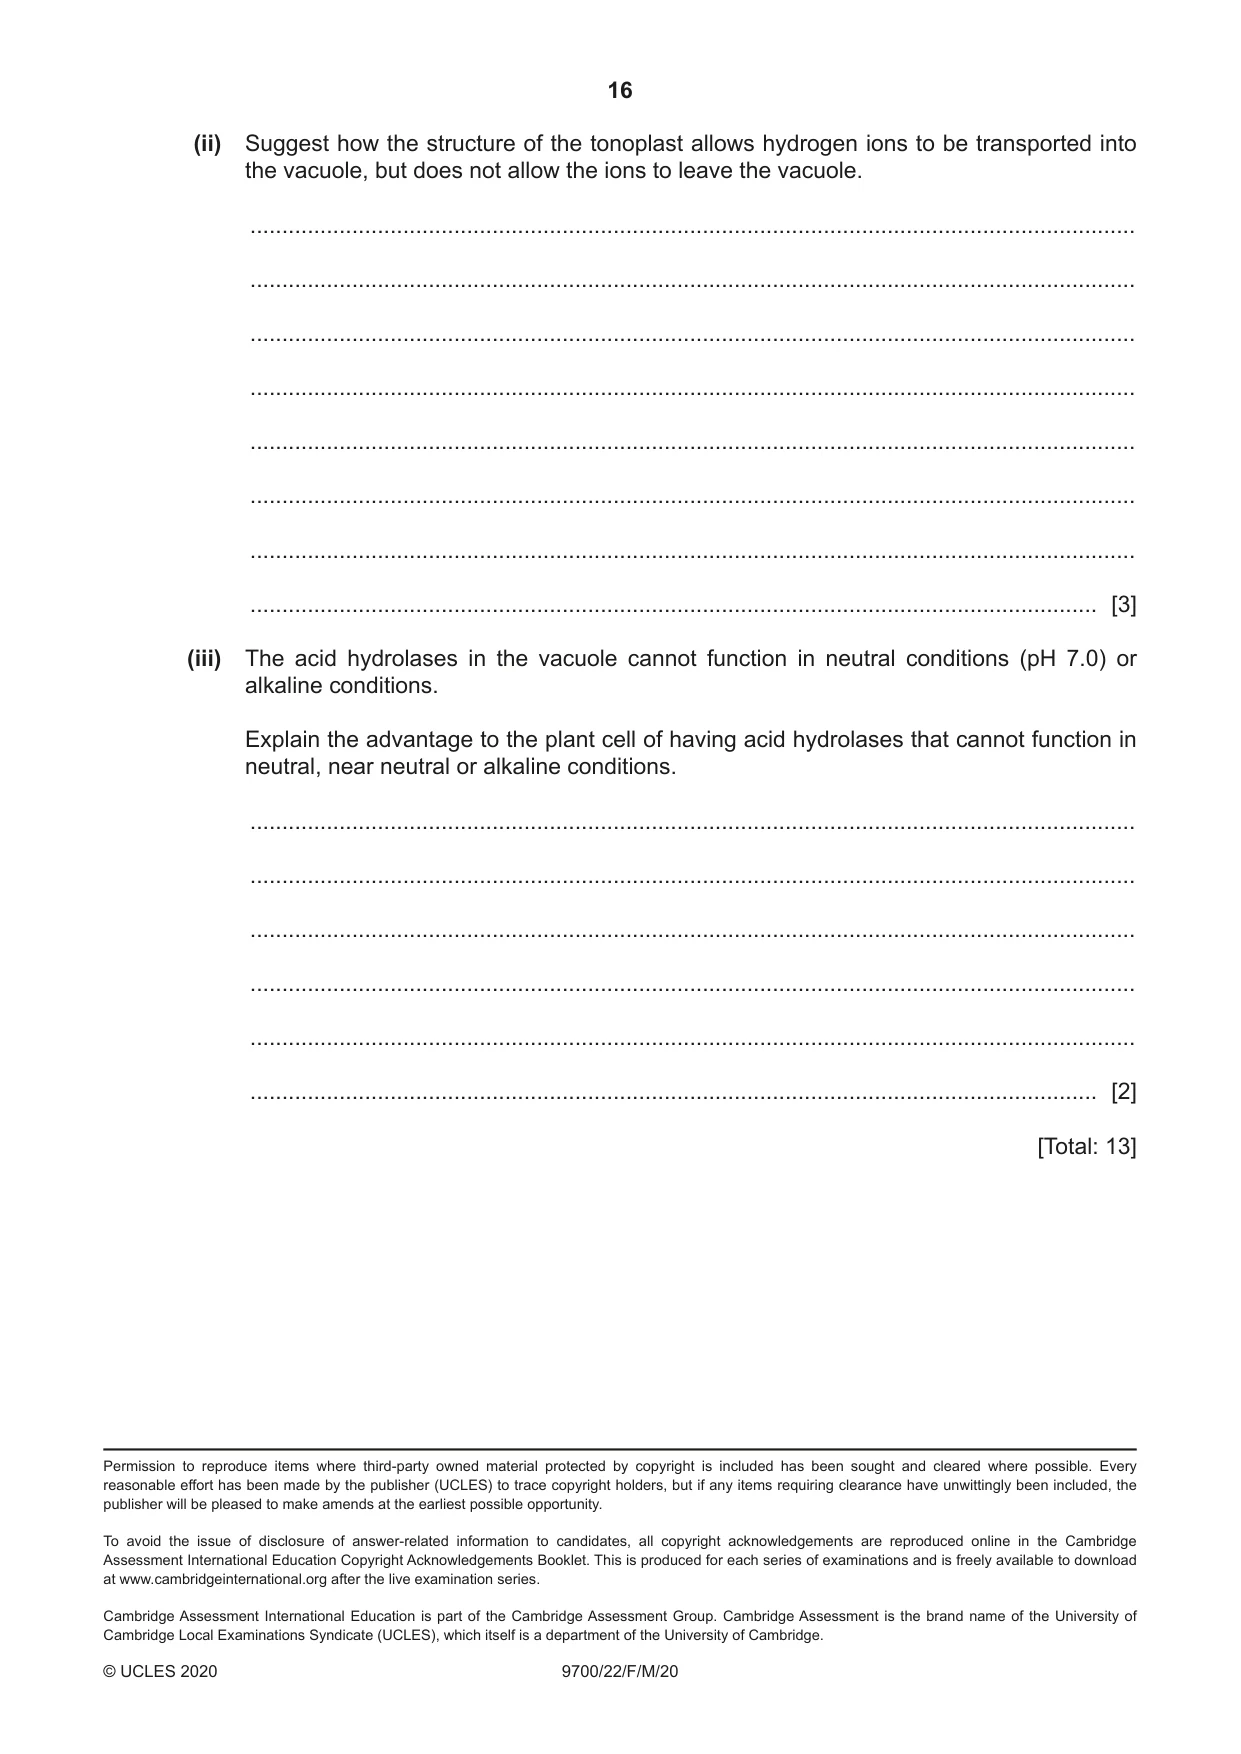
6 Fig. 6.1 is a transmission electron micrograph of a plant parenchyma cell. X cell sap in vacuole cytosol (fluid part of cytoplasm) Y tonoplast Fig. 6.1 (a) The external environment of the parenchyma cell has a higher water potential than the internal environment of the cell. One function of parenchyma cells is to provide support to the plant. With reference to Fig. 6.1, suggest how parenchyma cells provide support to the plant. ................................................................................................................................................... ................................................................................................................................................... ................................................................................................................................................... ................................................................................................................................................... ................................................................................................................................................... ................................................................................................................................................... ............................................................................................................................................. [2] (b) The image shown in Fig. 6.1 is at a higher magnification than can be obtained using a typical light microscope. (i) Explain what is meant by the term magnification. ........................................................................................................................................... ........................................................................................................................................... ..................................................................................................................................... [1] (ii) The actual diameter of the parenchyma cell in Fig. 6.1 along the line X—Y is 35 µm. Calculate the magnification of the image. magnification = × ................................................................ [2] (c) The cell sap in the vacuole of the cell shown in Fig. 6.1 has a pH of 5.0. The cytosol has a pH of 7.2. The tonoplast controls the passage of hydrogen ions from the cytosol into the vacuole. The low pH created by the entry of hydrogen ions is optimum for the action of acid hydrolase enzymes in the vacuole. Acid hydrolase enzymes are also found in lysosomes in animal cells. (i) Suggest which transport mechanism is used to move hydrogen ions from the cytosol of the parenchyma cell into the vacuole. Explain your choice. transport mechanism ......................................................................................................... explanation ........................................................................................................................ ........................................................................................................................................... ........................................................................................................................................... ........................................................................................................................................... ........................................................................................................................................... ........................................................................................................................................... ........................................................................................................................................... ........................................................................................................................................... [3] (ii) Suggest how the structure of the tonoplast allows hydrogen ions to be transported into the vacuole, but does not allow the ions to leave the vacuole. ........................................................................................................................................... ........................................................................................................................................... ........................................................................................................................................... ........................................................................................................................................... ........................................................................................................................................... ........................................................................................................................................... ........................................................................................................................................... ..................................................................................................................................... [3] (iii) The acid hydrolases in the vacuole cannot function in neutral conditions (pH 7.0) or alkaline conditions. Explain the advantage to the plant cell of having acid hydrolases that cannot function in neutral, near neutral or alkaline conditions. ........................................................................................................................................... ........................................................................................................................................... ........................................................................................................................................... ........................................................................................................................................... ........................................................................................................................................... ..................................................................................................................................... [2] [Total: 13]
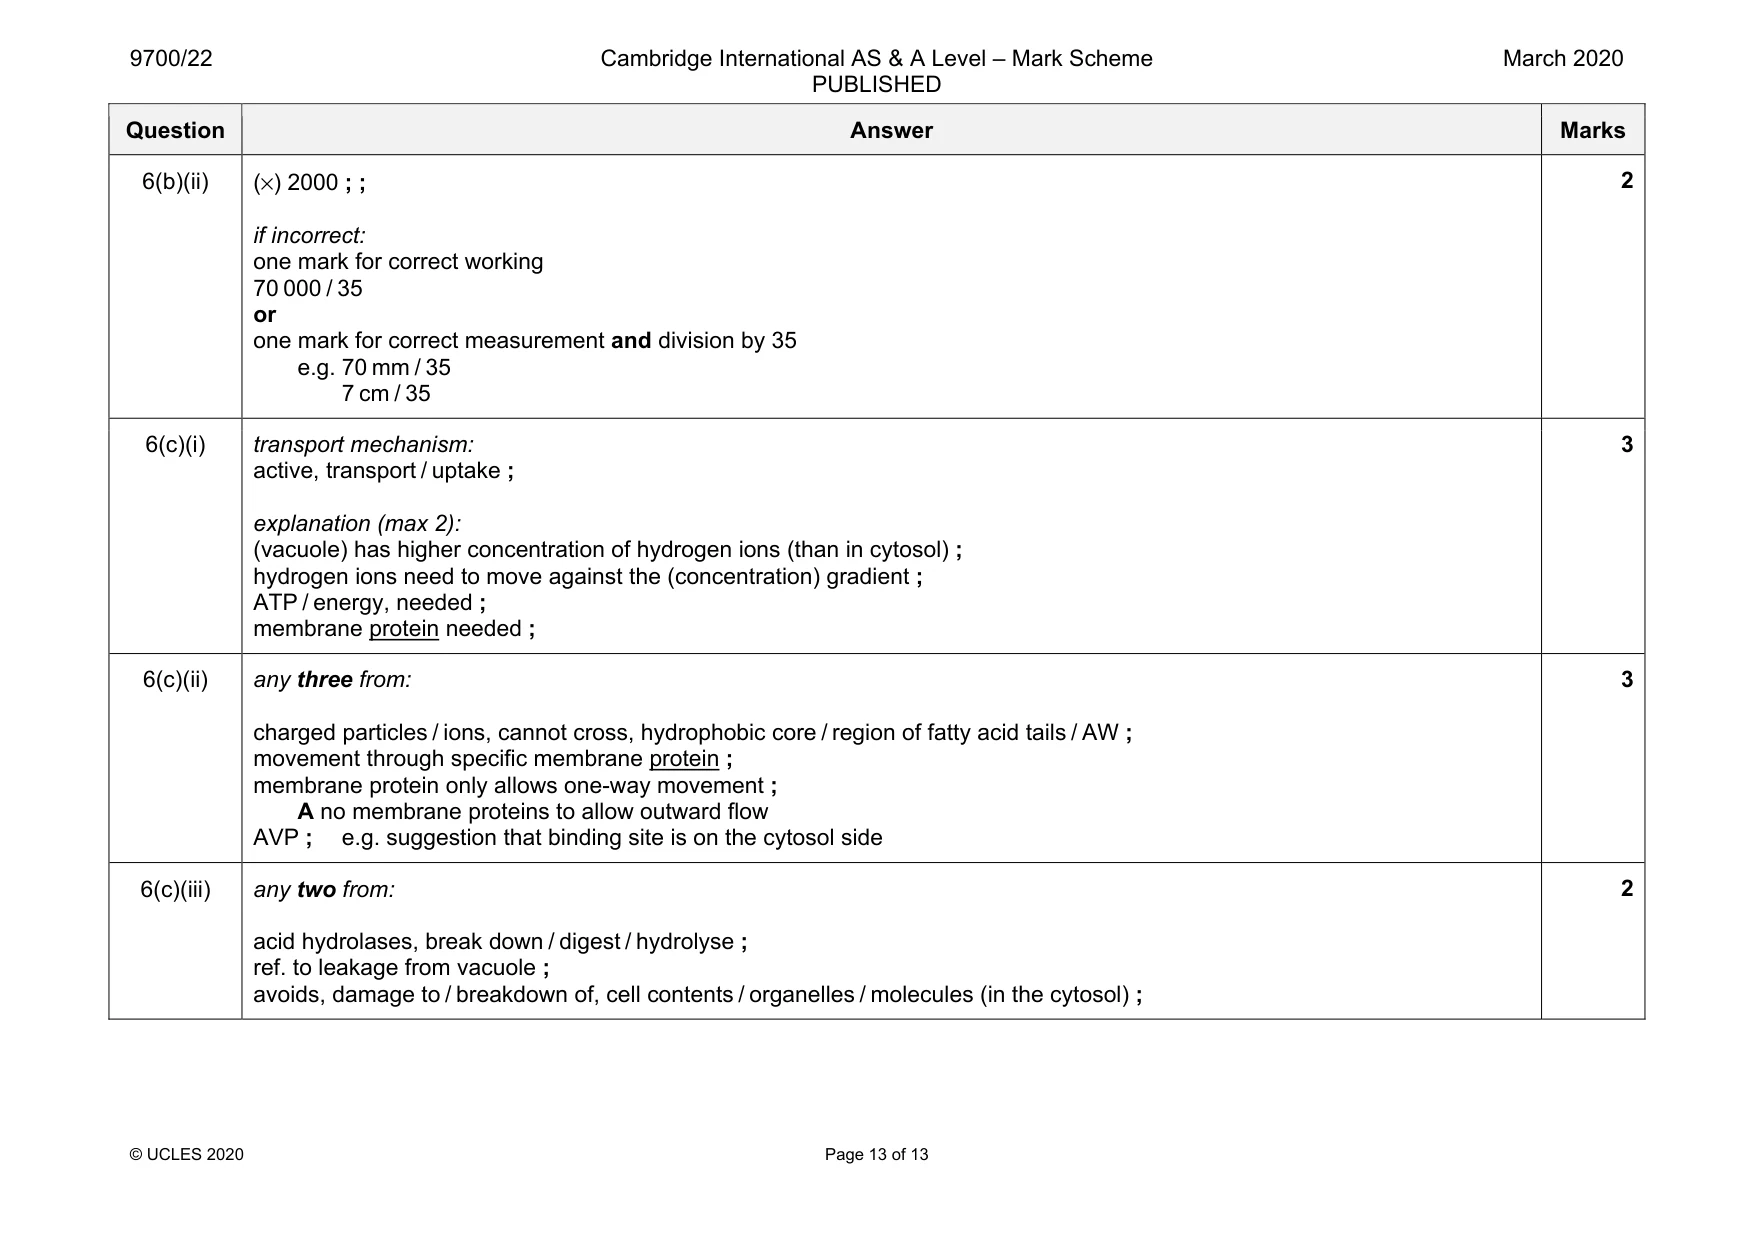
Mark scheme: 6(a) any two from: 1 water moves into, cell / vacuole, by osmosis / down water potential gradient ; 2 (large) vacuole full of, water / sap ; 3 turgid / vacuole exerts outward pressure ; 4 hydrostatic (support) ; 6(b)(i) number of times an image is larger than, actual / real, size ; A image size ÷ actual size R increase in size of specimen or object 1 Question Answer Marks 6(b)(ii) (×) 2000 ; ; if incorrect: one mark for correct working 70 000 / 35 or one mark for correct measurement and division by 35 e.g. 70 mm / 35 7 cm / 35 2 6(c)(i) transport mechanism: active, transport / uptake ; explanation (max 2): (vacuole) has higher concentration of hydrogen ions (than in cytosol) ; hydrogen ions need to move against the (concentration) gradient ; ATP / energy, needed ; membrane protein needed ; 3 6(c)(ii) any three from: charged particles / ions, cannot cross, hydrophobic core / region of fatty acid tails / AW ; movement through specific membrane protein ; membrane protein only allows one-way movement ; A no membrane proteins to allow outward flow AVP ; e.g. suggestion that binding site is on the cytosol side 3 6(c)(iii) any two from: acid hydrolases, break down / digest / hydrolyse ; ref. to leakage from vacuole ; avoids, damage to / breakdown of, cell contents / organelles / molecules (in the cytosol) ; 2
What was in this paper
The subtopics covered by these 6 questions, and how many questions each got. Open one in a new tab to see every Cambridge question on it.
What you needed in this session
Cambridge’s own grade thresholds for 2020 Feb/March, Paper 2 · Variant 2. A higher threshold means an easier paper — the bar moves with how the cohort did.