Cambridge A Level Biology 9700 — 2019 Oct/Nov Paper 5 · Variant 1
9700/51/O/N/19 · 2 questions · 30 marks · ≈34 min
The question paper and its mark scheme, free to read here and free to download. This is Cambridge’s own paper, exactly as it was sat.
Question paper8 pages

Mark scheme8 pages
Answers below. Sit the paper first if you are practising.
Questions as text
Q1 · Chlorella is a photosynthetic, single-celled protoctist that lives in ponds
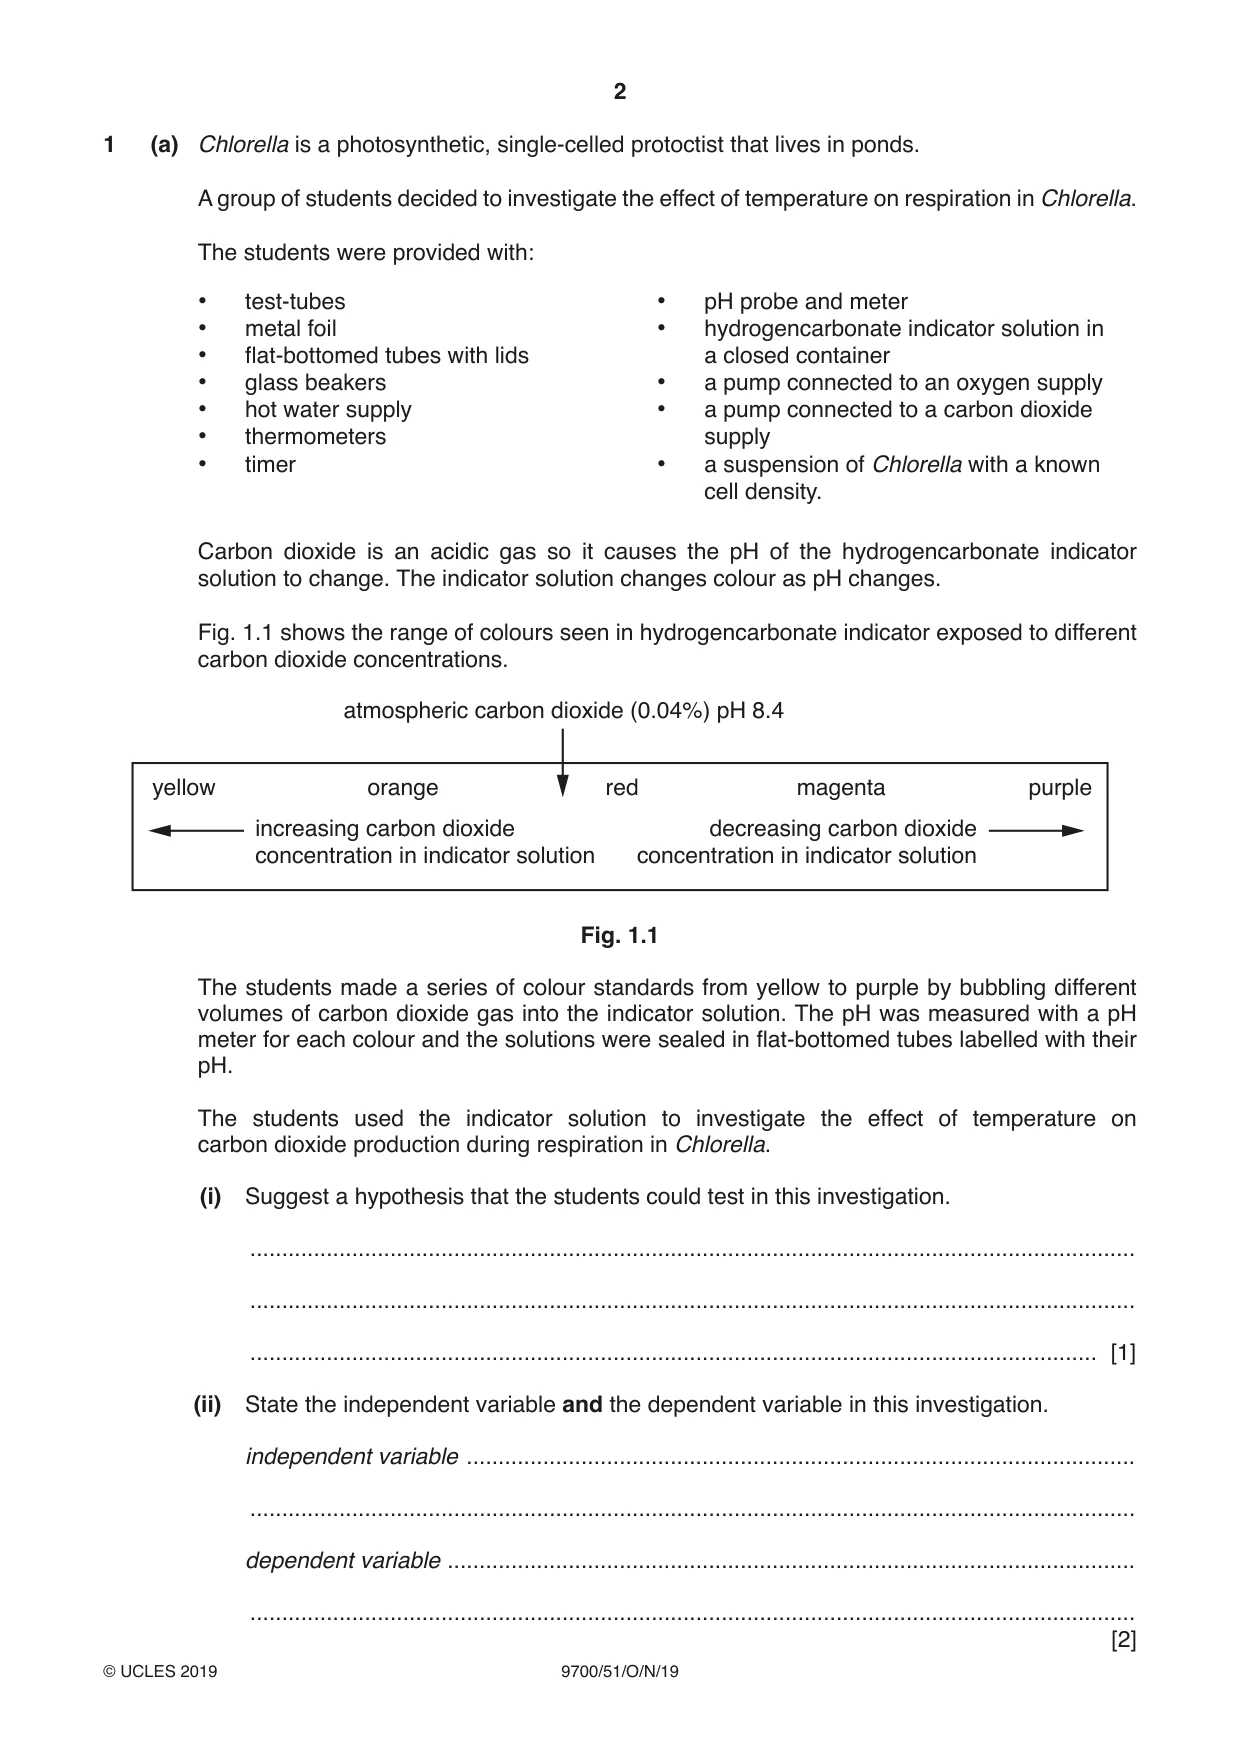
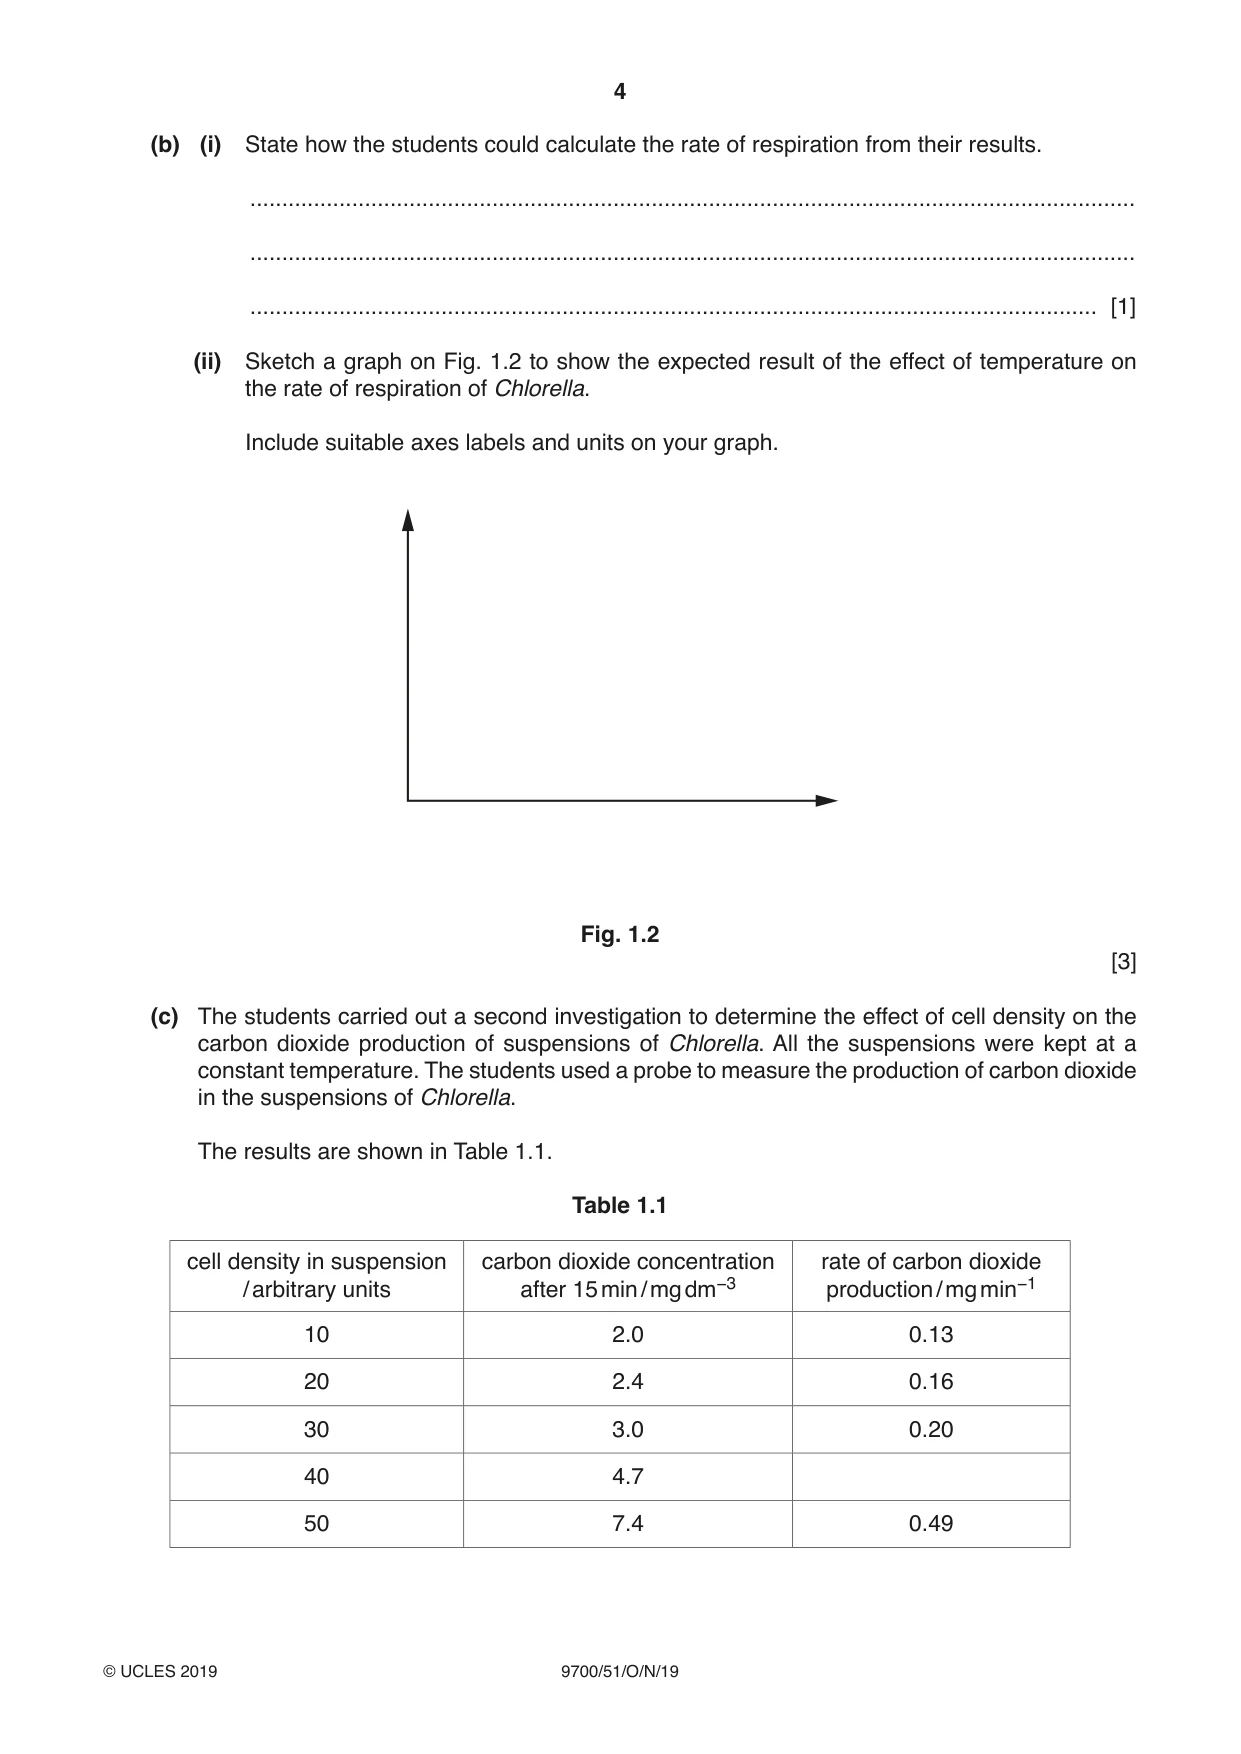
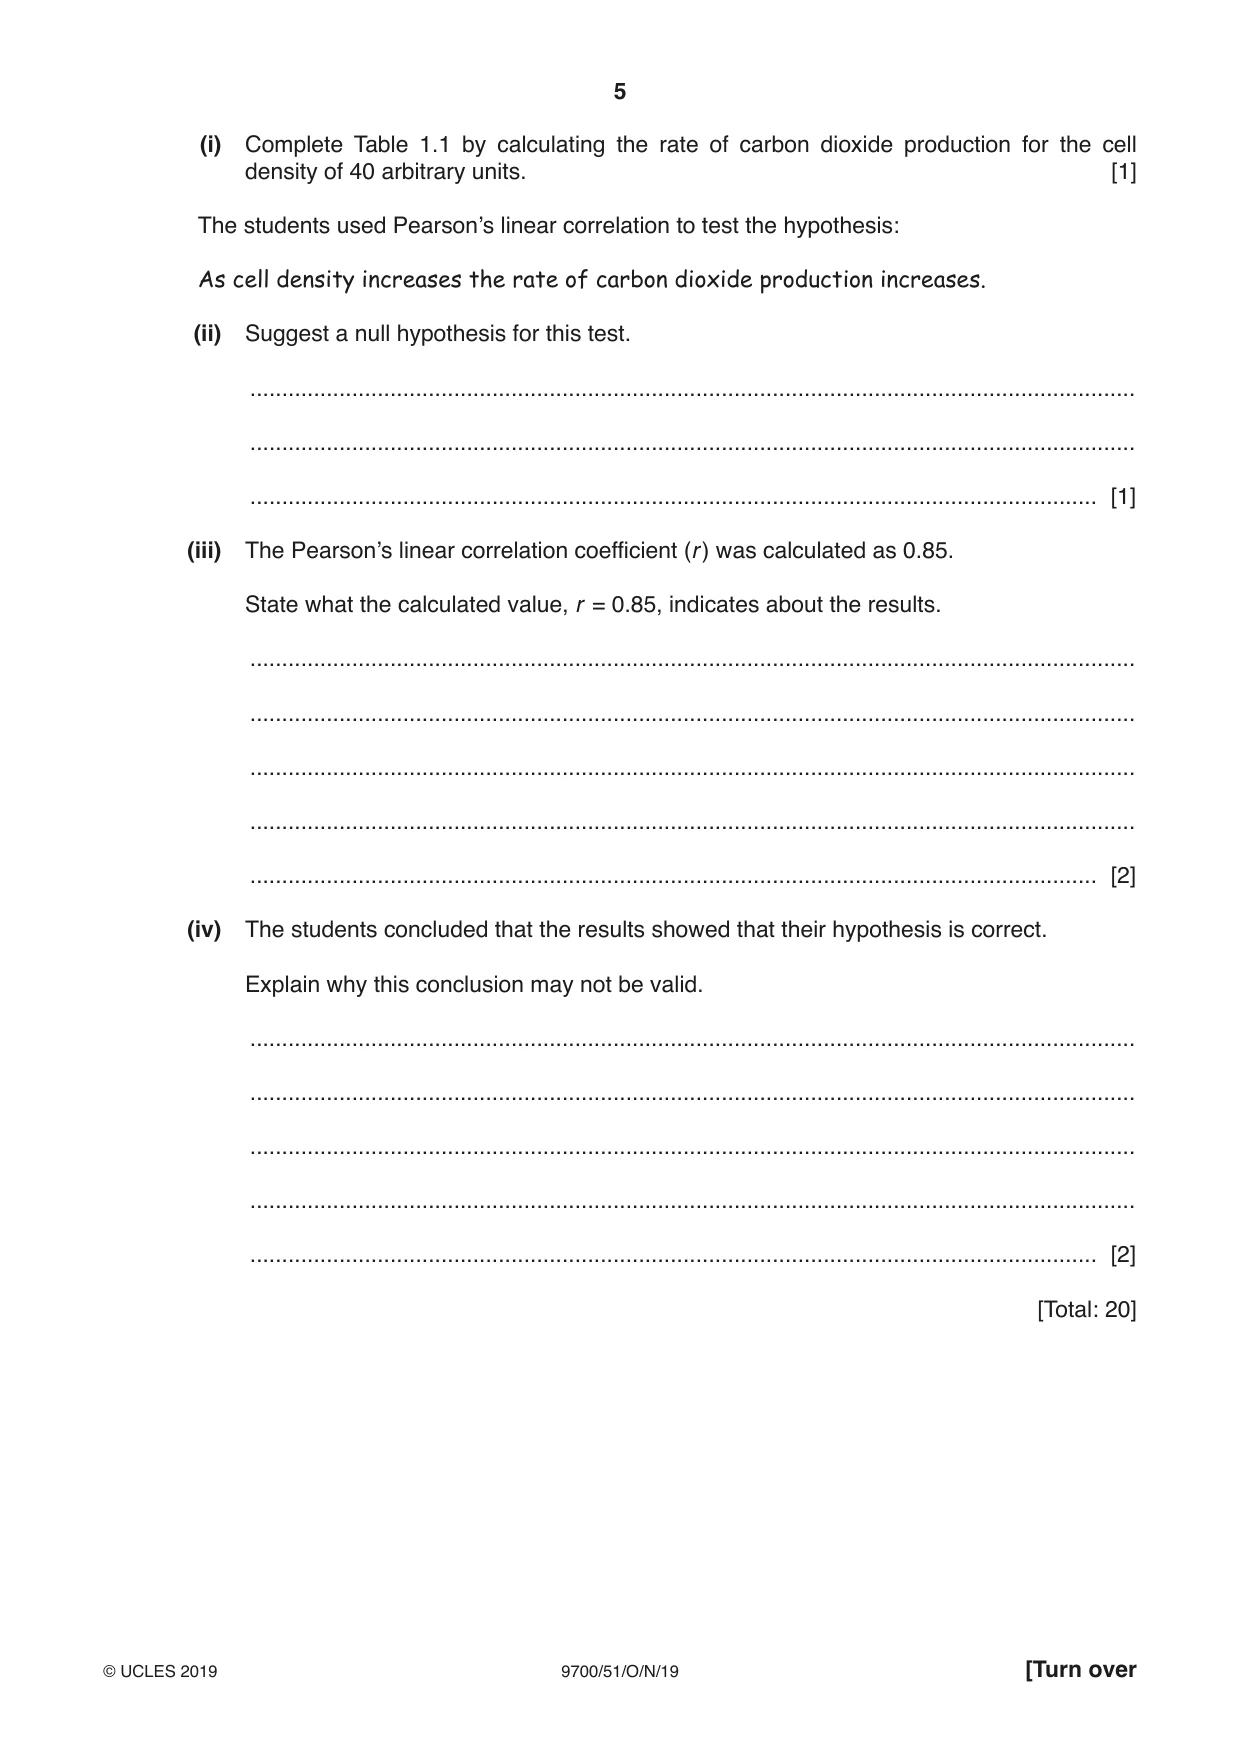
1 (a) Chlorella is a photosynthetic, single-celled protoctist that lives in ponds. A group of students decided to investigate the effect of temperature on respiration in Chlorella. The students were provided with: • test-tubes • pH probe and meter • metal foil • hydrogencarbonate indicator solution in • flat-bottomed tubes with lids a closed container • glass beakers • a pump connected to an oxygen supply • hot water supply • a pump connected to a carbon dioxide • thermometers supply • timer • a suspension of Chlorella with a known cell density. Carbon dioxide is an acidic gas so it causes the pH of the hydrogencarbonate indicator solution to change. The indicator solution changes colour as pH changes. Fig. 1.1 shows the range of colours seen in hydrogencarbonate indicator exposed to different carbon dioxide concentrations. atmospheric carbon dioxide (0.04%) pH 8.4 yellow orange red magenta purple increasing carbon dioxide decreasing carbon dioxide concentration in indicator solution concentration in indicator solution Fig. 1.1 The students made a series of colour standards from yellow to purple by bubbling different volumes of carbon dioxide gas into the indicator solution. The pH was measured with a pH meter for each colour and the solutions were sealed in flat-bottomed tubes labelled with their pH. The students used the indicator solution to investigate the effect of temperature on carbon dioxide production during respiration in Chlorella. (i) Suggest a hypothesis that the students could test in this investigation. ........................................................................................................................................... ........................................................................................................................................... ..................................................................................................................................... [1] (ii) State the independent variable and the dependent variable in this investigation. independent variable ......................................................................................................... ........................................................................................................................................... dependent variable ............................................................................................................ ........................................................................................................................................... [2] (iii) Describe how the students could use the apparatus provided to investigate the effect of temperature on carbon dioxide production during respiration in Chlorella. Your method should be set out in a logical order and be detailed enough to let another person follow it. Details of making the colour standards should not be included in your method. ........................................................................................................................................... ........................................................................................................................................... ........................................................................................................................................... ........................................................................................................................................... ........................................................................................................................................... ........................................................................................................................................... ........................................................................................................................................... ........................................................................................................................................... ........................................................................................................................................... ........................................................................................................................................... ........................................................................................................................................... ........................................................................................................................................... ........................................................................................................................................... ........................................................................................................................................... ........................................................................................................................................... ........................................................................................................................................... ........................................................................................................................................... ........................................................................................................................................... ........................................................................................................................................... ........................................................................................................................................... ........................................................................................................................................... ........................................................................................................................................... ........................................................................................................................................... ..................................................................................................................................... [7] (b) (i) State how the students could calculate the rate of respiration from their results. ........................................................................................................................................... ........................................................................................................................................... ..................................................................................................................................... [1] (ii) Sketch a graph on Fig. 1.2 to show the expected result of the effect of temperature on the rate of respiration of Chlorella. Include suitable axes labels and units on your graph. Fig. 1.2 [3] (c) The students carried out a second investigation to determine the effect of cell density on the carbon dioxide production of suspensions of Chlorella. All the suspensions were kept at a constant temperature. The students used a probe to measure the production of carbon dioxide in the suspensions of Chlorella. The results are shown in Table 1.1. Table 1.1 cell density in suspension carbon dioxide concentration rate of carbon dioxide / arbitrary units after 15 min / mg dm−3 production / mg min−1 10 2.0 0.13 20 2.4 0.16 30 3.0 0.20 40 4.7 50 7.4 0.49 (i) Complete Table 1.1 by calculating the rate of carbon dioxide production for the cell density of 40 arbitrary units. [1] The students used Pearson’s linear correlation to test the hypothesis: As cell density increases the rate of carbon dioxide production increases. (ii) Suggest a null hypothesis for this test. ........................................................................................................................................... ........................................................................................................................................... ..................................................................................................................................... [1] (iii) The Pearson’s linear correlation coefficient (r ) was calculated as 0.85. State what the calculated value, r = 0.85, indicates about the results. ........................................................................................................................................... ........................................................................................................................................... ........................................................................................................................................... ........................................................................................................................................... ..................................................................................................................................... [2] (iv) The students concluded that the results showed that their hypothesis is correct. Explain why this conclusion may not be valid. ........................................................................................................................................... ........................................................................................................................................... ........................................................................................................................................... ........................................................................................................................................... ..................................................................................................................................... [2] [Total: 20]
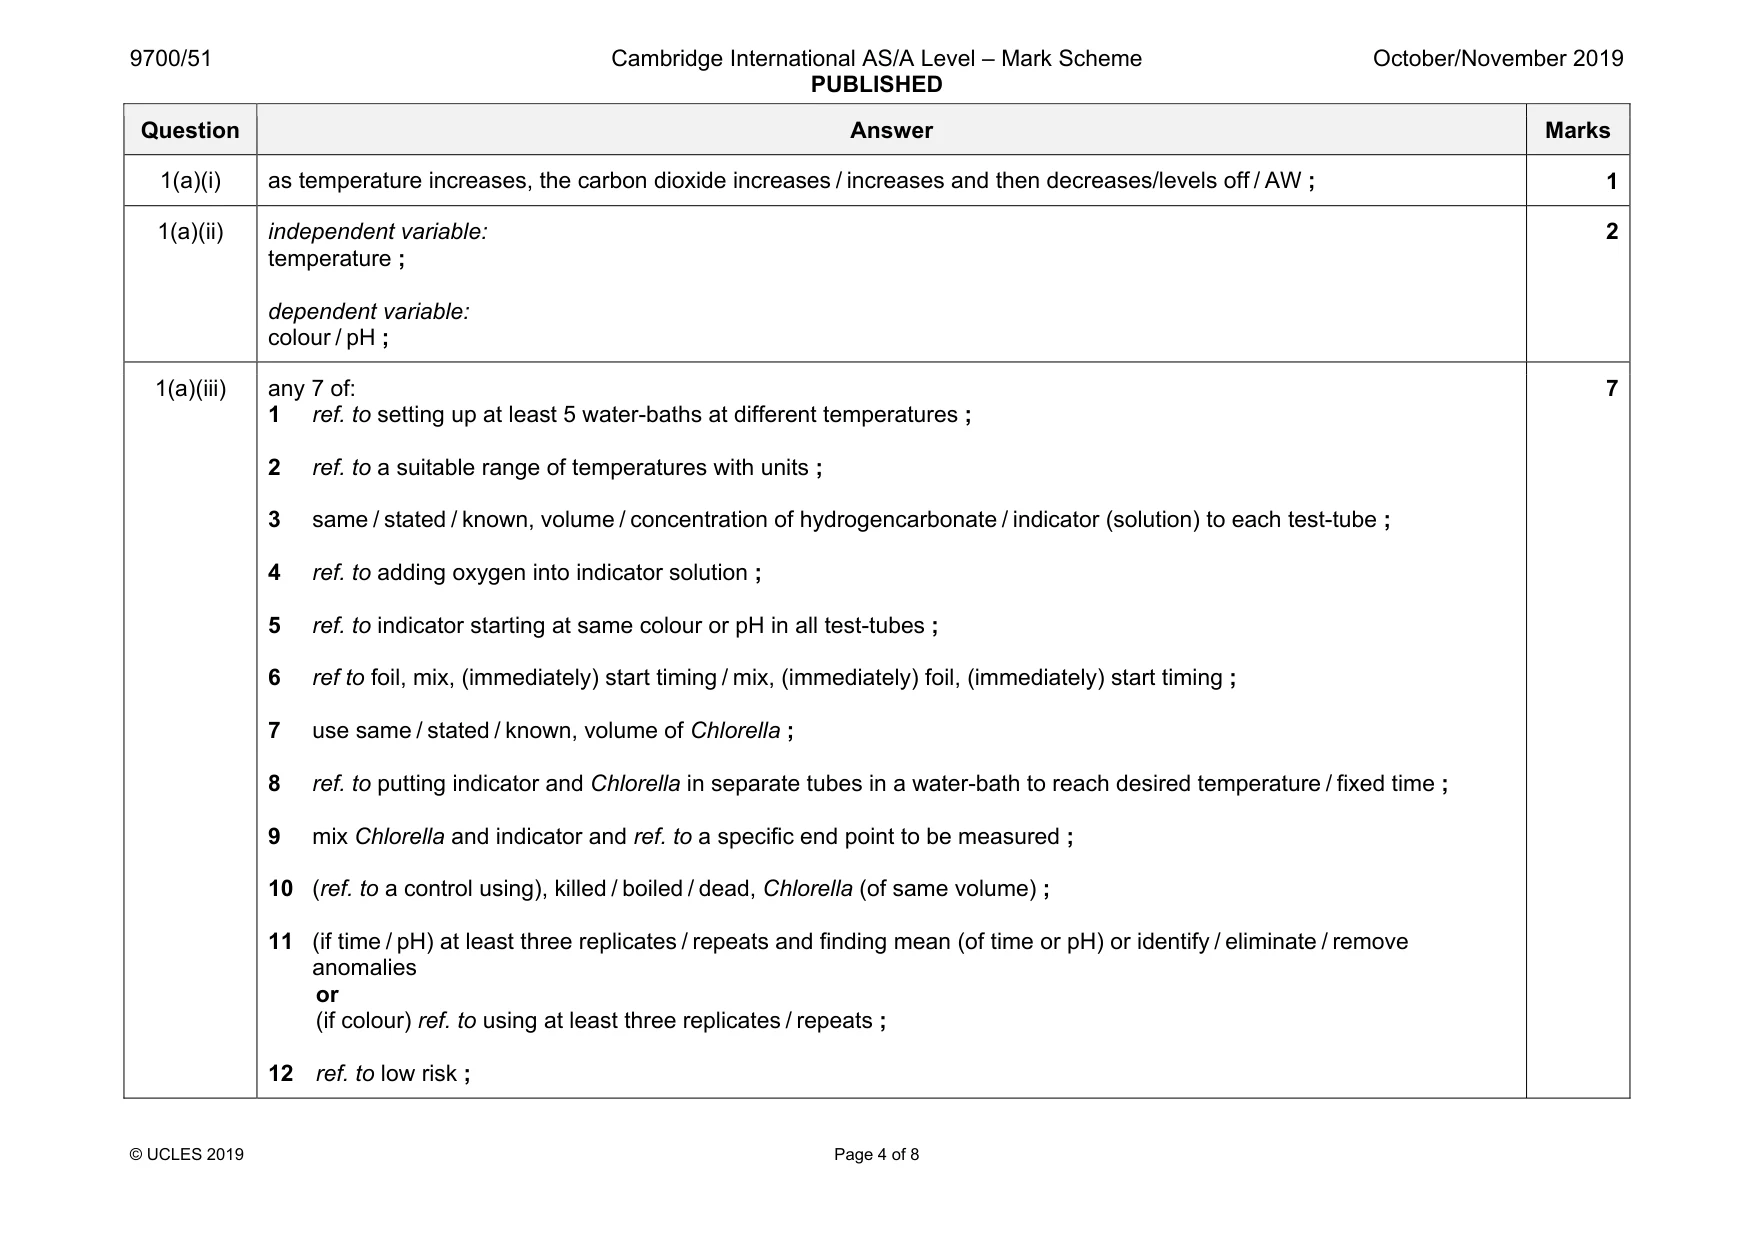
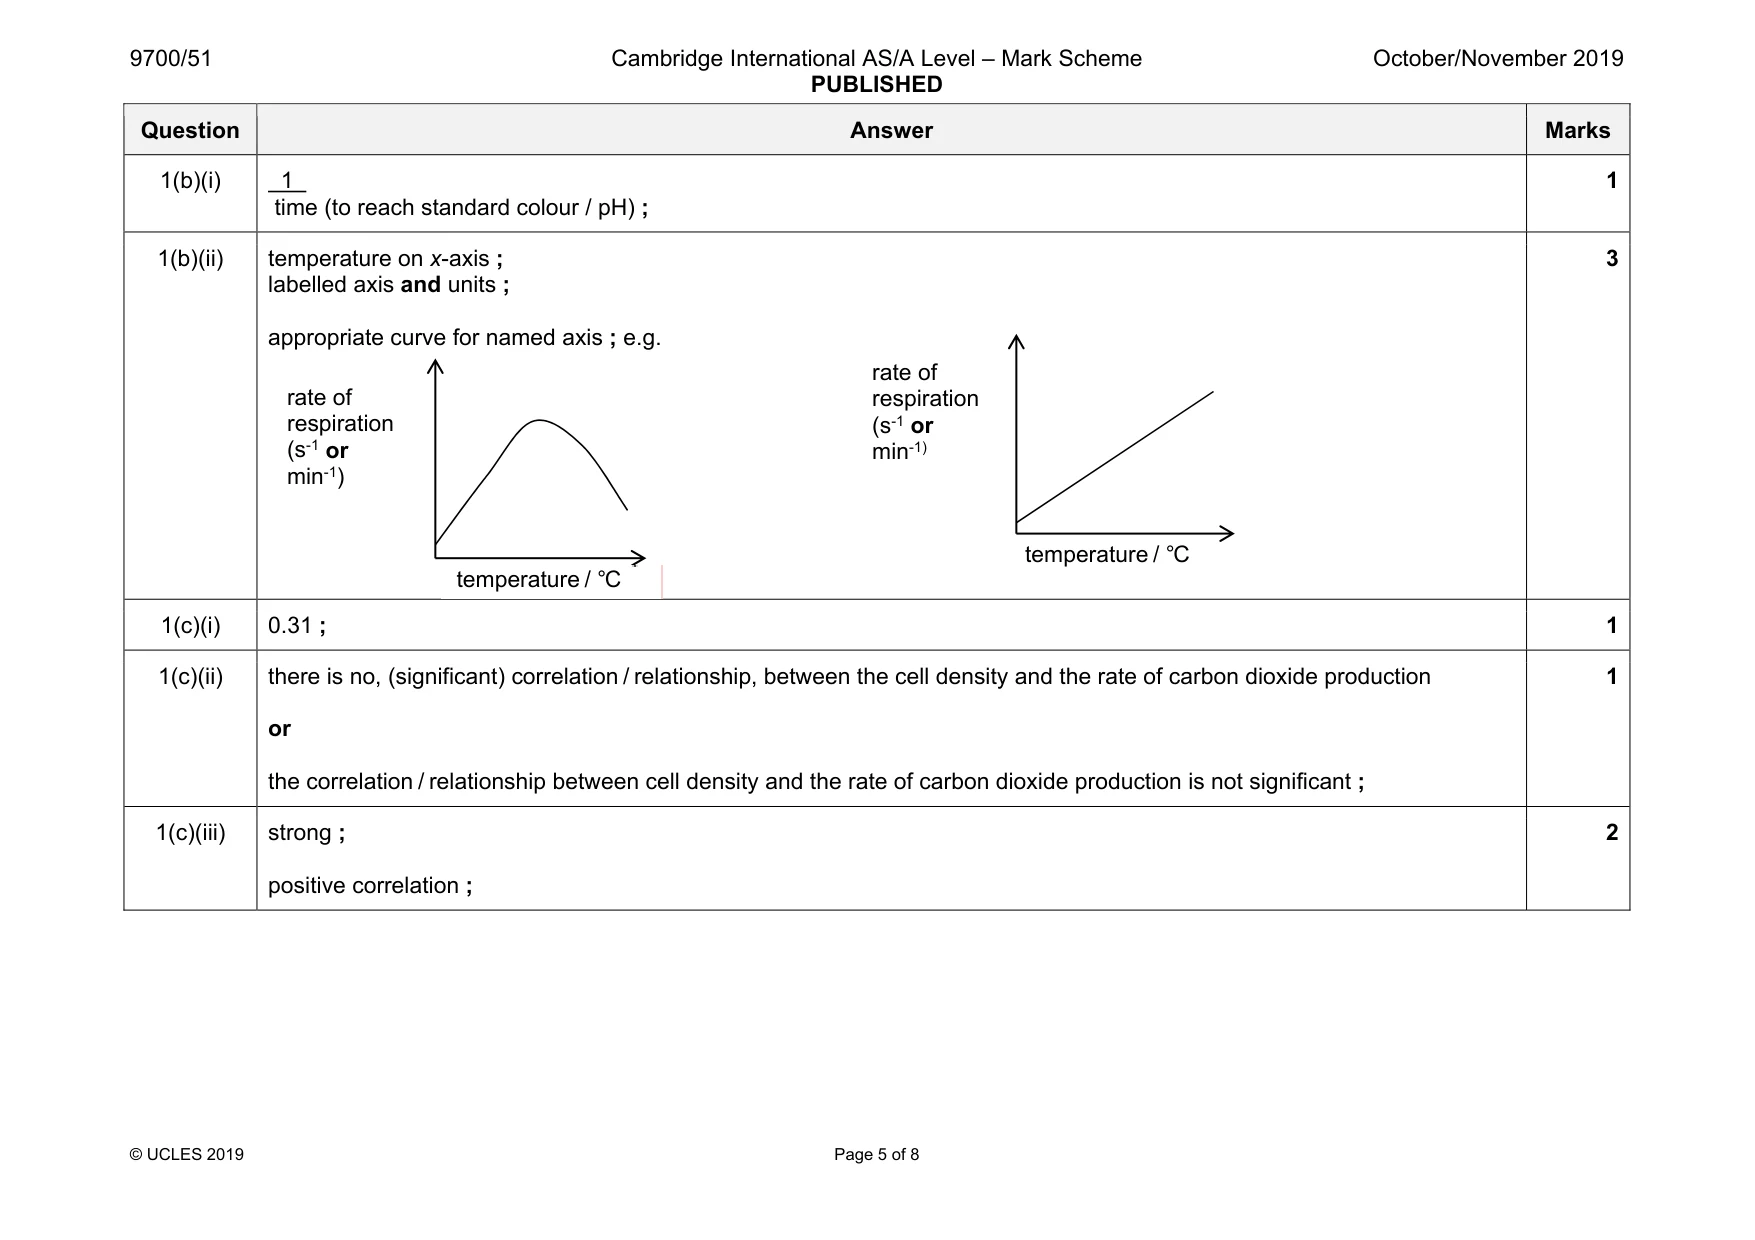
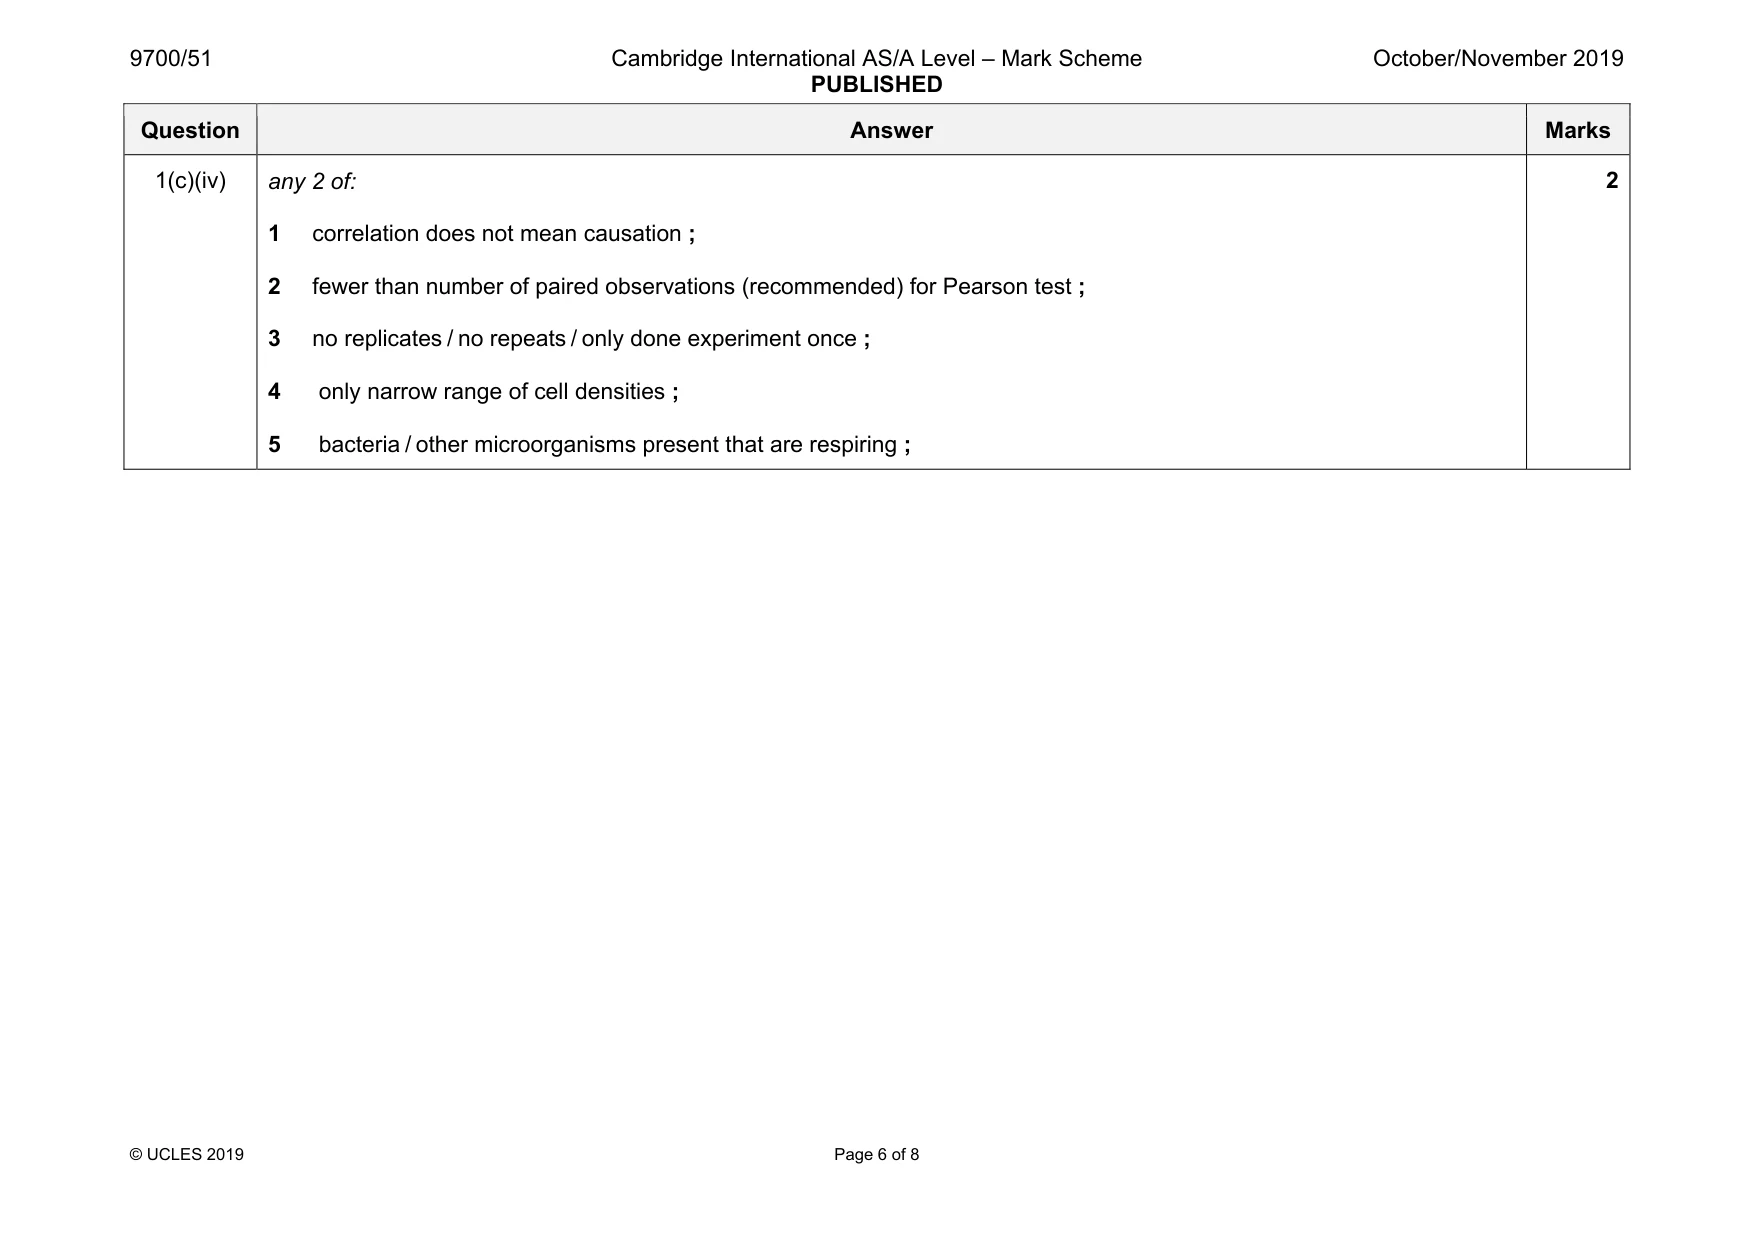
Mark scheme: 1(a)(i) as temperature increases, the carbon dioxide increases / increases and then decreases/levels off / AW ; 1 1(a)(ii) independent variable: temperature ; dependent variable: colour / pH ; 2 1(a)(iii) any 7 of: 1 ref. to setting up at least 5 water-baths at different temperatures ; 2 ref. to a suitable range of temperatures with units ; 3 same / stated / known, volume / concentration of hydrogencarbonate / indicator (solution) to each test-tube ; 4 ref. to adding oxygen into indicator solution ; 5 ref. to indicator starting at same colour or pH in all test-tubes ; 6 ref to foil, mix, (immediately) start timing / mix, (immediately) foil, (immediately) start timing ; 7 use same / stated / known, volume of Chlorella ; 8 ref. to putting indicator and Chlorella in separate tubes in a water-bath to reach desired temperature / fixed time ; 9 mix Chlorella and indicator and ref. to a specific end point to be measured ; 10 (ref. to a control using), killed / boiled / dead, Chlorella (of same volume) ; 11 (if time / pH) at least three replicates / repeats and finding mean (of time or pH) or identify / eliminate / remove anomalies or (if colour) ref. to using at least three replicates / repeats ; 12 ref. to low risk ; 7 Question Answer Marks 1(b)(i) 1 time (to reach standard colour / pH) ; 1 1(b)(ii) temperature on x-axis ; labelled axis and units ; appropriate curve for named axis ; e.g. 3 1(c)(i) 0.31 ; 1 1(c)(ii) there is no, (significant) correlation / relationship, between the cell density and the rate of carbon dioxide production or the correlation / relationship between cell density and the rate of carbon dioxide production is not significant ; 1 1(c)(iii) strong ; positive correlation ; 2 rate of respiration (s-1 or min-1) temperature / °C rate of respiration (s-1 or min-1) temperature / °C Question Answer Marks 1(c)(iv) any 2 of: 1 correlation does not mean causation ; 2 fewer than number of paired observations (recommended) for Pearson test ; 3 no replicates / no repeats / only done experiment once ; 4 only narrow range of cell densities ; 5 bacteria / other microorganisms present that are respiring ; 2
Q2 · A fungal pathogen infects melon plants and causes the leaf cells to lose turgor
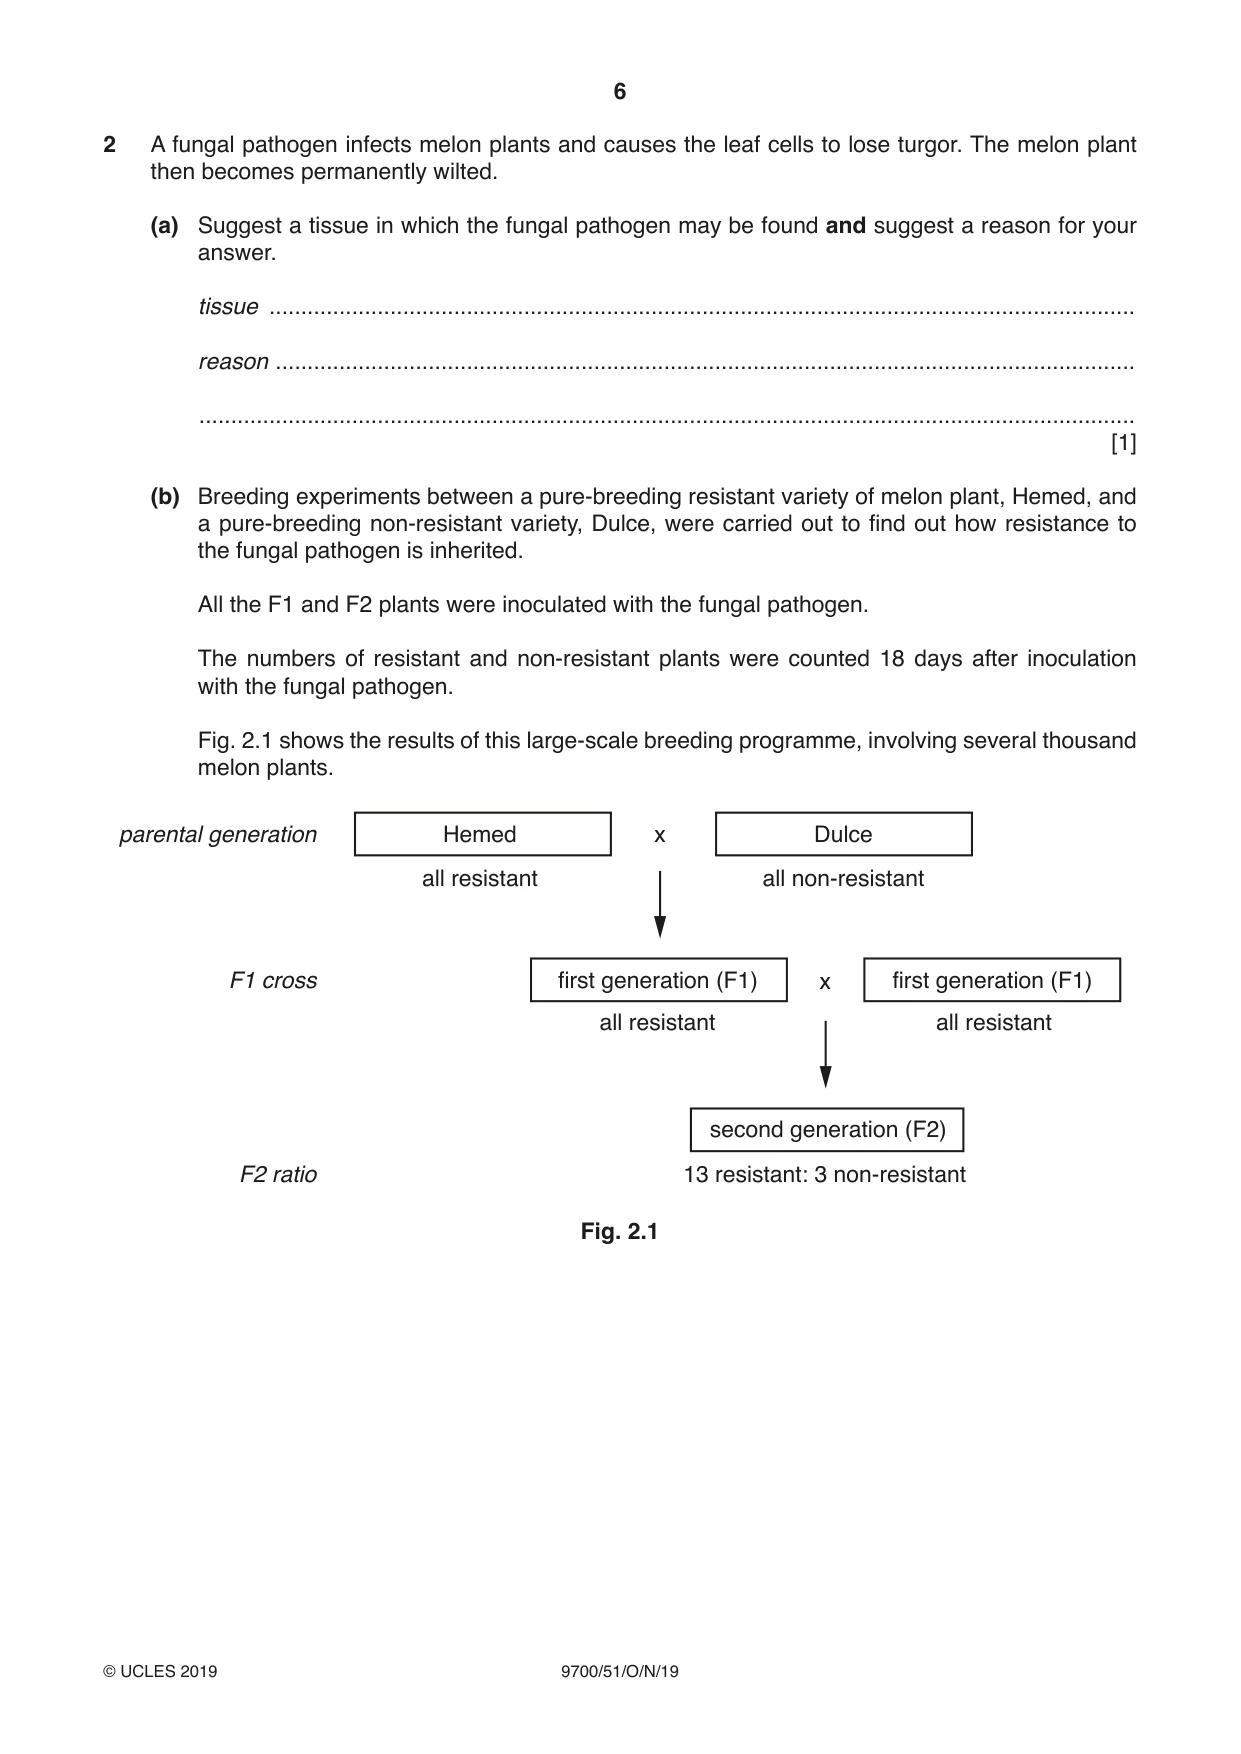
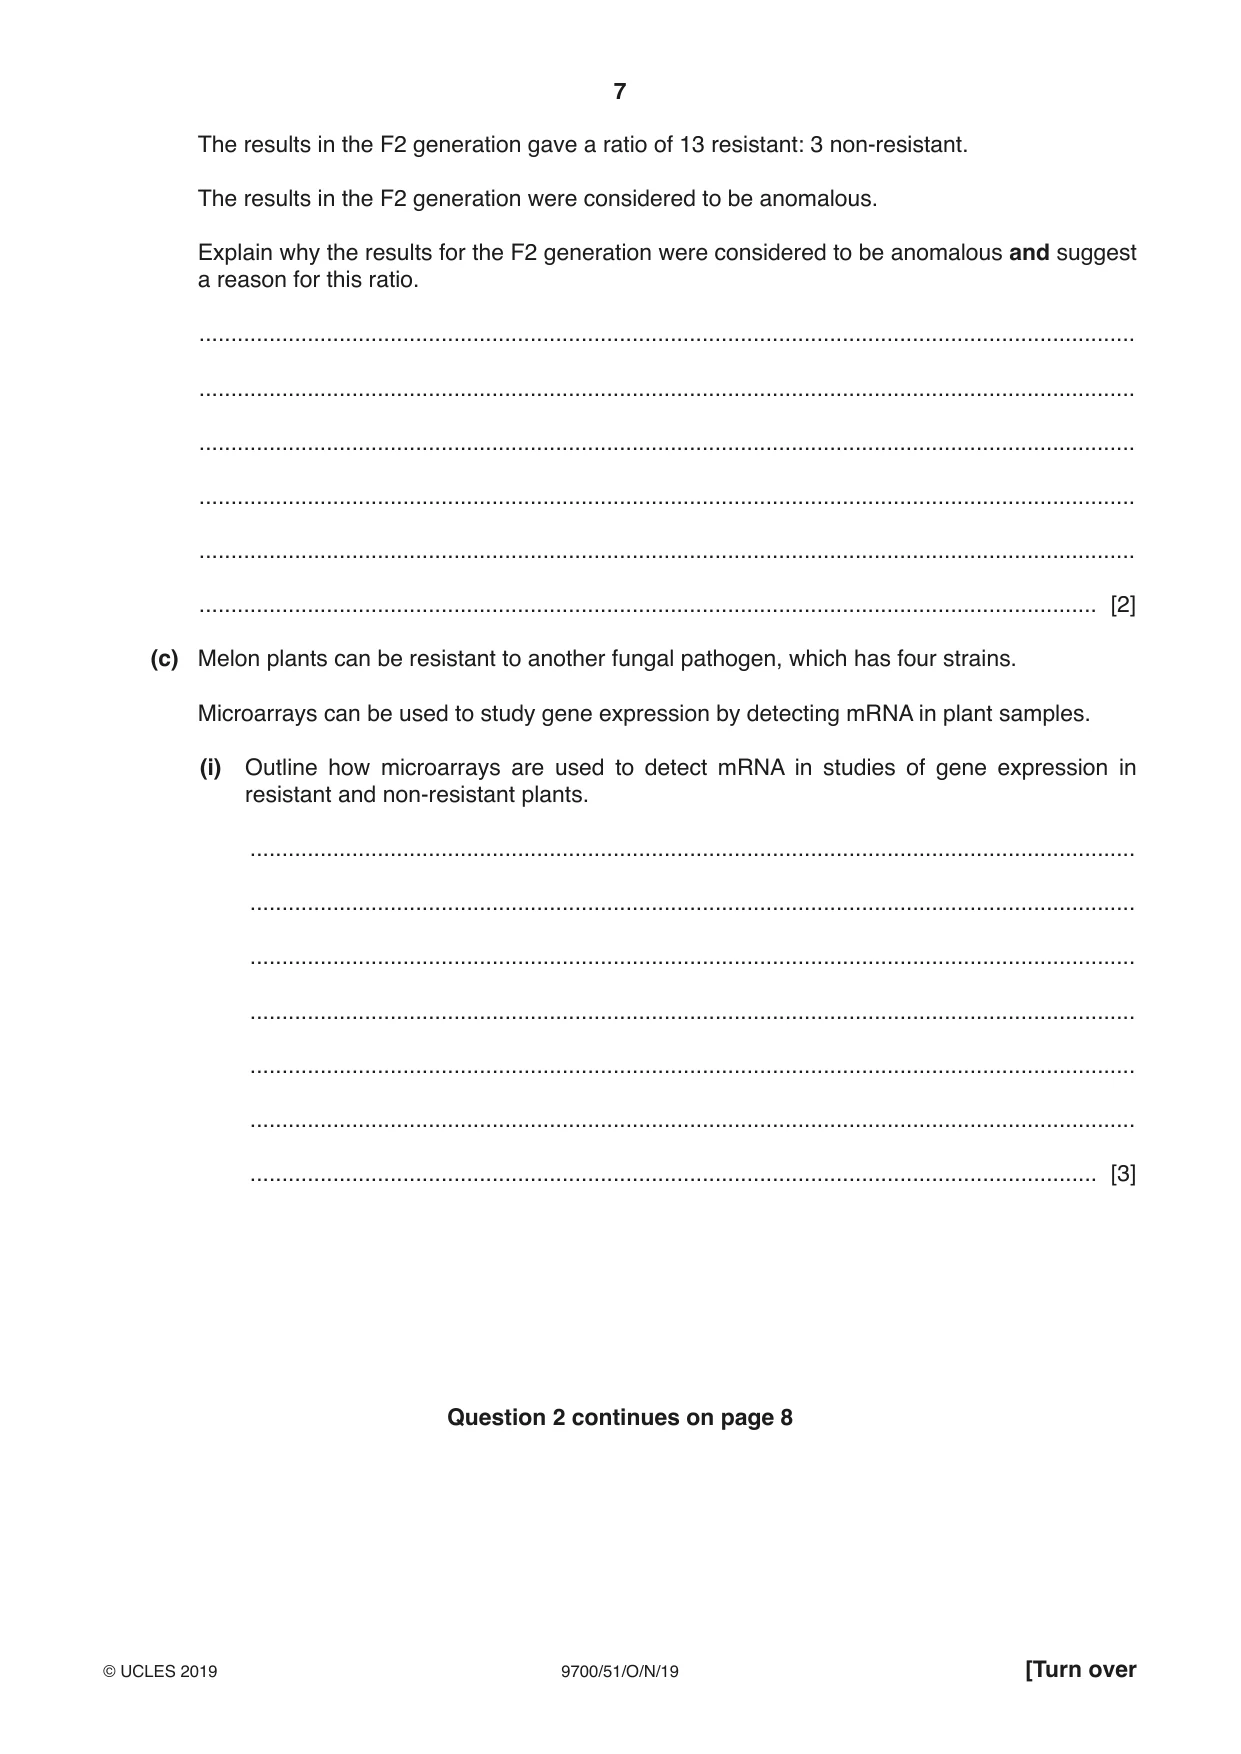
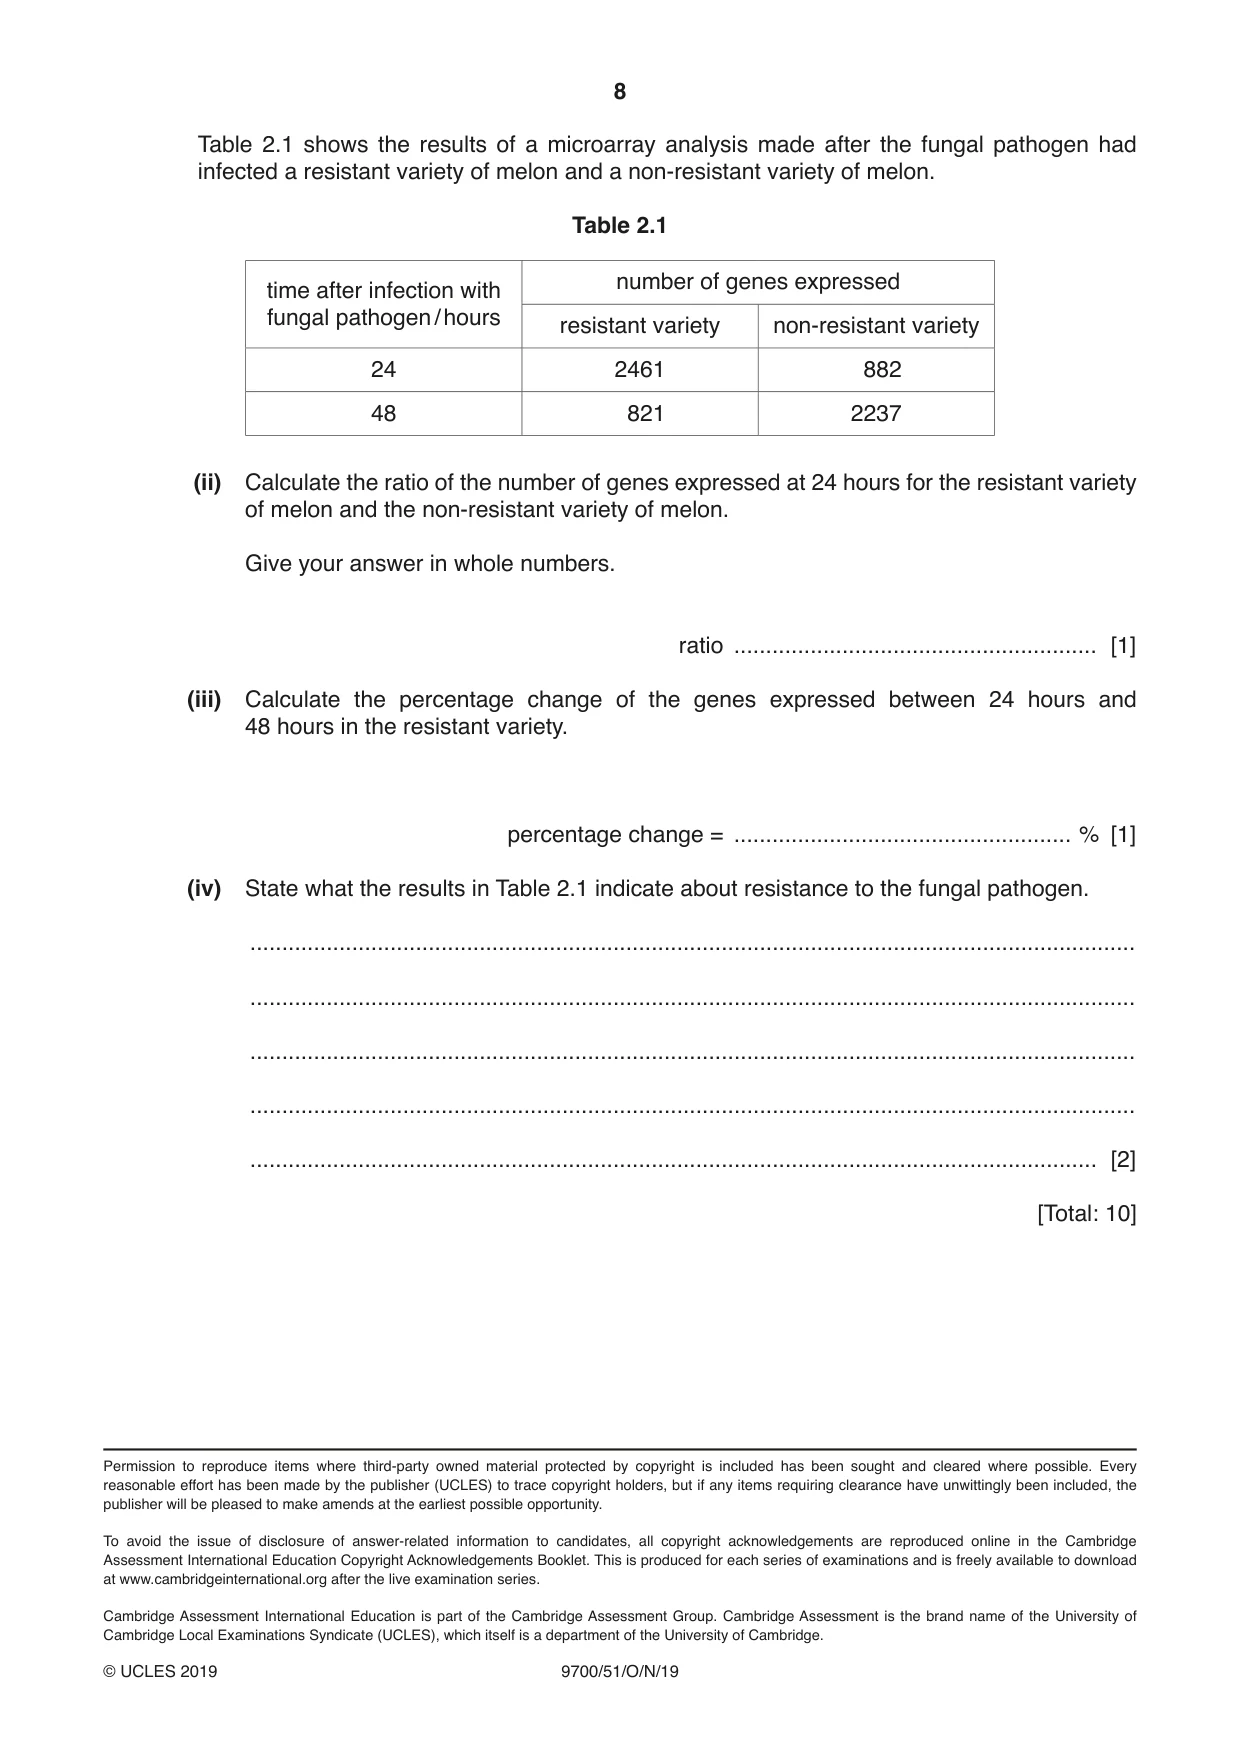
2 A fungal pathogen infects melon plants and causes the leaf cells to lose turgor. The melon plant then becomes permanently wilted. (a) Suggest a tissue in which the fungal pathogen may be found and suggest a reason for your answer. tissue ........................................................................................................................................ reason ....................................................................................................................................... ................................................................................................................................................... [1] (b) Breeding experiments between a pure-breeding resistant variety of melon plant, Hemed, and a pure-breeding non-resistant variety, Dulce, were carried out to find out how resistance to the fungal pathogen is inherited. All the F1 and F2 plants were inoculated with the fungal pathogen. The numbers of resistant and non-resistant plants were counted 18 days after inoculation with the fungal pathogen. Fig. 2.1 shows the results of this large-scale breeding programme, involving several thousand melon plants. parental generation Hemed x Dulce all resistant all non-resistant F1 cross first generation (F1) x first generation (F1) all resistant all resistant second generation (F2) F2 ratio 13 resistant: 3 non-resistant Fig. 2.1 The results in the F2 generation gave a ratio of 13 resistant: 3 non-resistant. The results in the F2 generation were considered to be anomalous. Explain why the results for the F2 generation were considered to be anomalous and suggest a reason for this ratio. ................................................................................................................................................... ................................................................................................................................................... ................................................................................................................................................... ................................................................................................................................................... ................................................................................................................................................... ............................................................................................................................................. [2] (c) Melon plants can be resistant to another fungal pathogen, which has four strains. Microarrays can be used to study gene expression by detecting mRNA in plant samples. (i) Outline how microarrays are used to detect mRNA in studies of gene expression in resistant and non-resistant plants. ........................................................................................................................................... ........................................................................................................................................... ........................................................................................................................................... ........................................................................................................................................... ........................................................................................................................................... ........................................................................................................................................... ..................................................................................................................................... [3] Question 2 continues on page 8 Table 2.1 shows the results of a microarray analysis made after the fungal pathogen had infected a resistant variety of melon and a non-resistant variety of melon. Table 2.1 number of genes expressed time after infection with fungal pathogen / hours resistant variety non-resistant variety 24 2461 882 48 821 2237 (ii) Calculate the ratio of the number of genes expressed at 24 hours for the resistant variety of melon and the non-resistant variety of melon. Give your answer in whole numbers. ratio ......................................................... [1] (iii) Calculate the percentage change of the genes expressed between 24 hours and 48 hours in the resistant variety. percentage change = ..................................................... % [1] (iv) State what the results in Table 2.1 indicate about resistance to the fungal pathogen. ........................................................................................................................................... ........................................................................................................................................... ........................................................................................................................................... ........................................................................................................................................... ..................................................................................................................................... [2] [Total: 10]
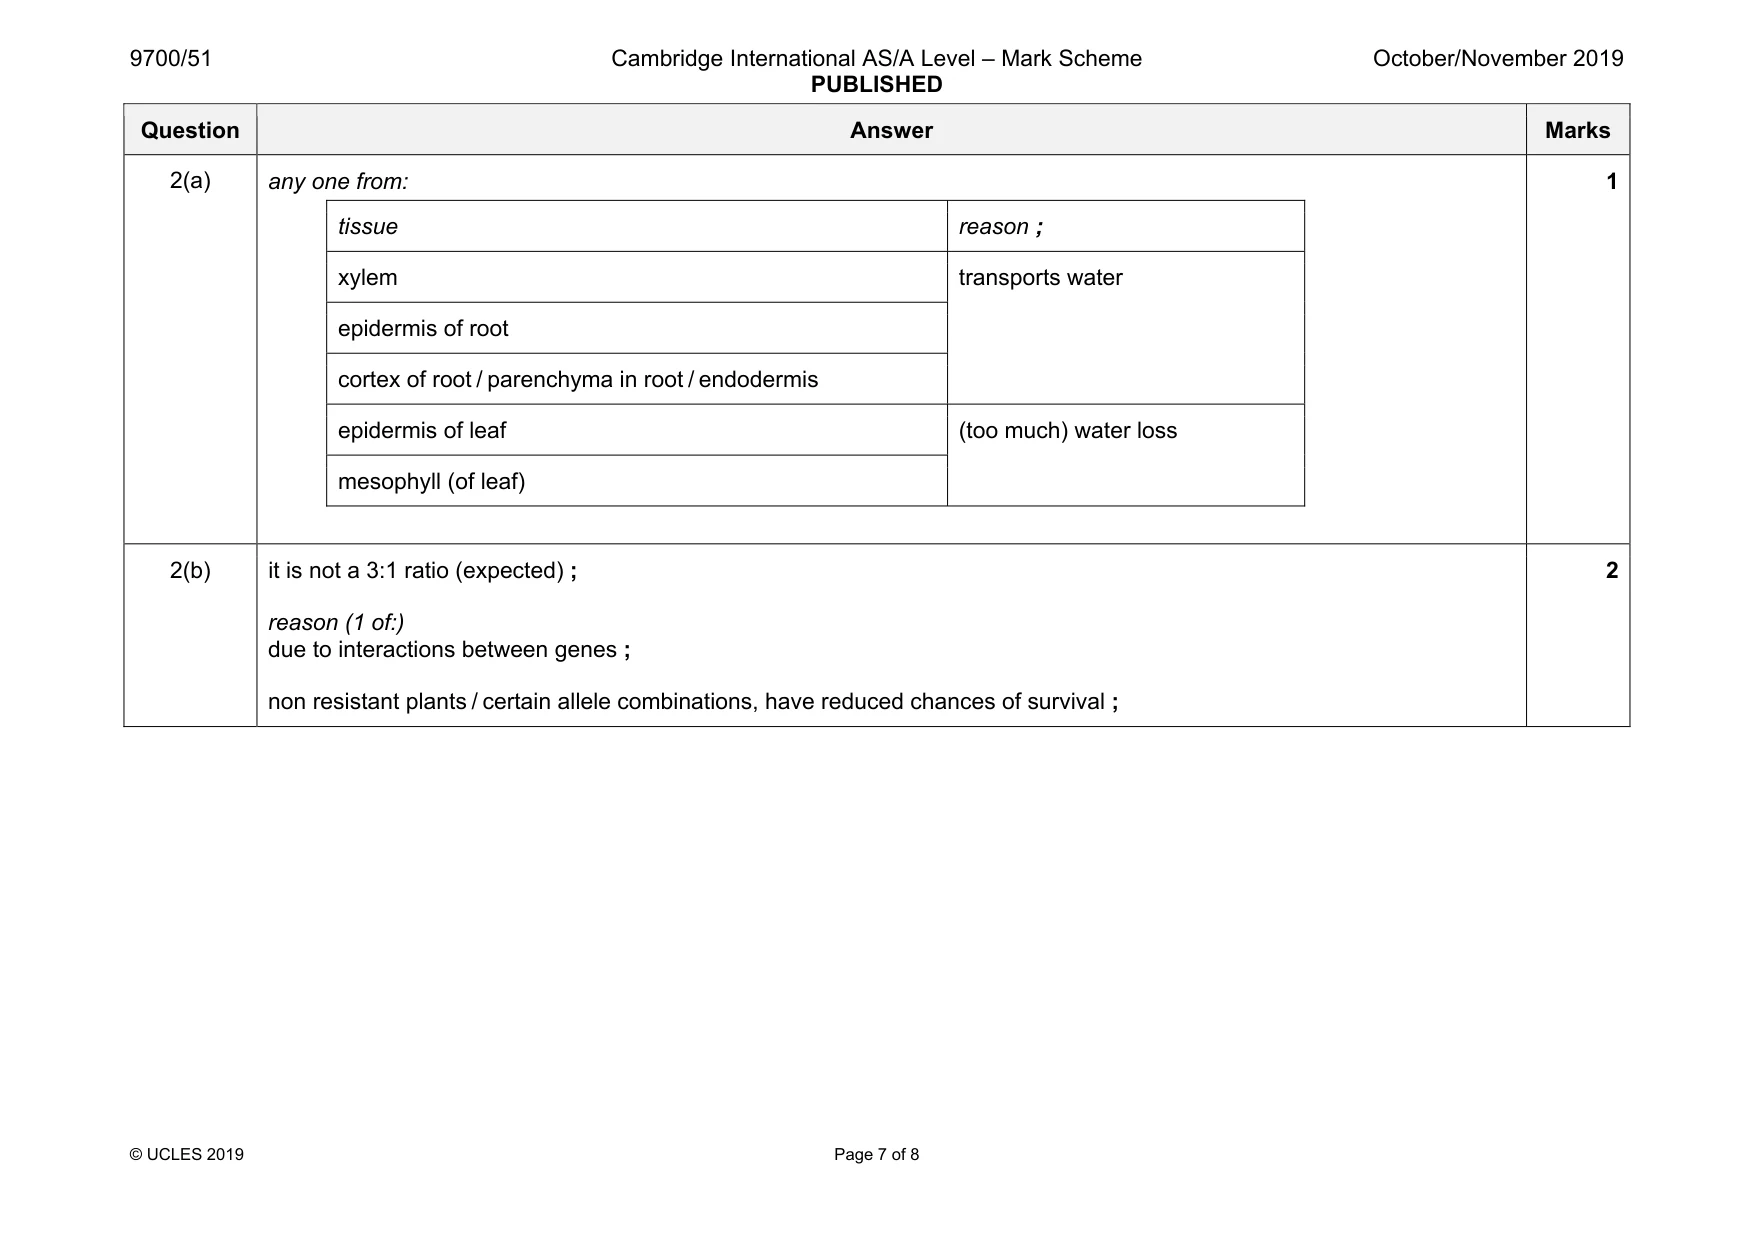
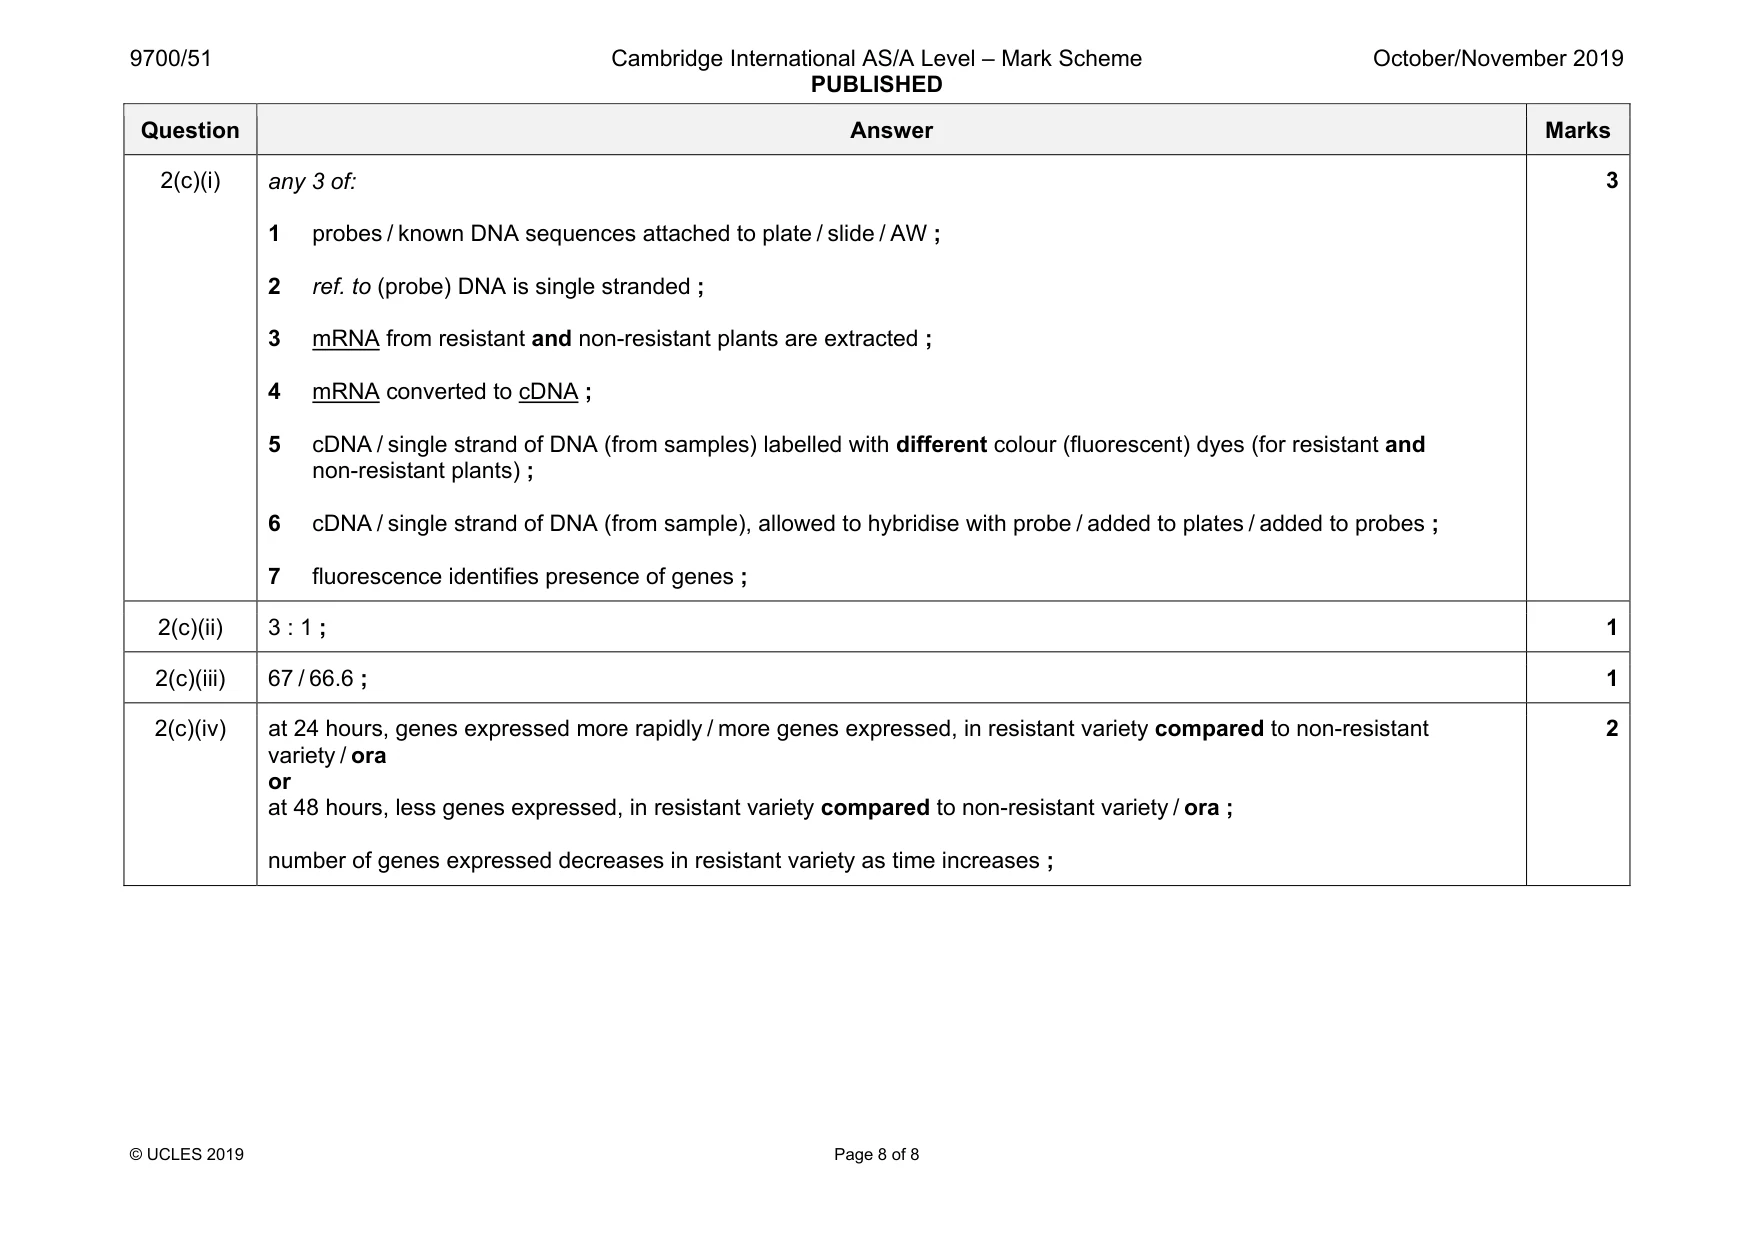
Mark scheme: 2(a) any one from: tissue reason ; xylem transports water epidermis of root cortex of root / parenchyma in root / endodermis epidermis of leaf (too much) water loss mesophyll (of leaf) 1 2(b) it is not a 3:1 ratio (expected) ; reason (1 of:) due to interactions between genes ; non resistant plants / certain allele combinations, have reduced chances of survival ; 2 Question Answer Marks 2(c)(i) any 3 of: 1 probes / known DNA sequences attached to plate / slide / AW ; 2 ref. to (probe) DNA is single stranded ; 3 mRNA from resistant and non-resistant plants are extracted ; 4 mRNA converted to cDNA ; 5 cDNA / single strand of DNA (from samples) labelled with different colour (fluorescent) dyes (for resistant and non-resistant plants) ; 6 cDNA / single strand of DNA (from sample), allowed to hybridise with probe / added to plates / added to probes ; 7 fluorescence identifies presence of genes ; 3 2(c)(ii) 3 : 1 ; 1 2(c)(iii) 67 / 66.6 ; 1 2(c)(iv) at 24 hours, genes expressed more rapidly / more genes expressed, in resistant variety compared to non-resistant variety / ora or at 48 hours, less genes expressed, in resistant variety compared to non-resistant variety / ora ; number of genes expressed decreases in resistant variety as time increases ; 2
What was in this paper
The subtopics covered by these 2 questions, and how many questions each got. Open one in a new tab to see every Cambridge question on it.
What you needed in this session
Cambridge’s own grade thresholds for 2019 Oct/Nov, Paper 5 · Variant 1. A higher threshold means an easier paper — the bar moves with how the cohort did.