Cambridge A Level Biology 9700 — 2019 Oct/Nov Paper 5 · Variant 3
9700/53/O/N/19 · 2 questions · 30 marks · ≈34 min
The question paper and its mark scheme, free to read here and free to download. This is Cambridge’s own paper, exactly as it was sat.
Question paper16 pages




Mark scheme8 pages
Answers below. Sit the paper first if you are practising.
Questions as text
Q1 · A group of students investigated the growth of different varieties of yeast
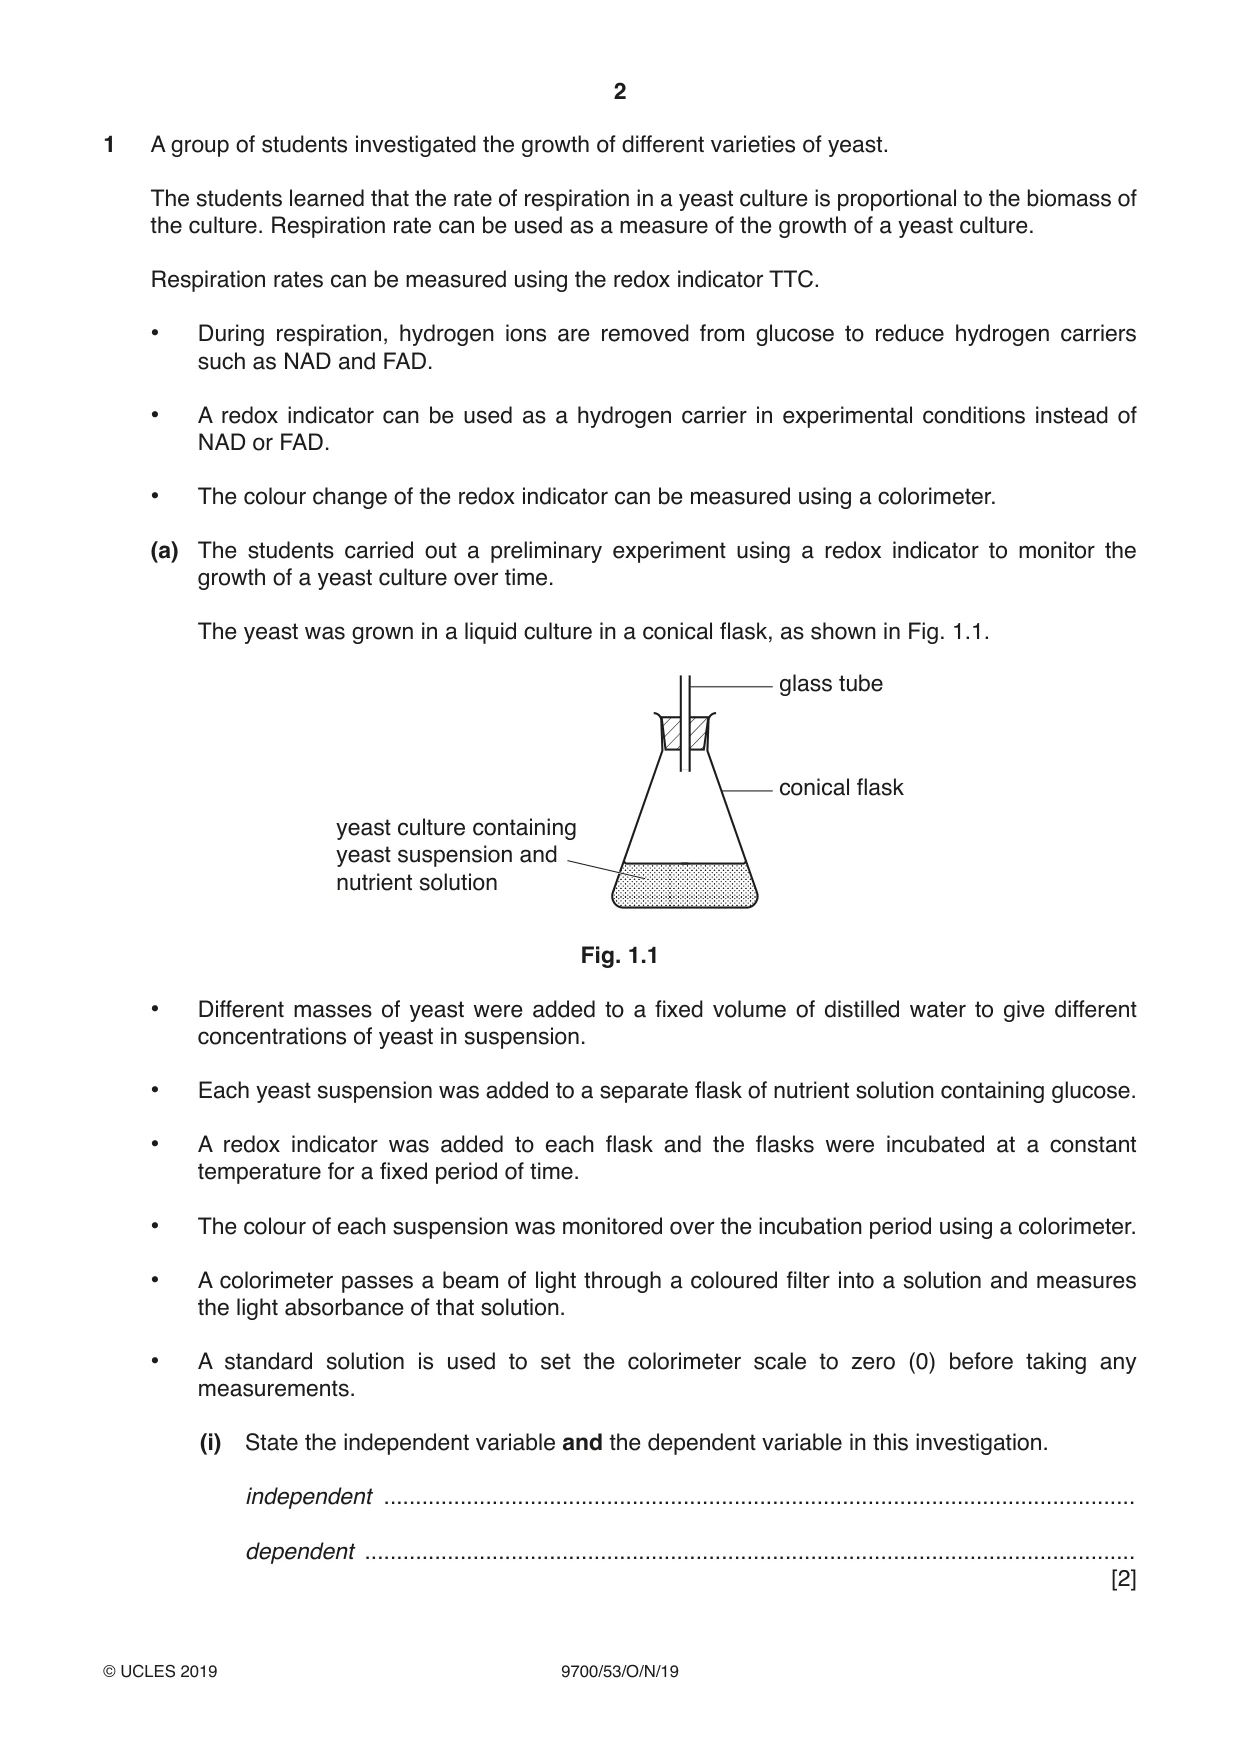
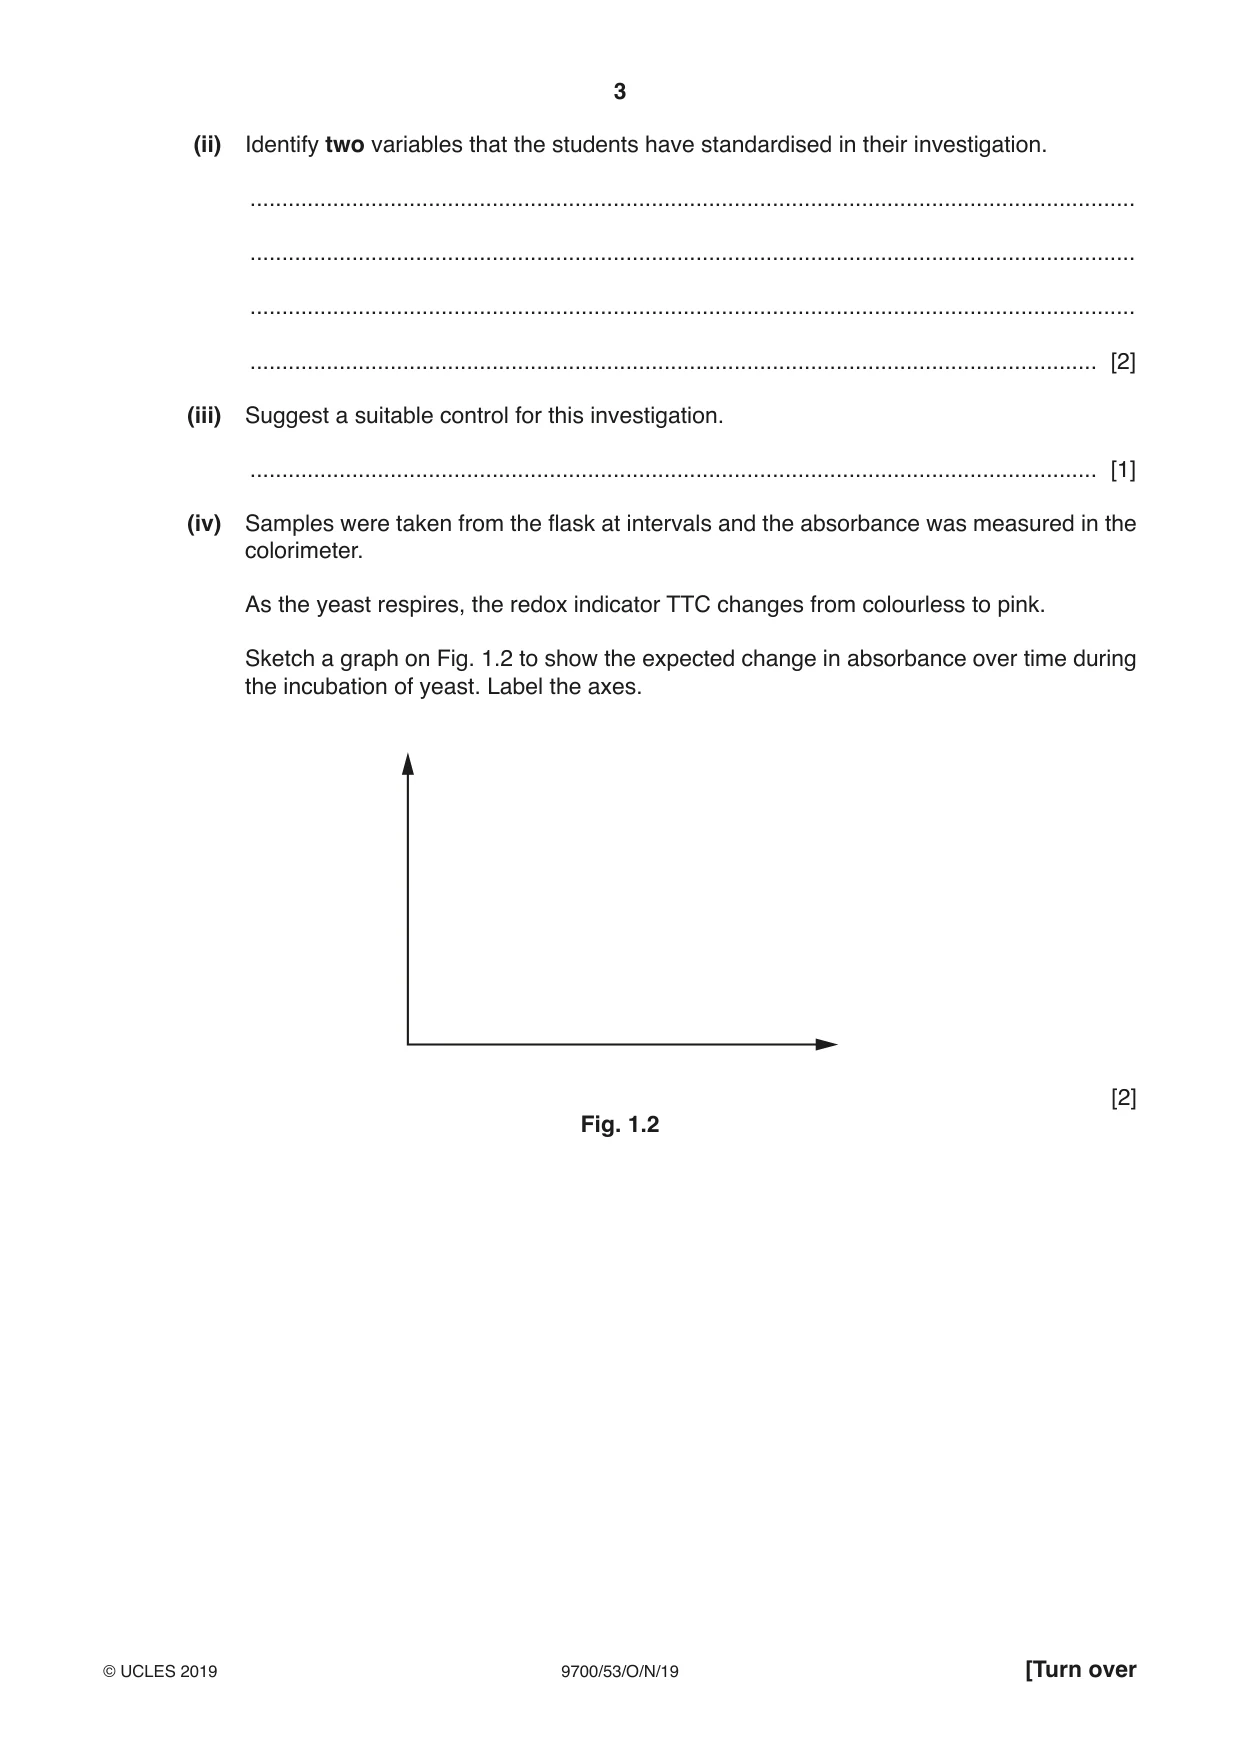
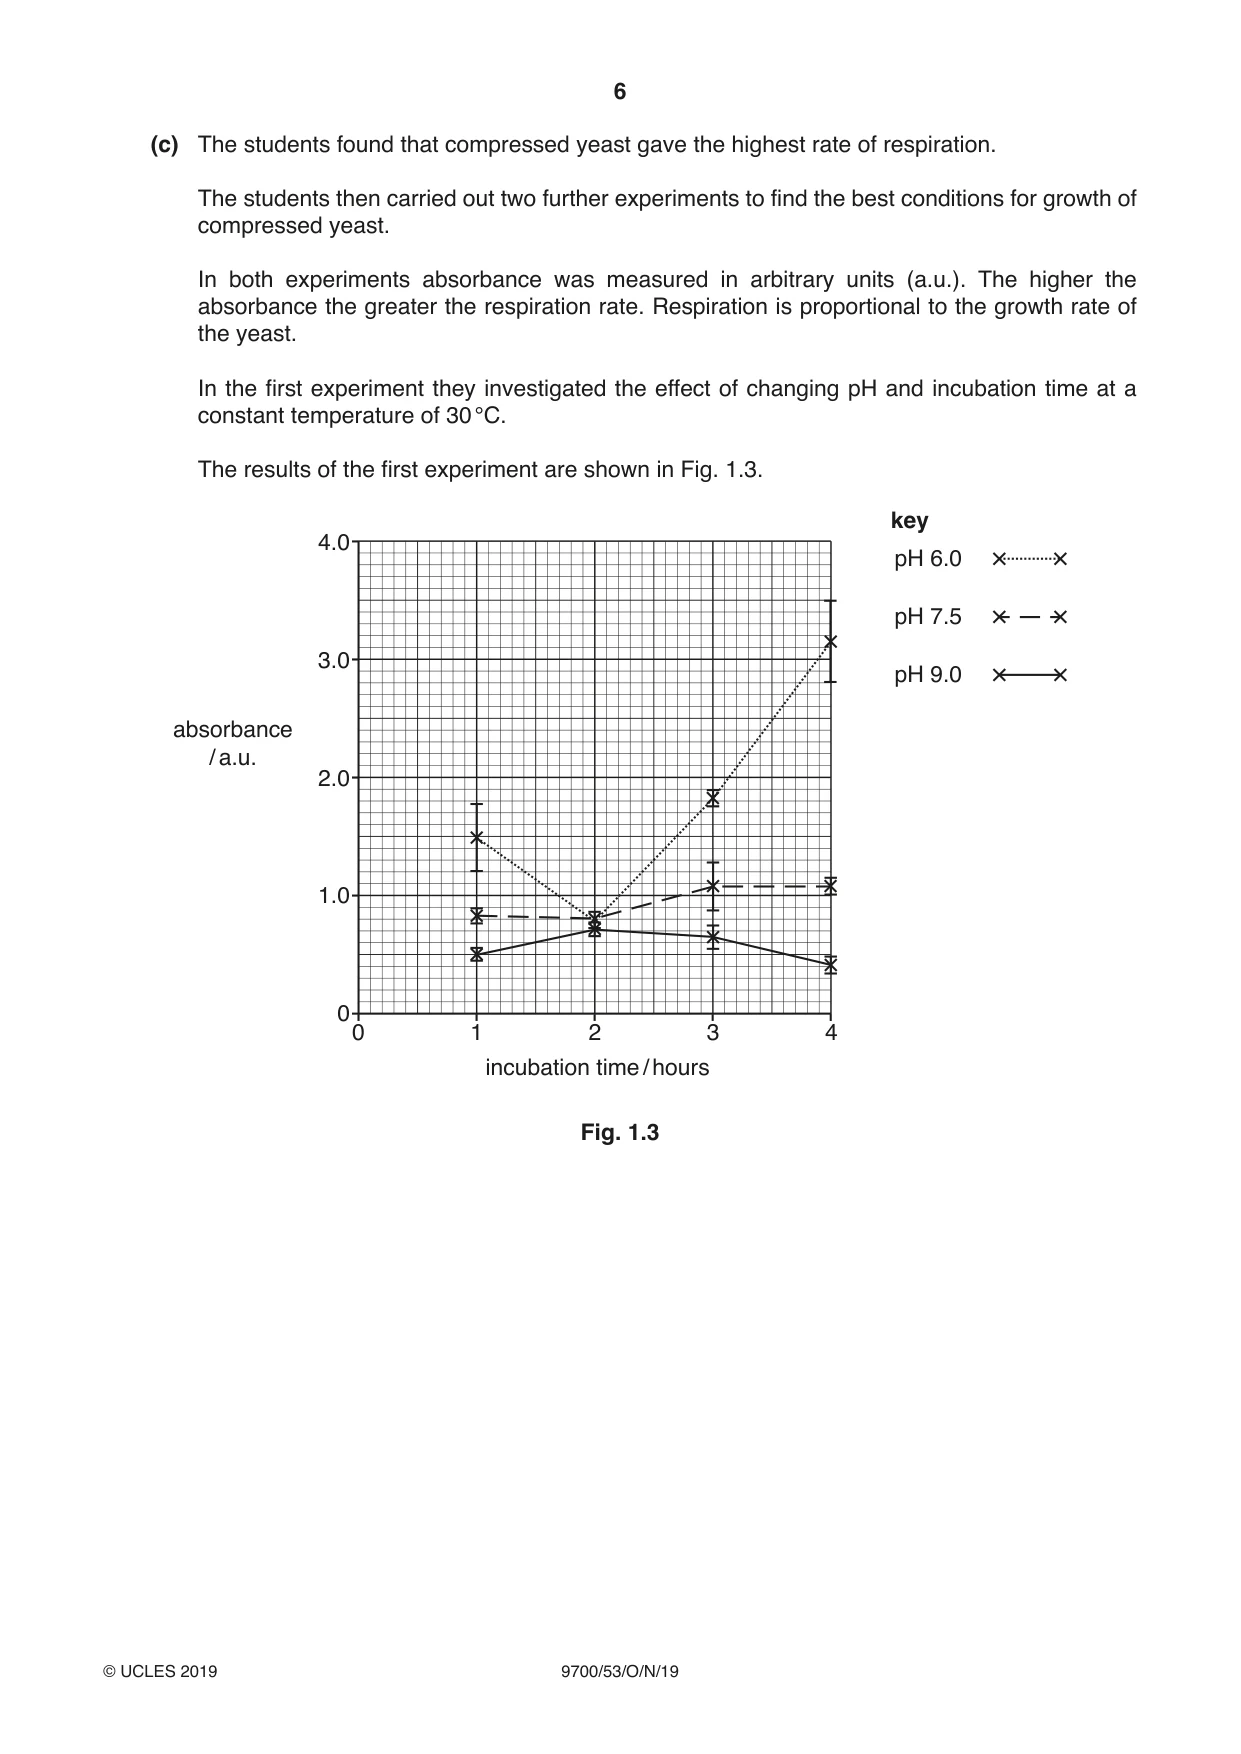
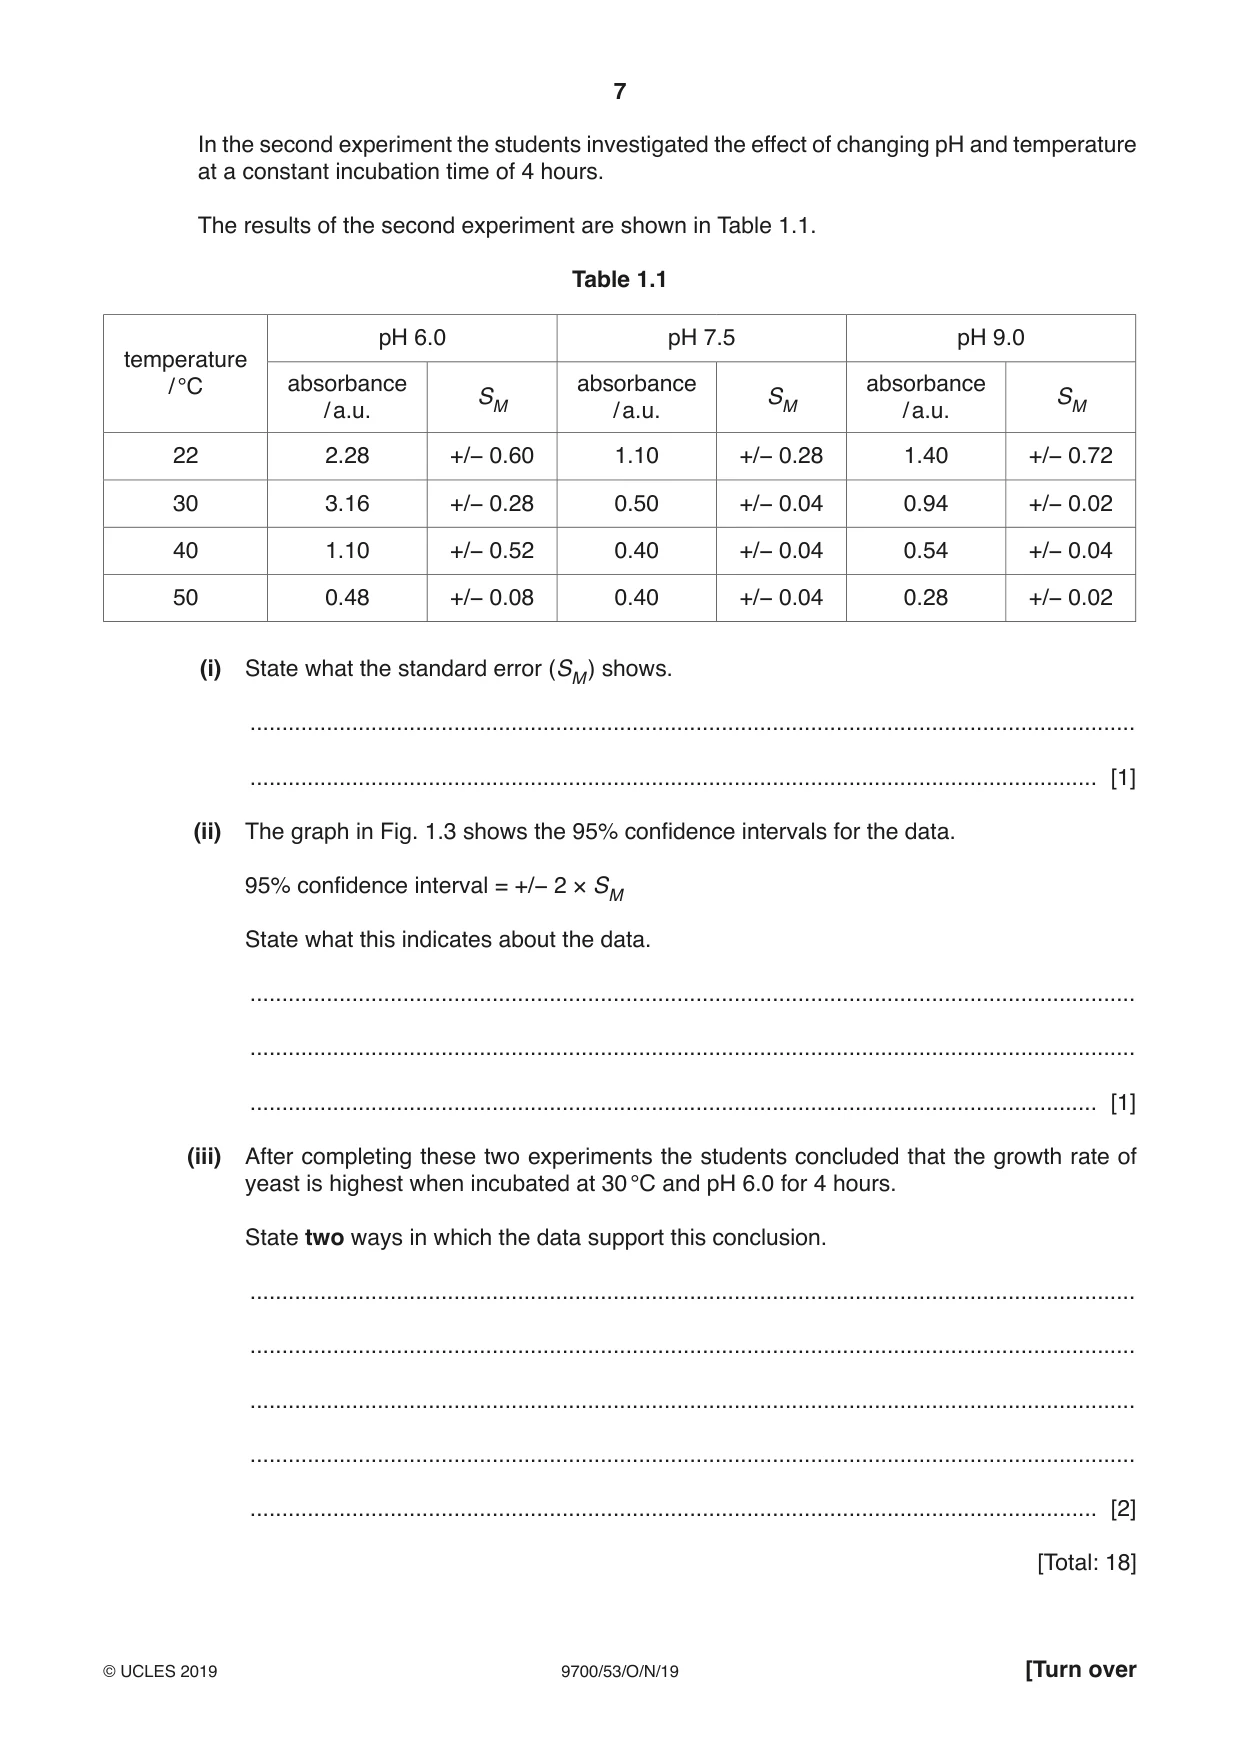
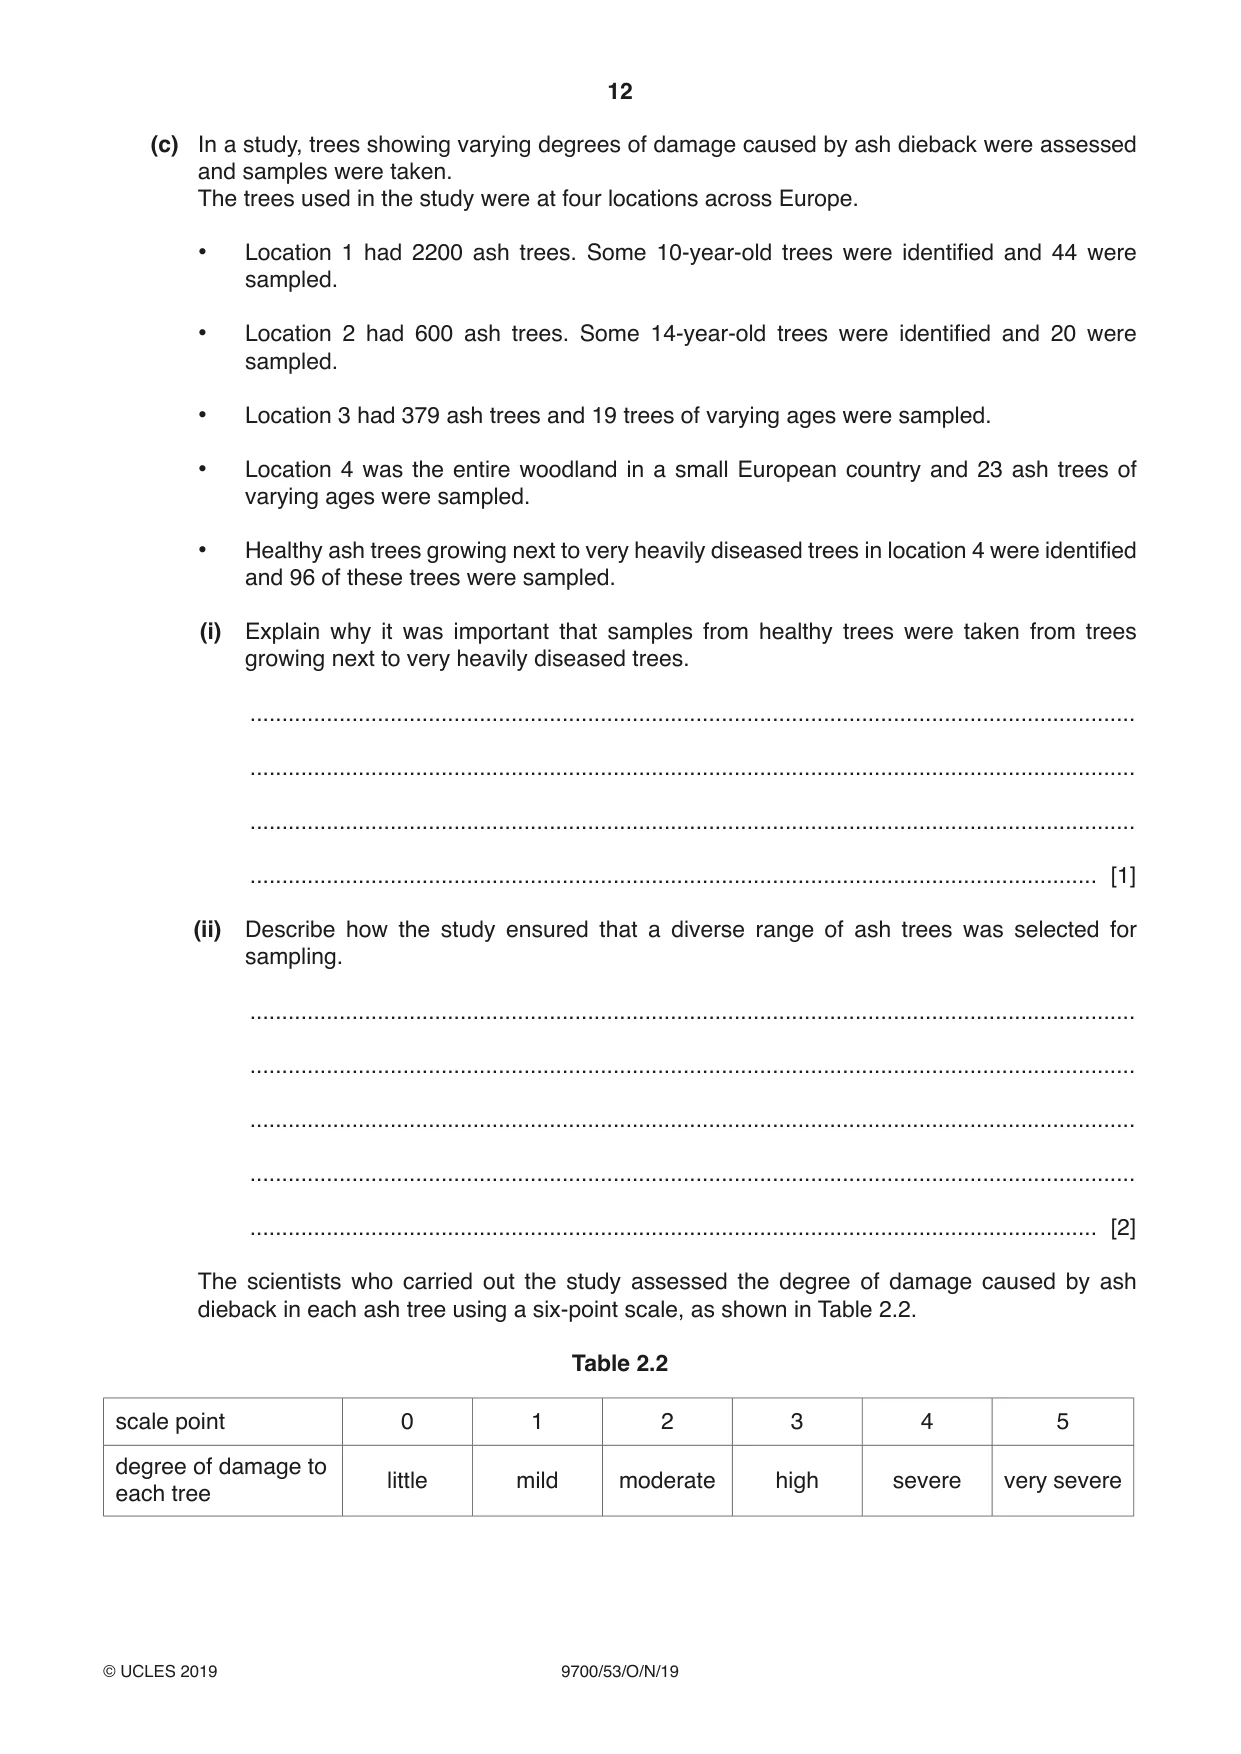
1 A group of students investigated the growth of different varieties of yeast. The students learned that the rate of respiration in a yeast culture is proportional to the biomass of the culture. Respiration rate can be used as a measure of the growth of a yeast culture. Respiration rates can be measured using the redox indicator TTC. • During respiration, hydrogen ions are removed from glucose to reduce hydrogen carriers such as NAD and FAD. • A redox indicator can be used as a hydrogen carrier in experimental conditions instead of NAD or FAD. • The colour change of the redox indicator can be measured using a colorimeter. (a) The students carried out a preliminary experiment using a redox indicator to monitor the growth of a yeast culture over time. The yeast was grown in a liquid culture in a conical flask, as shown in Fig. 1.1. glass tube conical flask yeast culture containing yeast suspension and nutrient solution Fig. 1.1 • Different masses of yeast were added to a fixed volume of distilled water to give different concentrations of yeast in suspension. • Each yeast suspension was added to a separate flask of nutrient solution containing glucose. • A redox indicator was added to each flask and the flasks were incubated at a constant temperature for a fixed period of time. • The colour of each suspension was monitored over the incubation period using a colorimeter. • A colorimeter passes a beam of light through a coloured filter into a solution and measures the light absorbance of that solution. • A standard solution is used to set the colorimeter scale to zero (0) before taking any measurements. (i) State the independent variable and the dependent variable in this investigation. independent ...................................................................................................................... dependent ......................................................................................................................... [2] (ii) Identify two variables that the students have standardised in their investigation. ........................................................................................................................................... ........................................................................................................................................... ........................................................................................................................................... ..................................................................................................................................... [2] (iii) Suggest a suitable control for this investigation. ..................................................................................................................................... [1] (iv) Samples were taken from the flask at intervals and the absorbance was measured in the colorimeter. As the yeast respires, the redox indicator TTC changes from colourless to pink. Sketch a graph on Fig. 1.2 to show the expected change in absorbance over time during the incubation of yeast. Label the axes. [2] Fig. 1.2 (b) Three different varieties of yeast, commonly used in food manufacture, are compressed yeast, active dry yeast and instant yeast. The students decided to compare the growth rates of the three different varieties of yeast by measuring their respiration rate. They decided to use TTC as the redox indicator. Describe a method that students could use to compare the respiration rates of the three varieties of yeast. Your method should be set out in a logical order and be detailed enough to let another person follow it. ................................................................................................................................................... ................................................................................................................................................... ................................................................................................................................................... ................................................................................................................................................... ................................................................................................................................................... ................................................................................................................................................... ................................................................................................................................................... ................................................................................................................................................... ................................................................................................................................................... ................................................................................................................................................... ................................................................................................................................................... ................................................................................................................................................... ................................................................................................................................................... ................................................................................................................................................... ................................................................................................................................................... ................................................................................................................................................... ................................................................................................................................................... ................................................................................................................................................... ................................................................................................................................................... ................................................................................................................................................... ................................................................................................................................................... ............................................................................................................................................. [7] Question 1 continues on page 6 (c) The students found that compressed yeast gave the highest rate of respiration. The students then carried out two further experiments to find the best conditions for growth of compressed yeast. In both experiments absorbance was measured in arbitrary units (a.u.). The higher the absorbance the greater the respiration rate. Respiration is proportional to the growth rate of the yeast. In the first experiment they investigated the effect of changing pH and incubation time at a constant temperature of 30 °C. The results of the first experiment are shown in Fig. 1.3. key 4.0 pH 6.0 pH 7.5 3.0 pH 9.0 absorbance / a.u. 2.0 1.0 0 0 1 2 3 4 incubation time / hours Fig. 1.3 In the second experiment the students investigated the effect of changing pH and temperature at a constant incubation time of 4 hours. The results of the second experiment are shown in Table 1.1. Table 1.1 pH 6.0 pH 7.5 pH 9.0 temperature / °C absorbance absorbance absorbance SM SM SM / a.u. / a.u. / a.u. 22 2.28 +/− 0.60 1.10 +/− 0.28 1.40 +/− 0.72 30 3.16 +/− 0.28 0.50 +/− 0.04 0.94 +/− 0.02 40 1.10 +/− 0.52 0.40 +/− 0.04 0.54 +/− 0.04 50 0.48 +/− 0.08 0.40 +/− 0.04 0.28 +/− 0.02 (i) State what the standard error (SM ) shows. ........................................................................................................................................... ..................................................................................................................................... [1] (ii) The graph in Fig. 1.3 shows the 95% confidence intervals for the data. 95% confidence interval = +/− 2 × SM State what this indicates about the data. ........................................................................................................................................... ........................................................................................................................................... ..................................................................................................................................... [1] (iii) After completing these two experiments the students concluded that the growth rate of yeast is highest when incubated at 30 °C and pH 6.0 for 4 hours. State two ways in which the data support this conclusion. ........................................................................................................................................... ........................................................................................................................................... ........................................................................................................................................... ........................................................................................................................................... ..................................................................................................................................... [2] [Total: 18]
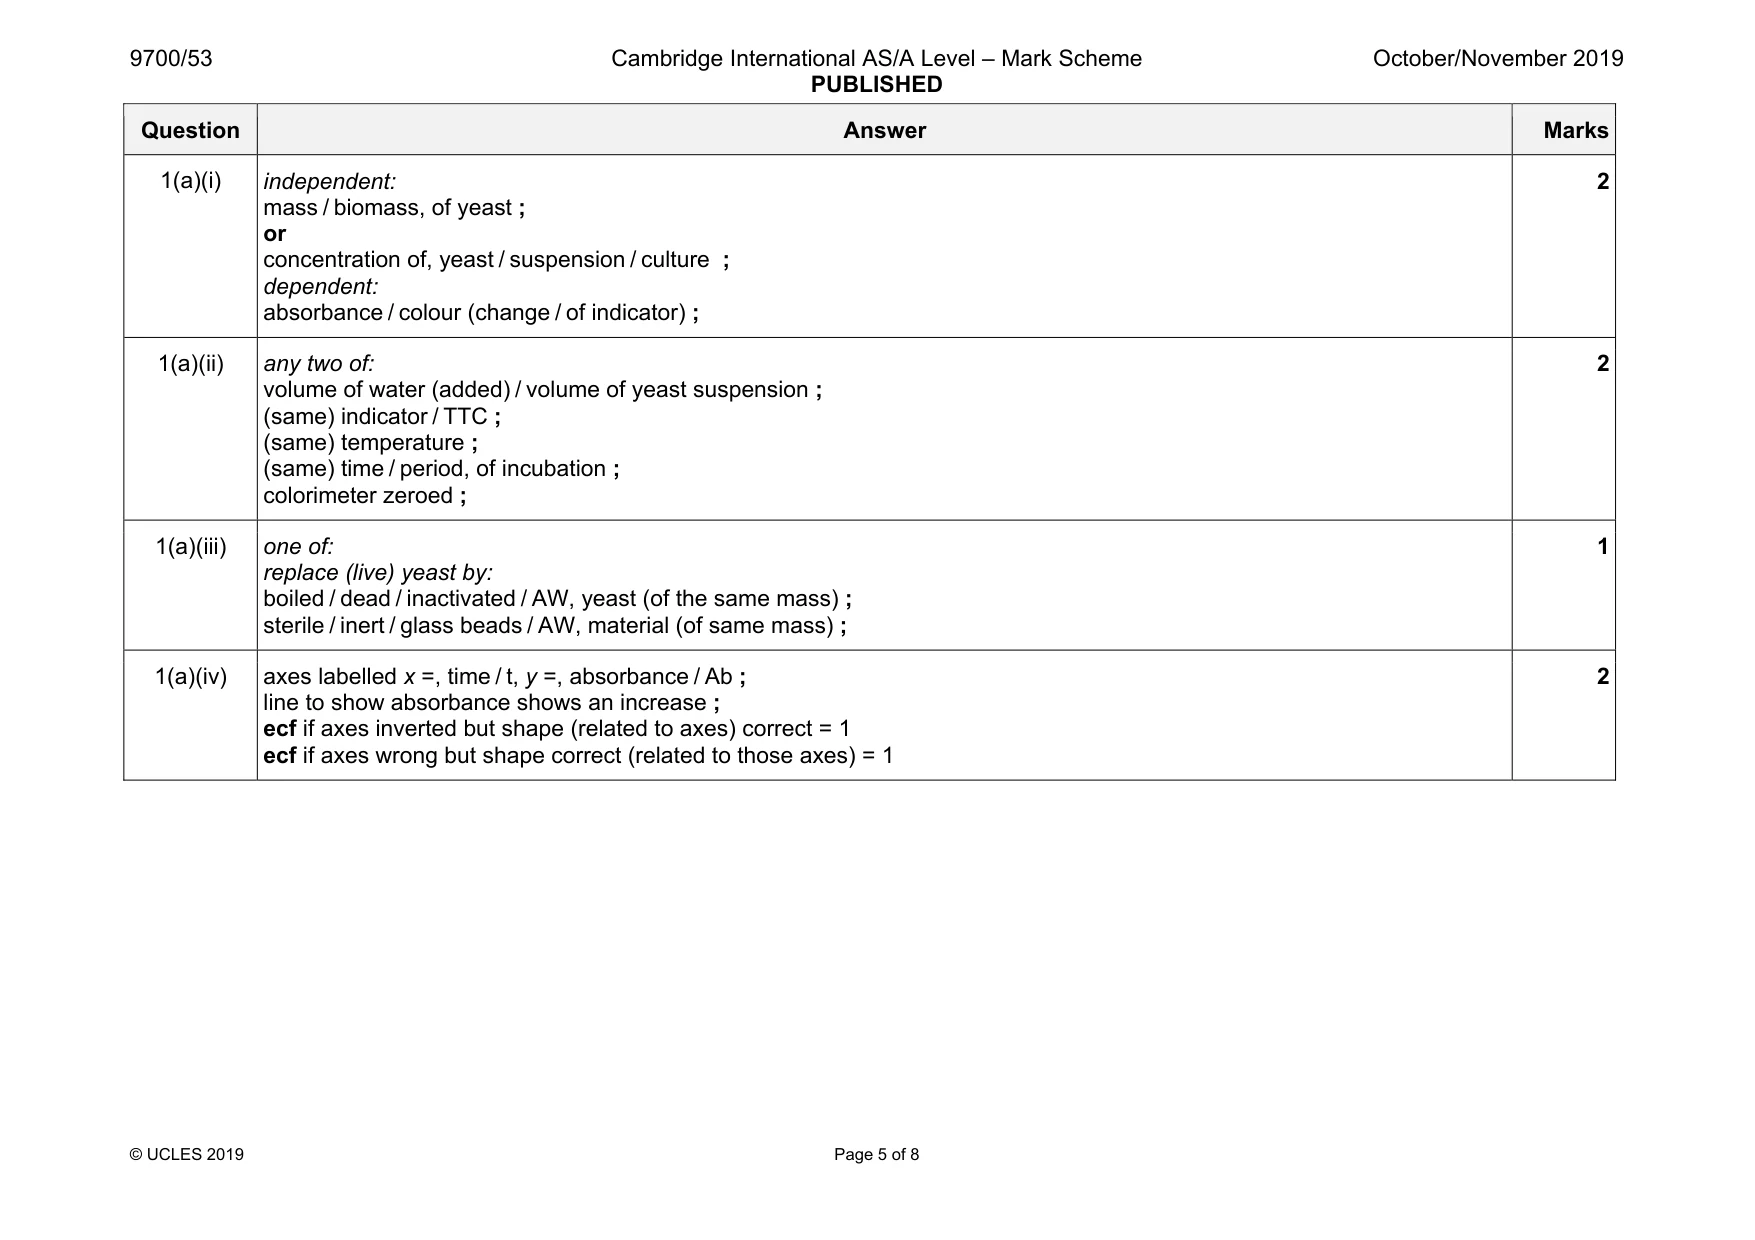
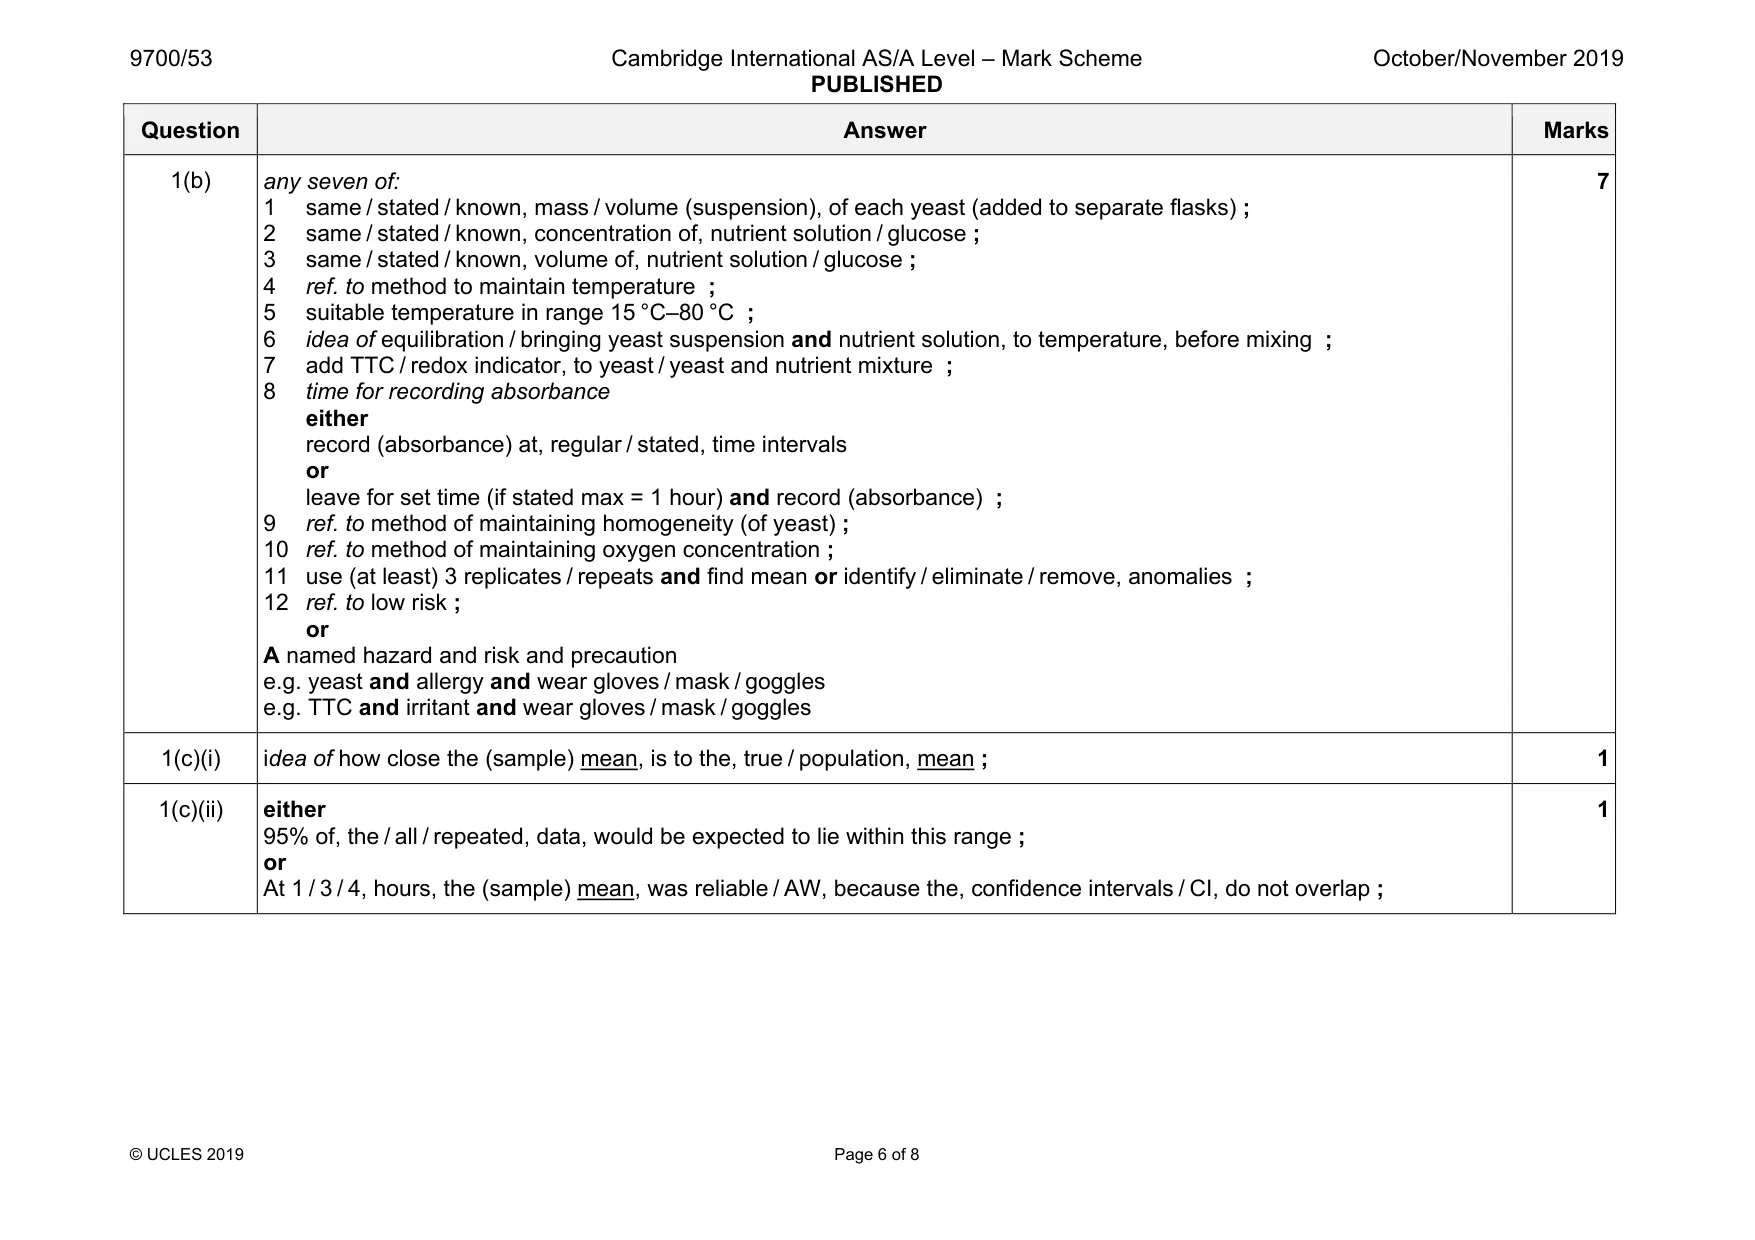
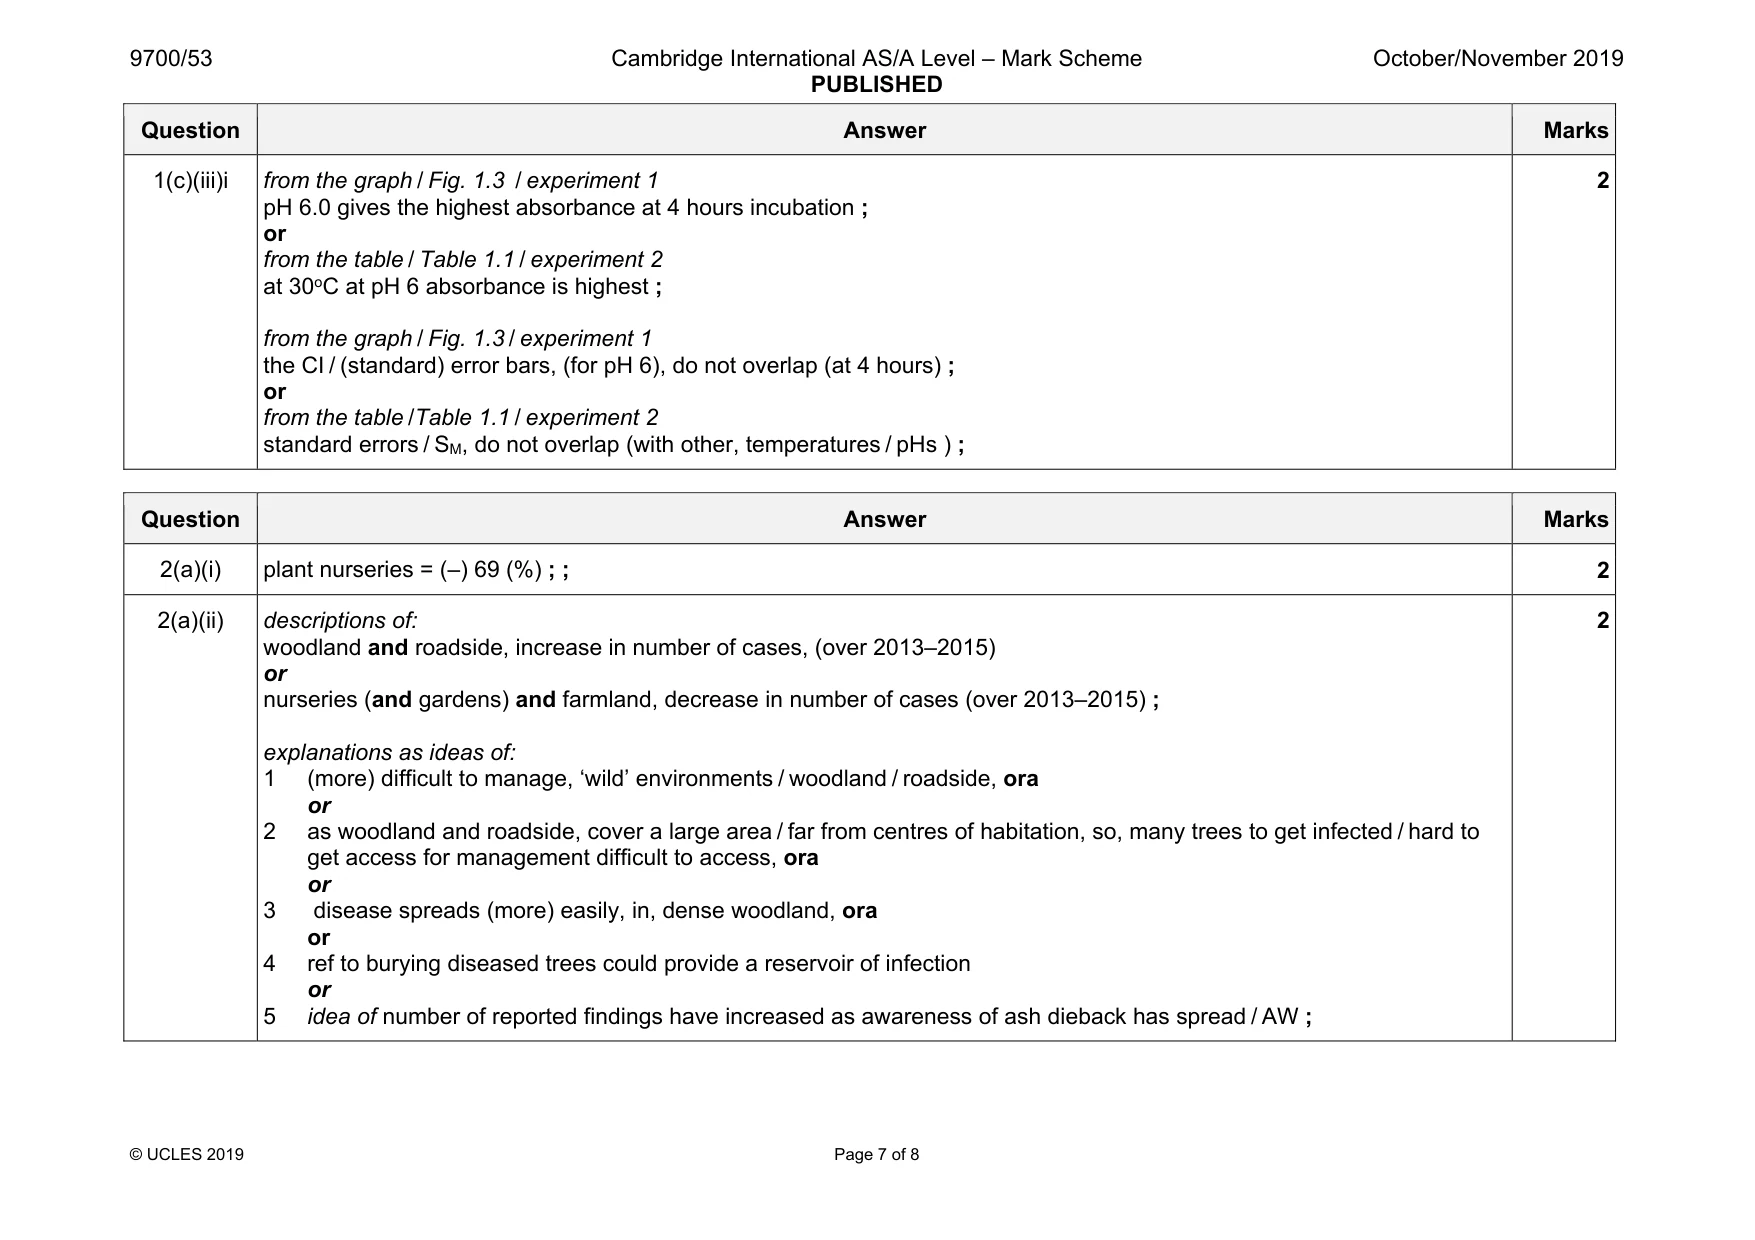
Mark scheme: 1(a)(i) independent: mass / biomass, of yeast ; or concentration of, yeast / suspension / culture ; dependent: absorbance / colour (change / of indicator) ; 2 1(a)(ii) any two of: volume of water (added) / volume of yeast suspension ; (same) indicator / TTC ; (same) temperature ; (same) time / period, of incubation ; colorimeter zeroed ; 2 1(a)(iii) one of: replace (live) yeast by: boiled / dead / inactivated / AW, yeast (of the same mass) ; sterile / inert / glass beads / AW, material (of same mass) ; 1 1(a)(iv) axes labelled x =, time / t, y =, absorbance / Ab ; line to show absorbance shows an increase ; ecf if axes inverted but shape (related to axes) correct = 1 ecf if axes wrong but shape correct (related to those axes) = 1 2 Question Answer Marks 1(b) any seven of: 1 same / stated / known, mass / volume (suspension), of each yeast (added to separate flasks) ; 2 same / stated / known, concentration of, nutrient solution / glucose ; 3 same / stated / known, volume of, nutrient solution / glucose ; 4 ref. to method to maintain temperature ; 5 suitable temperature in range 15 °C–80 °C ; 6 idea of equilibration / bringing yeast suspension and nutrient solution, to temperature, before mixing ; 7 add TTC / redox indicator, to yeast / yeast and nutrient mixture ; 8 time for recording absorbance either record (absorbance) at, regular / stated, time intervals or leave for set time (if stated max = 1 hour) and record (absorbance) ; 9 ref. to method of maintaining homogeneity (of yeast) ; 10 ref. to method of maintaining oxygen concentration ; 11 use (at least) 3 replicates / repeats and find mean or identify / eliminate / remove, anomalies ; 12 ref. to low risk ; or A named hazard and risk and precaution e.g. yeast and allergy and wear gloves / mask / goggles e.g. TTC and irritant and wear gloves / mask / goggles 7 1(c)(i) idea of how close the (sample) mean, is to the, true / population, mean ; 1 1(c)(ii) either 95% of, the / all / repeated, data, would be expected to lie within this range ; or At 1 / 3 / 4, hours, the (sample) mean, was reliable / AW, because the, confidence intervals / CI, do not overlap ; 1 Question Answer Marks 1(c)(iii)i from the graph / Fig. 1.3 / experiment 1 pH 6.0 gives the highest absorbance at 4 hours incubation ; or from the table / Table 1.1 / experiment 2 at 30oC at pH 6 absorbance is highest ; from the graph / Fig. 1.3 / experiment 1 the CI / (standard) error bars, (for pH 6), do not overlap (at 4 hours) ; or from the table /Table 1.1 / experiment 2 standard errors / SM, do not overlap (with other, temperatures / pHs ) ; 2
Q2 · Populations of European ash trees, Fraxinus excelsior, are susceptible to a chronic tree…
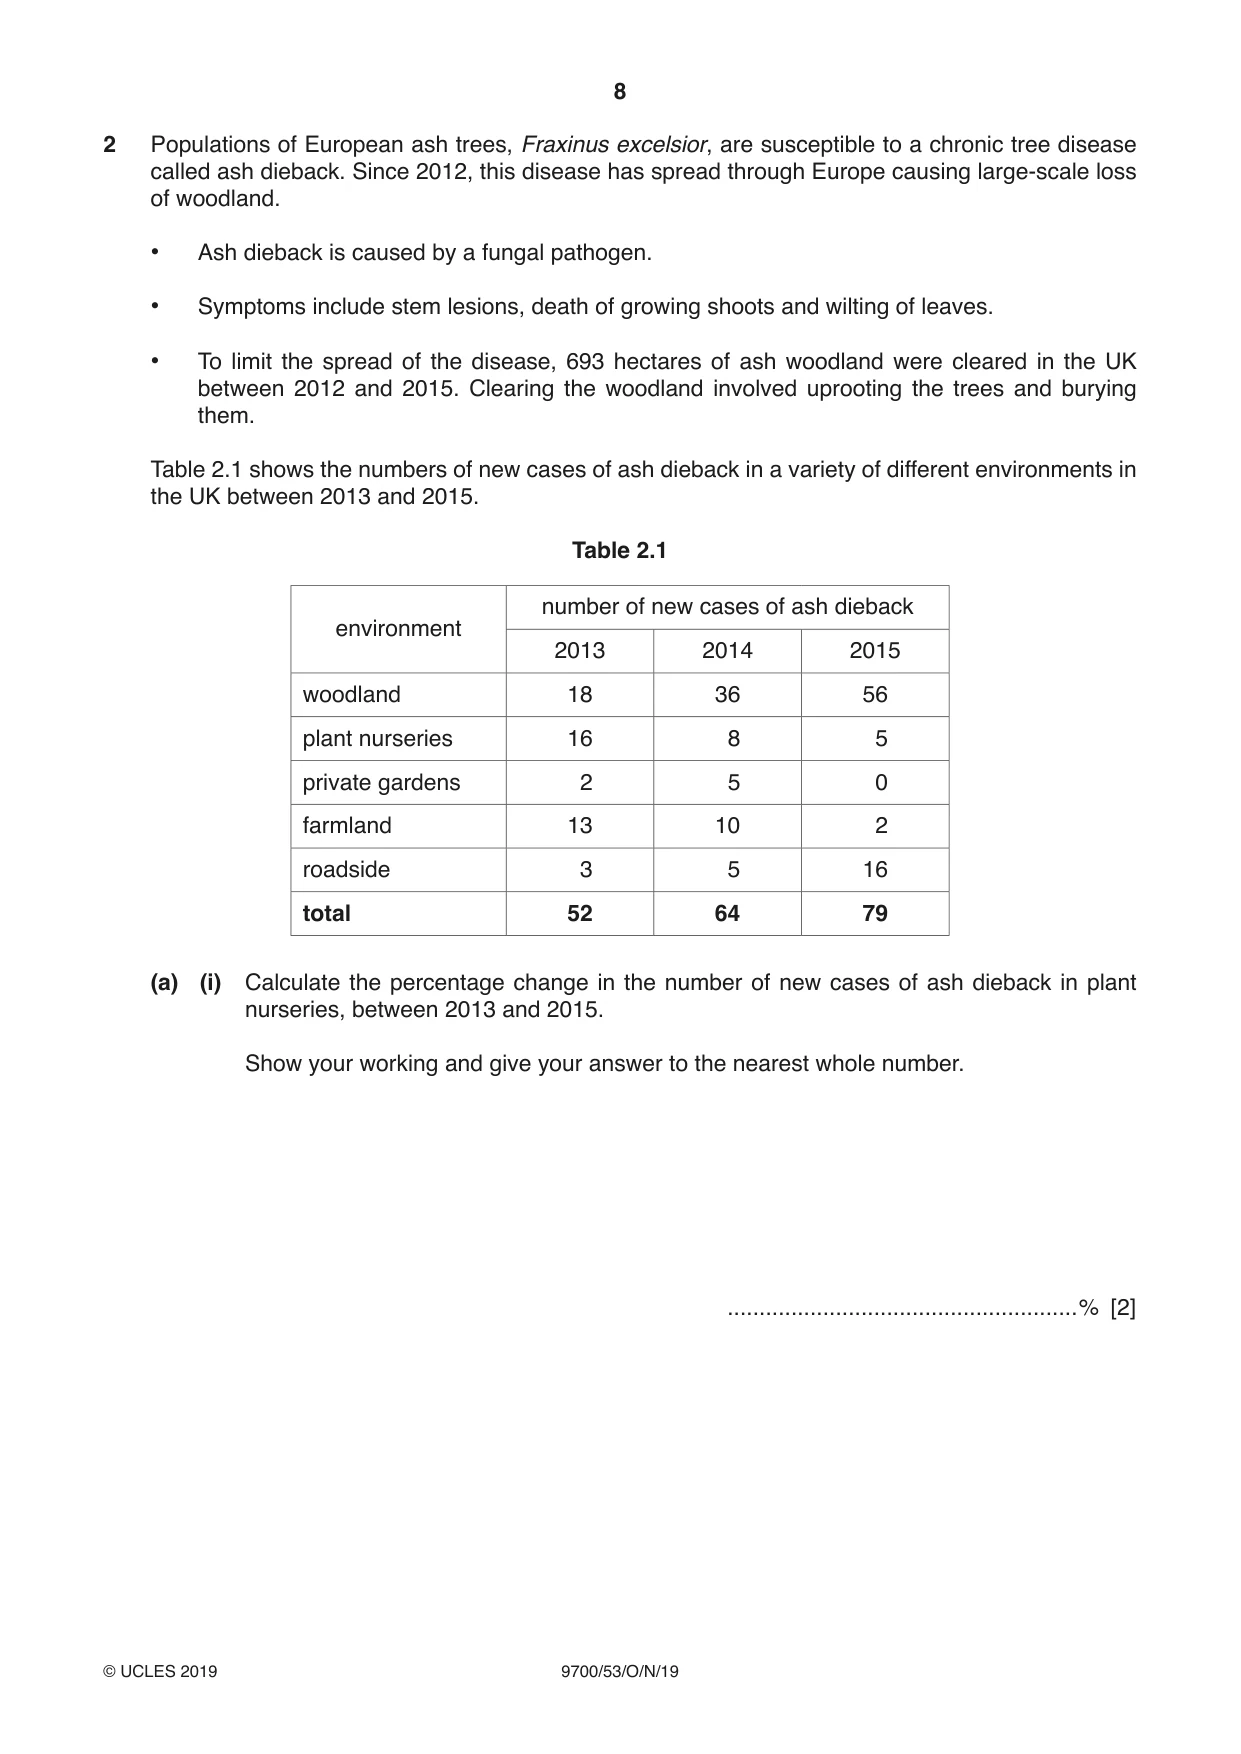
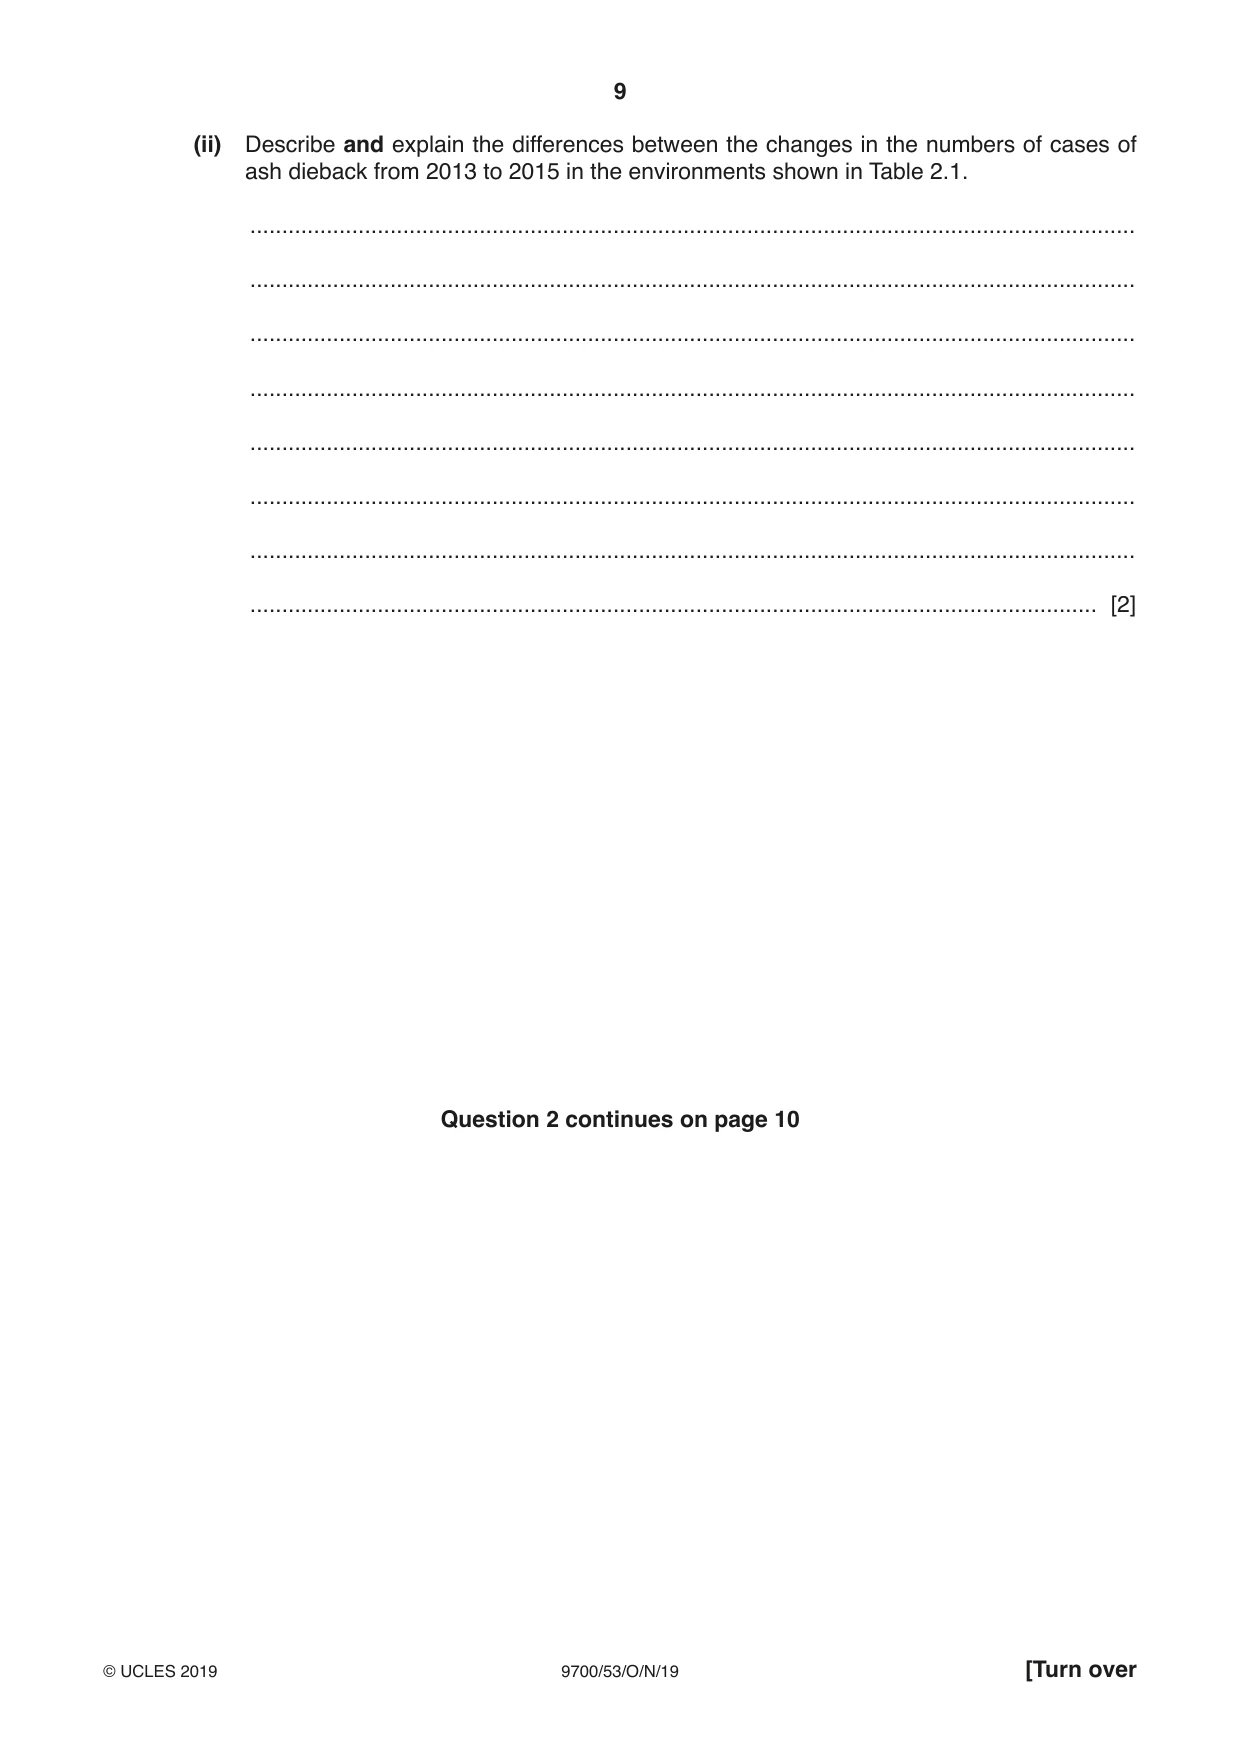
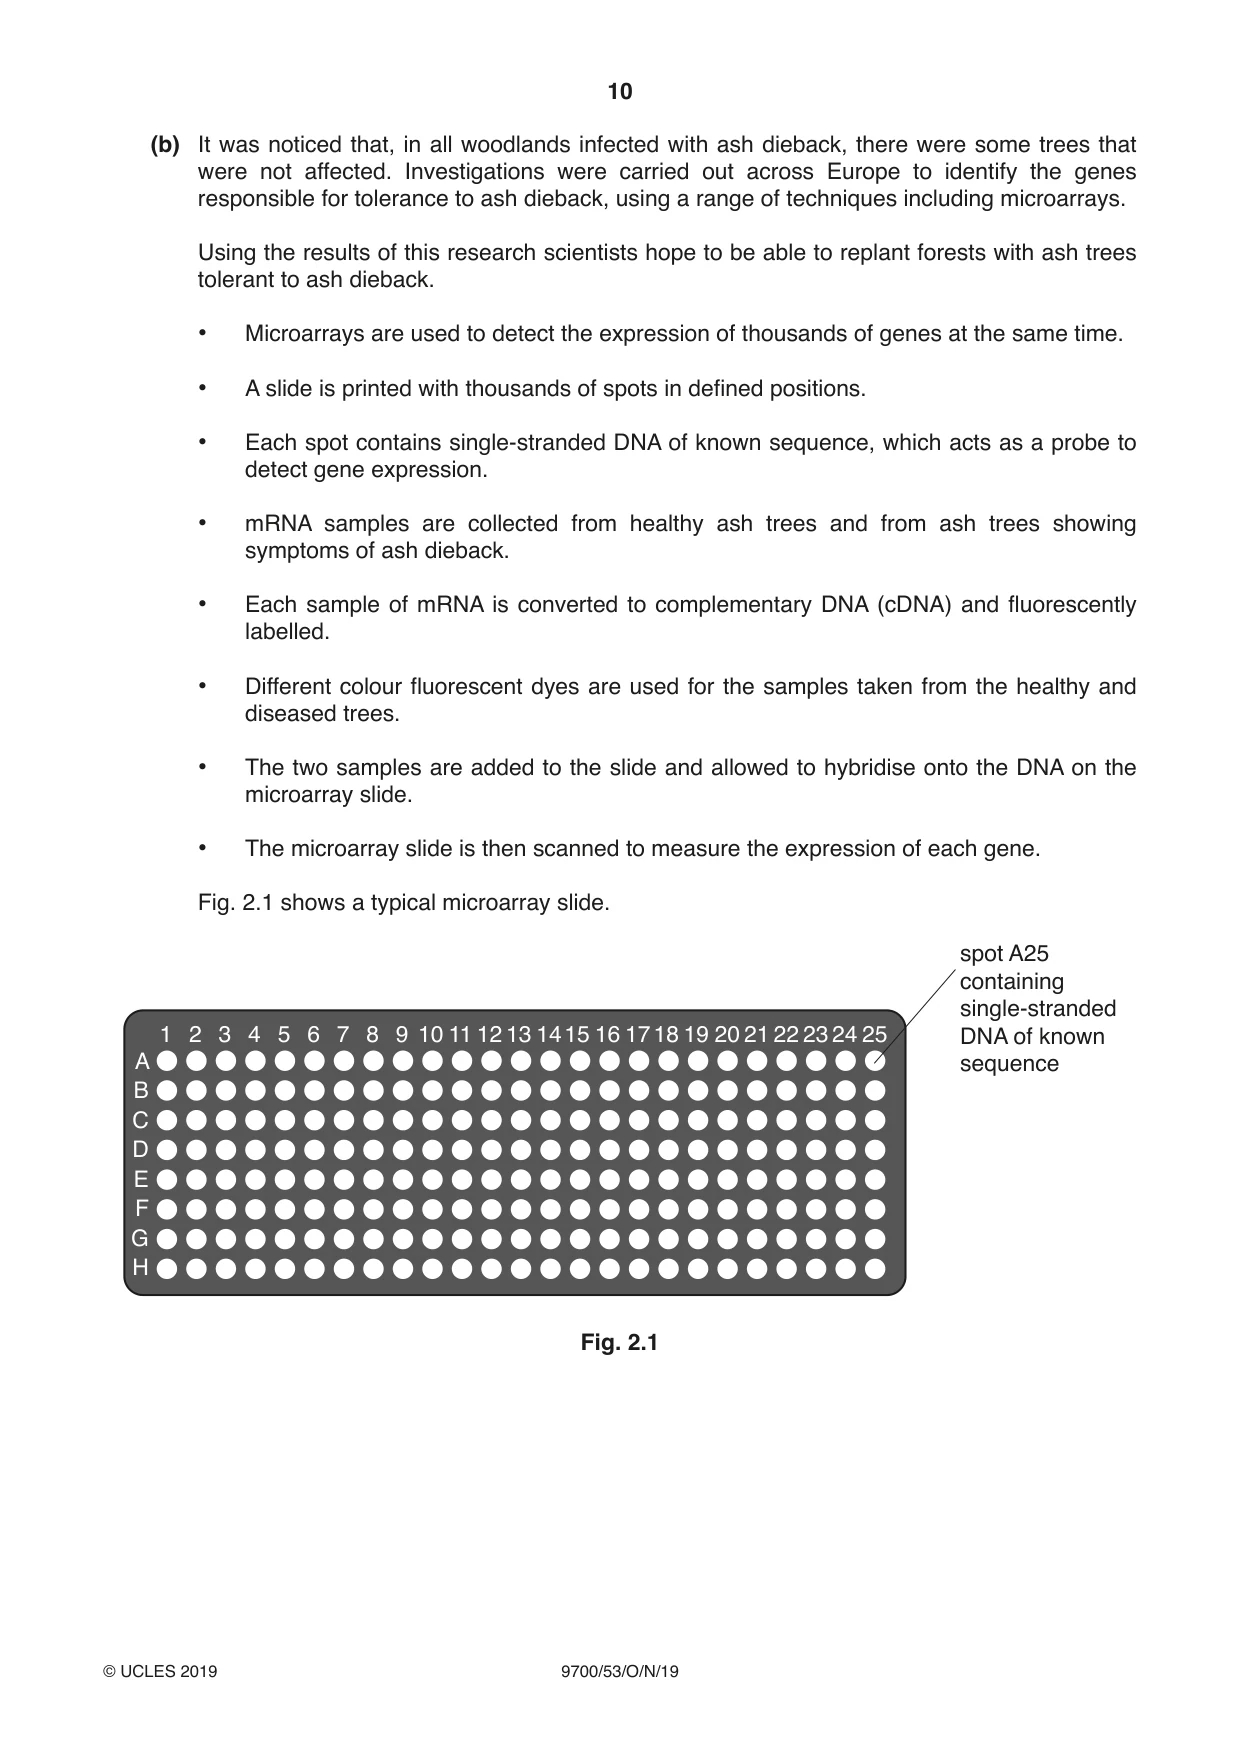
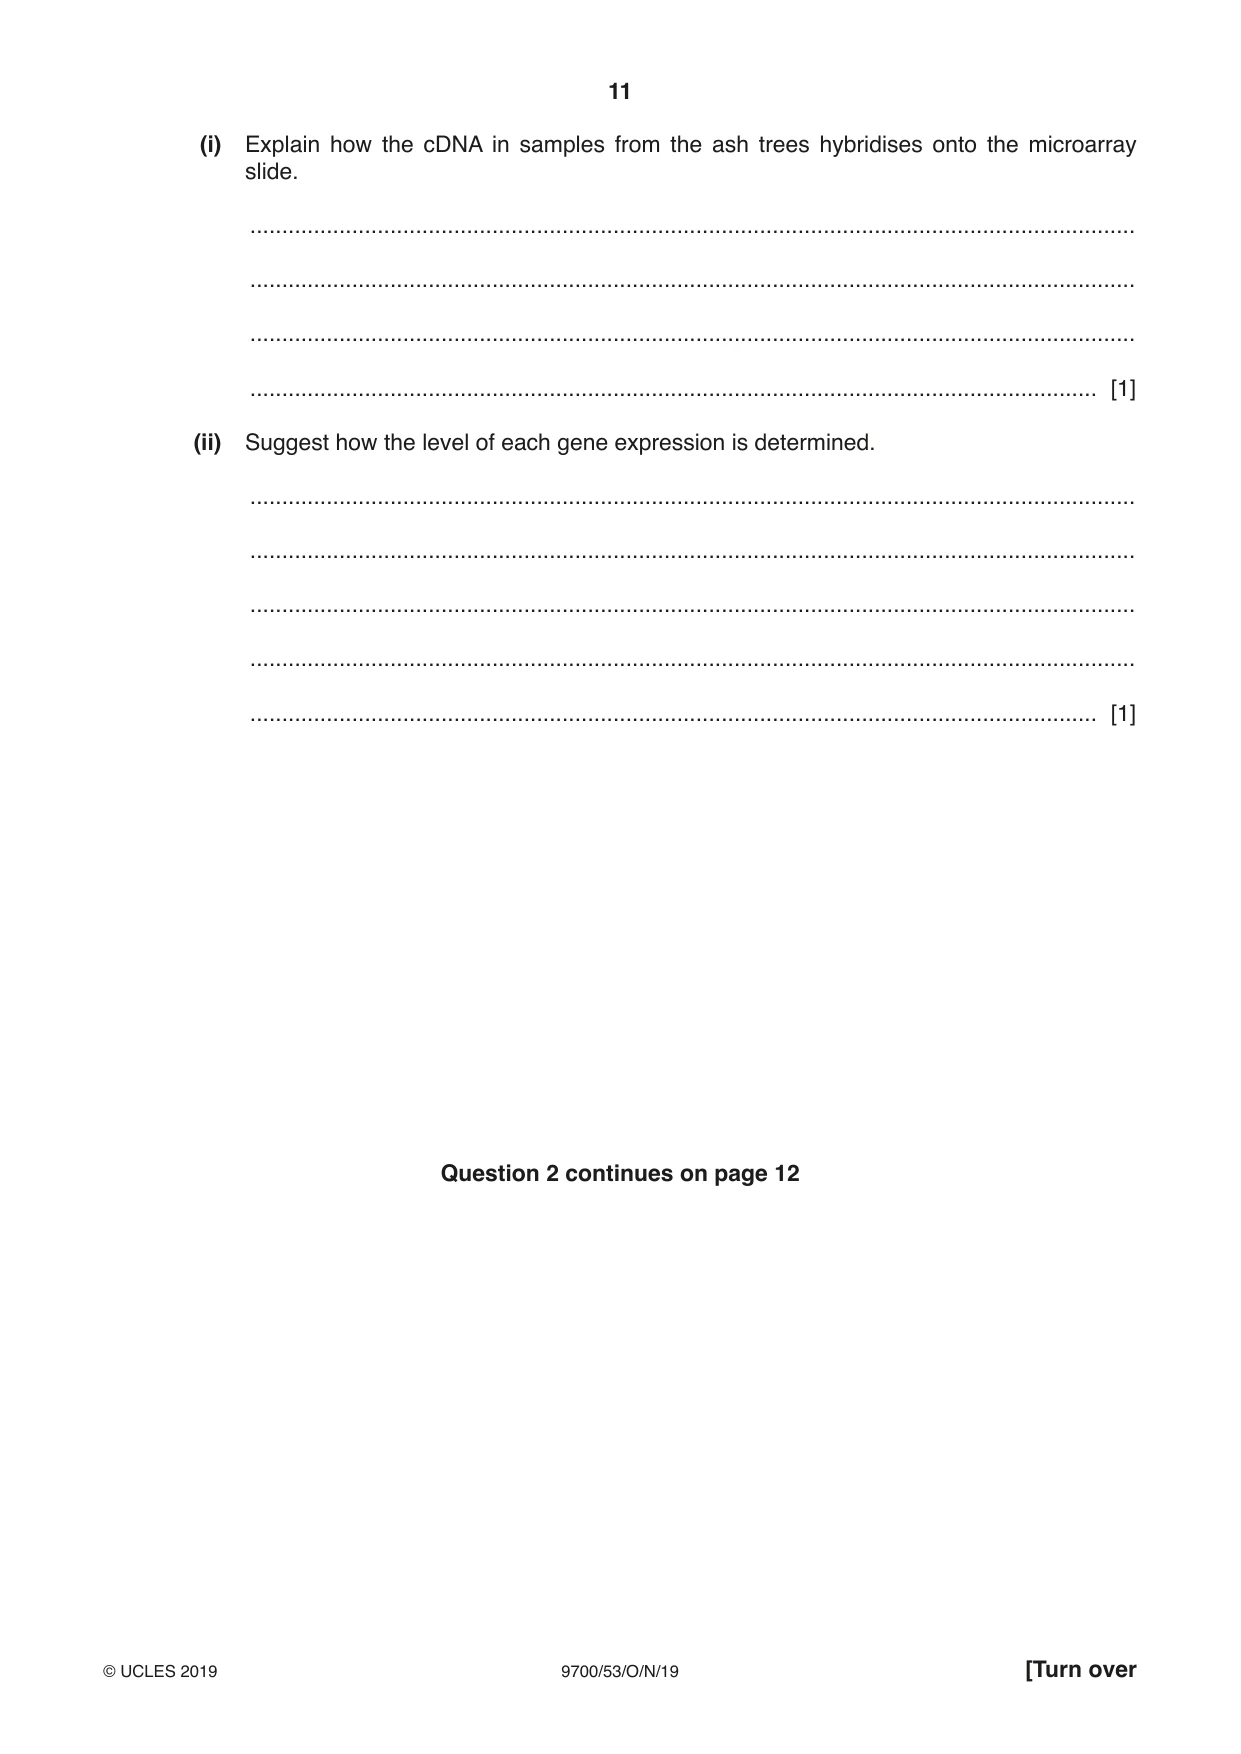
2 Populations of European ash trees, Fraxinus excelsior, are susceptible to a chronic tree disease called ash dieback. Since 2012, this disease has spread through Europe causing large-scale loss of woodland. • Ash dieback is caused by a fungal pathogen. • Symptoms include stem lesions, death of growing shoots and wilting of leaves. • To limit the spread of the disease, 693 hectares of ash woodland were cleared in the UK between 2012 and 2015. Clearing the woodland involved uprooting the trees and burying them. Table 2.1 shows the numbers of new cases of ash dieback in a variety of different environments in the UK between 2013 and 2015. Table 2.1 number of new cases of ash dieback environment 2013 2014 2015 woodland 18 36 56 plant nurseries 16 8 5 private gardens 2 5 0 farmland 13 10 2 roadside 3 5 16 total 52 64 79 (a) (i) Calculate the percentage change in the number of new cases of ash dieback in plant nurseries, between 2013 and 2015. Show your working and give your answer to the nearest whole number. .......................................................% [2] (ii) Describe and explain the differences between the changes in the numbers of cases of ash dieback from 2013 to 2015 in the environments shown in Table 2.1. ........................................................................................................................................... ........................................................................................................................................... ........................................................................................................................................... ........................................................................................................................................... ........................................................................................................................................... ........................................................................................................................................... ........................................................................................................................................... ..................................................................................................................................... [2] Question 2 continues on page 10 (b) It was noticed that, in all woodlands infected with ash dieback, there were some trees that were not affected. Investigations were carried out across Europe to identify the genes responsible for tolerance to ash dieback, using a range of techniques including microarrays. Using the results of this research scientists hope to be able to replant forests with ash trees tolerant to ash dieback. • Microarrays are used to detect the expression of thousands of genes at the same time. • A slide is printed with thousands of spots in defined positions. • Each spot contains single-stranded DNA of known sequence, which acts as a probe to detect gene expression. • mRNA samples are collected from healthy ash trees and from ash trees showing symptoms of ash dieback. • Each sample of mRNA is converted to complementary DNA (cDNA) and fluorescently labelled. • Different colour fluorescent dyes are used for the samples taken from the healthy and diseased trees. • The two samples are added to the slide and allowed to hybridise onto the DNA on the microarray slide. • The microarray slide is then scanned to measure the expression of each gene. Fig. 2.1 shows a typical microarray slide. spot A25 containing single-stranded 1 2 3 4 5 6 7 8 9 10 11 12 13 1415 16 1718 19 20 21 22 23 24 25 DNA of known A sequence B C D E F G H Fig. 2.1
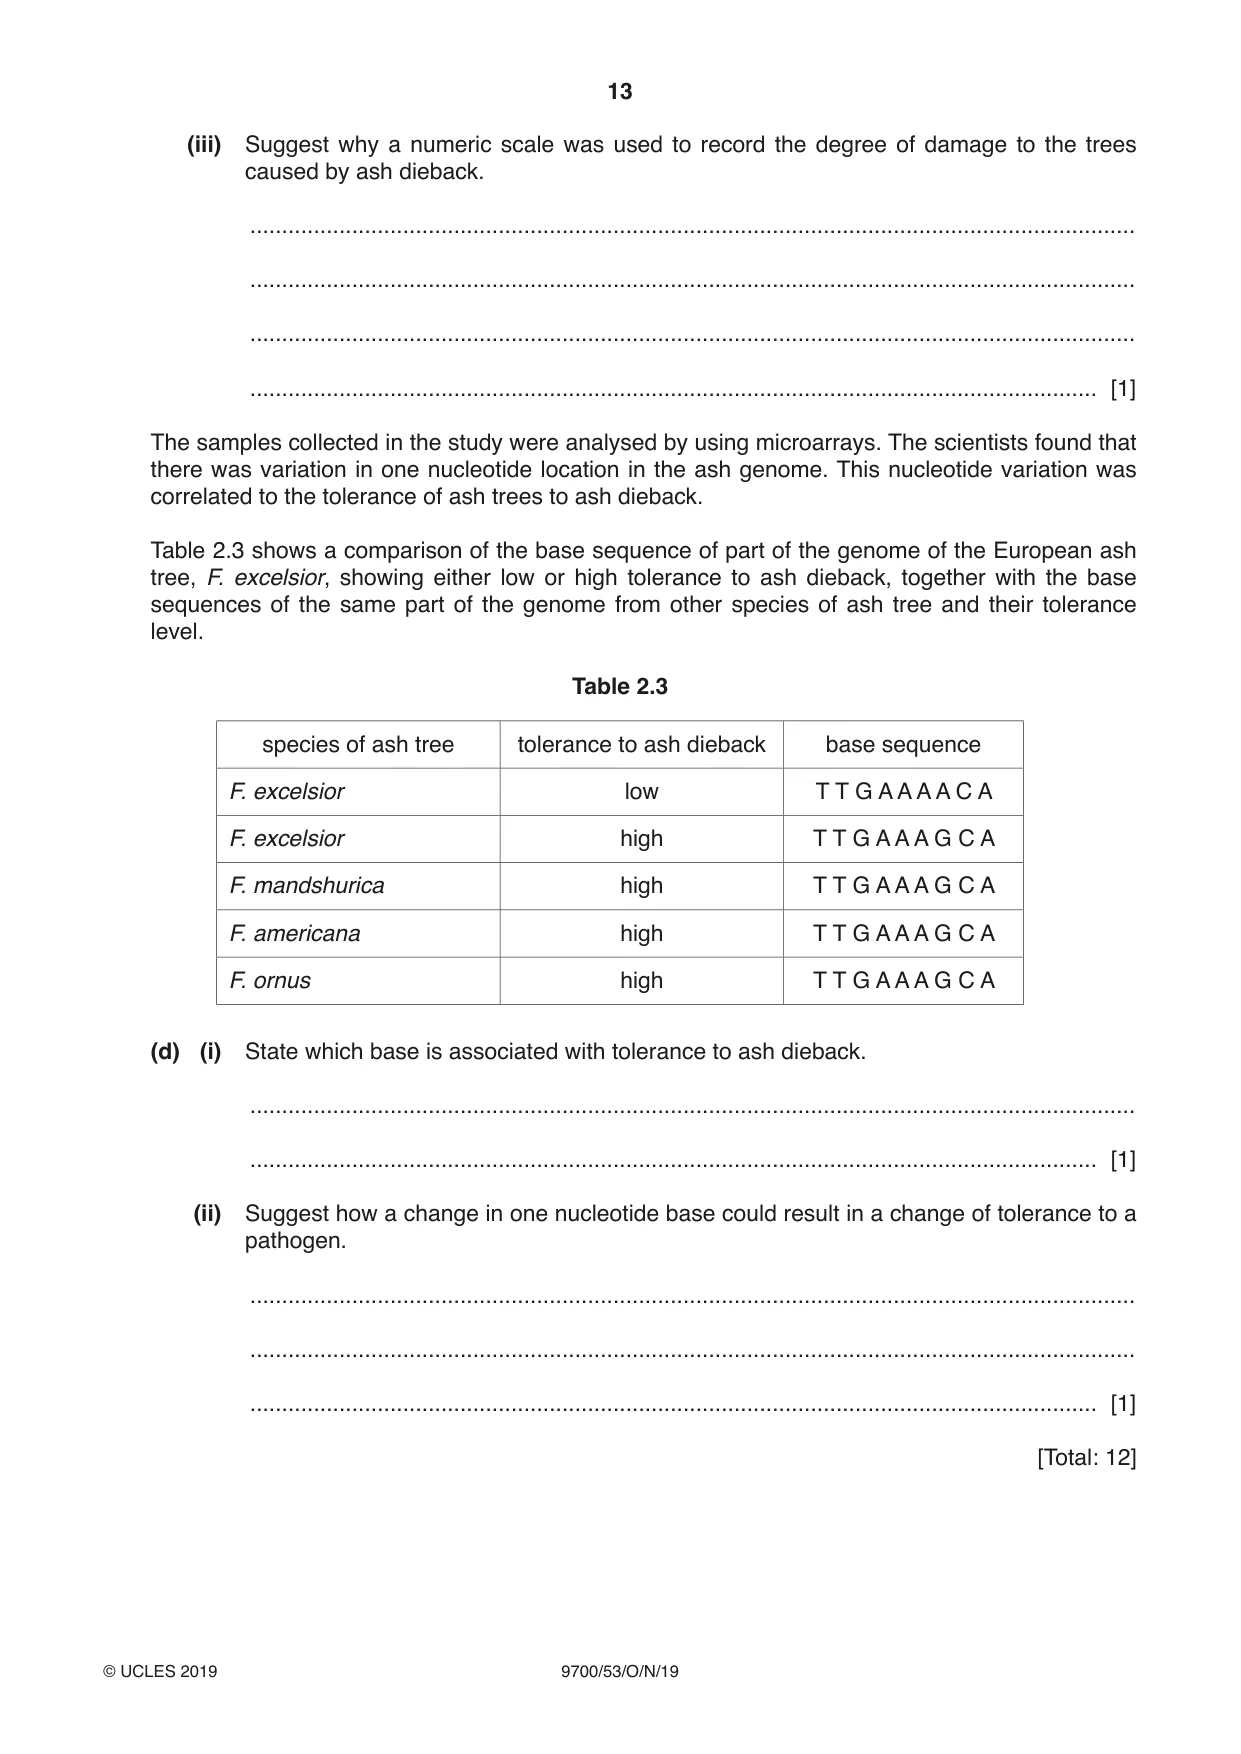
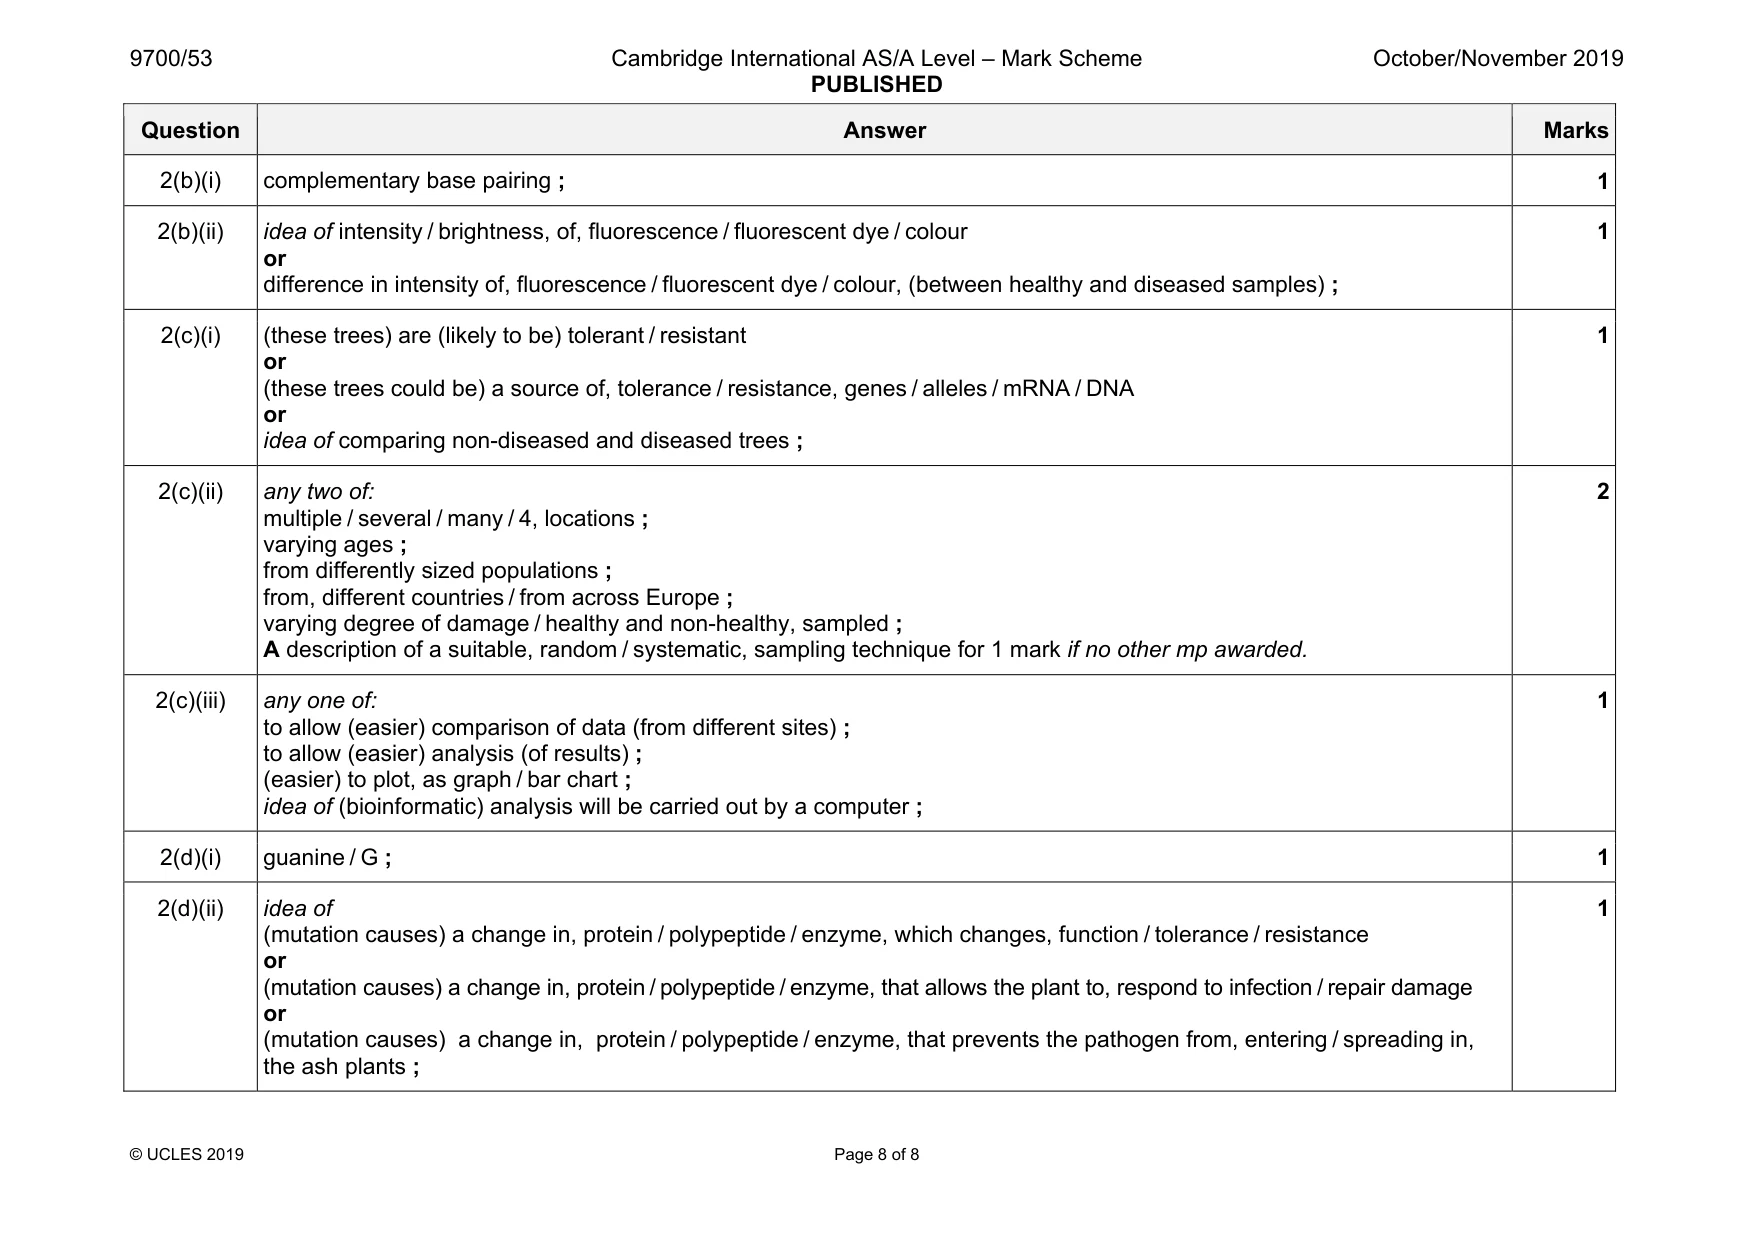
Mark scheme: 2(a)(i) plant nurseries = (–) 69 (%) ; ; 2 2(a)(ii) descriptions of: woodland and roadside, increase in number of cases, (over 2013–2015) or nurseries (and gardens) and farmland, decrease in number of cases (over 2013–2015) ; explanations as ideas of: 1 (more) difficult to manage, ‘wild’ environments / woodland / roadside, ora or 2 as woodland and roadside, cover a large area / far from centres of habitation, so, many trees to get infected / hard to get access for management difficult to access, ora or 3 disease spreads (more) easily, in, dense woodland, ora or 4 ref to burying diseased trees could provide a reservoir of infection or 5 idea of number of reported findings have increased as awareness of ash dieback has spread / AW ; 2 Question Answer Marks 2(b)(i) complementary base pairing ; 1 2(b)(ii) idea of intensity / brightness, of, fluorescence / fluorescent dye / colour or difference in intensity of, fluorescence / fluorescent dye / colour, (between healthy and diseased samples) ; 1 2(c)(i) (these trees) are (likely to be) tolerant / resistant or (these trees could be) a source of, tolerance / resistance, genes / alleles / mRNA / DNA or idea of comparing non-diseased and diseased trees ; 1 2(c)(ii) any two of: multiple / several / many / 4, locations ; varying ages ; from differently sized populations ; from, different countries / from across Europe ; varying degree of damage / healthy and non-healthy, sampled ; A description of a suitable, random / systematic, sampling technique for 1 mark if no other mp awarded. 2 2(c)(iii) any one of: to allow (easier) comparison of data (from different sites) ; to allow (easier) analysis (of results) ; (easier) to plot, as graph / bar chart ; idea of (bioinformatic) analysis will be carried out by a computer ; 1 2(d)(i) guanine / G ; 1 2(d)(ii) idea of (mutation causes) a change in, protein / polypeptide / enzyme, which changes, function / tolerance / resistance or (mutation causes) a change in, protein / polypeptide / enzyme, that allows the plant to, respond to infection / repair damage or (mutation causes) a change in, protein / polypeptide / enzyme, that prevents the pathogen from, entering / spreading in, the ash plants ; 1
What was in this paper
The subtopics covered by these 2 questions, and how many questions each got. Open one in a new tab to see every Cambridge question on it.
What you needed in this session
Cambridge’s own grade thresholds for 2019 Oct/Nov, Paper 5 · Variant 3. A higher threshold means an easier paper — the bar moves with how the cohort did.