Cambridge A Level Biology 9700 — 2019 Oct/Nov Paper 3 · Variant 4
9700/34/O/N/19 · 2 questions · 40 marks · ≈45 min
The question paper and its mark scheme, free to read here and free to download. This is Cambridge’s own paper, exactly as it was sat.
Question paper12 pages

Mark scheme7 pages
Answers below. Sit the paper first if you are practising.


Questions as text
Q1 · When plant tissue is soaked in methylene blue solution, the solution enters the tissue…
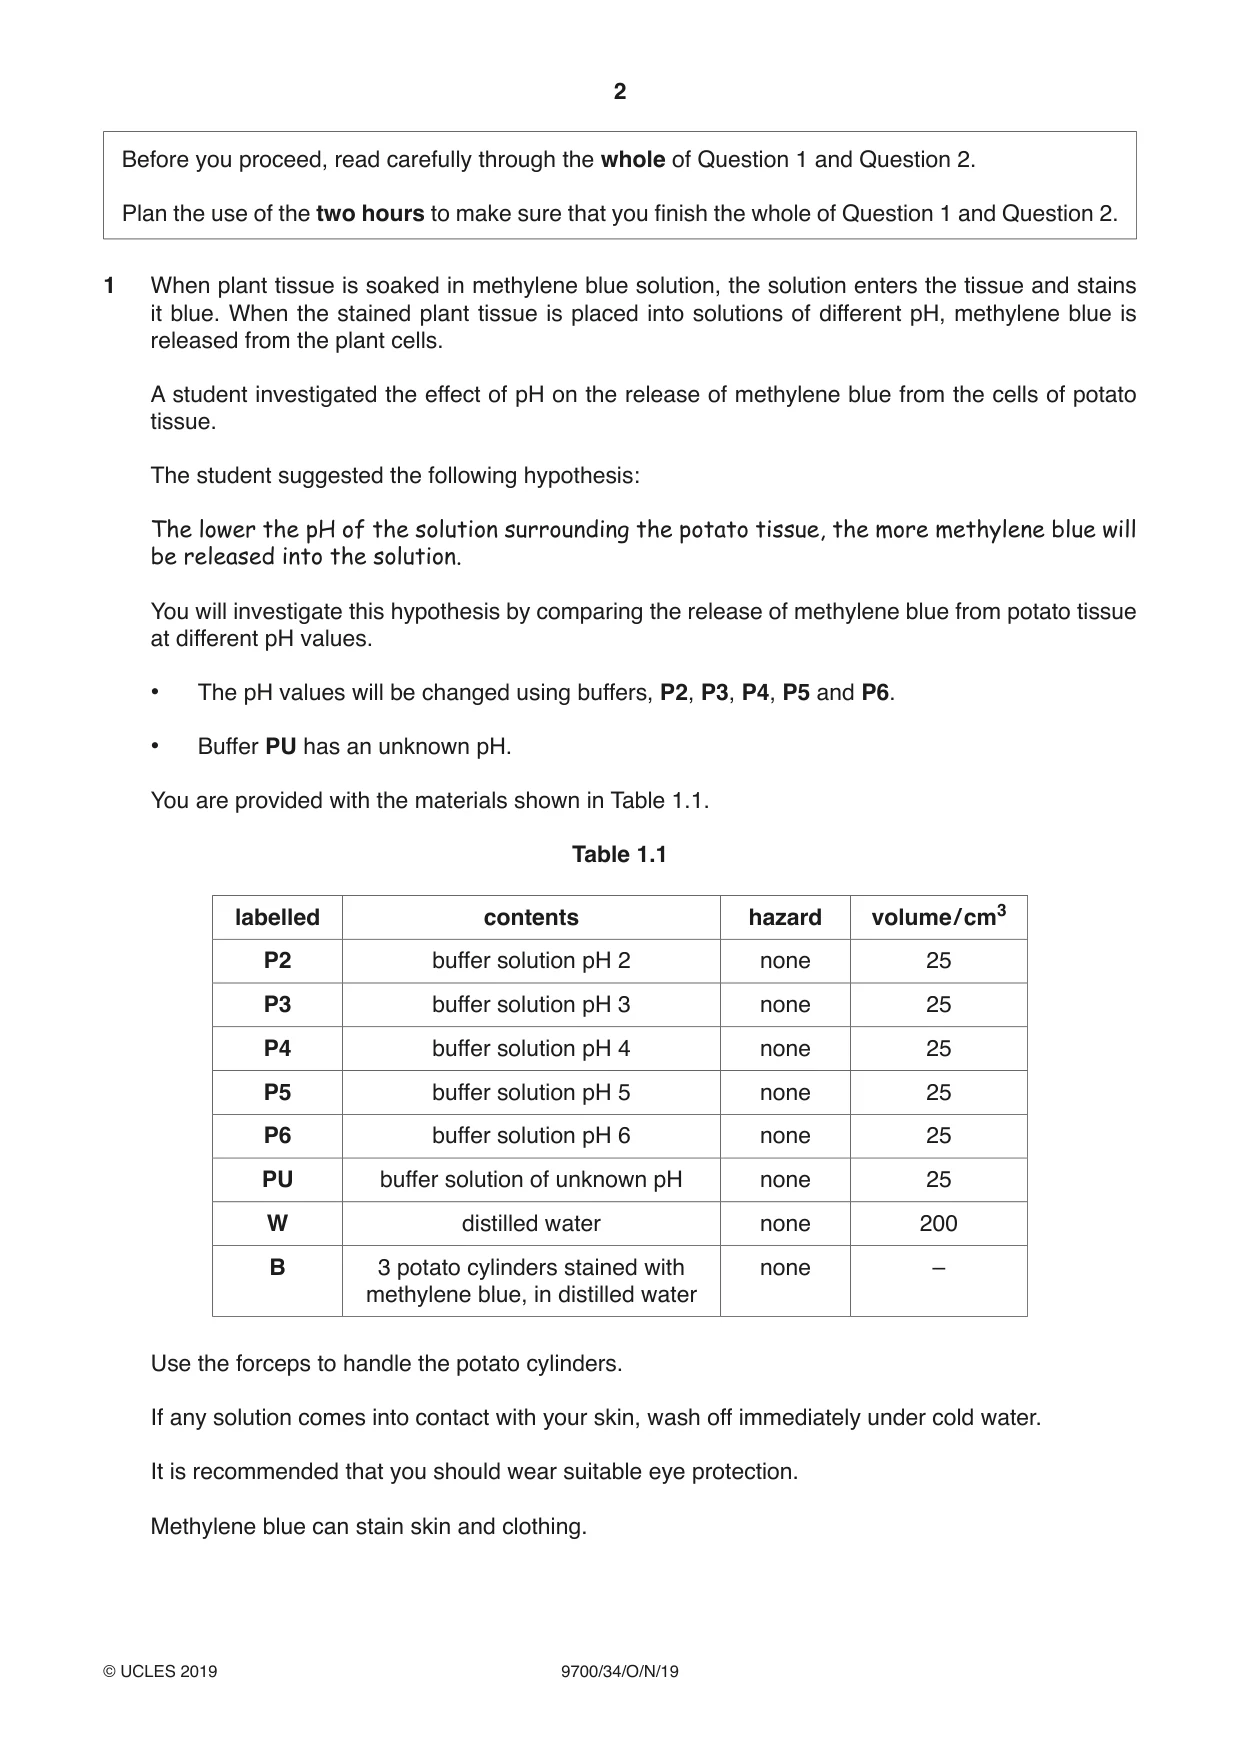
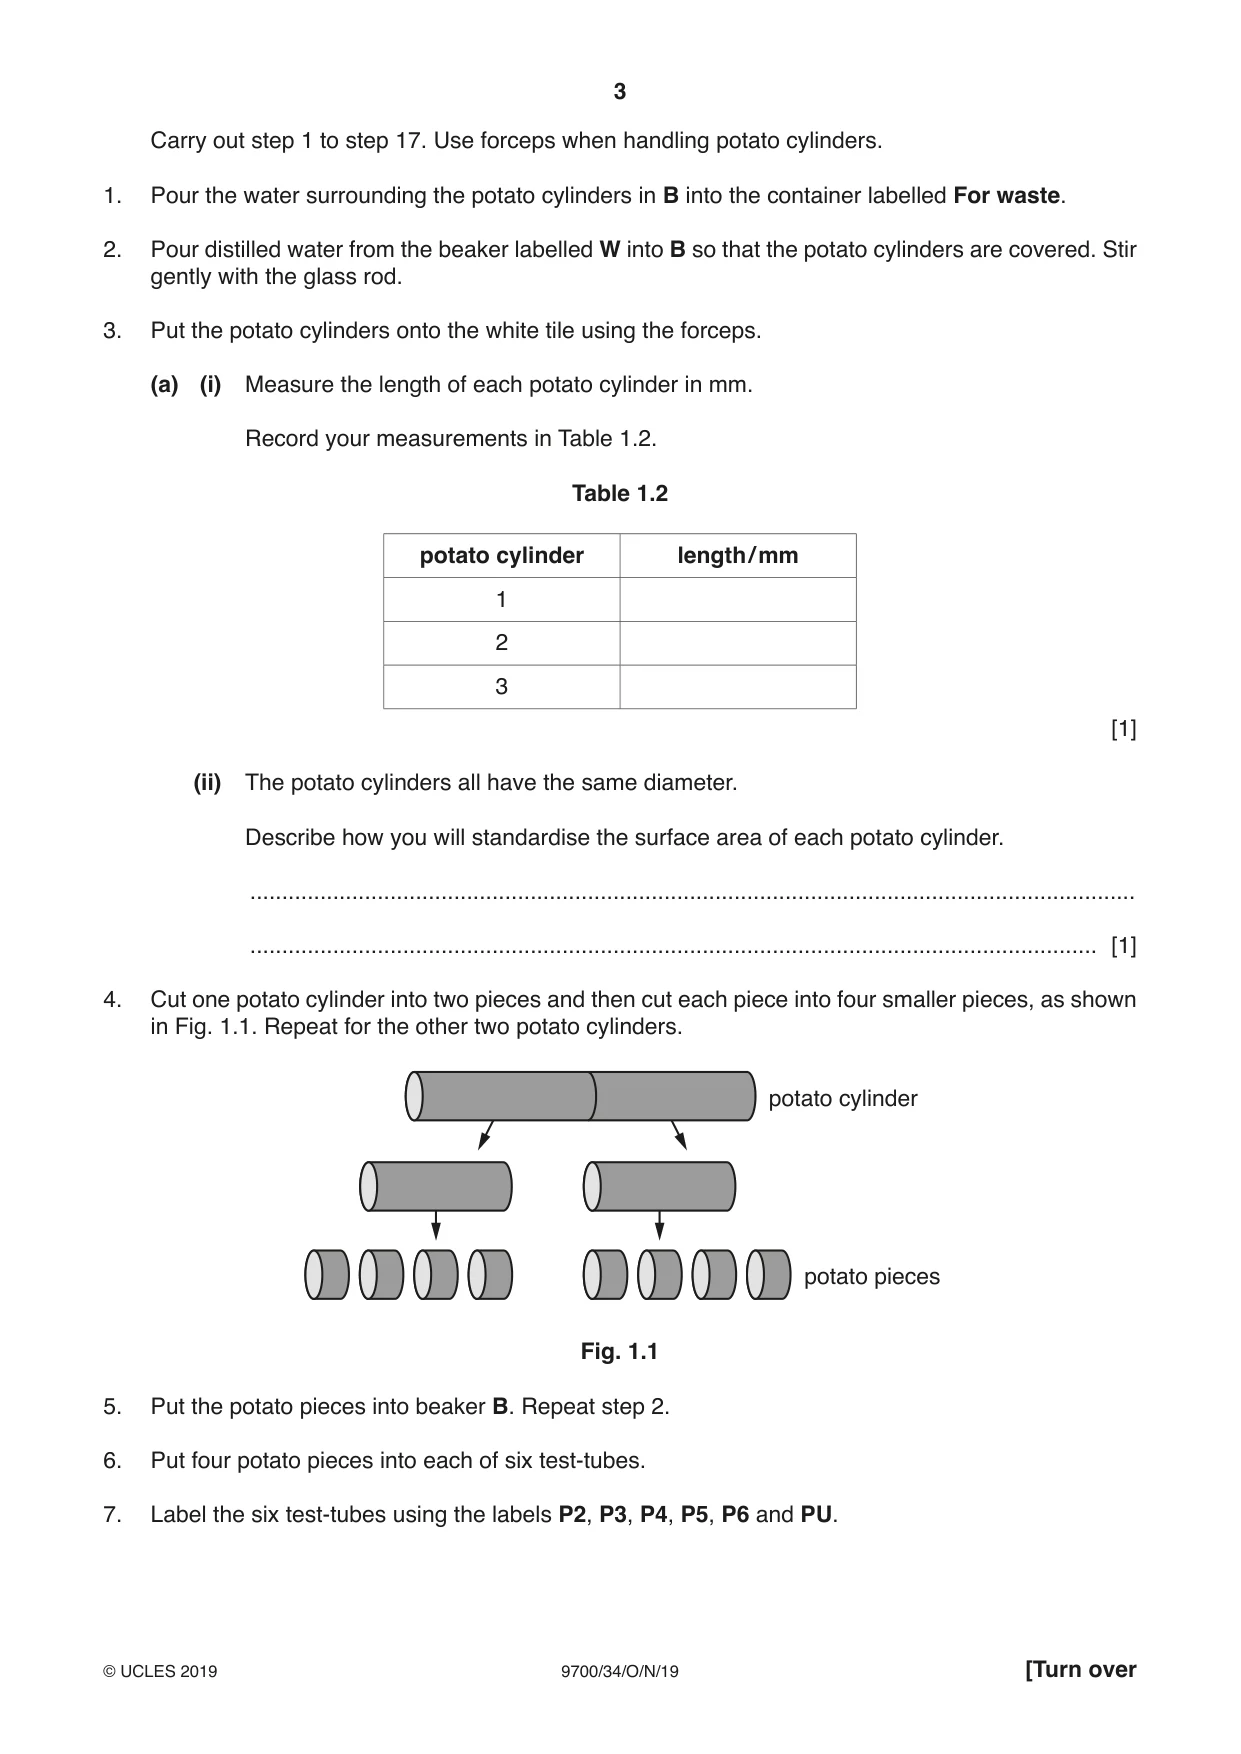
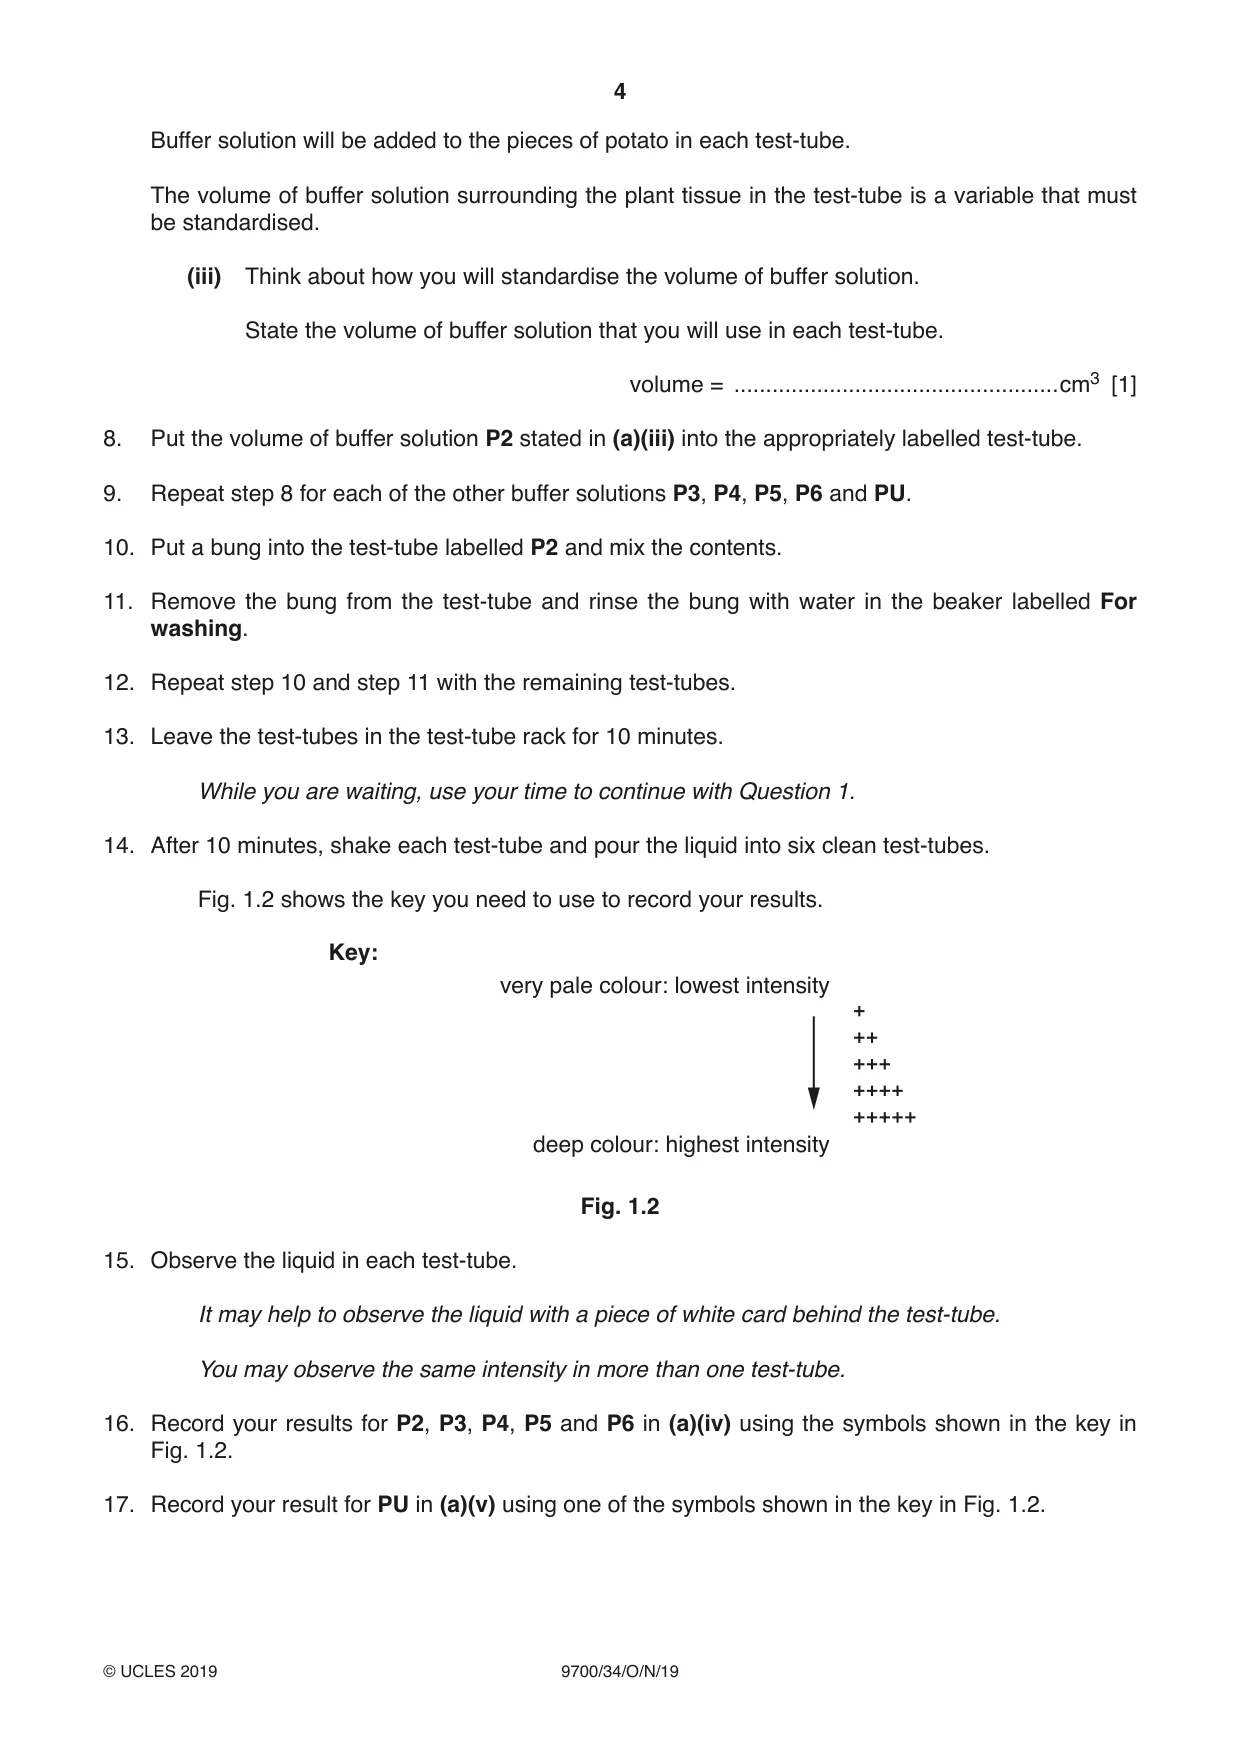
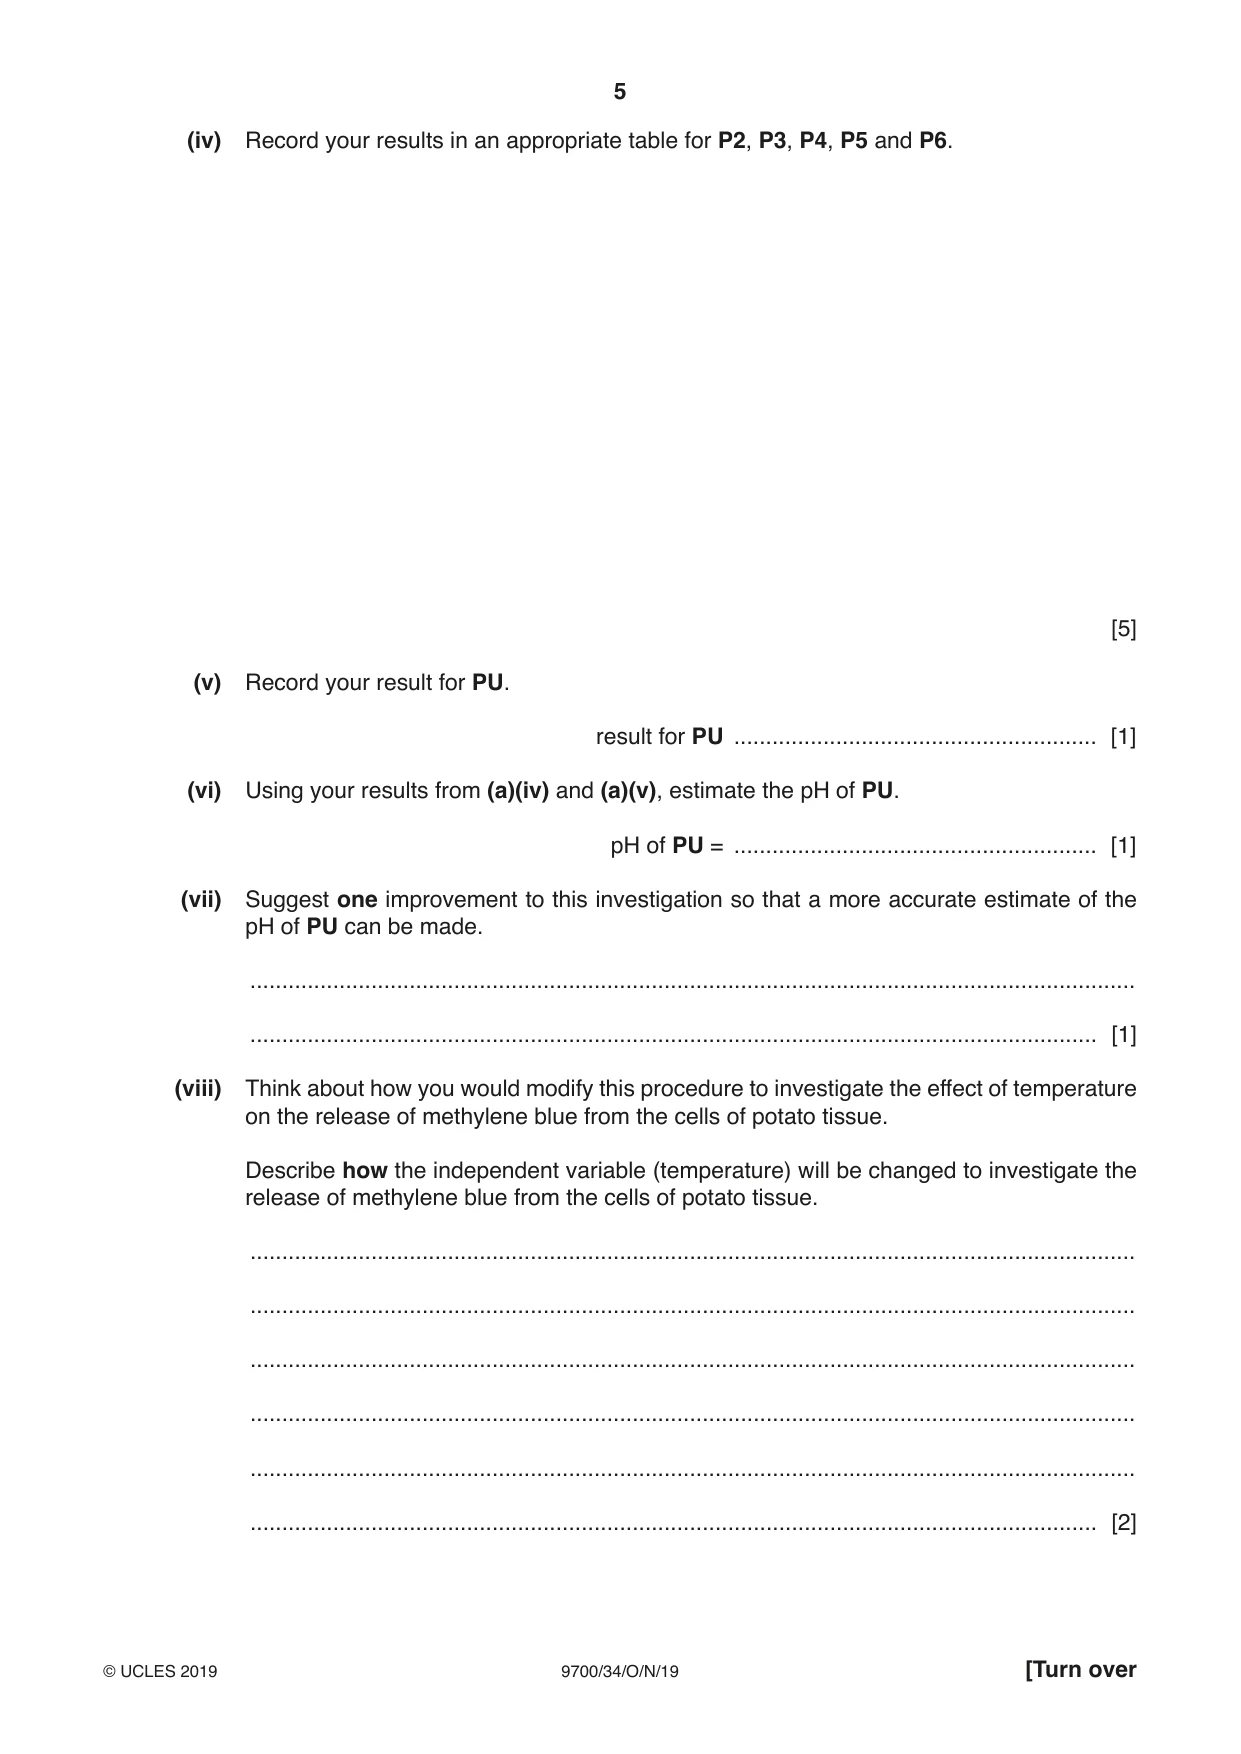
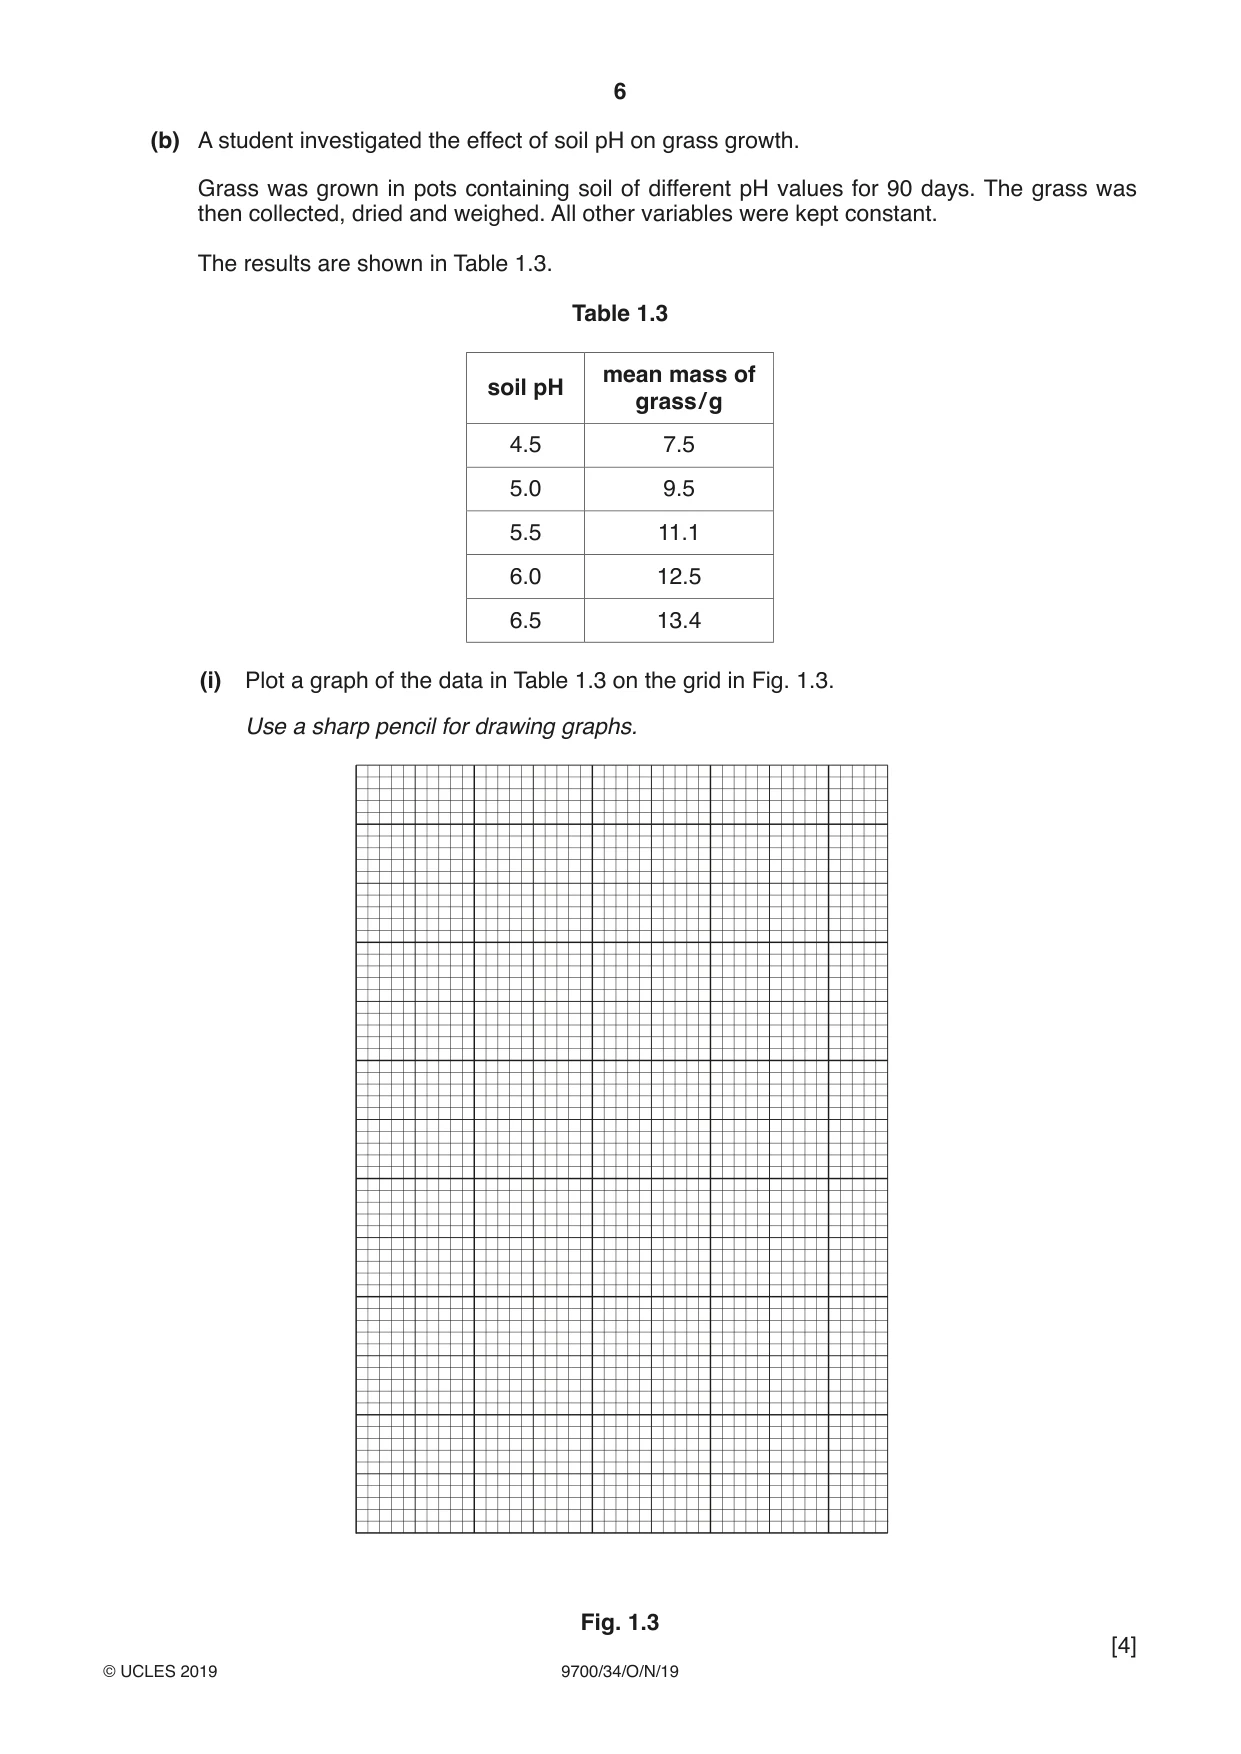
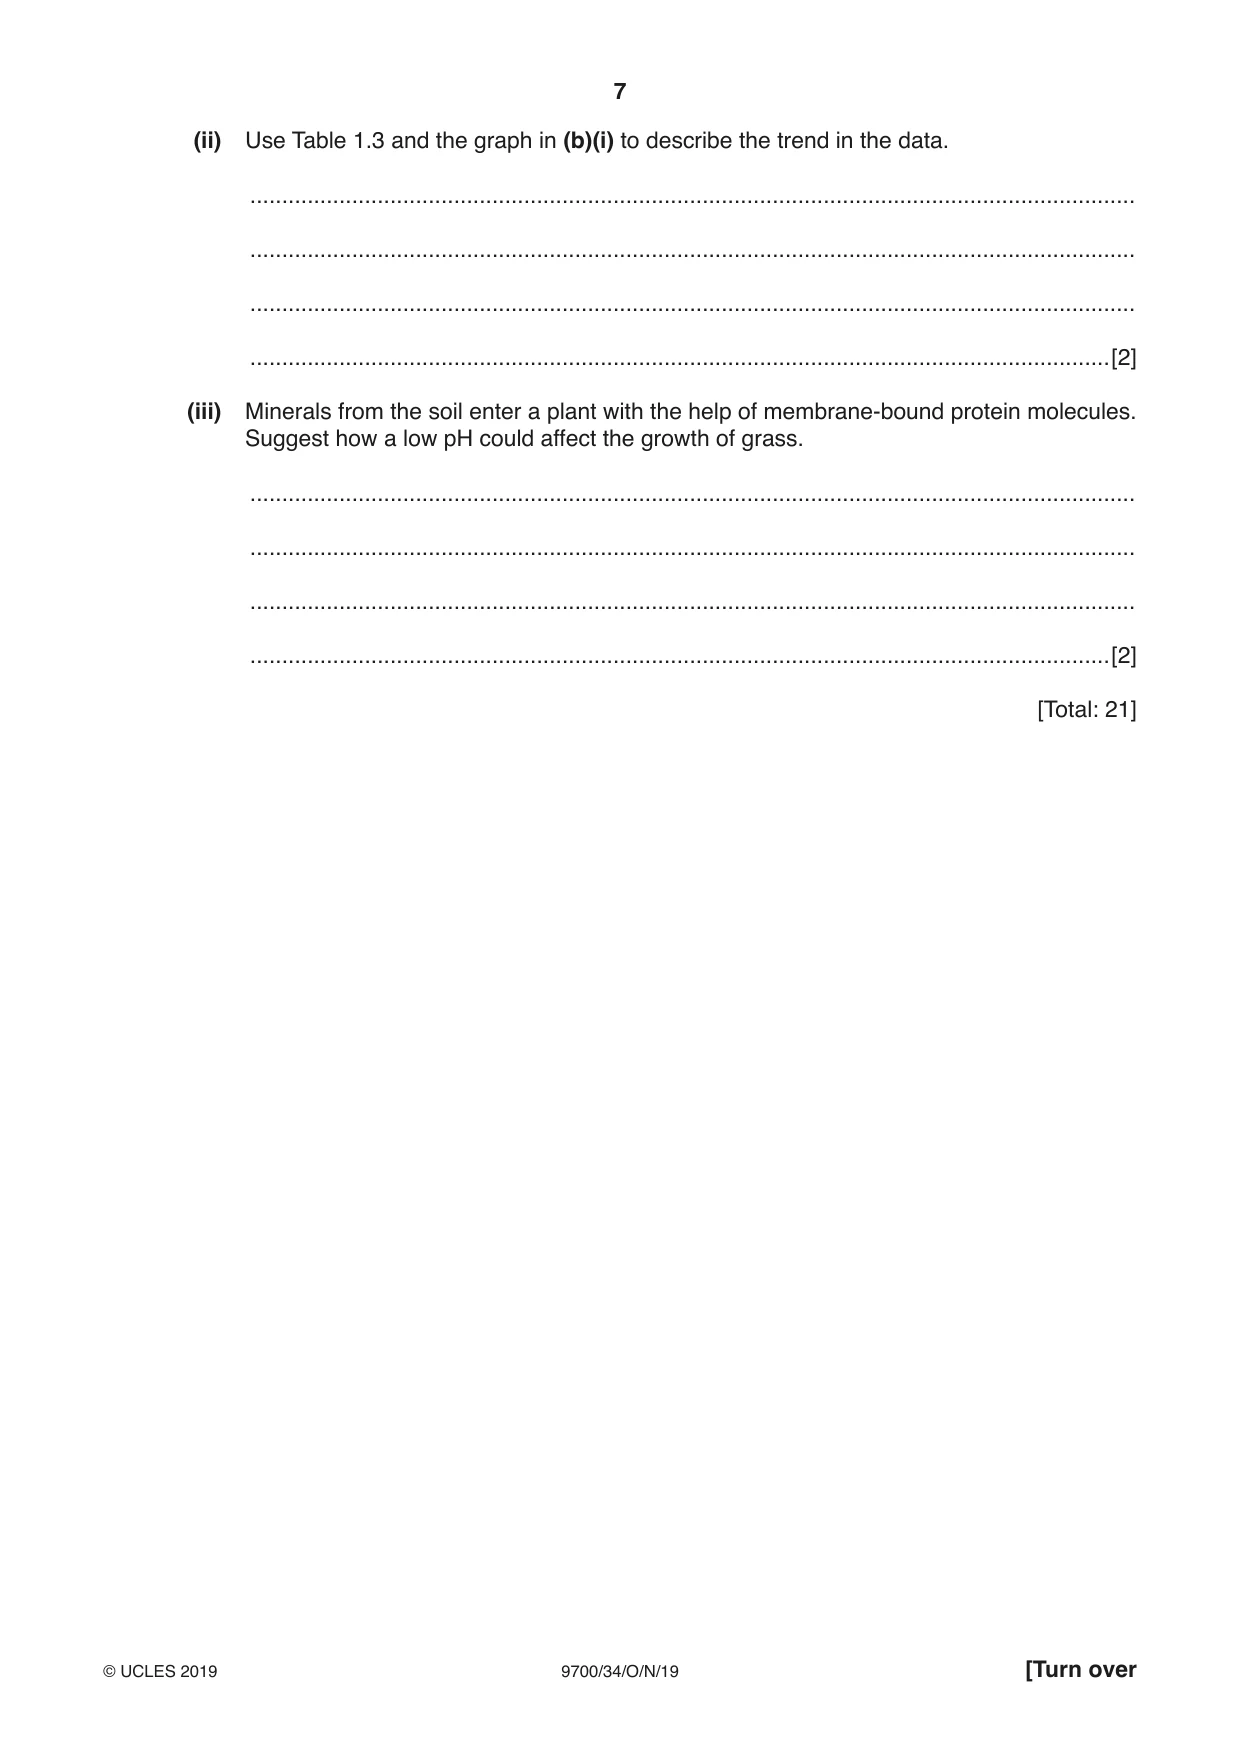
1 When plant tissue is soaked in methylene blue solution, the solution enters the tissue and stains it blue. When the stained plant tissue is placed into solutions of different pH, methylene blue is released from the plant cells. A student investigated the effect of pH on the release of methylene blue from the cells of potato tissue. The student suggested the following hypothesis: The lower the pH of the solution surrounding the potato tissue, the more methylene blue will be released into the solution. You will investigate this hypothesis by comparing the release of methylene blue from potato tissue at different pH values. • The pH values will be changed using buffers, P2, P3, P4, P5 and P6. • Buffer PU has an unknown pH. You are provided with the materials shown in Table 1.1. Table 1.1 labelled contents hazard volume / cm3 P2 buffer solution pH 2 none 25 P3 buffer solution pH 3 none 25 P4 buffer solution pH 4 none 25 P5 buffer solution pH 5 none 25 P6 buffer solution pH 6 none 25 PU buffer solution of unknown pH none 25 W distilled water none 200 B 3 potato cylinders stained with none – methylene blue, in distilled water Use the forceps to handle the potato cylinders. If any solution comes into contact with your skin, wash off immediately under cold water. It is recommended that you should wear suitable eye protection. Methylene blue can stain skin and clothing. Carry out step 1 to step 17. Use forceps when handling potato cylinders. 1. Pour the water surrounding the potato cylinders in B into the container labelled For waste. 2. Pour distilled water from the beaker labelled W into B so that the potato cylinders are covered. Stir gently with the glass rod. 3. Put the potato cylinders onto the white tile using the forceps. (a) (i) Measure the length of each potato cylinder in mm. Record your measurements in Table 1.2. Table 1.2 potato cylinder length / mm 1 2 3 [1] (ii) The potato cylinders all have the same diameter. Describe how you will standardise the surface area of each potato cylinder. ........................................................................................................................................... ..................................................................................................................................... [1] 4. Cut one potato cylinder into two pieces and then cut each piece into four smaller pieces, as shown in Fig. 1.1. Repeat for the other two potato cylinders. potato cylinder potato pieces Fig. 1.1 5. Put the potato pieces into beaker B. Repeat step 2. 6. Put four potato pieces into each of six test-tubes. 7. Label the six test-tubes using the labels P2, P3, P4, P5, P6 and PU. Buffer solution will be added to the pieces of potato in each test-tube. The volume of buffer solution surrounding the plant tissue in the test-tube is a variable that must be standardised. (iii) Think about how you will standardise the volume of buffer solution. State the volume of buffer solution that you will use in each test-tube. volume = ...................................................cm3 [1] 8. Put the volume of buffer solution P2 stated in (a)(iii) into the appropriately labelled test-tube. 9. Repeat step 8 for each of the other buffer solutions P3, P4, P5, P6 and PU. 10. Put a bung into the test-tube labelled P2 and mix the contents. 11. Remove the bung from the test-tube and rinse the bung with water in the beaker labelled For washing. 12. Repeat step 10 and step 11 with the remaining test-tubes. 13. Leave the test-tubes in the test-tube rack for 10 minutes. While you are waiting, use your time to continue with Question 1. 14. After 10 minutes, shake each test-tube and pour the liquid into six clean test-tubes. Fig. 1.2 shows the key you need to use to record your results. Key: very pale colour: lowest intensity deep colour: highest intensity Fig. 1.2 15. Observe the liquid in each test-tube. It may help to observe the liquid with a piece of white card behind the test-tube. You may observe the same intensity in more than one test-tube. 16. Record your results for P2, P3, P4, P5 and P6 in (a)(iv) using the symbols shown in the key in Fig. 1.2. 17. Record your result for PU in (a)(v) using one of the symbols shown in the key in Fig. 1.2. (iv) Record your results in an appropriate table for P2, P3, P4, P5 and P6. [5] (v) Record your result for PU. result for PU ......................................................... [1] (vi) Using your results from (a)(iv) and (a)(v), estimate the pH of PU. pH of PU = ......................................................... [1] (vii) Suggest one improvement to this investigation so that a more accurate estimate of the pH of PU can be made. ........................................................................................................................................... ..................................................................................................................................... [1] (viii) Think about how you would modify this procedure to investigate the effect of temperature on the release of methylene blue from the cells of potato tissue. Describe how the independent variable (temperature) will be changed to investigate the release of methylene blue from the cells of potato tissue. ........................................................................................................................................... ........................................................................................................................................... ........................................................................................................................................... ........................................................................................................................................... ........................................................................................................................................... ..................................................................................................................................... [2] (b) A student investigated the effect of soil pH on grass growth. Grass was grown in pots containing soil of different pH values for 90 days. The grass was then collected, dried and weighed. All other variables were kept constant. The results are shown in Table 1.3. Table 1.3 mean mass of soil pH grass / g 4.5 7.5 5.0 9.5 5.5 11.1 6.0 12.5 6.5 13.4 (i) Plot a graph of the data in Table 1.3 on the grid in Fig. 1.3. Use a sharp pencil for drawing graphs. Fig. 1.3 (ii) Use Table 1.3 and the graph in (b)(i) to describe the trend in the data. ........................................................................................................................................... ........................................................................................................................................... ........................................................................................................................................... .......................................................................................................................................[2] (iii) Minerals from the soil enter a plant with the help of membrane-bound protein molecules. Suggest how a low pH could affect the growth of grass. ........................................................................................................................................... ........................................................................................................................................... ........................................................................................................................................... .......................................................................................................................................[2] [Total: 21]
Mark scheme: 1(a)(i) collects three lengths within the range given as whole numbers or to 0.5 ; 1 1(a)(ii) cut all to same length ; 1 1(a)(iii) stated volume of buffer ; 1 1(a)(iv) 1. (heading) pH ; 2. (heading for dependent) colour intensity ; 3. collects results for 5 pH values ; 4. correct trend in results ; 5. results recorded using (++) scale ; 5 1(a)(v) uses symbols to record results ; 1 1(a)(vi) correct answer from candidates results ; 1 1(a)(vii) colour standards or colorimeter or use more intermediate pH values ; 1 1(a)(vii)i use a thermostatically controlled water-bath ; use at least 5 different temperatures ; 2 1(b)(i) 1. label on x-axis soil pH + label on y-axis mean mass of grass (/) g ; 2. scale on x-axis 0.5 to 2 cm + labelled each 2 cm + scale on y-axis is 1 to 2 cm + labelled each 2 cm ; 3. correct plotting of 5 points with a small cross or dot in circle ; 4. smooth line, joined point to point, through 5 points / curve or line of best fit ; 4 Question Answer Marks 1(b)(ii) as the pH increases the mass of grass increases ; idea that the mass increases at a decreasing rate or correct data quotes to illustrate the trend ; 2 1(b)(iii) denatures proteins ; reduced absorption of minerals by active transport ; 2
Q2 · M1 is a slide of a stained transverse section through a plant leaf
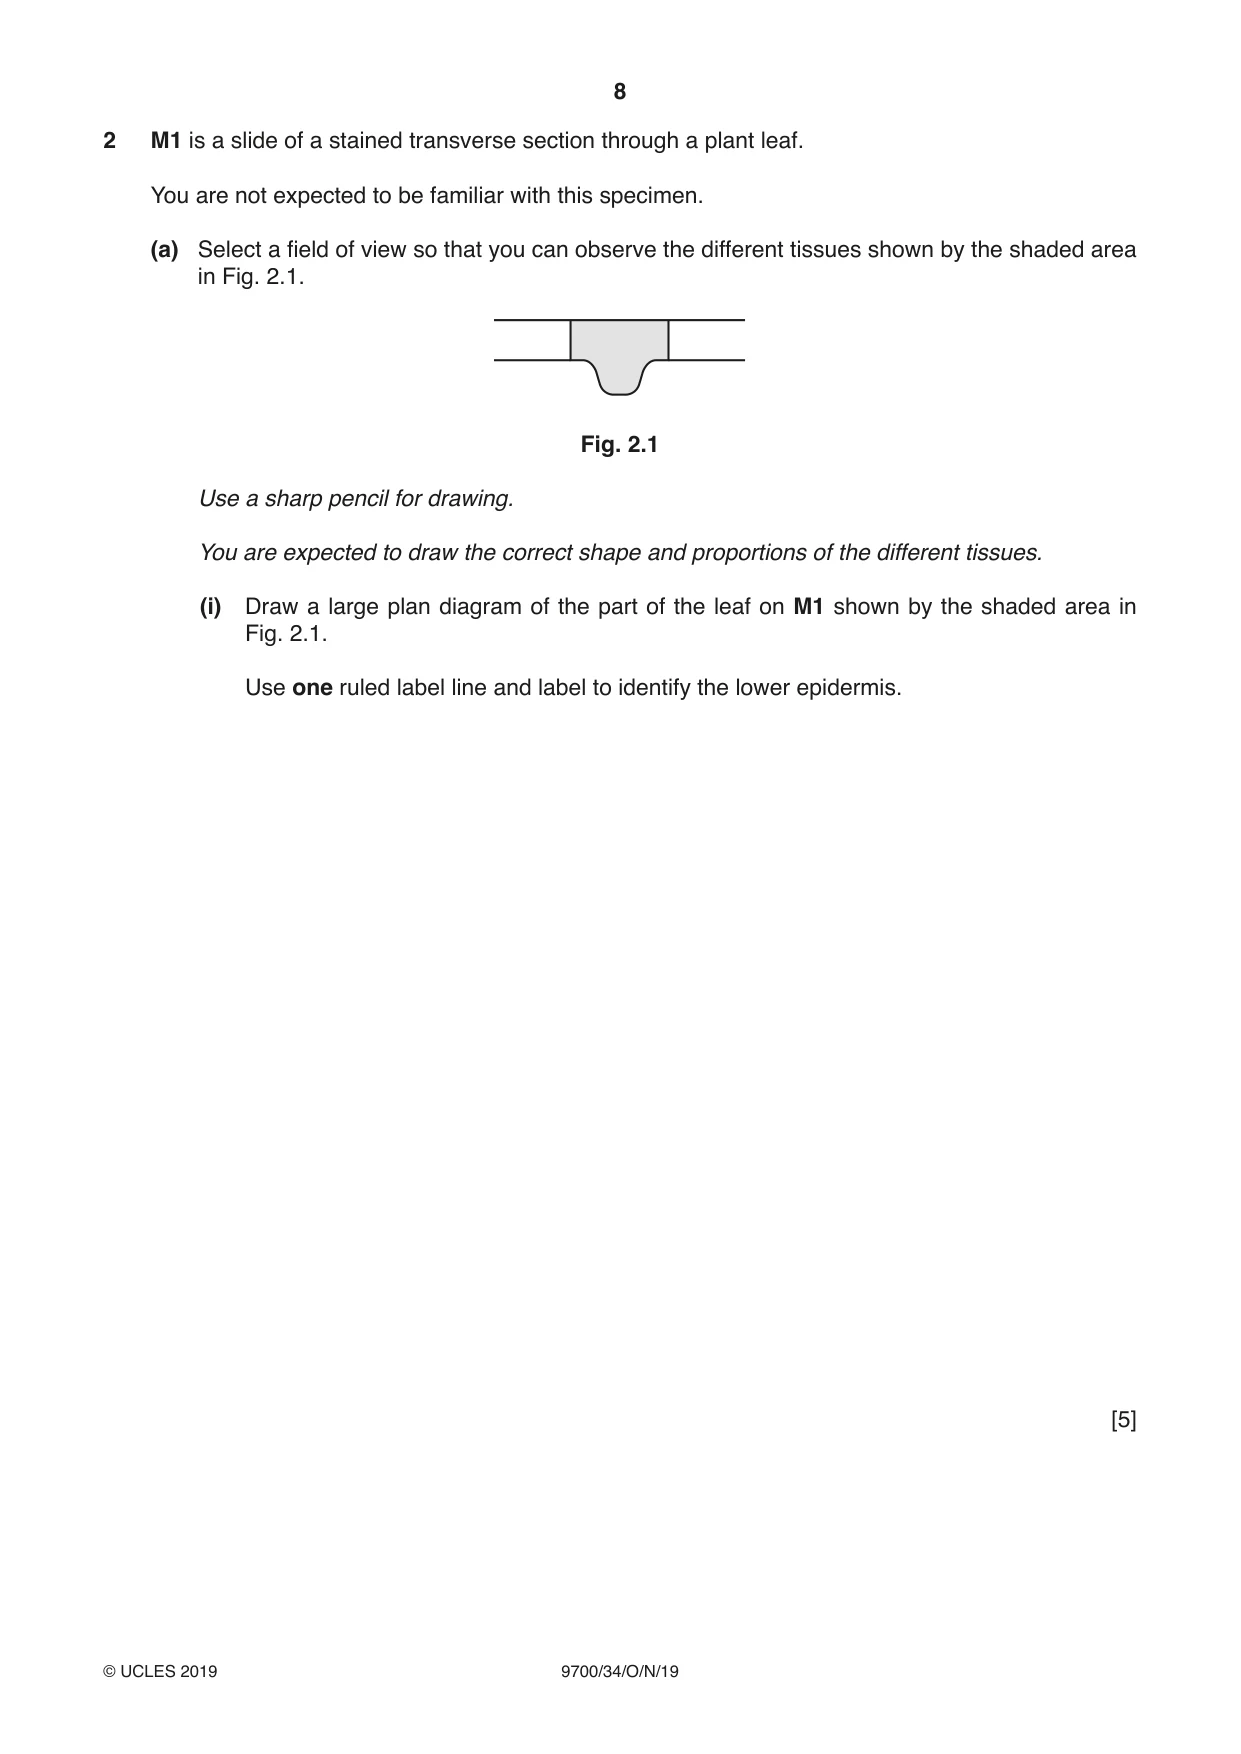
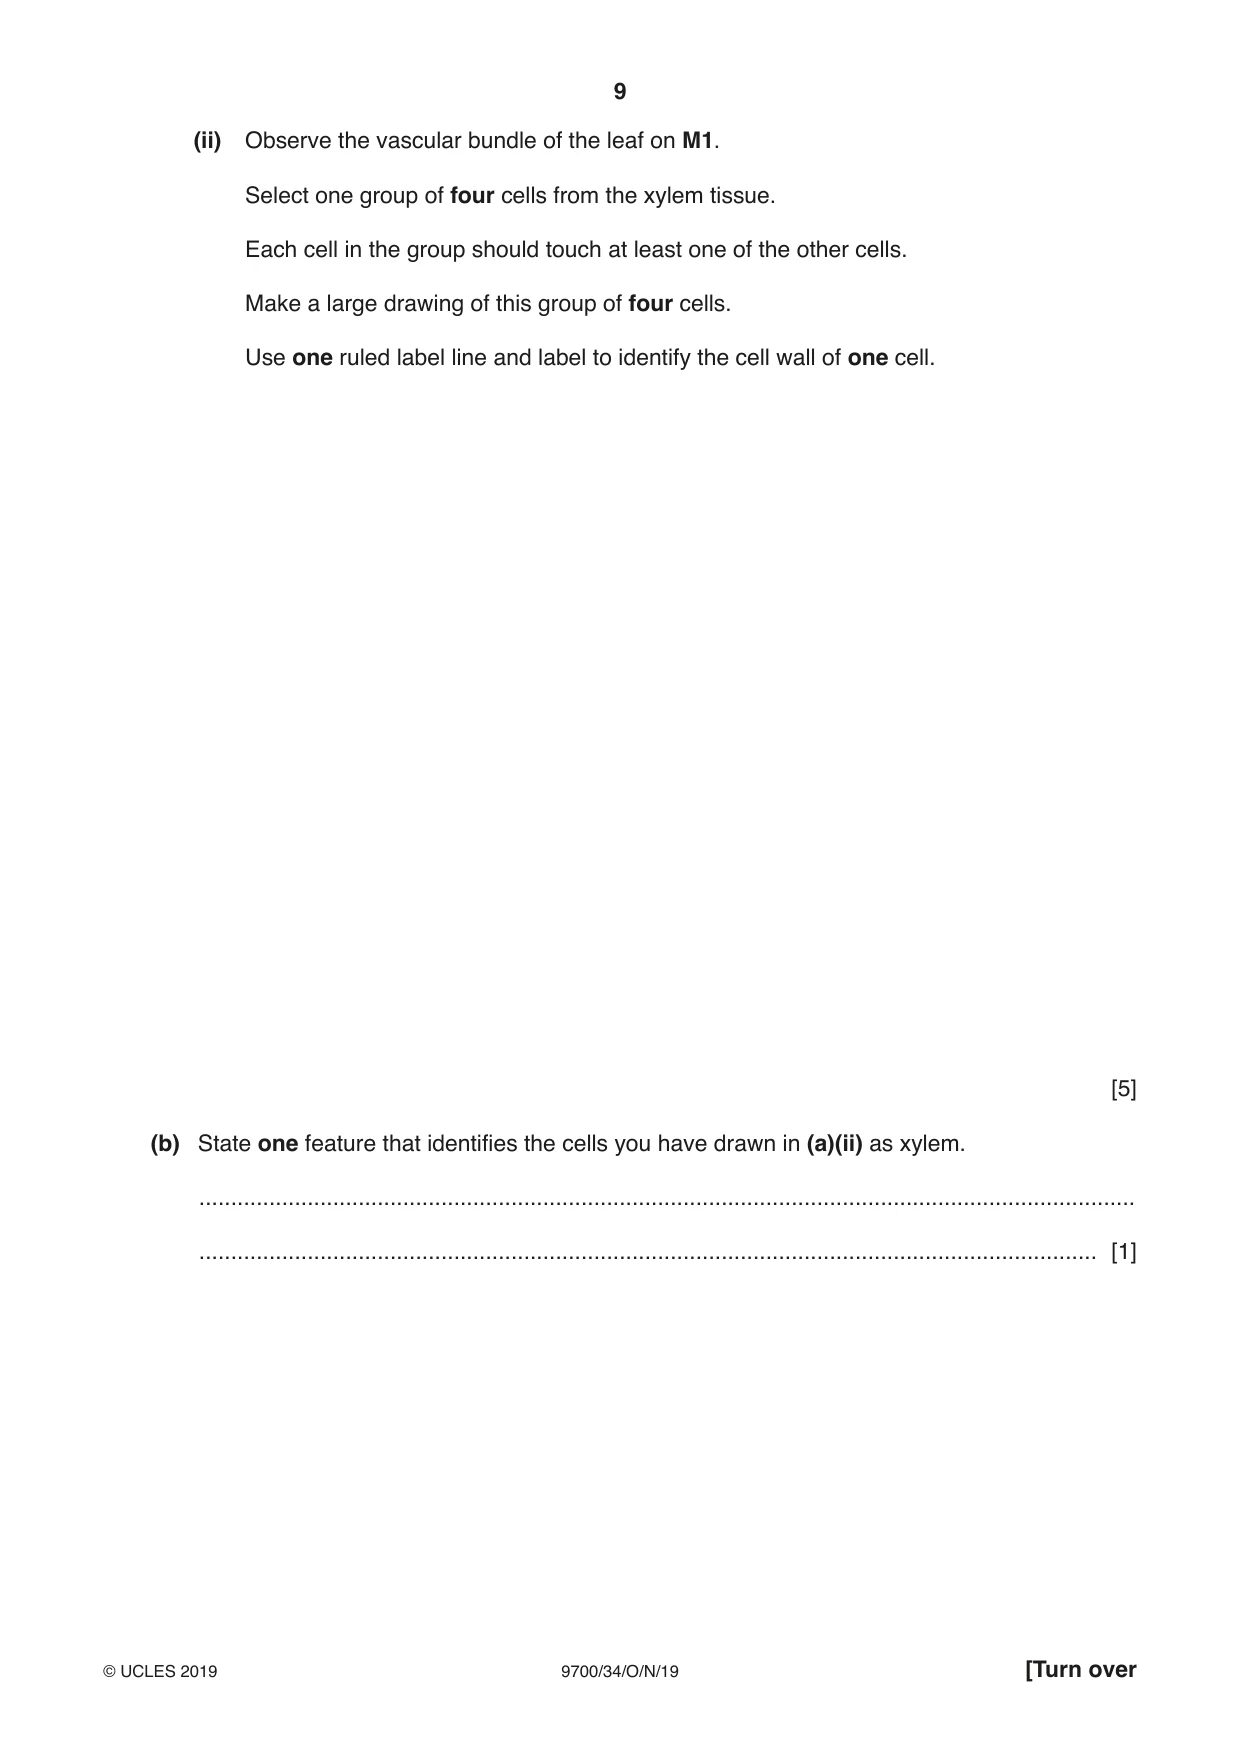
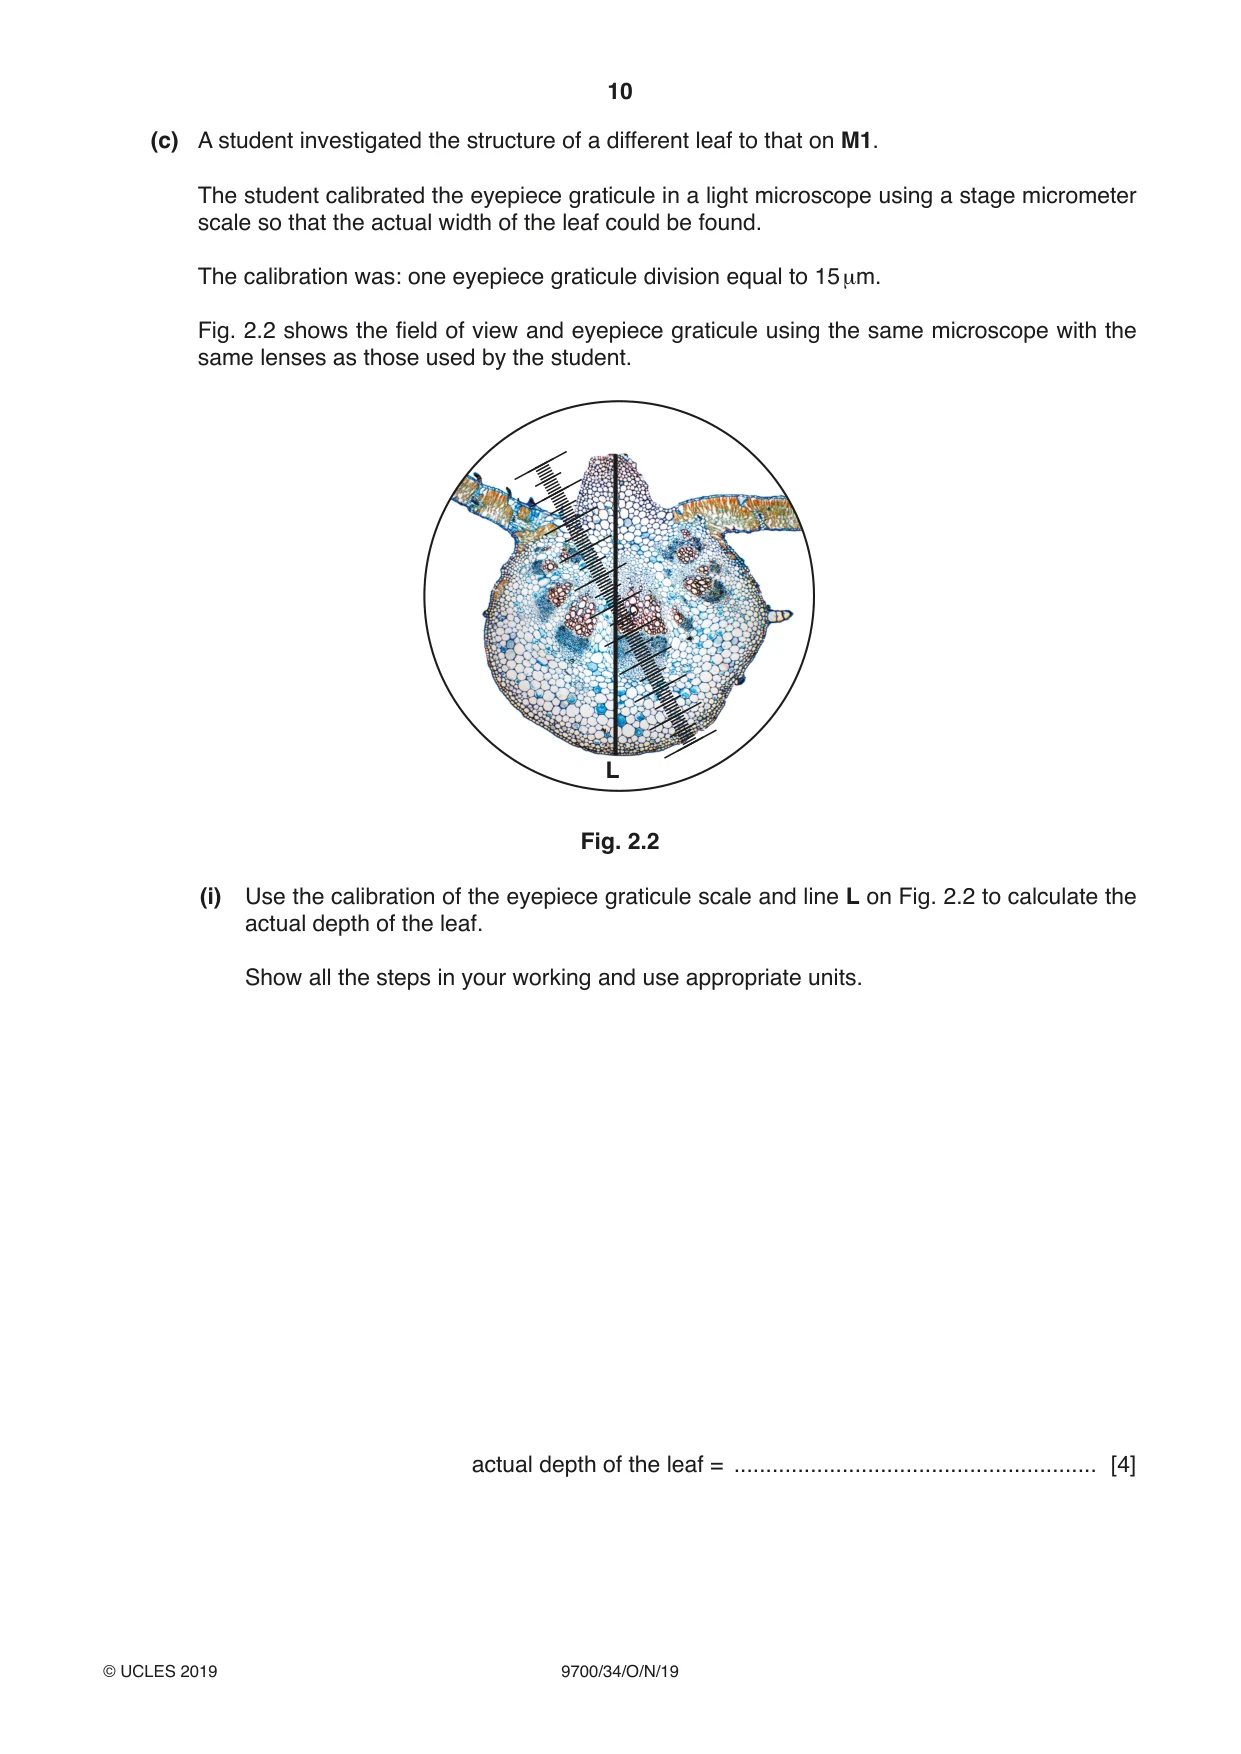
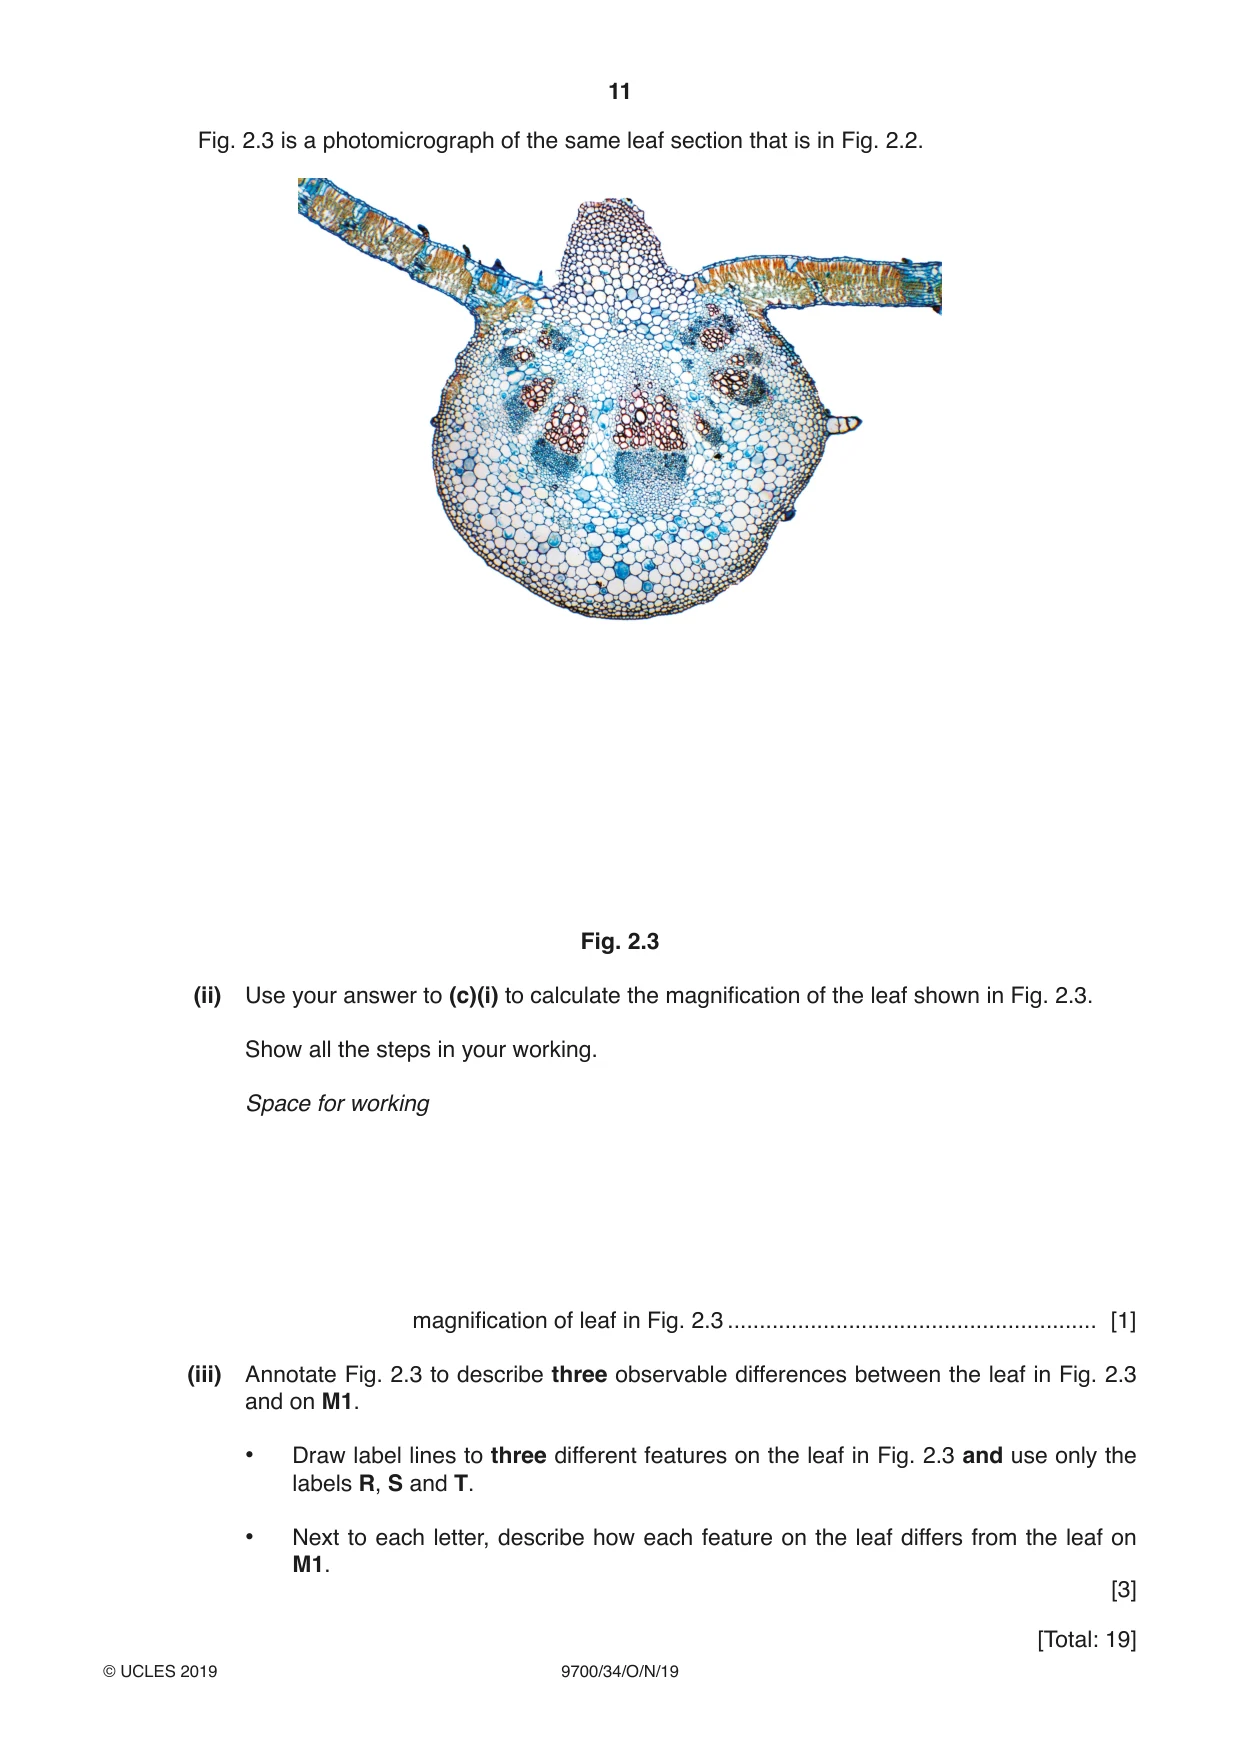
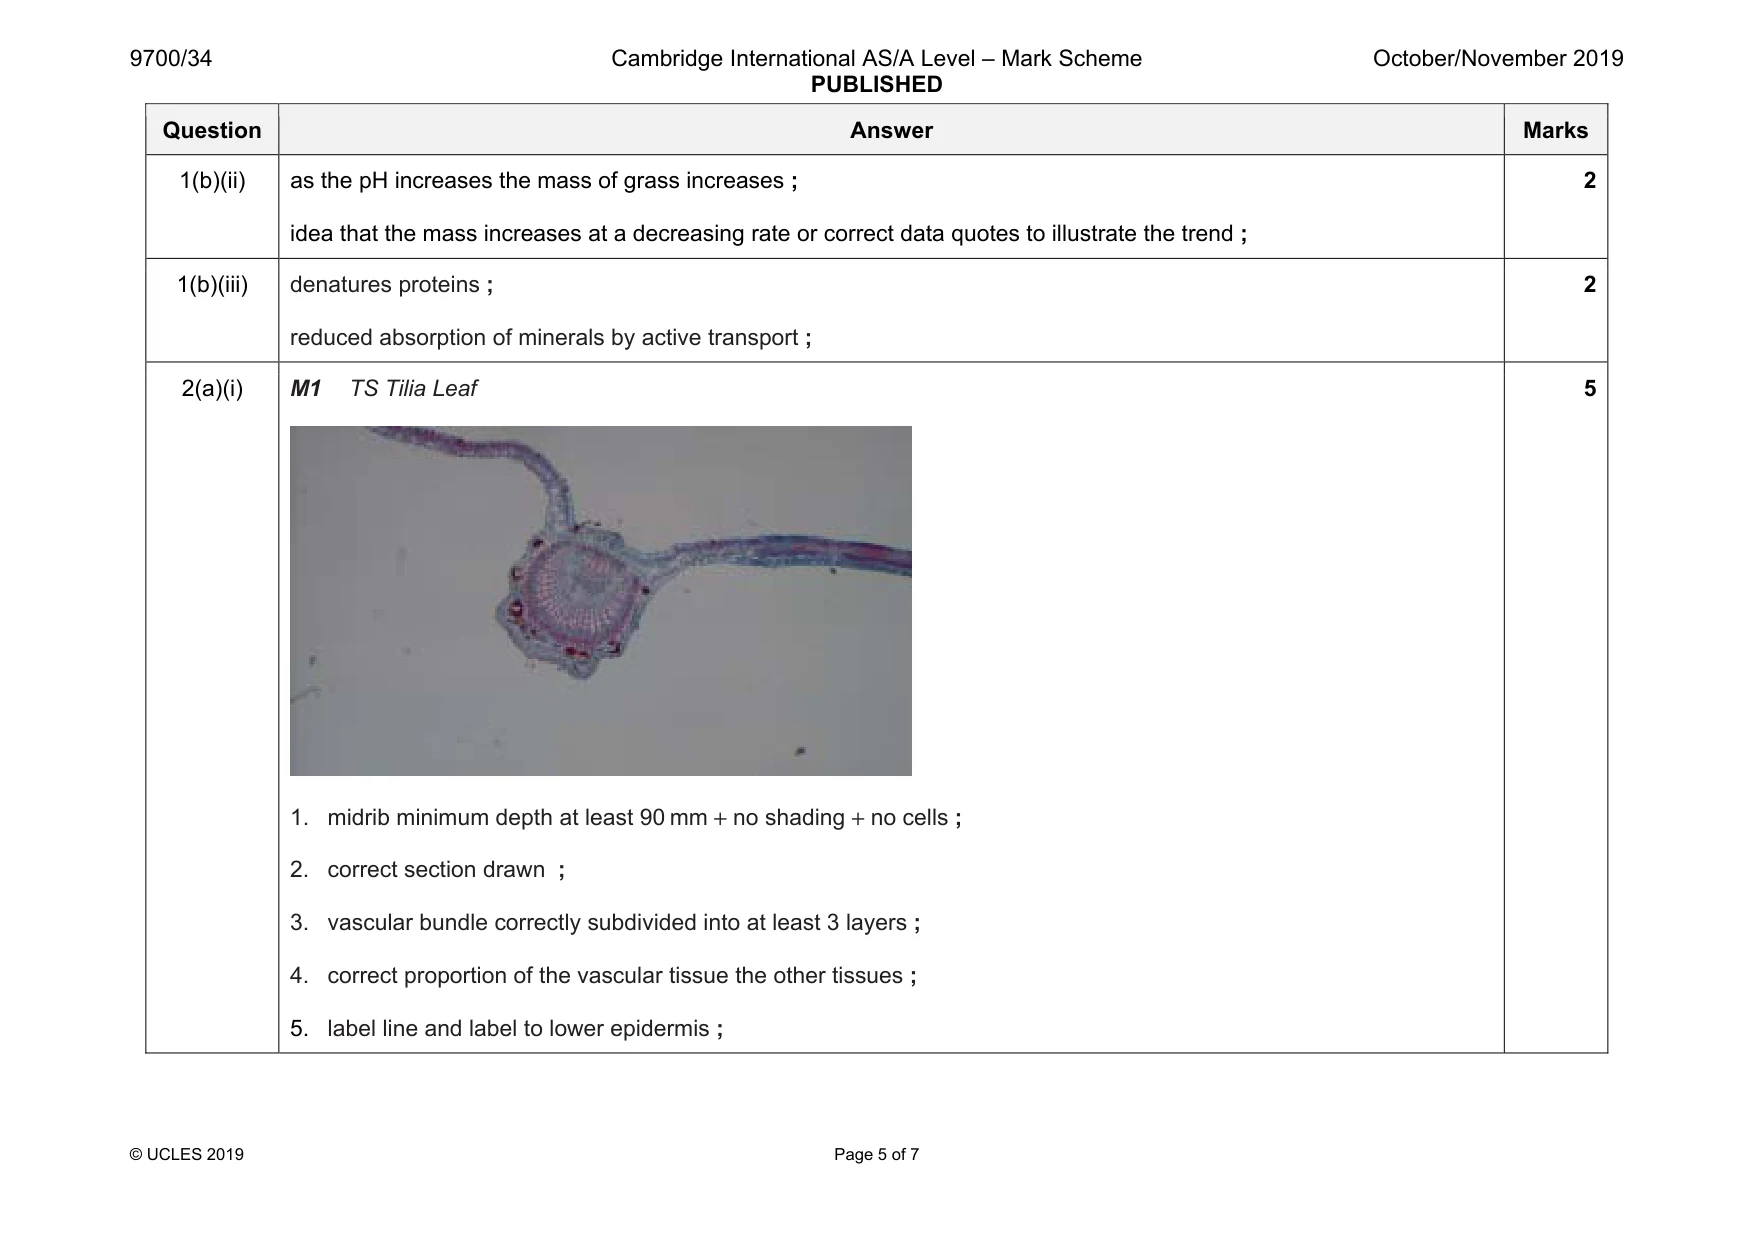
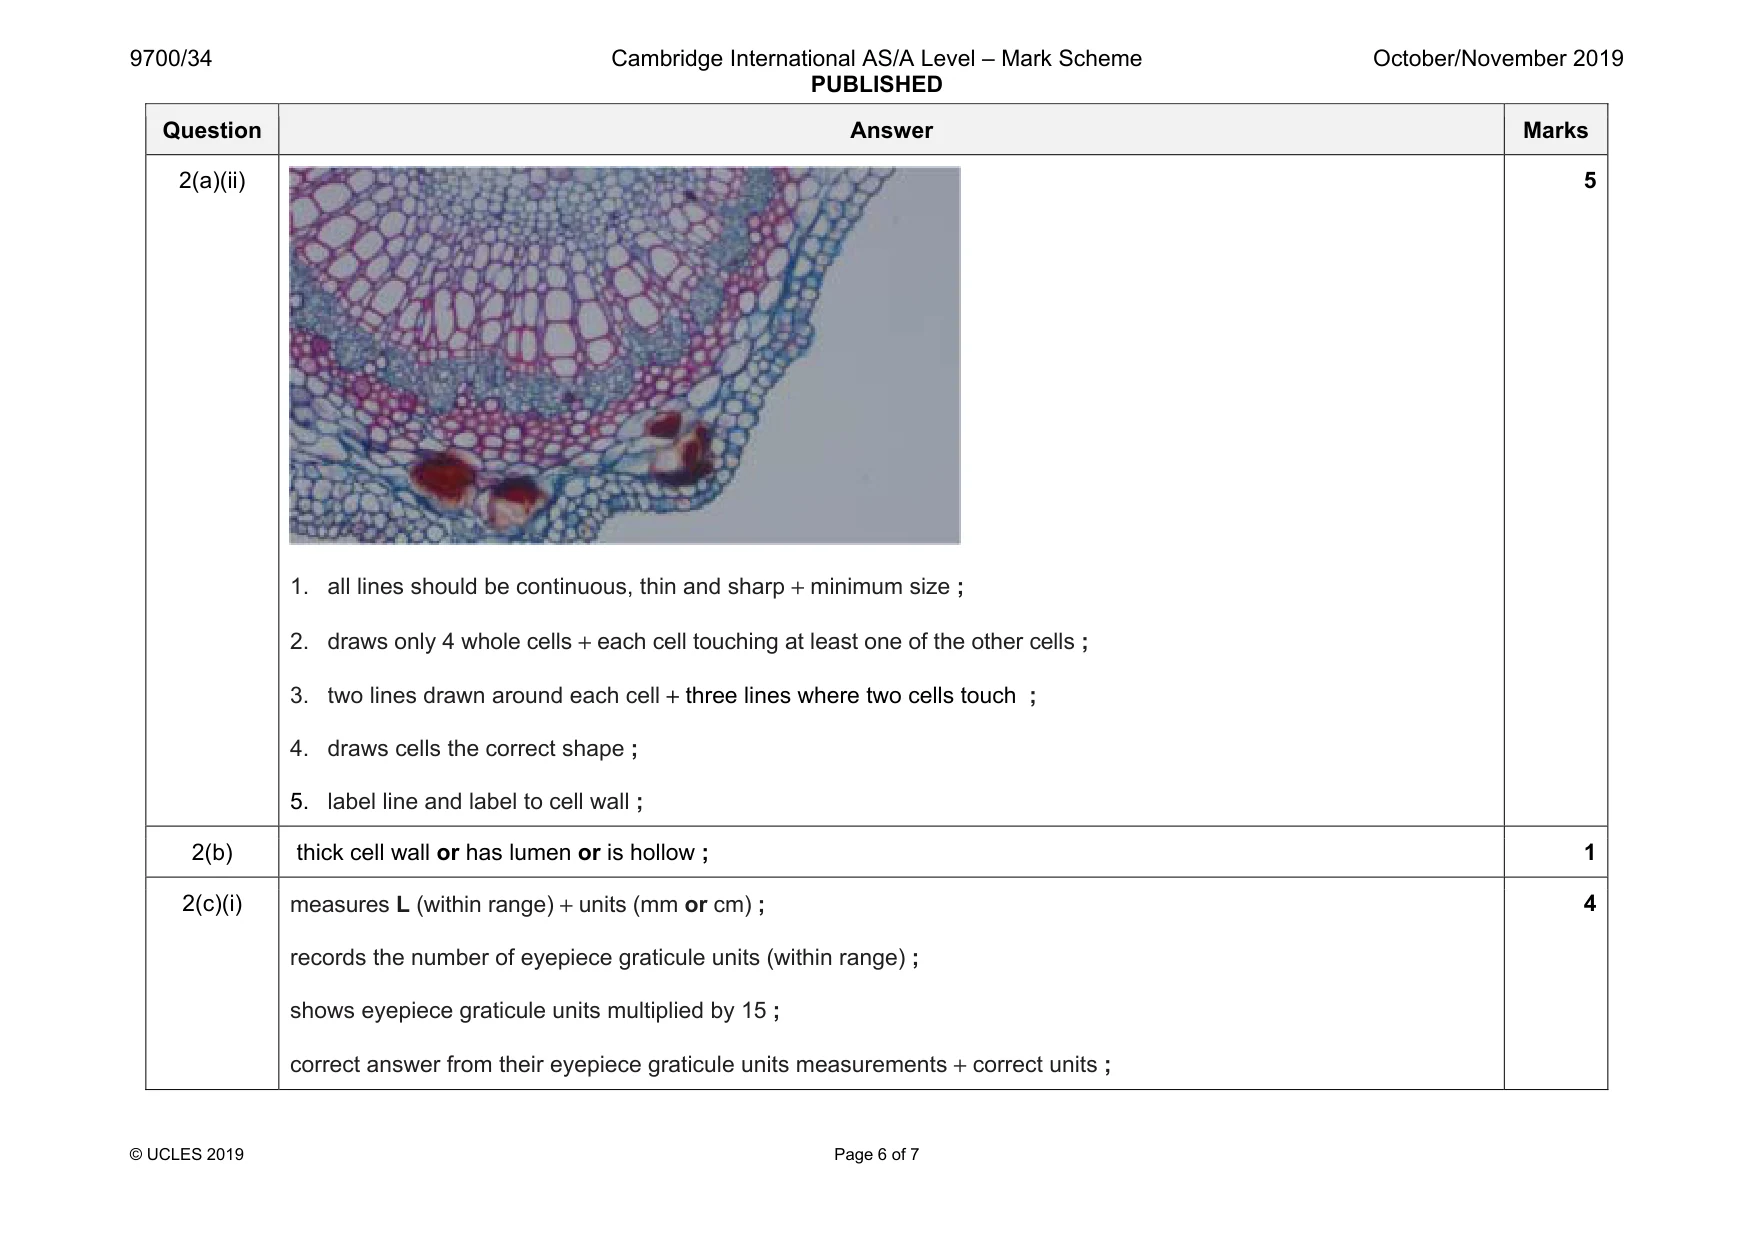
2 M1 is a slide of a stained transverse section through a plant leaf. You are not expected to be familiar with this specimen. (a) Select a field of view so that you can observe the different tissues shown by the shaded area in Fig. 2.1. Fig. 2.1 Use a sharp pencil for drawing. You are expected to draw the correct shape and proportions of the different tissues. (i) Draw a large plan diagram of the part of the leaf on M1 shown by the shaded area in Fig. 2.1. Use one ruled label line and label to identify the lower epidermis. [5] (ii) Observe the vascular bundle of the leaf on M1. Select one group of four cells from the xylem tissue. Each cell in the group should touch at least one of the other cells. Make a large drawing of this group of four cells. Use one ruled label line and label to identify the cell wall of one cell. [5] (b) State one feature that identifies the cells you have drawn in (a)(ii) as xylem. ................................................................................................................................................... ............................................................................................................................................. [1] (c) A student investigated the structure of a different leaf to that on M1. The student calibrated the eyepiece graticule in a light microscope using a stage micrometer scale so that the actual width of the leaf could be found. The calibration was: one eyepiece graticule division equal to 15 µm. Fig. 2.2 shows the field of view and eyepiece graticule using the same microscope with the same lenses as those used by the student. L Fig. 2.2 (i) Use the calibration of the eyepiece graticule scale and line L on Fig. 2.2 to calculate the actual depth of the leaf. Show all the steps in your working and use appropriate units. actual depth of the leaf = ......................................................... [4]
Mark scheme: 2(a)(i) M1 TS Tilia Leaf 1. midrib minimum depth at least 90 mm + no shading + no cells ; 2. correct section drawn ; 3. vascular bundle correctly subdivided into at least 3 layers ; 4. correct proportion of the vascular tissue the other tissues ; 5. label line and label to lower epidermis ; 5 Question Answer Marks 2(a)(ii) 1. all lines should be continuous, thin and sharp + minimum size ; 2. draws only 4 whole cells + each cell touching at least one of the other cells ; 3. two lines drawn around each cell + three lines where two cells touch ; 4. draws cells the correct shape ; 5. label line and label to cell wall ; 5 2(b) thick cell wall or has lumen or is hollow ; 1 2(c)(i) measures L (within range) + units (mm or cm) ; records the number of eyepiece graticule units (within range) ; shows eyepiece graticule units multiplied by 15 ; correct answer from their eyepiece graticule units measurements + correct units ; 4 Question Answer Marks 2(c)(ii) shows depth of Fig 2.3 divided by answer to (c)(i) ; 1 2(c)(iii) annotates 3 correct features on Fig 2.3 using labels R, S and T ;;; e.g. Fig 2.3 is more rounded than J1 3
What was in this paper
The subtopics covered by these 2 questions, and how many questions each got. Open one in a new tab to see every Cambridge question on it.
What you needed in this session
Cambridge’s own grade thresholds for 2019 Oct/Nov, Paper 3 · Variant 4. A higher threshold means an easier paper — the bar moves with how the cohort did.