Cambridge A Level Biology 9700 — 2019 Oct/Nov Paper 3 · Variant 1
9700/31/O/N/19 · 2 questions · 40 marks · ≈45 min
The question paper and its mark scheme, free to read here and free to download. This is Cambridge’s own paper, exactly as it was sat.
Question paper12 pages


Mark scheme6 pages
Answers below. Sit the paper first if you are practising.

Questions as text
Q1 · Beetroot is a root vegetable that contains a red pigment in its cells
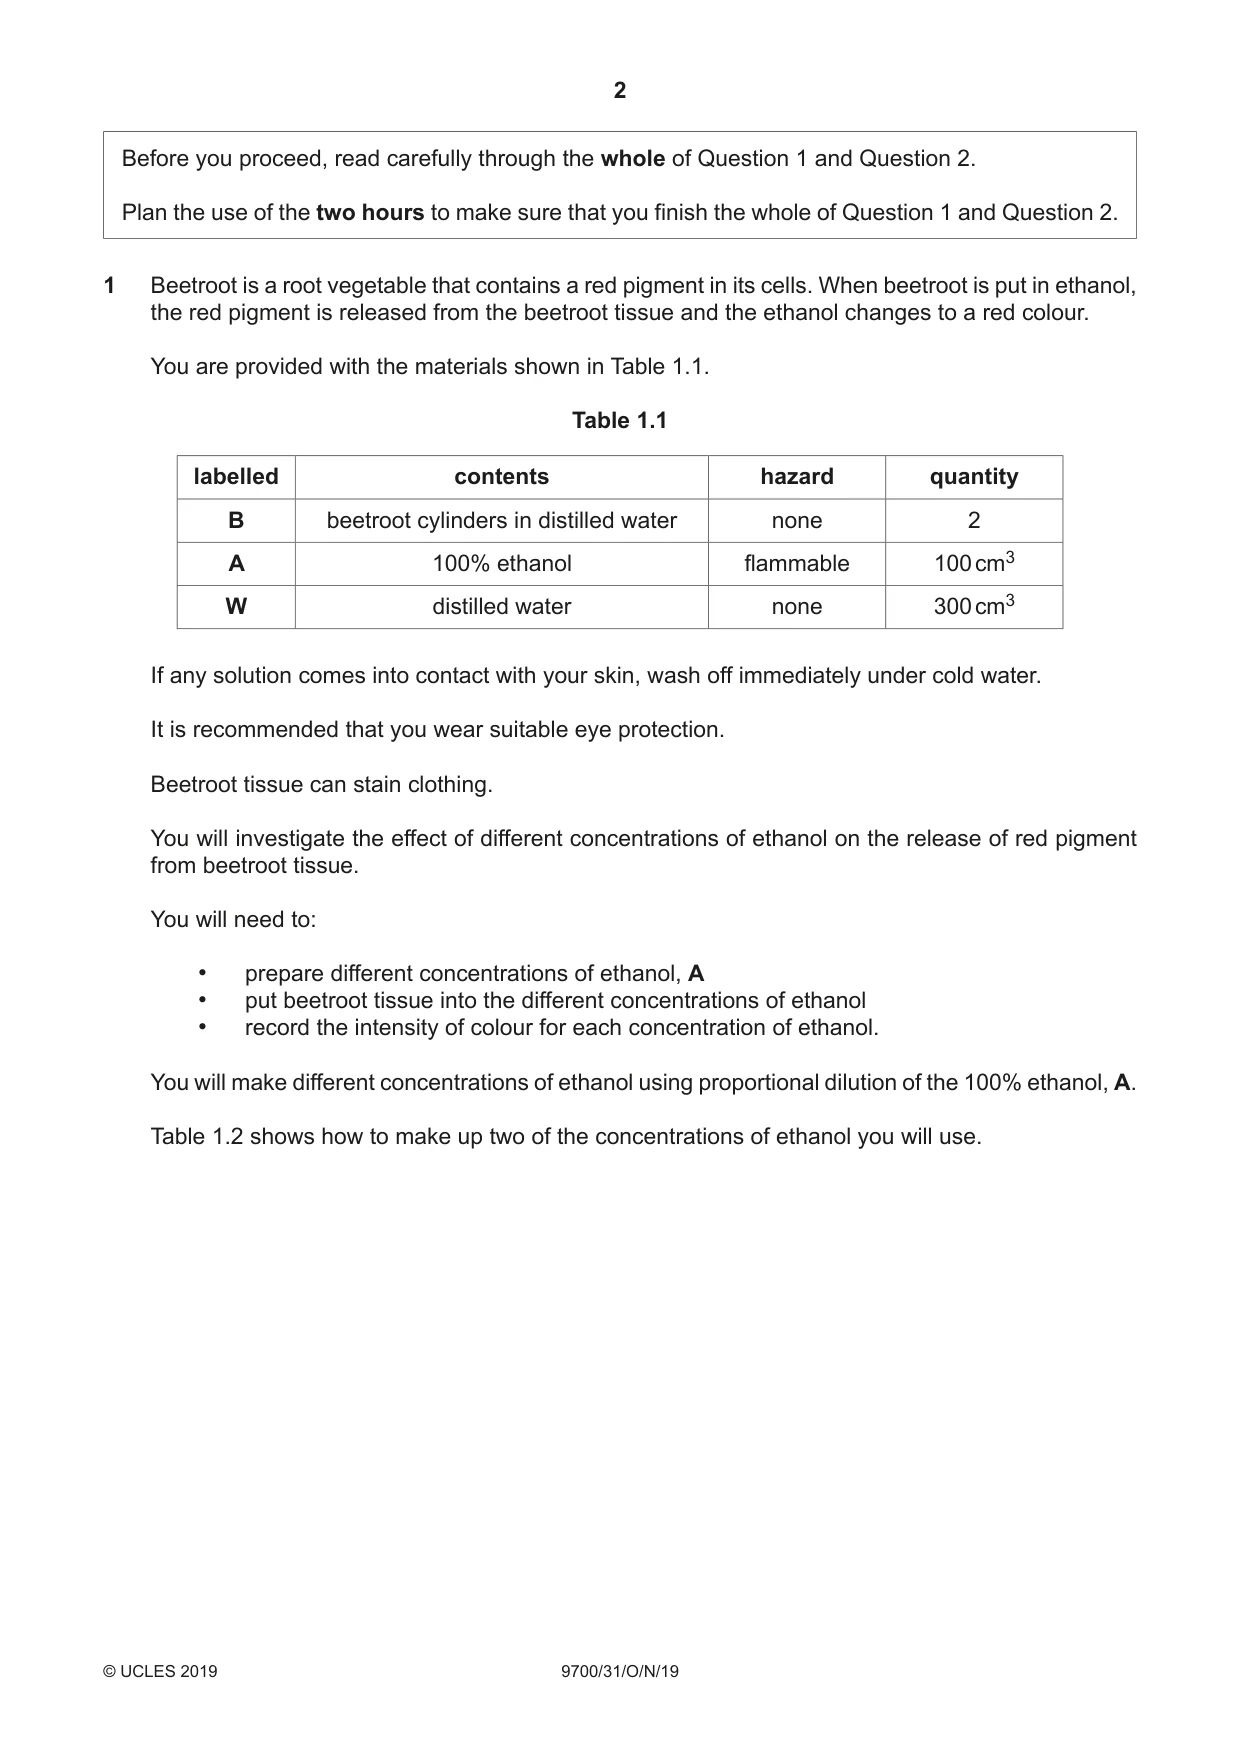
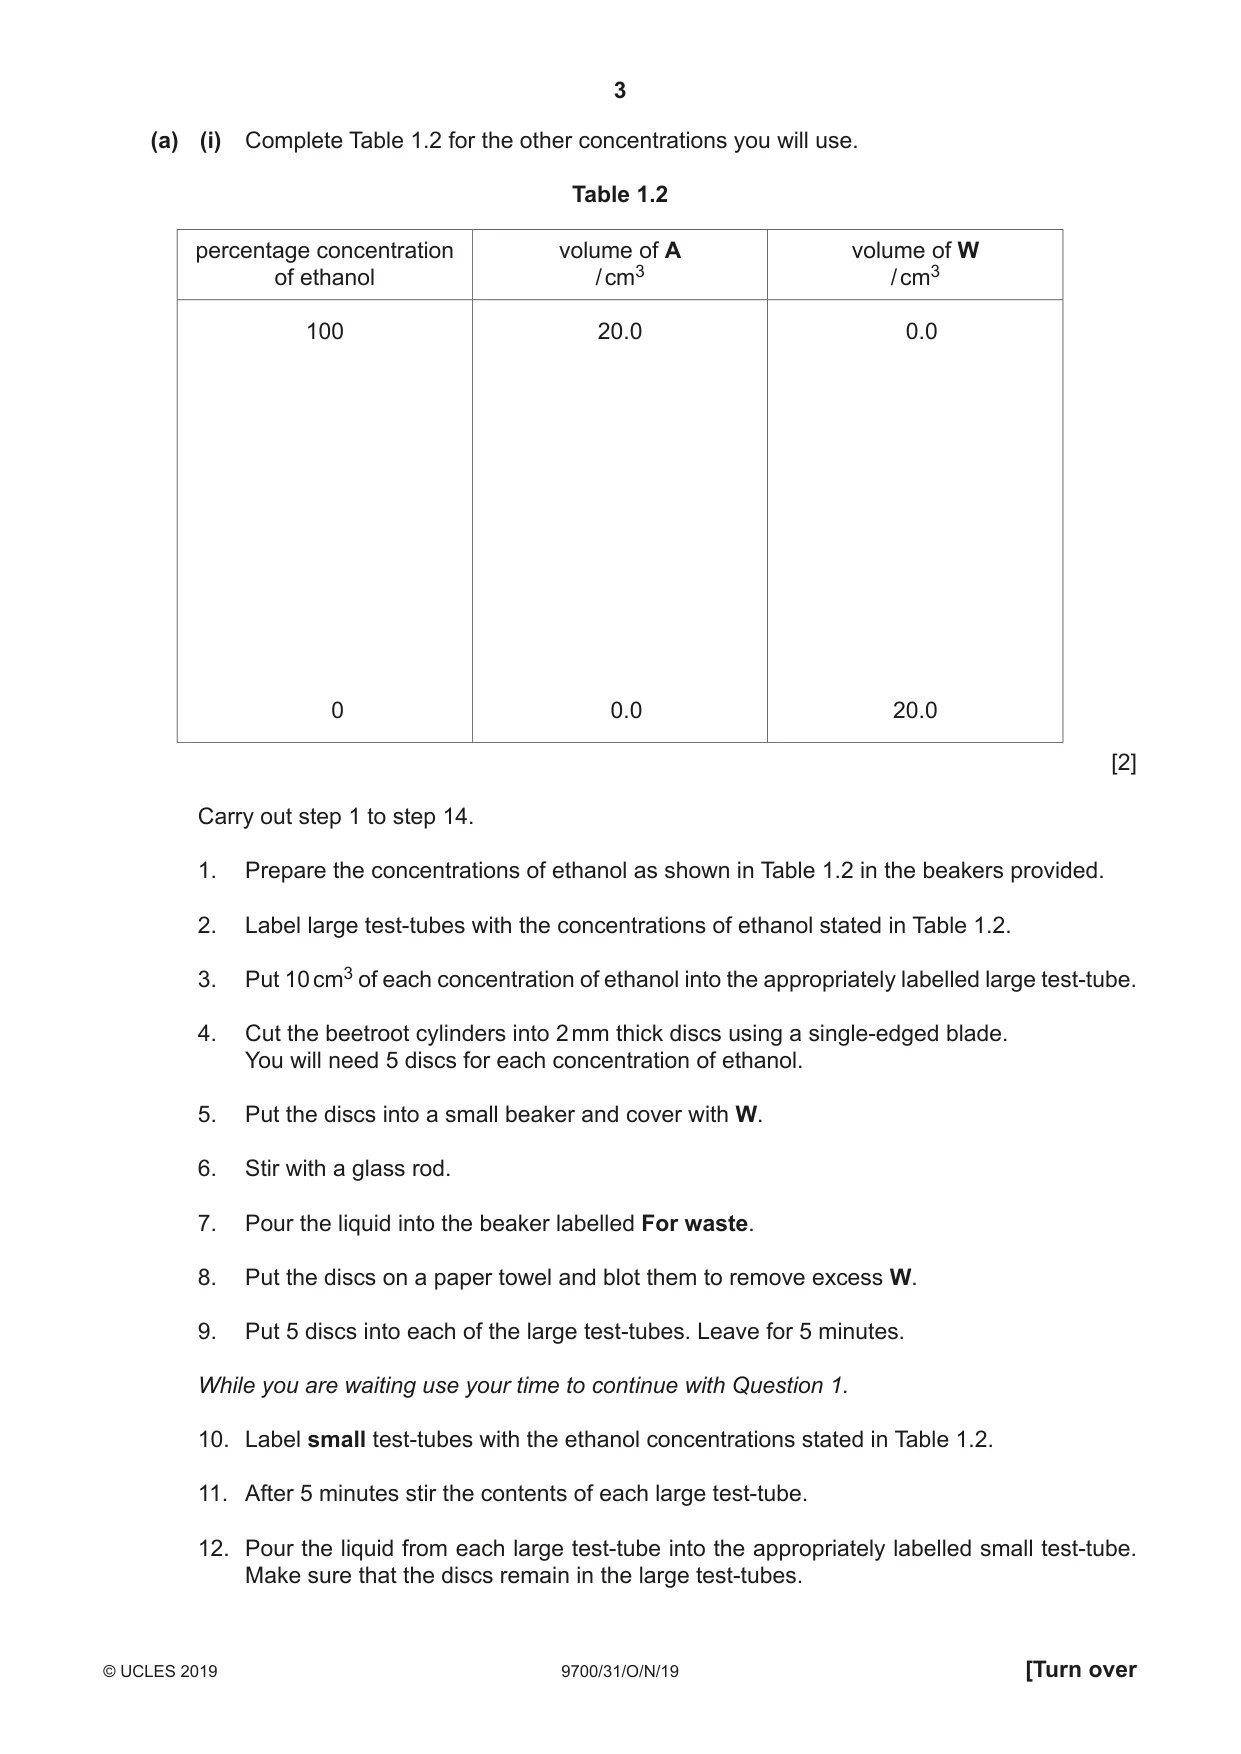
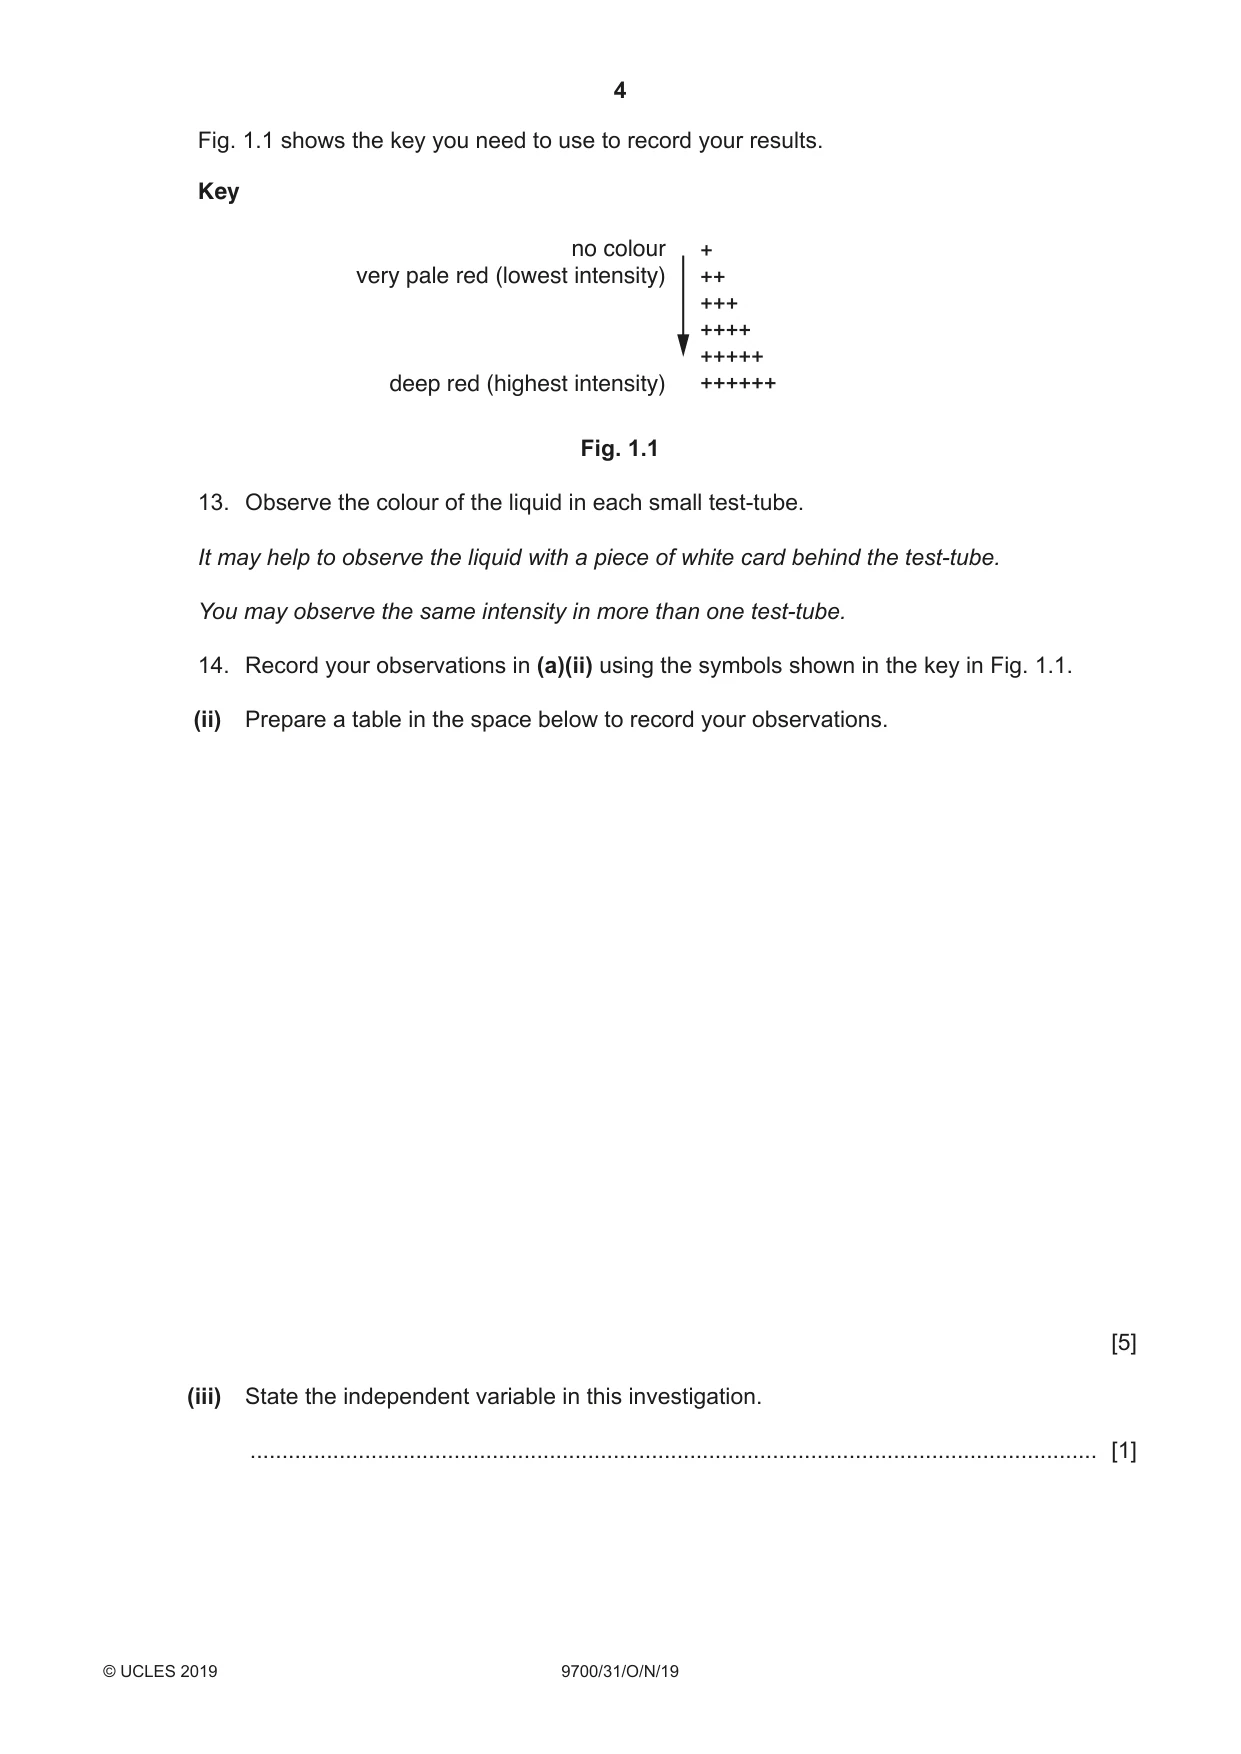
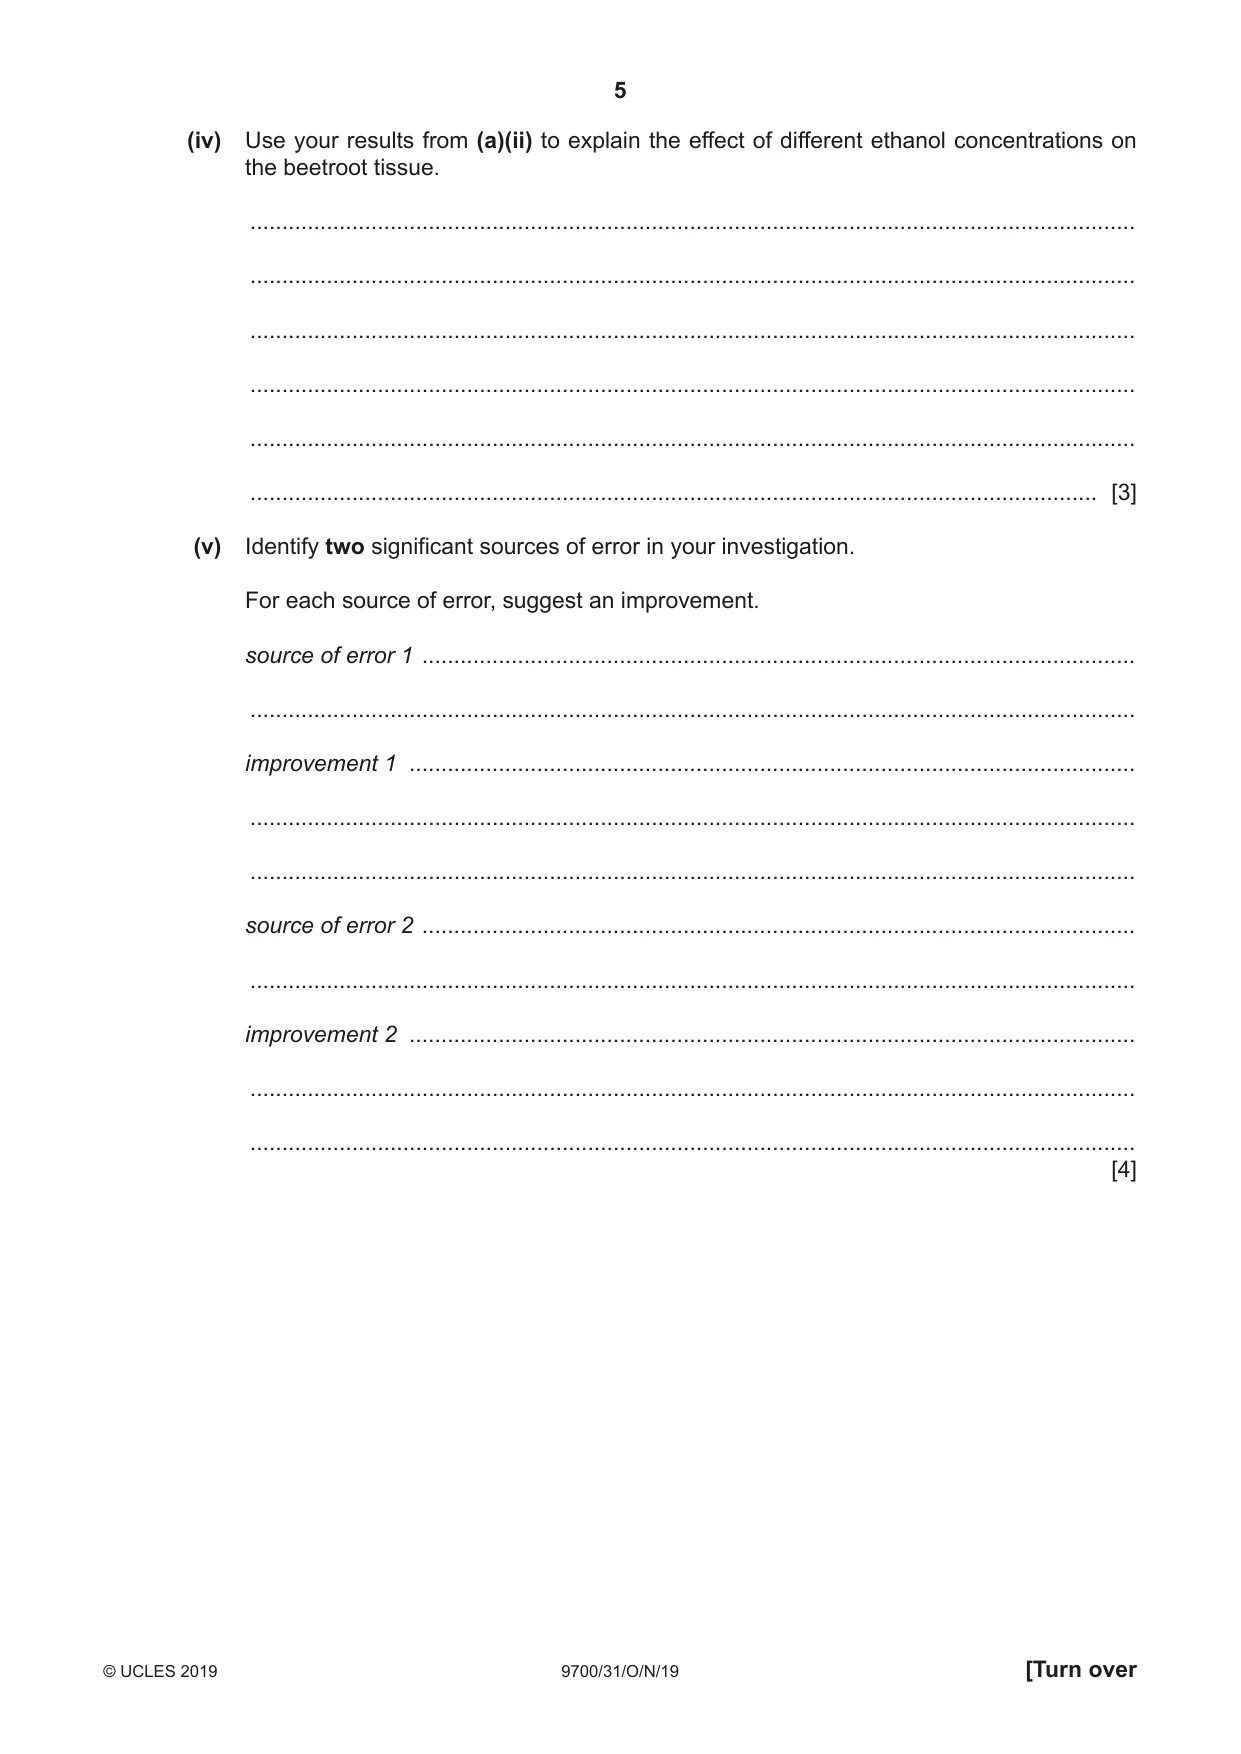
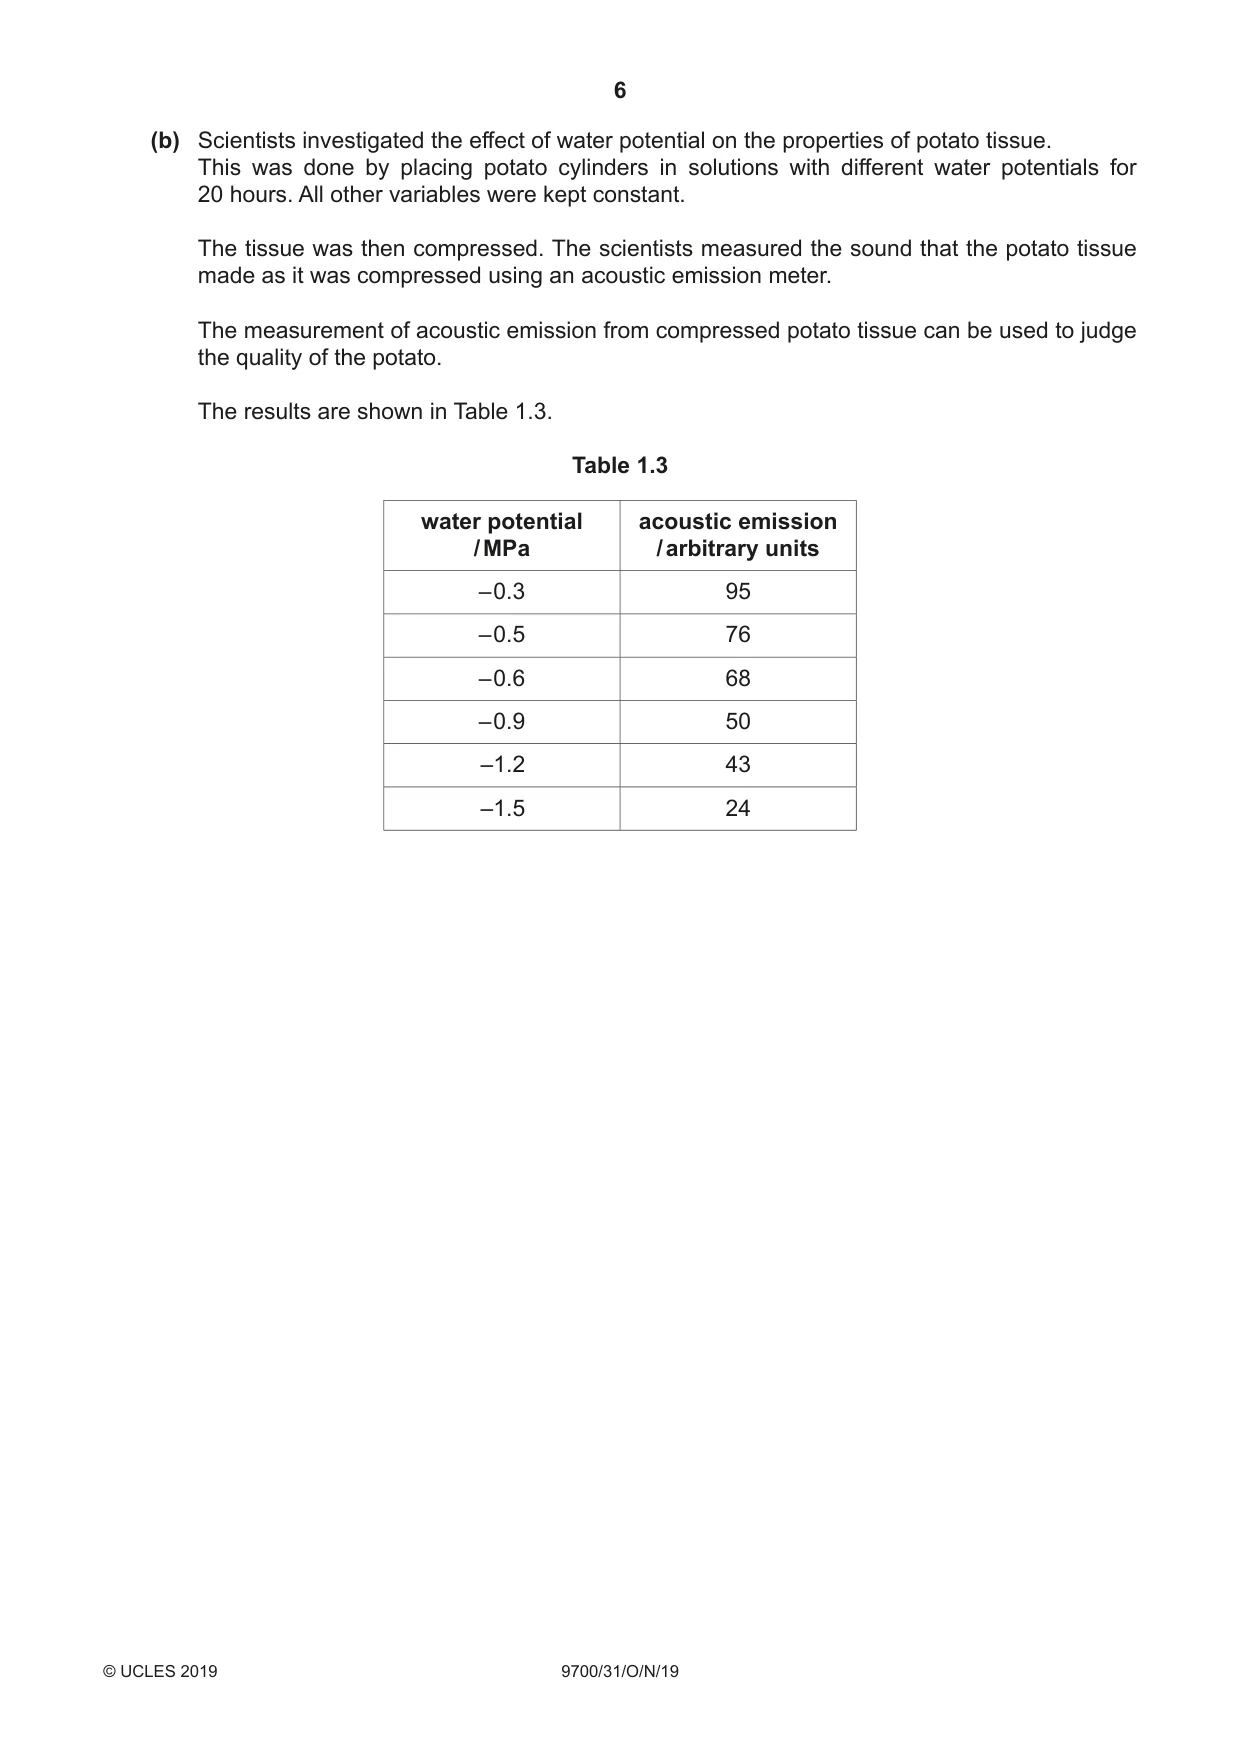
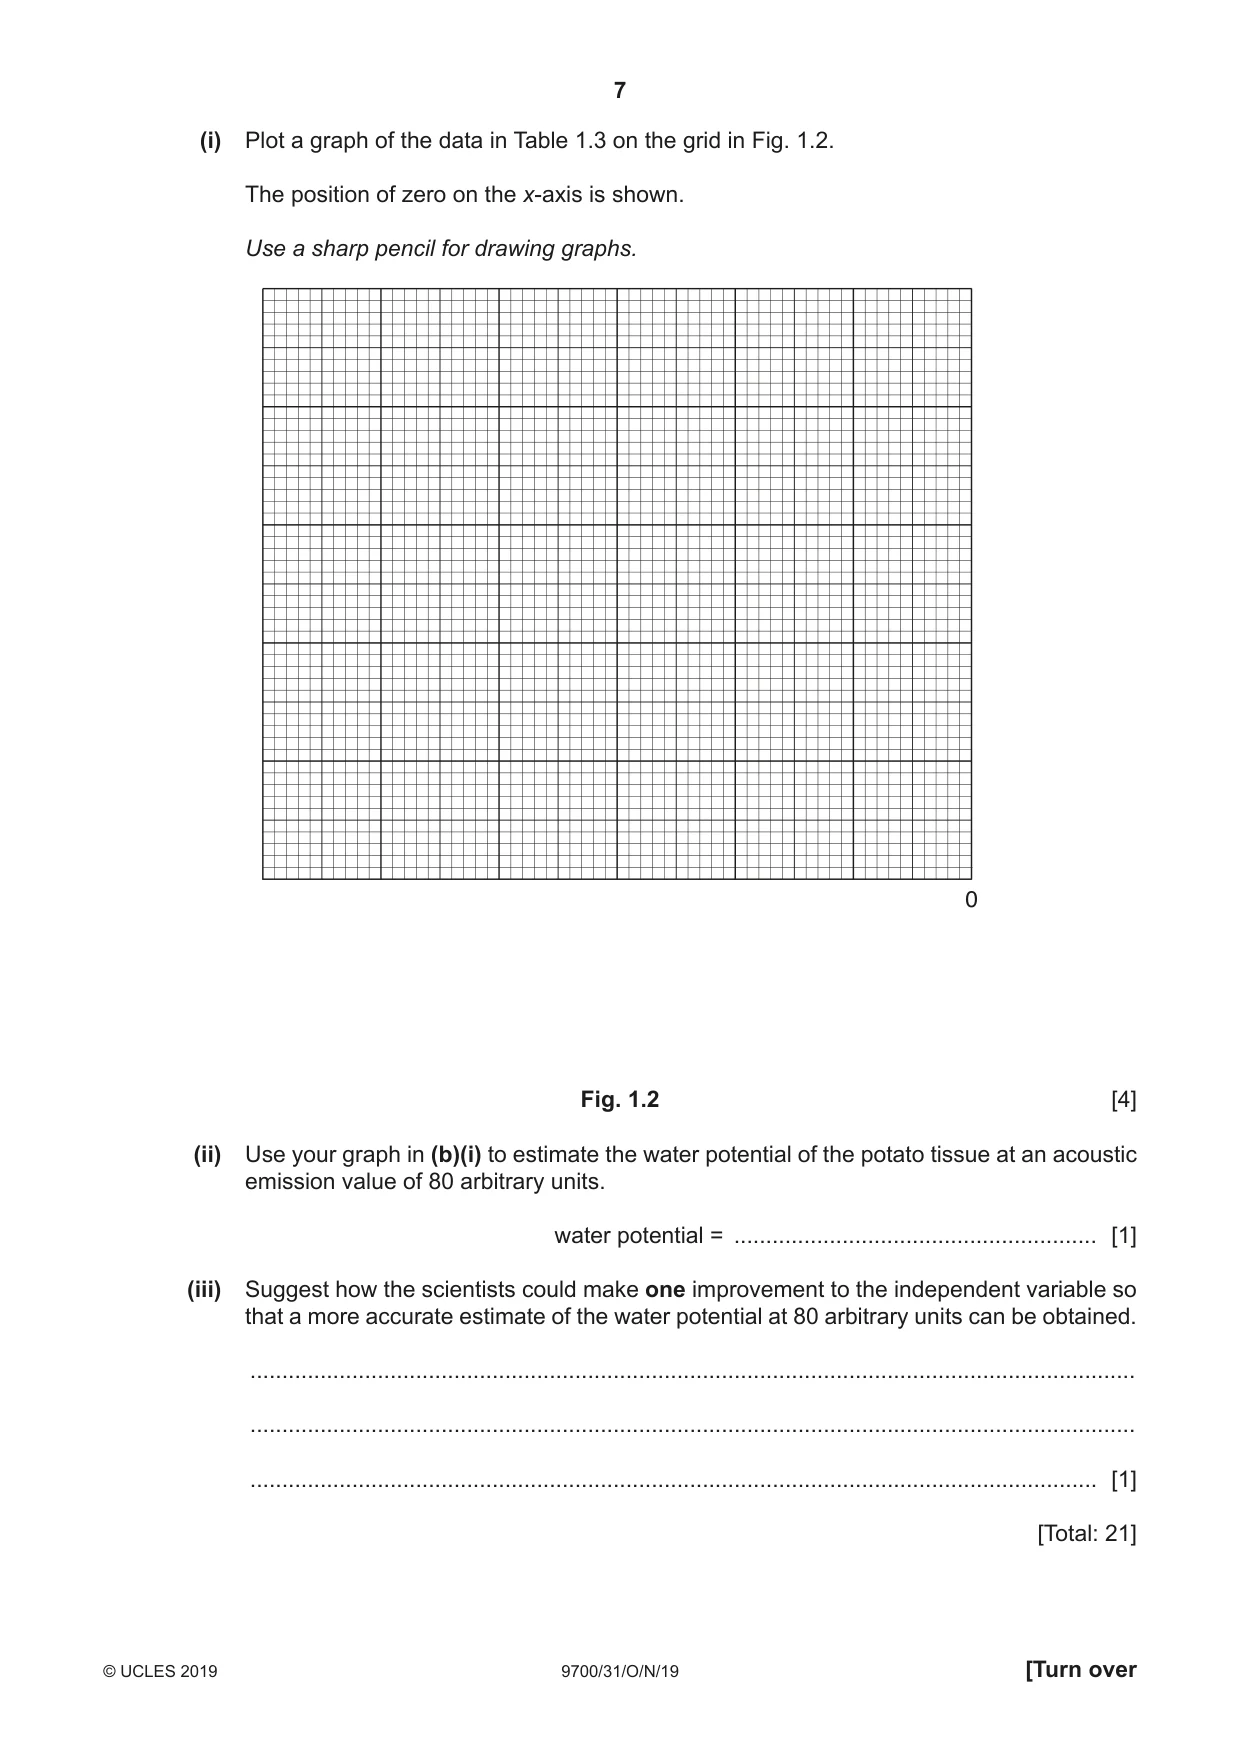
1 Beetroot is a root vegetable that contains a red pigment in its cells. When beetroot is put in ethanol, the red pigment is released from the beetroot tissue and the ethanol changes to a red colour. You are provided with the materials shown in Table 1.1. Table 1.1 labelled contents hazard quantity B beetroot cylinders in distilled water none 2 A 100% ethanol flammable 100 cm3 W distilled water none 300 cm3 If any solution comes into contact with your skin, wash off immediately under cold water. It is recommended that you wear suitable eye protection. Beetroot tissue can stain clothing. You will investigate the effect of different concentrations of ethanol on the release of red pigment from beetroot tissue. You will need to: • prepare different concentrations of ethanol, A • put beetroot tissue into the different concentrations of ethanol • record the intensity of colour for each concentration of ethanol. You will make different concentrations of ethanol using proportional dilution of the 100% ethanol, A. Table 1.2 shows how to make up two of the concentrations of ethanol you will use. (a) (i) Complete Table 1.2 for the other concentrations you will use. Table 1.2 percentage concentration volume of A volume of W of ethanol / cm3 / cm3 100 20.0 0.0 0 0.0 20.0 [2] Carry out step 1 to step 14. 1. Prepare the concentrations of ethanol as shown in Table 1.2 in the beakers provided. 2. Label large test-tubes with the concentrations of ethanol stated in Table 1.2. 3. Put 10 cm3 of each concentration of ethanol into the appropriately labelled large test-tube. 4. Cut the beetroot cylinders into 2 mm thick discs using a single-edged blade. You will need 5 discs for each concentration of ethanol. 5. Put the discs into a small beaker and cover with W. 6. Stir with a glass rod. 7. Pour the liquid into the beaker labelled For waste. 8. Put the discs on a paper towel and blot them to remove excess W. 9. Put 5 discs into each of the large test-tubes. Leave for 5 minutes. While you are waiting use your time to continue with Question 1. 10. Label small test-tubes with the ethanol concentrations stated in Table 1.2. 11. After 5 minutes stir the contents of each large test-tube. 12. Pour the liquid from each large test-tube into the appropriately labelled small test-tube. Make sure that the discs remain in the large test-tubes. Fig. 1.1 shows the key you need to use to record your results. Key no colour very pale red (lowest intensity) deep red (highest intensity) Fig. 1.1 13. Observe the colour of the liquid in each small test-tube. It may help to observe the liquid with a piece of white card behind the test-tube. You may observe the same intensity in more than one test-tube. 14. Record your observations in (a)(ii) using the symbols shown in the key in Fig. 1.1. (ii) Prepare a table in the space below to record your observations. [5] (iii) State the independent variable in this investigation. ..................................................................................................................................... [1] (iv) Use your results from (a)(ii) to explain the effect of different ethanol concentrations on the beetroot tissue. ........................................................................................................................................... ........................................................................................................................................... ........................................................................................................................................... ........................................................................................................................................... ........................................................................................................................................... ..................................................................................................................................... [3] (v) Identify two significant sources of error in your investigation. For each source of error, suggest an improvement. source of error 1 ................................................................................................................ ........................................................................................................................................... improvement 1 .................................................................................................................. ........................................................................................................................................... ........................................................................................................................................... source of error 2 ................................................................................................................ ........................................................................................................................................... improvement 2 .................................................................................................................. ........................................................................................................................................... ........................................................................................................................................... [4] (b) Scientists investigated the effect of water potential on the properties of potato tissue. This was done by placing potato cylinders in solutions with different water potentials for 20 hours. All other variables were kept constant. The tissue was then compressed. The scientists measured the sound that the potato tissue made as it was compressed using an acoustic emission meter. The measurement of acoustic emission from compressed potato tissue can be used to judge the quality of the potato. The results are shown in Table 1.3. Table 1.3 water potential acoustic emission / MPa / arbitrary units – 0.3 95 – 0.5 76 – 0.6 68 – 0.9 50 –1.2 43 –1.5 24 (i) Plot a graph of the data in Table 1.3 on the grid in Fig. 1.2. The position of zero on the x-axis is shown. Use a sharp pencil for drawing graphs. 0 Fig. 1.2 [4] (ii) Use your graph in (b)(i) to estimate the water potential of the potato tissue at an acoustic emission value of 80 arbitrary units. water potential = ......................................................... [1] (iii) Suggest how the scientists could make one improvement to the independent variable so that a more accurate estimate of the water potential at 80 arbitrary units can be obtained. ........................................................................................................................................... ........................................................................................................................................... ..................................................................................................................................... [1] [Total: 21]
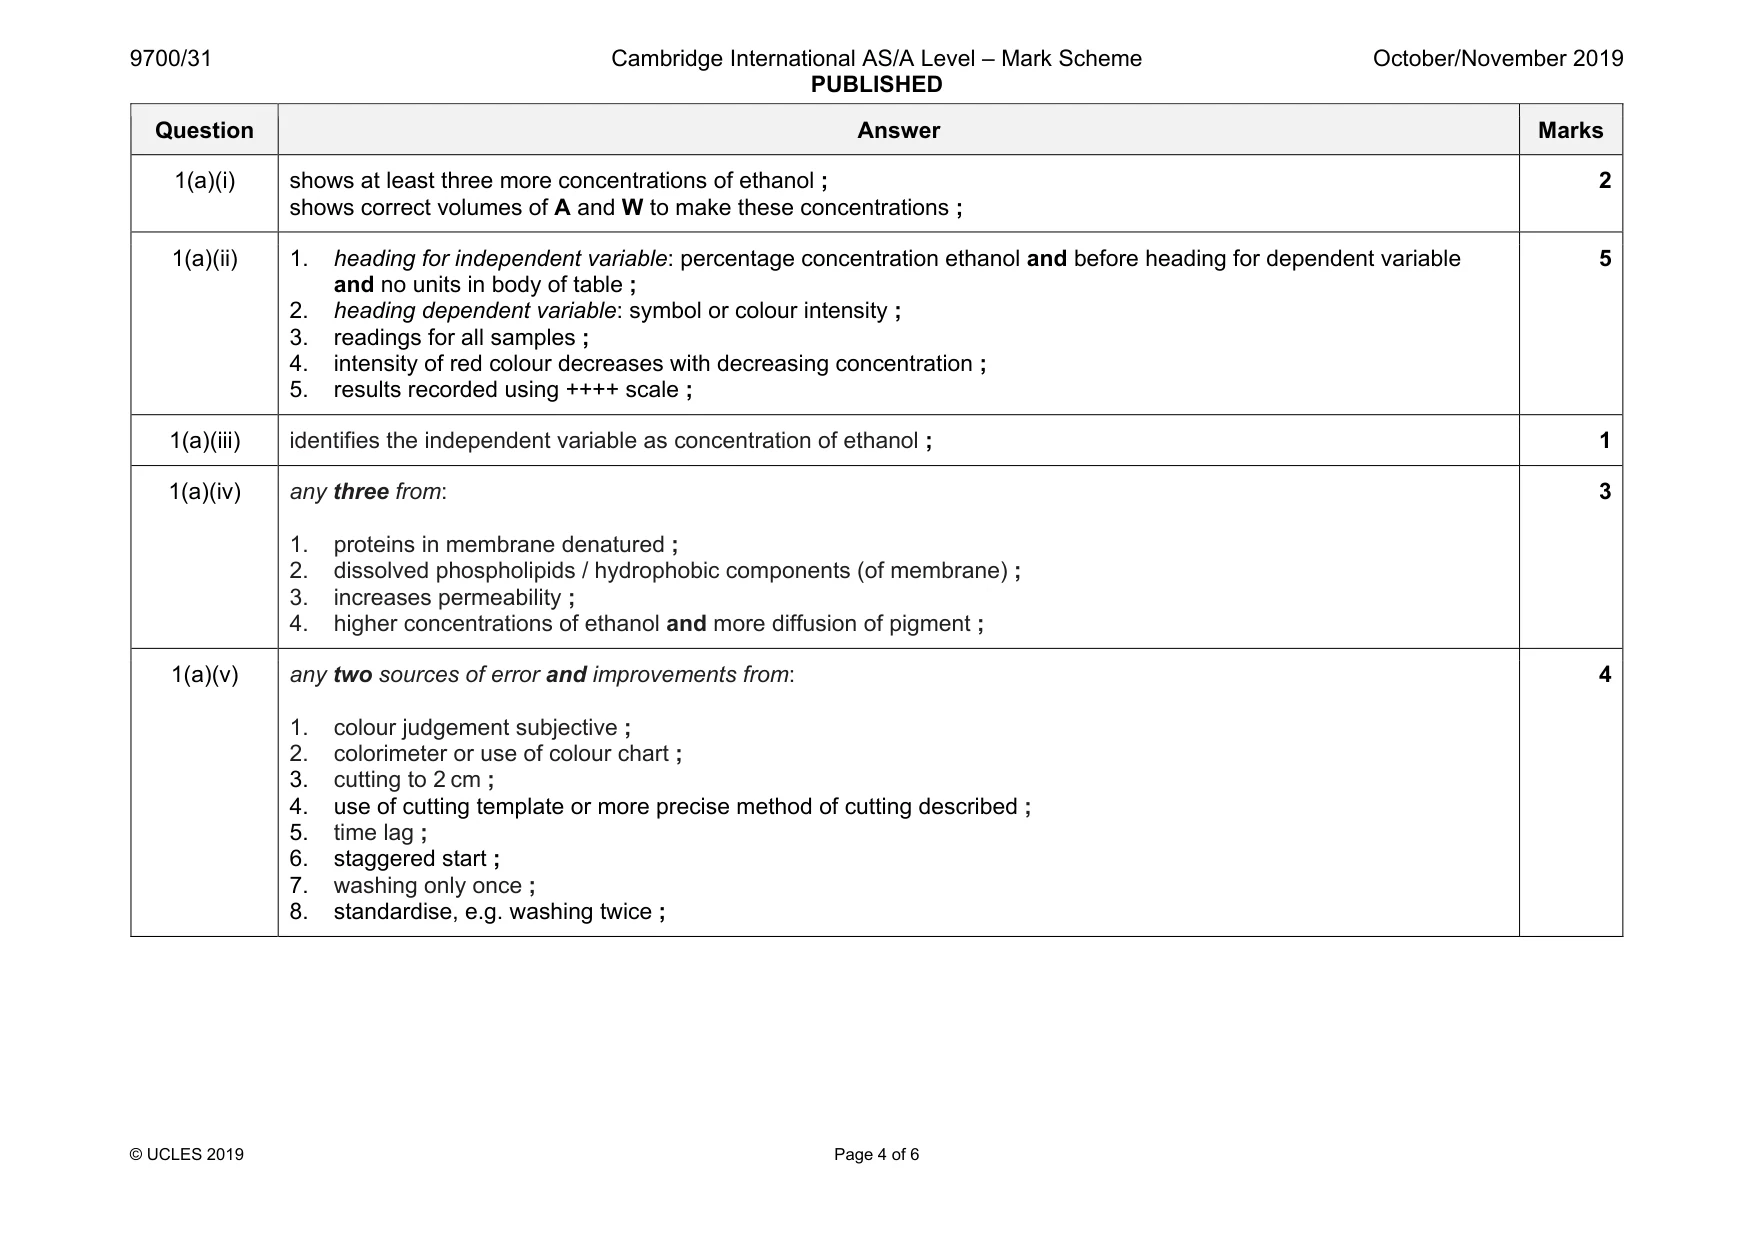
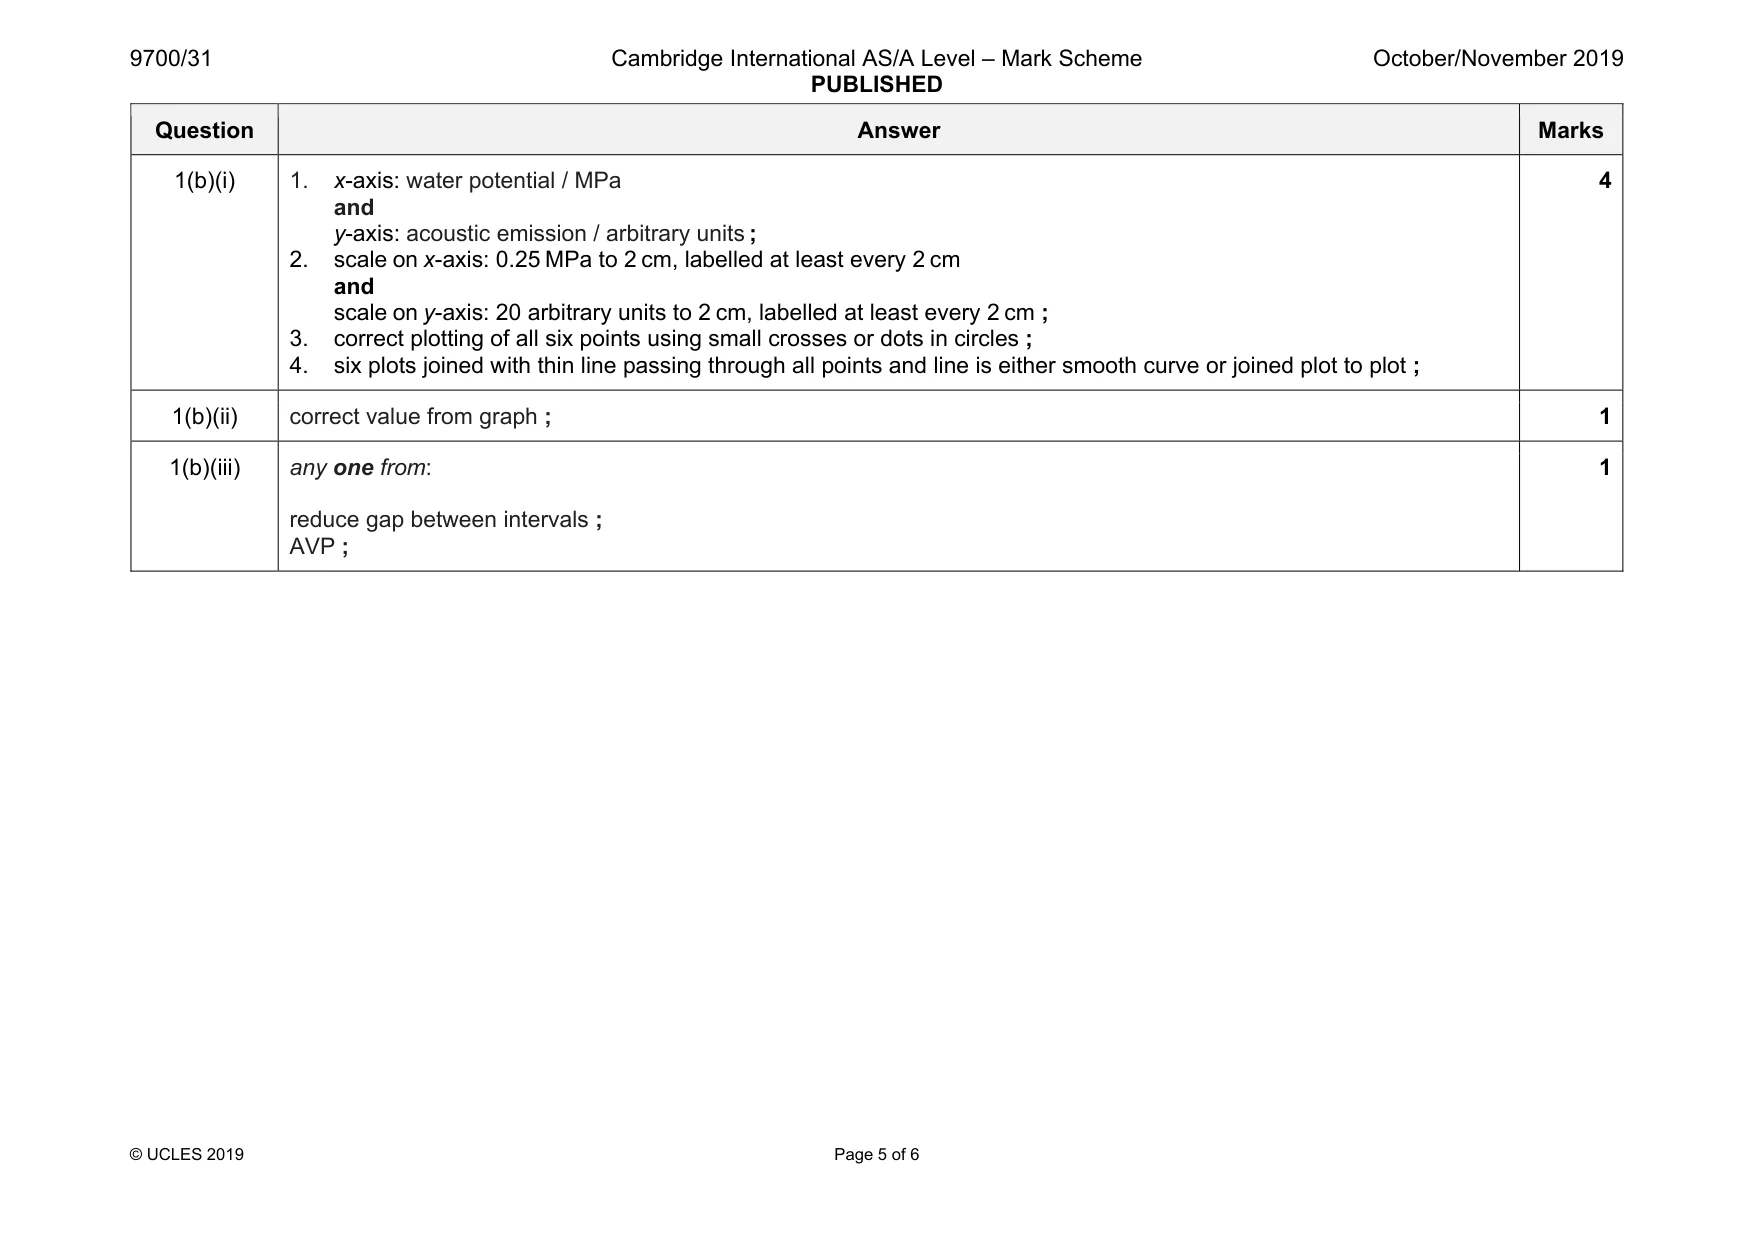
Mark scheme: 1(a)(i) shows at least three more concentrations of ethanol ; shows correct volumes of A and W to make these concentrations ; 2 1(a)(ii) 1. heading for independent variable: percentage concentration ethanol and before heading for dependent variable and no units in body of table ; 2. heading dependent variable: symbol or colour intensity ; 3. readings for all samples ; 4. intensity of red colour decreases with decreasing concentration ; 5. results recorded using ++++ scale ; 5 1(a)(iii) identifies the independent variable as concentration of ethanol ; 1 1(a)(iv) any three from: 1. proteins in membrane denatured ; 2. dissolved phospholipids / hydrophobic components (of membrane) ; 3. increases permeability ; 4. higher concentrations of ethanol and more diffusion of pigment ; 3 1(a)(v) any two sources of error and improvements from: 1. colour judgement subjective ; 2. colorimeter or use of colour chart ; 3. cutting to 2 cm ; 4. use of cutting template or more precise method of cutting described ; 5. time lag ; 6. staggered start ; 7. washing only once ; 8. standardise, e.g. washing twice ; 4 Question Answer Marks 1(b)(i) 1. x-axis: water potential / MPa and y-axis: acoustic emission / arbitrary units ; 2. scale on x-axis: 0.25 MPa to 2 cm, labelled at least every 2 cm and scale on y-axis: 20 arbitrary units to 2 cm, labelled at least every 2 cm ; 3. correct plotting of all six points using small crosses or dots in circles ; 4. six plots joined with thin line passing through all points and line is either smooth curve or joined plot to plot ; 4 1(b)(ii) correct value from graph ; 1 1(b)(iii) any one from: reduce gap between intervals ; AVP ; 1
Q2 · J1 is a slide of a stained transverse section of a plant stem
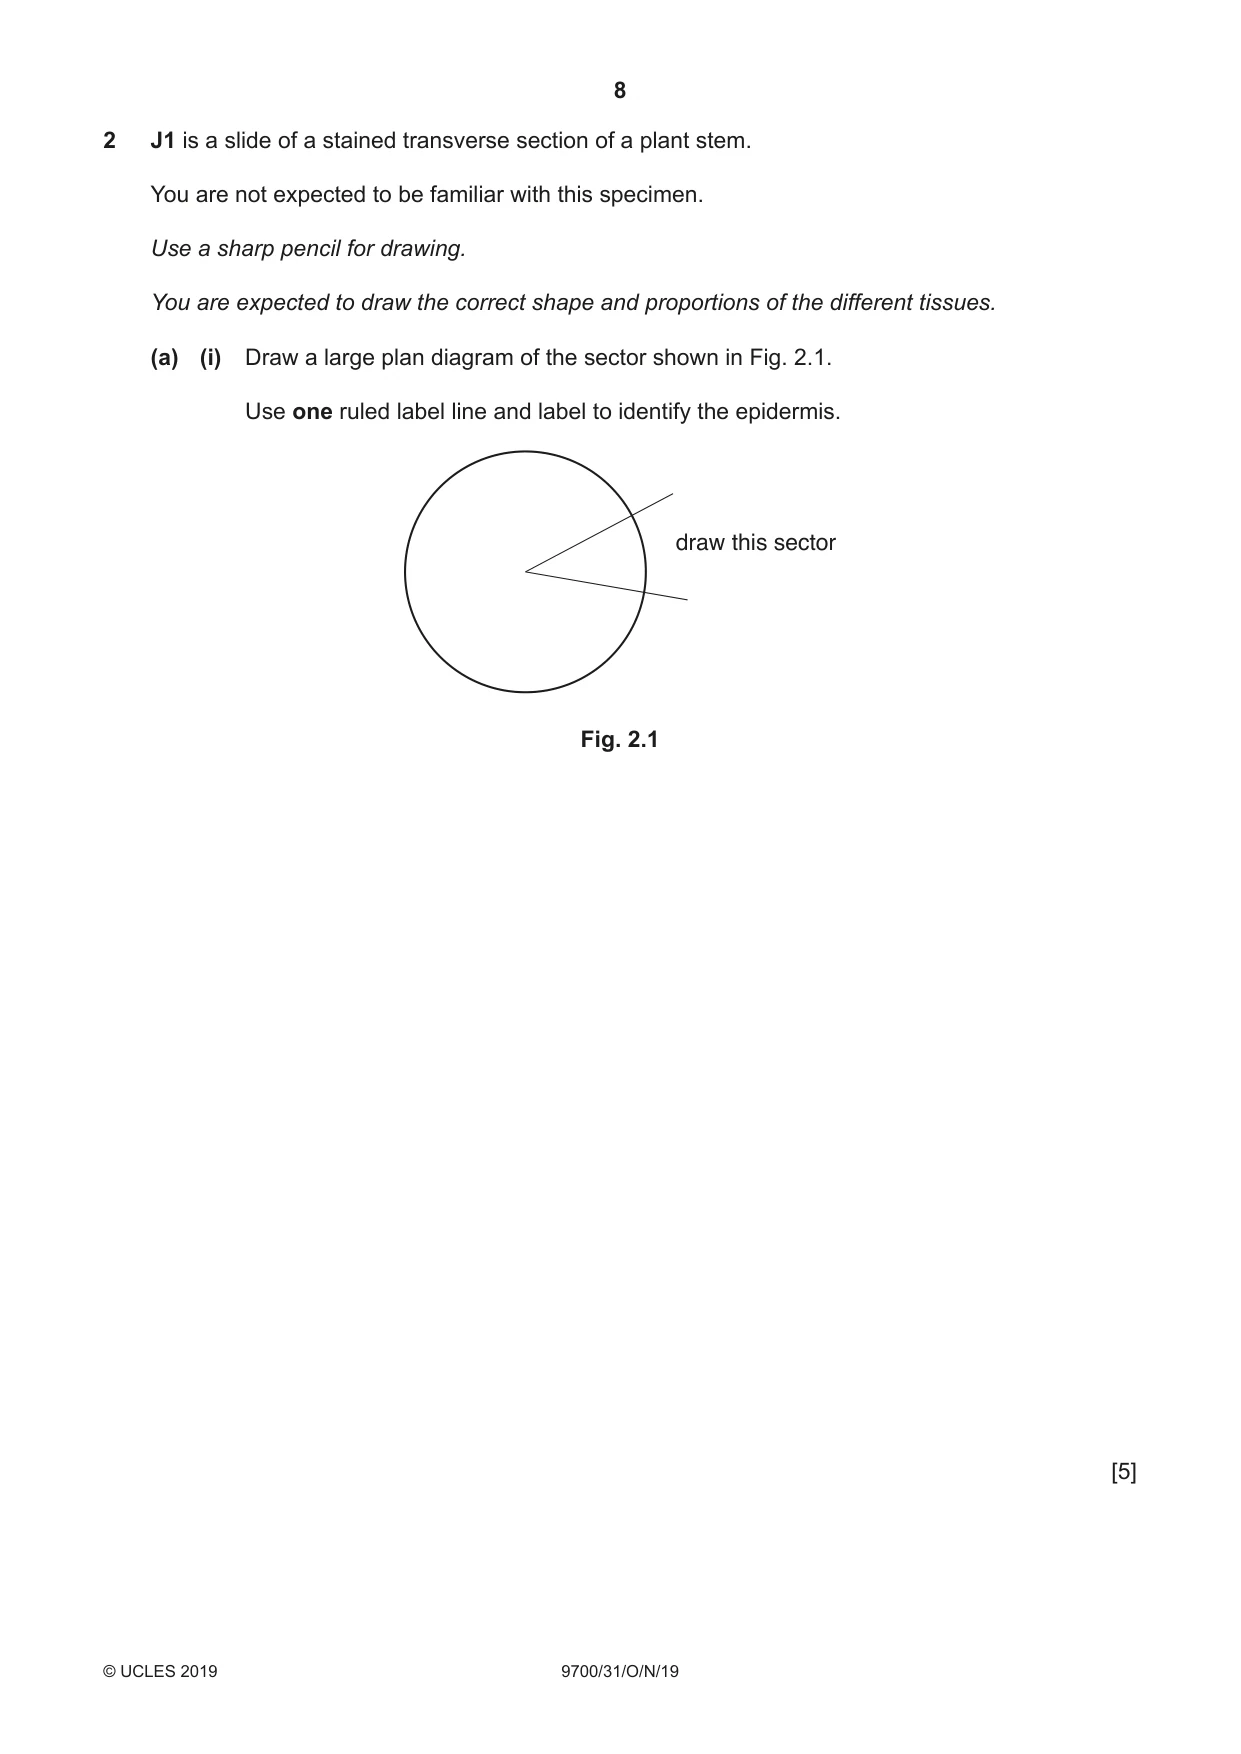
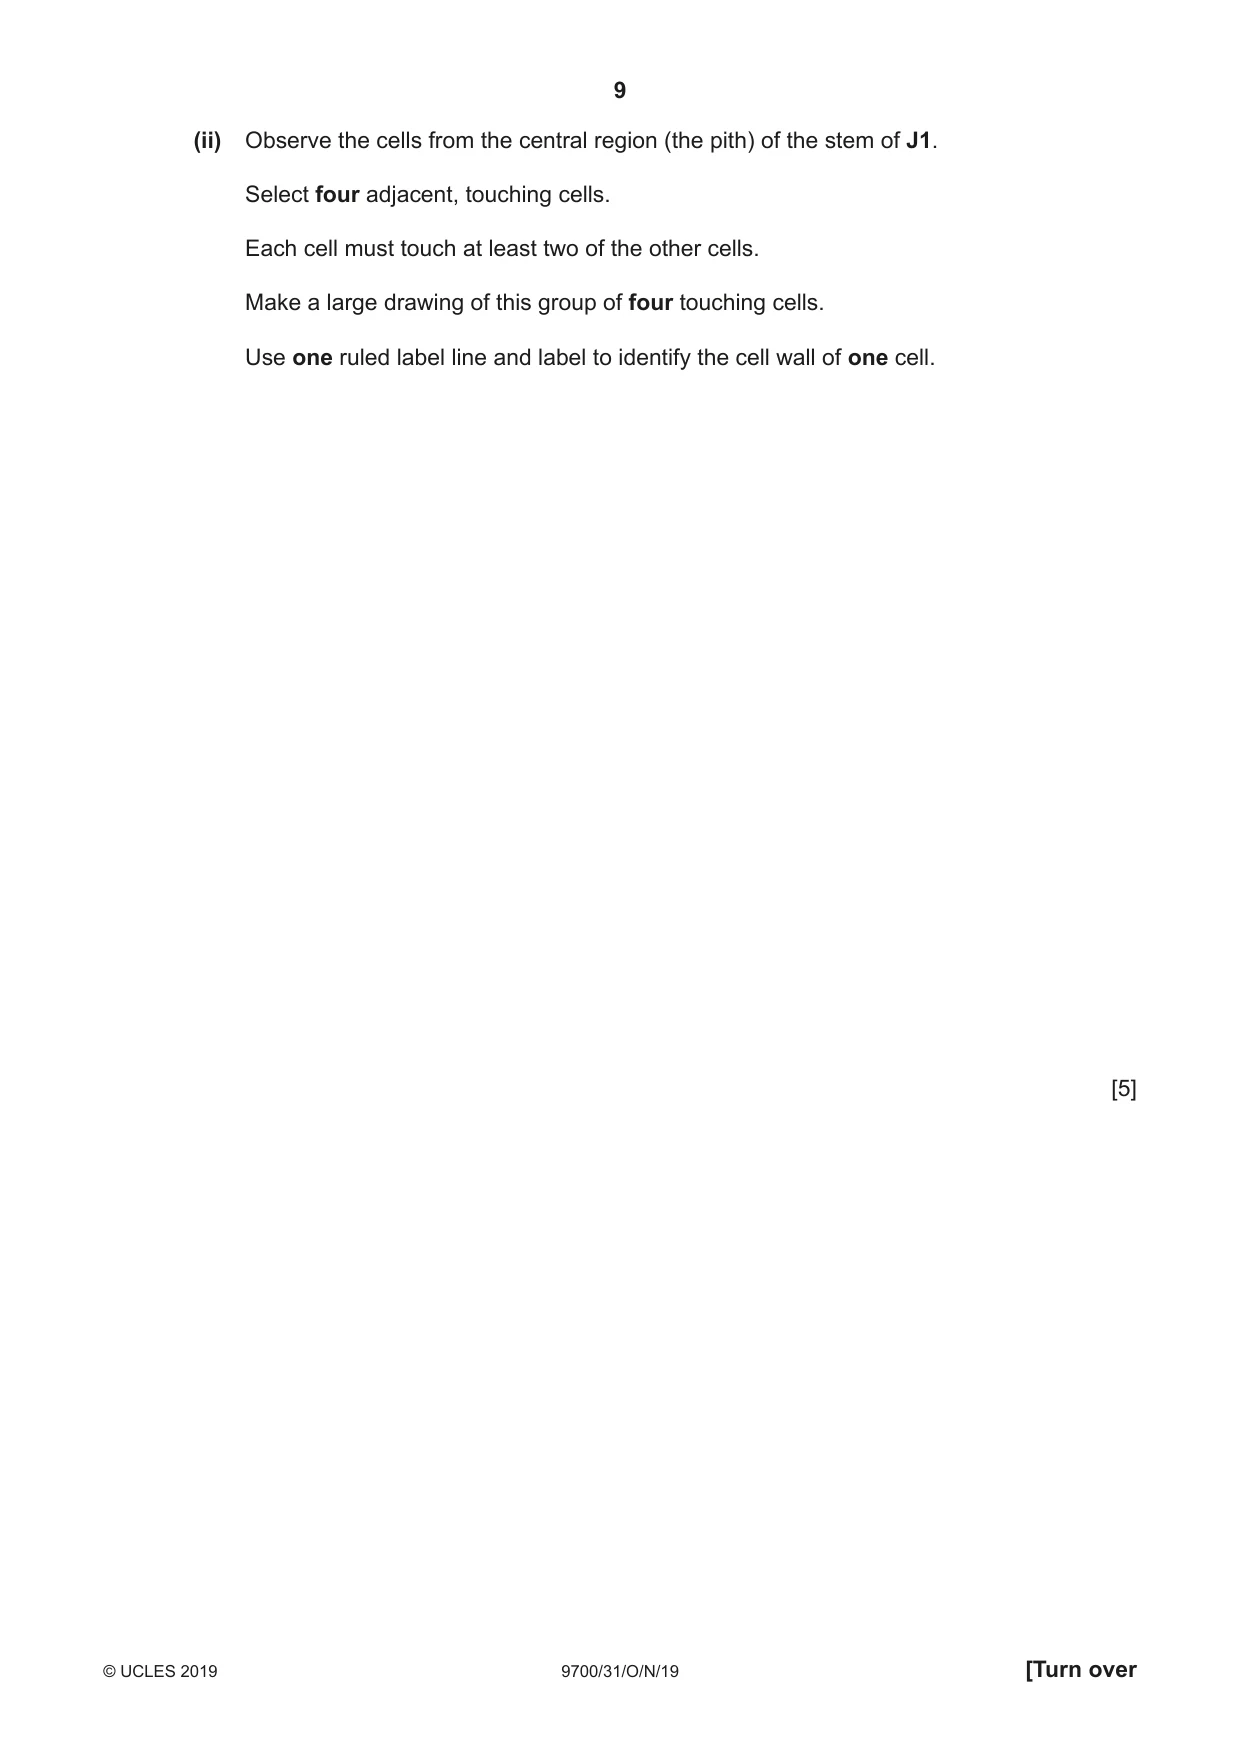
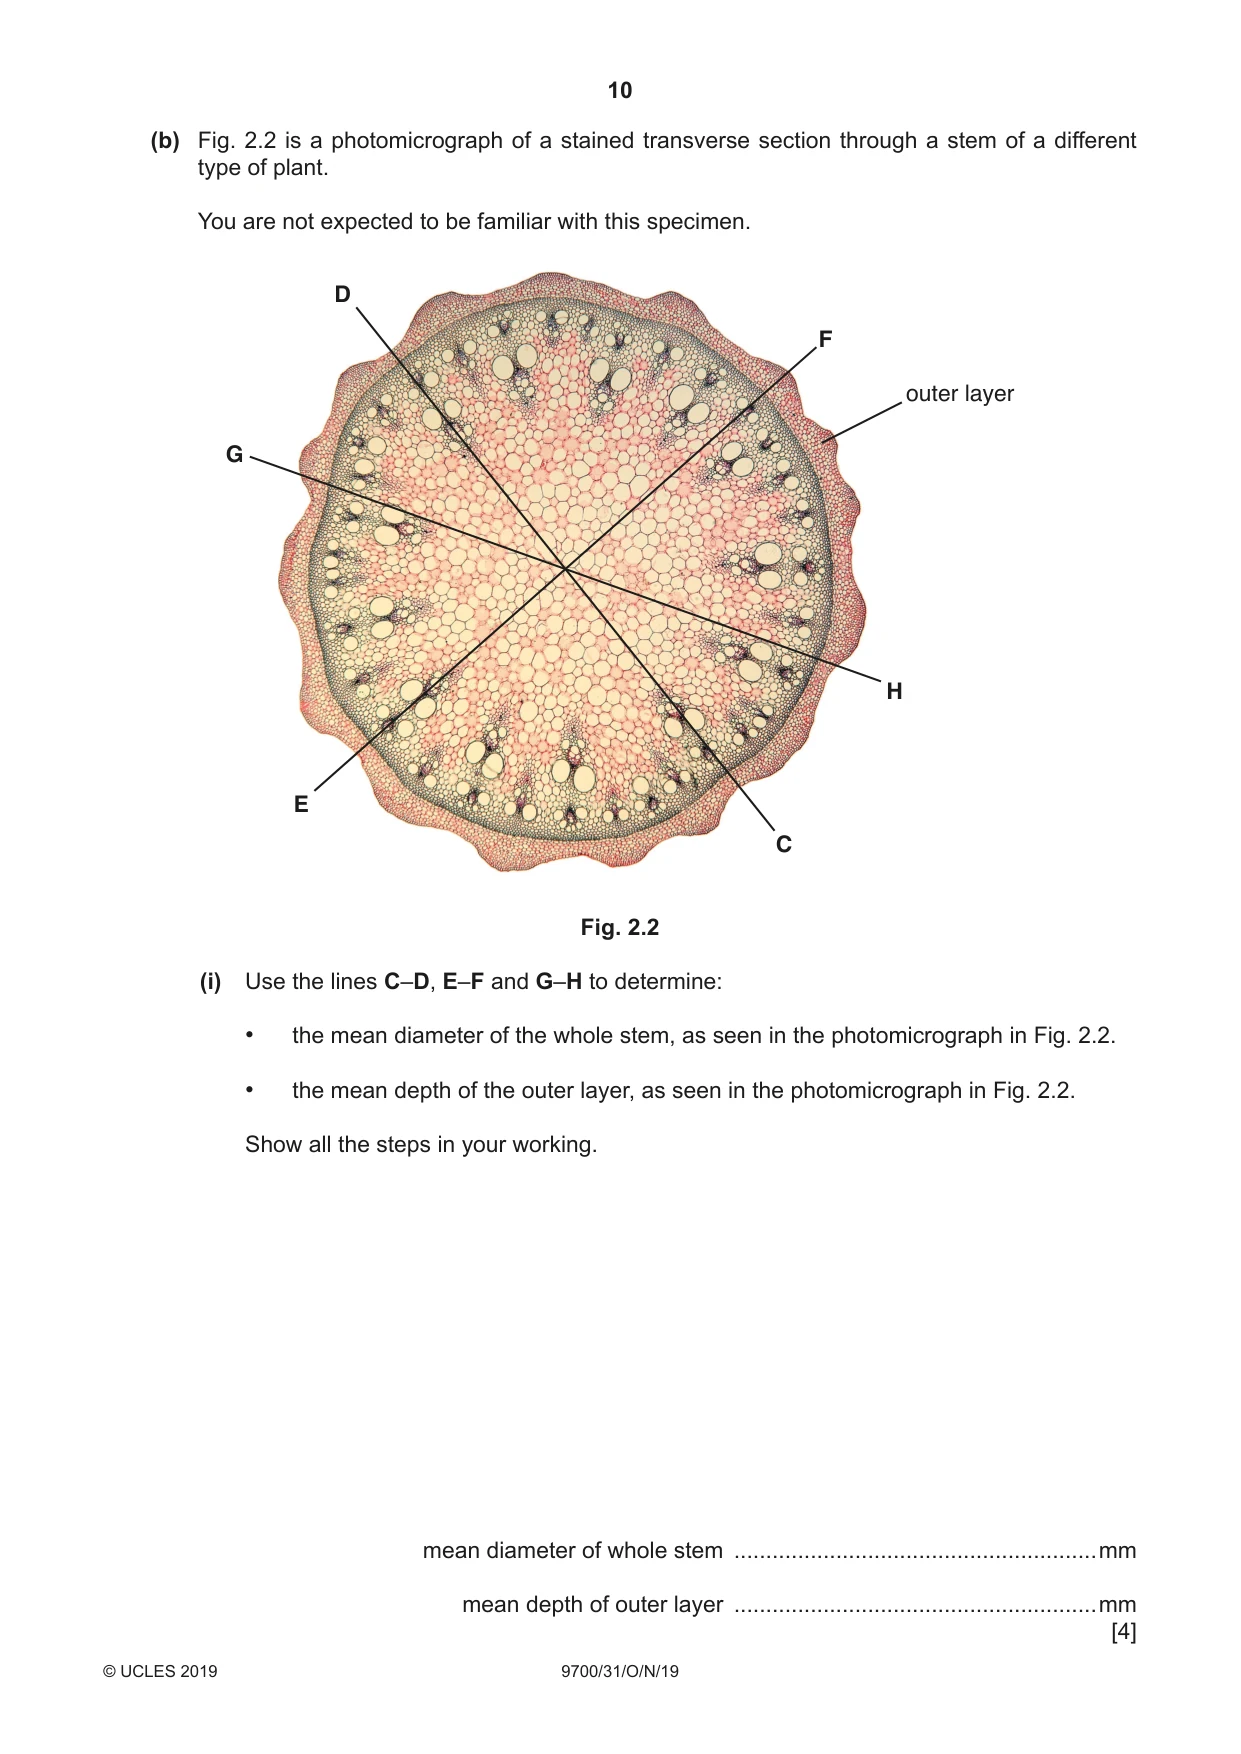
2 J1 is a slide of a stained transverse section of a plant stem. You are not expected to be familiar with this specimen. Use a sharp pencil for drawing. You are expected to draw the correct shape and proportions of the different tissues. (a) (i) Draw a large plan diagram of the sector shown in Fig. 2.1. Use one ruled label line and label to identify the epidermis. draw this sector Fig. 2.1 [5] (ii) Observe the cells from the central region (the pith) of the stem of J1. Select four adjacent, touching cells. Each cell must touch at least two of the other cells. Make a large drawing of this group of four touching cells. Use one ruled label line and label to identify the cell wall of one cell. [5] (b) Fig. 2.2 is a photomicrograph of a stained transverse section through a stem of a different type of plant. You are not expected to be familiar with this specimen. D F outer layer G H E C Fig. 2.2 (i) Use the lines C–D, E–F and G–H to determine: • the mean diameter of the whole stem, as seen in the photomicrograph in Fig. 2.2. • the mean depth of the outer layer, as seen in the photomicrograph in Fig. 2.2. Show all the steps in your working. mean diameter of whole stem .........................................................mm mean depth of outer layer .........................................................mm
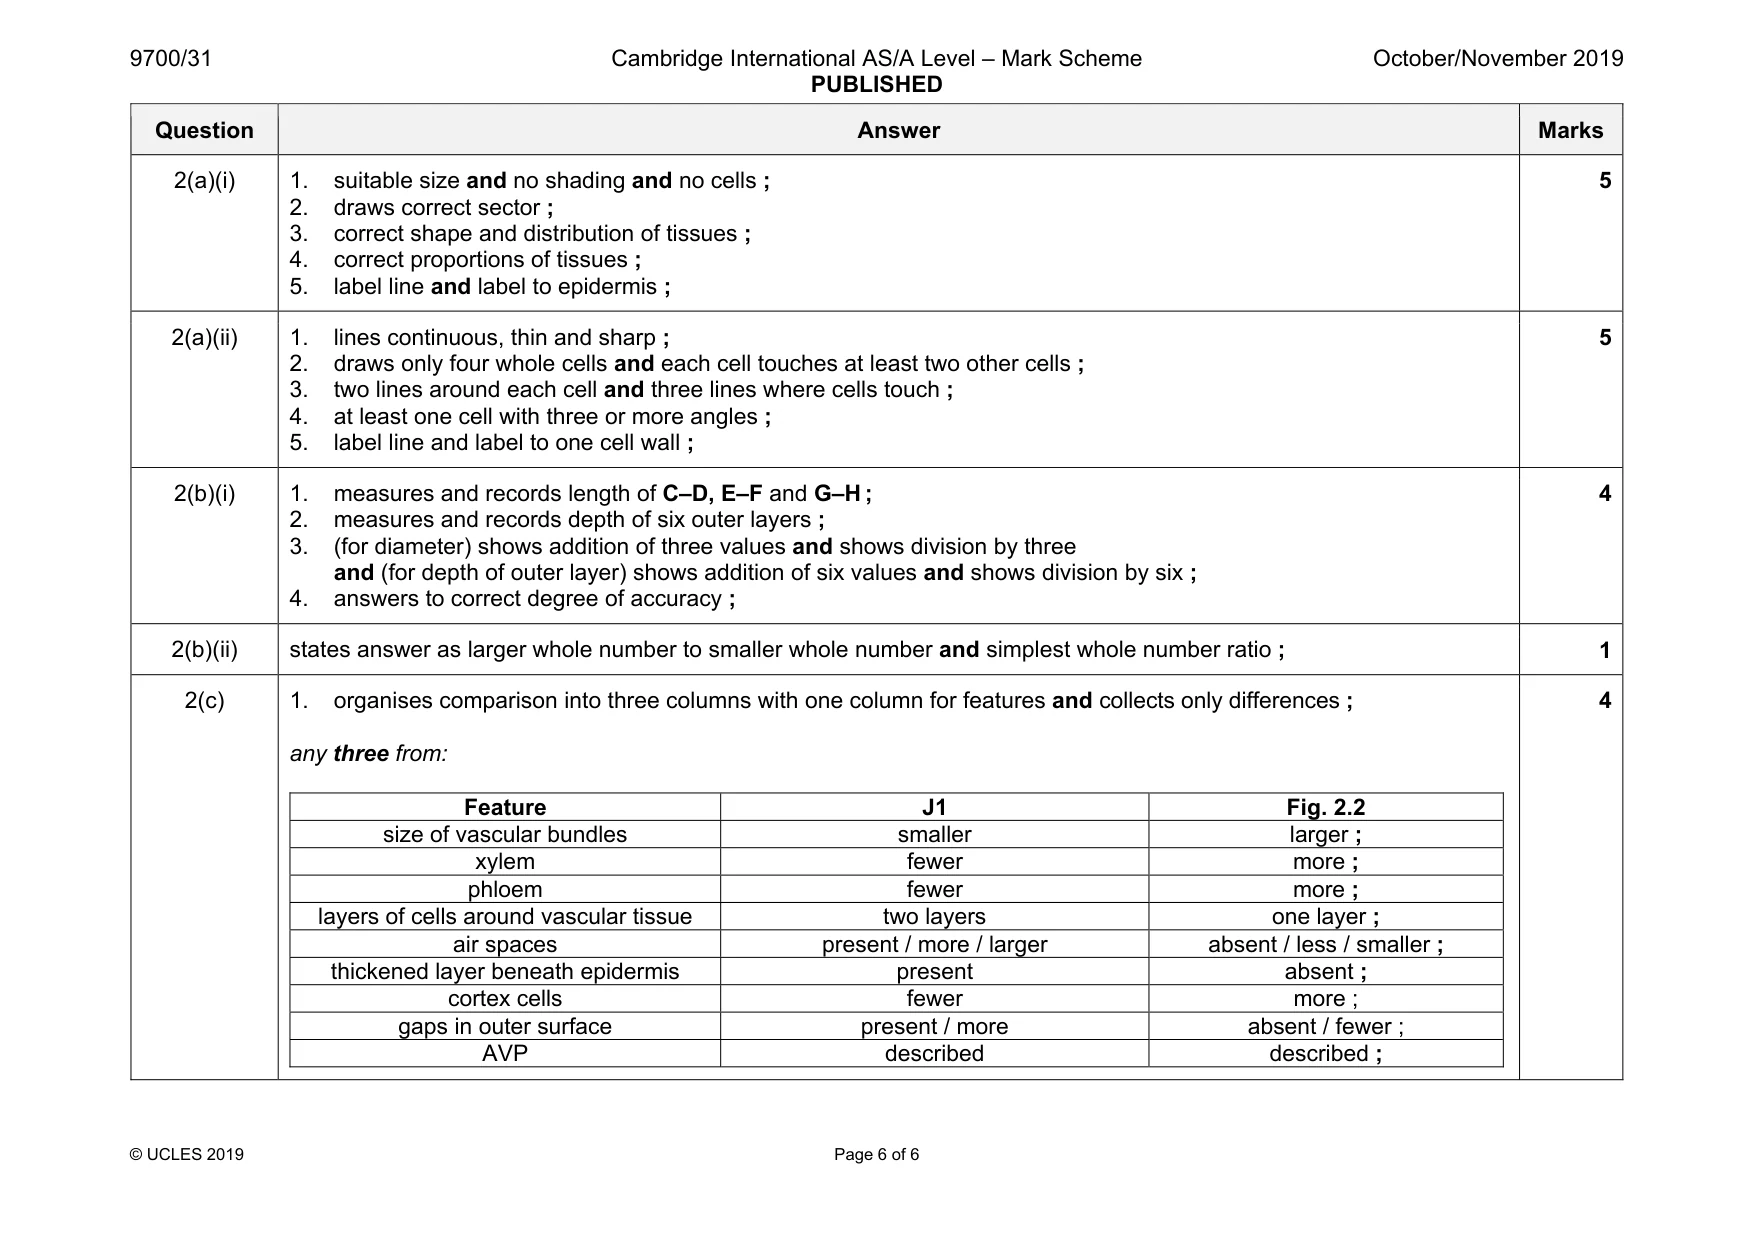
Mark scheme: 2(a)(i) 1. suitable size and no shading and no cells ; 2. draws correct sector ; 3. correct shape and distribution of tissues ; 4. correct proportions of tissues ; 5. label line and label to epidermis ; 5 2(a)(ii) 1. lines continuous, thin and sharp ; 2. draws only four whole cells and each cell touches at least two other cells ; 3. two lines around each cell and three lines where cells touch ; 4. at least one cell with three or more angles ; 5. label line and label to one cell wall ; 5 2(b)(i) 1. measures and records length of C–D, E–F and G–H ; 2. measures and records depth of six outer layers ; 3. (for diameter) shows addition of three values and shows division by three and (for depth of outer layer) shows addition of six values and shows division by six ; 4. answers to correct degree of accuracy ; 4 2(b)(ii) states answer as larger whole number to smaller whole number and simplest whole number ratio ; 1 2(c) 1. organises comparison into three columns with one column for features and collects only differences ; any three from: Feature J1 Fig. 2.2 size of vascular bundles smaller larger ; xylem fewer more ; phloem fewer more ; layers of cells around vascular tissue two layers one layer ; air spaces present / more / larger absent / less / smaller ; thickened layer beneath epidermis present absent ; cortex cells fewer more ; gaps in outer surface present / more absent / fewer ; AVP described described ; 4
What was in this paper
The subtopics covered by these 2 questions, and how many questions each got. Open one in a new tab to see every Cambridge question on it.
What you needed in this session
Cambridge’s own grade thresholds for 2019 Oct/Nov, Paper 3 · Variant 1. A higher threshold means an easier paper — the bar moves with how the cohort did.