Cambridge A Level Biology 9700 — 2019 Oct/Nov Paper 3 · Variant 5
9700/35/O/N/19 · 2 questions · 40 marks · ≈45 min
The question paper and its mark scheme, free to read here and free to download. This is Cambridge’s own paper, exactly as it was sat.
Question paper16 pages




Mark scheme8 pages
Answers below. Sit the paper first if you are practising.
Questions as text
Q1 · Agar cubes that have been stained with a blue indicator can be used to investigate…
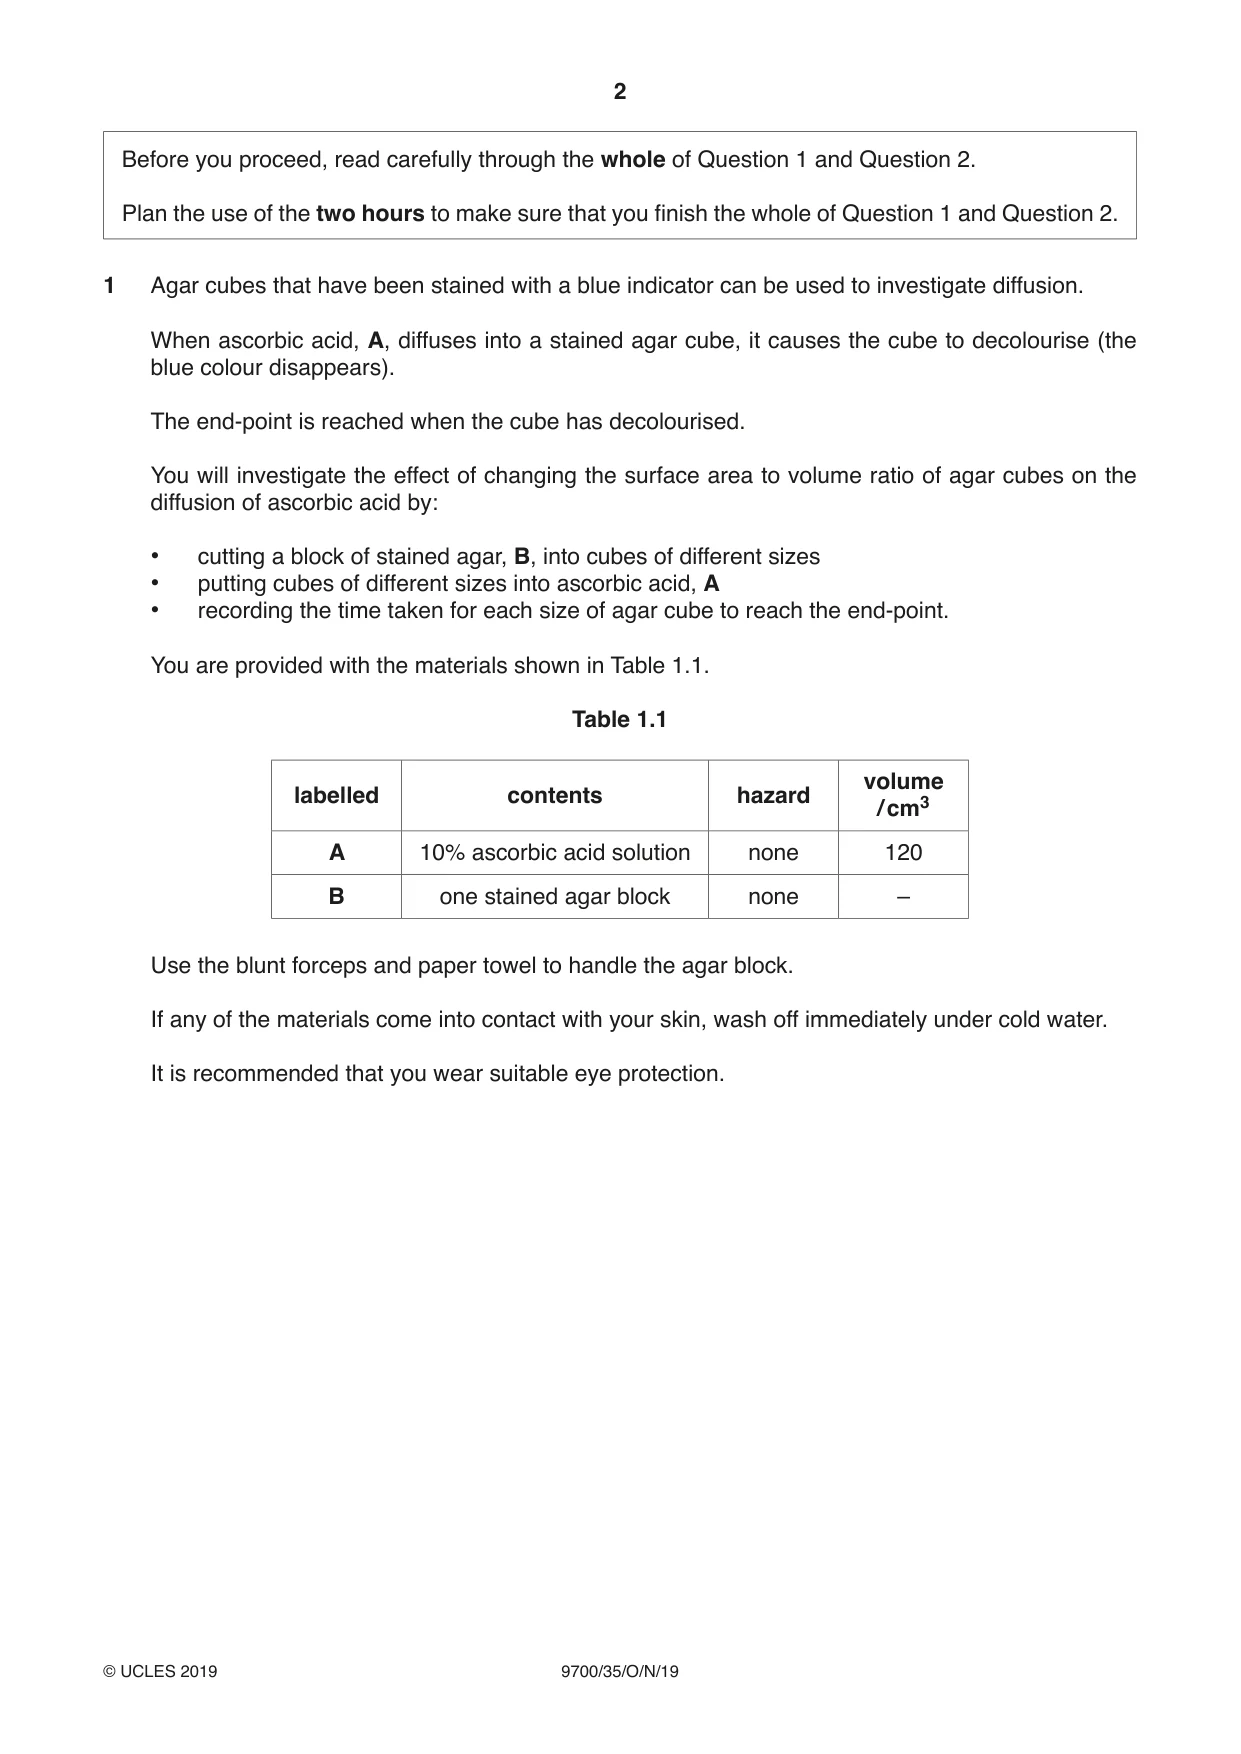
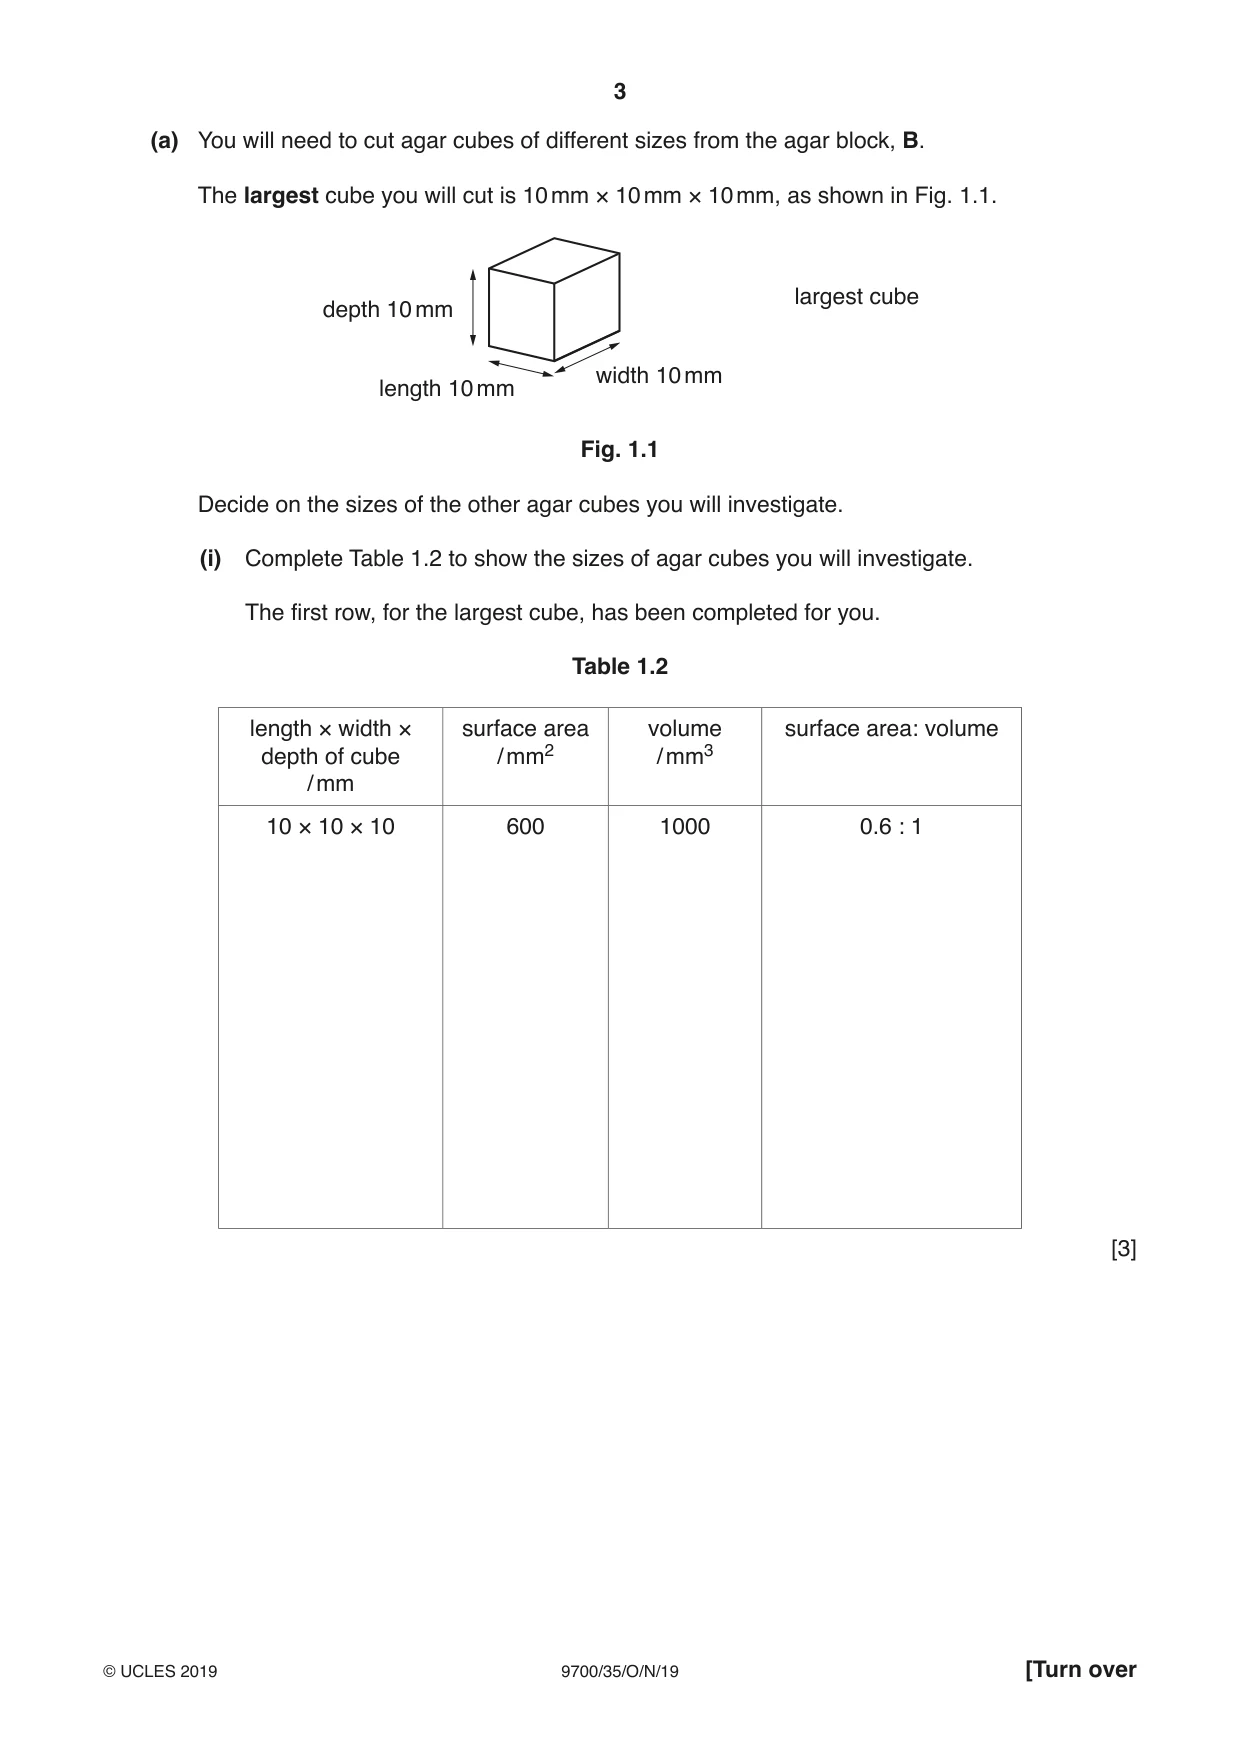
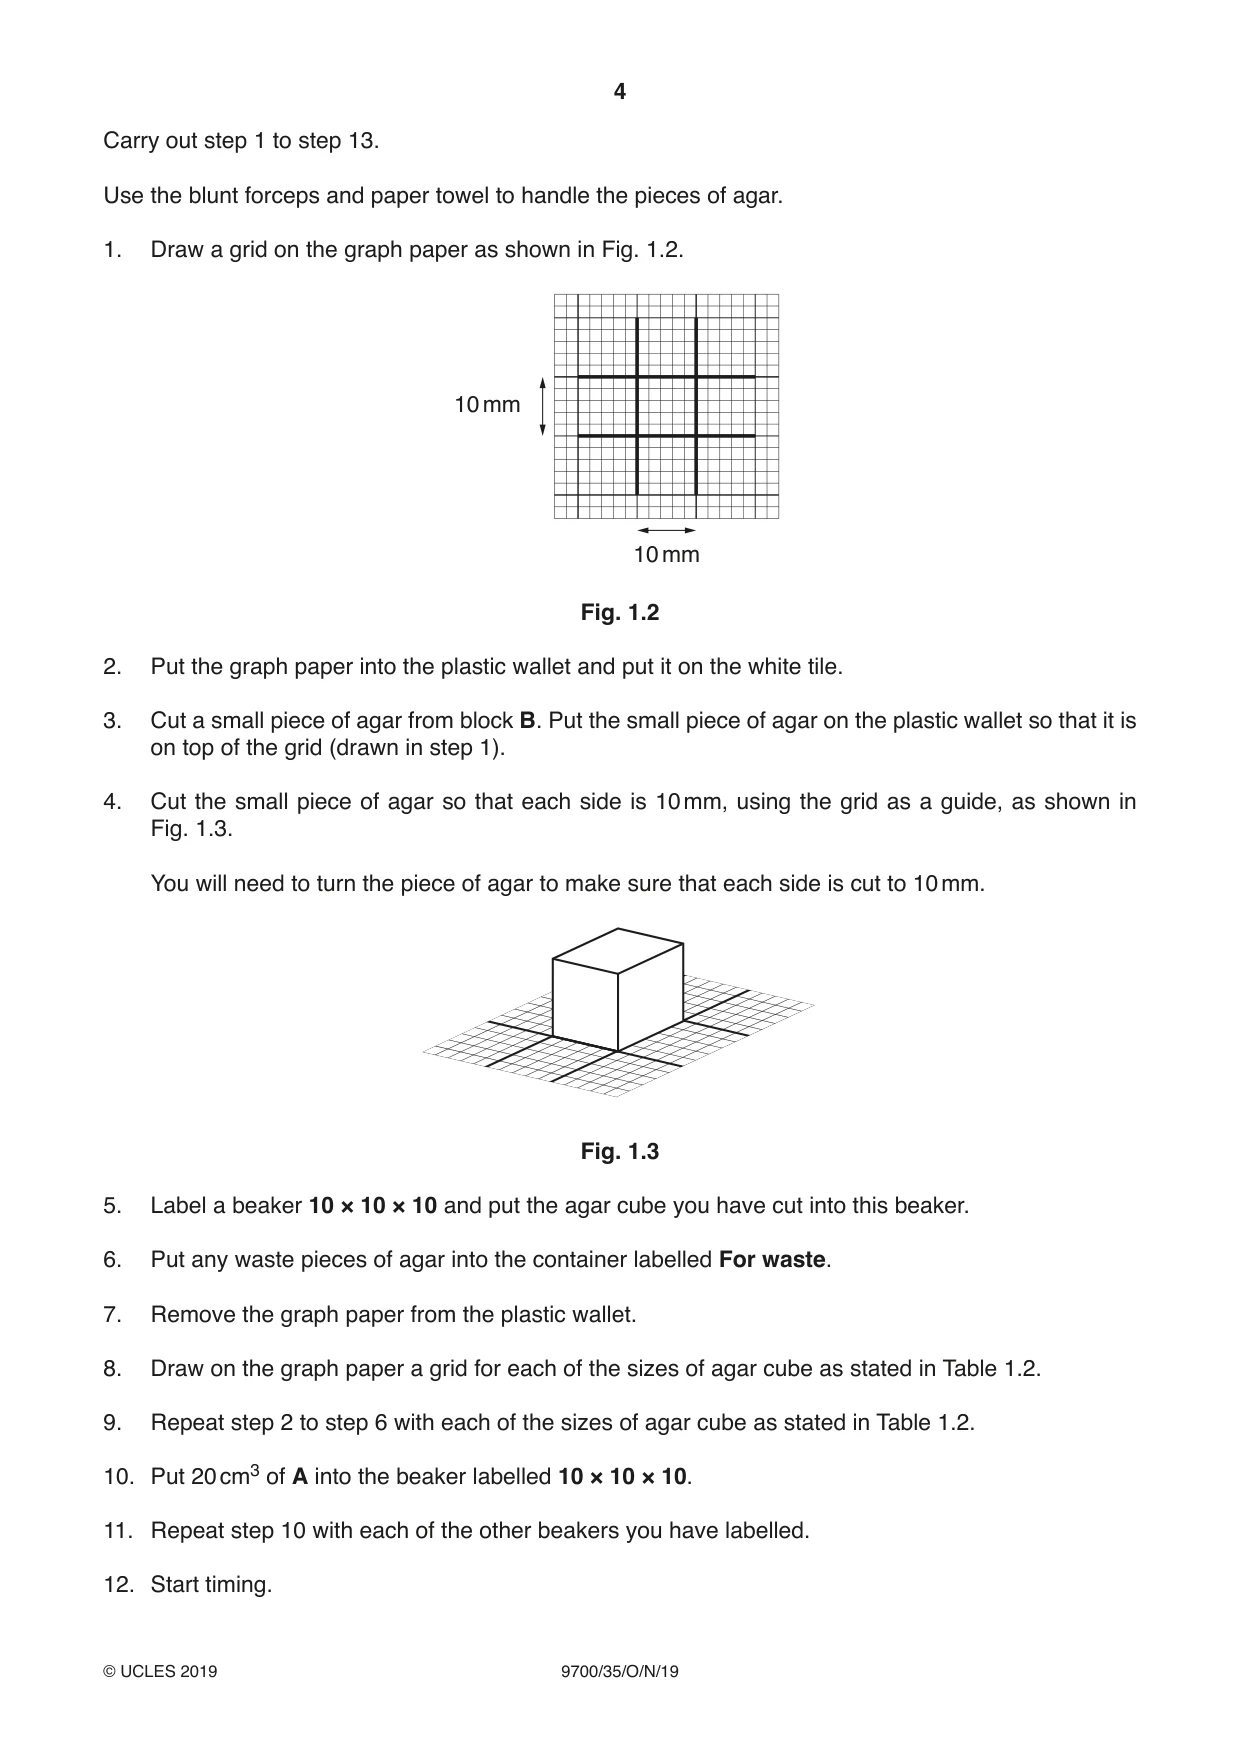
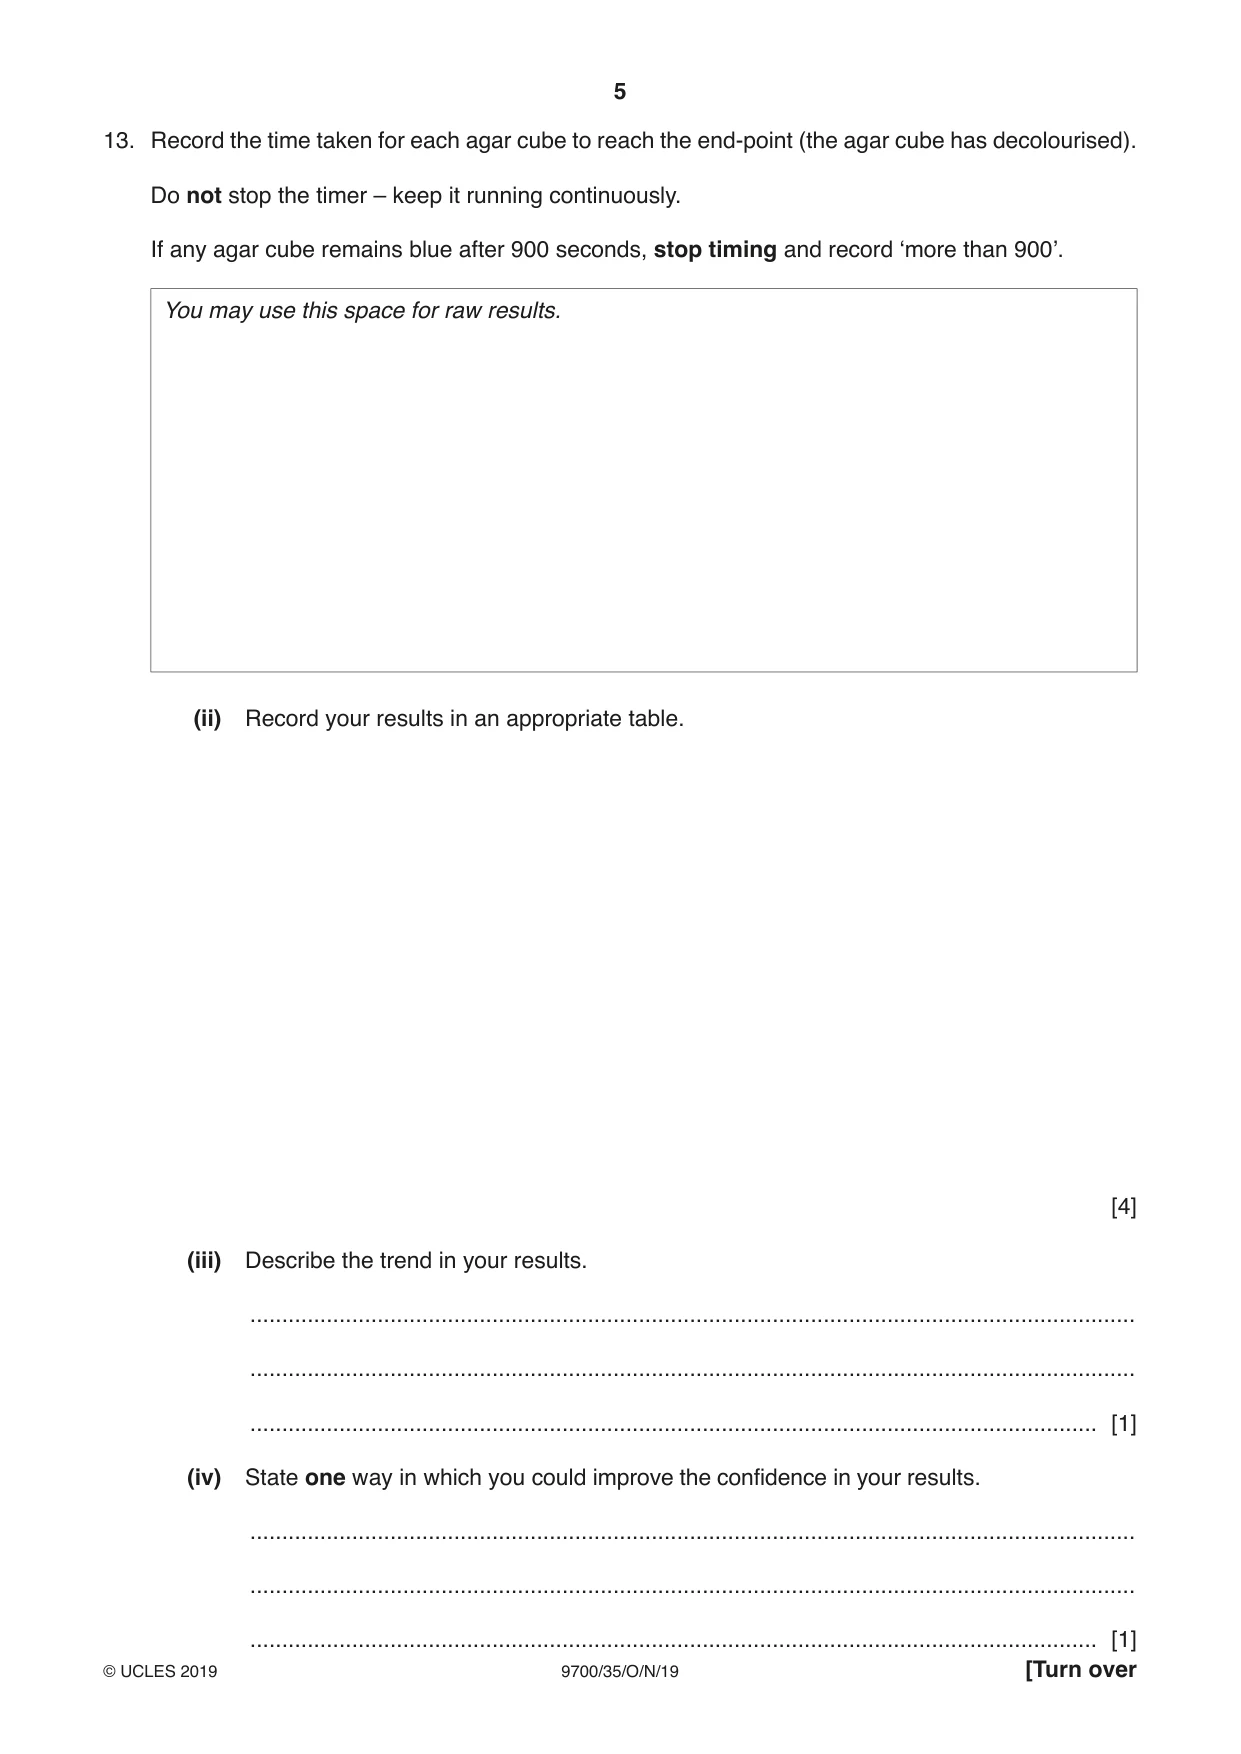
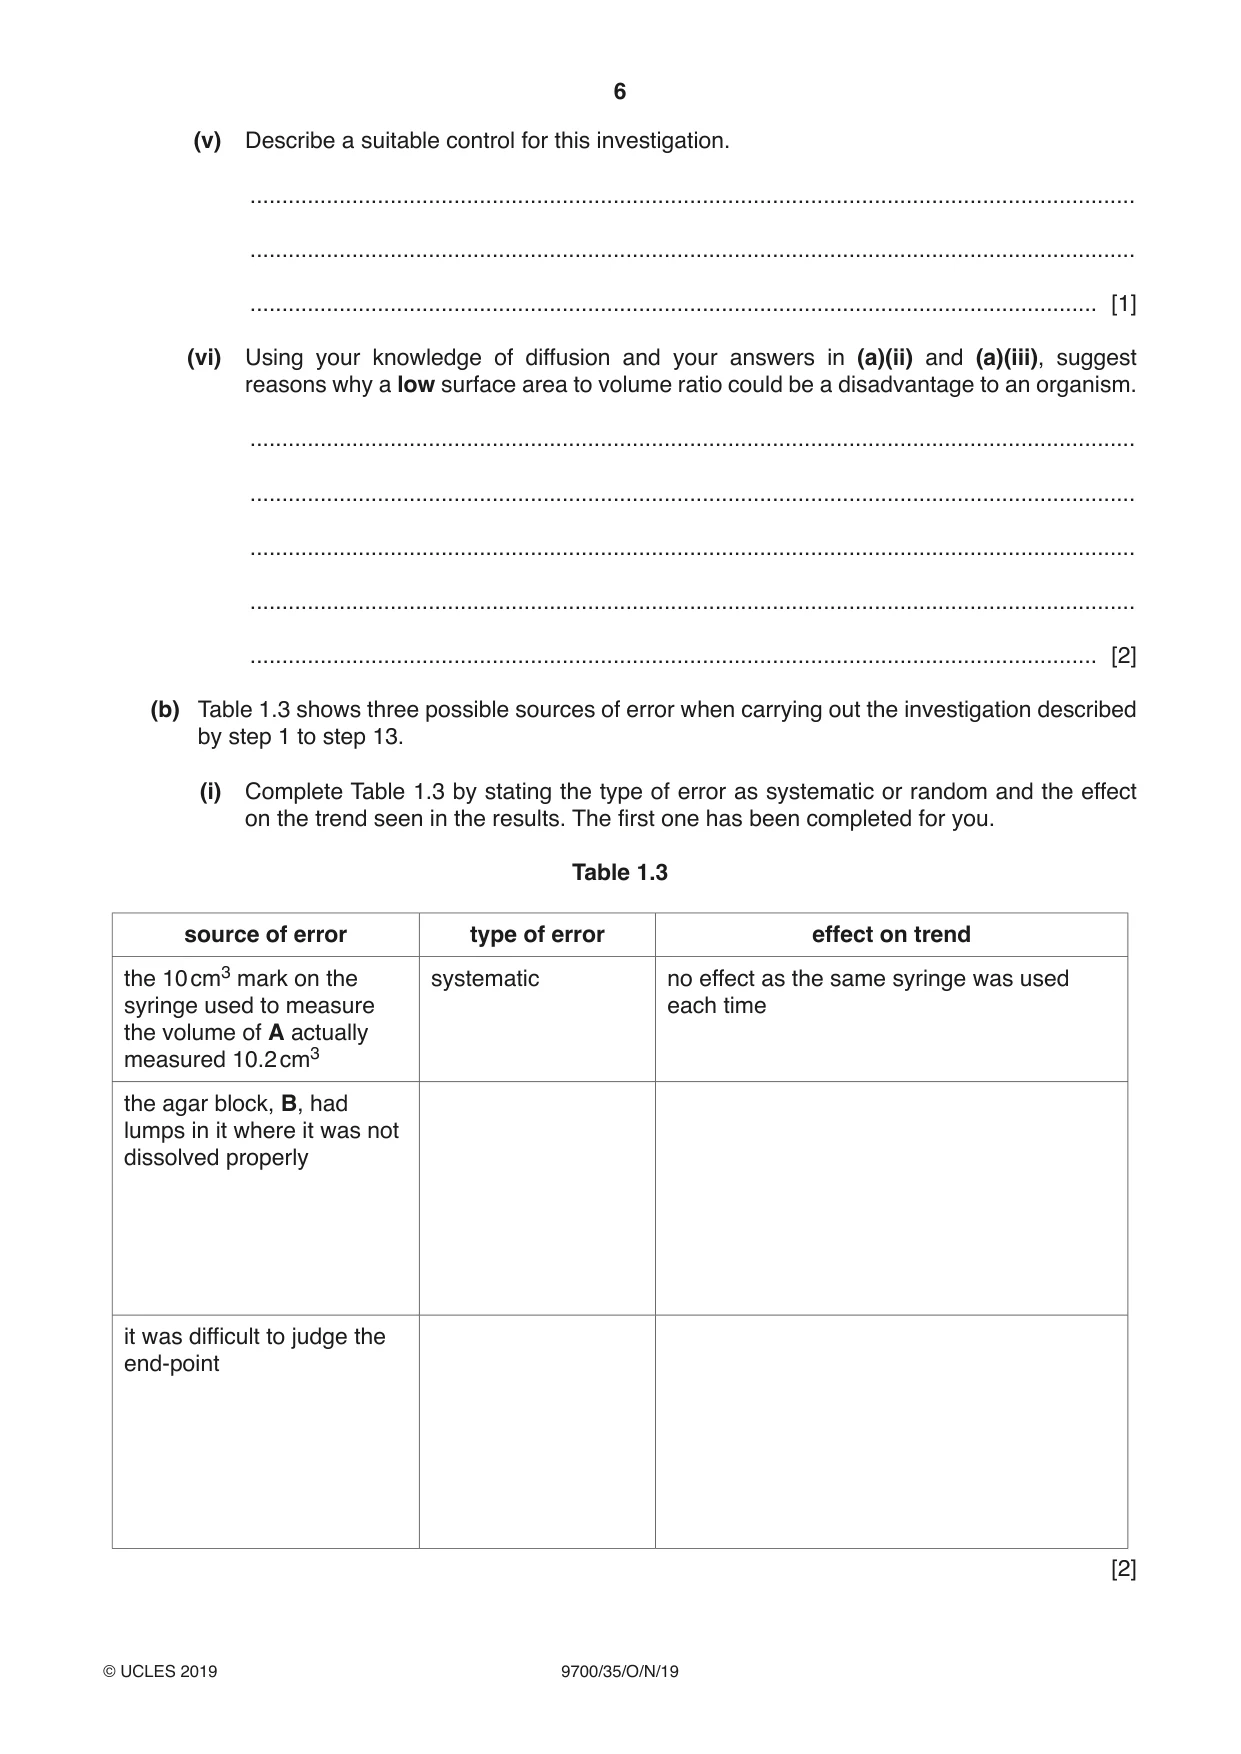
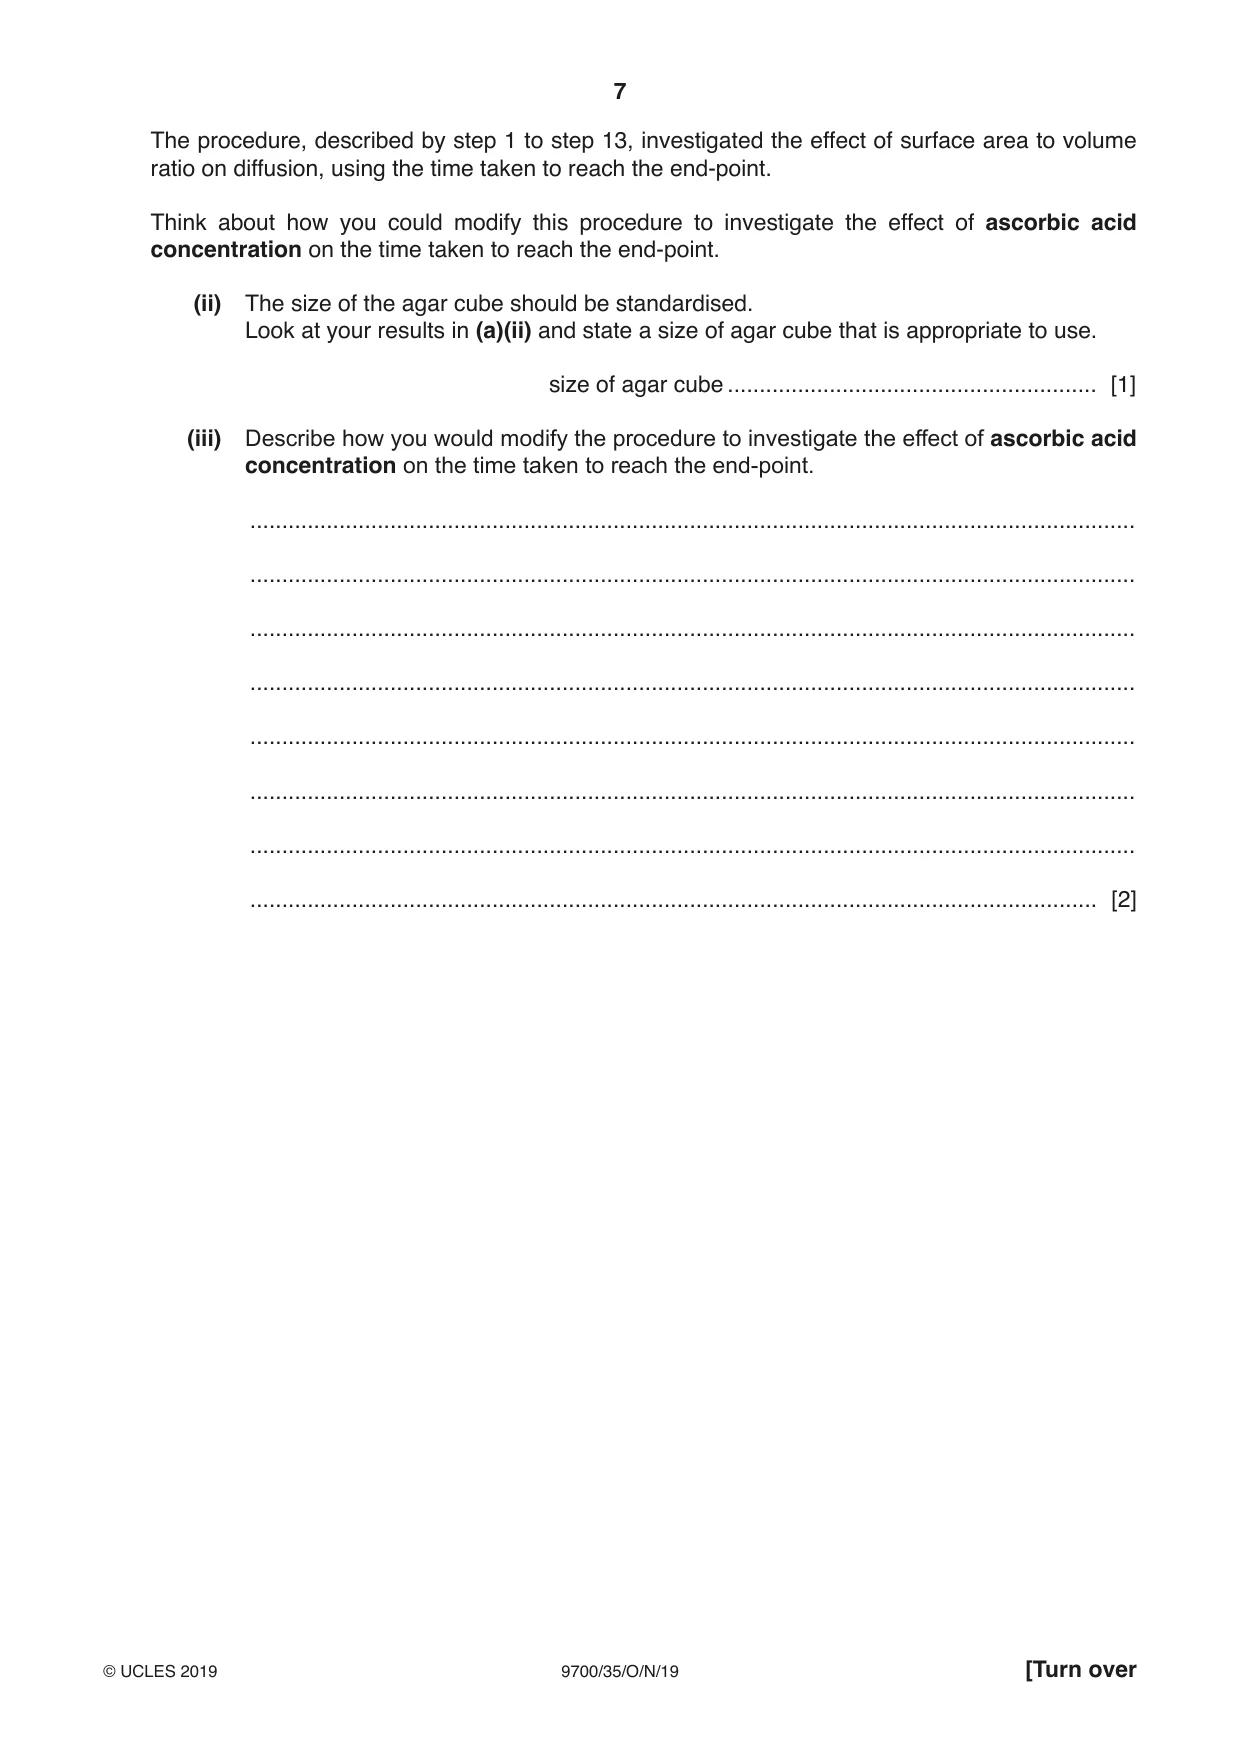
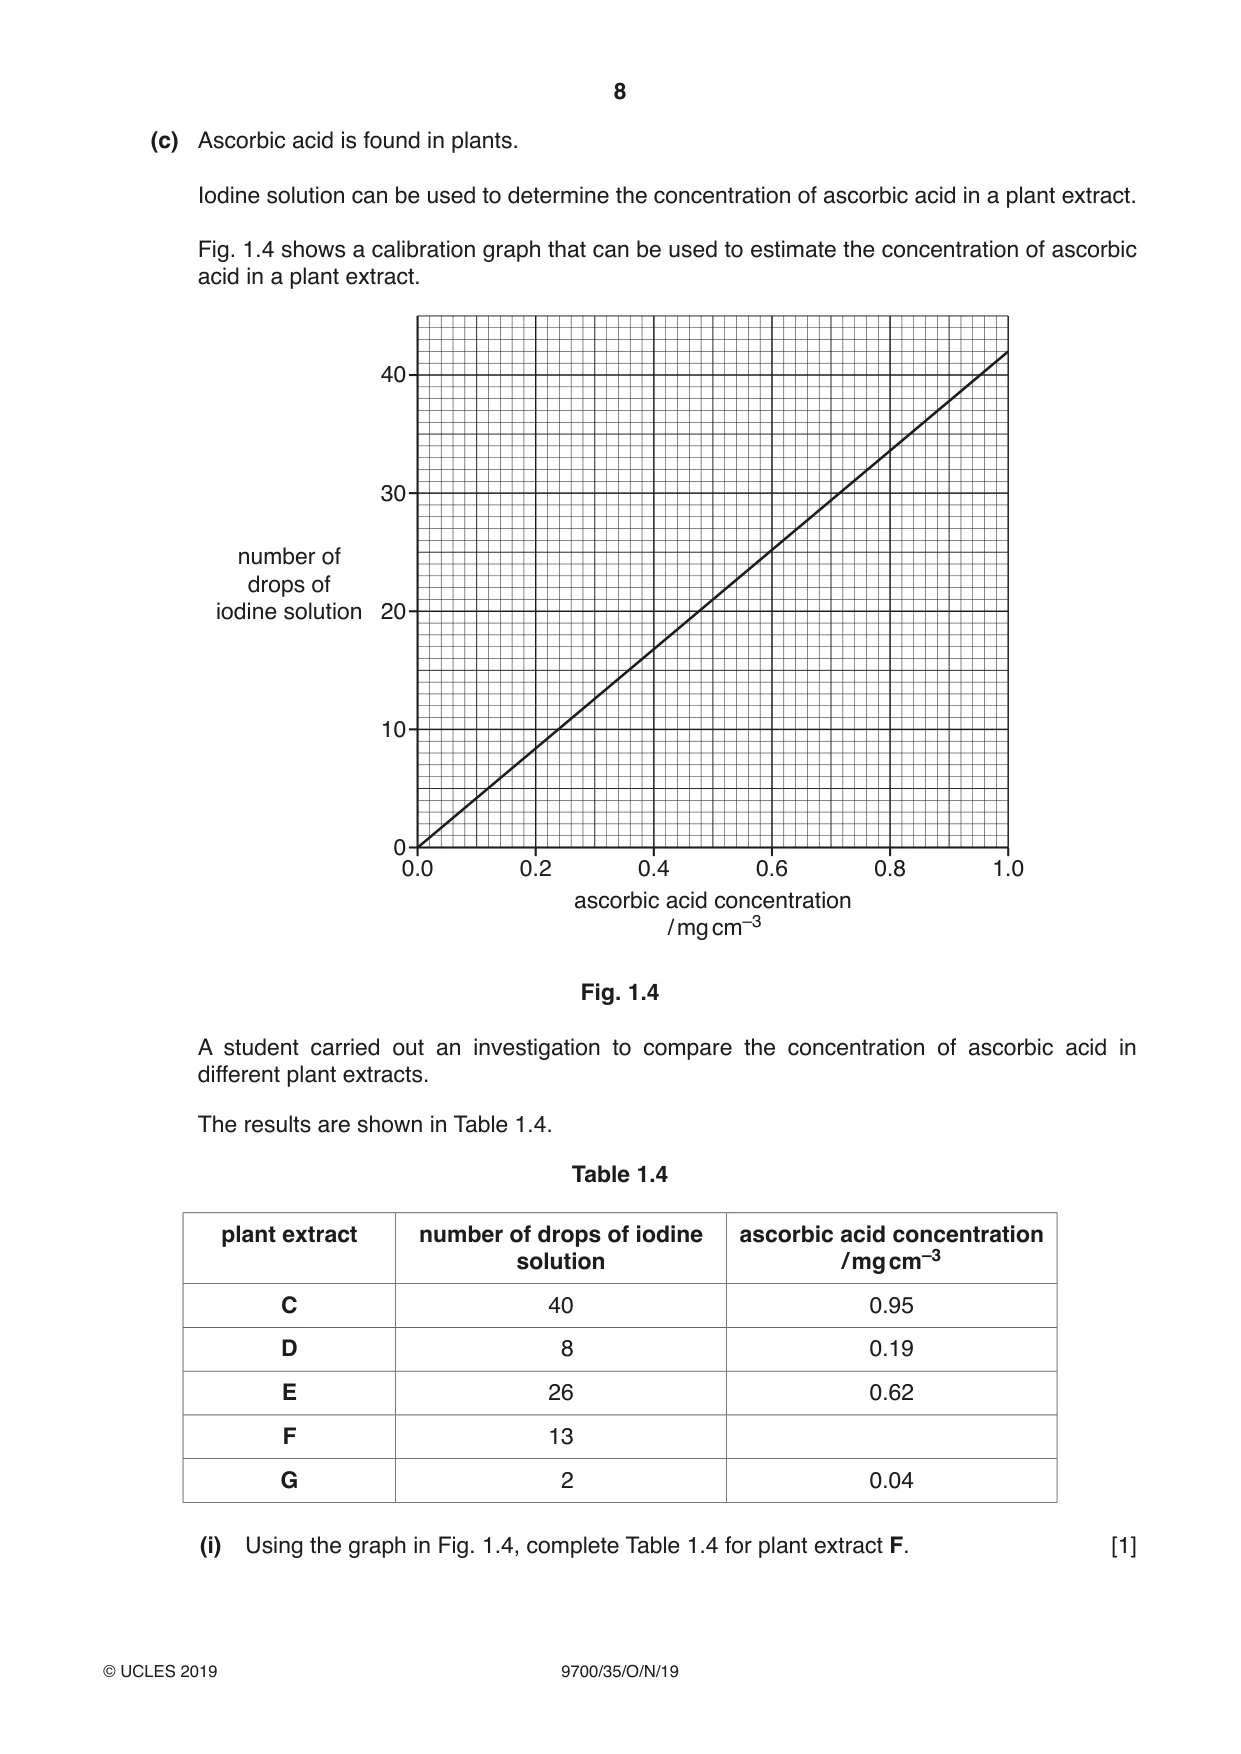
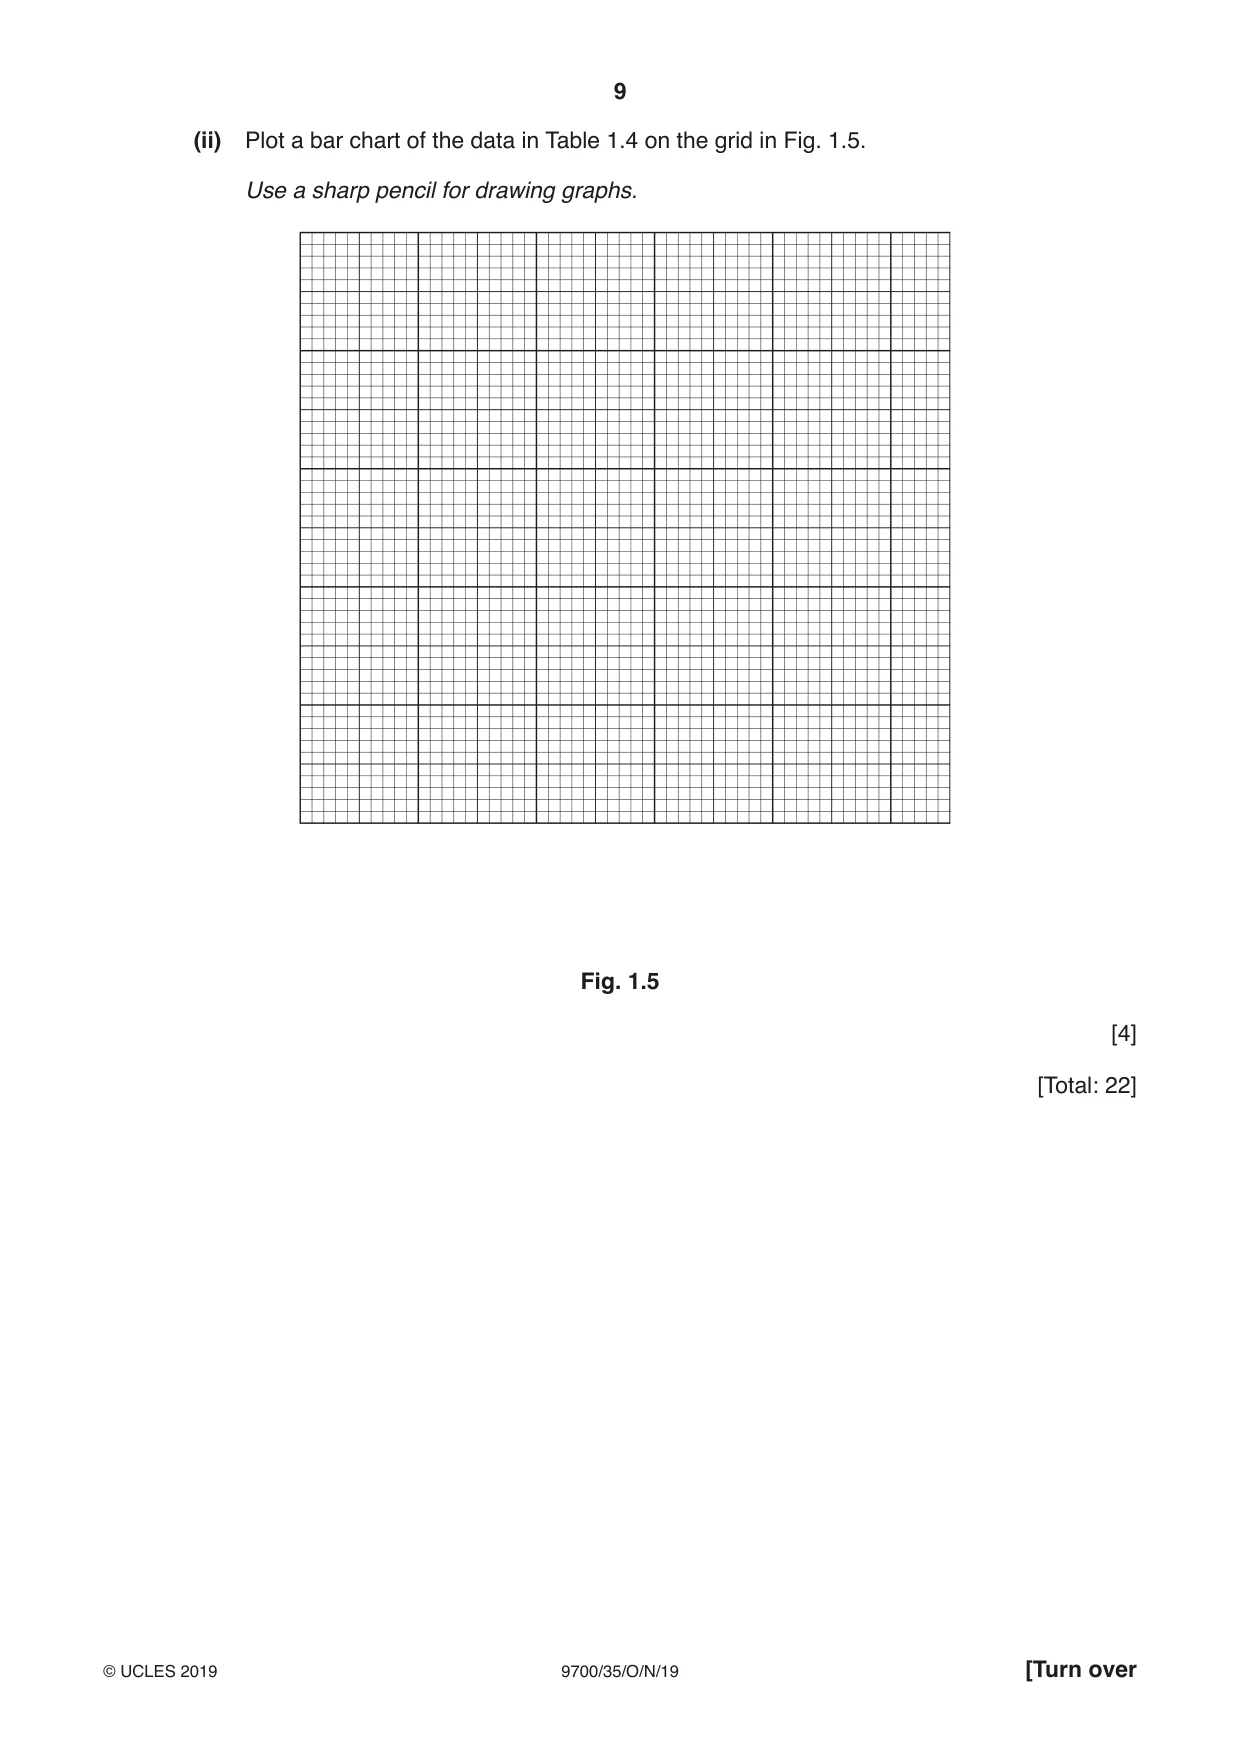
1 Agar cubes that have been stained with a blue indicator can be used to investigate diffusion. When ascorbic acid, A, diffuses into a stained agar cube, it causes the cube to decolourise (the blue colour disappears). The end-point is reached when the cube has decolourised. You will investigate the effect of changing the surface area to volume ratio of agar cubes on the diffusion of ascorbic acid by: • cutting a block of stained agar, B, into cubes of different sizes • putting cubes of different sizes into ascorbic acid, A • recording the time taken for each size of agar cube to reach the end-point. You are provided with the materials shown in Table 1.1. Table 1.1 volume labelled contents hazard / cm3 A 10% ascorbic acid solution none 120 B one stained agar block none – Use the blunt forceps and paper towel to handle the agar block. If any of the materials come into contact with your skin, wash off immediately under cold water. It is recommended that you wear suitable eye protection. (a) You will need to cut agar cubes of different sizes from the agar block, B. The largest cube you will cut is 10 mm × 10 mm × 10 mm, as shown in Fig. 1.1. largest cube depth 10 mm width 10 mm length 10 mm Fig. 1.1 Decide on the sizes of the other agar cubes you will investigate. (i) Complete Table 1.2 to show the sizes of agar cubes you will investigate. The first row, for the largest cube, has been completed for you. Table 1.2 length × width × surface area volume surface area: volume depth of cube / mm2 / mm3 / mm 10 × 10 × 10 600 1000 0.6 : 1 [3] Carry out step 1 to step 13. Use the blunt forceps and paper towel to handle the pieces of agar. 1. Draw a grid on the graph paper as shown in Fig. 1.2. 10 mm 10 mm Fig. 1.2 2. Put the graph paper into the plastic wallet and put it on the white tile. 3. Cut a small piece of agar from block B. Put the small piece of agar on the plastic wallet so that it is on top of the grid (drawn in step 1). 4. Cut the small piece of agar so that each side is 10 mm, using the grid as a guide, as shown in Fig. 1.3. You will need to turn the piece of agar to make sure that each side is cut to 10 mm. Fig. 1.3 5. Label a beaker 10 × 10 × 10 and put the agar cube you have cut into this beaker. 6. Put any waste pieces of agar into the container labelled For waste. 7. Remove the graph paper from the plastic wallet. 8. Draw on the graph paper a grid for each of the sizes of agar cube as stated in Table 1.2. 9. Repeat step 2 to step 6 with each of the sizes of agar cube as stated in Table 1.2. 10. Put 20 cm3 of A into the beaker labelled 10 × 10 × 10. 11. Repeat step 10 with each of the other beakers you have labelled. 12. Start timing. 13. Record the time taken for each agar cube to reach the end-point (the agar cube has decolourised). Do not stop the timer – keep it running continuously. If any agar cube remains blue after 900 seconds, stop timing and record ‘more than 900’. You may use this space for raw results. (ii) Record your results in an appropriate table. [4] (iii) Describe the trend in your results. ........................................................................................................................................... ........................................................................................................................................... ..................................................................................................................................... [1] (iv) State one way in which you could improve the confidence in your results. ........................................................................................................................................... ........................................................................................................................................... (v) Describe a suitable control for this investigation. ........................................................................................................................................... ........................................................................................................................................... ..................................................................................................................................... [1] (vi) Using your knowledge of diffusion and your answers in (a)(ii) and (a)(iii), suggest reasons why a low surface area to volume ratio could be a disadvantage to an organism. ........................................................................................................................................... ........................................................................................................................................... ........................................................................................................................................... ........................................................................................................................................... ..................................................................................................................................... [2] (b) Table 1.3 shows three possible sources of error when carrying out the investigation described by step 1 to step 13. (i) Complete Table 1.3 by stating the type of error as systematic or random and the effect on the trend seen in the results. The first one has been completed for you. Table 1.3 source of error type of error effect on trend the 10 cm3 mark on the systematic no effect as the same syringe was used syringe used to measure each time the volume of A actually measured 10.2 cm3 the agar block, B, had lumps in it where it was not dissolved properly it was difficult to judge the end-point [2] The procedure, described by step 1 to step 13, investigated the effect of surface area to volume ratio on diffusion, using the time taken to reach the end-point. Think about how you could modify this procedure to investigate the effect of ascorbic acid concentration on the time taken to reach the end-point. (ii) The size of the agar cube should be standardised. Look at your results in (a)(ii) and state a size of agar cube that is appropriate to use. size of agar cube .......................................................... [1] (iii) Describe how you would modify the procedure to investigate the effect of ascorbic acid concentration on the time taken to reach the end-point. ........................................................................................................................................... ........................................................................................................................................... ........................................................................................................................................... ........................................................................................................................................... ........................................................................................................................................... ........................................................................................................................................... ........................................................................................................................................... ..................................................................................................................................... [2] (c) Ascorbic acid is found in plants. Iodine solution can be used to determine the concentration of ascorbic acid in a plant extract. Fig. 1.4 shows a calibration graph that can be used to estimate the concentration of ascorbic acid in a plant extract. 40 30 number of drops of iodine solution 20 10 0 0.0 0.2 0.4 0.6 0.8 1.0 ascorbic acid concentration / mg cm–3 Fig. 1.4 A student carried out an investigation to compare the concentration of ascorbic acid in different plant extracts. The results are shown in Table 1.4. Table 1.4 plant extract number of drops of iodine ascorbic acid concentration solution / mg cm–3 C 40 0.95 D 8 0.19 E 26 0.62 F 13 G 2 0.04 (i) Using the graph in Fig. 1.4, complete Table 1.4 for plant extract F. [1] (ii) Plot a bar chart of the data in Table 1.4 on the grid in Fig. 1.5. Use a sharp pencil for drawing graphs. Fig. 1.5 [4] [Total: 22]
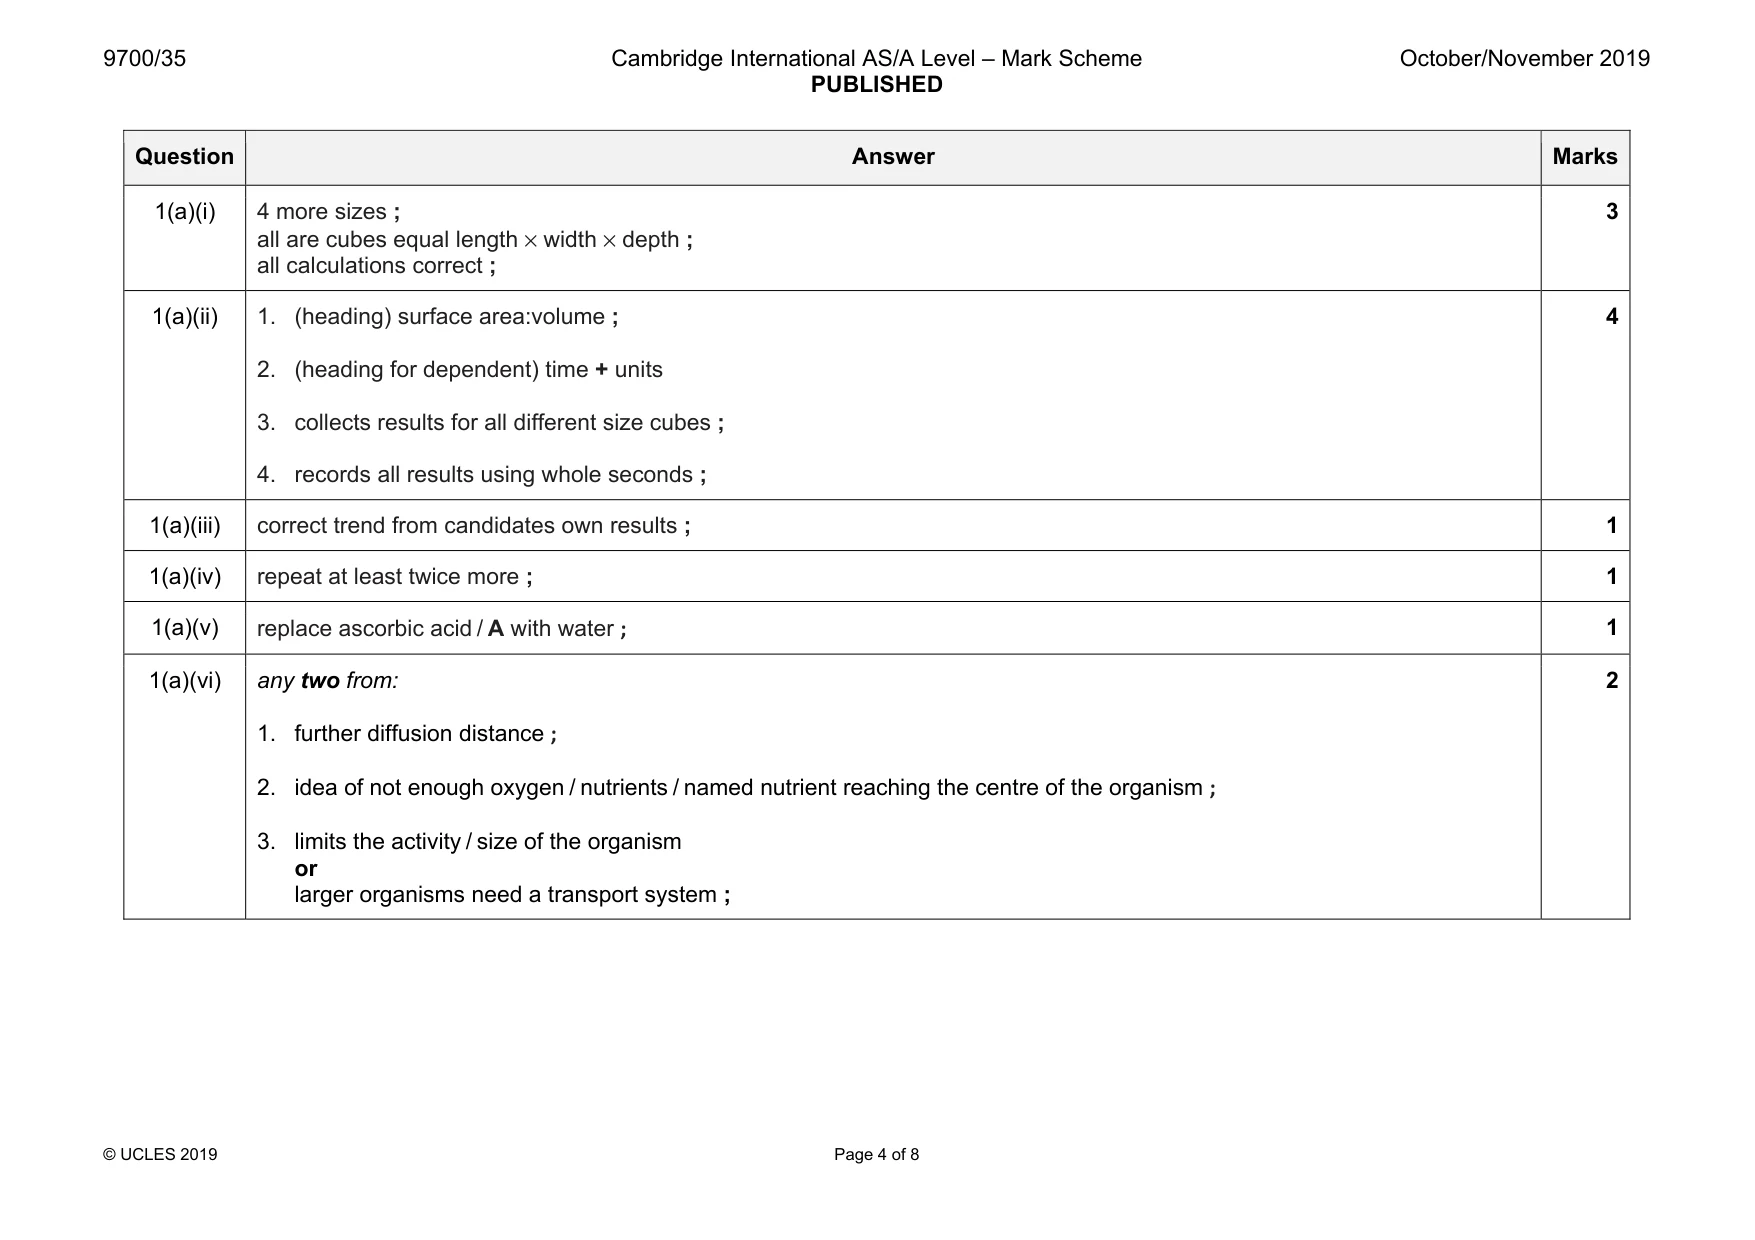
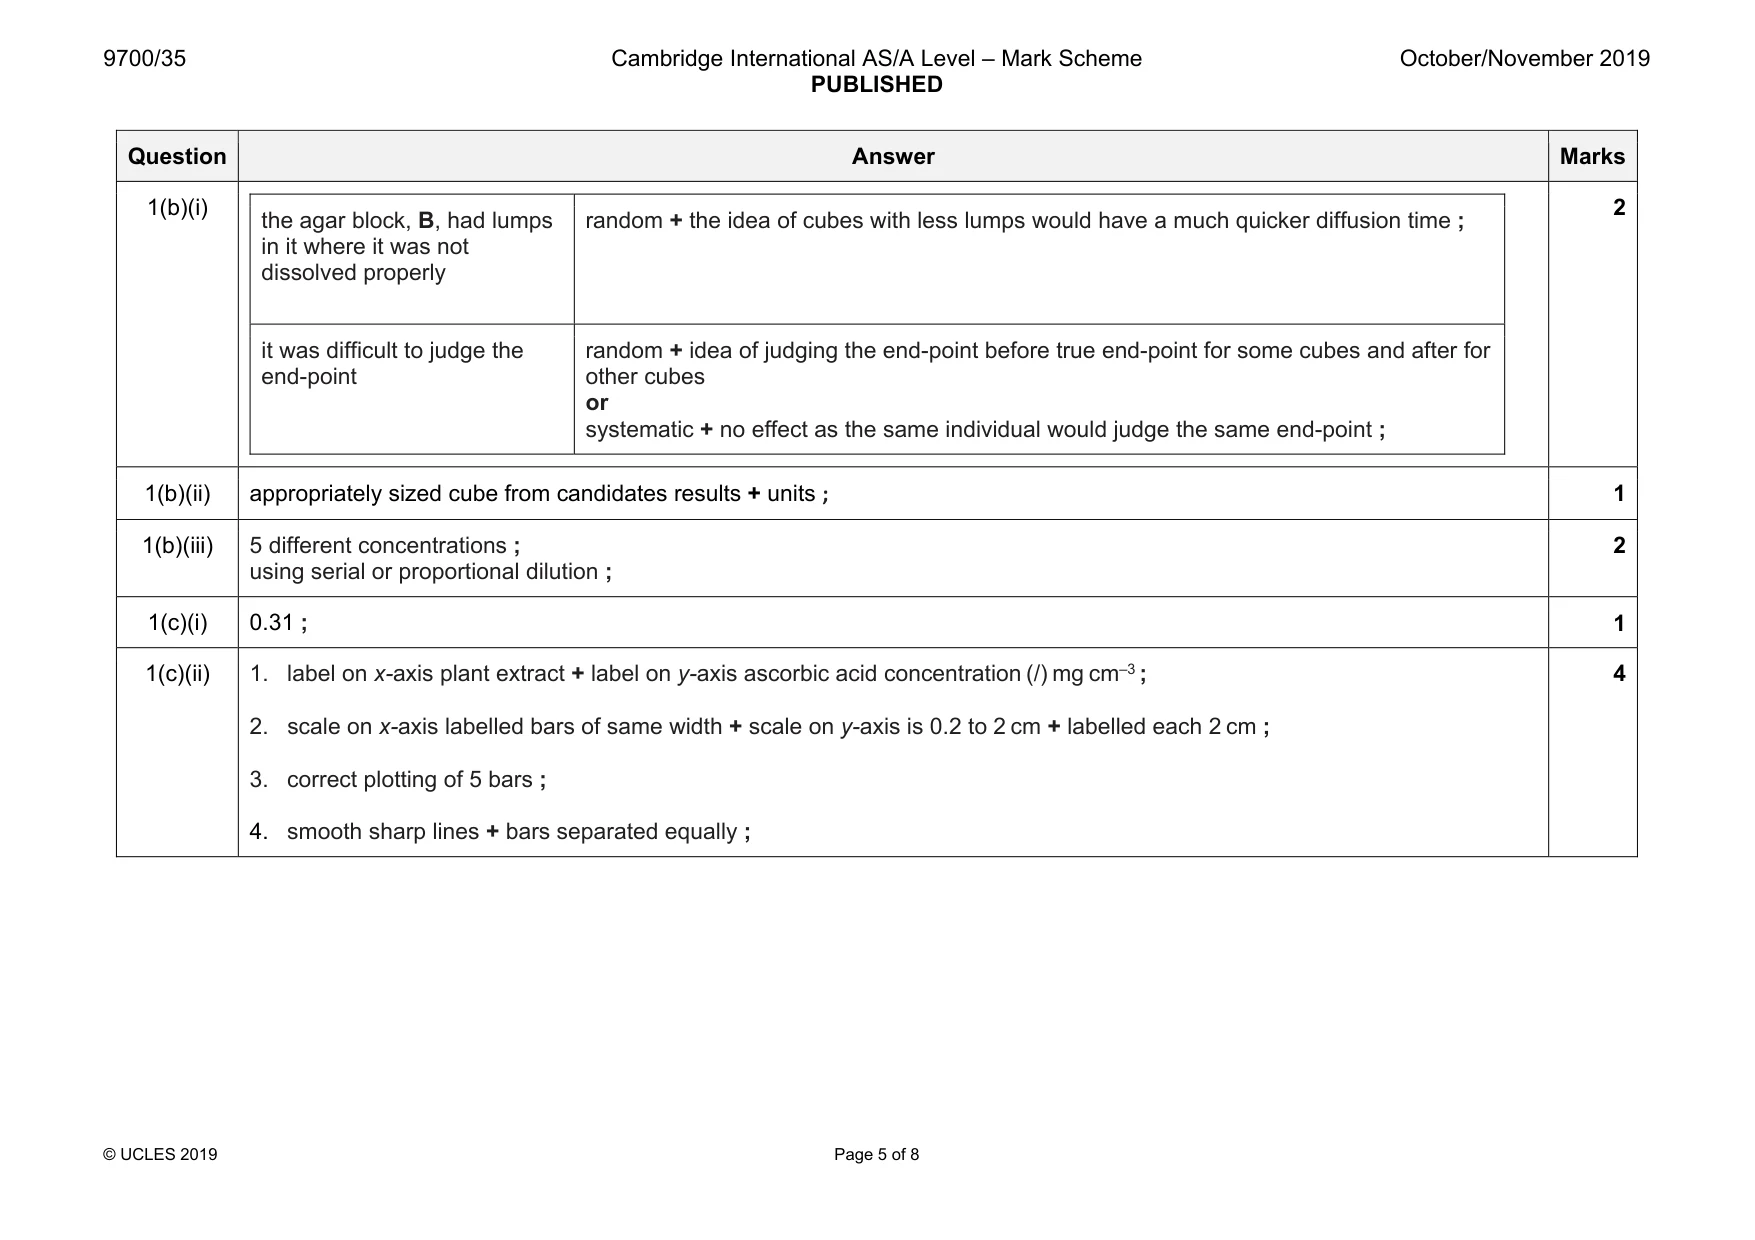
Mark scheme: 1(a)(i) 4 more sizes ; all are cubes equal length × width × depth ; all calculations correct ; 3 1(a)(ii) 1. (heading) surface area:volume ; 2. (heading for dependent) time + units 3. collects results for all different size cubes ; 4. records all results using whole seconds ; 4 1(a)(iii) correct trend from candidates own results ; 1 1(a)(iv) repeat at least twice more ; 1 1(a)(v) replace ascorbic acid / A with water ; 1 1(a)(vi) any two from: 1. further diffusion distance ; 2. idea of not enough oxygen / nutrients / named nutrient reaching the centre of the organism ; 3. limits the activity / size of the organism or larger organisms need a transport system ; 2 Question Answer Marks 1(b)(i) the agar block, B, had lumps in it where it was not dissolved properly random + the idea of cubes with less lumps would have a much quicker diffusion time ; it was difficult to judge the end-point random + idea of judging the end-point before true end-point for some cubes and after for other cubes or systematic + no effect as the same individual would judge the same end-point ; 2 1(b)(ii) appropriately sized cube from candidates results + units ; 1 1(b)(iii) 5 different concentrations ; using serial or proportional dilution ; 2 1(c)(i) 0.31 ; 1 1(c)(ii) 1. label on x-axis plant extract + label on y-axis ascorbic acid concentration (/) mg cm–3 ; 2. scale on x-axis labelled bars of same width + scale on y-axis is 0.2 to 2 cm + labelled each 2 cm ; 3. correct plotting of 5 bars ; 4. smooth sharp lines + bars separated equally ; 4
Q2 · L1 is a slide of a stained transverse section through a plant root
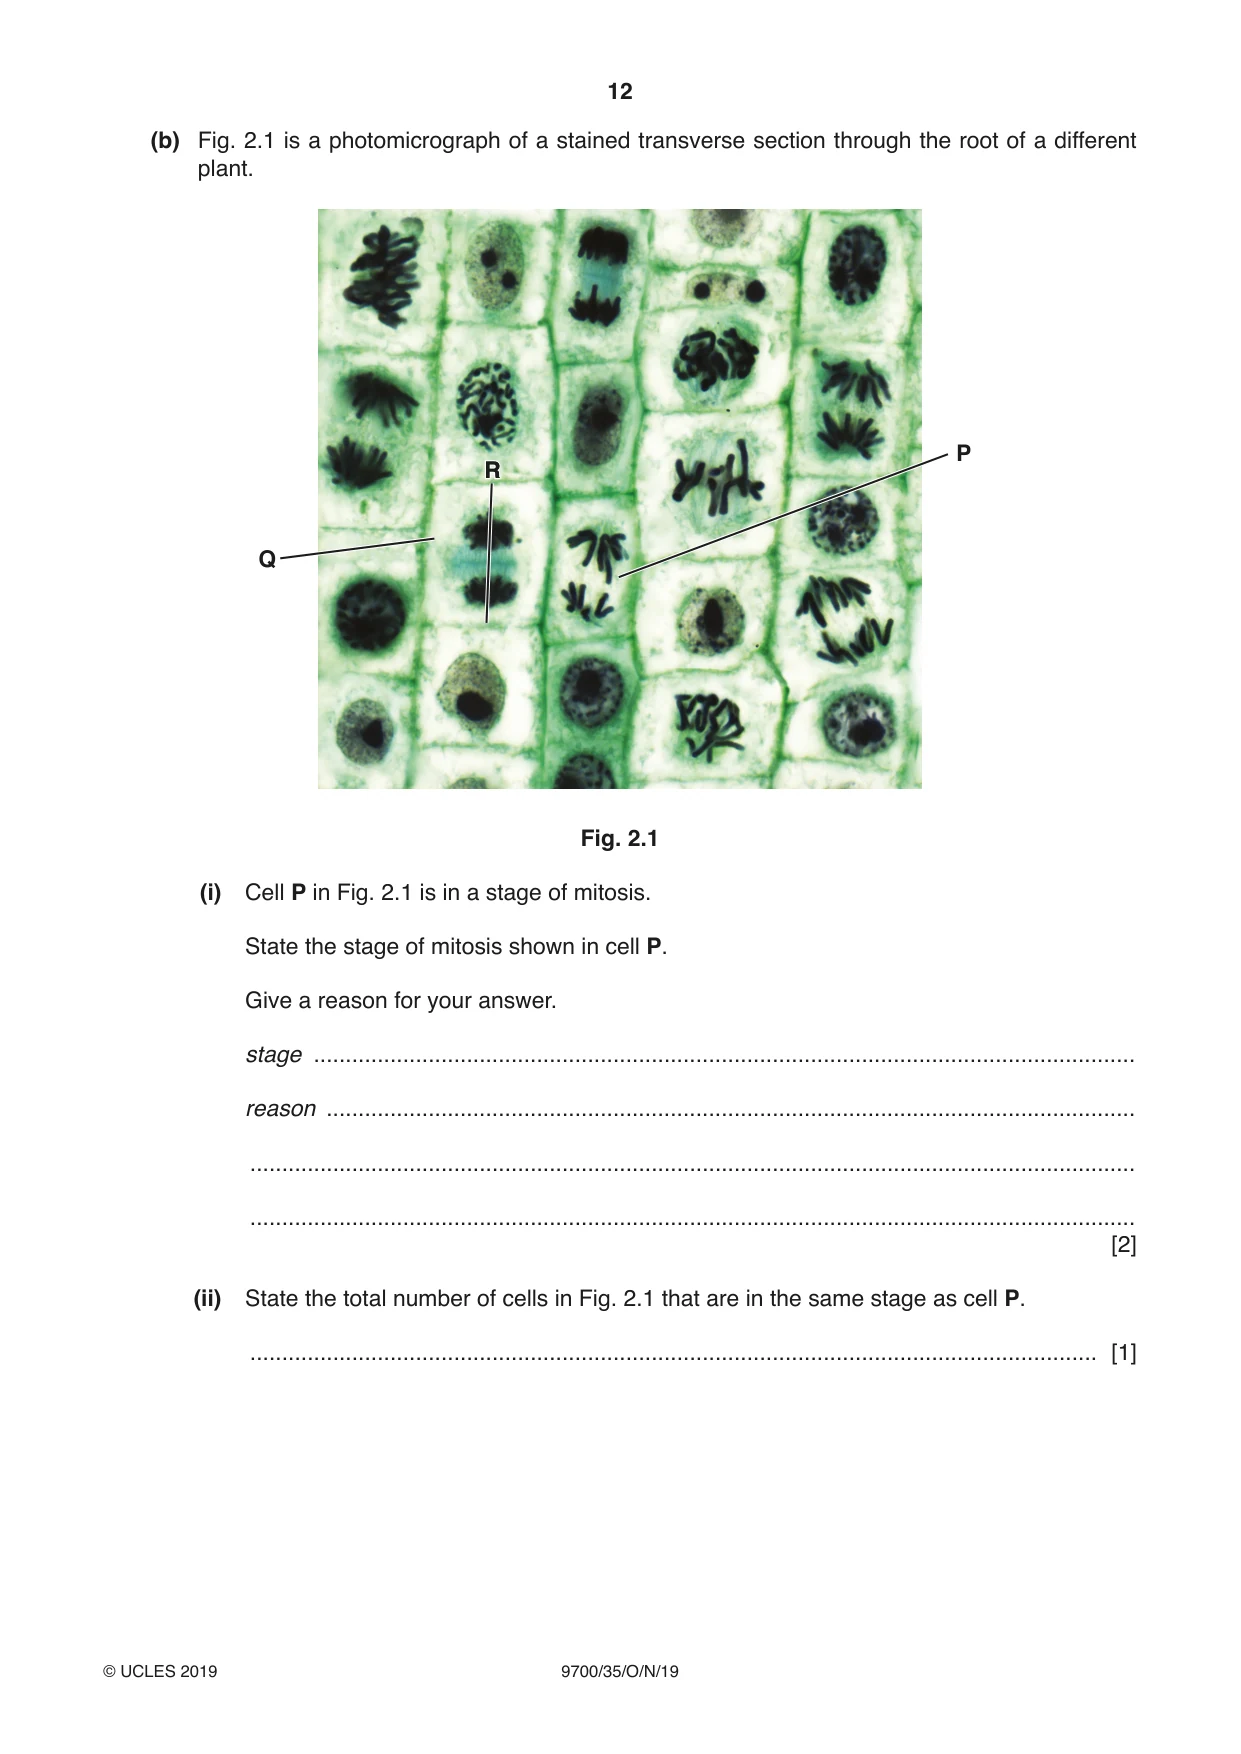
2 L1 is a slide of a stained transverse section through a plant root. You are not expected to be familiar with this specimen. Use a sharp pencil for drawing. You are expected to draw the correct shape and proportions of the different tissues. (a) (i) Draw a large plan diagram of the whole root. Use one ruled label line and label to identify the epidermis. [5] (ii) Observe the cells in the xylem of the root on L1. Select one large xylem vessel and three adjacent, touching vessels which show observable features of the xylem. Each cell must touch at least two of the other cells. Make a large drawing of this group of four touching cells. Use one ruled label line and label to identify the lumen in one of the cells. [6] (b) Fig. 2.1 is a photomicrograph of a stained transverse section through the root of a different plant. P R Q Fig. 2.1 (i) Cell P in Fig. 2.1 is in a stage of mitosis. State the stage of mitosis shown in cell P. Give a reason for your answer. stage ................................................................................................................................. reason ............................................................................................................................... ........................................................................................................................................... ........................................................................................................................................... [2] (ii) State the total number of cells in Fig. 2.1 that are in the same stage as cell P. ..................................................................................................................................... [1]
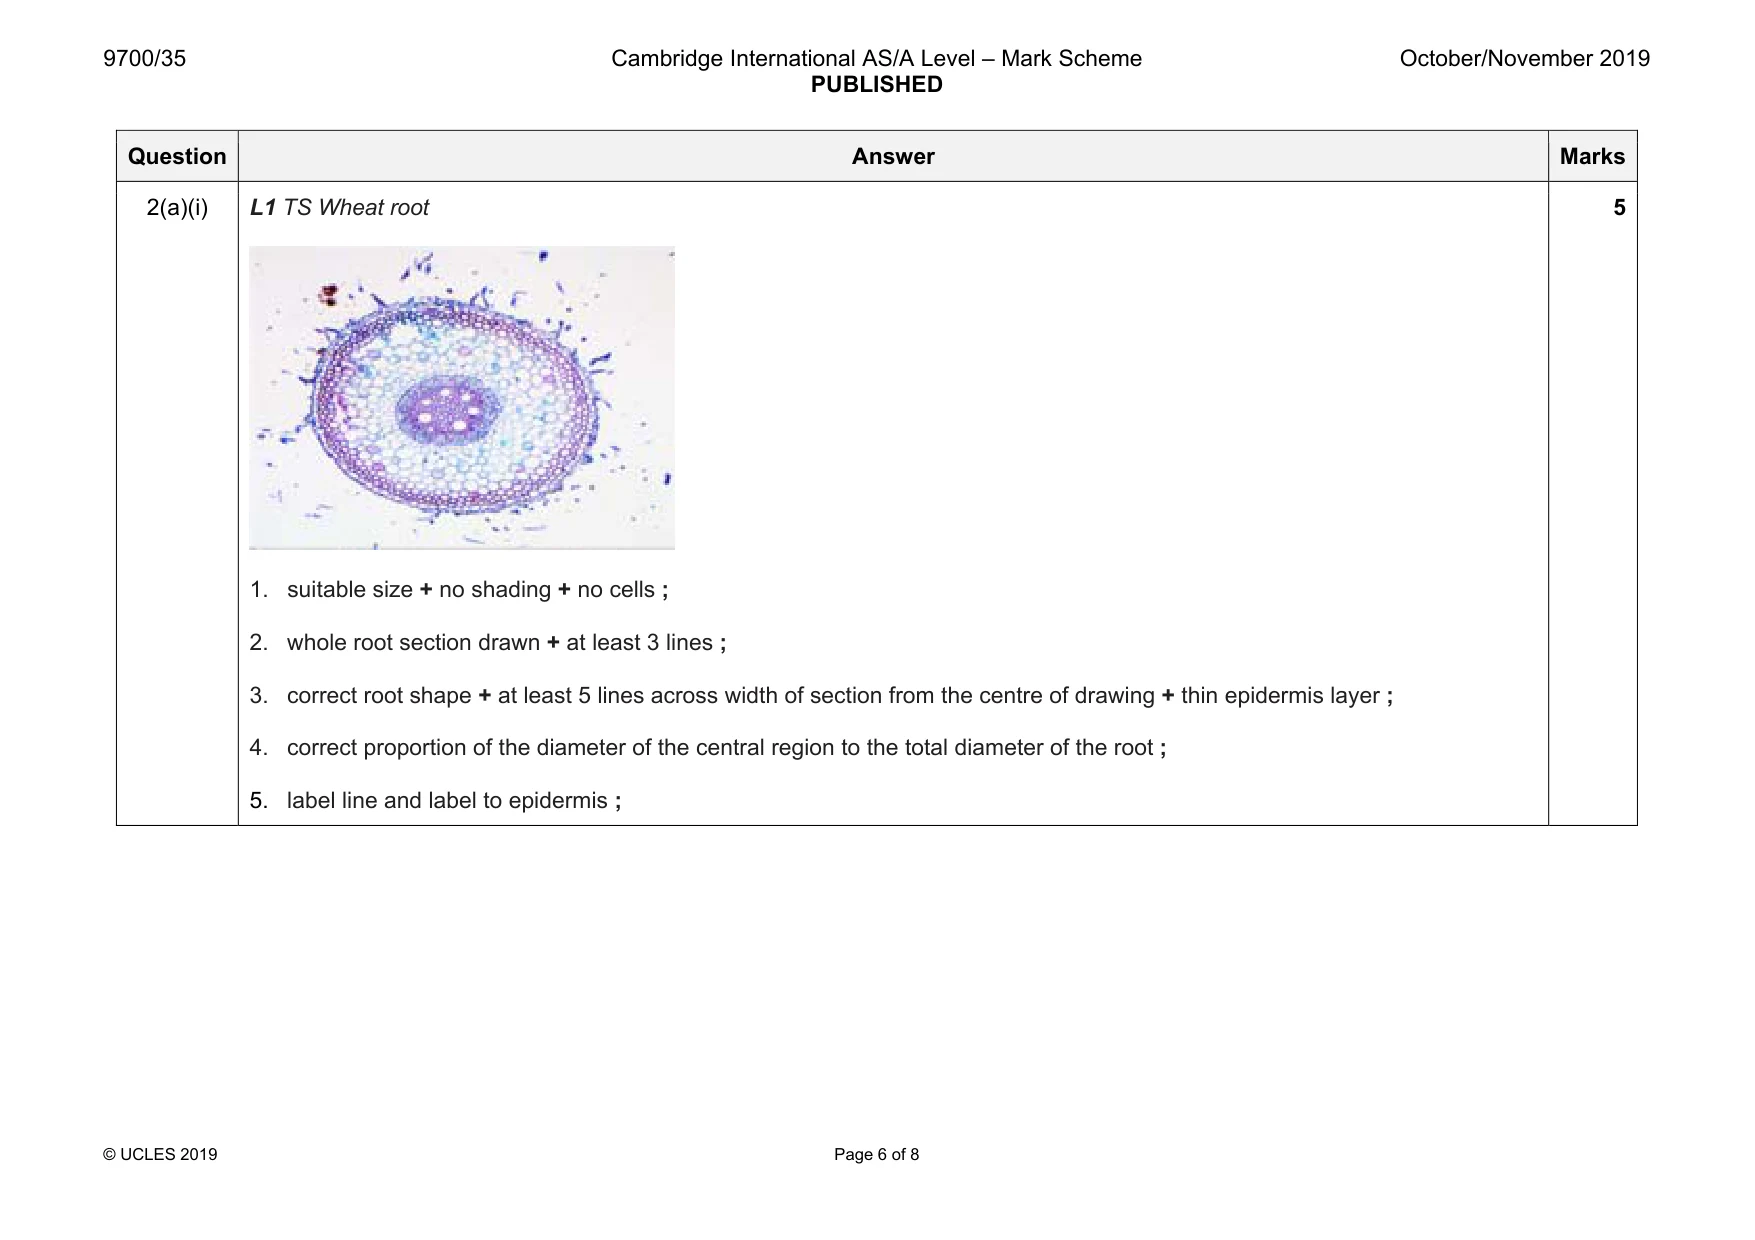
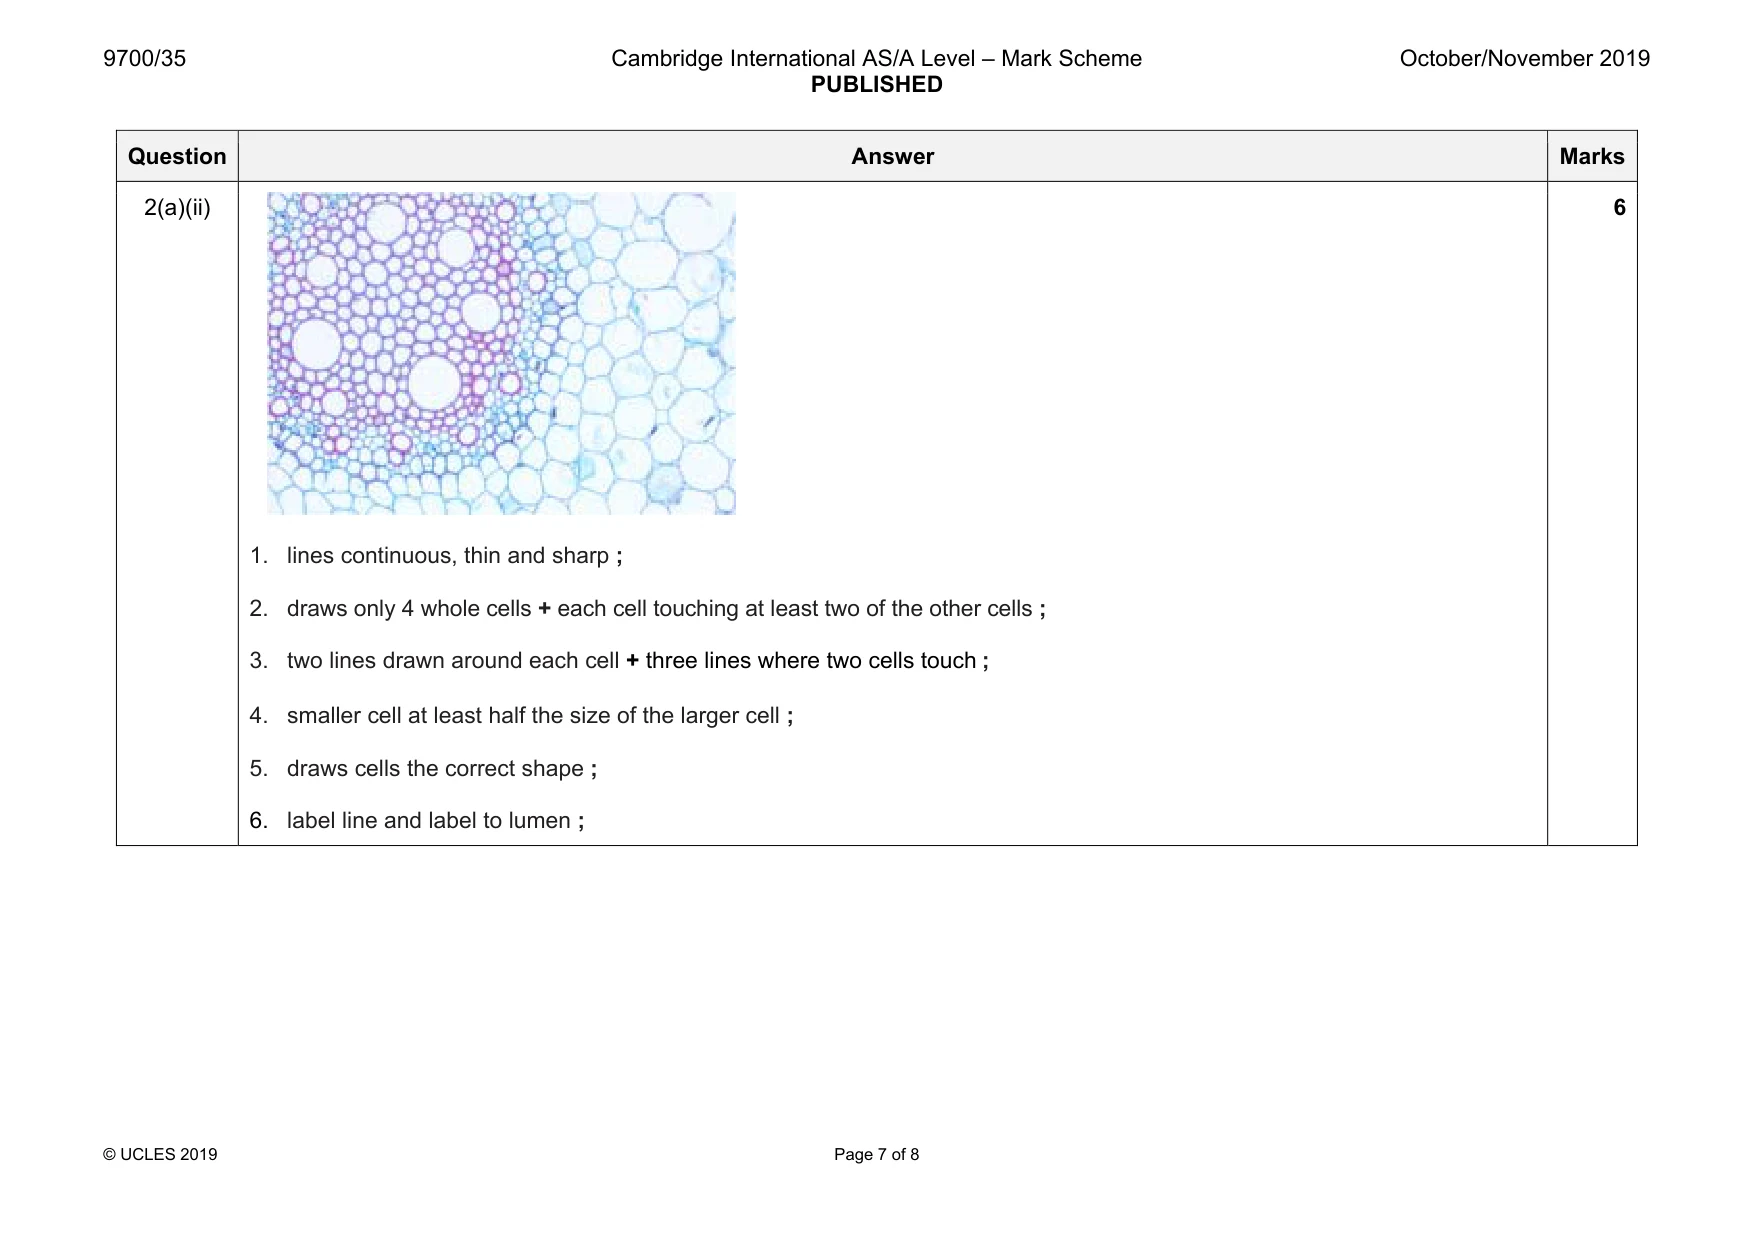
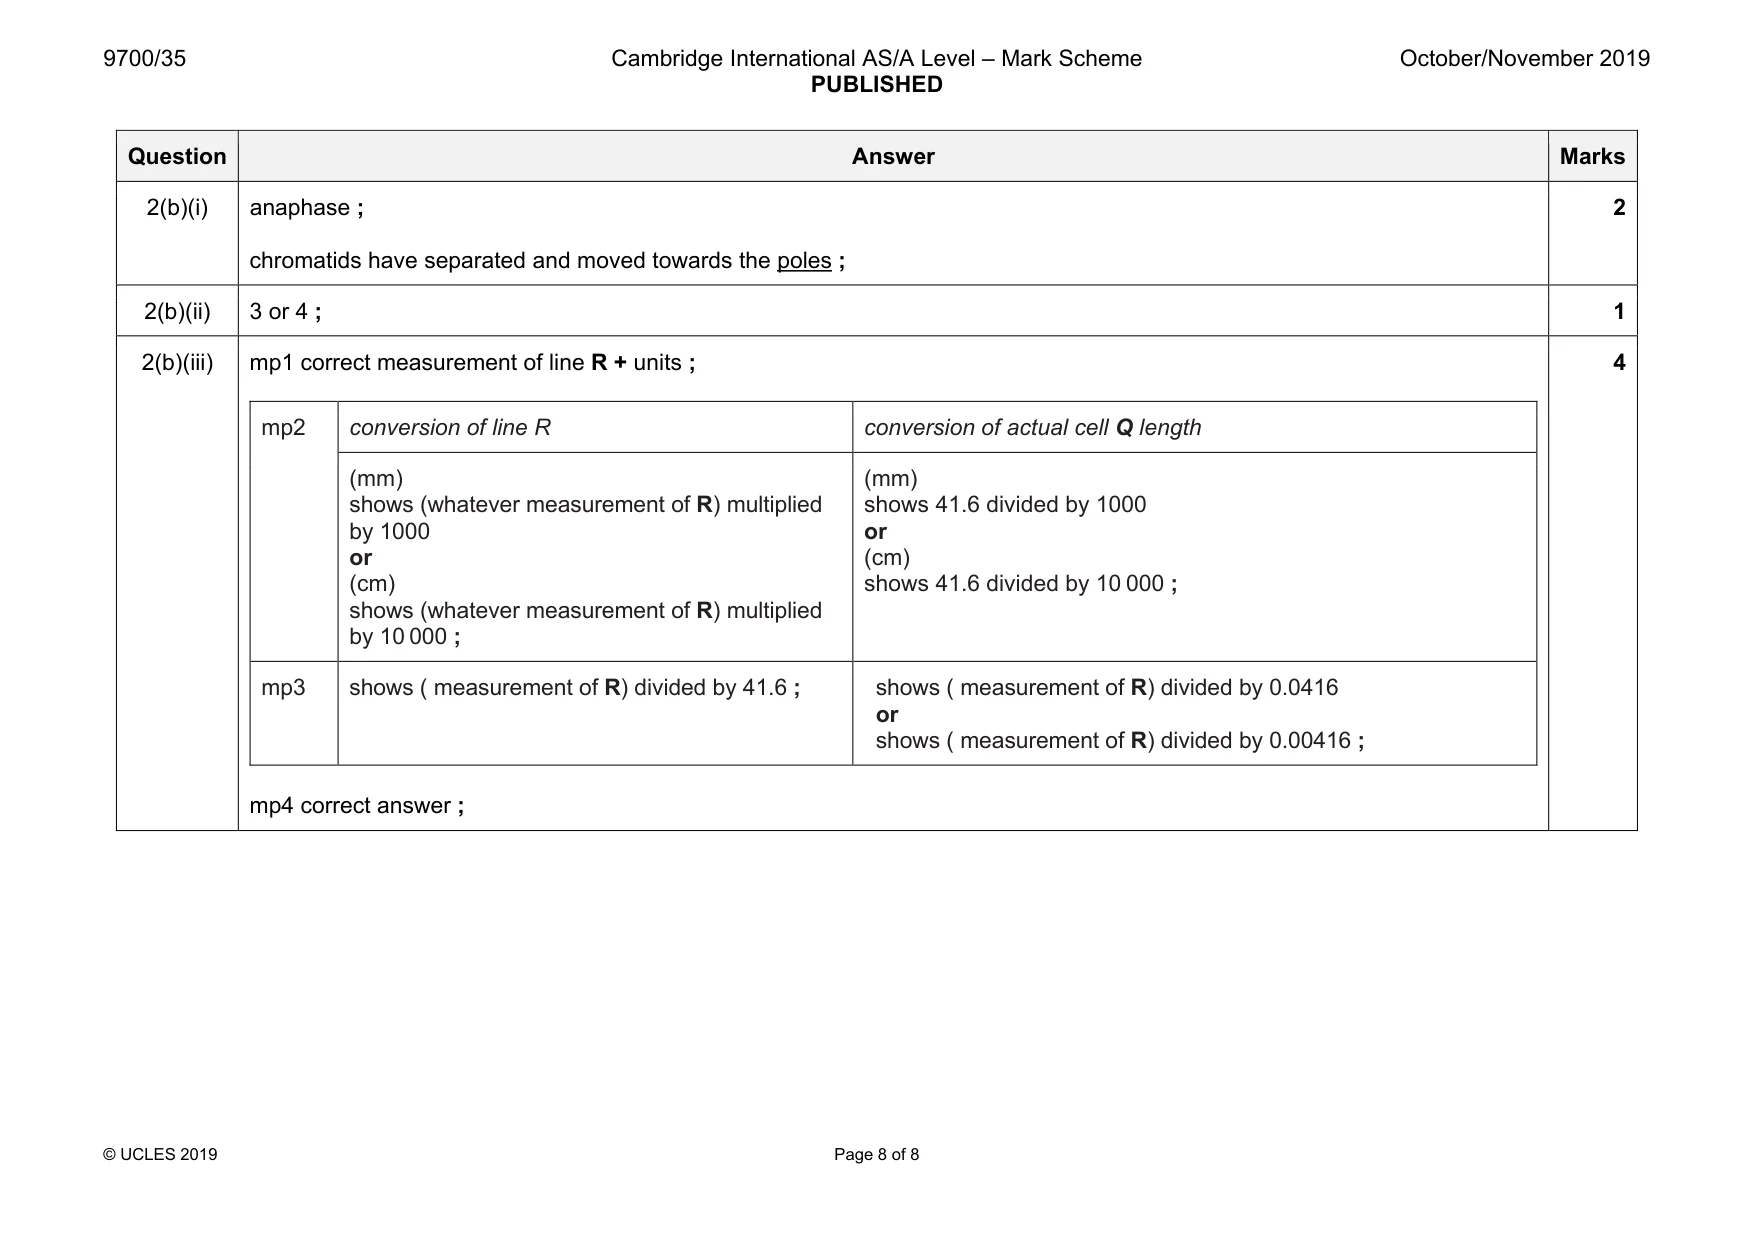
Mark scheme: 2(a)(i) L1 TS Wheat root 1. suitable size + no shading + no cells ; 2. whole root section drawn + at least 3 lines ; 3. correct root shape + at least 5 lines across width of section from the centre of drawing + thin epidermis layer ; 4. correct proportion of the diameter of the central region to the total diameter of the root ; 5. label line and label to epidermis ; 5 Question Answer Marks 2(a)(ii) 1. lines continuous, thin and sharp ; 2. draws only 4 whole cells + each cell touching at least two of the other cells ; 3. two lines drawn around each cell + three lines where two cells touch ; 4. smaller cell at least half the size of the larger cell ; 5. draws cells the correct shape ; 6. label line and label to lumen ; 6 Question Answer Marks 2(b)(i) anaphase ; chromatids have separated and moved towards the poles ; 2 2(b)(ii) 3 or 4 ; 1 2(b)(iii) mp1 correct measurement of line R + units ; mp2 conversion of line R conversion of actual cell Q length (mm) shows (whatever measurement of R) multiplied by 1000 or (cm) shows (whatever measurement of R) multiplied by 10 000 ; (mm) shows 41.6 divided by 1000 or (cm) shows 41.6 divided by 10 000 ; mp3 shows ( measurement of R) divided by 41.6 ; shows ( measurement of R) divided by 0.0416 or shows ( measurement of R) divided by 0.00416 ; mp4 correct answer ; 4
What was in this paper
The subtopics covered by these 2 questions, and how many questions each got. Open one in a new tab to see every Cambridge question on it.
What you needed in this session
Cambridge’s own grade thresholds for 2019 Oct/Nov, Paper 3 · Variant 5. A higher threshold means an easier paper — the bar moves with how the cohort did.