Cambridge A Level Biology 9700 — 2019 Feb/March Paper 4 · Variant 2
9700/42/F/M/19 · 10 questions · 100 marks · ≈113 min
The question paper and its mark scheme, free to read here and free to download. This is Cambridge’s own paper, exactly as it was sat.
Question paper32 pages








Mark scheme21 pages
Answers below. Sit the paper first if you are practising.
Questions as text
Q1 · The effect of light intensity on the rate of photosynthesis can be investigated using a…
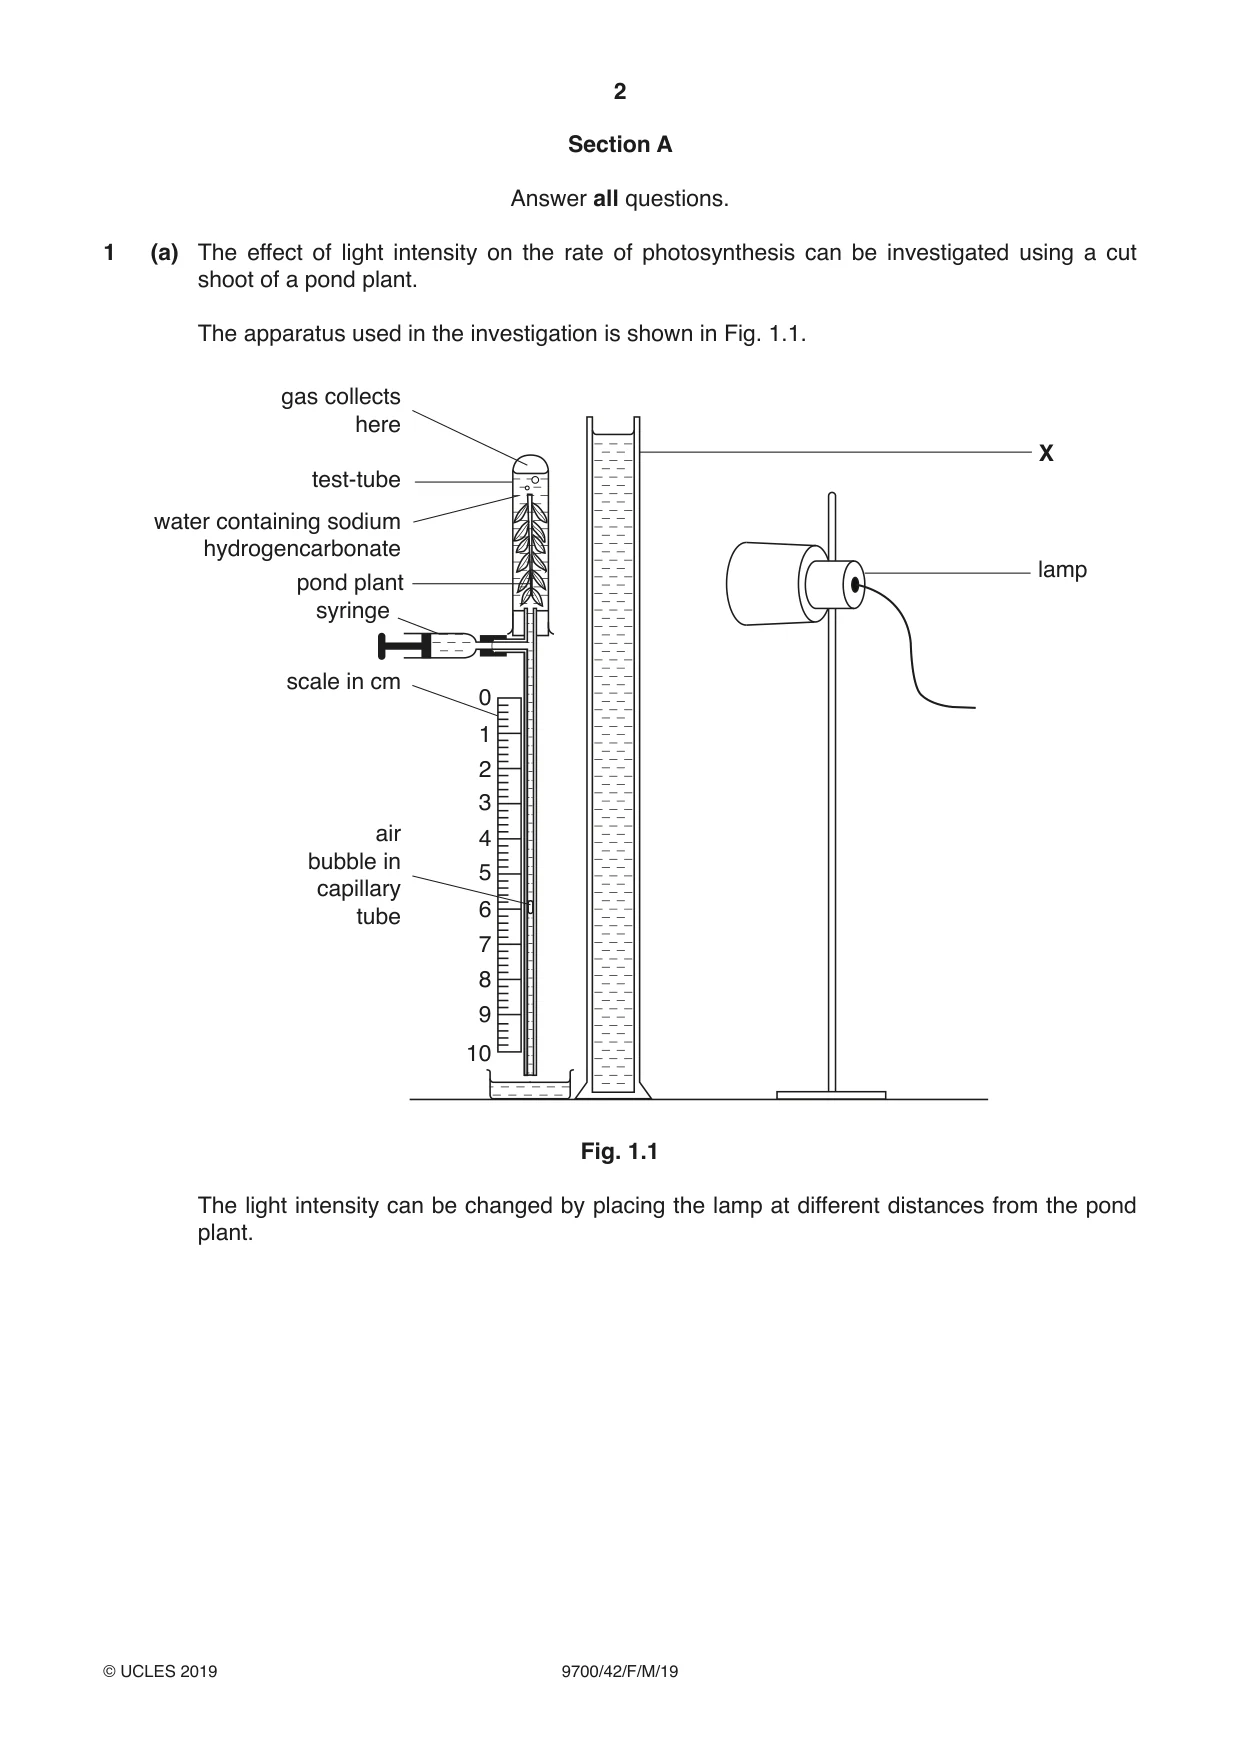
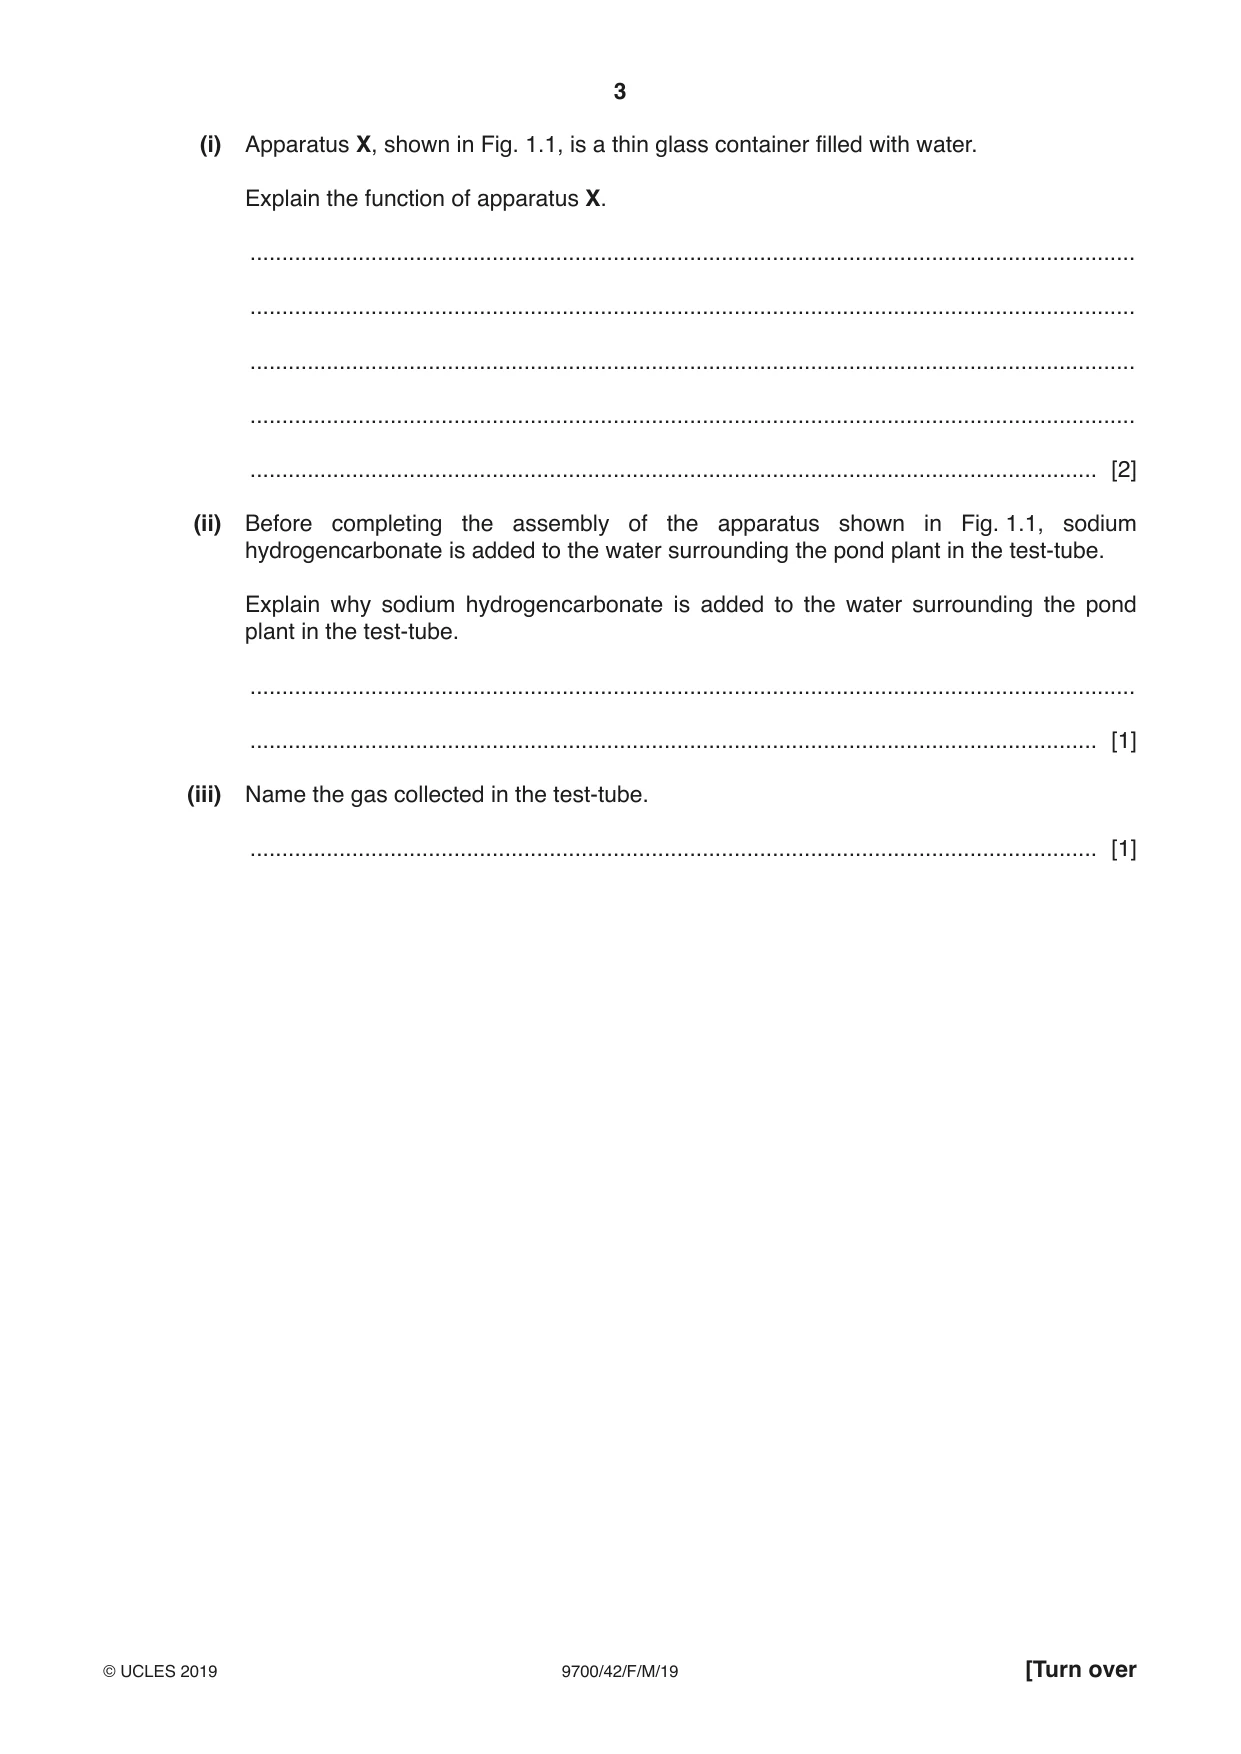
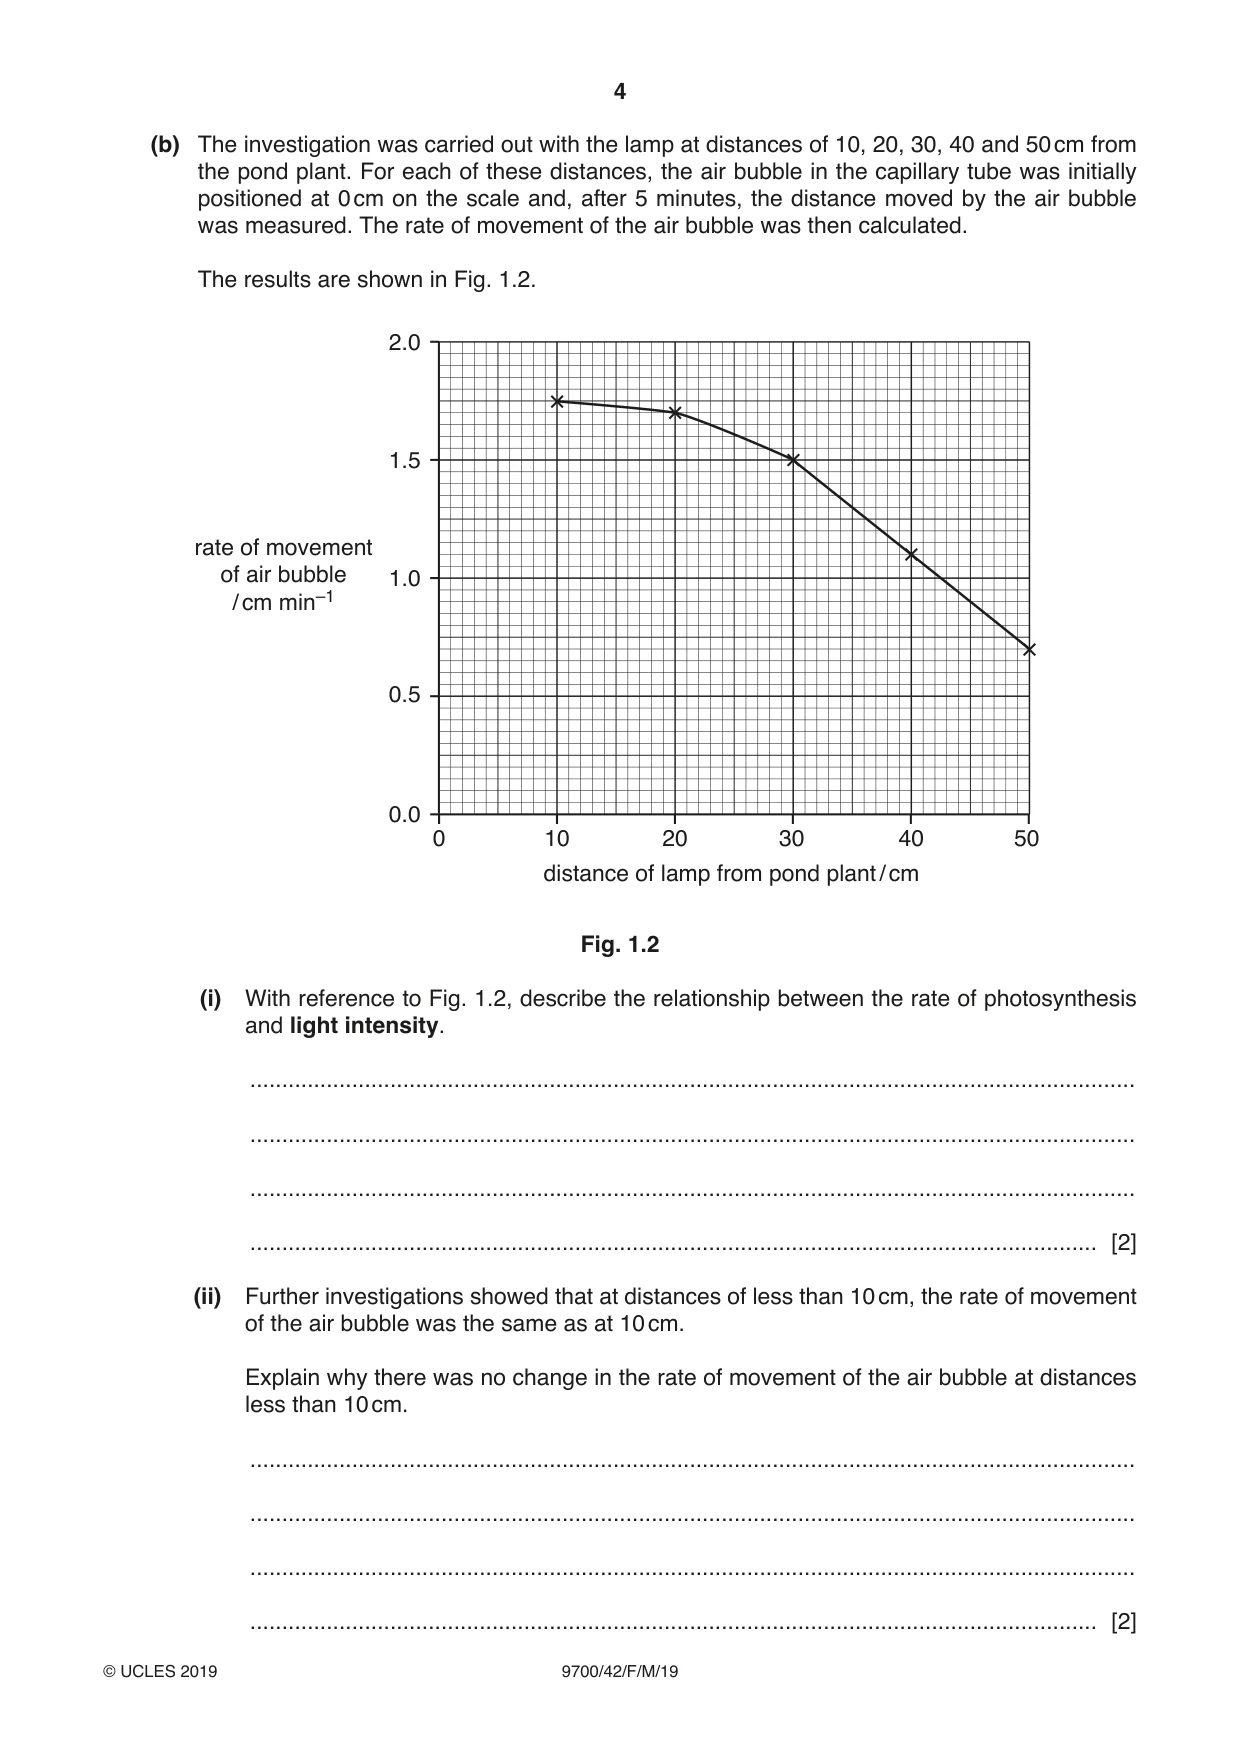
1 (a) The effect of light intensity on the rate of photosynthesis can be investigated using a cut shoot of a pond plant. The apparatus used in the investigation is shown in Fig. 1.1. gas collects here X test-tube water containing sodium hydrogencarbonate lamp pond plant syringe scale in cm 0 1 2 3 air 4 bubble in 5 capillary 6 tube 7 8 9 10 Fig. 1.1 The light intensity can be changed by placing the lamp at different distances from the pond plant. (i) Apparatus X, shown in Fig. 1.1, is a thin glass container filled with water. Explain the function of apparatus X. ........................................................................................................................................... ........................................................................................................................................... ........................................................................................................................................... ........................................................................................................................................... ..................................................................................................................................... [2] (ii) Before completing the assembly of the apparatus shown in Fig. 1.1, sodium hydrogencarbonate is added to the water surrounding the pond plant in the test-tube. Explain why sodium hydrogencarbonate is added to the water surrounding the pond plant in the test-tube. ........................................................................................................................................... ..................................................................................................................................... [1] (iii) Name the gas collected in the test-tube. ..................................................................................................................................... [1] (b) The investigation was carried out with the lamp at distances of 10, 20, 30, 40 and 50 cm from the pond plant. For each of these distances, the air bubble in the capillary tube was initially positioned at 0 cm on the scale and, after 5 minutes, the distance moved by the air bubble was measured. The rate of movement of the air bubble was then calculated. The results are shown in Fig. 1.2. 2.0 1.5 rate of movement of air bubble 1.0 / cm min–1 0.5 0.0 0 10 20 30 40 50 distance of lamp from pond plant / cm Fig. 1.2 (i) With reference to Fig. 1.2, describe the relationship between the rate of photosynthesis and light intensity. ........................................................................................................................................... ........................................................................................................................................... ........................................................................................................................................... ..................................................................................................................................... [2] (ii) Further investigations showed that at distances of less than 10 cm, the rate of movement of the air bubble was the same as at 10 cm. Explain why there was no change in the rate of movement of the air bubble at distances less than 10 cm. ........................................................................................................................................... ........................................................................................................................................... ........................................................................................................................................... ..................................................................................................................................... [2] (c) Some of the light energy absorbed by the pond plant is used in cyclic photophosphorylation. Outline the process of cyclic photophosphorylation. ................................................................................................................................................... ................................................................................................................................................... ................................................................................................................................................... ................................................................................................................................................... ................................................................................................................................................... ................................................................................................................................................... ................................................................................................................................................... ................................................................................................................................................... ................................................................................................................................................... ................................................................................................................................................... ............................................................................................................................................. [5] [Total: 13]
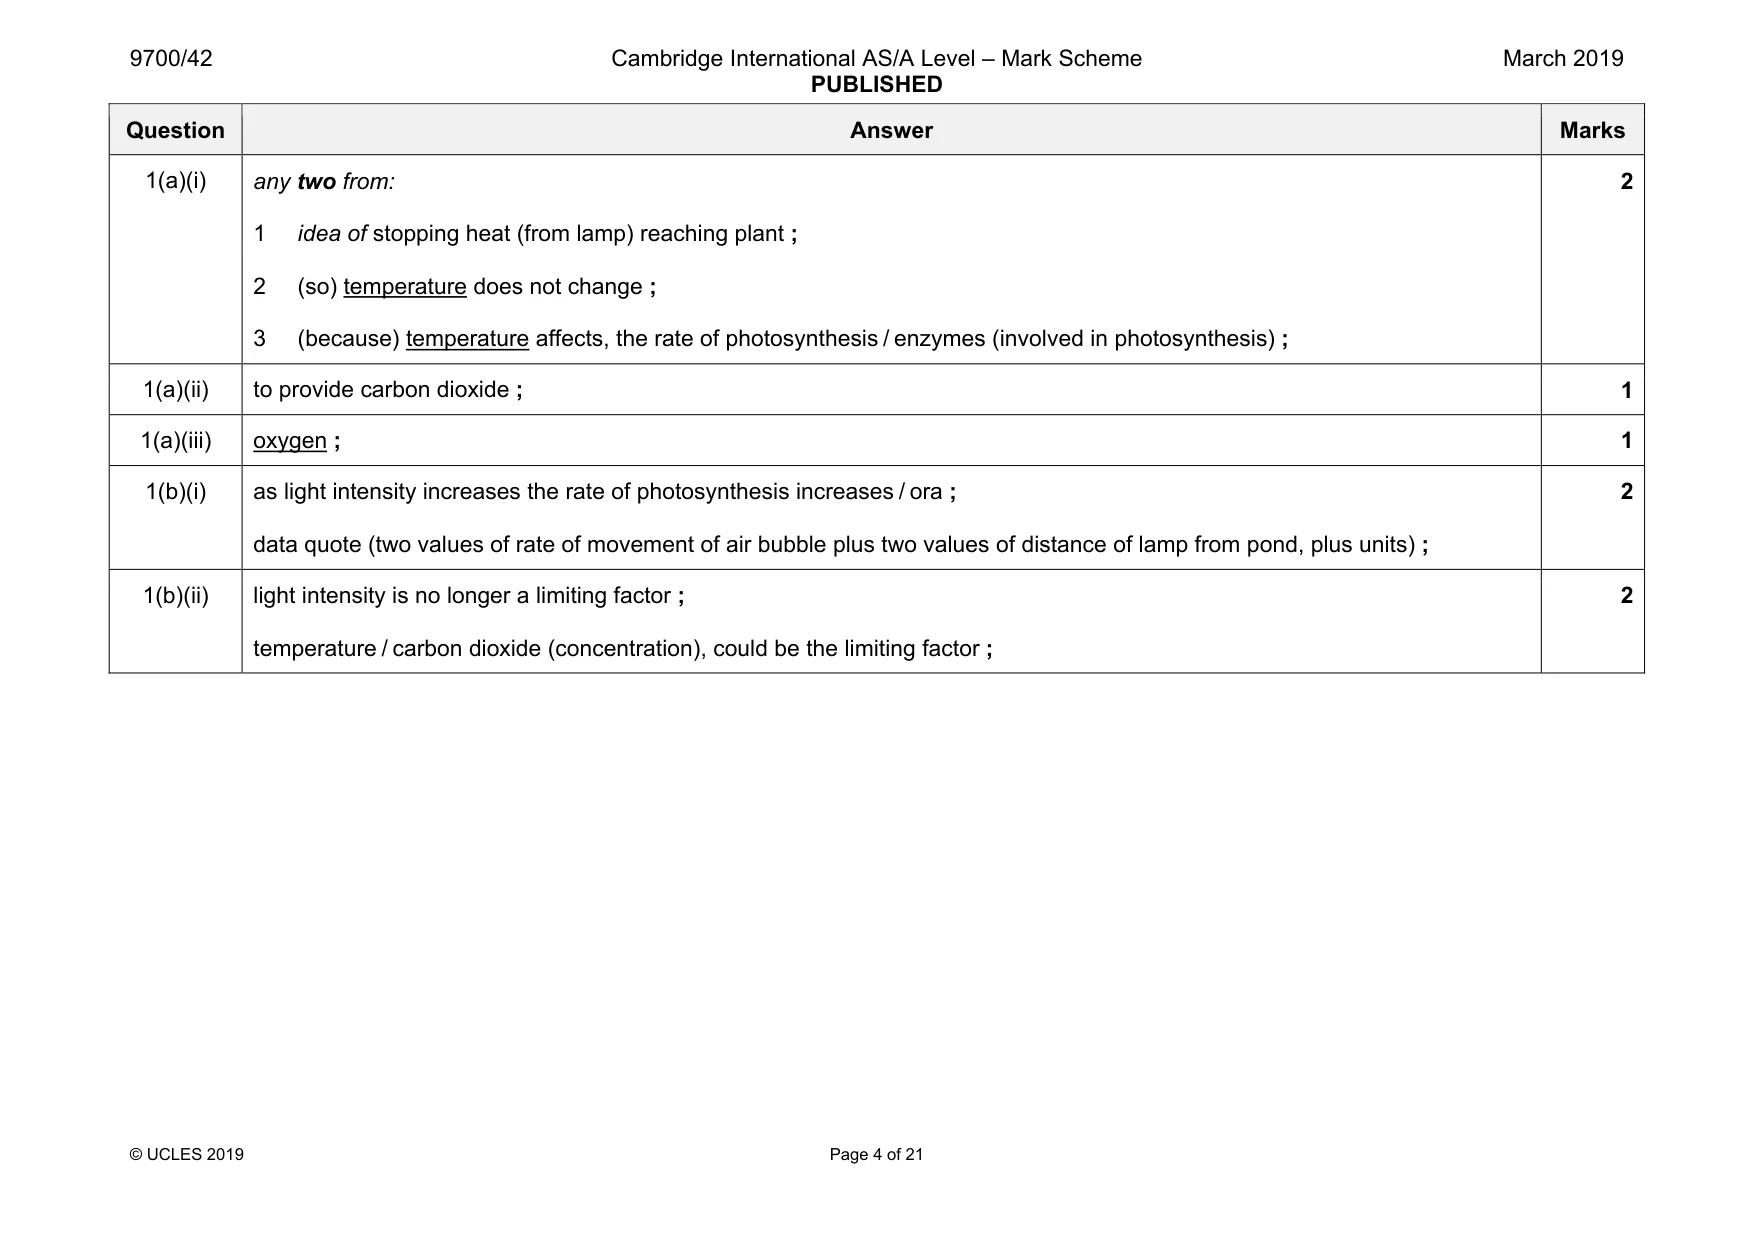
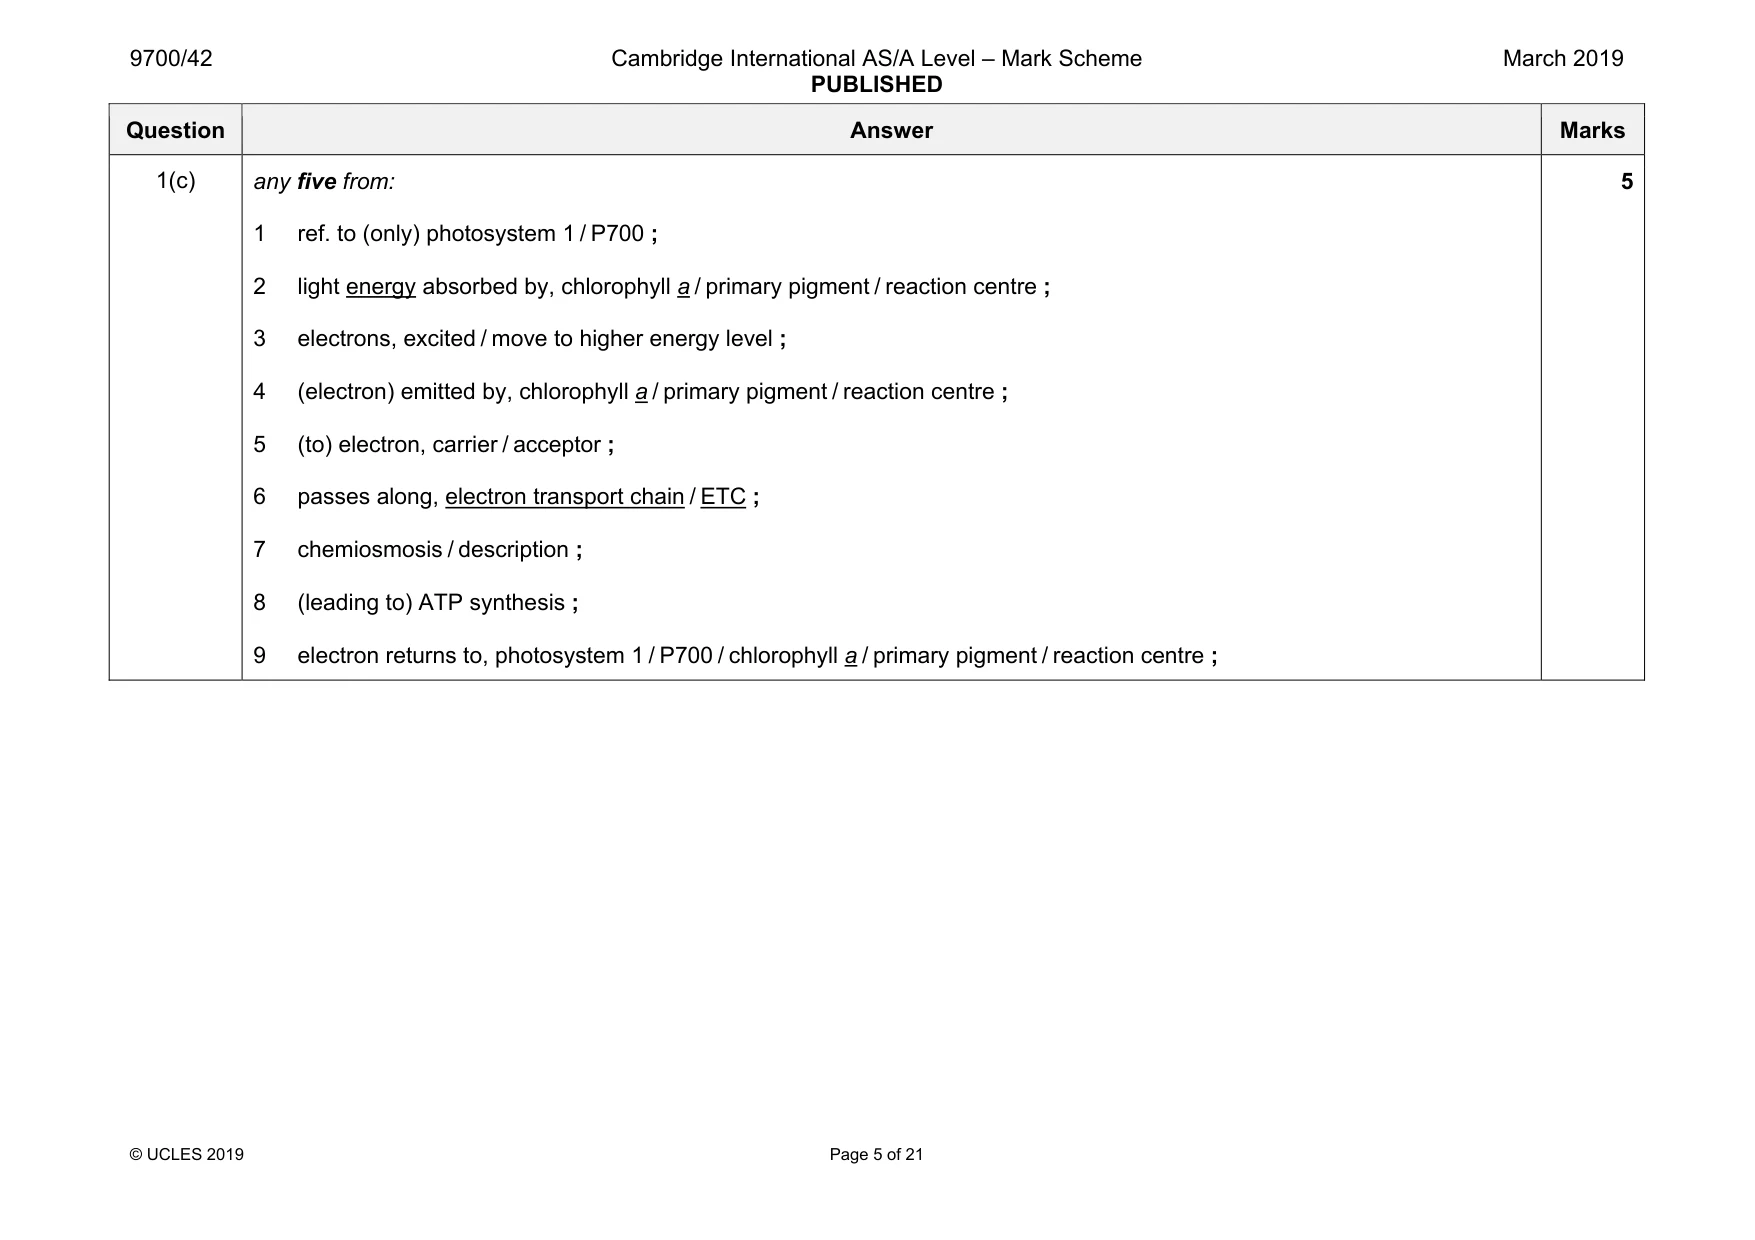
Mark scheme: 1(a)(i) any two from: 1 idea of stopping heat (from lamp) reaching plant ; 2 (so) temperature does not change ; 3 (because) temperature affects, the rate of photosynthesis / enzymes (involved in photosynthesis) ; 2 1(a)(ii) to provide carbon dioxide ; 1 1(a)(iii) oxygen ; 1 1(b)(i) as light intensity increases the rate of photosynthesis increases / ora ; data quote (two values of rate of movement of air bubble plus two values of distance of lamp from pond, plus units) ; 2 1(b)(ii) light intensity is no longer a limiting factor ; temperature / carbon dioxide (concentration), could be the limiting factor ; 2 Question Answer Marks 1(c) any five from: 1 ref. to (only) photosystem 1 / P700 ; 2 light energy absorbed by, chlorophyll a / primary pigment / reaction centre ; 3 electrons, excited / move to higher energy level ; 4 (electron) emitted by, chlorophyll a / primary pigment / reaction centre ; 5 (to) electron, carrier / acceptor ; 6 passes along, electron transport chain / ETC ; 7 chemiosmosis / description ; 8 (leading to) ATP synthesis ; 9 electron returns to, photosystem 1 / P700 / chlorophyll a / primary pigment / reaction centre ; 5
Q2 · The hormone glucagon is an example of a cell signalling molecule
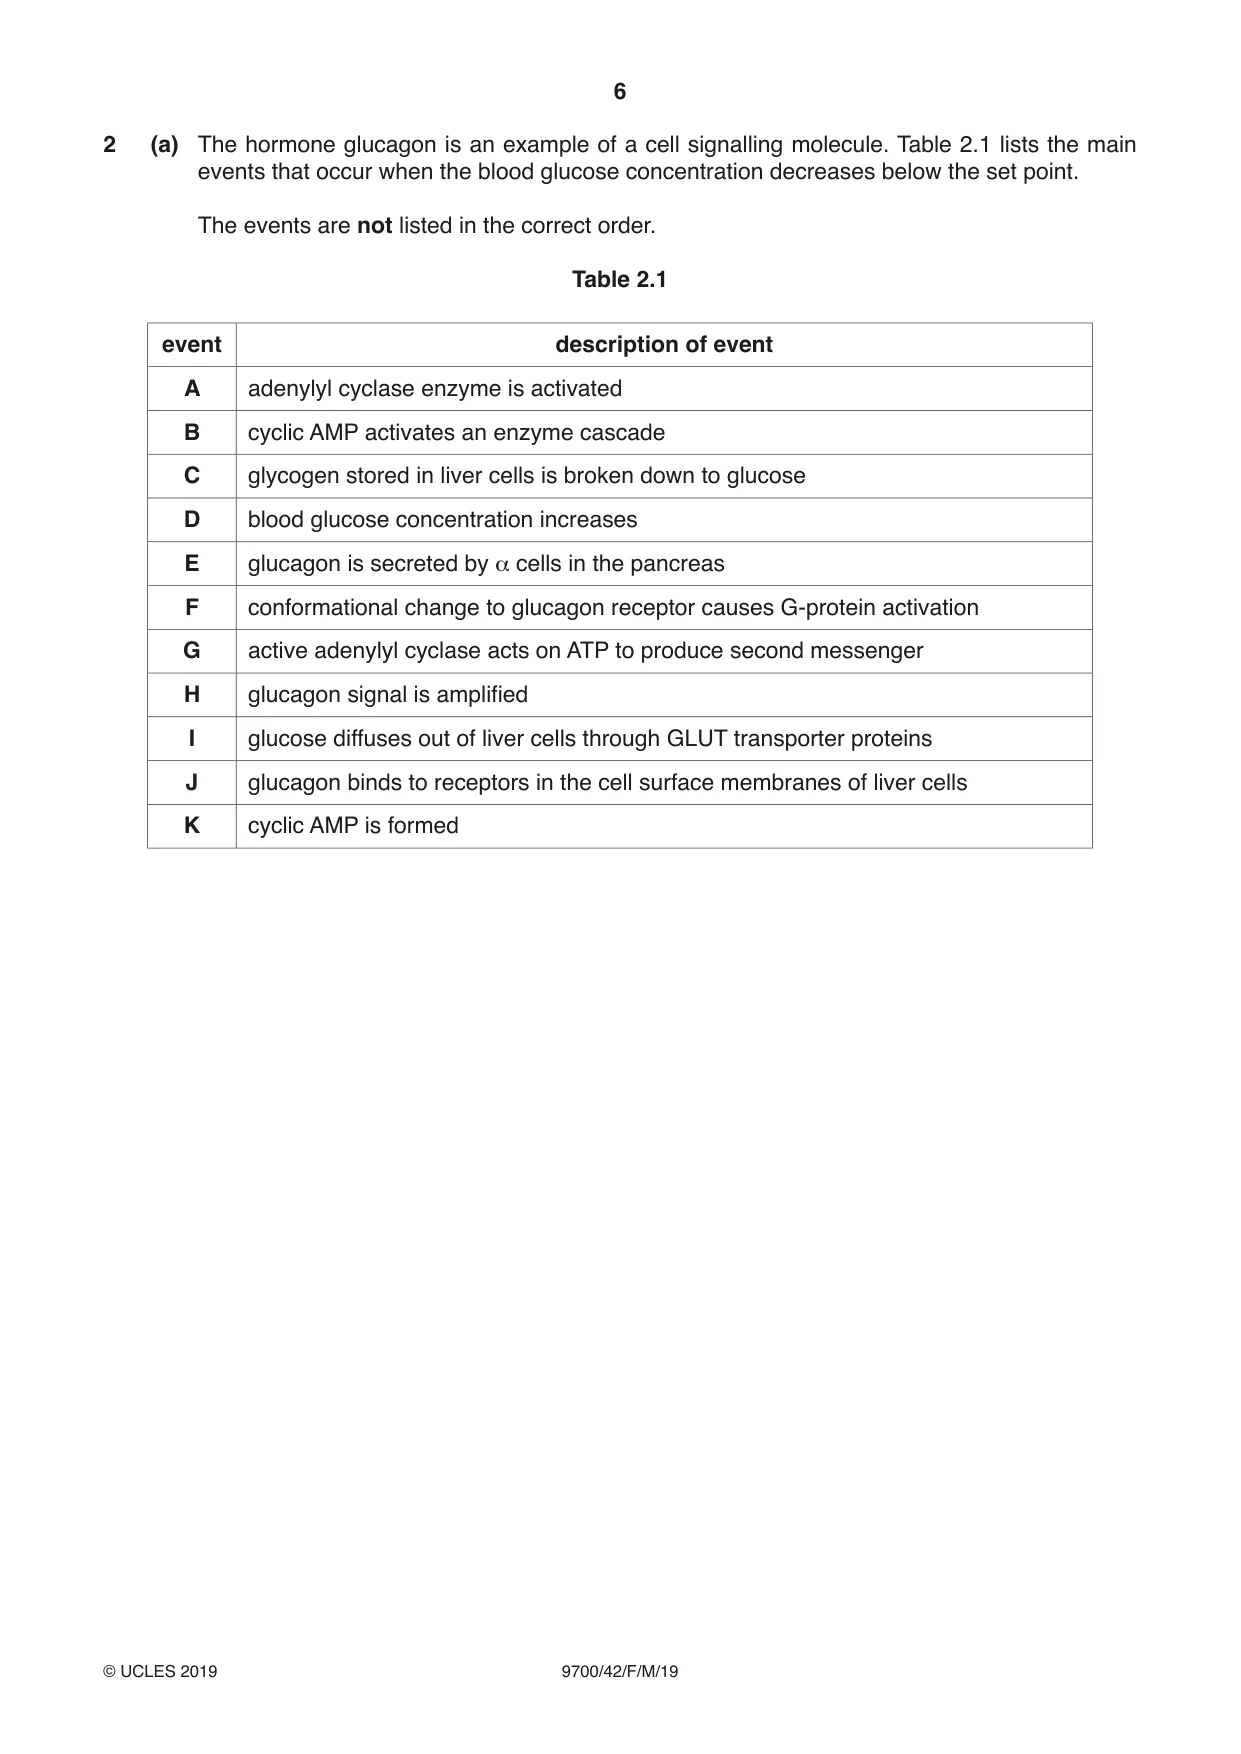
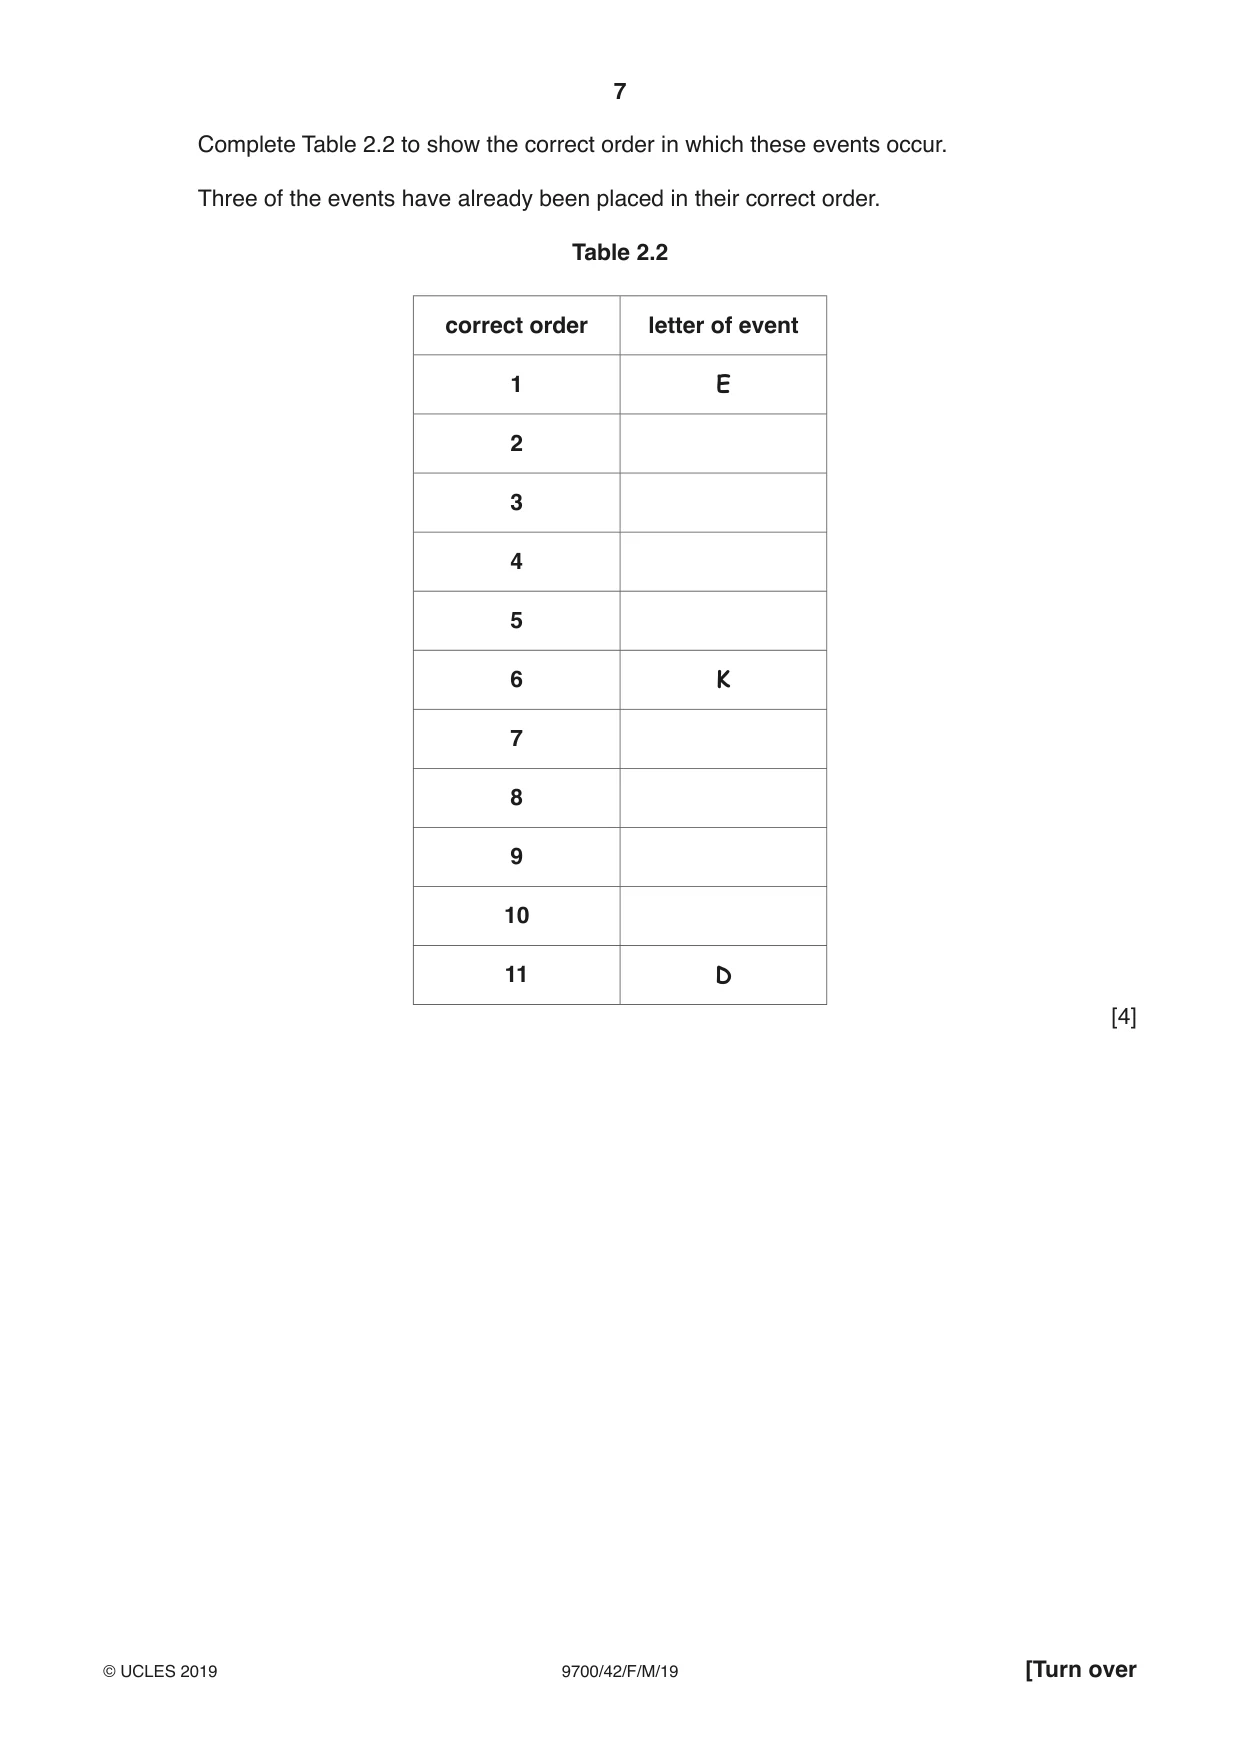
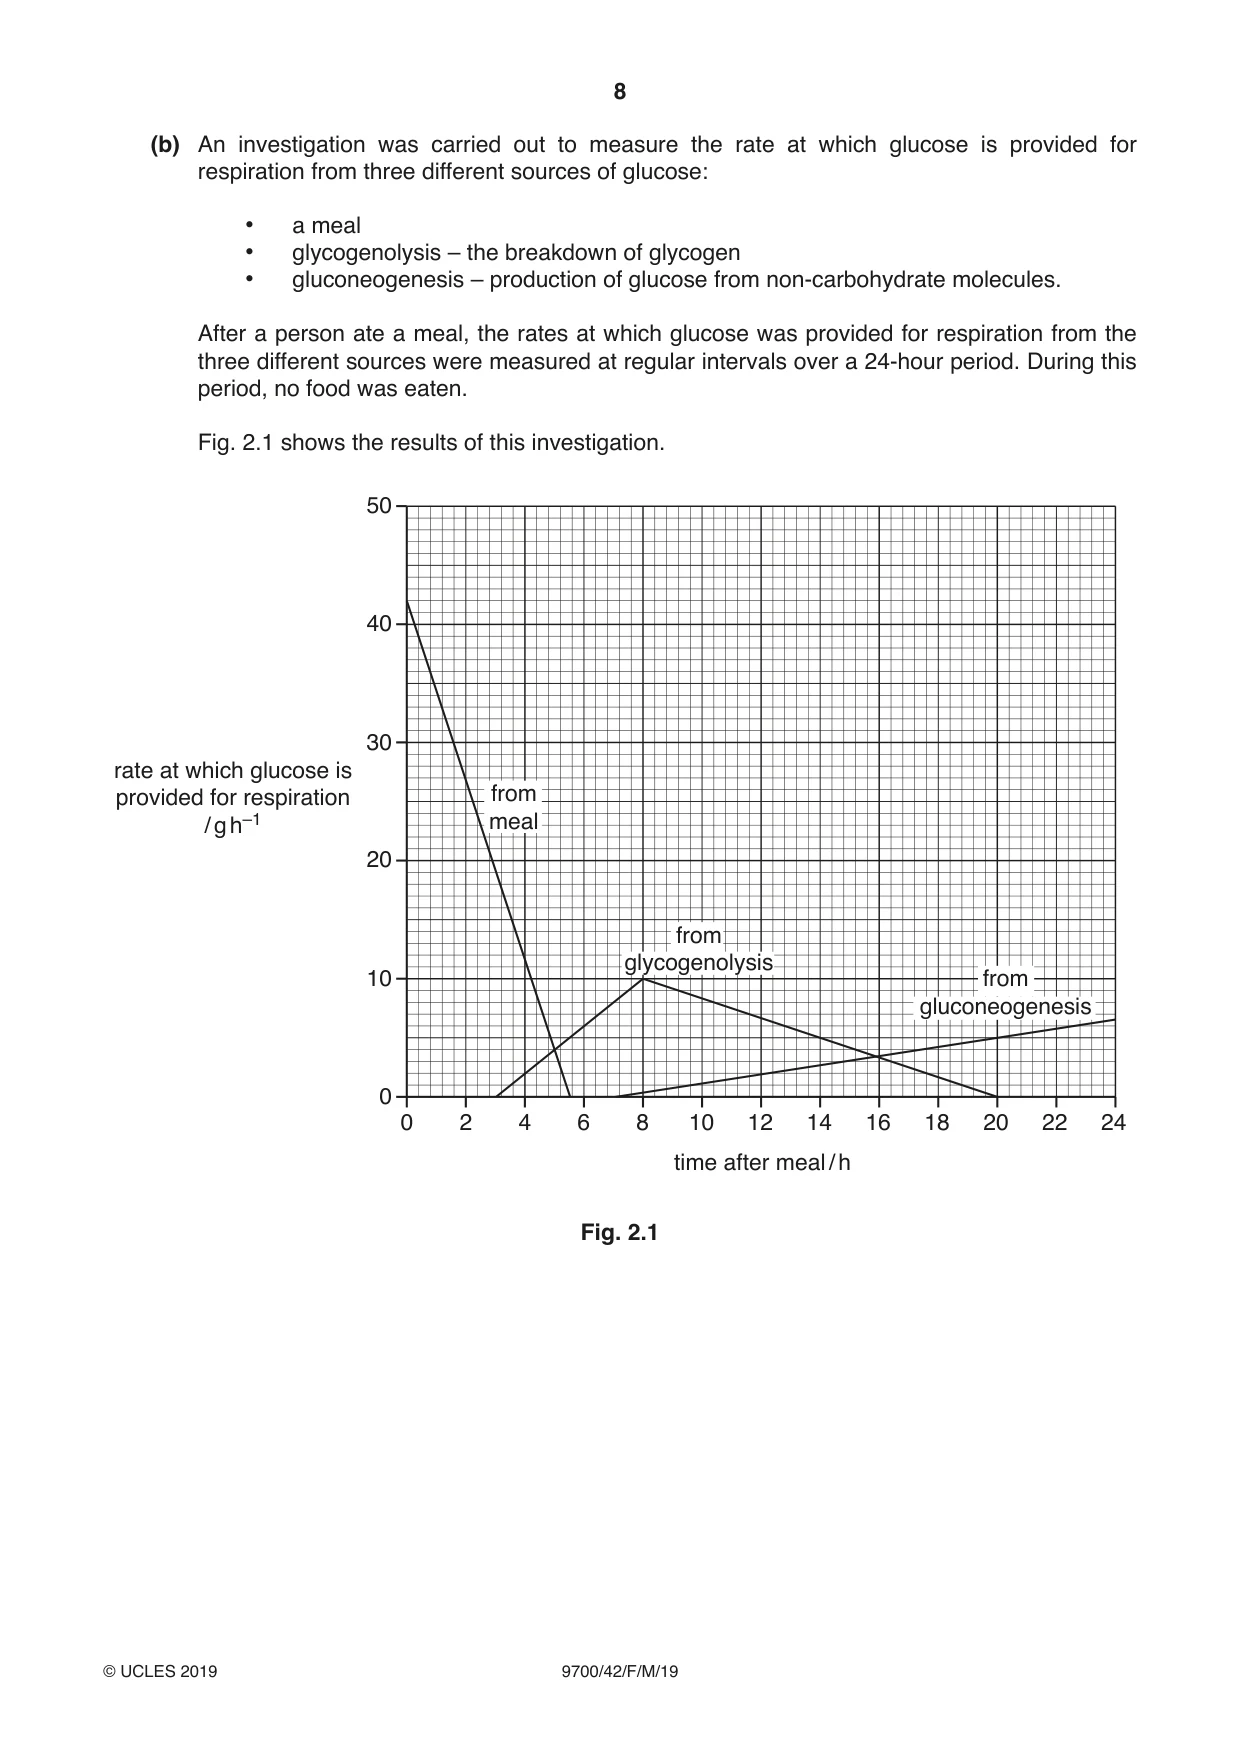
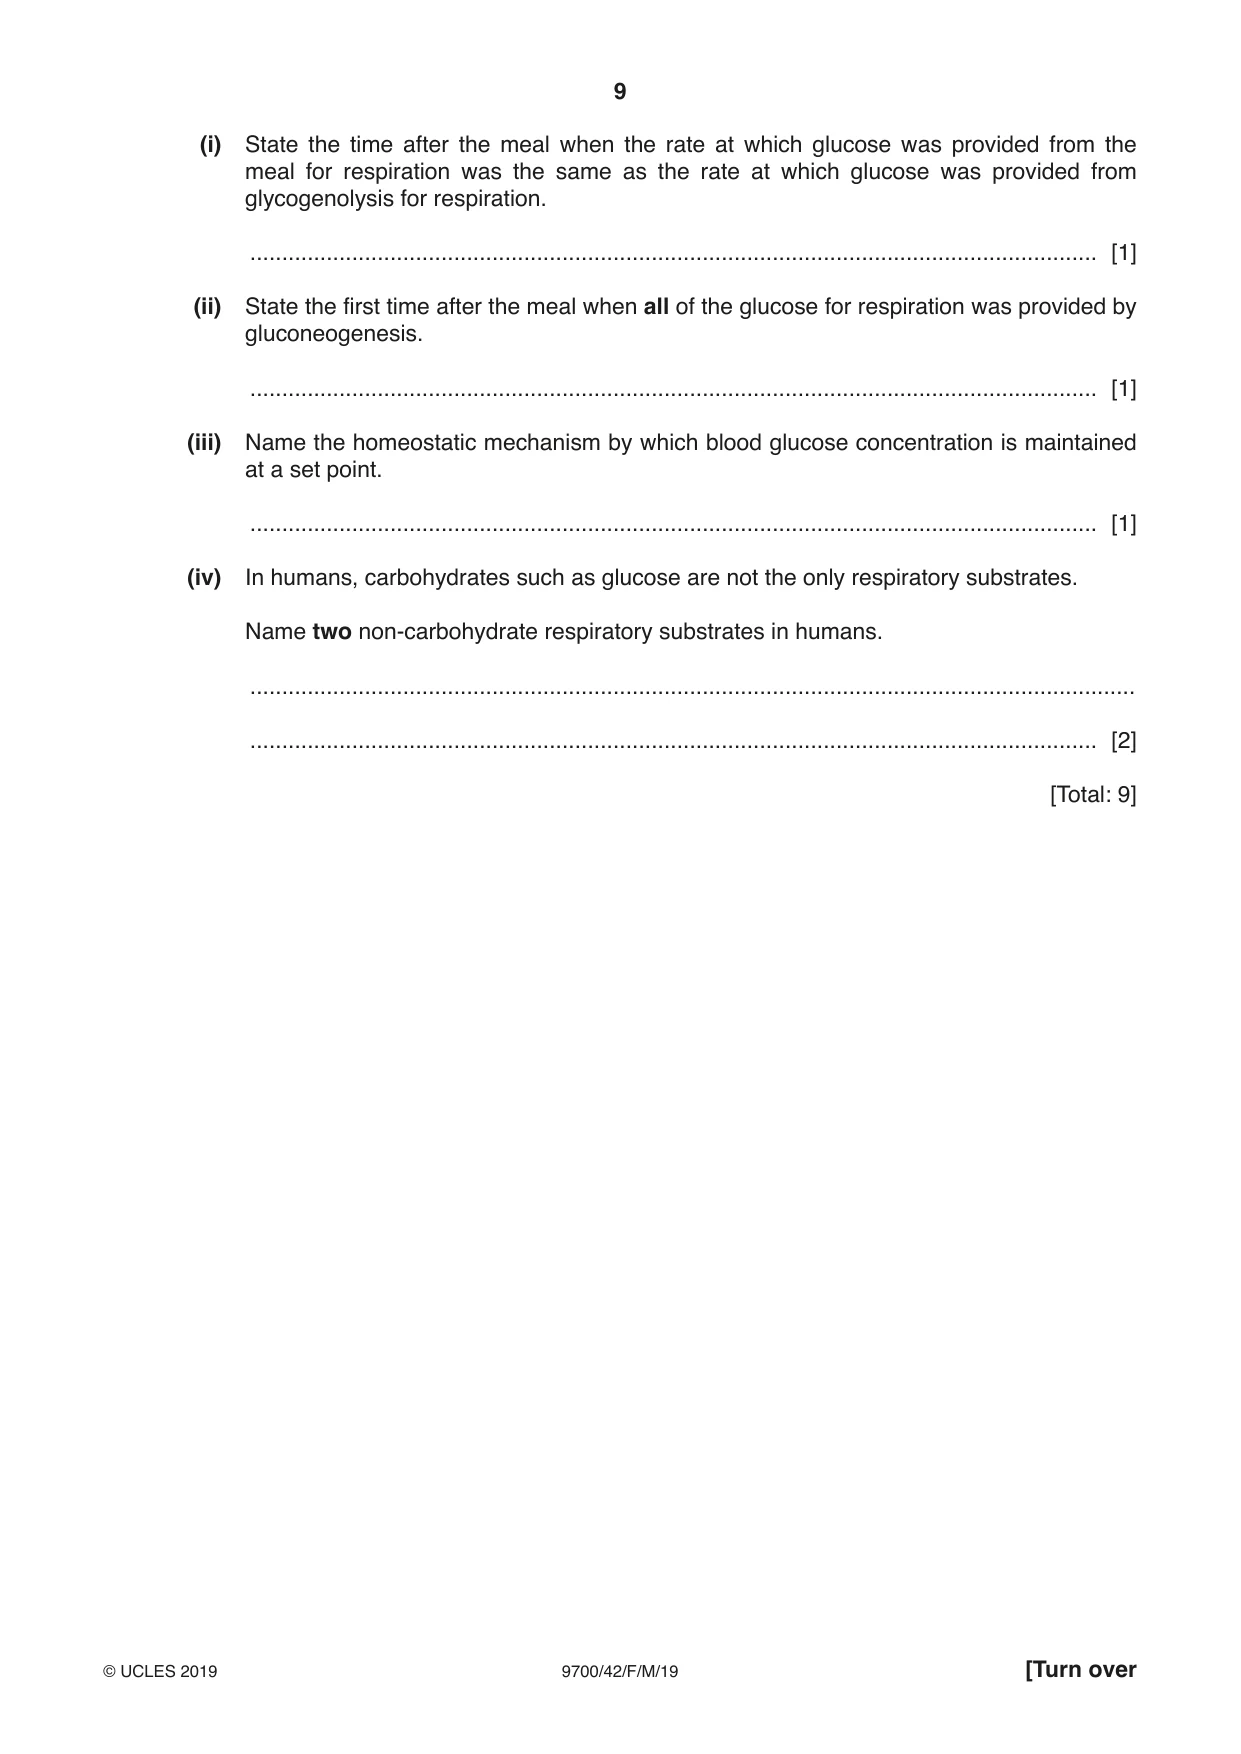
2 (a) The hormone glucagon is an example of a cell signalling molecule. Table 2.1 lists the main events that occur when the blood glucose concentration decreases below the set point. The events are not listed in the correct order. Table 2.1 event description of event A adenylyl cyclase enzyme is activated B cyclic AMP activates an enzyme cascade C glycogen stored in liver cells is broken down to glucose D blood glucose concentration increases E glucagon is secreted by α cells in the pancreas F conformational change to glucagon receptor causes G-protein activation G active adenylyl cyclase acts on ATP to produce second messenger H glucagon signal is amplified I glucose diffuses out of liver cells through GLUT transporter proteins J glucagon binds to receptors in the cell surface membranes of liver cells K cyclic AMP is formed Complete Table 2.2 to show the correct order in which these events occur. Three of the events have already been placed in their correct order. Table 2.2 correct order letter of event 1 E 2 3 4 5 6 K 7 8 9 10 11 D [4] (b) An investigation was carried out to measure the rate at which glucose is provided for respiration from three different sources of glucose: • a meal • glycogenolysis – the breakdown of glycogen • gluconeogenesis – production of glucose from non-carbohydrate molecules. After a person ate a meal, the rates at which glucose was provided for respiration from the three different sources were measured at regular intervals over a 24-hour period. During this period, no food was eaten. Fig. 2.1 shows the results of this investigation. 50 40 30 rate at which glucose is provided for respiration from / g h–1 meal 20 from glycogenolysis 10 from gluconeogenesis 0 0 2 4 6 8 10 12 14 16 18 20 22 24 time after meal / h Fig. 2.1 (i) State the time after the meal when the rate at which glucose was provided from the meal for respiration was the same as the rate at which glucose was provided from glycogenolysis for respiration. ..................................................................................................................................... [1] (ii) State the first time after the meal when all of the glucose for respiration was provided by gluconeogenesis. ..................................................................................................................................... [1] (iii) Name the homeostatic mechanism by which blood glucose concentration is maintained at a set point. ..................................................................................................................................... [1] (iv) In humans, carbohydrates such as glucose are not the only respiratory substrates. Name two non-carbohydrate respiratory substrates in humans. ........................................................................................................................................... ..................................................................................................................................... [2] [Total: 9]
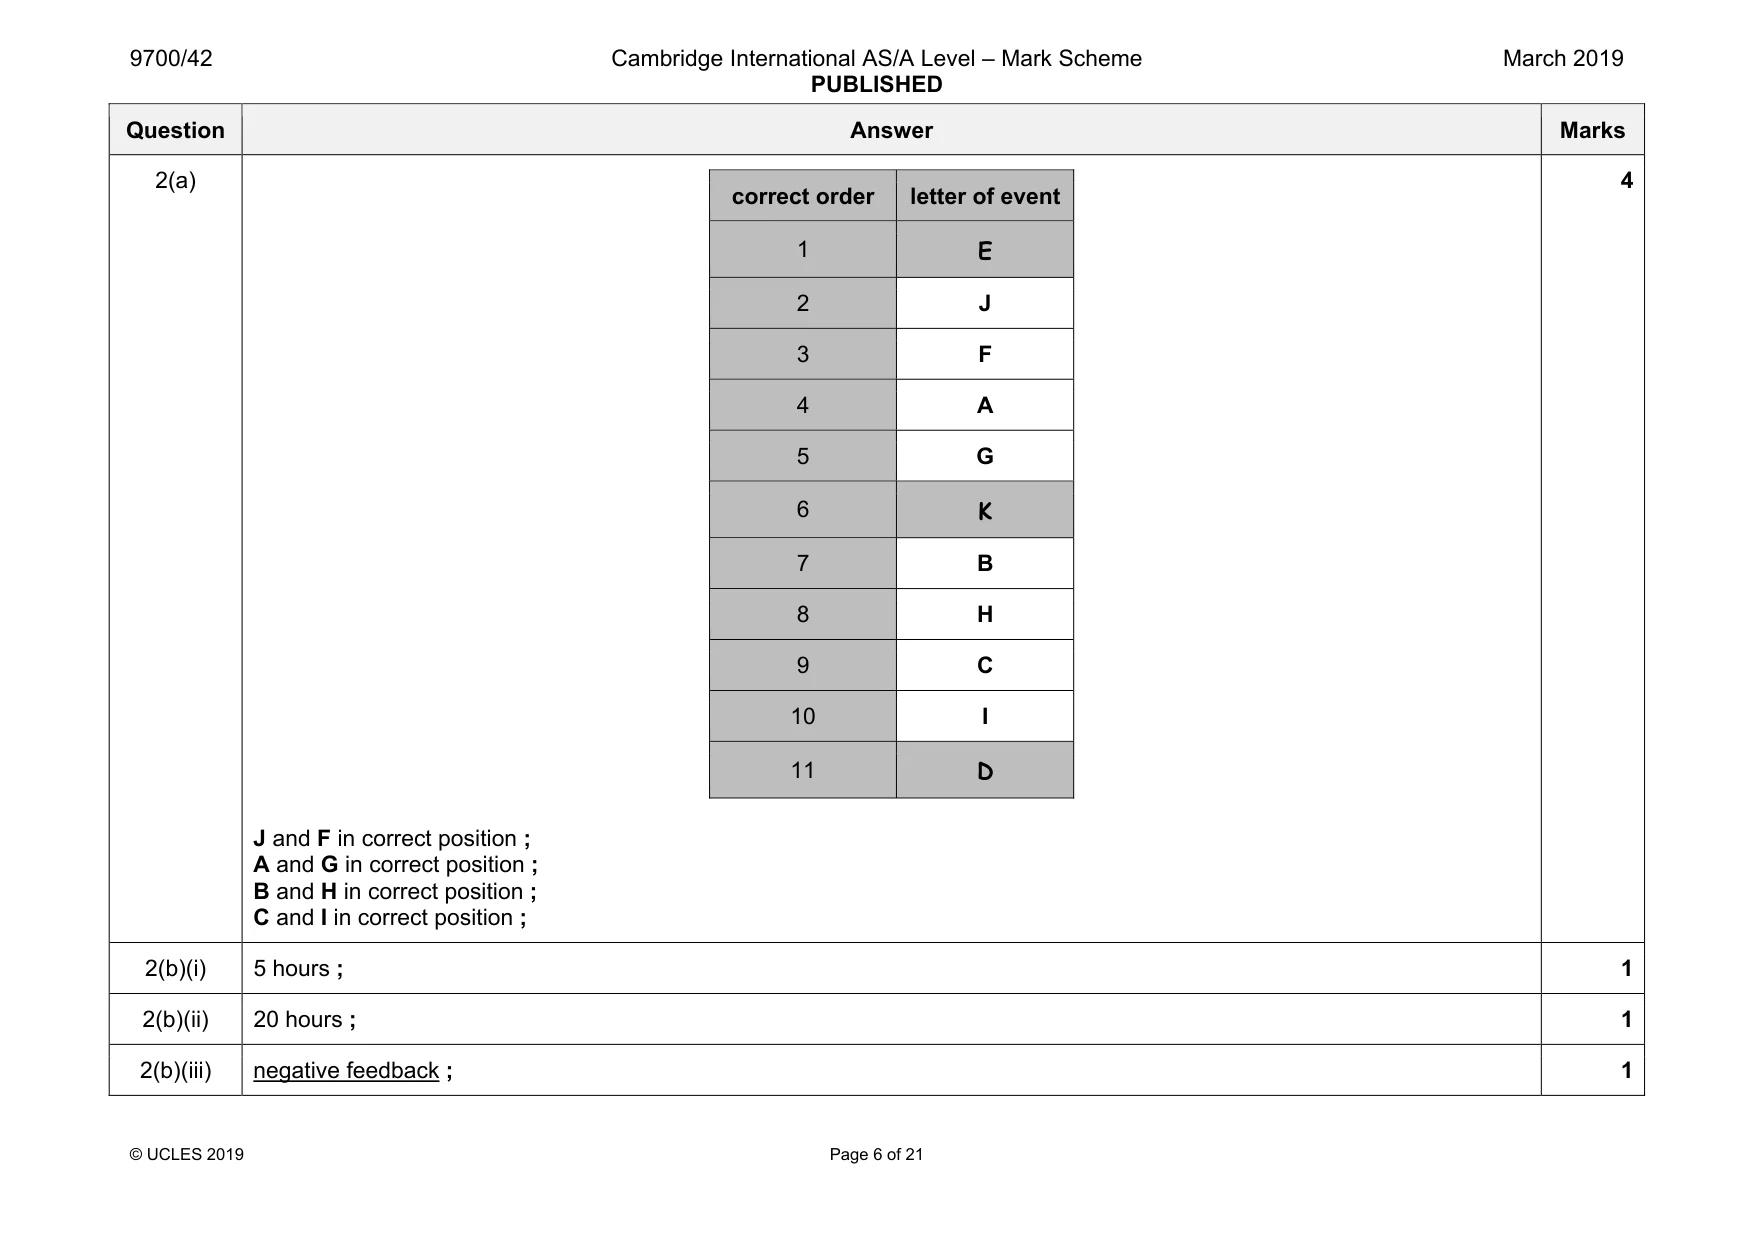
Mark scheme: 2(a) correct order letter of event 1 E 2 J 3 F 4 A 5 G 6 K 7 B 8 H 9 C 10 I 11 D J and F in correct position ; A and G in correct position ; B and H in correct position ; C and I in correct position ; 4 2(b)(i) 5 hours ; 1 2(b)(ii) 20 hours ; 1 2(b)(iii) negative feedback ; 1 Question Answer Marks 2(b)(iv) lipids / fatty acids ; ignore fats amino acids / protein ; 2
Q3 · During an immune response, only B-lymphocytes with receptors that are specific to the…
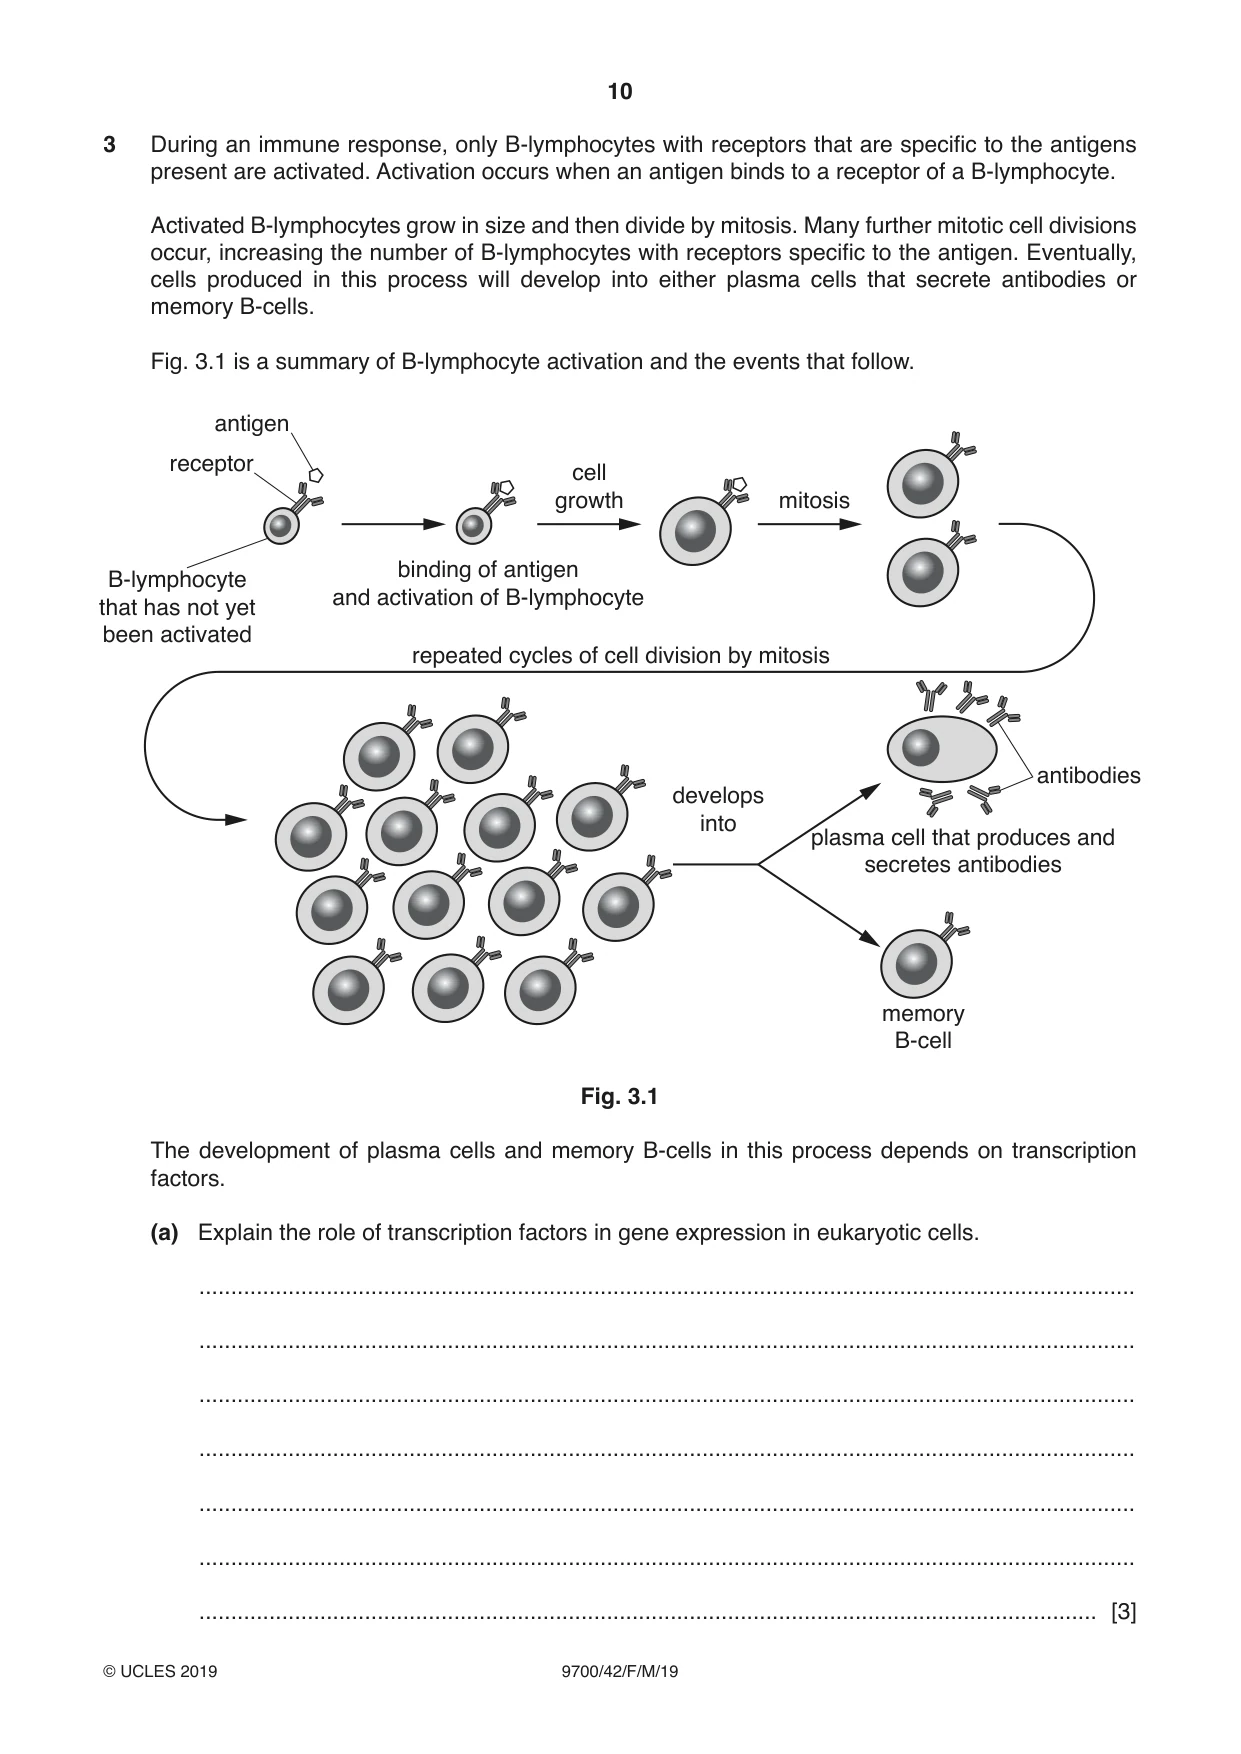
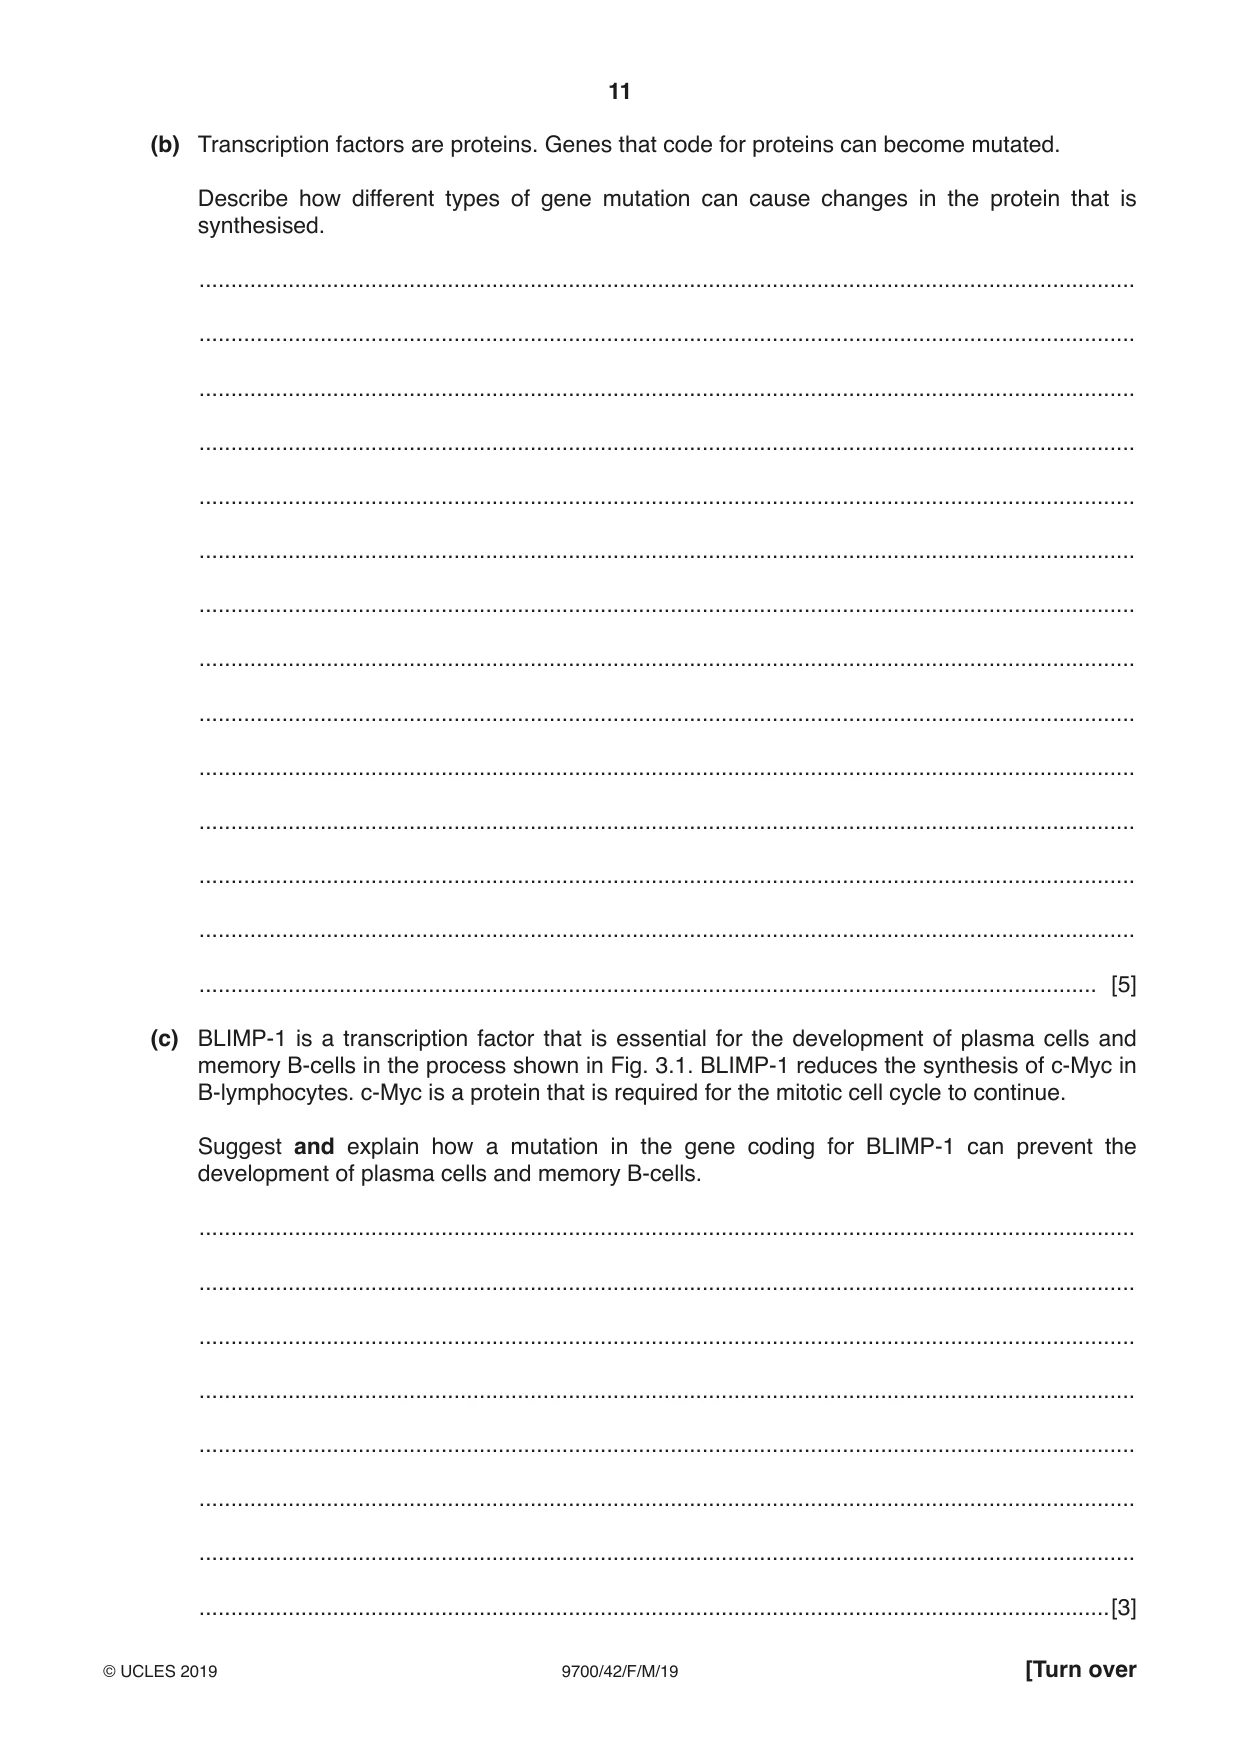
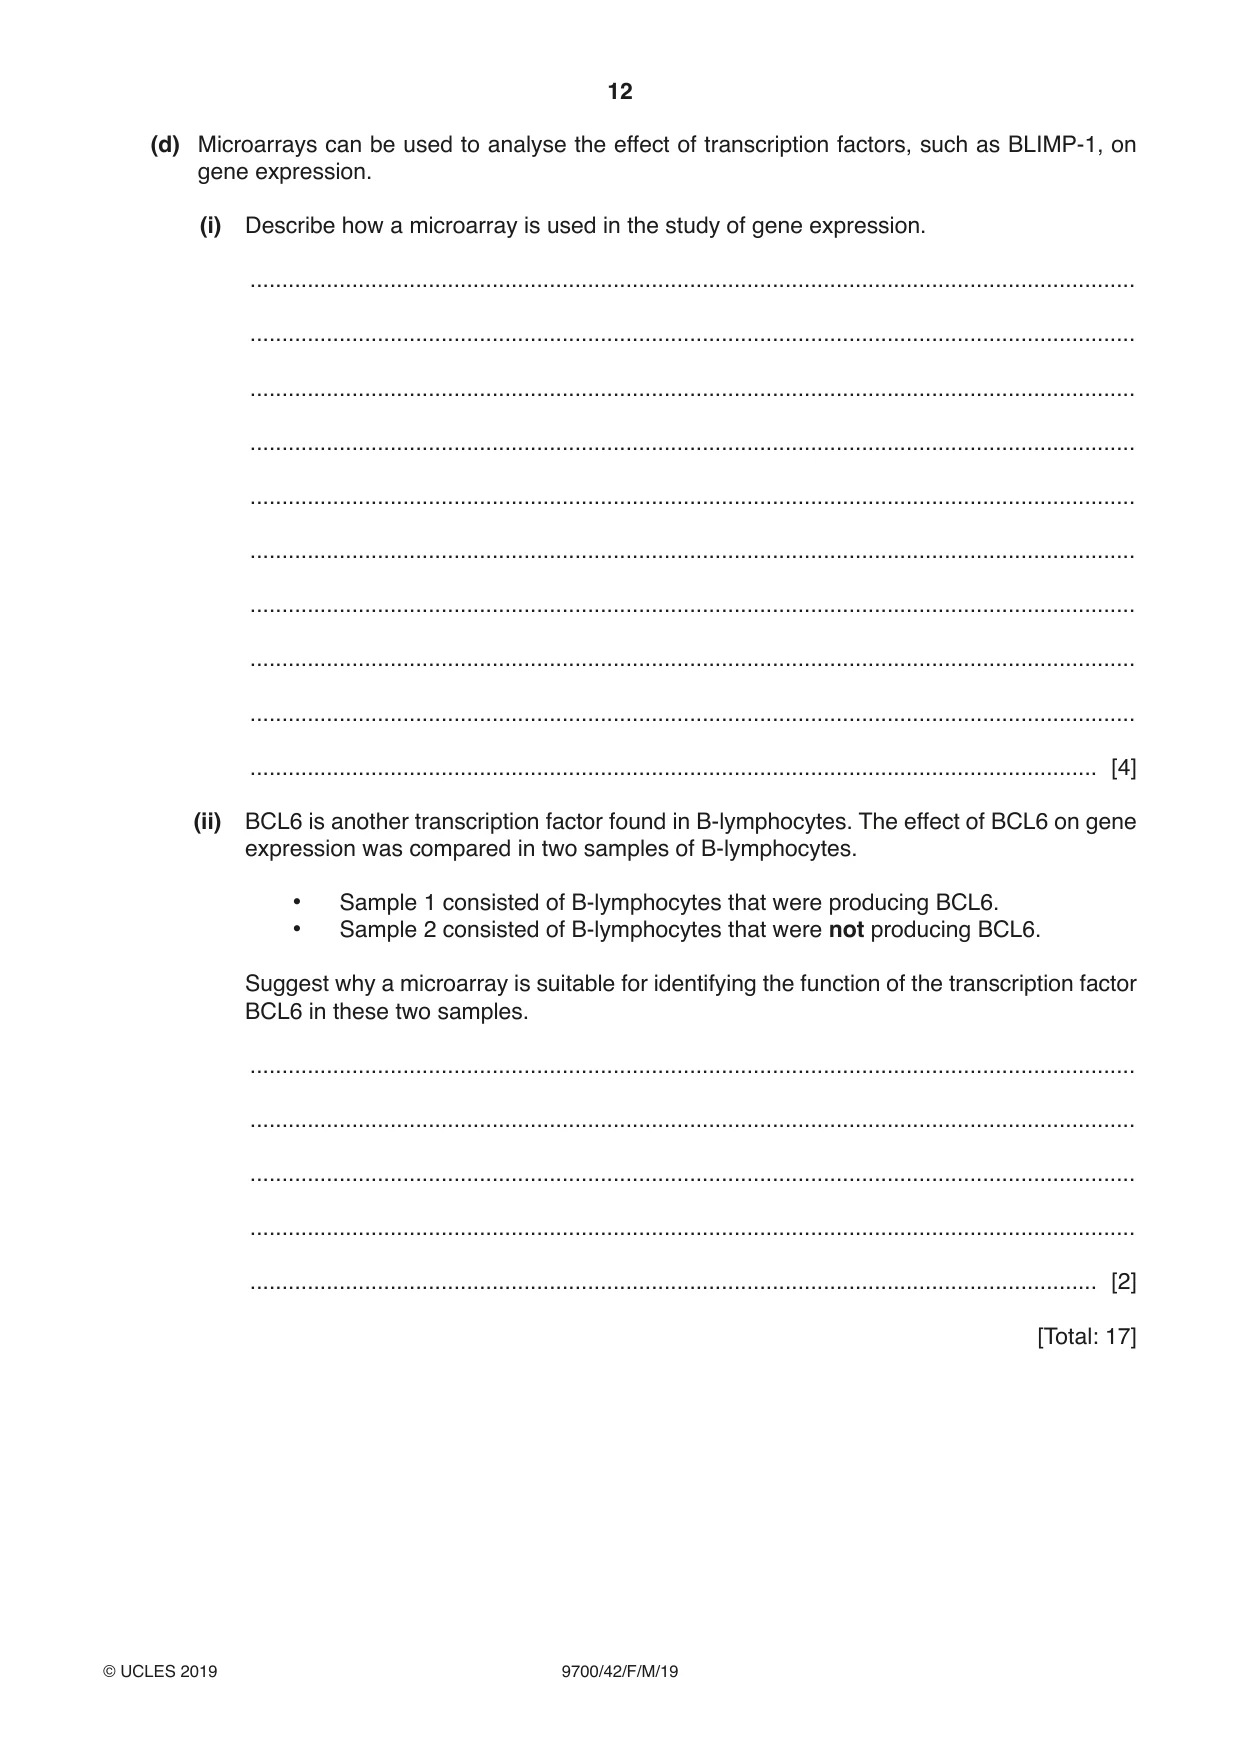
3 During an immune response, only B-lymphocytes with receptors that are specific to the antigens present are activated. Activation occurs when an antigen binds to a receptor of a B-lymphocyte. Activated B-lymphocytes grow in size and then divide by mitosis. Many further mitotic cell divisions occur, increasing the number of B-lymphocytes with receptors specific to the antigen. Eventually, cells produced in this process will develop into either plasma cells that secrete antibodies or memory B-cells. Fig. 3.1 is a summary of B-lymphocyte activation and the events that follow. antigen receptor cell growth mitosis binding of antigen B-lymphocyte and activation of B-lymphocytethat has not yet been activated repeated cycles of cell division by mitosis antibodies develops into plasma cell that produces and secretes antibodies memory B-cell Fig. 3.1 The development of plasma cells and memory B-cells in this process depends on transcription factors. (a) Explain the role of transcription factors in gene expression in eukaryotic cells. ................................................................................................................................................... ................................................................................................................................................... ................................................................................................................................................... ................................................................................................................................................... ................................................................................................................................................... ................................................................................................................................................... ............................................................................................................................................. [3] (b) Transcription factors are proteins. Genes that code for proteins can become mutated. Describe how different types of gene mutation can cause changes in the protein that is synthesised. ................................................................................................................................................... ................................................................................................................................................... ................................................................................................................................................... ................................................................................................................................................... ................................................................................................................................................... ................................................................................................................................................... ................................................................................................................................................... ................................................................................................................................................... ................................................................................................................................................... ................................................................................................................................................... ................................................................................................................................................... ................................................................................................................................................... ................................................................................................................................................... ............................................................................................................................................. [5] (c) BLIMP-1 is a transcription factor that is essential for the development of plasma cells and memory B-cells in the process shown in Fig. 3.1. BLIMP-1 reduces the synthesis of c-Myc in B-lymphocytes. c-Myc is a protein that is required for the mitotic cell cycle to continue. Suggest and explain how a mutation in the gene coding for BLIMP-1 can prevent the development of plasma cells and memory B-cells. ................................................................................................................................................... ................................................................................................................................................... ................................................................................................................................................... ................................................................................................................................................... ................................................................................................................................................... ................................................................................................................................................... ................................................................................................................................................... ...............................................................................................................................................[3] (d) Microarrays can be used to analyse the effect of transcription factors, such as BLIMP-1, on gene expression. (i) Describe how a microarray is used in the study of gene expression. ........................................................................................................................................... ........................................................................................................................................... ........................................................................................................................................... ........................................................................................................................................... ........................................................................................................................................... ........................................................................................................................................... ........................................................................................................................................... ........................................................................................................................................... ........................................................................................................................................... ..................................................................................................................................... [4] (ii) BCL6 is another transcription factor found in B-lymphocytes. The effect of BCL6 on gene expression was compared in two samples of B-lymphocytes. • Sample 1 consisted of B-lymphocytes that were producing BCL6. • Sample 2 consisted of B-lymphocytes that were not producing BCL6. Suggest why a microarray is suitable for identifying the function of the transcription factor BCL6 in these two samples. ........................................................................................................................................... ........................................................................................................................................... ........................................................................................................................................... ........................................................................................................................................... ..................................................................................................................................... [2] [Total: 17] Question 4 starts on page 14
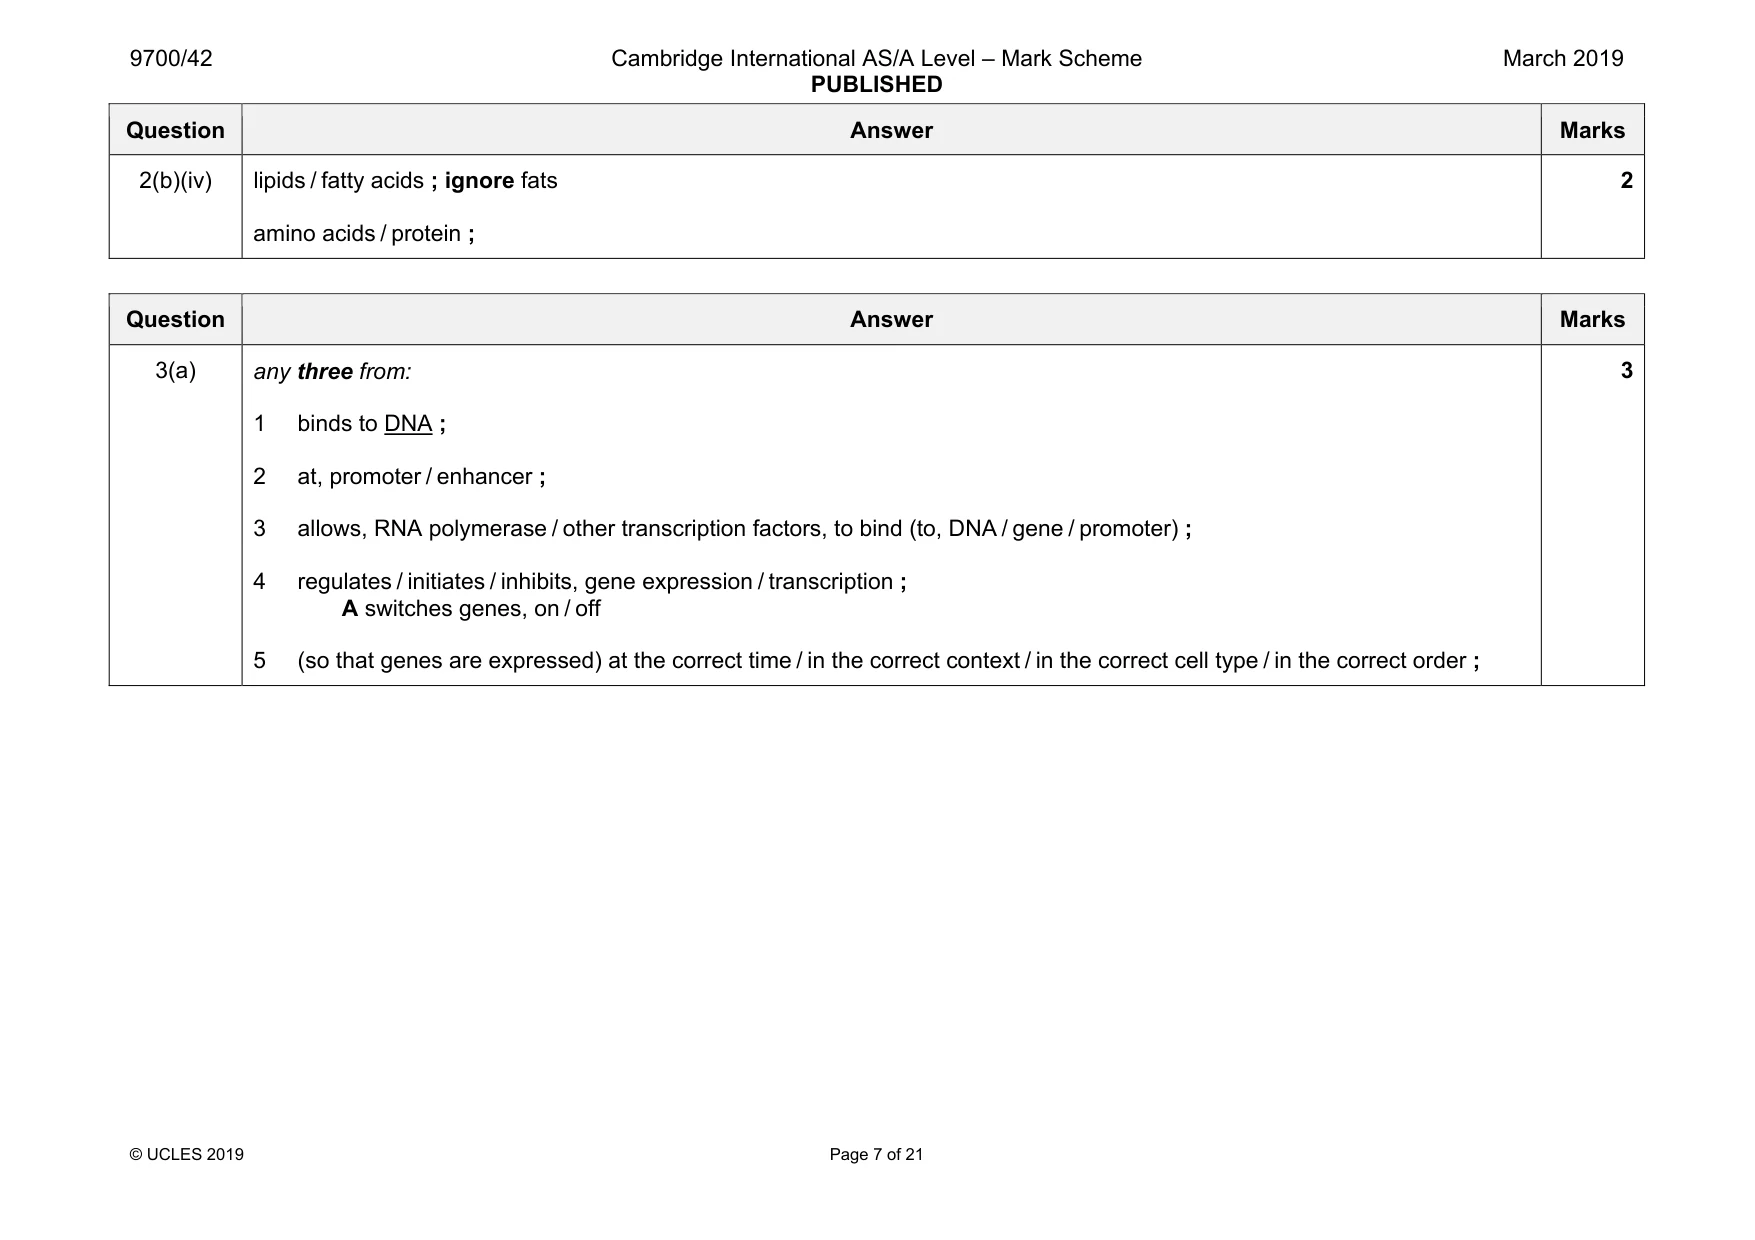
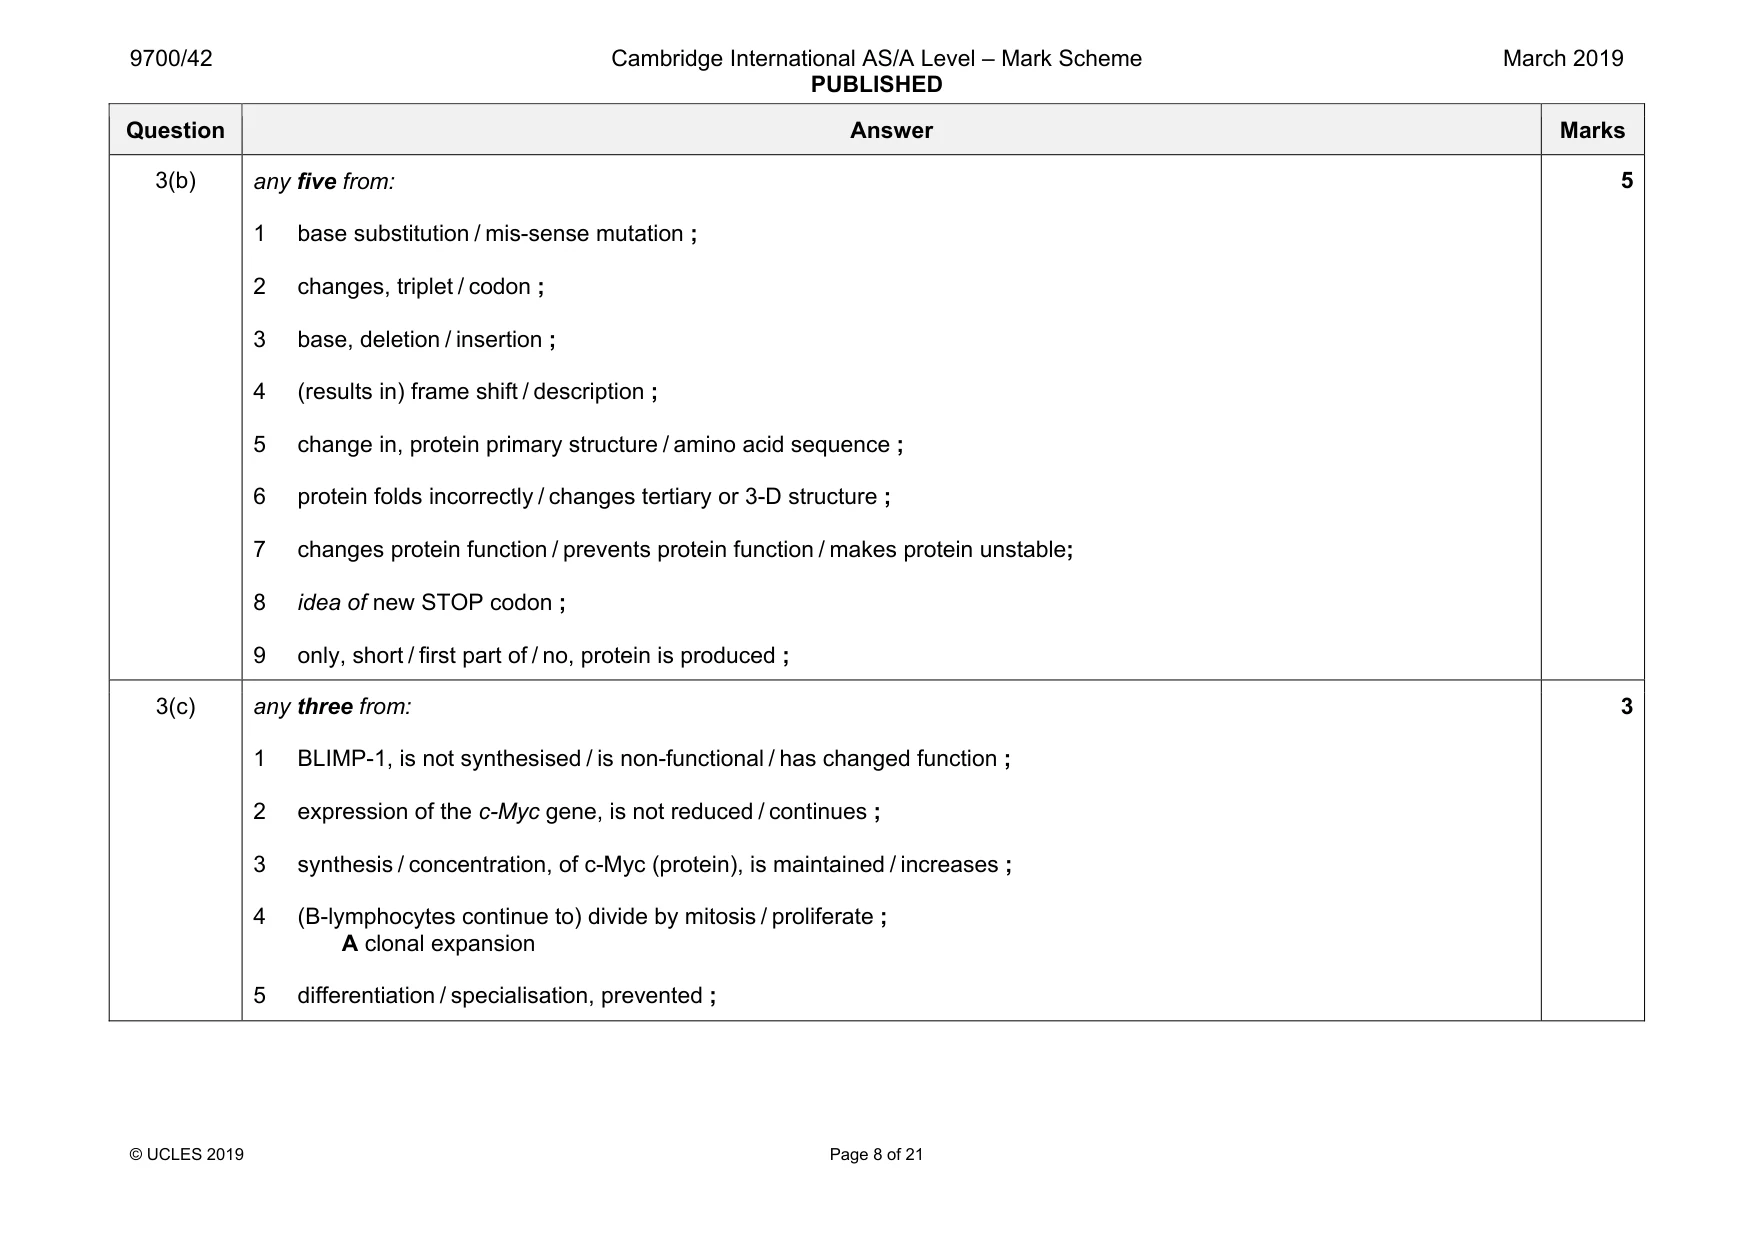
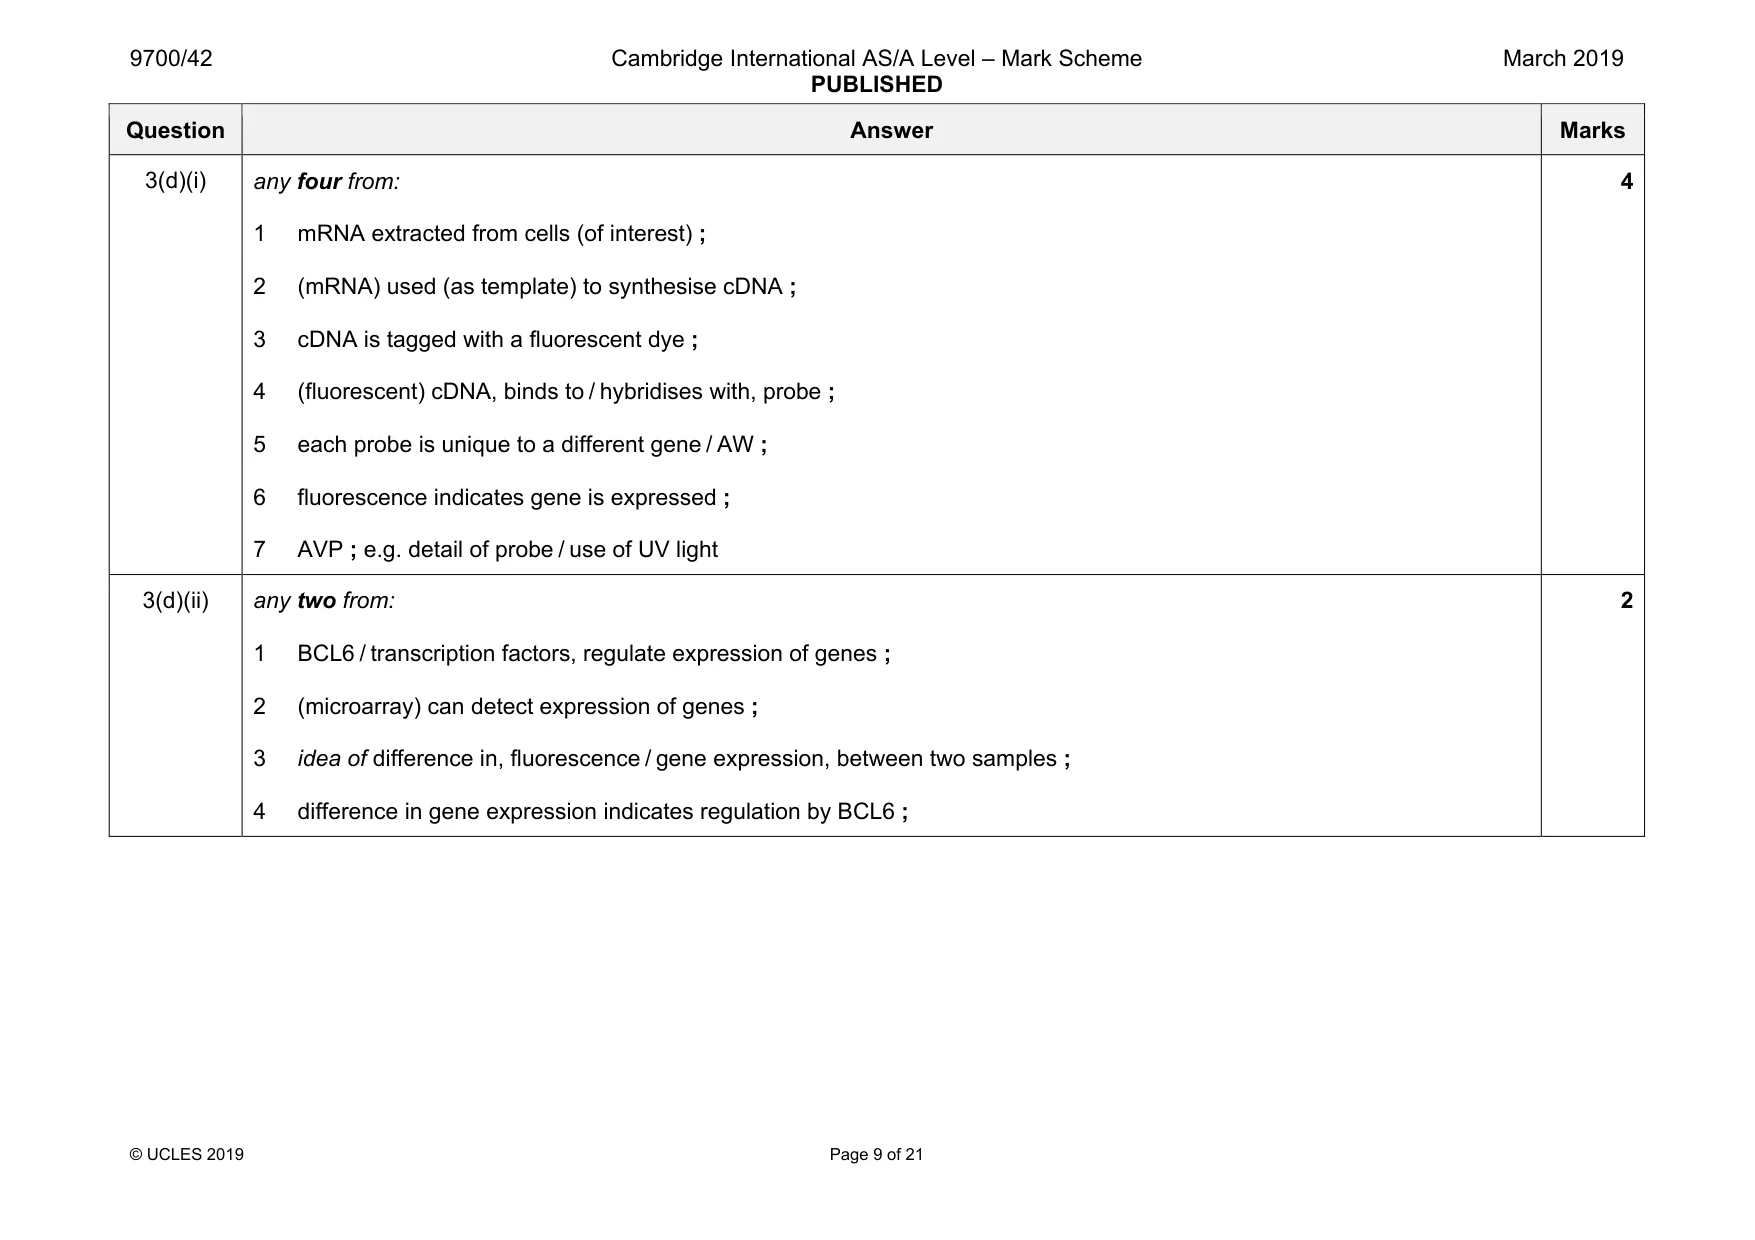
Mark scheme: 3(a) any three from: 1 binds to DNA ; 2 at, promoter / enhancer ; 3 allows, RNA polymerase / other transcription factors, to bind (to, DNA / gene / promoter) ; 4 regulates / initiates / inhibits, gene expression / transcription ; A switches genes, on / off 5 (so that genes are expressed) at the correct time / in the correct context / in the correct cell type / in the correct order ; 3 Question Answer Marks 3(b) any five from: 1 base substitution / mis-sense mutation ; 2 changes, triplet / codon ; 3 base, deletion / insertion ; 4 (results in) frame shift / description ; 5 change in, protein primary structure / amino acid sequence ; 6 protein folds incorrectly / changes tertiary or 3-D structure ; 7 changes protein function / prevents protein function / makes protein unstable; 8 idea of new STOP codon ; 9 only, short / first part of / no, protein is produced ; 5 3(c) any three from: 1 BLIMP-1, is not synthesised / is non-functional / has changed function ; 2 expression of the c-Myc gene, is not reduced / continues ; 3 synthesis / concentration, of c-Myc (protein), is maintained / increases ; 4 (B-lymphocytes continue to) divide by mitosis / proliferate ; A clonal expansion 5 differentiation / specialisation, prevented ; 3 Question Answer Marks 3(d)(i) any four from: 1 mRNA extracted from cells (of interest) ; 2 (mRNA) used (as template) to synthesise cDNA ; 3 cDNA is tagged with a fluorescent dye ; 4 (fluorescent) cDNA, binds to / hybridises with, probe ; 5 each probe is unique to a different gene / AW ; 6 fluorescence indicates gene is expressed ; 7 AVP ; e.g. detail of probe / use of UV light 4 3(d)(ii) any two from: 1 BCL6 / transcription factors, regulate expression of genes ; 2 (microarray) can detect expression of genes ; 3 idea of difference in, fluorescence / gene expression, between two samples ; 4 difference in gene expression indicates regulation by BCL6 ; 2
Q4 · Mexican spadefoot toads, Spea multiplicata, live on land but return to ponds to breed
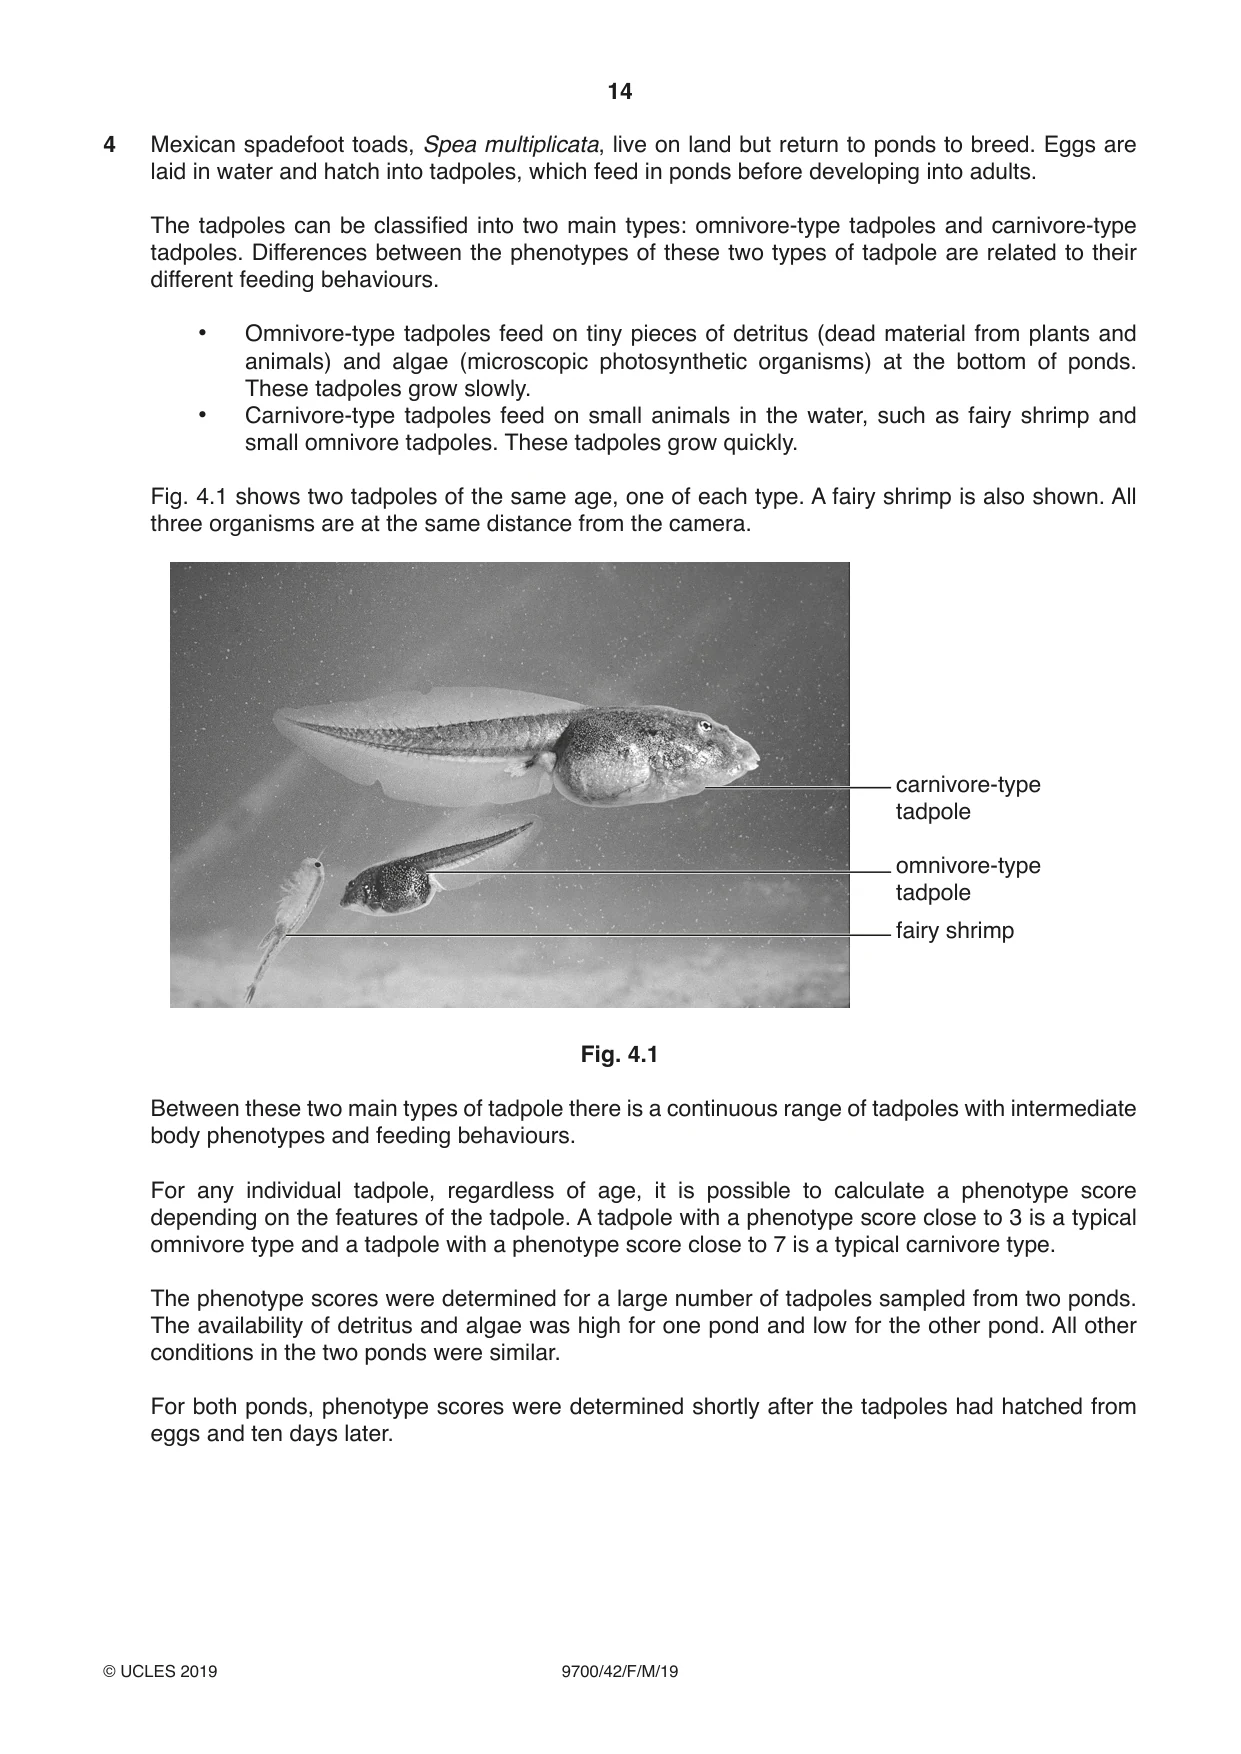
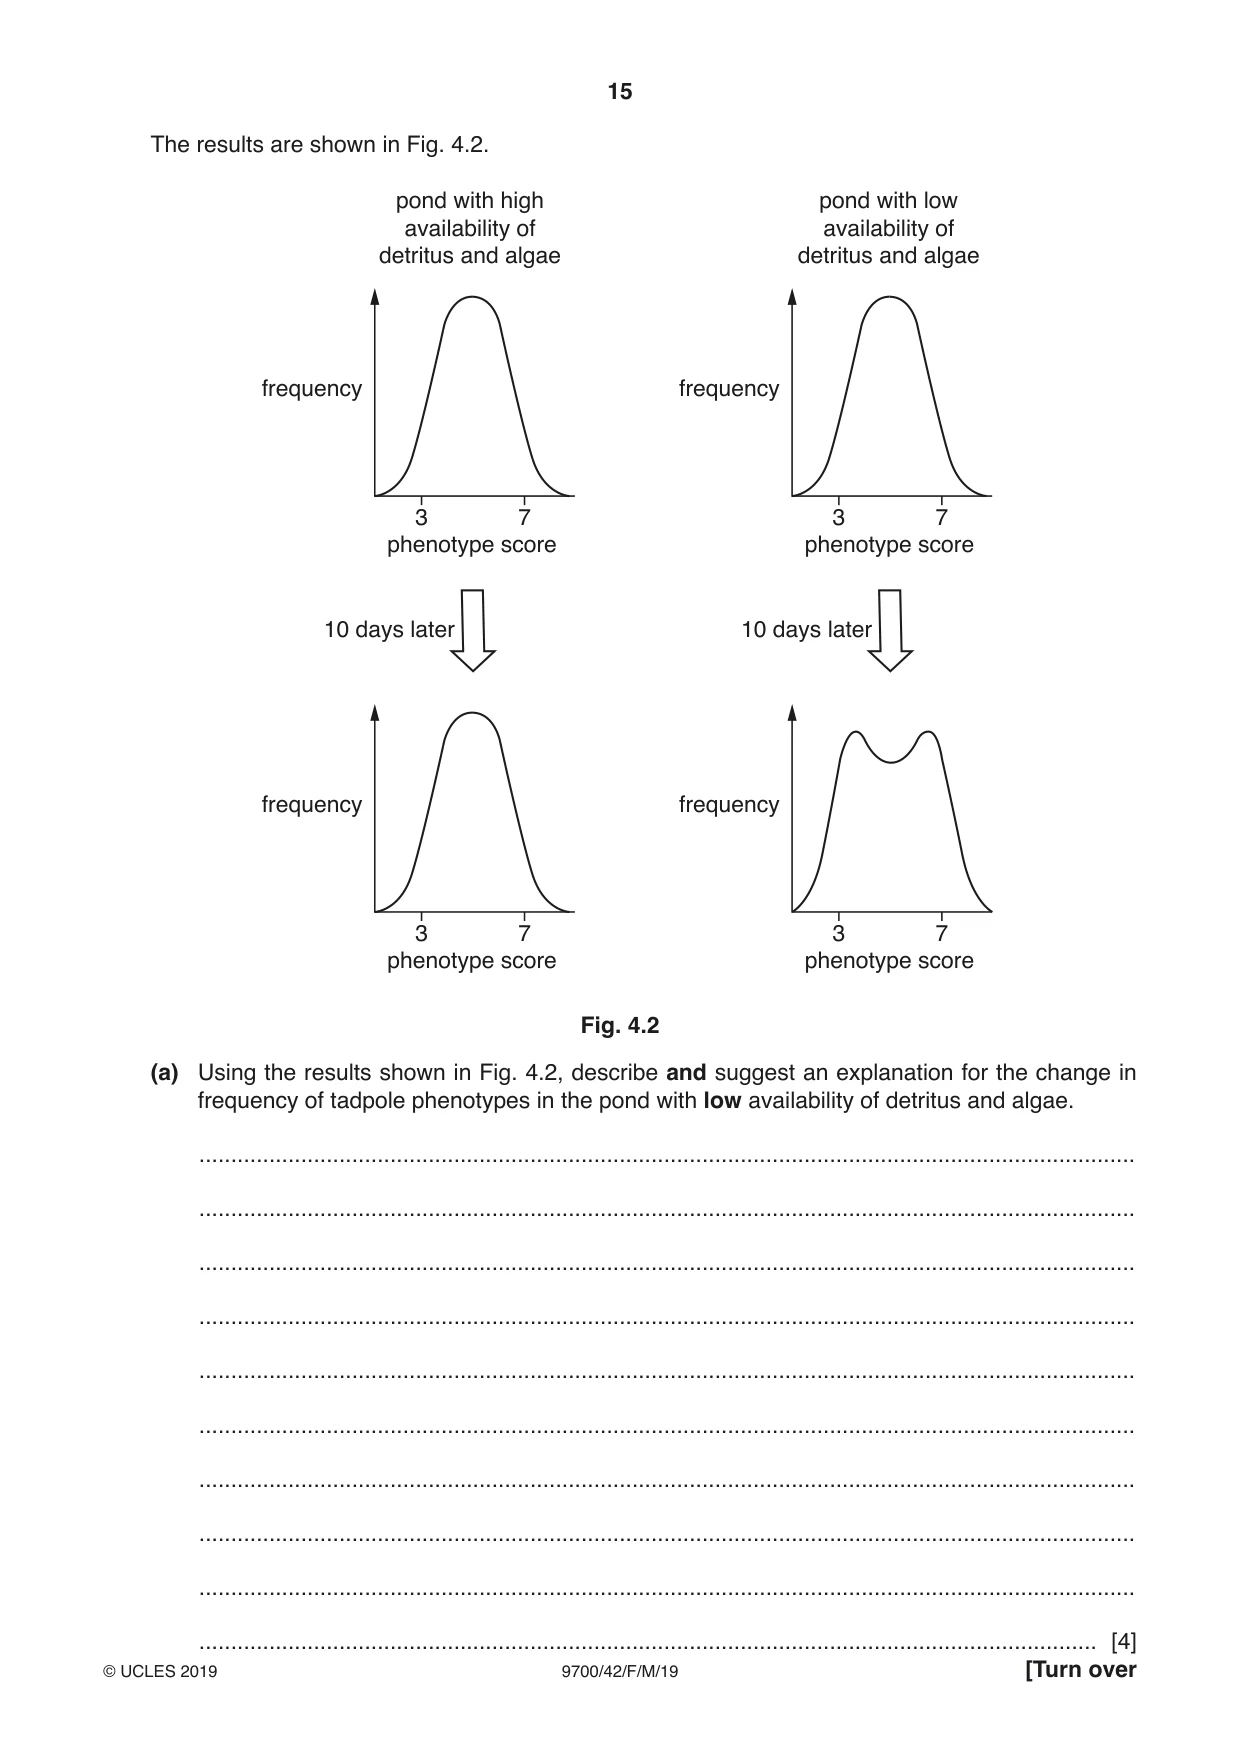
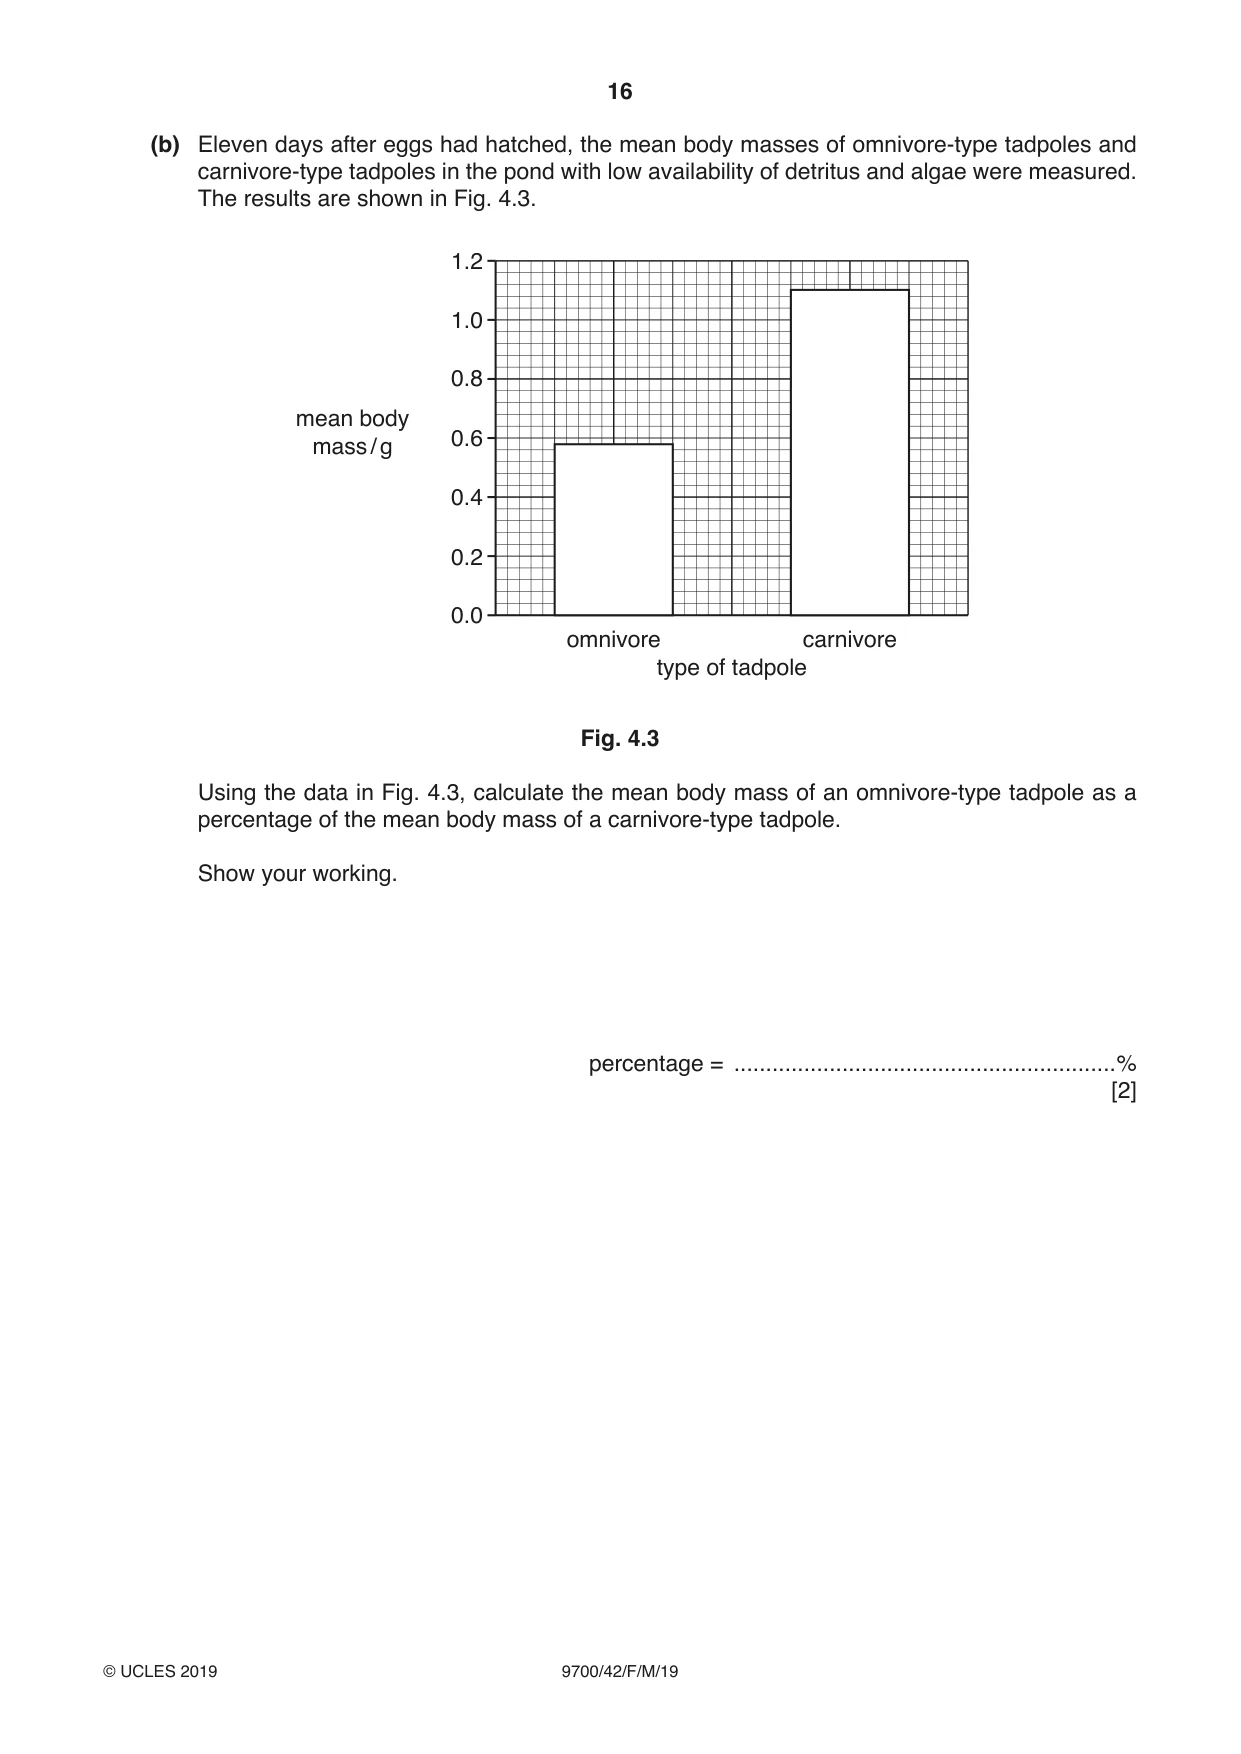
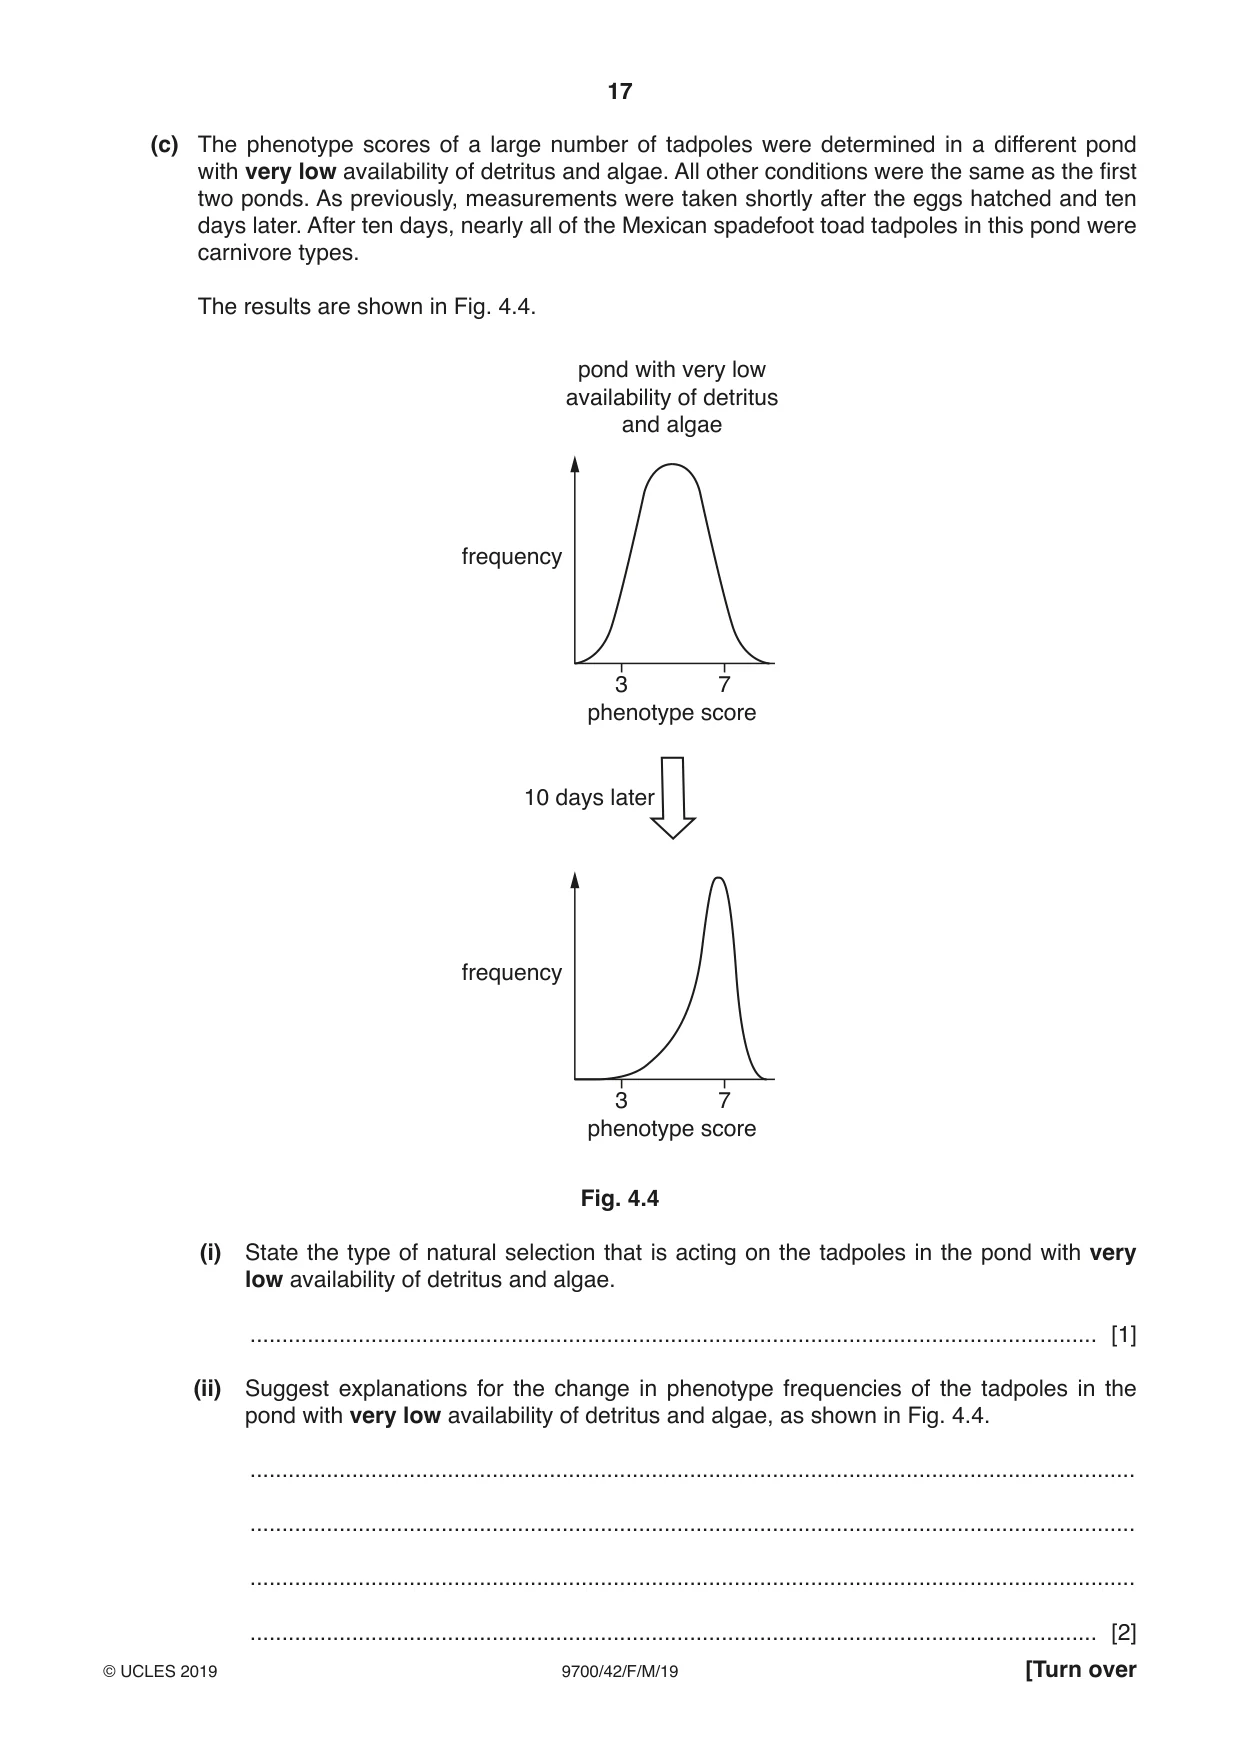
4 Mexican spadefoot toads, Spea multiplicata, live on land but return to ponds to breed. Eggs are laid in water and hatch into tadpoles, which feed in ponds before developing into adults. The tadpoles can be classified into two main types: omnivore-type tadpoles and carnivore-type tadpoles. Differences between the phenotypes of these two types of tadpole are related to their different feeding behaviours. • Omnivore-type tadpoles feed on tiny pieces of detritus (dead material from plants and animals) and algae (microscopic photosynthetic organisms) at the bottom of ponds. These tadpoles grow slowly. • Carnivore-type tadpoles feed on small animals in the water, such as fairy shrimp and small omnivore tadpoles. These tadpoles grow quickly. Fig. 4.1 shows two tadpoles of the same age, one of each type. A fairy shrimp is also shown. All three organisms are at the same distance from the camera. carnivore-type tadpole omnivore-type tadpole fairy shrimp Fig. 4.1 Between these two main types of tadpole there is a continuous range of tadpoles with intermediate body phenotypes and feeding behaviours. For any individual tadpole, regardless of age, it is possible to calculate a phenotype score depending on the features of the tadpole. A tadpole with a phenotype score close to 3 is a typical omnivore type and a tadpole with a phenotype score close to 7 is a typical carnivore type. The phenotype scores were determined for a large number of tadpoles sampled from two ponds. The availability of detritus and algae was high for one pond and low for the other pond. All other conditions in the two ponds were similar. For both ponds, phenotype scores were determined shortly after the tadpoles had hatched from eggs and ten days later. The results are shown in Fig. 4.2. pond with high pond with low availability of availability of detritus and algae detritus and algae frequency frequency 3 7 3 7 phenotype score phenotype score 10 days later 10 days later frequency frequency 3 7 3 7 phenotype score phenotype score Fig. 4.2 (a) Using the results shown in Fig. 4.2, describe and suggest an explanation for the change in frequency of tadpole phenotypes in the pond with low availability of detritus and algae. ................................................................................................................................................... ................................................................................................................................................... ................................................................................................................................................... ................................................................................................................................................... ................................................................................................................................................... ................................................................................................................................................... ................................................................................................................................................... ................................................................................................................................................... ................................................................................................................................................... (b) Eleven days after eggs had hatched, the mean body masses of omnivore-type tadpoles and carnivore-type tadpoles in the pond with low availability of detritus and algae were measured. The results are shown in Fig. 4.3. 1.2 1.0 0.8 mean body 0.6 mass / g 0.4 0.2 0.0 omnivore carnivore type of tadpole Fig. 4.3 Using the data in Fig. 4.3, calculate the mean body mass of an omnivore-type tadpole as a percentage of the mean body mass of a carnivore-type tadpole. Show your working. percentage = ............................................................% [2] (c) The phenotype scores of a large number of tadpoles were determined in a different pond with very low availability of detritus and algae. All other conditions were the same as the first two ponds. As previously, measurements were taken shortly after the eggs hatched and ten days later. After ten days, nearly all of the Mexican spadefoot toad tadpoles in this pond were carnivore types. The results are shown in Fig. 4.4. pond with very low availability of detritus and algae frequency 3 7 phenotype score 10 days later frequency 3 7 phenotype score Fig. 4.4 (i) State the type of natural selection that is acting on the tadpoles in the pond with very low availability of detritus and algae. ..................................................................................................................................... [1] (ii) Suggest explanations for the change in phenotype frequencies of the tadpoles in the pond with very low availability of detritus and algae, as shown in Fig. 4.4. ........................................................................................................................................... ........................................................................................................................................... ........................................................................................................................................... ..................................................................................................................................... [2] (d) Mexican spadefoot toad tadpoles develop into adult toads that do not live in water. In some years, the ponds where Mexican spadefoot toad tadpoles live, dry out quickly. Suggest why the carnivore-type tadpoles have a selective advantage in the years when ponds dry out quickly. ................................................................................................................................................... ................................................................................................................................................... ............................................................................................................................................. [1] [Total: 10] Question 5 starts on page 20
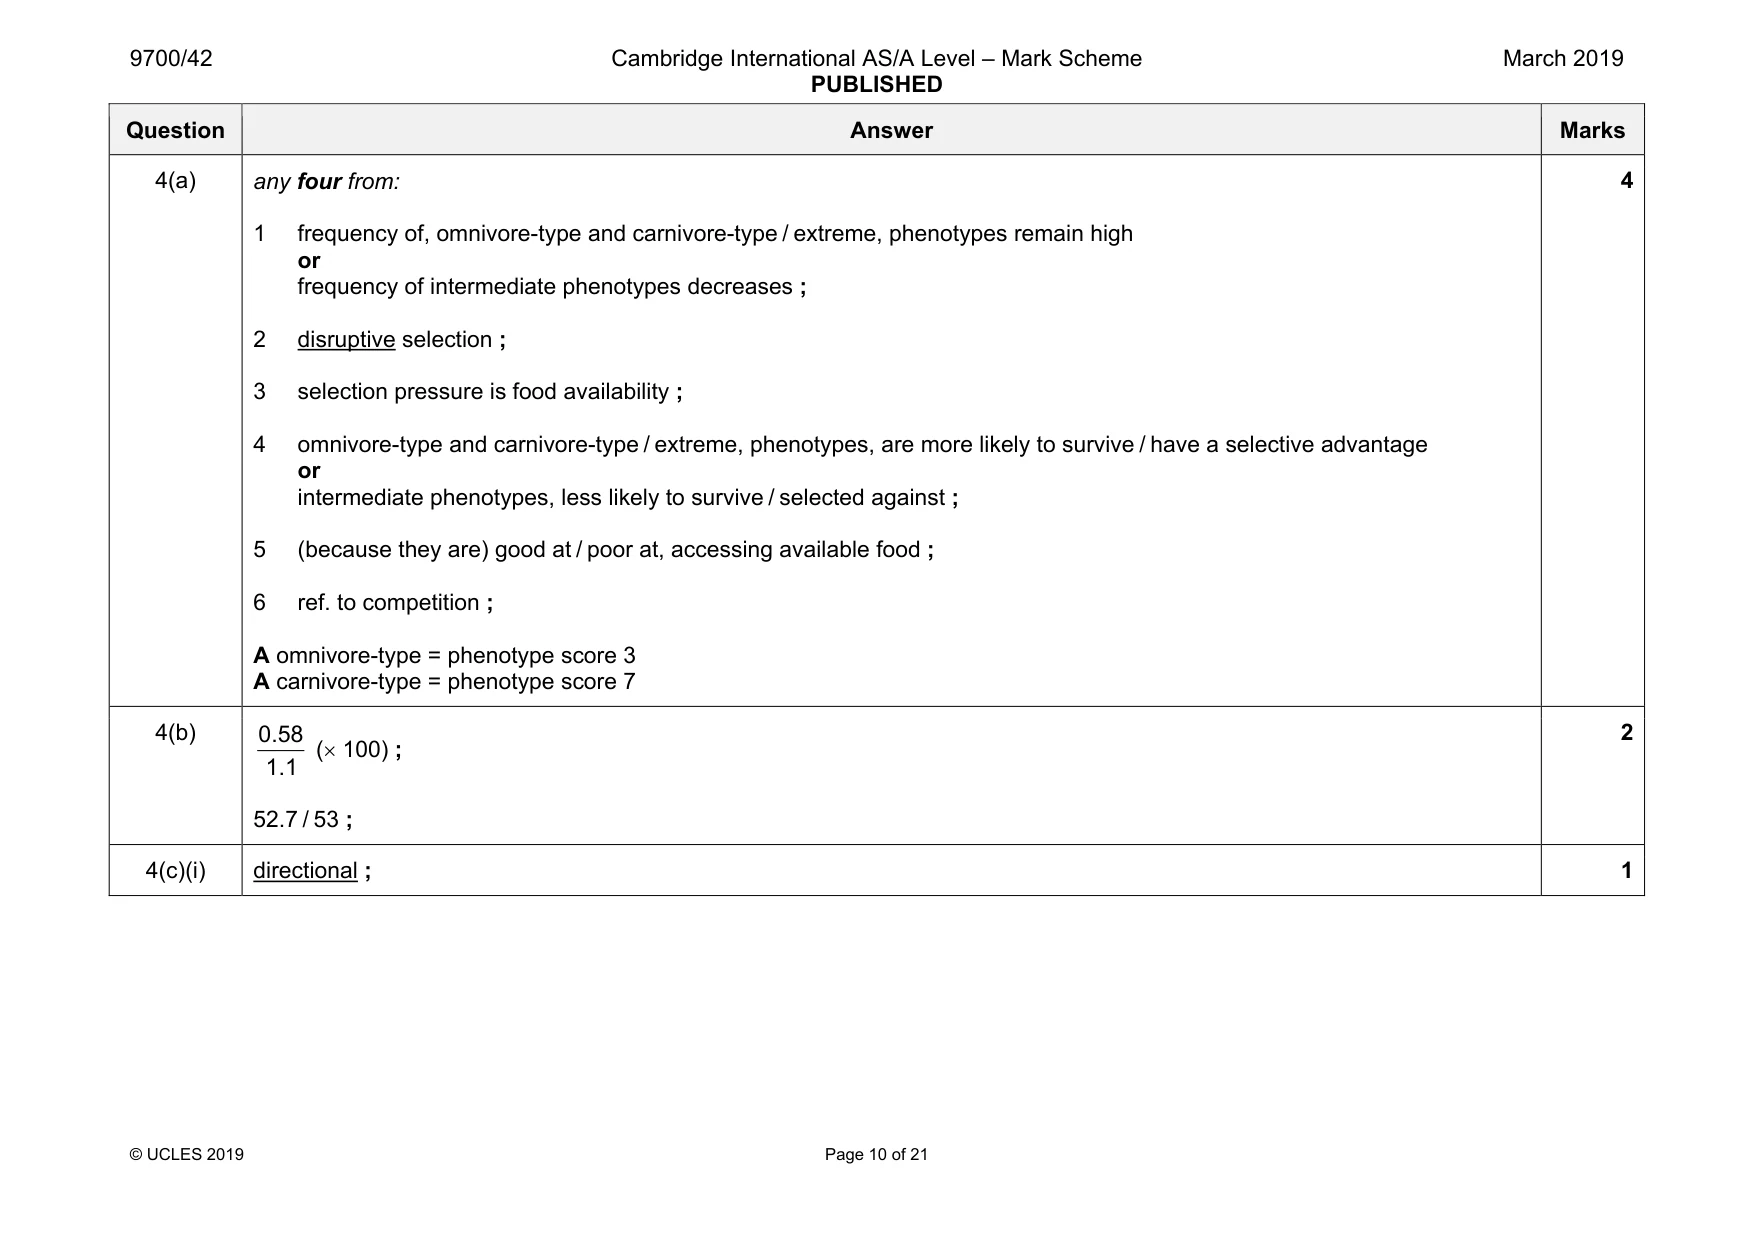
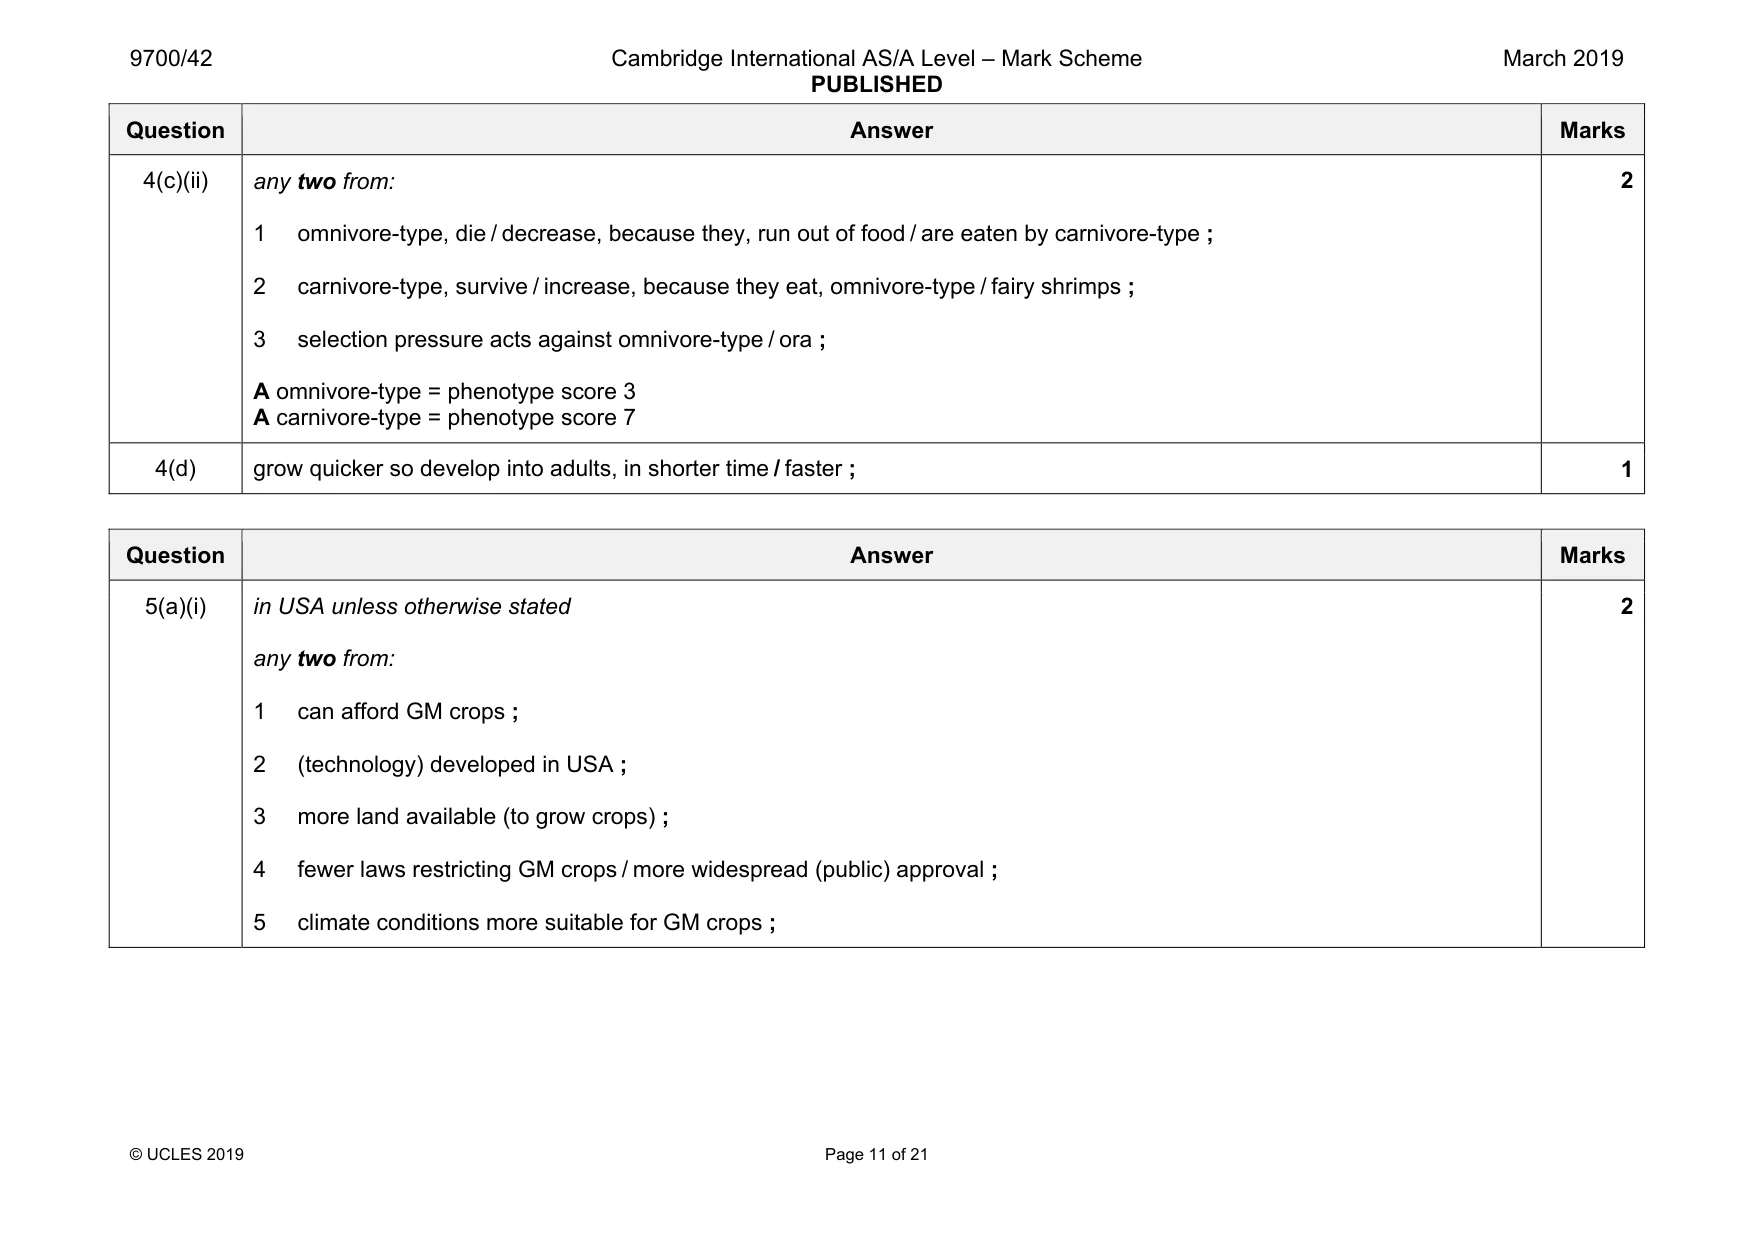
Mark scheme: 4(a) any four from: 1 frequency of, omnivore-type and carnivore-type / extreme, phenotypes remain high or frequency of intermediate phenotypes decreases ; 2 disruptive selection ; 3 selection pressure is food availability ; 4 omnivore-type and carnivore-type / extreme, phenotypes, are more likely to survive / have a selective advantage or intermediate phenotypes, less likely to survive / selected against ; 5 (because they are) good at / poor at, accessing available food ; 6 ref. to competition ; A omnivore-type = phenotype score 3 A carnivore-type = phenotype score 7 4 4(b) 0.58 1.1 (× 100) ; 52.7 / 53 ; 2 4(c)(i) directional ; 1 Question Answer Marks 4(c)(ii) any two from: 1 omnivore-type, die / decrease, because they, run out of food / are eaten by carnivore-type ; 2 carnivore-type, survive / increase, because they eat, omnivore-type / fairy shrimps ; 3 selection pressure acts against omnivore-type / ora ; A omnivore-type = phenotype score 3 A carnivore-type = phenotype score 7 2 4(d) grow quicker so develop into adults, in shorter time / faster ; 1
Q5 · The area of land that was used to grow genetically modified (GM) crops in the USA…
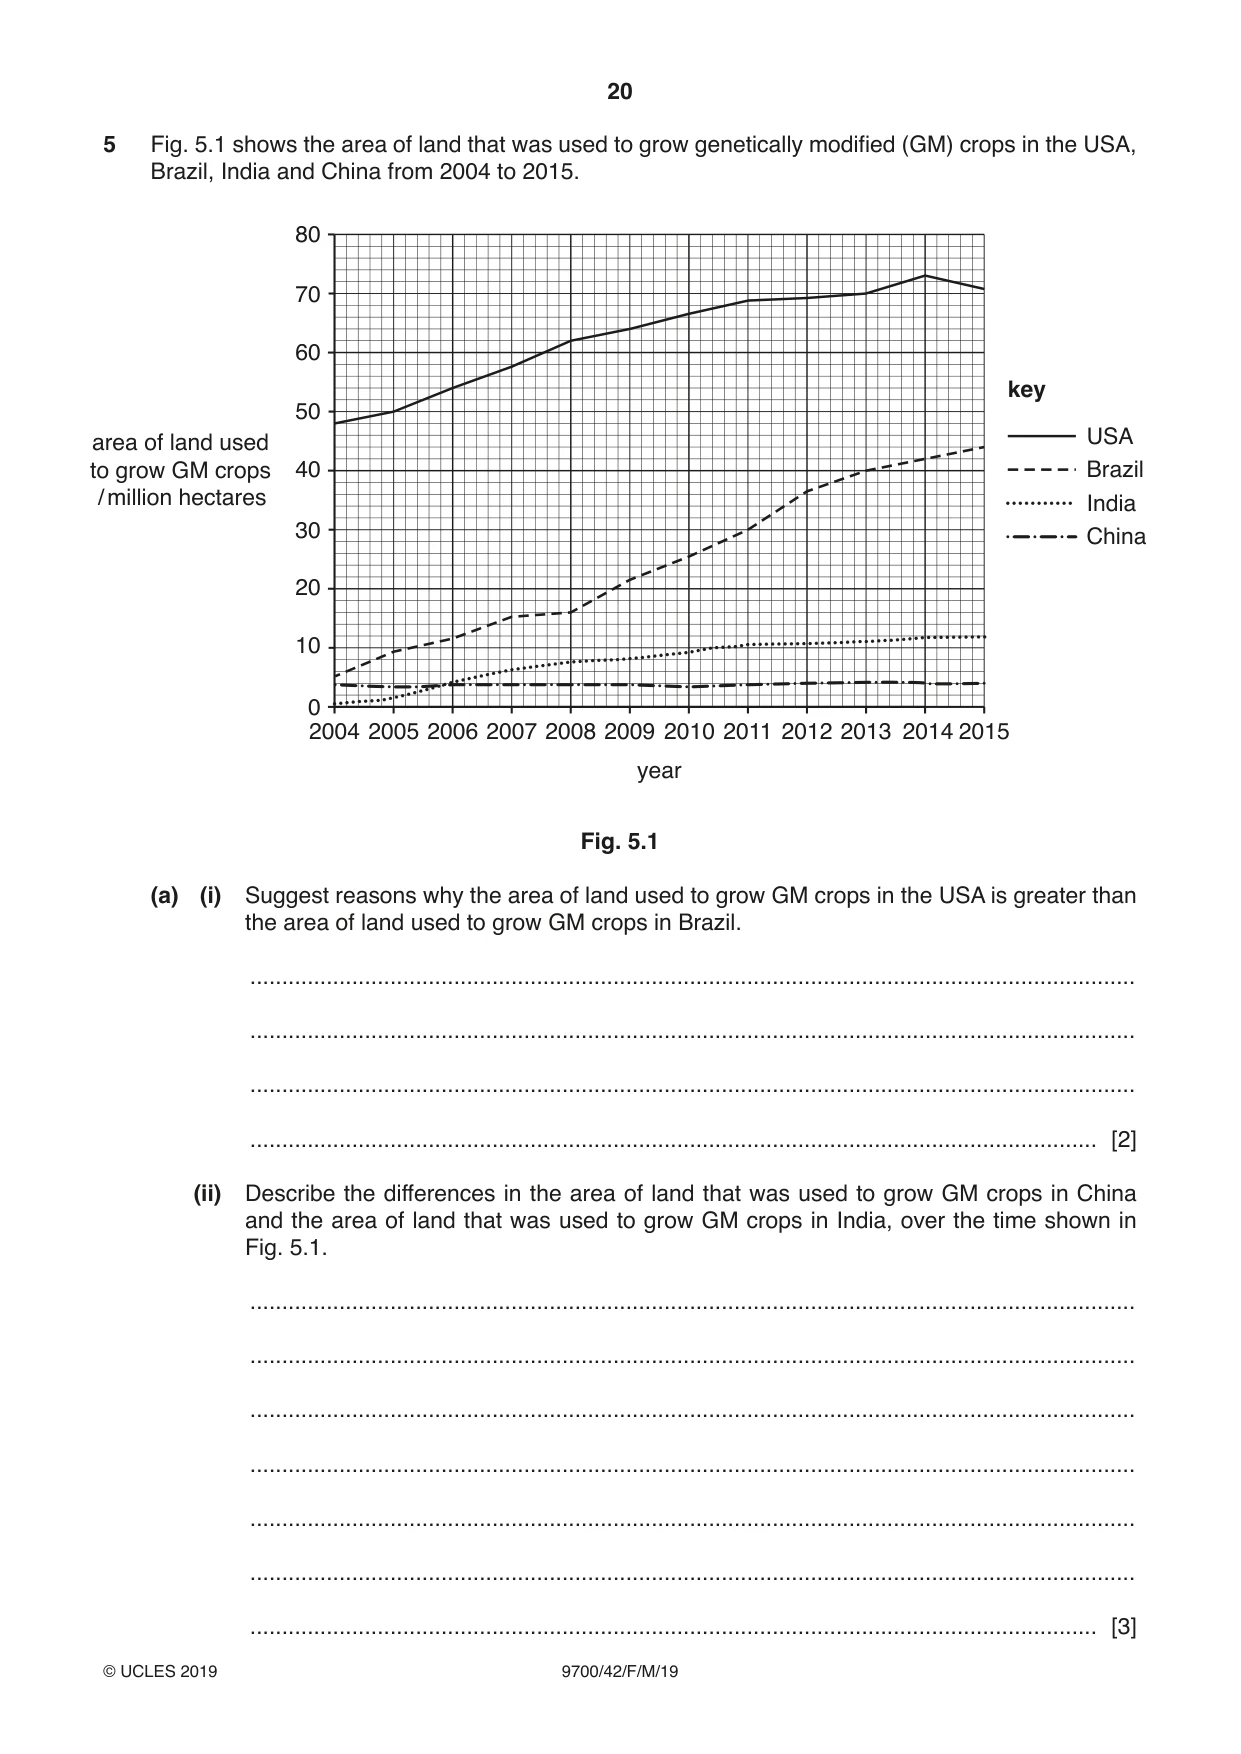
5 Fig. 5.1 shows the area of land that was used to grow genetically modified (GM) crops in the USA, Brazil, India and China from 2004 to 2015. 80 70 60 key 50 USAarea of land used to grow GM crops 40 Brazil / million hectares India 30 China 20 10 0 2004 2005 2006 2007 2008 2009 2010 2011 2012 2013 2014 2015 year Fig. 5.1 (a) (i) Suggest reasons why the area of land used to grow GM crops in the USA is greater than the area of land used to grow GM crops in Brazil. ........................................................................................................................................... ........................................................................................................................................... ........................................................................................................................................... ..................................................................................................................................... [2] (ii) Describe the differences in the area of land that was used to grow GM crops in China and the area of land that was used to grow GM crops in India, over the time shown in Fig. 5.1. ........................................................................................................................................... ........................................................................................................................................... ........................................................................................................................................... ........................................................................................................................................... ........................................................................................................................................... ........................................................................................................................................... ..................................................................................................................................... [3] (b) (i) Genetic modifications in crops can provide resistance to insect pests. Bt maize is one type of GM crop that has been produced to be resistant to insect pests. State two benefits to farmers of insect resistance in crops. ........................................................................................................................................... ........................................................................................................................................... ........................................................................................................................................... ..................................................................................................................................... [2] (ii) Describe the difference between Bt maize and non-GM maize that explains why Bt maize is resistant to insects. ........................................................................................................................................... ........................................................................................................................................... ........................................................................................................................................... ..................................................................................................................................... [2] (c) (i) State two reasons why people may have objections to the growth of insect-resistant GM crops. ........................................................................................................................................... ........................................................................................................................................... ........................................................................................................................................... ..................................................................................................................................... [2] (ii) In 2015, the percentage of the USA population that objected to the use of GM crops was lower than in 2005. Suggest why a smaller percentage of the USA population objected to the use of GM crops in 2015. ........................................................................................................................................... ..................................................................................................................................... [1] [Total: 12]
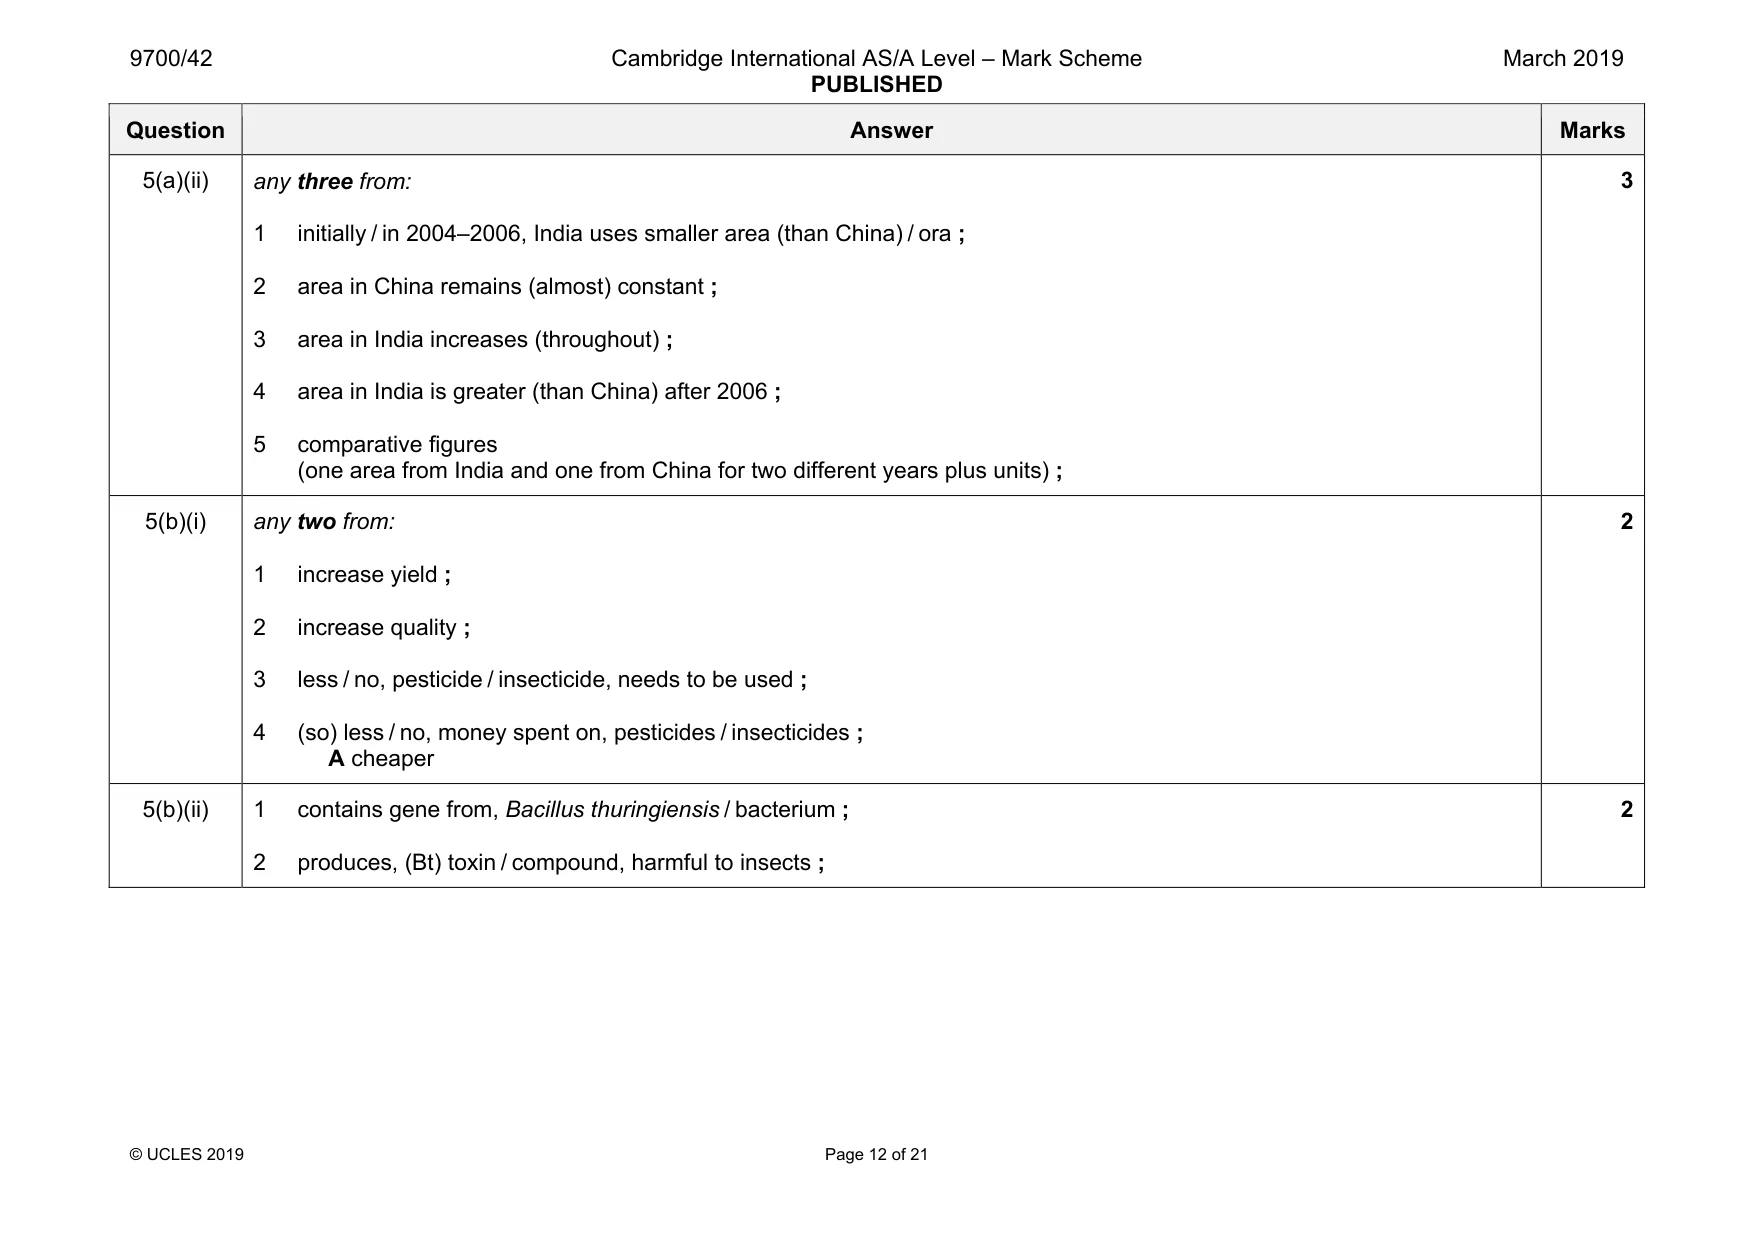
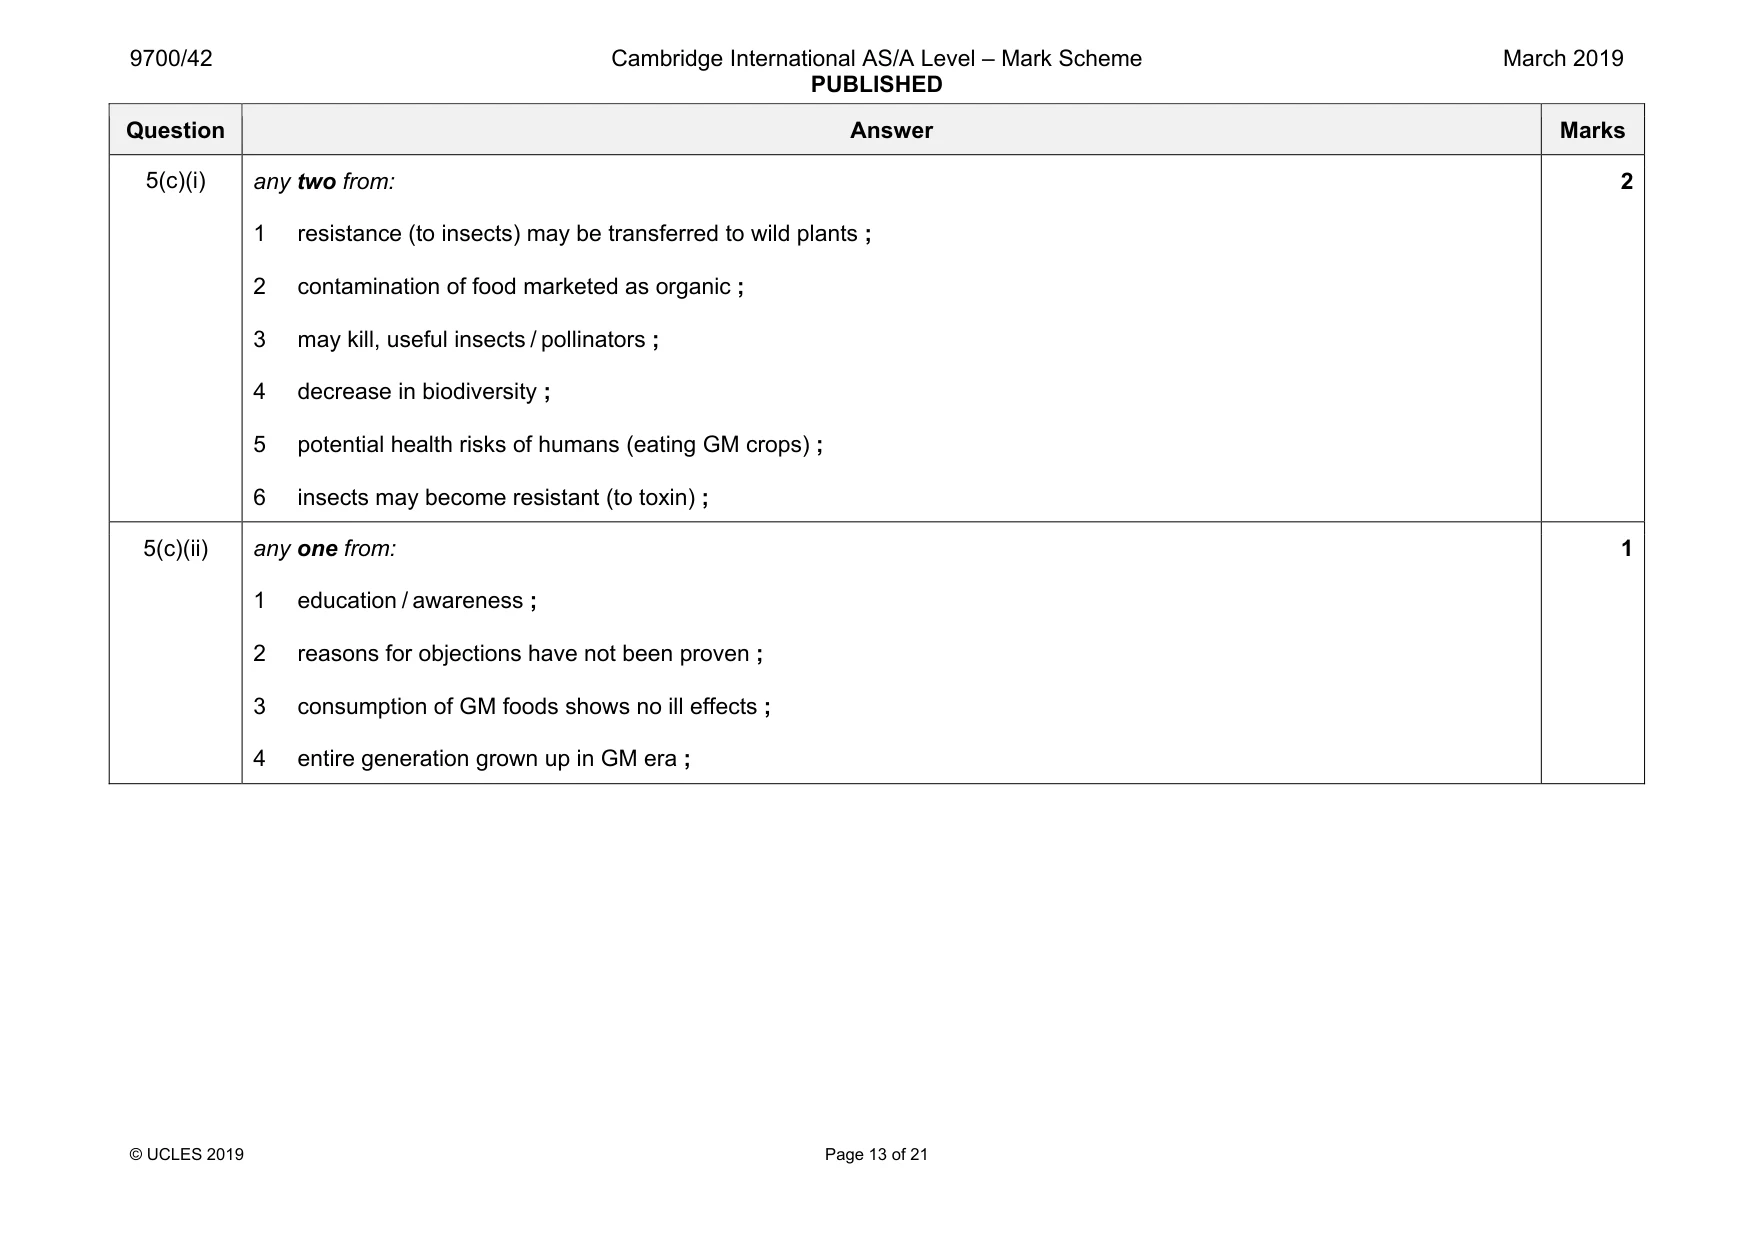
Mark scheme: 5(a)(i) in USA unless otherwise stated any two from: 1 can afford GM crops ; 2 (technology) developed in USA ; 3 more land available (to grow crops) ; 4 fewer laws restricting GM crops / more widespread (public) approval ; 5 climate conditions more suitable for GM crops ; 2 Question Answer Marks 5(a)(ii) any three from: 1 initially / in 2004–2006, India uses smaller area (than China) / ora ; 2 area in China remains (almost) constant ; 3 area in India increases (throughout) ; 4 area in India is greater (than China) after 2006 ; 5 comparative figures (one area from India and one from China for two different years plus units) ; 3 5(b)(i) any two from: 1 increase yield ; 2 increase quality ; 3 less / no, pesticide / insecticide, needs to be used ; 4 (so) less / no, money spent on, pesticides / insecticides ; A cheaper 2 5(b)(ii) 1 contains gene from, Bacillus thuringiensis / bacterium ; 2 produces, (Bt) toxin / compound, harmful to insects ; 2 Question Answer Marks 5(c)(i) any two from: 1 resistance (to insects) may be transferred to wild plants ; 2 contamination of food marketed as organic ; 3 may kill, useful insects / pollinators ; 4 decrease in biodiversity ; 5 potential health risks of humans (eating GM crops) ; 6 insects may become resistant (to toxin) ; 2 5(c)(ii) any one from: 1 education / awareness ; 2 reasons for objections have not been proven ; 3 consumption of GM foods shows no ill effects ; 4 entire generation grown up in GM era ; 1
More questions on Genetically modified organisms in agriculture
Q6 · MELAS syndrome is an inherited disease caused by a mutation in a gene located in…
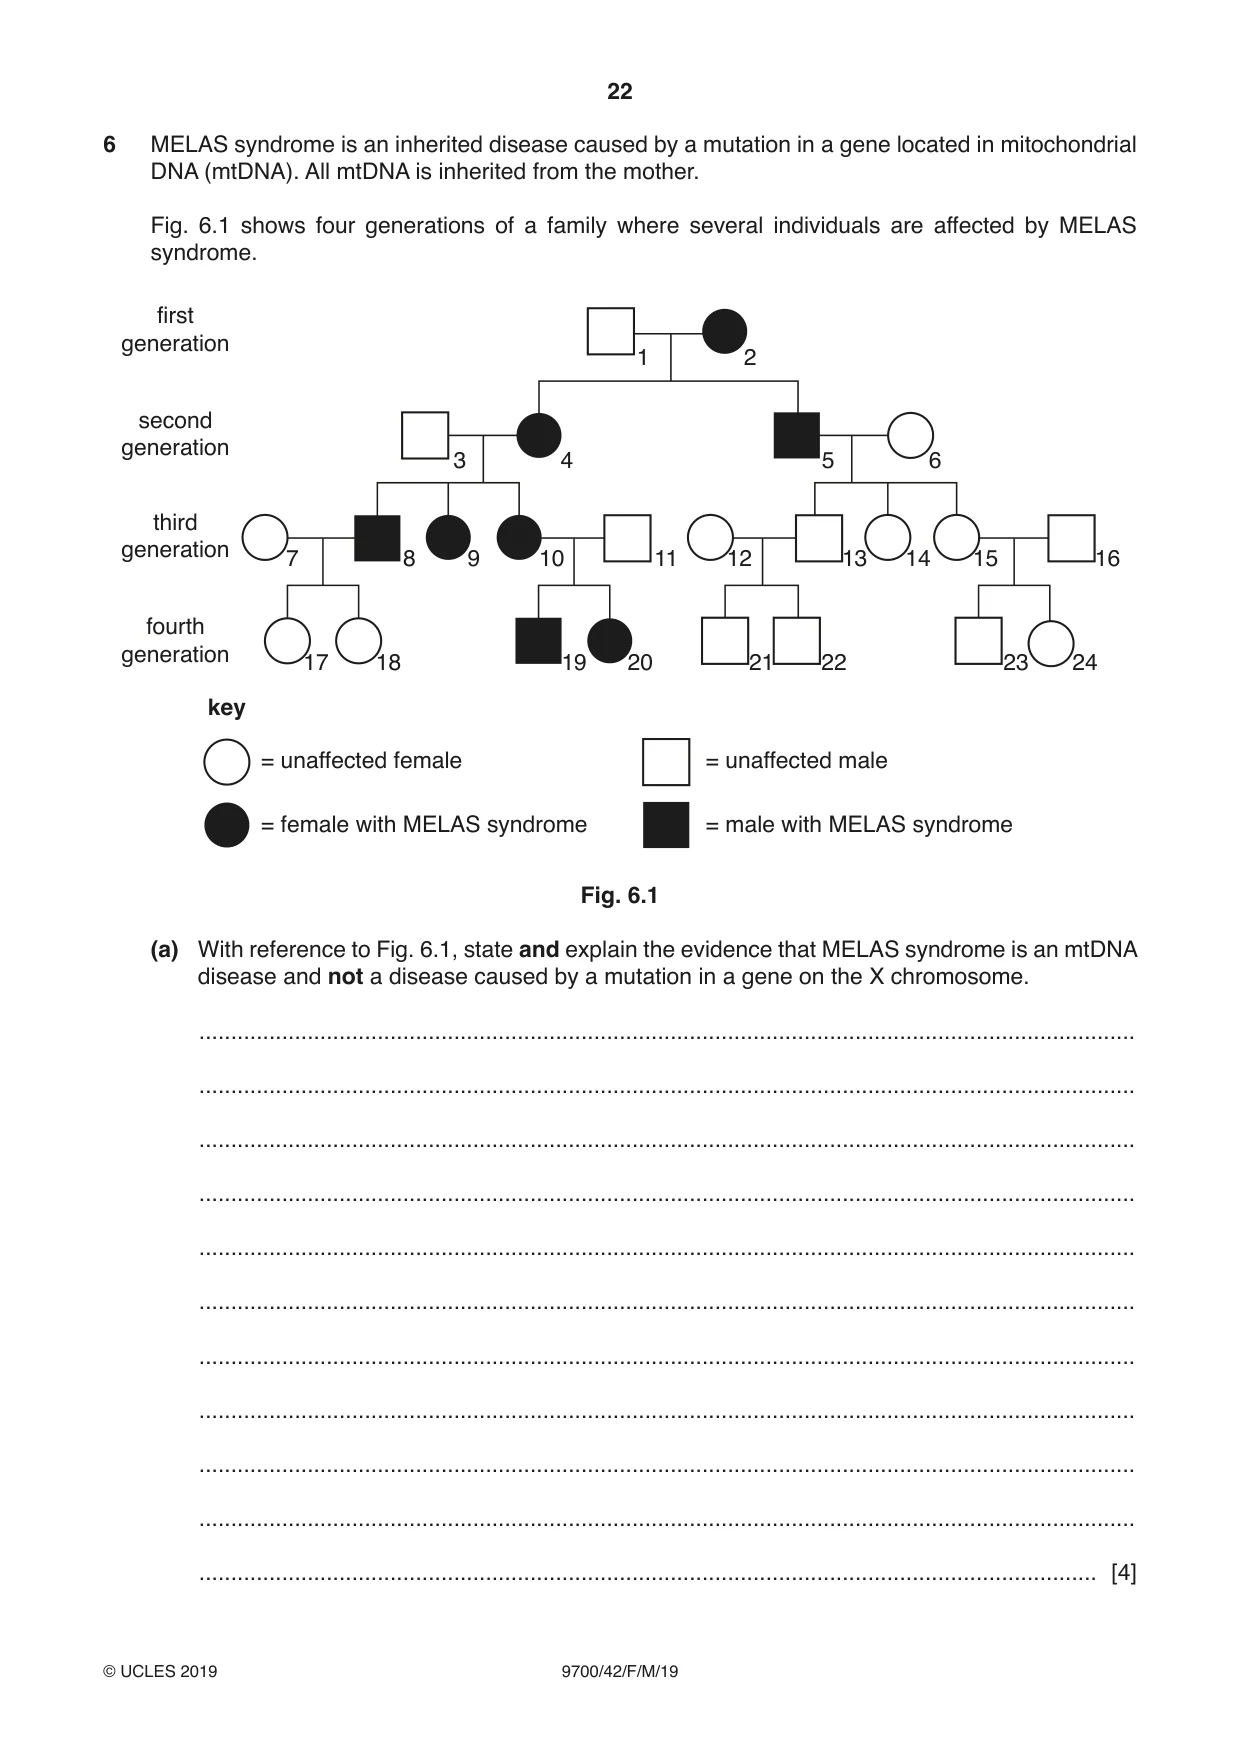
6 MELAS syndrome is an inherited disease caused by a mutation in a gene located in mitochondrial DNA (mtDNA). All mtDNA is inherited from the mother. Fig. 6.1 shows four generations of a family where several individuals are affected by MELAS syndrome. first generation 1 2 second generation 3 4 5 6 third generation 7 8 9 10 11 12 13 14 15 16 fourth generation 17 18 19 20 21 22 23 24 key = unaffected female = unaffected male = female with MELAS syndrome = male with MELAS syndrome Fig. 6.1 (a) With reference to Fig. 6.1, state and explain the evidence that MELAS syndrome is an mtDNA disease and not a disease caused by a mutation in a gene on the X chromosome. ................................................................................................................................................... ................................................................................................................................................... ................................................................................................................................................... ................................................................................................................................................... ................................................................................................................................................... ................................................................................................................................................... ................................................................................................................................................... ................................................................................................................................................... ................................................................................................................................................... ................................................................................................................................................... ............................................................................................................................................. [4] (b) Analysis of mtDNA can show how recently species have evolved from each other. Describe the properties of mtDNA that make it suitable for the study of evolution. ................................................................................................................................................... ................................................................................................................................................... ................................................................................................................................................... ................................................................................................................................................... ................................................................................................................................................... ................................................................................................................................................... ................................................................................................................................................... ............................................................................................................................................. [3] [Total: 7]
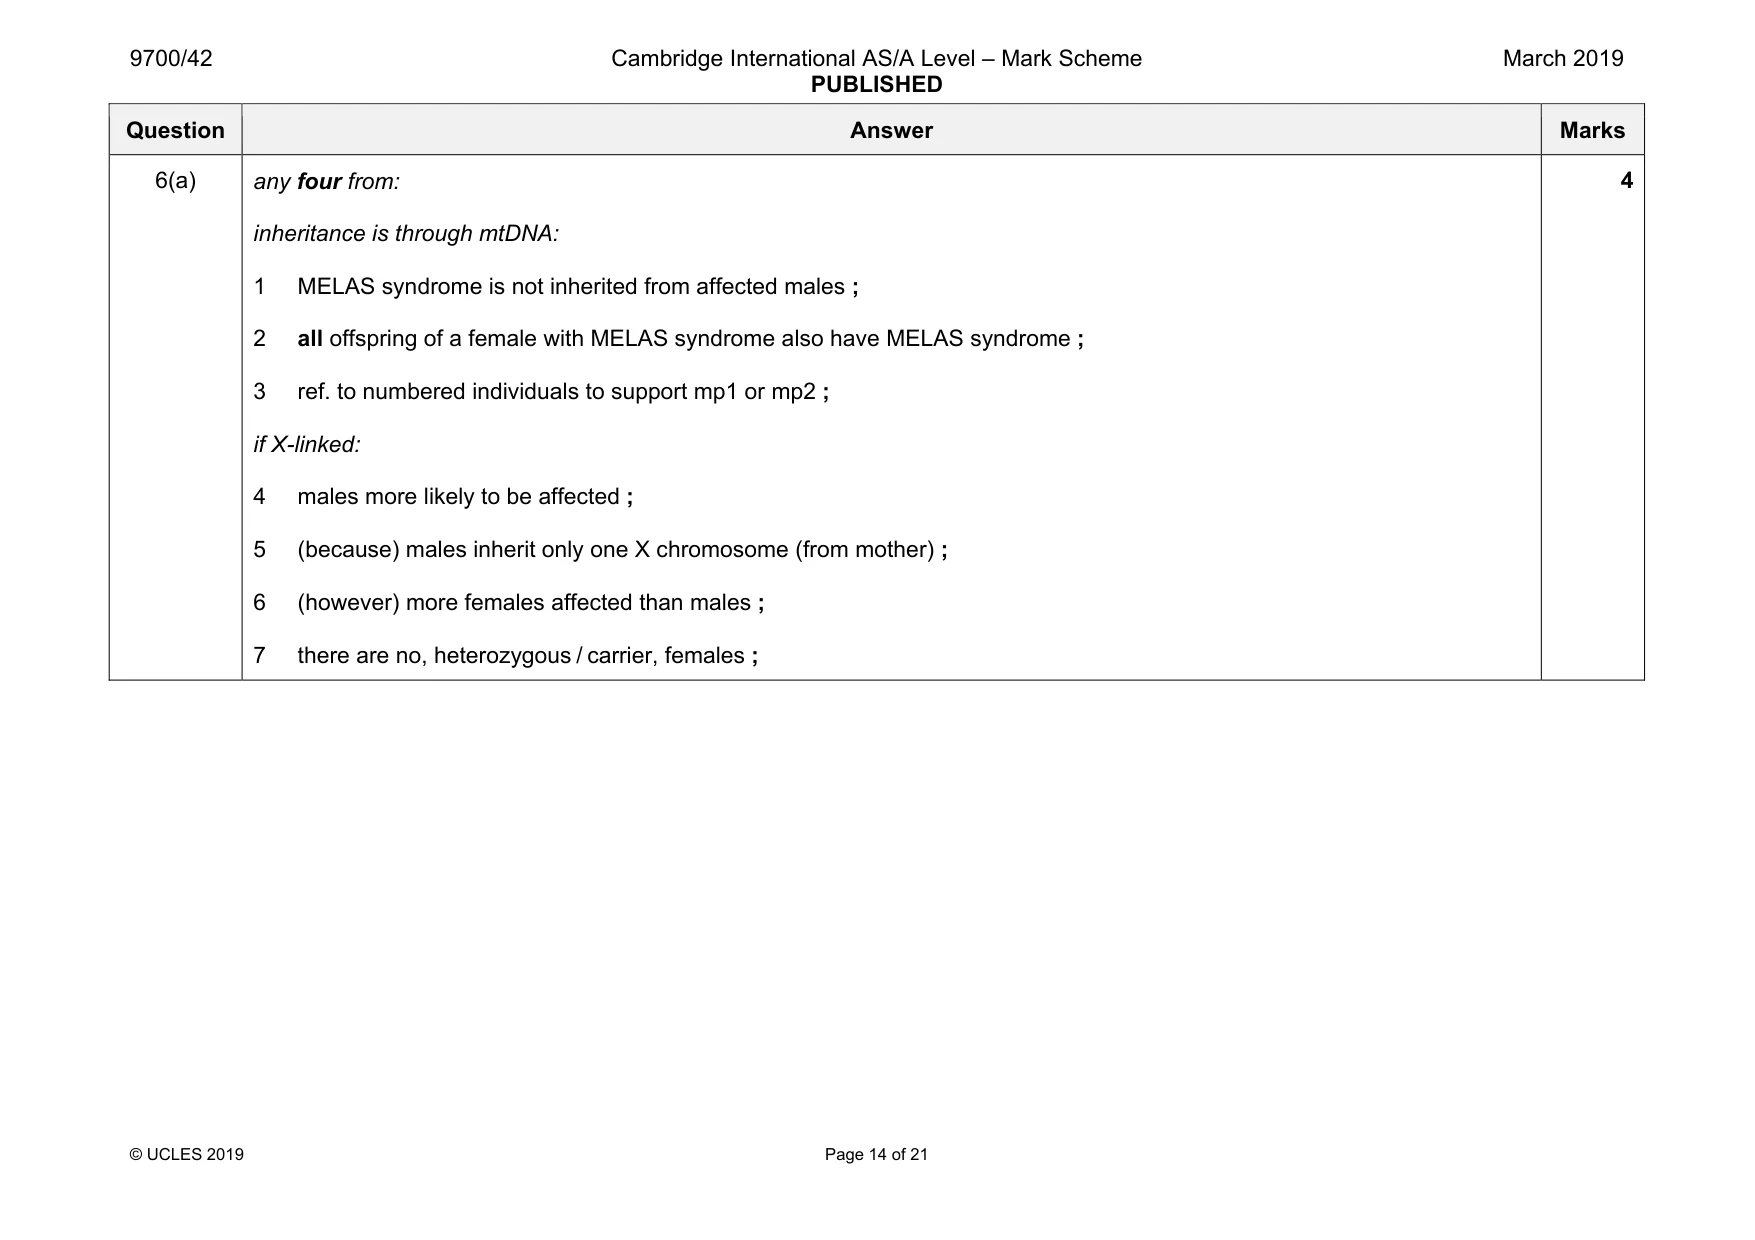
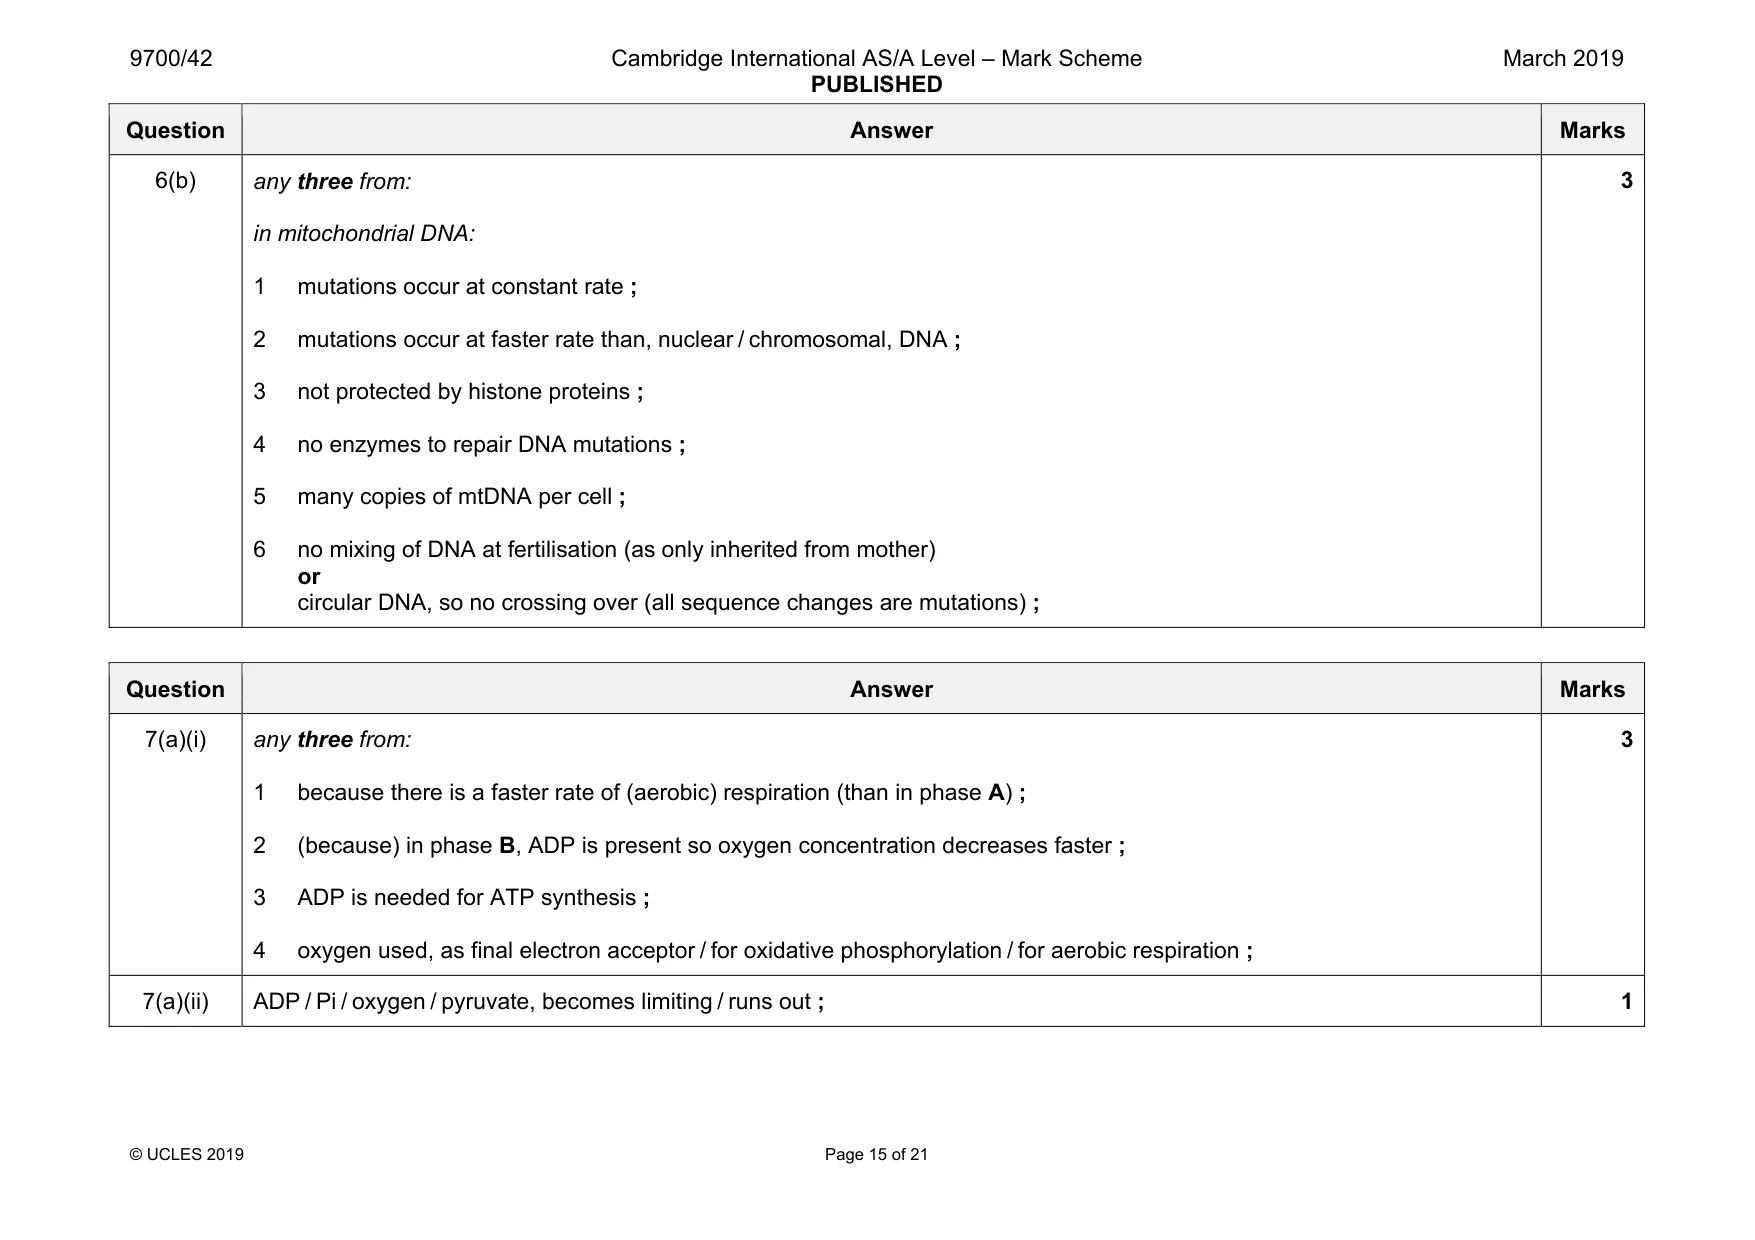
Mark scheme: 6(a) any four from: inheritance is through mtDNA: 1 MELAS syndrome is not inherited from affected males ; 2 all offspring of a female with MELAS syndrome also have MELAS syndrome ; 3 ref. to numbered individuals to support mp1 or mp2 ; if X-linked: 4 males more likely to be affected ; 5 (because) males inherit only one X chromosome (from mother) ; 6 (however) more females affected than males ; 7 there are no, heterozygous / carrier, females ; 4 Question Answer Marks 6(b) any three from: in mitochondrial DNA: 1 mutations occur at constant rate ; 2 mutations occur at faster rate than, nuclear / chromosomal, DNA ; 3 not protected by histone proteins ; 4 no enzymes to repair DNA mutations ; 5 many copies of mtDNA per cell ; 6 no mixing of DNA at fertilisation (as only inherited from mother) or circular DNA, so no crossing over (all sequence changes are mutations) ; 3
More questions on Passage of information from parents to offspring
Q7 · Isolated mitochondria were used to investigate respiration
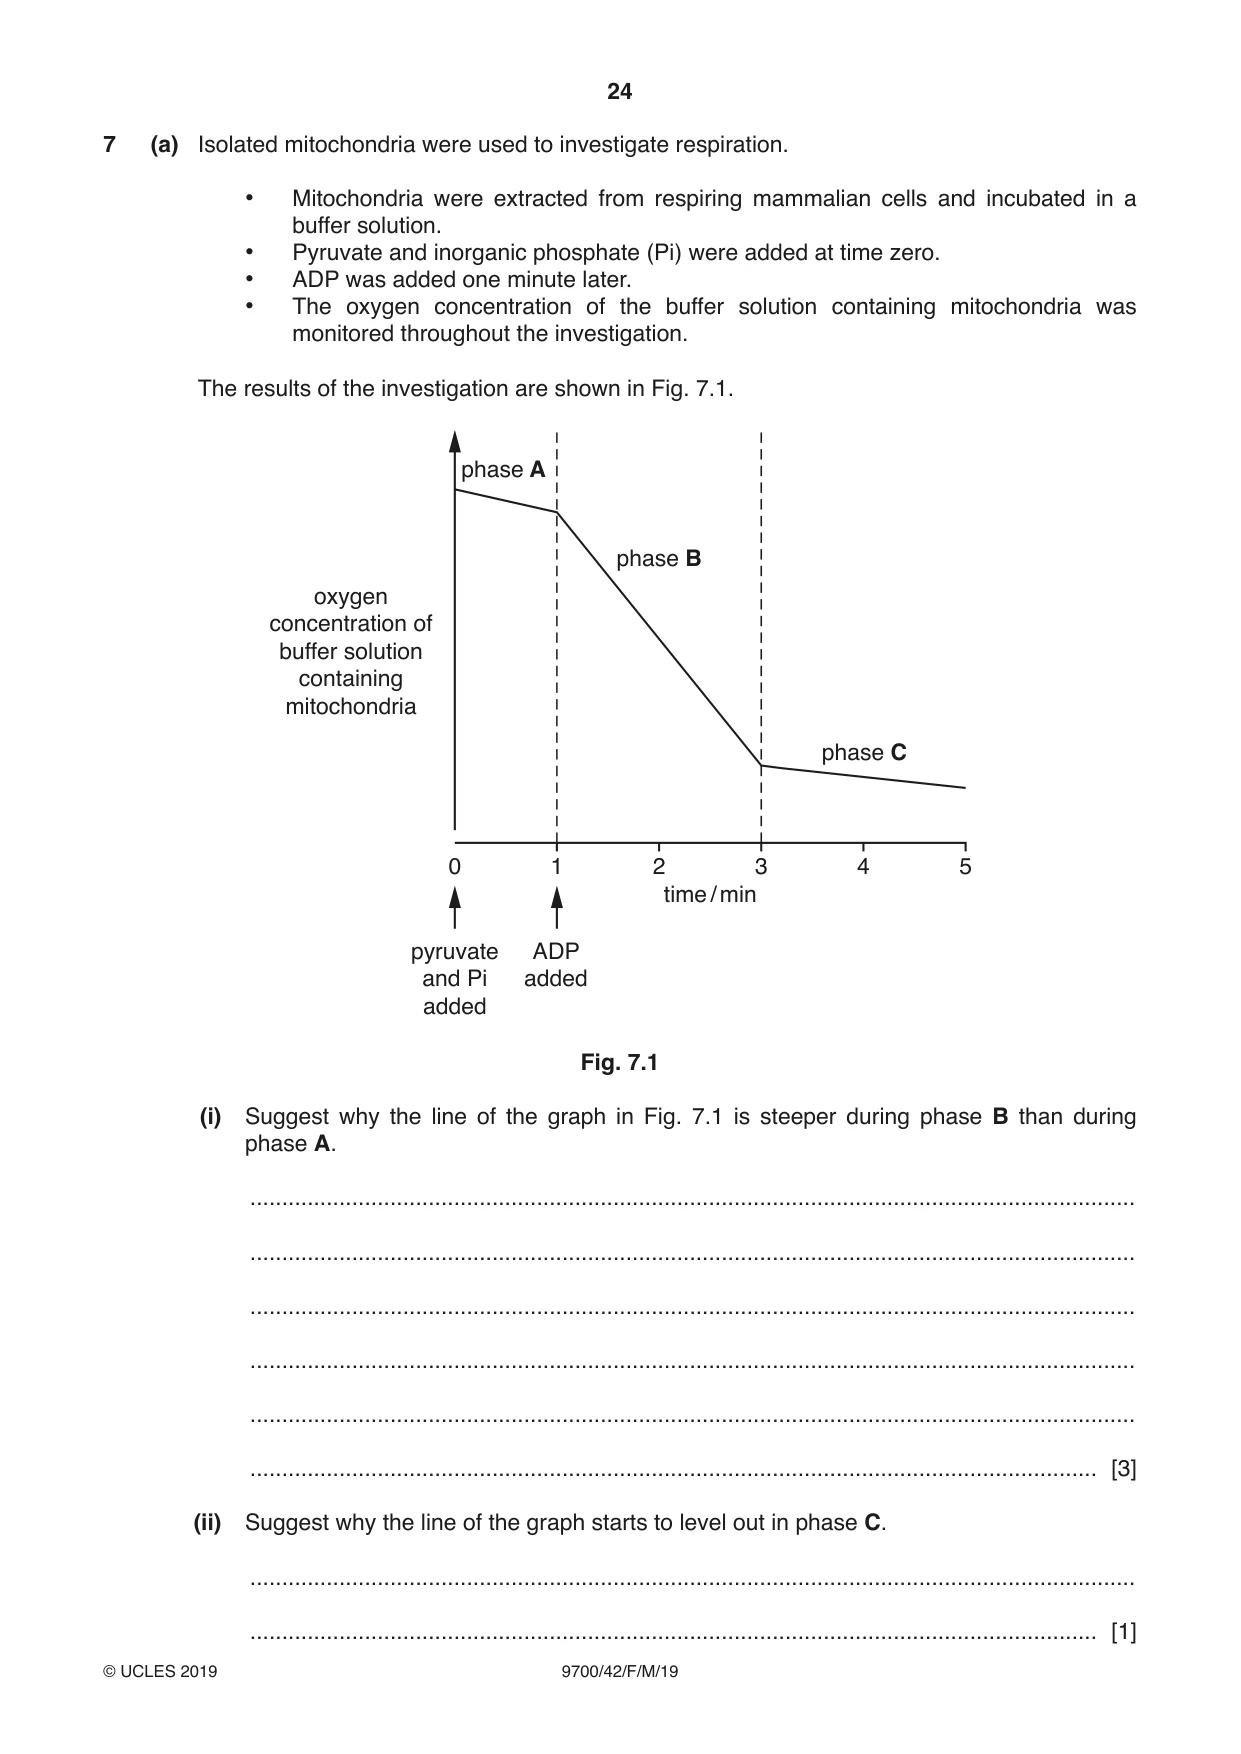
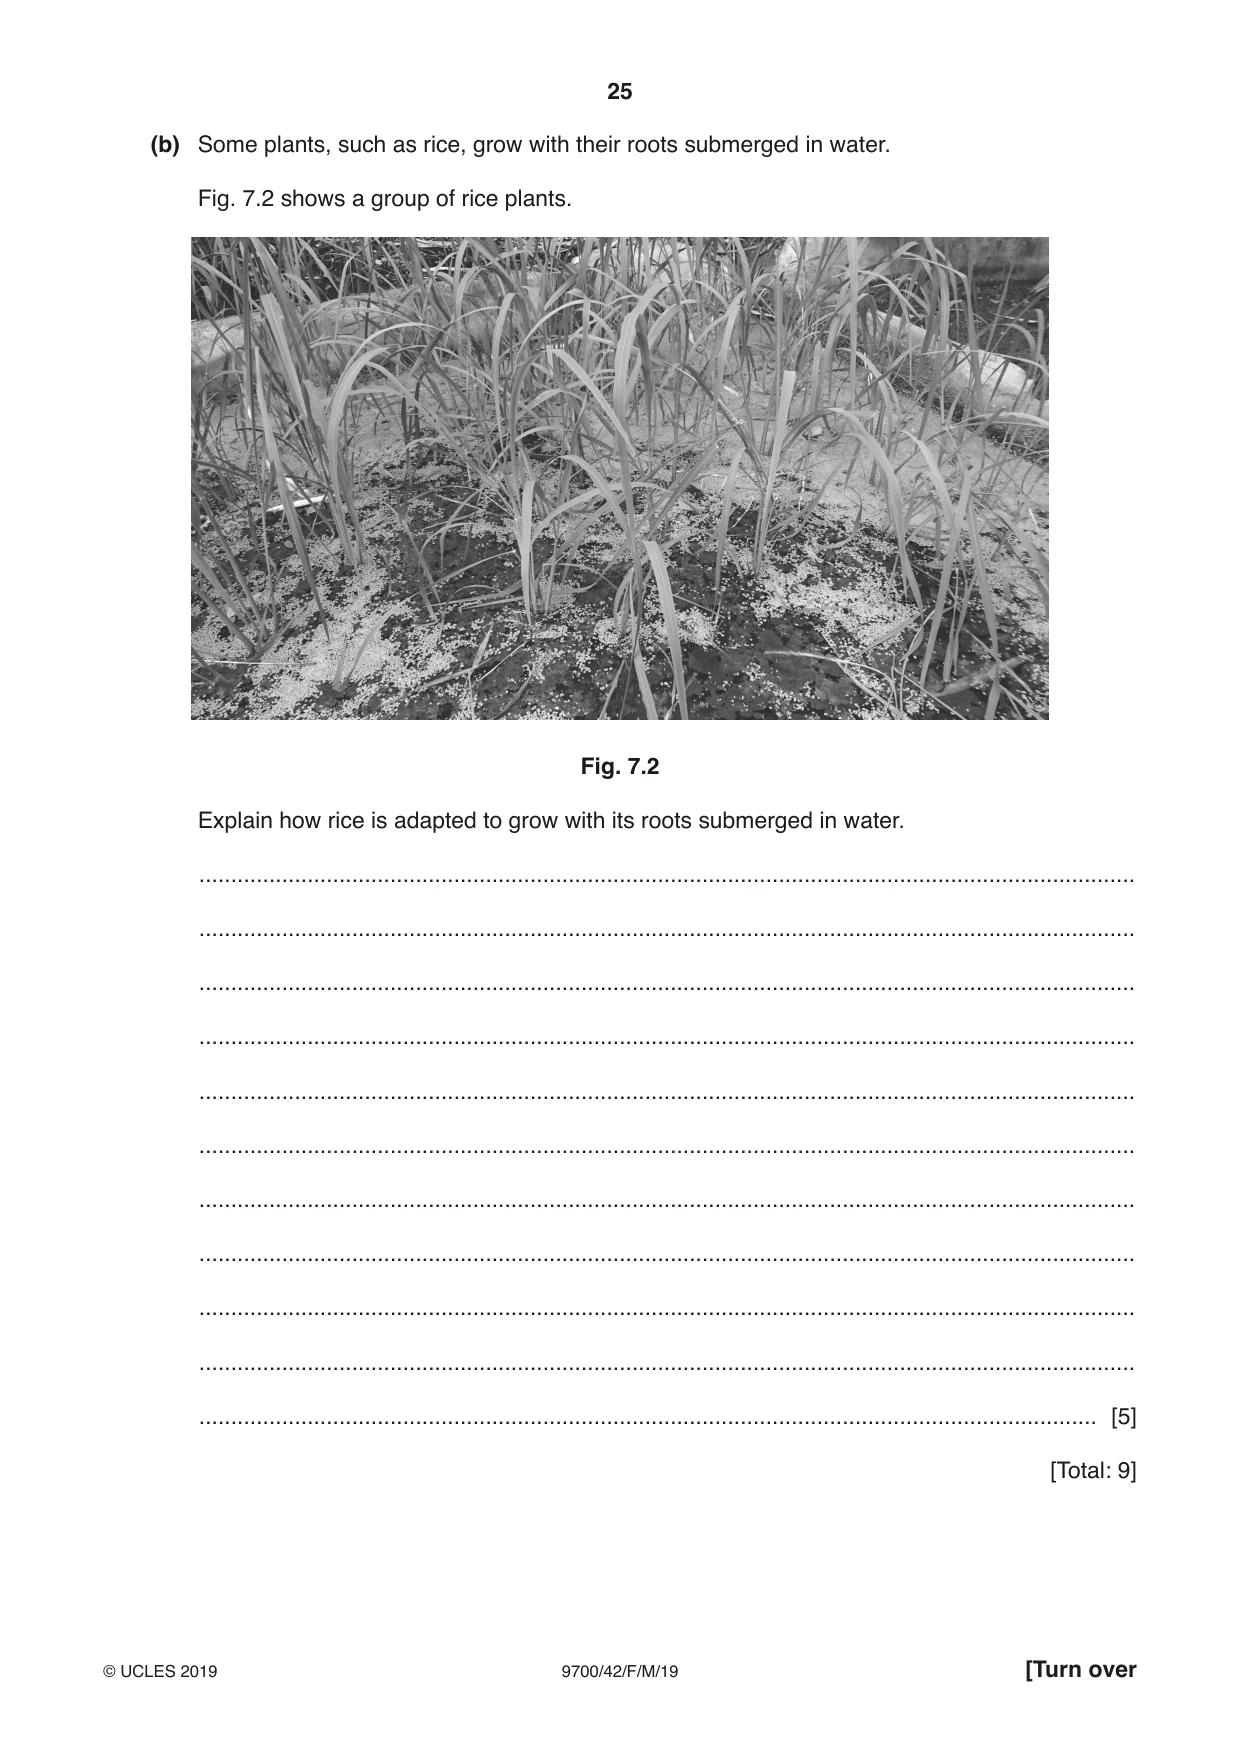
7 (a) Isolated mitochondria were used to investigate respiration. • Mitochondria were extracted from respiring mammalian cells and incubated in a buffer solution. • Pyruvate and inorganic phosphate (Pi) were added at time zero. • ADP was added one minute later. • The oxygen concentration of the buffer solution containing mitochondria was monitored throughout the investigation. The results of the investigation are shown in Fig. 7.1. phase A phase B oxygen concentration of buffer solution containing mitochondria phase C 0 1 2 3 4 5 time / min pyruvate ADP and Pi added added Fig. 7.1 (i) Suggest why the line of the graph in Fig. 7.1 is steeper during phase B than during phase A. ........................................................................................................................................... ........................................................................................................................................... ........................................................................................................................................... ........................................................................................................................................... ........................................................................................................................................... ..................................................................................................................................... [3] (ii) Suggest why the line of the graph starts to level out in phase C. ........................................................................................................................................... ..................................................................................................................................... [1] (b) Some plants, such as rice, grow with their roots submerged in water. Fig. 7.2 shows a group of rice plants. Fig. 7.2 Explain how rice is adapted to grow with its roots submerged in water. ................................................................................................................................................... ................................................................................................................................................... ................................................................................................................................................... ................................................................................................................................................... ................................................................................................................................................... ................................................................................................................................................... ................................................................................................................................................... ................................................................................................................................................... ................................................................................................................................................... ................................................................................................................................................... ............................................................................................................................................. [5] [Total: 9]
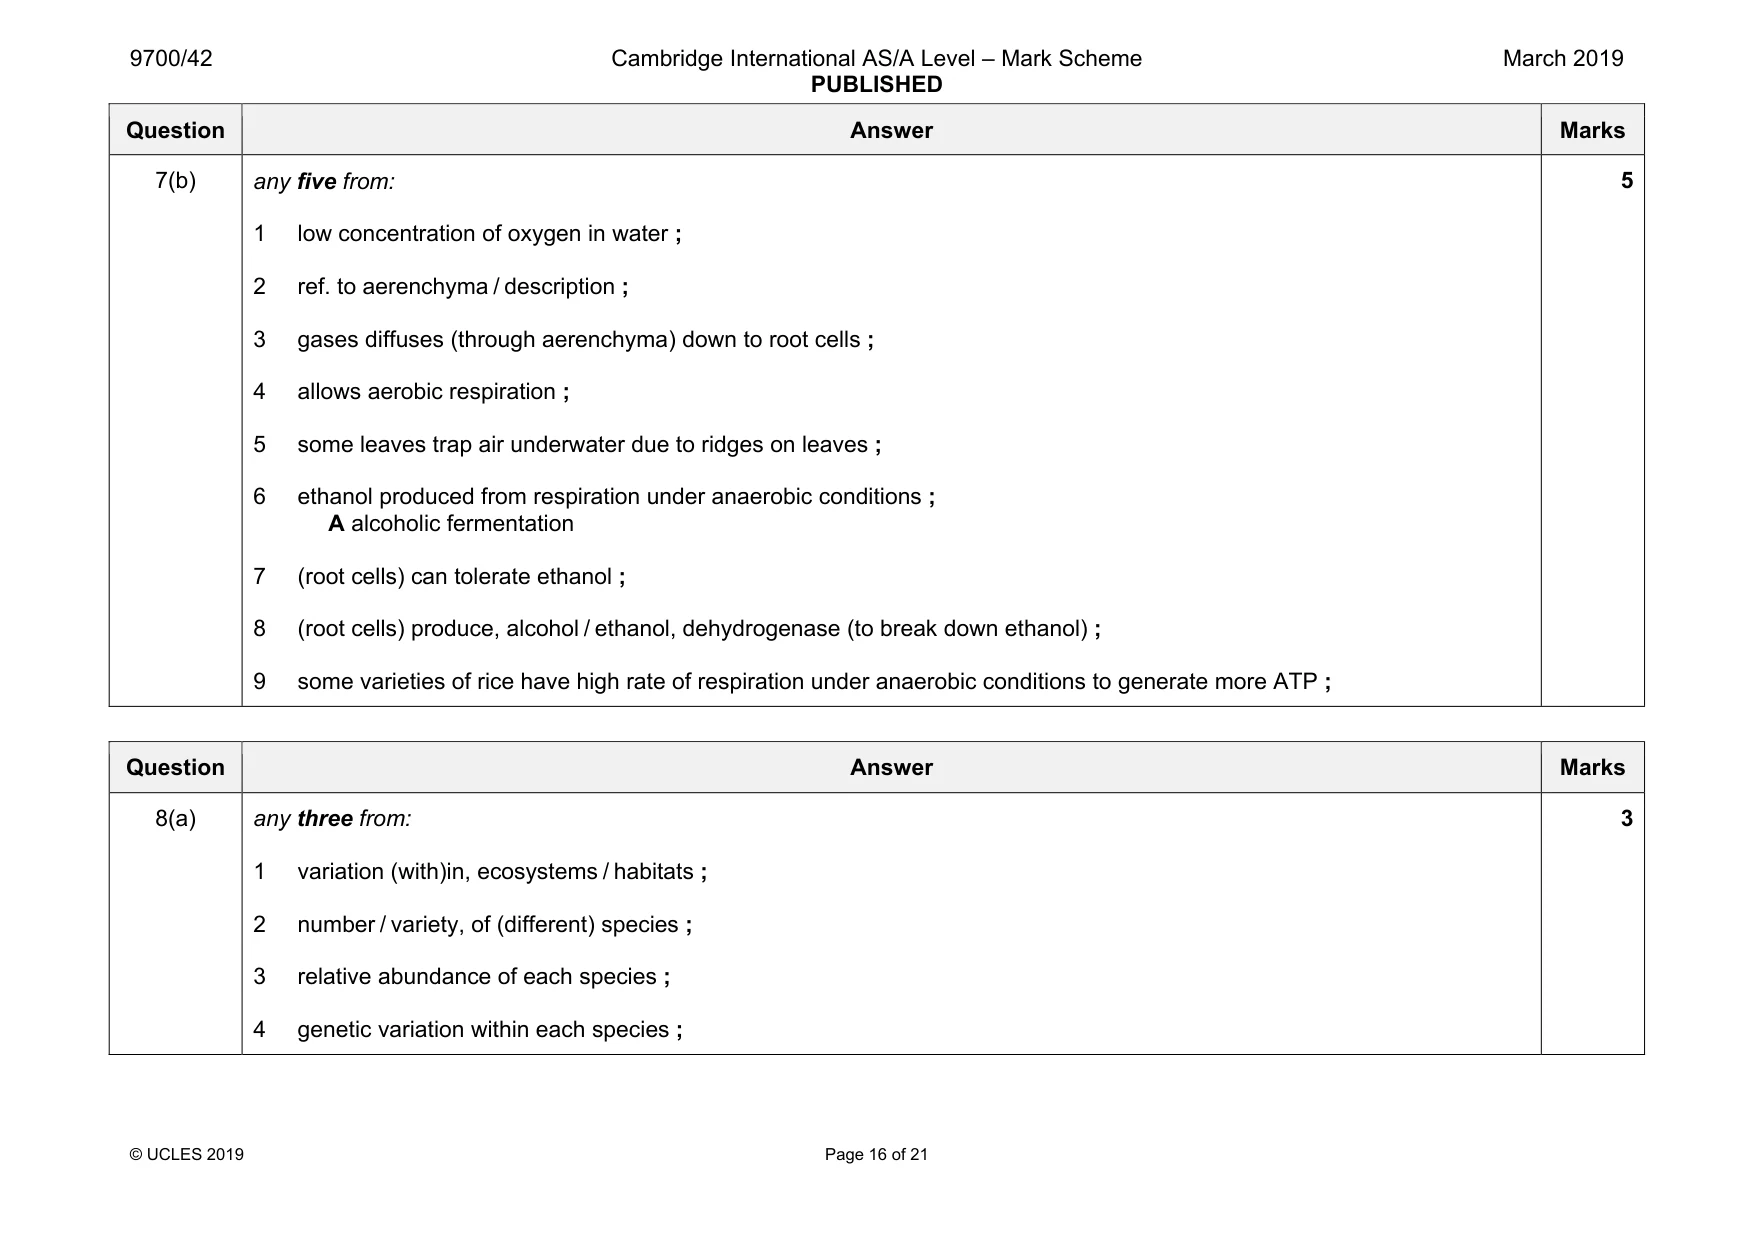
Mark scheme: 7(a)(i) any three from: 1 because there is a faster rate of (aerobic) respiration (than in phase A) ; 2 (because) in phase B, ADP is present so oxygen concentration decreases faster ; 3 ADP is needed for ATP synthesis ; 4 oxygen used, as final electron acceptor / for oxidative phosphorylation / for aerobic respiration ; 3 7(a)(ii) ADP / Pi / oxygen / pyruvate, becomes limiting / runs out ; 1 Question Answer Marks 7(b) any five from: 1 low concentration of oxygen in water ; 2 ref. to aerenchyma / description ; 3 gases diffuses (through aerenchyma) down to root cells ; 4 allows aerobic respiration ; 5 some leaves trap air underwater due to ridges on leaves ; 6 ethanol produced from respiration under anaerobic conditions ; A alcoholic fermentation 7 (root cells) can tolerate ethanol ; 8 (root cells) produce, alcohol / ethanol, dehydrogenase (to break down ethanol) ; 9 some varieties of rice have high rate of respiration under anaerobic conditions to generate more ATP ; 5
Q8 · Explain what is meant by the term biodiversity
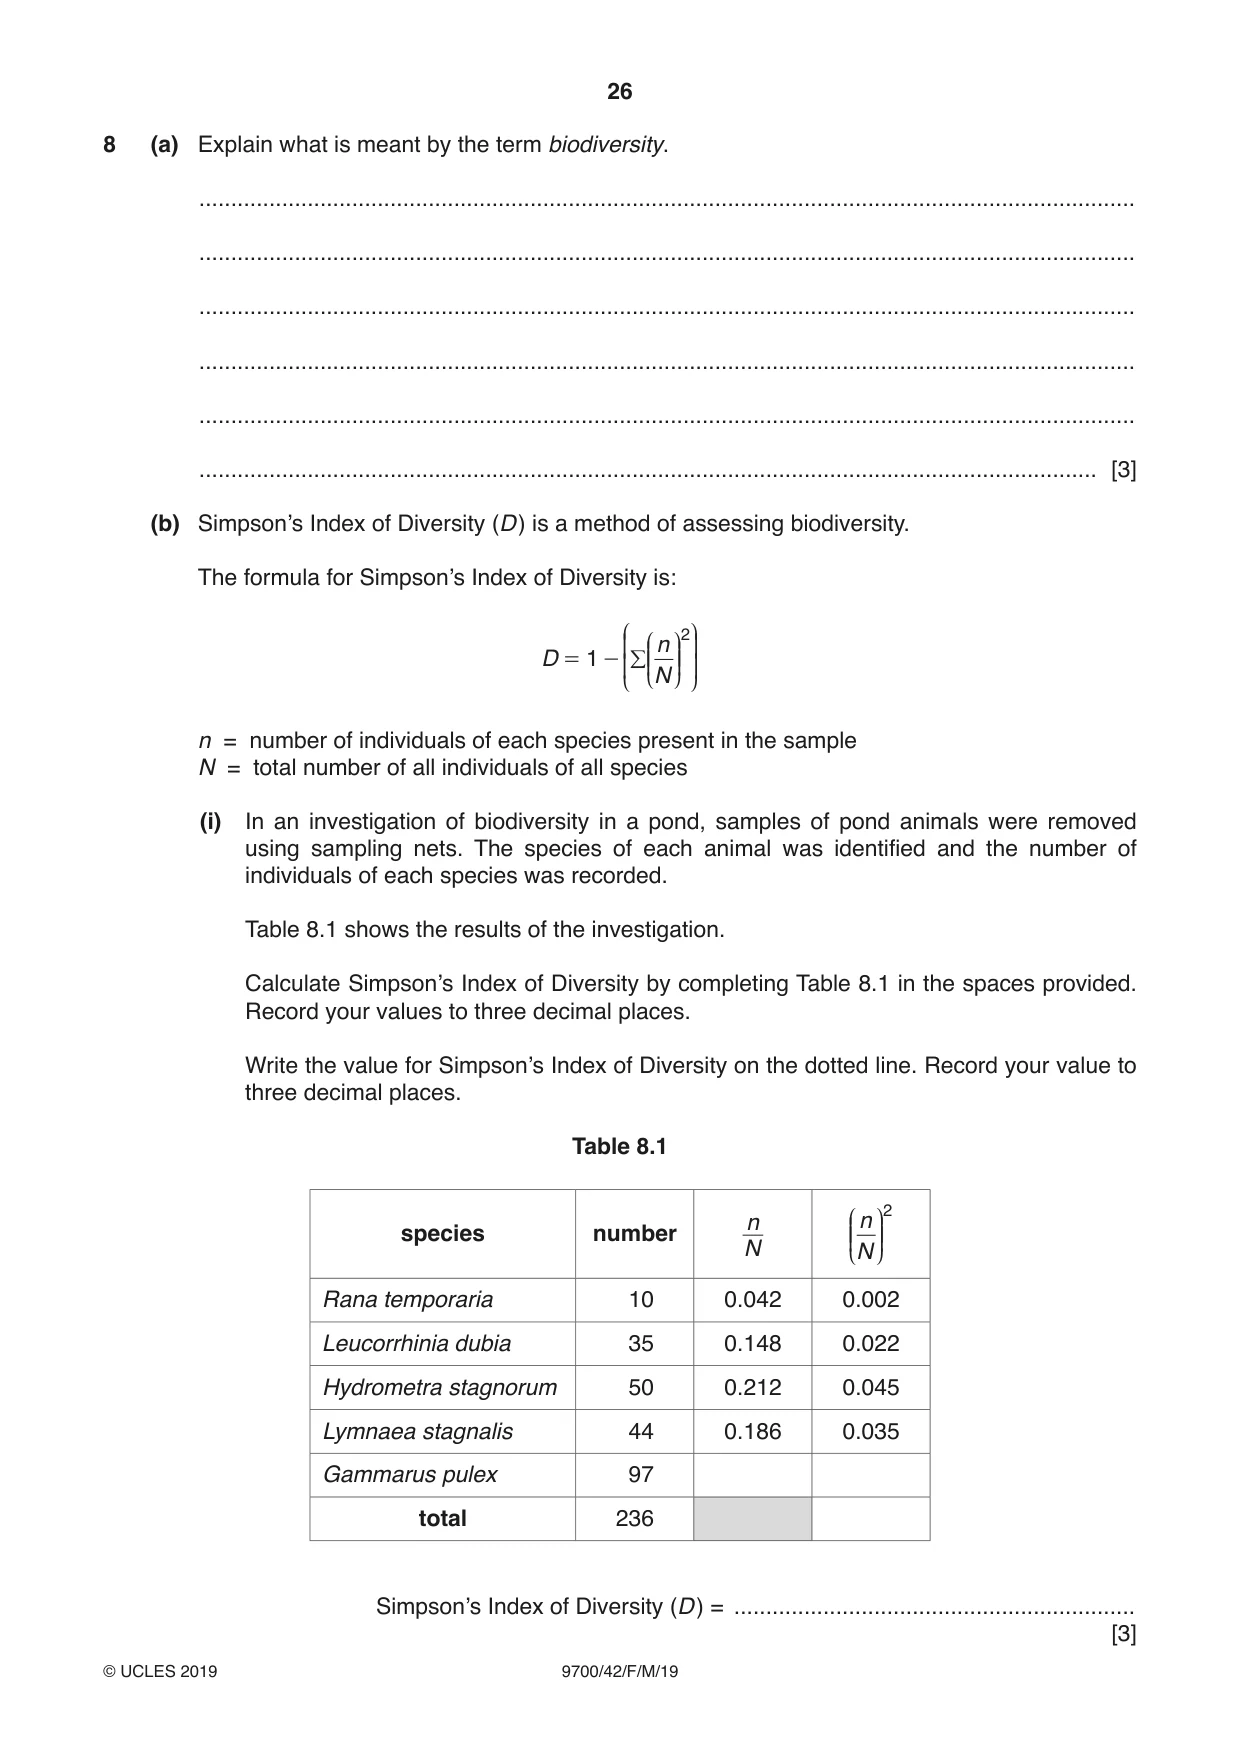
8 (a) Explain what is meant by the term biodiversity. ................................................................................................................................................... ................................................................................................................................................... ................................................................................................................................................... ................................................................................................................................................... ................................................................................................................................................... ............................................................................................................................................. [3] (b) Simpson’s Index of Diversity (D) is a method of assessing biodiversity. The formula for Simpson’s Index of Diversity is: J N J N2 K n O = D 1 - K/ KK OO O N L L P P n = number of individuals of each species present in the sample N = total number of all individuals of all species (i) In an investigation of biodiversity in a pond, samples of pond animals were removed using sampling nets. The species of each animal was identified and the number of individuals of each species was recorded. Table 8.1 shows the results of the investigation. Calculate Simpson’s Index of Diversity by completing Table 8.1 in the spaces provided. Record your values to three decimal places. Write the value for Simpson’s Index of Diversity on the dotted line. Record your value to three decimal places. Table 8.1 n J n N2 species number KK OO N N L P Rana temporaria 10 0.042 0.002 Leucorrhinia dubia 35 0.148 0.022 Hydrometra stagnorum 50 0.212 0.045 Lymnaea stagnalis 44 0.186 0.035 Gammarus pulex 97 total 236 Simpson’s Index of Diversity (D) = ............................................................... [3] (ii) Explain what this value for Simpson’s Index of Diversity shows about the diversity of the pond. ........................................................................................................................................... ........................................................................................................................................... ........................................................................................................................................... ..................................................................................................................................... [2] [Total: 8]
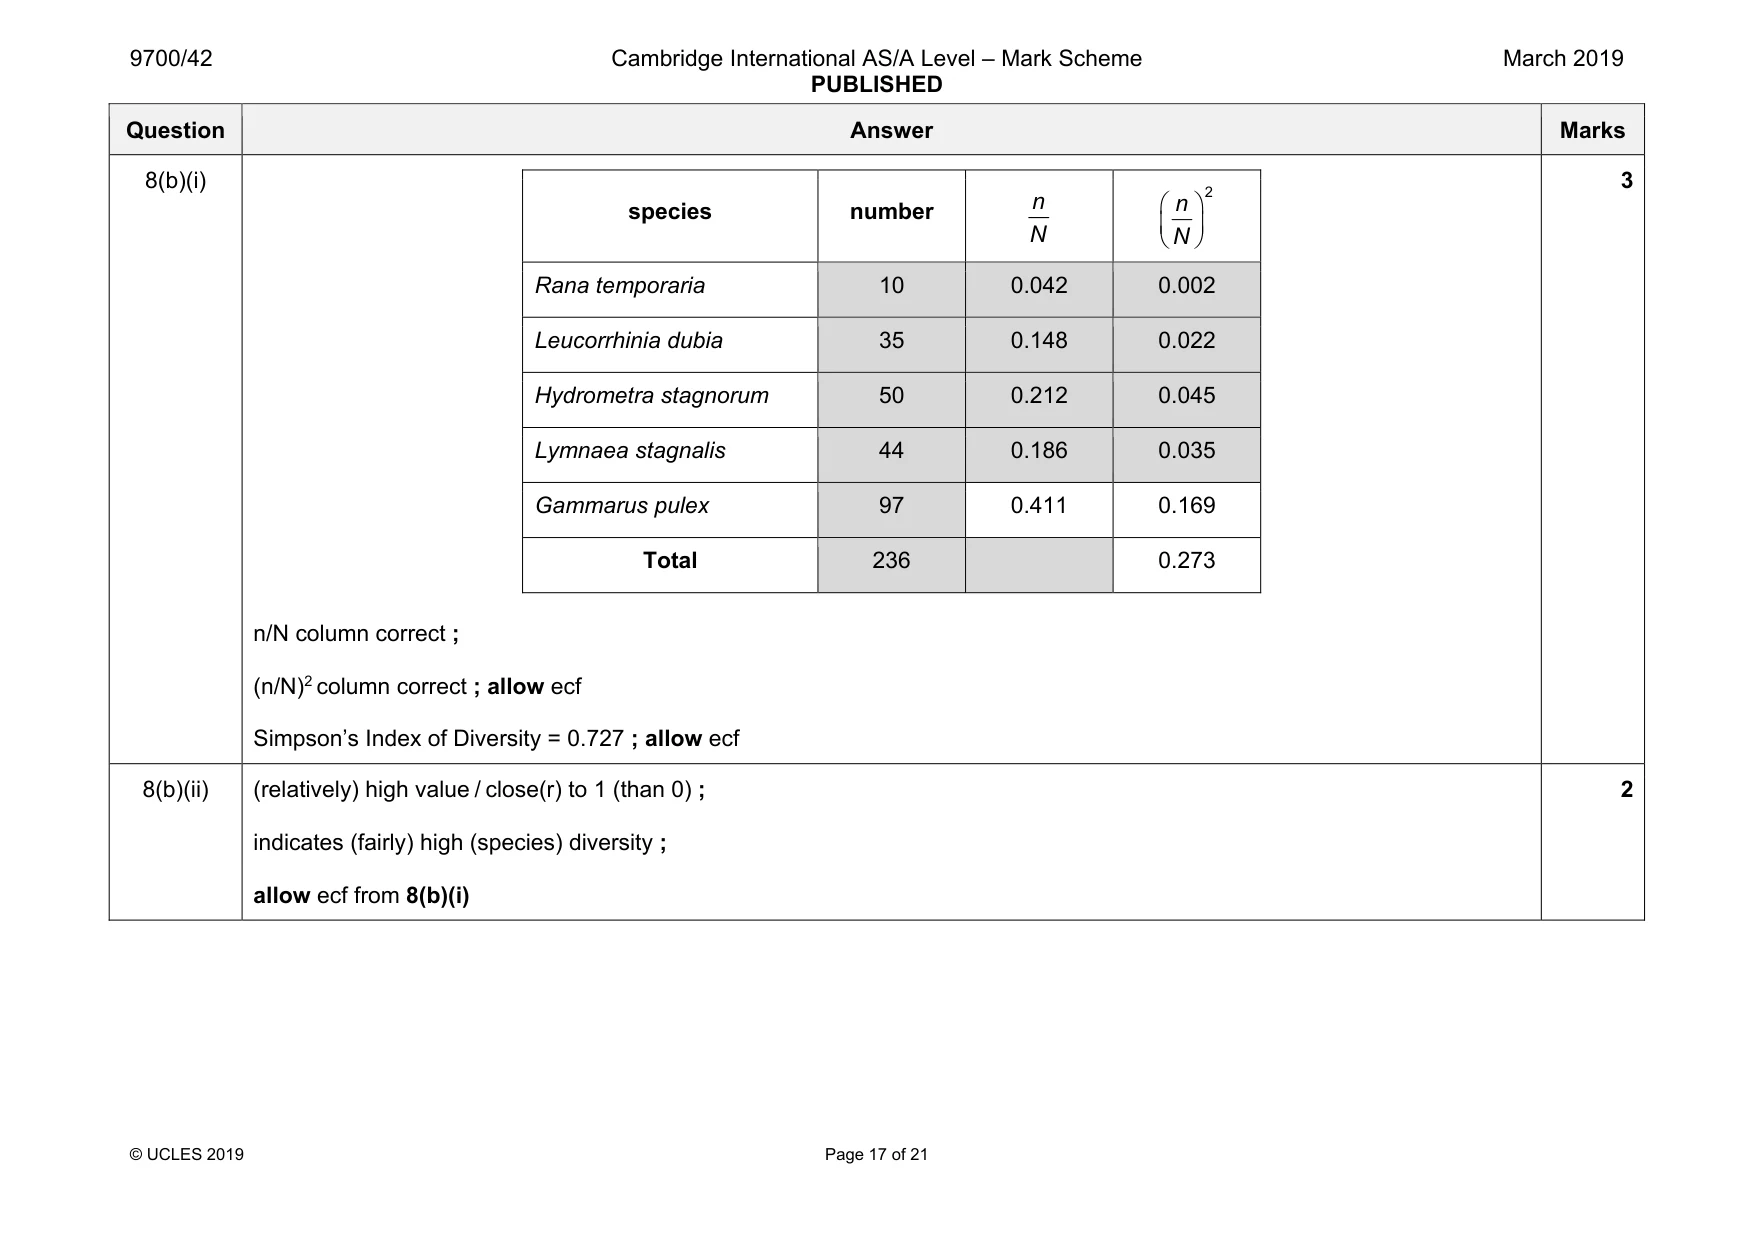
Mark scheme: 8(a) any three from: 1 variation (with)in, ecosystems / habitats ; 2 number / variety, of (different) species ; 3 relative abundance of each species ; 4 genetic variation within each species ; 3 Question Answer Marks 8(b)(i) species number n N 2 n N Rana temporaria 10 0.042 0.002 Leucorrhinia dubia 35 0.148 0.022 Hydrometra stagnorum 50 0.212 0.045 Lymnaea stagnalis 44 0.186 0.035 Gammarus pulex 97 0.411 0.169 Total 236 0.273 n/N column correct ; (n/N)2 column correct ; allow ecf Simpson’s Index of Diversity = 0.727 ; allow ecf 3 8(b)(ii) (relatively) high value / close(r) to 1 (than 0) ; indicates (fairly) high (species) diversity ; allow ecf from 8(b)(i) 2
Q9 · Describe the sliding filament model of muscular contraction
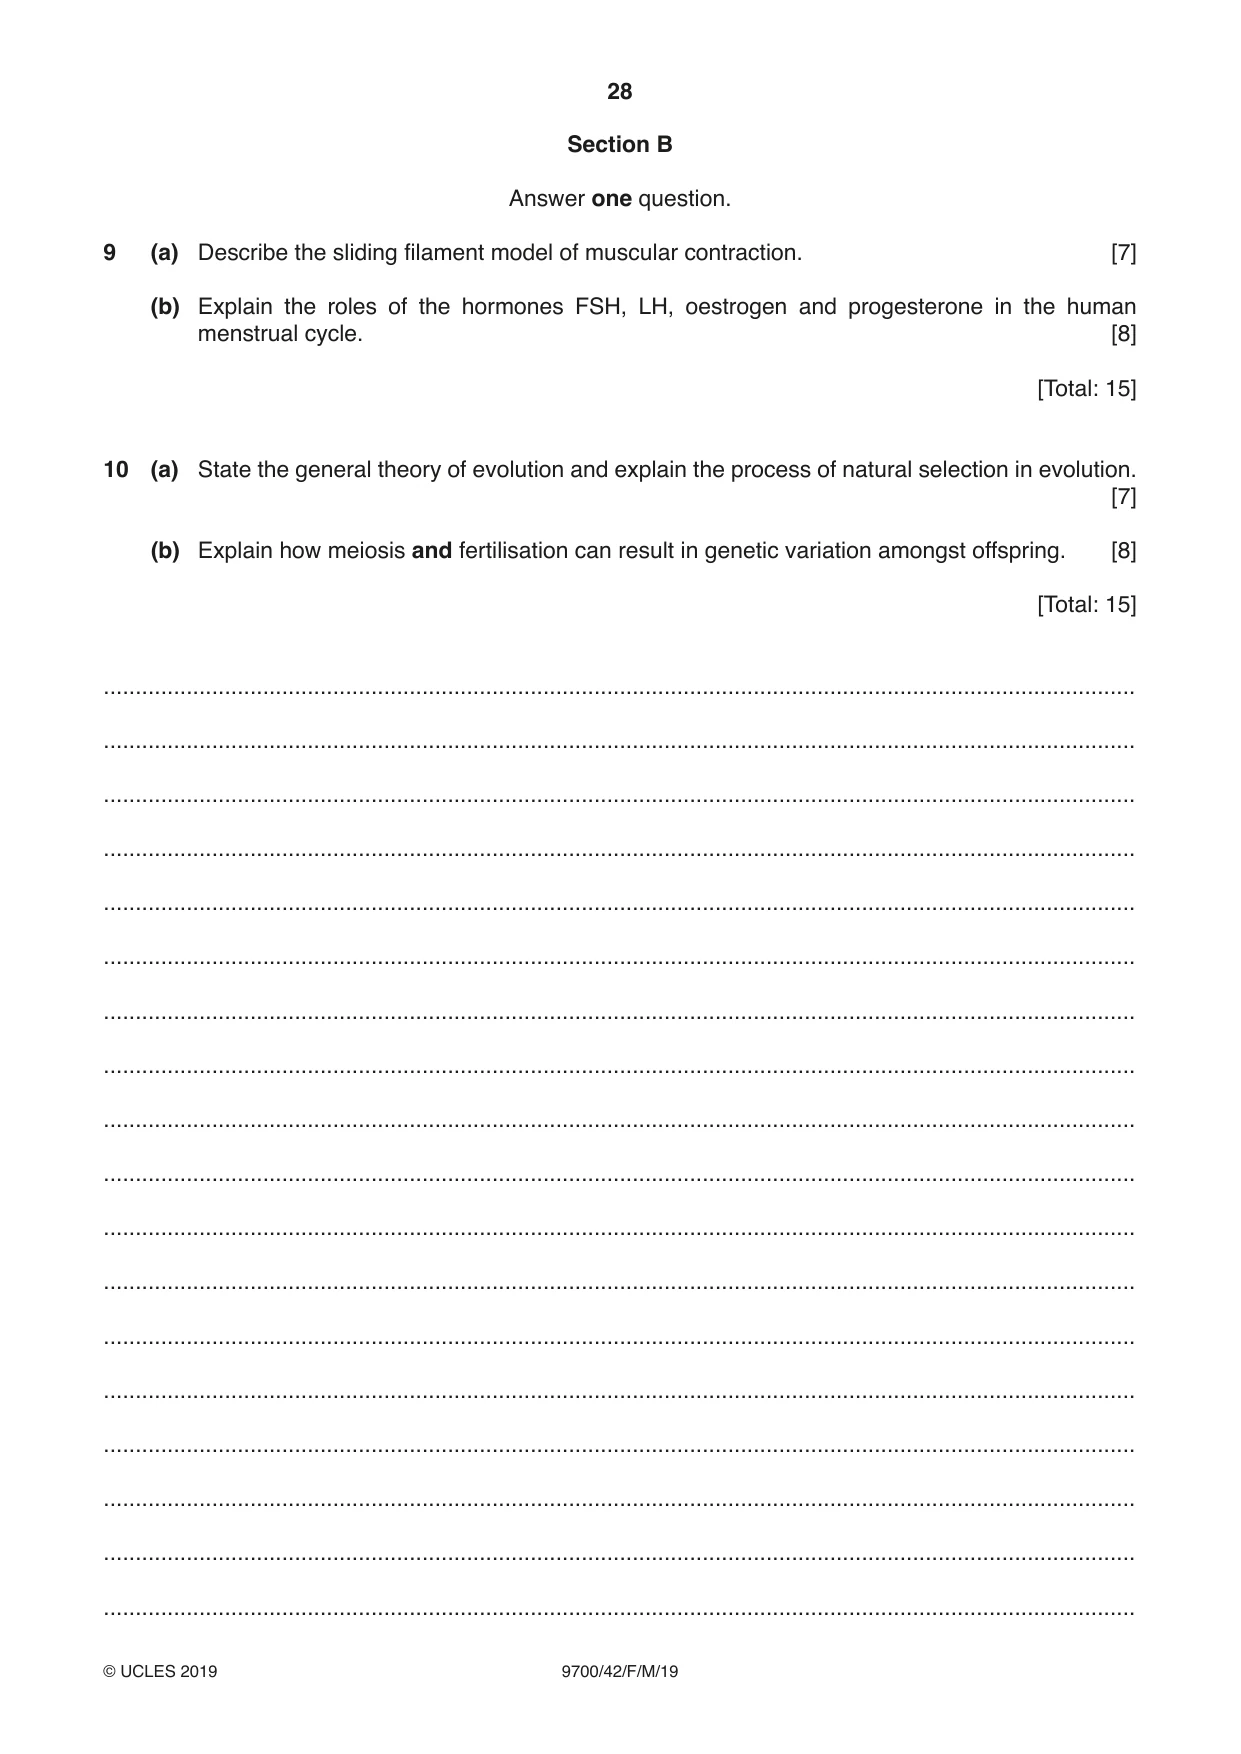
9 (a) Describe the sliding filament model of muscular contraction. [7] (b) Explain the roles of the hormones FSH, LH, oestrogen and progesterone in the human menstrual cycle. [8] [Total: 15]
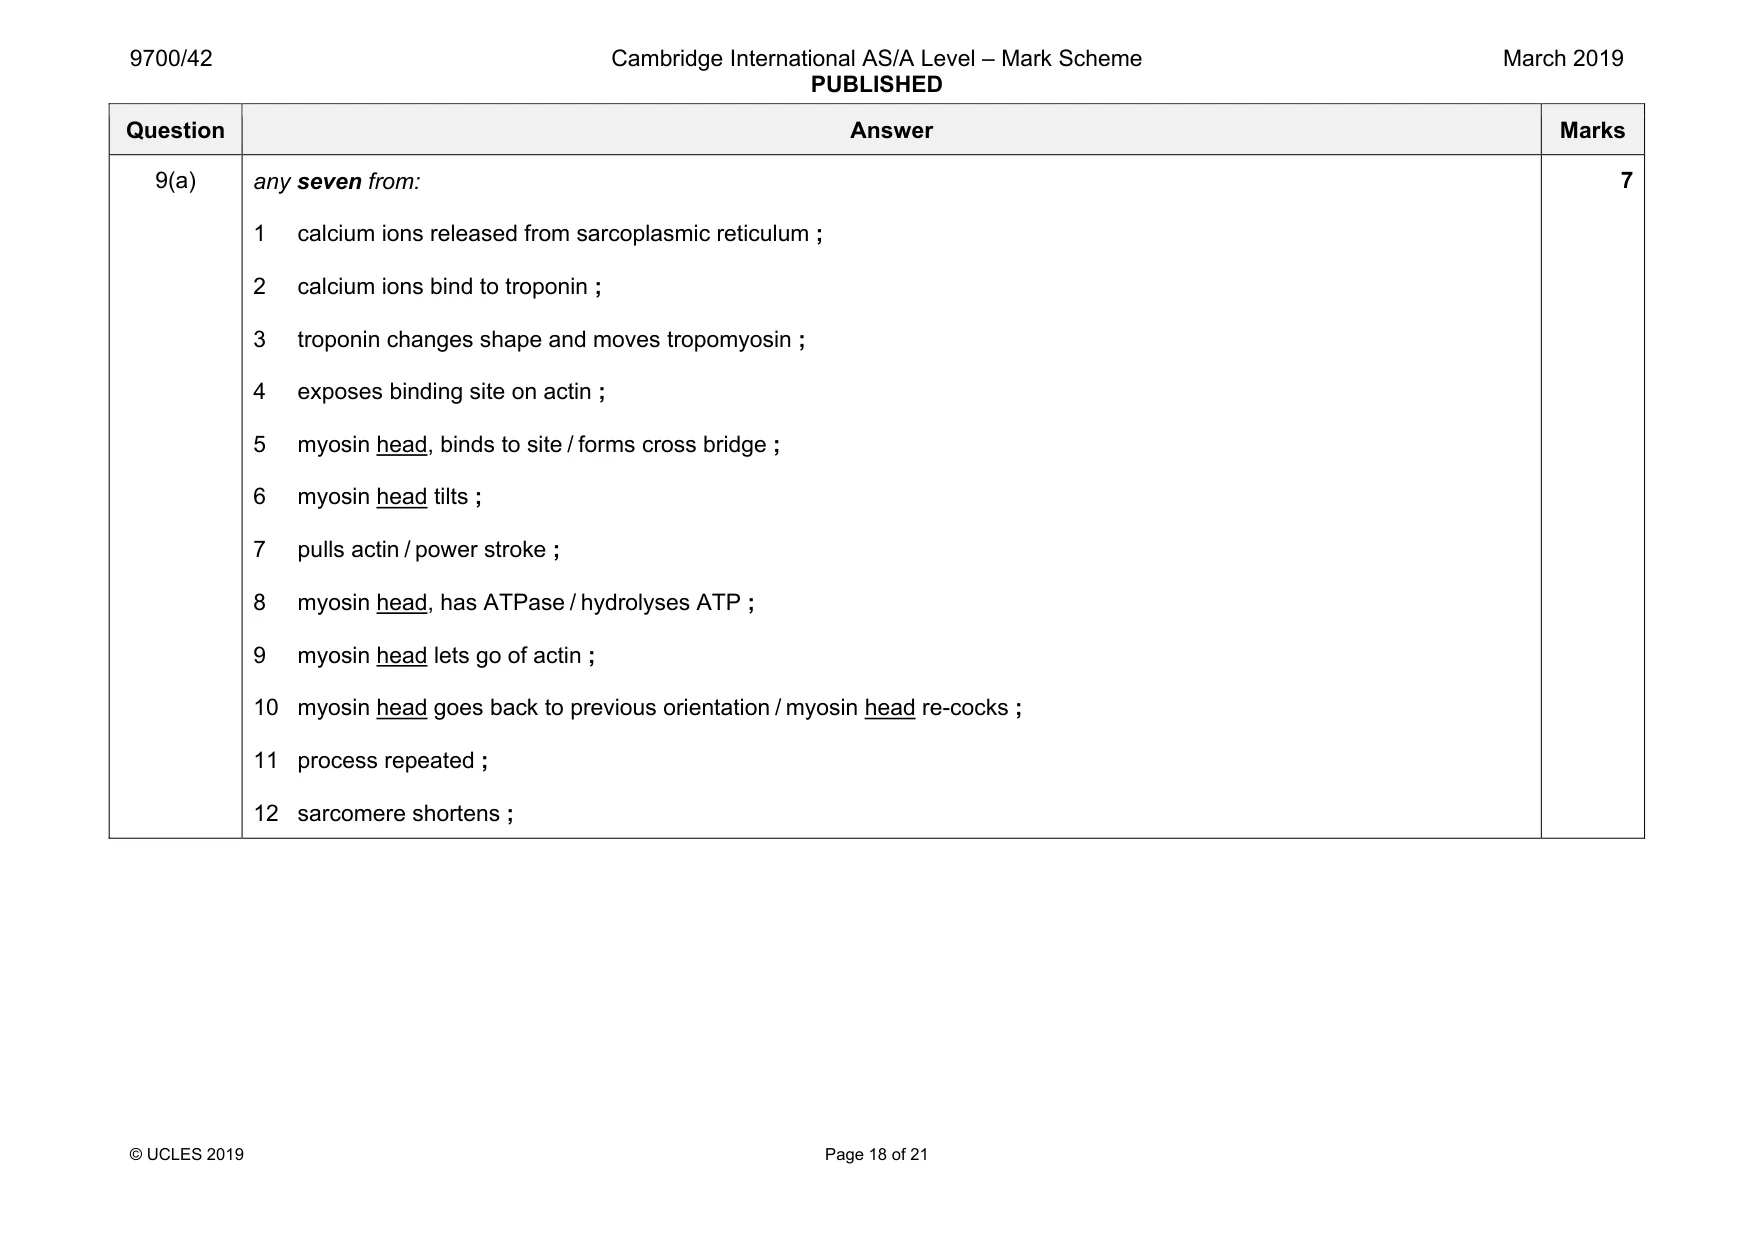
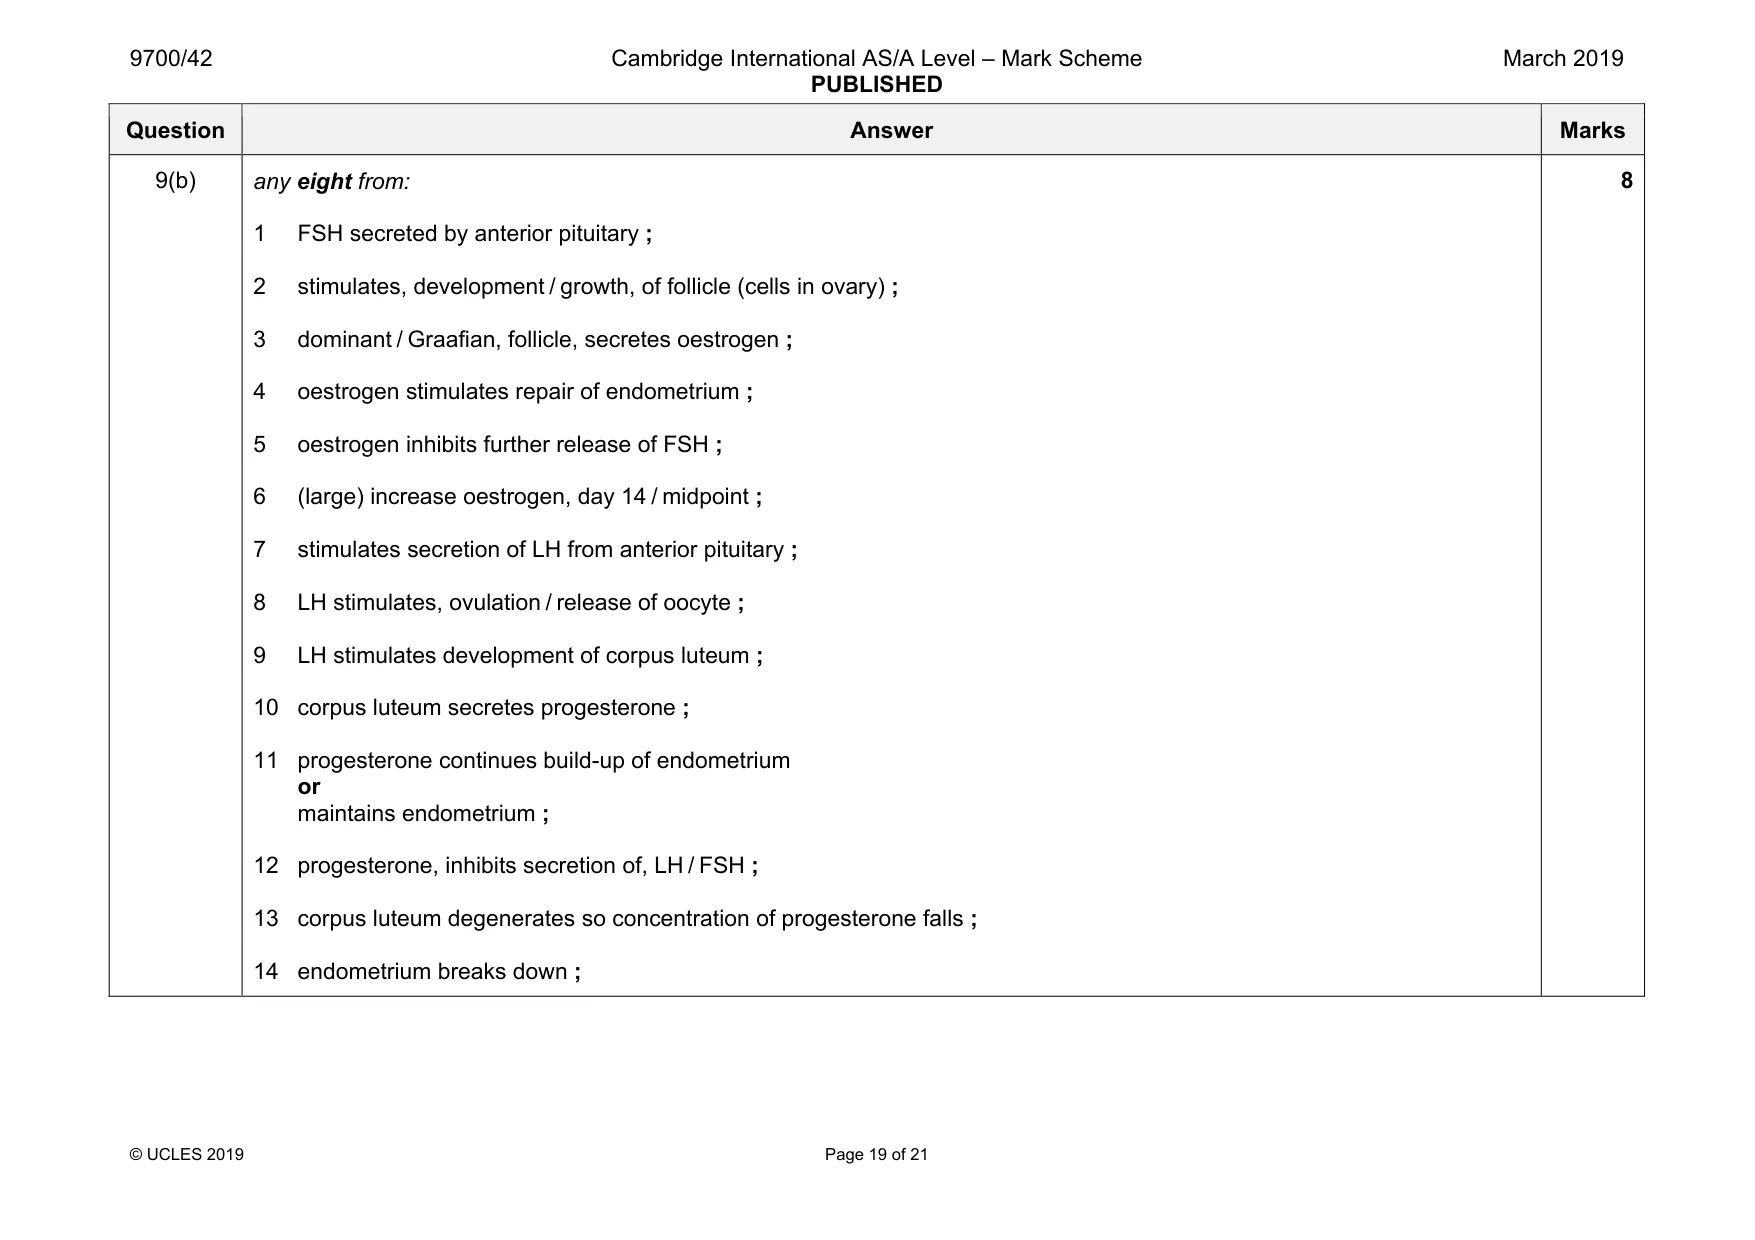
Mark scheme: 9(a) any seven from: 1 calcium ions released from sarcoplasmic reticulum ; 2 calcium ions bind to troponin ; 3 troponin changes shape and moves tropomyosin ; 4 exposes binding site on actin ; 5 myosin head, binds to site / forms cross bridge ; 6 myosin head tilts ; 7 pulls actin / power stroke ; 8 myosin head, has ATPase / hydrolyses ATP ; 9 myosin head lets go of actin ; 10 myosin head goes back to previous orientation / myosin head re-cocks ; 11 process repeated ; 12 sarcomere shortens ; 7 Question Answer Marks 9(b) any eight from: 1 FSH secreted by anterior pituitary ; 2 stimulates, development / growth, of follicle (cells in ovary) ; 3 dominant / Graafian, follicle, secretes oestrogen ; 4 oestrogen stimulates repair of endometrium ; 5 oestrogen inhibits further release of FSH ; 6 (large) increase oestrogen, day 14 / midpoint ; 7 stimulates secretion of LH from anterior pituitary ; 8 LH stimulates, ovulation / release of oocyte ; 9 LH stimulates development of corpus luteum ; 10 corpus luteum secretes progesterone ; 11 progesterone continues build-up of endometrium or maintains endometrium ; 12 progesterone, inhibits secretion of, LH / FSH ; 13 corpus luteum degenerates so concentration of progesterone falls ; 14 endometrium breaks down ; 8
Q10 · State the general theory of evolution and explain the process of natural selection in…
10 (a) State the general theory of evolution and explain the process of natural selection in evolution. [7] (b) Explain how meiosis and fertilisation can result in genetic variation amongst offspring. [8] [Total: 15] .................................................................................................................................................................. .................................................................................................................................................................. .................................................................................................................................................................. .................................................................................................................................................................. .................................................................................................................................................................. .................................................................................................................................................................. .................................................................................................................................................................. .................................................................................................................................................................. .................................................................................................................................................................. .................................................................................................................................................................. .................................................................................................................................................................. .................................................................................................................................................................. .................................................................................................................................................................. .................................................................................................................................................................. .................................................................................................................................................................. .................................................................................................................................................................. .................................................................................................................................................................. .................................................................................................................................................................. .................................................................................................................................................................. .................................................................................................................................................................. .................................................................................................................................................................. .................................................................................................................................................................. .................................................................................................................................................................. .................................................................................................................................................................. .................................................................................................................................................................. .................................................................................................................................................................. .................................................................................................................................................................. .................................................................................................................................................................. .................................................................................................................................................................. .................................................................................................................................................................. .................................................................................................................................................................. .................................................................................................................................................................. .................................................................................................................................................................. .................................................................................................................................................................. .................................................................................................................................................................. .................................................................................................................................................................. .................................................................................................................................................................. .................................................................................................................................................................. .................................................................................................................................................................. .................................................................................................................................................................. .................................................................................................................................................................. .................................................................................................................................................................. .................................................................................................................................................................. .................................................................................................................................................................. .................................................................................................................................................................. .................................................................................................................................................................. .................................................................................................................................................................. .................................................................................................................................................................. .................................................................................................................................................................. .................................................................................................................................................................. .................................................................................................................................................................. .................................................................................................................................................................. .................................................................................................................................................................. .................................................................................................................................................................. .................................................................................................................................................................. .................................................................................................................................................................. .................................................................................................................................................................. .................................................................................................................................................................. .................................................................................................................................................................. .................................................................................................................................................................. .................................................................................................................................................................. .................................................................................................................................................................. .................................................................................................................................................................. .................................................................................................................................................................. .................................................................................................................................................................. .................................................................................................................................................................. .................................................................................................................................................................. .................................................................................................................................................................. .................................................................................................................................................................. .................................................................................................................................................................. .................................................................................................................................................................. .................................................................................................................................................................. ..................................................................................................................................................................
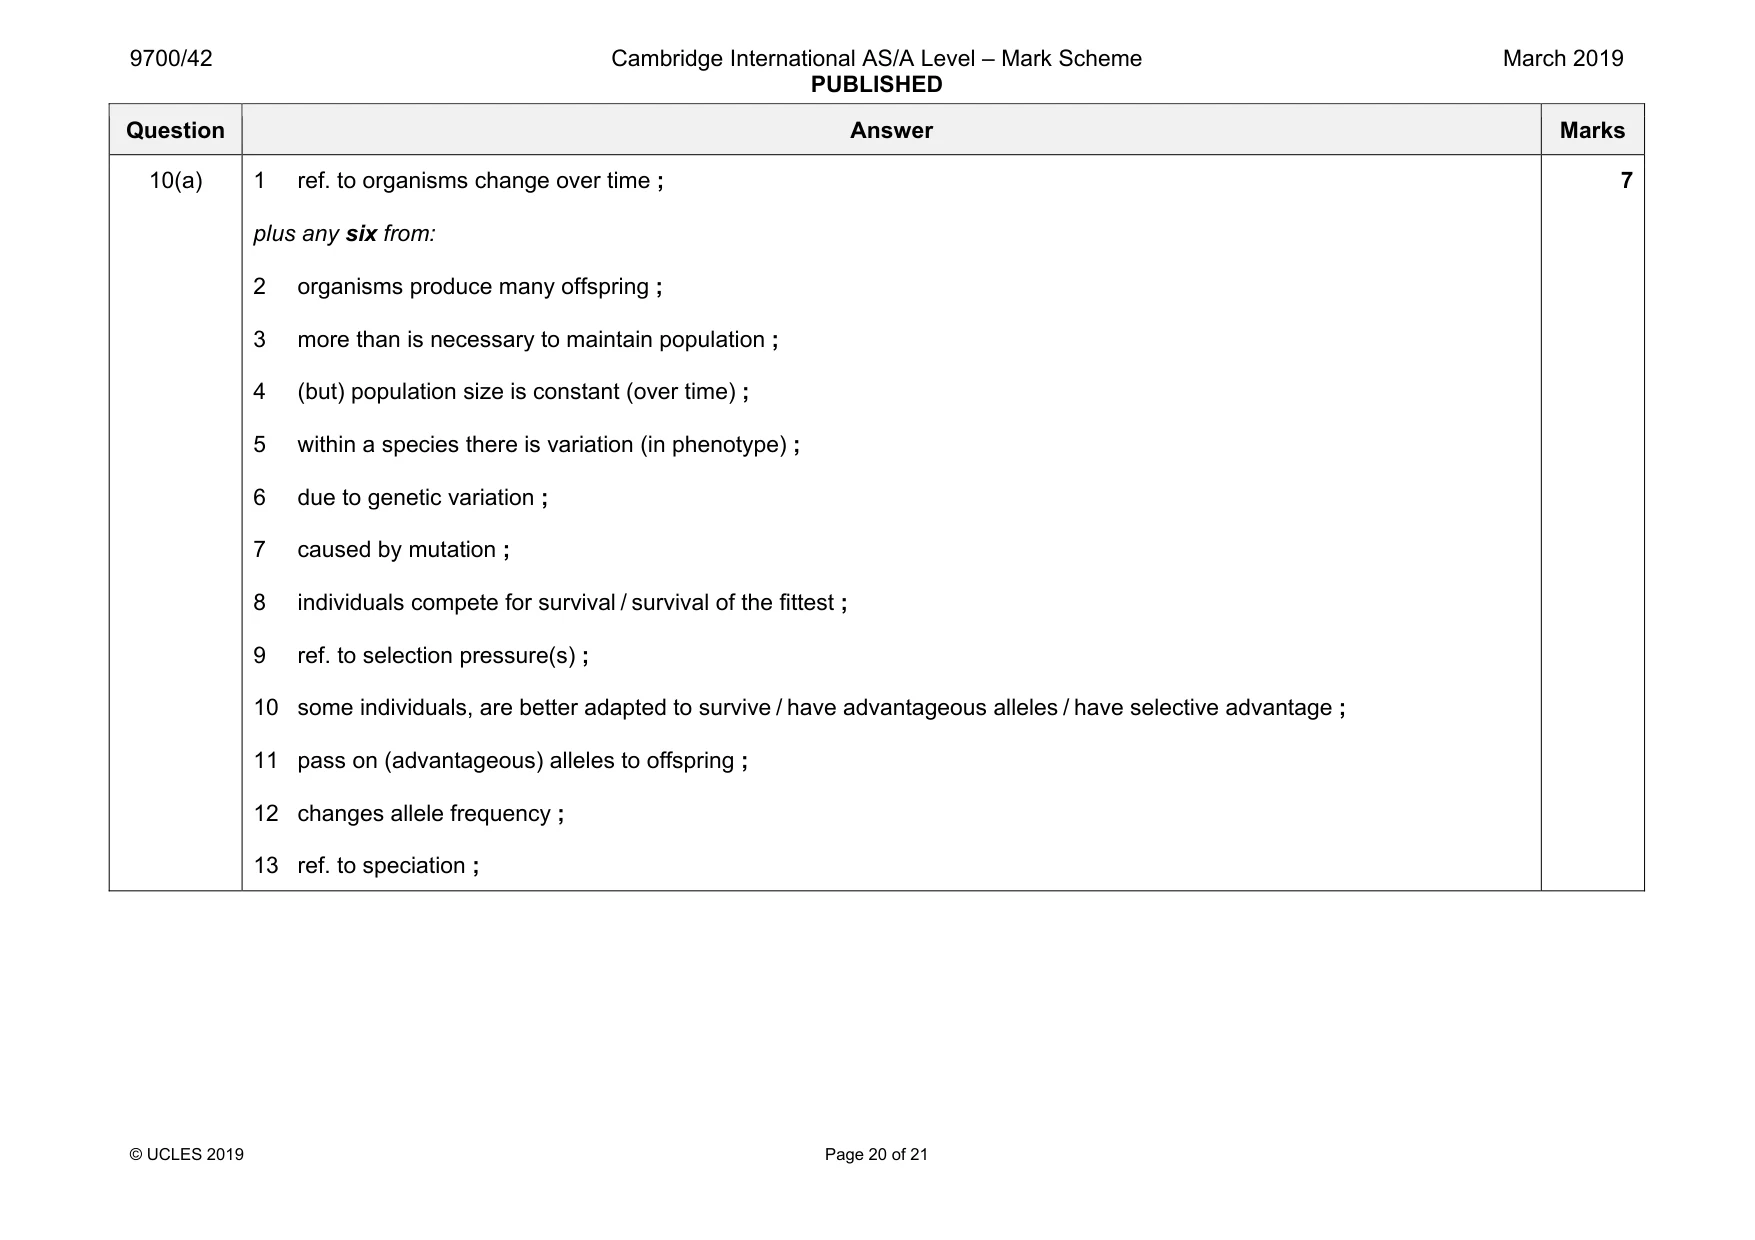
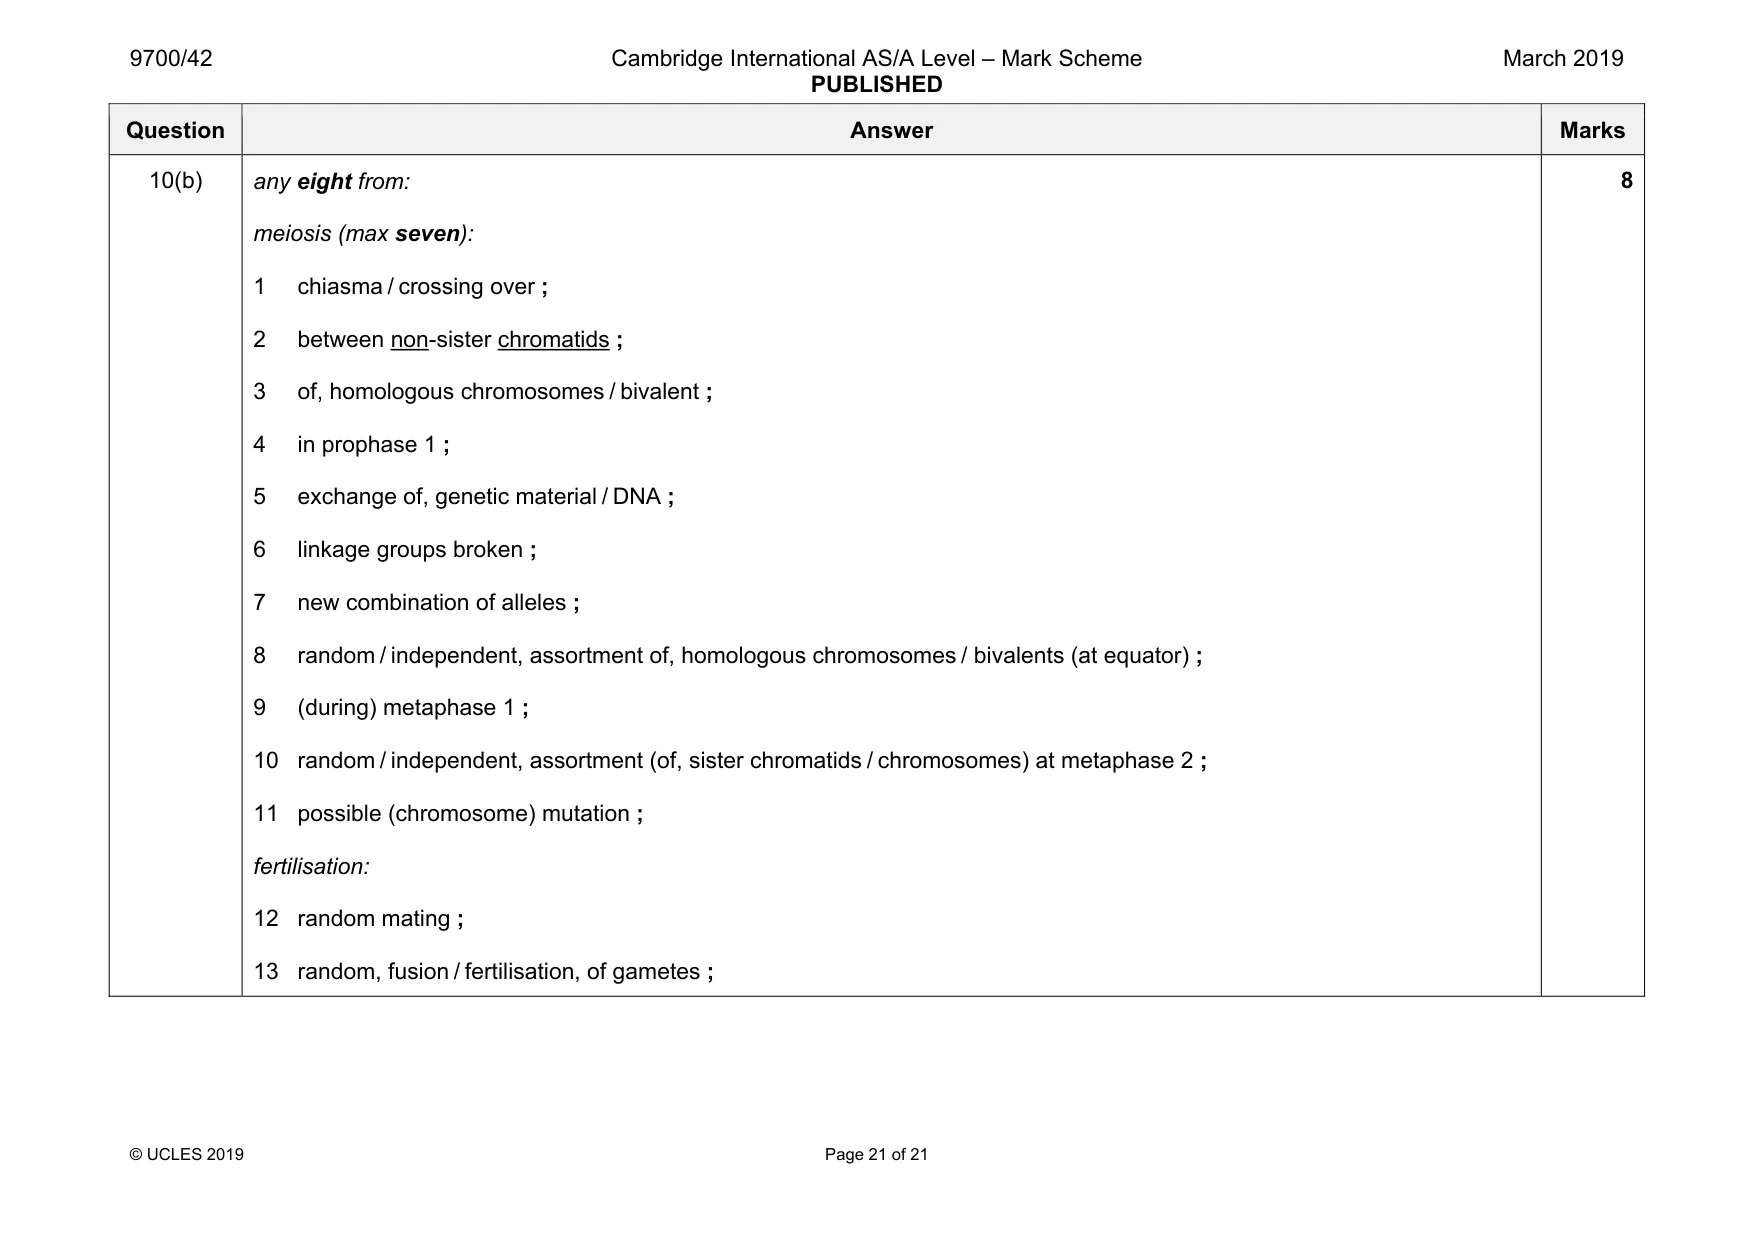
Mark scheme: 10(a) 1 ref. to organisms change over time ; plus any six from: 2 organisms produce many offspring ; 3 more than is necessary to maintain population ; 4 (but) population size is constant (over time) ; 5 within a species there is variation (in phenotype) ; 6 due to genetic variation ; 7 caused by mutation ; 8 individuals compete for survival / survival of the fittest ; 9 ref. to selection pressure(s) ; 10 some individuals, are better adapted to survive / have advantageous alleles / have selective advantage ; 11 pass on (advantageous) alleles to offspring ; 12 changes allele frequency ; 13 ref. to speciation ; 7 Question Answer Marks 10(b) any eight from: meiosis (max seven): 1 chiasma / crossing over ; 2 between non-sister chromatids ; 3 of, homologous chromosomes / bivalent ; 4 in prophase 1 ; 5 exchange of, genetic material / DNA ; 6 linkage groups broken ; 7 new combination of alleles ; 8 random / independent, assortment of, homologous chromosomes / bivalents (at equator) ; 9 (during) metaphase 1 ; 10 random / independent, assortment (of, sister chromatids / chromosomes) at metaphase 2 ; 11 possible (chromosome) mutation ; fertilisation: 12 random mating ; 13 random, fusion / fertilisation, of gametes ; 8
What was in this paper
The subtopics covered by these 10 questions, and how many questions each got. Open one in a new tab to see every Cambridge question on it.
What you needed in this session
Cambridge’s own grade thresholds for 2019 Feb/March, Paper 4 · Variant 2. A higher threshold means an easier paper — the bar moves with how the cohort did.